Working Group on Clean Technology, Innovation and Jobs Final Report Engl...
Upload
nashvilletechcouncilCategory
view
307download
4
TECHNOLOGY EMPLOYMENT SPOTLIGHT: NASHVILLEDeveloped for the Nashville Technology Council
Brought to you by:
Nashville Technology Council Copyright 2015
TECHNOLOGY EMPLOYMENT SPOTLIGHT: NASHVILLE AREA
MESSAGE FROM THE PRESIDENT
It is an exciting time to be in a technology career or business in Middle Tennessee. Our community has incredible assets for technology companies and IT departments to grow their businesses. Our businesses are making investments to not only attract but also grow talent in this region.
This year’s report shows that our technology sector has grown by over 2,200 workers. Annual openings have increased from 872 to 1,548. Our region is aggressively competing as evidenced by the 9% increase in annual postings. Although already a key resource for reducing the skills gap, area schools have the capacity to engage more students (see page 11). Recruiting students to acquire new skills or obtain degrees and certificates will be key for the development of our technology workforce.
As you review cities across the state and cities of peer size, it is important that this region continues to invest in education so that workforce supply meets business demand.
The growth of our technology workforce and investment of the businesses are driving regional economic development. Middle Tennessee businesses are investing in long-term solutions to the IT skills gap. Regional businesses came together to support the NTC’s IT Pathway Collaborative for 300 paid internships totaling over $1.6m over two years. The IT Pathway Collaborative and the NTC’s leadership with the White House’s Tech Hire Initiative will build this region’s high-quality technology talent pool.
Finding this scarce talent entails knowing where they are. That’s why the Nashville Technology Council has partnered with CareerBuilder and Economic Modeling Specialists International (EMSI), a CareerBuilder company. Together, we provide you access to in-depth data on the current and future state of the technology workforce in our community, delivered in this comprehensive report. From this report, you will get an in-depth look at the state of Nashville’s current technology labor market, be able to identify the top educational institutions and programs for future technology talent and compare technology job growth projections within various markets.
As your partner, Nashville Technology Council is committed to delivering data and resources to help you position your business for competitive growth. Use this information to inform your recruiting strategy, get involved to build the talent locally and create a plan to invest in your business’ greatest asset – your people.
Sincerely,
BRYAN HUDDLESTONPresident and CEO, Nashville Technology Council
Nashville Technology Council Copyright 2015 1

HOW DOES THE NASHVILLE IT WORKFORCE BREAKDOWN?
Age Gender
0 10% 20% 30% 40%
5.2%
27.2%
30.5%
23.4%
11.9%
19-24
25-34
19-24
25-34
25-34
Female:34.4%Male:
65.6%“Nashville is a unique amalgamation of entrepreneurial energy and established enterprises, fueled by the power of technology in our “can-do” city. The Nashville Technology Council is at the nexus of these two worlds, and must maintain its robust involvement, advancing the healthy balance of emerging talent and tools necessary for smart, sustainable growth.” Brian Lapidus Practice Leader Identity Theft and Breach Notification, Kroll Advisory Solutions
Nashville Technology Council Copyright 2015 2

IT JOBS IN NASHVILLE METROPOLITAN AREA (MSA)
Annual Change in Jobs
Educational Supply
The 23,398 IT Jobs in the Nashville Area comprises several different job categories. Here are some highlights that illustrate to how the market is changing.
Annual Openings is defined as the estimated employment change and turnover for an occupation over the course of a given year. This is EMSI’s estimate of labor market demand for an occupation, and when combined with Related Completions gives a picture of the supply and demand for the occupation in the region. Note that in one year, the growth in IT jobs is almost 9%.
MESSAGE FROM THE PRESIDENT 23,398IT jobs in 2014
1,5482014 Openings
8222013 Completions
“Educational Supply”
0 500 1,000 1,500 2,000
1,548
1,421
2014
2013
The 822 Related Completions is the number of people who received either a degree or certificate related to the occupations in 2013, the most recently reported year. This represents the educational supply for an occupation, and when combined with Annual Openings gives a picture of the supply and demand for the occupation in the region.
Nashville Technology Council Copyright 2015 3

Top 5 IT Occupations in Nashville, Jan 2014 - Feb 2015
Here is a look at the top 5 IT jobs in Nashville from January 2014 to February 2015 by number of job openings, jobs, average monthly postings and average monthly hires.
Computer and Information Systems Managers
Network and Computer Systems Administrators
Software Developers, Applications
Computer User Support Specialists
Computer Systems Analysts
2014 Job Openings
IS THE SUPPLY OF IT WORKERS MEETING THE DEMAND?
0 100 200 300 400 0 50 100 150 200 250
Computer and Information Systems Managers
Network and Computer Systems Administrators
Software Developers, Applications
Computer User Support Specialists
Computer Systems Analysts
2014 Average Monthly Hires
2014 Average Monthly Postings
“Nashville remains one of the nation’s leading hubs for technology innovation and employment growth. Although attracting top IT talent can be a challenge in the current recruitment landscape, leading area organizations are separating themselves by offering a simple, candidate-friendly pre-hire experience. And corporations that stand out are focused on developing their employment brand, sharing positive workplace culture, offering challenging projects and career development opportunities.”
Chuck BrandingCareerbuilder
0 50 100 150 200 0 1k 2k 3k 4k 5k
2014 Jobs
Nashville Technology Council Copyright 2015 4
76
75
109
152
169
2,448
2,503
2,553
3,670
4,052
118
264
279
325
395
114
140
146
226
225
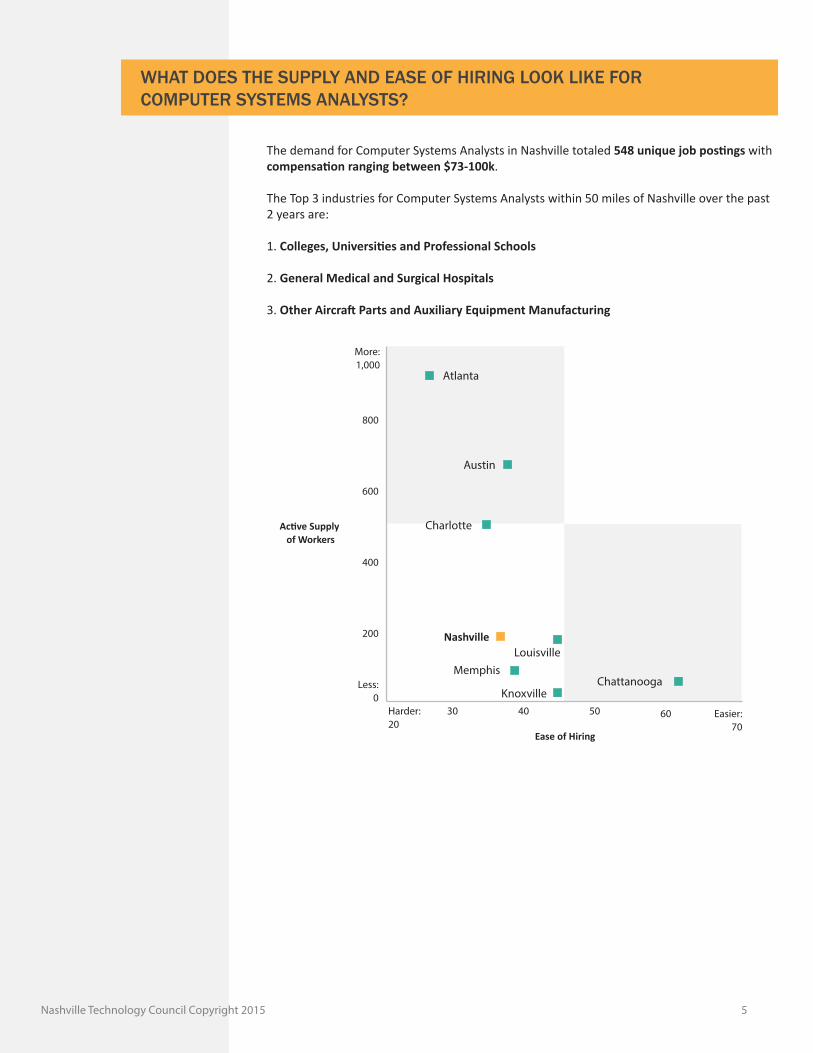
The demand for Computer Systems Analysts in Nashville totaled 548 unique job postings with compensation ranging between $73-100k.
The Top 3 industries for Computer Systems Analysts within 50 miles of Nashville over the past 2 years are:
1. Colleges, Universities and Professional Schools
2. General Medical and Surgical Hospitals
3. Other Aircraft Parts and Auxiliary Equipment Manufacturing
WHAT DOES THE SUPPLY AND EASE OF HIRING LOOK LIKE FOR COMPUTER SYSTEMS ANALYSTS?
Harder:20
30 40 50 60 Easier:70
Less:0
200
400
600
800
More:1,000
Ease of Hiring
NashvilleLouisville
Austin
Charlotte
Atlanta
Memphis
KnoxvilleChattanooga
Active Supply of Workers
Nashville Technology Council Copyright 2015 5

The demand for Web Developers in Nashville totatled 1,141 unique job postings with compensation ranging between $80-99K.
The Top 3 industries looking for Web Developers within 50 miles of Nashville over the past 2 years are:
1. Computer Systems Design Services Establishments primarily engaged in planning and designing computer systems that integrate computer hardware, software, and communication technologies.
2. All Other Professional, Scientific, and Technical ServicesEstablishments primarily engaged in the provision of professional, scientific, or technical services.
3. Custom Computer Programming Services Establishments primarily engaged in writing, modifying, testing, and supporting software to meet the needs of a particular customer.
WHAT DOES THE SUPPLY AND EASE OF HIRING LOOK LIKE FOR WEB DEVELOPERS
Harder:20
30 40 Easier:50
Less:0
100
200
300
400
500
600
700
More:800
Ease of Hiring
Nashville
Louisville
Austin
Charlotte
Atlanta
Memphis Knoxville Chattanooga
Active Supplyof Workers
Nashville Technology Council Copyright 2015 6

0 5% 10% 15% 0 2% 4% 6% 8% 10%
Louisville
Austin
Nashville
Knoxville
Chattanooga
Charlotte
Atlanta
Memphis
Austin
Atlanta
Tennessee
Austin
Charlotte
Nashville
Nashville
LouisvilleMemphisKnoxvilleChattanooga
Nashville
Louisville
Charlotte
Memphis
Chattanooga
Atlanta
Knoxville
Network and Computer Systems Admin
Computer and Information Systems Managers
Tennessee (State)
Nation
Tennessee (State)
Nation
7%
10%
6%
6%
5%
4%
3%
2%
5%
6%
12%
12%
8%
7%
6%
6%
5%
3%
7%
9%
Job Growth by Position
The charts below shows Nashville's employment gains in various IT occupations compared to other metros in the region. Note that Nashville is tied for the highest growth rate in the region for software developers.
Nashville represents a significant portion of IT employment job growth in Tennessee, projecting 8% growth by 2019 compared to 7% for the state. However it is smaller compared to the larger cities of Louisville (10%) and Austin (10%) as seen in the chart on the far right.
HOW DOES NASHVILLE IT EMPLOYMENT GROWTH COMPARE?
0
10,000
20,000
30,000
40,000
50,000
60,000
70,000
80,000
0
20,000
40,000
60,000
80,000
100,000
120,000
2013
Number ofJobs
Number ofJobs
2014 2019 2013 2014 2019
Nashville Technology Council Copyright 2015 7

Louisville
Austin
Nashville
Knoxville
Chattanooga
Charlotte
Atlanta
Memphis
Tennessee (State)
Nation
Computer Systems Analysts
0 5% 10% 15%
12%
12%
12%
11%
10%
9%
9%
9%
14%
13%
0 5% 10% 15%
Computer User Support SpecialistsSoftware Developers, Applications
Tennessee (State)
HOW DOES NASHVILLE IT EMPLOYMENT GROWTH COMPARE? (Continued)
Austin
Nashville
Louisville
Charlotte
Memphis
Chattanooga
Atlanta
Knoxville
Nation
11%
12%
11%
8%
7%
7%
7%
6%
10%
10%
0 5% 10% 15% 20%
Tennessee (State)
Louisville
Austin
Nashville
Knoxville
Chattanooga
Charlotte
Atlanta
Memphis
Nation
12%
18%
11%
10%
10%
9%
8%
7%
11%
12%
Nashville Technology Council Copyright 2015 8
Percent Change in WorkforceHourly Wages
Austin
Charlotte
Atlanta
Nashville
Chattanooga
Knoxville
Louisville
Memphis
Computer and Information System Managers
Computer Network Architects
Tennessee (State)
0 $10 $20 $30 $40 $50 $60
$50.22
$57.10
$48.70
$46.94
$42.28
$41.68
$40.89
$40.62
$44.78
Austin
Charlotte
Atlanta
Memphis
Knoxville
Louisville
Nashville
Chattanooga
Tennessee (State)
0 $20 $40 $60 $80
$66.40
$67.23
$63.13
$55.63
$50.63
$50.32
$50.23
$48.12
$51.68
Software Developers, System Software
Charlotte
Atlanta
Austin
Knoxville
Chattanooga
Louisville
Nashville
Memphis
Tennessee (State)
0 $10 $20 $30 $40 $50
$48.05
$49.77
$46.78
$41.71
$40.13
$39.95
$38.42
$36.27
$39.89
Nashville
NationalAverage
0 $10 $20 $30 $40
$37.45
$30.38 Nashville
NationalAverage
0 2% 4% 6%
5.6%
5.4%
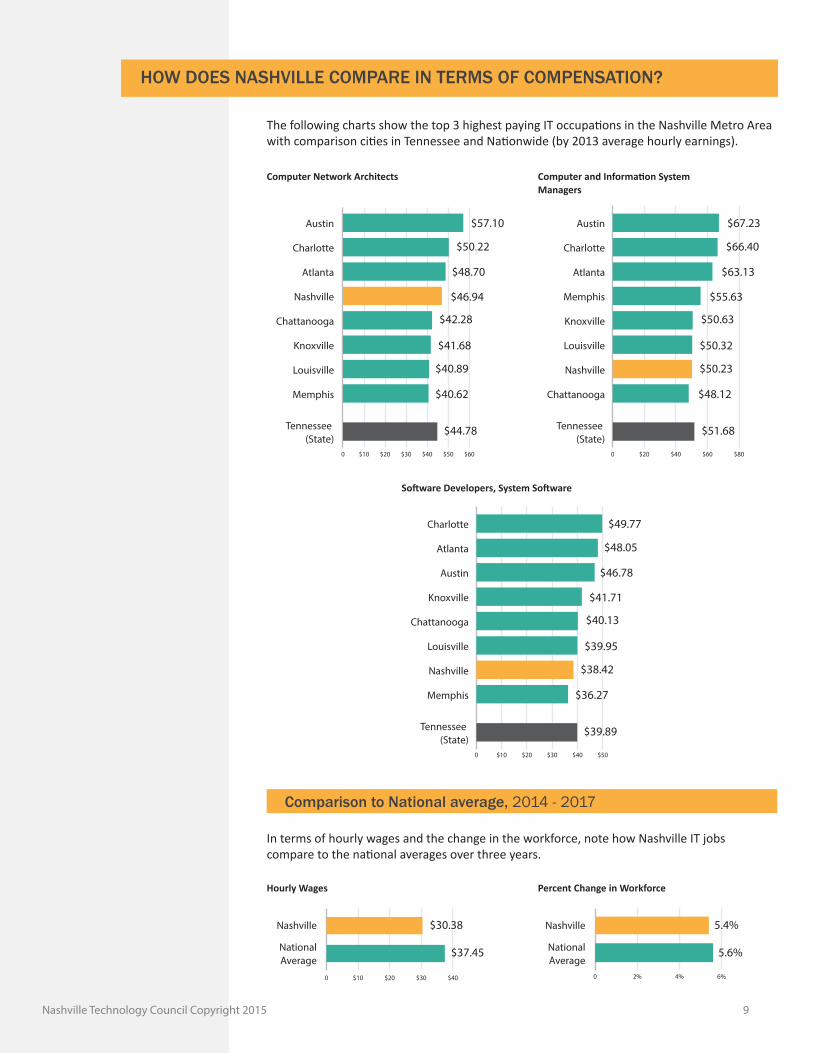
Comparison to National average, 2014 - 2017
In terms of hourly wages and the change in the workforce, note how Nashville IT jobs compare to the national averages over three years.
The following charts show the top 3 highest paying IT occupations in the Nashville Metro Area with comparison cities in Tennessee and Nationwide (by 2013 average hourly earnings).
HOW DOES NASHVILLE COMPARE IN TERMS OF COMPENSATION?
Nashville Technology Council Copyright 2015 9

HOW ARE LOCAL UNIVERSITIES SUPPORTING LOCAL IT JOB GROWTH?
5 Year Completions by Job(Certificate and Graduates)
Management Information Systems, General
Computer Science
Computer Systems Networking and Telecommunications
Business/O�ce Automation/Technology/Data Entry
Information Technology
Computer Systems Networking & TC
ITT Technical Institute - Nashville
Nashville State Community College
Management Information Systems, General
Middle Tennessee State University
Tennessee College of Applied Technology - Nashville
Belmont University
Computer Science
Vanderbuilt University
Middle Tennessee State University
Tennessee State University
Lipscomb University
0
0
0
18
0
0
0
0
0
58
34
45
0
6
54
44
14
0
58
34
45
18
6
54
44
14
0
0 200 400 600 800
606
629
599
303
183
2013 (Certificate and Graduates)
Certificates DegreesTotalCompletions
0 20 40 60 80 100 120
118
69
92
54
82
Completions by Job and Institution - 2013
“Nashville has a fantastic opportunity to lead the country in STEM (Science, Technology, Engineering, Art, Math) workforce; that need continues to grow with the number of cranes in our skyline. Our Nashville Technology Council's leadership has never been more needed than today, as we continue on this upward trajectory."
Nashville Technology Council Copyright 2015 10
DATA SOURCES
CareerBuilder’s Supply & Demand Portal, October 2014
2014.3 – QCEW Employees, Non-QCEW Employees, and Self-Employed for all data points except “Demographics (Existing Workforce) – Gender” and “Demographics (Existing Workforce – Age) taken from 2014.2 – QCEW Employees, Non-QCEW Employees, and Self-Employed.
ADDITIONAL INFORMATION
Information on the President's TechHire Initiative:https://www.technologycouncil.com/president-techhire
IT Pathway Collaborative:http://www.technologycouncil.com/education-workforce-development
SPONSORS
Nashville Technology Council Copyright 2015 11