JOB SATISFACTION AMONGST EMPLOYEES AT A · biographical questionnaire and the Job Descriptive Index...
171
JOB SATISFACTION AMONGST EMPLOYEES AT A PUBLIC HEALTH INSTITUTION IN THE WESTERN CAPE NEZAAM LUDDY Mini-thesis submitted in partial fulfilment of the requirements for the degree of Magister Commercii in the Department of Industrial Psychology, Faculty of Economic and Management Science, University of the Western Cape. SUPERVISOR: RUKHSANA JANO NOVEMBER 2005
Transcript of JOB SATISFACTION AMONGST EMPLOYEES AT A · biographical questionnaire and the Job Descriptive Index...
JOB SATISFACTION AMONGST EMPLOYEES AT A
PUBLIC HEALTH INSTITUTION IN THE WESTERN
CAPE
NEZAAM LUDDY
Mini-thesis submitted in partial fulfilment of the requirements for
the degree of Magister Commercii in the Department of Industrial
Psychology, Faculty of Economic and Management Science,
University of the Western Cape.
SUPERVISOR: RUKHSANA JANO
NOVEMBER 2005
i
ABSTRACT
Job satisfaction among public sector employees within South Africa, specifically the
health environment is becoming an area of major concern as highlighted by recent
research studies and media reports. An exodus of professional staff and a lack of
resources have exacerbated the current problem impeding on effective and efficient
service delivery. Literature validates that factors such as poor working conditions,
staff shortages, below competitive salaries, a lack of promotional opportunities are
some of the major factors contributing to employee dissatisfaction within the sector
(Ellickson & Logsdon, 2002; Herman, 2005; Ting, 1997).
As the ultimate goal in the health environment is service delivery, it is imperative that
employees perform optimally and maintain acceptable levels of job satisfaction,
hence, contributing to the vision and mission of providing better care and health to
individuals (Department of Health Provincial Government: Western Cape’s annual
report, 2003/2004).
The primary objective of this study is to ascertain the levels of job satisfaction
experienced amongst employees at a public health institution in the Western Cape
region. For the purpose of this study a quantitative, non-probability convenience
sampling design was used to assess job satisfaction. The sample group (N = 203)
consisted of permanent and contract male and female staff members on salary levels 2
to 13, extending across the following occupational classes: Pharmacist, Pharmacist
Assistant, Auxiliary Service Officer, Administrative Clerk, Director, Personnel
Officer, Administrative Officer, State Accountant and Personnel Practitioner. A

ii
biographical questionnaire and the Job Descriptive Index questionnaire (JDI) were
administered to gather the data. The JDI measures job satisfaction on five job facets,
namely, pay, promotions, supervision, co-workers and the work itself. Descriptive and
inferential statistics were used to analyse the data.
Results indicate that employees at the public health institution in the Western Cape
expressed satisfaction with their co-workers, followed by the nature of the work and
the supervision they receive. Opportunities for promotion and pay emerged as major
sources of dissatisfaction. With the exception of marital status, the relationship
between occupational class, race, gender, educational level, tenure, age, income and
job status with job satisfaction was found to be significant. Although the research
indicates that job satisfaction is significantly related to variables such as work,
remuneration, supervision, promotion, and co-workers, ongoing research is required
in this domain. However, the role of other potentially confounding extraneous
variables on job satisfaction needs to be contemplated for future research. Lastly, due
to the composition of the sample, results of this study cannot be inferred to other
similar occupational classes in other public institutions. Therefore, it is recommended
that a proportionate stratified random sample be utilised for future research.

iii
Key words:
Job satisfaction
Occupational classes
Public health institution
Job Descriptive Index
Organisational factors associated with job satisfaction
Satisfaction with pay
Promotion opportunities
Supervision
Relationship with co-workers
Satisfaction with nature of work

iv
DECLARATION
I hereby declare that “Job satisfaction amongst employees at a public health
institution in the Western Cape” is my own work, that it has not been submitted for
any degree or examination at any other institution of higher learning, and that all
references have, to the best of my knowledge, been correctly reported. It is being
submitted for the degree of Magister Commercii at the University of the Western
Cape.
Full Name: Nezaam Luddy
Date: 15 November 2005
Signed: ……………………

v
ACKNOWLEDGEMENTS
“Seek knowledge from the cradle to the grave.”
- Prophet Muhammad
First and foremost I thank the Almighty Allah for granting me the strength, health,
courage and inspiration to prosper in this endeavour and thus enriching my
knowledge. “Verily, God does not change [a] people’s condition unless they change
their own inner selves.” HE is indeed the unseen force behind making this study a
success.
I thank the lecturing staff of the University of the Western Cape (Industrial
Psychology Department), whose tutelage over the two years provided me with the
necessary background skills to undertake and complete this study.
To my colleagues without whose interest and co-operation I could not have produced
this study. I wish to thank them for supporting this initiative and affording me their
time and sharing their experiences.
A special thank you to my supervisor, Rukhsana Jano, for her guidance, insight and
encouragement in the writing and compilation of this thesis. Your invaluable support
and patience throughout this journey has been unreal and is appreciated from the
bottom of my heart.

vi
I wish to thank Karl Heslop for providing statistical support. Your assistance and
insight is highly valued and appreciated.
A note of thanks to Gerda Theron from the Department of Cultural Affairs and Sport:
Directorate Libraries for providing me with valuable text books and articles over the
research period.
I thank my mother Fatima Luddy and father Abdulrazaak Luddy, for instilling in me
unquestionable values and morals, thank you for your love, guidance and for always
believing in me throughout the years.
My sincere gratitude goes out to my friends Misha Morar, Leigh Angy Zwaan,
Sakena Parker, Nadine Sha, Janine Oosthuizen, Courtney Kruger and
Warren Charles. I am humbled by your friendship. Thank you for your support and
for continuously enquiring about my progress for the duration of the study. A special
thanks to my supervisor at work, advocate Peter Burgers for his constant inspiration
and guidance during the past two years. My request for three months special leave
that you have supported, to enable me to complete the research, is indeed appreciated.
To my loving and understanding wife, Najwa. You are the star that gives light to this
project. Your patience, love, encouragement and tolerance warrant you to have co-
authorship in this endeavour. I also wish to thank my teenage son, Yaeesh for his
sacrifices and support. I acknowledge that it was not always easy sacrificing your
weekends and holidays while I was busy with the study. Thanks to the both of you for
your infinite love and support during trying times.

vii
TABLE OF CONTENTS PAGE NO.
CHAPTER 1
INTRODUCTION
CONTENT
1.1 Introduction 1
1.2 Motivation for the study 3
1.3 Research questions 10
1.4 Research objectives 11
1.5 Research hypotheses 12
1.6 Delimitations of the study 13
1.7 Definition of terms 14
1.7.1 Remuneration/Pay 14
1.7.2 Supervisor 15
1.7.3 Promotion 15
1.7.4 Work 15
1.7.5 Co-worker 16

viii
1.8 Summary of the chapter 16
1.9 Overview of the study 16
CHAPTER 2
LITERATURE REVIEW
2.1 Introduction 18
2.2 The concept of job satisfaction 20
2.2.1 Definitions of job satisfaction 20
2.2.2 Facet satisfaction 21
2.2.3 Overall satisfaction 22
2.3 Motivation theories 22
2.3.1 Content theories 24
2.3.1.1 Maslow’s needs hierarchy theory 24
2.3.1.2 Herzberg’s two factor theory 26
2.3.1.3 McClelland’s need for achievement theory 30
2.3.2 Process theories 31
2.3.2.1 Vroom’s expectancy theory 31
2.3.2.2 Equity theory 33
2.3.2.3 Goal setting theory 34

ix
2.4 The antecedents of job satisfaction 35
2.4.1 Personal Determinants 36
2.4.1.1 Race 36
2.4.1.2 Gender 37
2.4.1.3 Educational level 39
2.4.1.4 Tenure 40
2.4.1.5 Age 42
2.4.1.6 Marital status 43
2.4.2 Organisational factors 44
2.4.2.1 The work itself 44
2.4.2.2 Remuneration/pay 45
2.4.2.3 Supervision 47
2.4.2.4 Promotion opportunities 48
2.4.2.5 Co-workers 48
2.4.2.6 Job status 49
2.4.2.7 Job level 50
2.5 The consequences of job satisfaction 51
2.5.1 Productivity 51
2.5.2 Physical and psychological health 52
2.5.3 Turnover 52
2.5.4 Absenteeism 53
x
2.6 Summary of the chapter 54
CHAPTER 3
RESEARCH METHODOLOGY
3.1 Introduction 55
3.2 Research design 55
3.2.1 Population 57
3.2.2 Sample 57
3.2.3 Procedure 58
3.2.4 Biographical Questionnaire 59
3.2.5 Measuring Instrument 60
3.2.5.1 Job Descriptive Index (JDI) 60
3.2.5.1.1 Nature and Composition of the JDI 60
3.2.5.1.2 Reliability of the JDI 61
3.2.5.1.3 Validity of the JDI 63
3.2.5.1.4 Rationale for inclusion of the JDI 64
3.2.6 Statistical Techniques 65
3.2.6.1 Descriptive Statistics 65
3.2.6.2 Inferential Statistics 66

xi
3.2.6.2.1 The Pearson Product Moment Correlation 66
Coefficient
3.2.6.2.2 Multiple Regression Analysis 67
3.2.6.2.3 Analysis of Variance (ANOVA) 67
3.2.6.2.4 Scheffe’s Multiple Comparison Method 68
3.3 Summary of the chapter 69
CHAPTER 4
DISCUSSION OF RESULTS
4.1 Introduction 70
4.2 Demographic information in terms of the sample 70
4.3 Descriptive statistics of the Job Descriptive Index 80
Questionnaire
4.4 Inferential statistics 82
4.4.1 Correlations for the biographical data and 82
job satisfaction
4.4.2 Correlations for the dimensions of job satisfaction 84

xii
4.4.3 Multiple Regression Analysis 86
4.4.4 Analysis of Variance (ANOVA) 90
4.4.5 Scheffe’s Multiple Comparison Method 99
4.5 Summary of the chapter 100
CHAPTER 5
DISCUSSION, CONCLUSIONS AND RECOMMENDATIONS
5.1 Introduction 101
5.2 Discussion 101
5.2.1 Demographic information about the sample 101
5.2.2 Descriptive statistics for the dimensions of 102
job satisfaction
5.2.3 Inferential Results 103
5.2.3.1 Correlation analysis for the biographical data 103
and job satisfaction
5.2.3.2 Correlation analysis for the dimensions of 104
job satisfaction
5.2.3.3 Multiple Regression Analysis 105

xiii
5.2.3.4 Differences in job satisfaction based on 106
biographical characteristics - Analysis
of Variance (ANOVA)
5.2.3.4.1 Race 106
5.2.3.4.2 Gender 107
5.2.3.4.3 Educational level 109
5.2.3.4.4 Tenure 110
5.2.3.4.5 Age 111
5.2.3.4.6 Marital status 112
5.2.3.4.7 Income 113
5.2.3.4.8 Job status 114
5.2.3.4.9 Scheffe’s Multiple Comparison 115
5.3 Conclusions 116
5.4 Recommendations 118
Reference List 121
Appendices:
Appendix A Letter of request to complete questionnaire
Appendix B Biographical questionnaire
Appendix C Job Descriptive Index (JDI) questionnaire

xiv
LIST OF TABLES
TABLE NO. PAGE NO.
Table 1.1: Annual turnover rates by salary band for the period
1 April 2003 to 31 March 2004 5
Table 1.2: Major reasons why personnel are leaving the department 6
Table 1.3: Sick leave - 1 January 2003 to 31 December 2003 7
Table 1.4: Misconduct addressed at disciplinary hearings 8
Table 1.5: Grievances lodged for the period 1 April 2003 to
31 March 2004 9
Table 1.6: Disputes lodged with Councils for the period
1 April 2003 to March 2004 10
Table 4.1: Descriptive statistics for the dimensions of
job satisfaction 80
Table 4.2: Correlations for the biographical data and
job satisfaction 82

xv
Table 4.3: Pearson correlation matrix for the dimensions of
job satisfaction 84
Table 4.4: Results of multiple regression analysis 88
Table 4.5: Occupational class and job satisfaction 90
Table 4.6: Race and job satisfaction 91
Table 4.7: Gender and job satisfaction 92
Table 4.8: Educational level and job satisfaction 93
Table 4.9: Years of service and job satisfaction 94
Table 4.10: Age and job satisfaction 95
Table 4.11: Marital status and job satisfaction 96
Table 4.12: Income and job satisfaction 97
Table 4.13: Job status and job satisfaction 98

xvi
LIST OF FIGURES
FIGURE NO. PAGE NO.
Figure 2.1: Herzberg’s theory: Factors affecting job satisfaction 28
Figure 2.2: Vrooms’s expectancy theory 32
Figure 2.3: Equity theory 33
Figure 4.1: Occupational classifications 71
Figure 4.2: Racial distribution 72
Figure 4.3: Gender distribution 73
Figure 4.4: Educational level 74
Figure 4.5: Length of service 75
Figure 4.6: Age in years 76
Figure 4.7: Marital status 77
Figure 4.8: Income distribution 78
Figure 4.9: Job status 79

1
CHAPTER 1
1.1 INTRODUCTION
According to Meyer (1999), most South African employees experience a lack of job
satisfaction resulting in a low level of employee commitment that, in turn, impacts on
performance and the achievement of organisational goals. The symptoms of these
problems result in low productivity, high absenteeism, labour unrest, industrial action
and high labour turnover. The current situation in the public sector in South Africa is
not dissimilar. Public sector employees are faced with a multitude of factors that
impact on effective and efficient service delivery.
Herman (2005) reports that the Western Cape Department of Health is working
extensively on improving employment conditions of employees within the health
sector as the province has been experiencing an exodus of professional employees
over the years in this sector. Herman attributes the exodus of employees in the health
sector to factors such as better salary prospects being offered overseas resulting in
employee shortages and placing additional demands on remaining employees.
Cullinan (2005) concurs that statistics indicated that by 2001 more than 23 000 South
African-born health employees were working abroad in countries such as Britian, the
USA, Canada, Australia and New Zealand. The reseacher states that “the Gauteng
and Western Cape provinces, the two better resourced provinces, have seen

2
substantial declines in public sector personnel, as has Kwazulu-Natal” (p. 11). Not
only are poor salaries blamed for the dilemma within the public sector, but other
factors such as the work environment and poor management are shown to contribute
towards and exacerbate job satisfaction (Cullinan, 2005).
Ting (1997) states that empirical evidence consistently indicates that job
characteristics such as pay satisfaction, opportunities for promotion, task clarity and
relationships with co-workers and supervisors have significant effects on job
satisfaction of government employees. In support, a study conducted by Ellickson
and Logsdon (2002) reflected that job satisfaction of public sector employees was
significantly influenced by perceptions of employee satisfaction in terms of pay,
promotional opportunities, relationships with supervisors, employees’performance
management systems and fringe benefits.
Similarly, Barrows and Watson (n.d.) posit that low pay, limited flexibility and
limited opportunities for promotion are characteristics of the public sector which
prevent the most qualified workers remaining in government agencies and climbing
the corporate ladder. The researchers emphasise that the resultant effect can lead to a
loss in productivity and a lack of continuity in the public sector. They contend that
these hindering factors also serve as a discouragement for young people entering the
labour market to pursue careers as civil servants.

3
Another study conducted by Pohlmann (1999) found that public sector employees
indicated dissatisfaction with supervision, communication and pay. However, a
survey conducted by Schneider and Vaught (1993) indicated that lower skilled public
sector employees place more emphasis on factors such as achievement, growth, the
work itself and recognition while public sector professionals indicated extrinsic
factors such as management policies and rules, job security, pay, supervision and
working conditions to be important.
1.2 MOTIVATION FOR THE STUDY
A survey conducted at 79 health clinics in South Africa between November 2002 and
February 2003, found that 56% of professional employees intended to go overseas
due to better salary prospects and wanting to further their education. The survey
further indicated that 40% lacked supervision, 68% received feedback from
supervisors, while 44% had no job descriptions. Other factors that were highlighted
by the survey causing dissatisfaction, was the extra workload, problems with
colleagues, stress, employees shortages, unsafe working conditions and poor
equipment (Mariani, Gcaba, & Dalton, 2003). Against this ‘backdrop,’ the premise of
this research is focused on ascertaining how variables such as the work environment,
pay, supervision, co-workers and promotion impacts on job satisfaction of civil
servants at an institution residing under the Department of Health in the Western
Cape.

4
According to Luthans (1989), high or low employee turnover rates, absenteeism and
grievances lodged are factors that indicate whether job satisfaction or job
dissatisfaction exists within organisations. In this regard, similarly, information
disseminated from the Department of Health Provincial Government: Western Cape’s
annual report (2003/2004) highlights some of the major problems experienced within
the Department being:
Employee turnover rates;
Major reasons why employees are leaving the department;
Costs incurred due to sick leave taken;
Types of misconduct addressed at disciplinary hearings and
Grievances and disputes lodged.
Table 1.1 provides a summary of turnover rates per salary band. Highly skilled
supervision which forms part of the Director occupational class reflects the highest
turnover rate of 32.33%.

5
Table 1.1 Annual turnover rates by salary band for the period 1 April 2003
to 31 March 2004
Salary Band
Number of
employees per
band as on 1
April 2003
Appointments
and transfers
into the
Department
Terminations
and transfers
out of the
Department
%
Turnover
rate
Lower skilled 4753 304 356 7.49
Skilled 8209 997 1359 16.56
Highly skilled
production
8997 836 1109 12.33
Highly skilled
supervision
2051 651 663 32.33
SMS Band A 74 5 9 12.16
SMS Band B 18 2 1 5.56
SMS Band C 2 1 0 0
SMS Band D 1 0 0 0
Total 24105 2796 3497 14.51
Source: Annual Report (2003/2004): Department of Health-Western Cape, p. 115.
According to Jayiya (2001), the public service is experiencing an exodus of highly
skilled managers and it is for this reason that the government has introduced the

6
Senior Management System (SMS) initiative to circumvent the problem. Jayiya adds
that the SMS offers competitive salary packages similar to that of the private sector.
Highly skilled managers are also afforded the opportunity to manage their own
benefit dispensation. Basset (1994) maintains that a high turnover rate is indicative of
dissatisfaction among employees.
As indicated in Table 1.2 below, resignations and expiry of contracts are the two
major reasons for employees leaving the department.
Table 1.2 Major reasons why personnel are leaving the Department
Termination type Number % of Total
Resignation 983 28.11
Expiry of contract 1691 48.36
Total 3497
Adapted from Annual Report (2003/2004): Department of Health-Western Cape, p. 116.
Table 1.3 illustrates the average number of days of sick leave taken per employee is 9
days per employee, resulting in an estimated salary cost of R43 399 000.

7
Table 1.3 Sick leave - 1 January 2003 to 31 December 2003
Salary
Band
Total days
% days with
medical
certification
Number of
employees
using sick
leave
% of total
employees
using sick
leave
Average
days per
employee
Estimated
cost
(R’000)
Lower
skilled
39201 78.89 3900 20.94 10 5,253
Skilled 58657 80.54 6412 34.42 9 11,263
Highly
skilled
production
65717 79.56 7448 39.98 9 21,575
Highly
skilled
supervision
5721 72.47 830 4.46 7 3,505
Senior
management
161 72.67 38 0.20 4 268
Total 169457 79.50 18628 100 9 43,399
Source: Annual Report (2003/2004): Department of Health-Western Cape, p. 124.
Research indicates that attitudinal factors such as job satisfaction and the country’s
economical state contribute to absenteeism in the workplace (Grobler, Warnich,
Carrell, Elbert & Hatfield, 2002).

8
According to Nel, van Dyk, Haasbroek, Schultz, Sono and Werner (2004),
absenteeism is costly and has a disruptive effect on business operations resulting in
lost productivity. In addition, Robbins, Odendaal and Roodt (2003) maintain that
absenteeism is costing South African companies millions of rands per annum in
decreased efficiency and increased benefit payments.
Table 1.4 indicates the number of employees in the Department of Health: Western
Cape that appeared at disciplinary hearings for being absent from work without
obtaining prior permission. Failure to report for work is often associated with
job dissatisfaction and impacts on productivity and continuity of a business entity
(French, 2003).
Table 1.4 Misconduct addressed at disciplinary hearings (Table 1.4 is additional
statistics in relation to Table 1.3)
Type of misconduct Number % of Total
Absent from work without
permission
98 74.2
Total 132
Adapted from Annual Report (2003/2004): Department of Health-Western Cape, p. 128.
Basset (1994) states that employee dissatisfaction is often combined with high levels
of complaints and grievances within the workplace. The author adds that dissatisfied

9
workers can either be a constructive or a destructive complainer that may resort to
sabotage and passive aggression.
Table 1.5 indicates that the total number of grievances lodged for the reporting year
2003/2004 amounted to 48 cases.
Table 1.5 Grievances lodged for the period 1 April 2003 to 31 March 2004
Number % of Total
Number of grievances
resolved
30 62.5
Number of grievances not
resolved
18 37.5
Total number of
grievances lodged
48
Source Annual Report (2003/2004): Department of Health-Western Cape, p. 129.
In addition, Table 1.6 depicts a total number of 47 dispute cases lodged with the
Councils for the reporting year 2003/2004. The Annual Report (2003/2004) of the
Department of Health-Western Cape (p. 129) indicated that no employee strike action
occurred for the period 1 April 2003 to 31 March 2004.

10
Table 1.6 Disputes lodged with Councils for the period 1 April 2003 to
March 2004
Number % of Total
Number of disputes upheld 10 21.2
Number of disputes
dismissed
37 78.8
Total number of disputes
lodged
47
Source Annual Report (2003/2004): Department of Health-Western Cape, p. 129.
Taking cognisance of the statistics presented (pp. 6-11), additional support is
warranted for the research to be conducted amongst employees at the public health
institution in the Western Cape region.
1.3 RESEARCH QUESTIONS
Is there a relationship between biographical variables (namely, occupational
class, race, gender, educational level, tenure, age, marital status, income and
job status) and job satisfaction?
Is there a relationship between job satisfaction amongst employees and work
in present job, remuneration, supervision, promotion and co-workers?

11
Will the demographic variables of occupational class, race, gender,
educational level, tenure, age, marital status, income and job status explain the
variance in job satisfaction amongst employees?
Are there differences in job satisfaction based on biographical variables
(namely, occupational class, race, gender, educational level, tenure, marital
status, income, and job status)?
1.4 RESEARCH OBJECTIVES
Based on the preceding research questions, the research objectives of the study can be
translated as follows:
To determine the relationship between biographical variables (namely,
occupational class, race, gender, educational level, tenure, age, marital status,
income and job status) and job satisfaction.
To determine whether there is a statistically significant relationship between
job satisfaction and work in present job, remuneration, supervision, promotion
and co-workers amongst employees in a public health institution in the
Western Cape.
To determine the variance in job satisfaction amongst employees in a public
health institution based on demographic variables (namely, occupational class,
race, gender, educational level, tenure, age, marital status, income and job
status).

12
To determine whether there are significant differences amongst employees
based on their biographical characteristics (namely, occupational class, race,
gender, educational level, tenure, marital status, income, and job status).
1.5 RESEARCH HYPOTHESES
Welman and Kruger (2001, p. 11) define a hypothesis as “a tentative assumption or
preliminary statement about the relationship between two or more things that needs to
be examined.”
Hypothesis 1
Alternative Hypothesis (H1)
There will be a significant relationship between biographical variables
(namely, occupational class, race, gender, educational level, tenure, age,
marital status, income and job status) and job satisfaction amongst employees
in a public health institution in the Western Cape.
Hypothesis 2
Alternative Hypothesis (H1)
There will be a significant relationship between work, remuneration,
supervision, promotion, and co-workers with job satisfaction amongst
employees in a public health institution in the Western Cape.

13
Hypothesis 3
Alternative Hypothesis (H1)
The demographic variables of occupational class, race, gender, educational
level, tenure, age, marital status, income and job status will significantly
explain the variance in job satisfaction amongst employees in a public health
institution in the Western Cape.
Hypothesis 4
Alternative Hypothesis (H1)
There will be significant differences in the job satisfaction of employees in a
public health institution in the Western Cape based on their biographical
characteristics (namely, occupational class, race, gender, educational level,
tenure, age, marital status, income and job status).
1.6 DELIMITATIONS OF THE STUDY
The sample consists of civil servants employed within the Health Department in the
Western Cape. Generalisability of the results of the study is problematic as the study
is conducted in only one public health institution in the Western Cape region.
Another contributing factor impacting on generalisability is the fact that only the
occupational classes of pharmacist, pharmacist assistant, auxiliary service officer,
administration clerk, director, personnel officer, administrative officer, state

14
accountant and personnel practitioner are targeted in the study. Therefore the results
of the study cannot be inferred to other similar occupational classes in other public
institutions and hence, the external validity of the study may be compromised.
For the respondents, the selected variables contributing to job satisfaction might not
be the only contributing factors that are important. Other variables such as role
ambiguity, job level, contingent rewards and other work-related factors have not been
investigated. Hence, the internal validity of the study will adversely be affected.
Thus, any conclusions emanating from the research are somewhat tenuous.
1.7 DEFINITION OF TERMS
1.7.1 Remuneration (Pay)
Heery and Noon (2001, p. 306) define remuneration as “payment for work, which can
assume a number of different forms, including a basic wage or salary, supplementary
cash payments, such as shift pay and overtime pay, and benefits in kind.” According
to Erasmus, van Wyk and Schenk (2001, p. 526), remuneration is defined as “ the
financial and non financial extrinsic rewards provided by an employer for the time,
skills and effort made available by the employee for fulfilling job requirements
aimed at achieving organisational objectives.” Concepts such as pay, wage or salary
are occasionally used as more or less having the same meaning as remuneration
(Erasmus et al., 2001).

15
1.7.2 Supervisor
According to Evans (1993, p. 112), a supervisor is defined as “a member of the most
junior level of management in the organization.” According to Heery and Noon
(2001, p. 355), a supervisor is defined as “a front-line manager who is responsible for
the supervision of employees.” Nel et al. (2004, p. 453) consider supervisors to be
those employees that “control the activities of lower-level employees.”
1.7.3 Promotion
Heery and Noon (2001, p. 286) define promotion as “the act of moving an employee
up the organisation hierarchy, usually leading to an increase in responsibility and
status and a better remuneration package.” Grobler et al. (2002, p. 237) define
promotion as “the reassigning of an employee to a higher-level job.” Graham (1986,
p. 156) defines promotion as “a move of an employee to a job within the company
which has greater importance and, usually higher pay.” According to Schleger (1985,
p. 50), a promotion is “when one person moves into a position of greater
responsibility.”
1.7.4 Work
Work is stated as “the tasks that have to be done” (Collins South African Thesaurus,
2004, p. 655). In addition, it is defined as “something you have to do that needs effort

16
and energy” (South African Oxford School Dictionary, 2004, p. 253). Furthermore,
work refers to “someone’s job” (The Concise Oxford Dictionary of Current English,
1992, p. 1412).
1.7.5 Co-worker
Co-worker is defined as “fellow worker, a colleague” (Chambers Compact
Dictionary, 2005, p. 181).
1.8 SUMMARY OF THE CHAPTER
In this chapter the study was contextualized with specific reference being made to the
factors affecting job satisfaction of public service employees and how job satisfaction
impacts on the current situation within the public service environment. The rationale
for the study, the research objectives and hypotheses were highlighted. The chapter
concludes with delimitations and key terms being defined. An overview of each
chapter is provided below.
1.9 OVERVIEW OF THE STUDY
To aid in the attainment of the objectives of the study, a survey of the available
literature that was undertaken is presented in Chapter 2. The chapter therefore
provides the theoretical grounding that forms the premise of the study.

17
Chapter 3 provides an in depth discussion of the research methodology used to
investigate the research problem. The design for the sample selection and size,
research instruments used, procedures followed and the statistical techniques used to
analyse the data is also highlighted.
Chapter 4 focuses on the findings that became apparent from the research study.
Chapter 5 deals with the discussion of the results that were obtained. Conclusions are
drawn based on the obtained results and the possible practical implications of the
research findings are highlighted. In conclusion, recommendations for future research
that may be of worth are put forth.

18
CHAPTER 2
LITERATURE REVIEW
2.1 INTRODUCTION
Prolific research in the area of job satisfaction has been conducted over the past few
decades (Boshoff, Cilliers & Van Wyk, 2003; Buitendach & De Witte, 2005; Calder,
2000; Derlin & Schneider, 1994; Dolliver, 2003; Hoole & Vermeulen, 2003; Kh
Metle, 2005; Malherbe & Pearse, 2003). However, a paucity of studies exist in the
public health industry investigating job satisfaction across different occupational
classes. The vast majority of studies conducted in the public health industry in South
Africa over the past years have mainly focused on job satisfaction amongst health
care doctors and nurses (Damane, 1992; Herman, 2005; Mariani et al., 2003;
Mavanyisi, 2005; Pillay, 2003).
According to Kh Metle (2005), job satisfaction has been a popular topic for
researchers in a wide area of fields including industrial psychology, public
administration, business and higher education. The principal reason as to why job
satisfaction is so extensively researched is that it relates to significant associations
with several variables (Yousef, 2000 cited in Buitendach & De Witte, 2005). For
example, it has a positive association with life satisfaction (Judge, Boudreau & Bretz,

19
1994 cited in Buitendach & De Witte, 2005), organisational commitment (Fletcher &
Williams, 1996 cited in Buitendach & De Witte, 2005) and job performance (Babin
& Boles, 1996 cited in Buitendach & De Witte, 2005).
Cherrington (1994) postulates that employees experiencing high satisfaction levels
contribute to organisational commitment, job involvement, improved physical and
mental health, and improved quality of life both on and off the job. Job dissatisfaction
on the other hand, culminates in higher absenteeism, turnover, labour problems,
labour grievances, attempts to organise labour unions and a negative organisational
climate. Spector’s (1997) research corroborates that of Cherrington’s (1994) in which
it was found that employees who are dissatisfied with their jobs show their
disapproval by constantly being late or staying absent from work.
Considering the above and in light of the vision of Healthcare 2010 – “Equal access
to quality care” of the Department of Health: Western Cape, it is imperative that
employees maintain satisfactory job satisfaction and performance levels. Boggie
(2005) maintains that in order to provide good service, the quality of employees is
critical to ensure success. It is for this reason that it is essential that the area of job
satisfaction be explored in order to gain a better insight thereof. This will provide
executive managers with important information to enable them to stimulate greater
job satisfaction amongst employees.

20
2.2 THE CONCEPT OF JOB SATISFACTION
2.2.1 Definitions of job satisfaction
There are a plethora of definitions of job satisfaction, some of which are
contradictory in nature. Spector (1997) refers to job satisfaction in terms of how
people feel about their jobs and different aspects of their jobs. Ellickson and Logsdon
(2002) support this view by defining job satisfaction as the extent to which
employees like their work.
Schermerhorn (1993) defines job satisfaction as an affective or emotional response
towards various aspects of an employee’s work. The author emphasises that likely
causes of job satisfaction include status, supervision, co-worker relationships, job
content, remuneration and extrinsic rewards, promotion and physical conditions of
the work environment, as well as organisational structure.
Similarly, Mc Namara (n.d.) points out that job satisfaction refers to an individual’s
feeling or state of mind giving heed to the nature of the individual’s work. The author
further explains that job satisfaction can be influenced by a diversity of job
dimensions, inter alia, the quality of the employee’s relationship with their
supervisor, the status of the physical environment in which the individual works,
degree of fulfillment in work.

21
In direct contrast, Rue and Byars (1992) refer to job satisfaction as an individual’s
mental state about the job. Robbins et al. (2003) add that an individual with high job
satisfaction will display a positive attitude towards their job, and the individual who
is dissatisfied will have a negative attitude about the job. This definition is expanded
by Greenberg and Baron (1995) who define job satisfaction as an individual’s
cognitive, affective and evaluative reactions toward their jobs.
According to Coster (1992 cited in Sempane, Rieger & Roodt, 2002), the work itself
could have an effect on the total quality of life of the employee. Schneider and
Snyder (1975 cited in Sempane et al., 2002) conclude job satisfaction is an
individual’s personal assessment of conditions prevalent in the job, thus evaluation
occurs on the basis of factors, which they regard as important to them.
According to Cherrington (1994), research on job satisfaction has identified two
aspects to understanding the concept of job satisfaction, namely, the facet satisfaction
and overall satisfaction. These two concepts are explained as follows:
2.2.2 Facet Satisfaction
Facet satisfaction refers to the tendency for an employee to be more or less satisfied
with various facets or aspects of the job (Johns, 1988). Cherrington (1994) refers to
the various aspects or facets of the job as the individual’s attitude about their pay, the
work itself - whether it is challenging, stimulating and attractive, and the

22
supervisors - whether they possess the softer managerial skills as well as being
competent in their jobs.
2.2.3 Overall Satisfaction
Overall satisfaction focuses on the general internal state of satisfaction or
dissatisfaction within the individual. Positive experiences in terms of friendly
colleagues, good remuneration, compassionate supervisors and attractive jobs create a
positive internal state. Negative experiences emanating from low pay, less than
stimulating jobs and criticism create a negative internal state. Therefore, the feeling
of overall satisfaction or dissatisfaction is a holistic feeling that is dependent on the
intensity and frequency of positive and negative experiences (Cherrington, 1994).
2.3 MOTIVATION THEORIES
Mullins (1996, p. 520) states that “motivation is a process which may lead to job
satisfaction.” Although the relationship between motivation and job satisfaction is not
clear, it can be illustrated by means of the motivational theories (Mullins, 1996).
According to Calder (2000), motivational theories can be classified into two
categories, namely, content theories and process theories. Mullins (1996) concludes
that the content theories of motivation are specifically related to job satisfaction and
assume a direct relationship between job satisfaction and improved performance,

23
while the process theories contemplate in more detail the relationship between
motivation, satisfaction and performance.
Cronje, Du Toit, Marais and Motlatta (2003) further posit that content theories
highlight the factors within people that guide behaviour, whereas process theories
focus largely on why individuals opt for certain behavioural choices to satisfy their
desires and how they assess their satisfaction after they have attained their objectives.
Nel et al. (2004) make reference to content theories as the ‘what’ of motivation and to
process theories as the ‘how’ of motivation. Nel et al. (2004) state that content
theories concentrate on the needs and factors that motivate behaviour, while process
theories are focused on the source of behaviour and the factors that affect the strength
and direction of the behaviour.
The following content theories will be addressed: Maslow’s needs hierarchy theory,
Herzberg’s two factor theory and Mc Clelland’s achievement motivation theory.
Process theories that will be given attention to include: The Valence Instrumental
Expectancy theory, Equity theory and Goal Setting theory. These theories endeavour
to provide a supporting context for job satisfaction.

24
2.3.1 Content Theories
2.3.1.1 Maslow’s needs hierarchy theory
Extensive research has been conducted in the area of work motivation and
satisfaction and many psychologists have attempted to explain it in terms of certain
needs, interests and values. One theory that has explored these factors is Maslow’s
hierarchy of needs. According to Maslow, the individual personality is dynamic and
continuously strives to satisfy a hierarchy of needs with an inherent tendency towards
self actualization (Joubert, 2000).
Amongst others, Abdullah (2002) postulates that Maslow’s hierarchy of needs is
divided into five levels. Edwards (1993 cited in Arnolds & Boshoff, 2001) states that
level one of the hierarchy refers to the satisfaction of the psychological needs which
include the basic needs such as housing, material and financial benefits impacting
positively on employee job performance.
At level two, the safety needs for security and protection from physical and emotional
harm is prominent. At this level, the employer must provide a safe working
environment, while the onus rests with individuals to ensure their own personal safety
outside of the work sphere (Abdullah, 2002). According to Smith and Tisak (1993
cited in Arnolds & Boshoff, 2001), at this level, safety and security in the form of job
security and fringe benefits, have been found to enhance employee job performance.

25
According to Abdullah (2002), level three refers to the social needs that entail the
need for affiliation focusing on the relationship with co-workers or subordinates.
Levine (1994) concludes that at this level, social support of employees is necessary to
enhance performance.
The esteem needs exist at level four of the hierarchy and is divided into two parts,
namely, (i) the need for recognition and respect from others and (ii) a need for a
positive self-image and self respect (Abdullah, 2002). According to Korman (1971)
and Tharenou (1979) cited in Arnolds and Boshoff (2001), individuals with high self-
perceived ability and self-image are more likely to be higher achievers on task
performance than those who have a low self-perceived ability, low success
expectancy and low self-image.
The self-actualization needs are at the last level of Maslow’s hierarchy and are
arrived at when all previous levels have been satisfied to a large extent (Heller &
Hindle, 1998). The satisfaction of self-actualization in the workplace is enhanced by
creating opportunities for promotion, allowing autonomy, providing challenging
assignments and the optimal utilization of individual’s ability. This is specifically
prevalent in the case of top management where the factors mentioned above impact
positively on employee job performance (Alpander (1990), Cranny, Smith & Stone
(1992), and Mc Campbell (1996) cited in Arnolds & Boshoff, 2001). As each need in
terms of the hierarchy becomes substantially satisfied, the following need becomes
dominant (Robbins et al., 2003).

26
Although Maslow’s needs theory is used extensively, wide criticism has been lodged
against the theory as a lack of empirical evidence exists in substantiation for the
theory (De Cenzo & Robbins, 1988 cited in Arnolds & Boshoff, 2001). Steers and
Porter (1991) add that there is no evidence of the five categories of needs being
reflected in order of satisfaction in any special hierarchy. Similarly, Robbins et al.
(2003) posit that little support has been found for the prediction that need structures
are organised along the scope suggested by Maslow.
2.3.1.2 Herzberg’s two factor theory
According to Heller and Hindle (1998), Herzberg’s two factors is a set of motivators
that drives people to achieve. Nagy (n.d.) asserts that Herzberg’s theory consists of
two dimensions known as “hygiene” factors and “motivator” factors. According to
Herzberg (1959) cited in Ruthankoon and Ogunlana (2002), the hygiene factors also
known as extrinsic factors are the parts of the jobs which create dissatisfaction but, if
not present, only return the worker to a neutral point of job satisfaction. These job
factors include supervision, interpersonal relations, benefits, job security, salary and
working conditions. Herzberg states that hygiene issues cannot motivate employees
but can minimise dissatisfaction and serve as a point of departure for motivation.
On the other hand, satisfying motivator needs which are related to job tasks, job
content and intrinsic aspects of the job can lead to job satisfaction, but the absence
thereof cannot lead to job dissatisfaction (Robbins, 1993). According to Robbins et
al. (2003), investigations conducted by Herzberg in terms of the intrinsic (motivators)

27
factors and extrinsic factors (hygiene) suggest that the opposite of satisfaction is not
dissatisfaction as was traditionally believed. The results of the studies reflected that
the opposite of satisfaction is no satisfaction (motivators) and the opposite of
dissatisfaction is no dissatisfaction (hygiene factors).

28
FIGURE 2.1: FACTORS THAT AFFECT JOB SATISFACTION IN TERMS
OF HERZBERG’S THEORY
Source: Grobler et al. (2002, p. 107).
Hygiene needs: Reflect job context and lower – level needs
Hygiene factors: More money Better supervision Good working conditions Job security Consistent management policies and rules
Negative job environment creates demands for
Level of dissatisfaction
Level of job performance
Level of satisfaction
Which influence
Motivators: Achievement Responsibility Growth Work itself Recognition
Motivator needs: Reflect job content and higher – level needs
Positive job opportunities Allow worker to achieve
Which influence

29
A criticism of Herzberg’s theory is that it oversimplifies work motivation. There are
job factors that lead to both satisfaction and dissatisfaction. Despite this criticism,
Herzberg extended Maslow’s needs hierarchy concept and made it more applicable to
work motivation (Abdullah, 2002).
Nagy (n.d.) points out that empirical evidence for Herzberg’s theory is scarce and
most support around this theory has been obtained using Herzberg’s own unique
methods consisting of critical interviews.
However, according to Schermerhorn (1993), Herzberg’s two-factor theory is an
important frame of reference for managers who want to gain an understanding of job
satisfaction and related job performance issues. Schemerhorn asserts that Herzberg’s
two-factor theory is a useful reminder that there are two important aspects of all jobs:
what people do in terms of job tasks (job content), and the work setting in which they
do it (job context). Schermerhorn suggests that managers should attempt to always
eliminate poor hygiene sources of job dissatisfaction in the workplace and ensure
building satisfier factors into job content to maximise opportunities for job
satisfaction.

30
2.3.1.3 McClelland’s need for achievement theory
McClelland’s need theory was one of the popular motivation theories in the 1950’s
and his theory relates to management by objectives (Di Rodio, 2002). Robbins et al.
(2003) report that McClelland’s theory focuses on the needs for achievement, power
and affiliation.
The need for achievement, according to Greenberg (1999), is where individuals strive
for goals that are challenging, but attainable, with the hope of feedback on
achievement. Greenberg (1999) further states that this need is concerned with an
individual’s longing to strive for personal achievement rather than the rewards of
success.
The need for power refers to individuals’ desire to control their surroundings,
including people and material resources. In this regard some people have a high need
for personalized power while others have a high need for socialized power (McShane
& Von Glinow, n.d.).
In terms of McClelland’s need for affiliation, Stuart-Kotze (n.d.) states that the need
for affiliation is similar to Maslow’s need to belong. Stuart-Kotze contends that the
need for affiliation manifests itself in the desire to be liked by other individuals, to be
accepted in a group and to enter into warm personal relationships. Cronje et al. (2003)
posit that research indicates that people with a high need for power and low need for

31
affiliation make good managers, whilst individuals with a high need for achievement,
in most instances, make successful entrepreneurs.
2.3.2 Process Theories
2.3.2.1 Vroom’s expectancy theory
Vroom regarded Maslow’s hierarchy of needs and Herzberg’s two factor theory as
too simplistic and as a result put forward a model that constituted the concepts of
valence (V), instrumentality (I) and expectancy (E). Vroom’s theory is referred to as
VIE theory. Vroom explained the scope of motivation as a process governing choices
between alternative forms of voluntary activity. According to the VIE theory, most
behaviours are under the voluntary control of a person (Abdullah, 2002).
According to Vroom’s expectancy theory, the success of motivation is dependent on
two factors, namely, that the value of the outcome should be high and that the
individual should be of the opinion that the task undertaken is attainable and will lead
to the expected outcome (Dessler, 1988). In this regard, Vroom’s theory links
expectation and task accomplishment to the probability of recognition (Luthans,
2002). In support Nel et al. (2004) state that expectancy refers to an individual’s
belief that a certain level of effort will lead to a certain level of performance and
reward.

32
Figure 2.2 illustrates the key concepts of Vroom’s expectancy theory.
FIGURE 2.2: VROOM’S EXPECTANCY THEORY Effort exerted Performance First–level Second-level (Motivation force) outcomes outcomes Source: Nel et al. (2004, p. 318). A criticism of Vroom’s theory however, is that he did not succeed to convert
motivation to perform an act into the actual performance of that act (Bottomley,
1987). Although the theory has its criticism, most of the research evidence is
supportive of the theory (Dessler, 1988).
Expectancy – perceived probability that effort will lead to performance and first level outcomes
Valence-anticipated satisfaction of attaining a goal
Units produced Sales generated Number of queries solved Number of invoices processed
Recognition Bonus Acceptance Promotion

33
2.3.2.2 Equity theory
The Equity theory of motivation suggests that individuals have a strong want to
maintain a balance between what they perceive their inputs or contributions to be in
relation to expected rewards (Dessler, 1988). In terms of the Equity theory, Robbins
(1993) states that satisfaction is determined by an individual’s input-outcome
balance. The author further mentions that satisfaction occurs when perceived equity
exists, and dissatisfaction results when perceived inequity exists.
To illustrate the Equity theory, reference is made to figure 2.3 below.
FIGURE 2.3: EQUITY THEORY Ratio Comparisons Perception
______________________________________________________________ O / lA < O / lB Inequity due to being under – rewarded O / lA = O / lB Equity O / lA > O / lB Inequity due to being over – rewarded ___________________________________________________________________________________ *Where: O / lA represents the employees; and O / lB represents relevant others. Source: Robbins (1993, p. 224).
In terms of the theory, individuals regard a state of equity to exist when their job
inputs in relation to their job outputs are equivalent to that of relevant others. In this

34
regard a situation of fairness is said to exist (Robbins, 1993). Employees might assess
their relation to friends, neighbours, co-workers, colleagues in other organisations or
previous jobs they themselves have occupied (Robbins, 1993). Similarly, Robbins et
al. (2003) concur that employees compare their job inputs (such as their contribution,
experience, education and competence) to their job outputs (salary levels, salary
increases and recognition) in relation to that of others.
Similarly, inequity exists when there is a perception amongst employees that they are
under-rewarded relevant to others or whether they are over–rewarded in relation to
their job outputs. The resultant effect is that individuals might contribute less in the
workplace if they are of the opinion that they are being underpaid. On the other hand,
employees might offer more in terms of their expected job outputs as they may be
more motivated to contribute if a job pays well in comparison to their job outputs
(Dessler, 1988).
2.3.2.3 Goal setting theory
Locke (1968 cited in Robbins et al., 2003) proposed that aiming towards attaining a
goal is a significant source of work motivation. According to Heery and Noon (2001),
the goal setting theory stems from the notion that the behaviour of employees can be
changed by influencing their goals and targets. Nel et al. (2004) add that employees
are motivated if they are aware of what needs to be done in achieving a specific goal,
irrespective of the difficulties they might encounter in doing so. They refer to the

35
Management By Objectives (MBO) technique that harbours employee involvement in
goal-setting, decision-making and feedback.
Robbins (1998) states that employees will perform better if they get continuous
feedback in terms of how well they are progressing toward their goals. Furthermore,
Robbins (1998) adds that continuous feedback will also identify possible
discrepancies that might hamper the achievement of attaining goals. Employees
granted the opportunity to be involved in the preparation of their own goals would be
more committed in achieving such goals.
Heery and Noon (2001, p. 142) note four general principles to elicit high performance
and increase motivation in terms of the goal setting theory:
“goals should be challenging but attainable;
goals should be specific rather than vague;
employees should be involved in the process, setting their own goals; and
goals should be measurable in terms clearly understood by employees.”
2.4 THE ANTECEDENTS OF JOB SATISFACTION
The factors affecting job satisfaction can be divided into two main areas, namely,
personal determinants and organisational factors (Nel et al., 2004).

36
2.4.1 Personal Determinants
Studies investigating job satisfaction indicate that personal determinants such as race,
gender, educational level, tenure, age and marital status impact on job satisfaction.
2.4.1.1 Race
Research evidence with regard to the relationship between race and job satisfaction
have yielded inconsistent results (Friday, Moss & Friday, 2004).
Research conducted by Gavin and Ewen (1974) cited in Friday et al. (2004) on
various occupational classes consisting of blue collar and white collar employees,
reflected that African employees experienced higher levels of job satisfaction than the
other racial groups. On the other hand, a number of studies have also found that
White employees amongst different occupational classes experienced higher levels of
job satisfaction in comparison to African employees (Strawser & Slocum (1972),
O’Reilly & Roberts (1973), Milutinovich (1977), Gold, Webb & Smith (1982), Davis
(1985), Greenhaus, Parasuraman & Wormley (1990), Martin & Tuch (1991) all cited
in Friday et al., 2004).
A survey conducted by Henault (2004) investigating job satisfaction amongst
American healthcare executives revealed that minorities continued to lag behind their
White counterparts. A number of studies have also found that race based differences

37
in relation to job satisfaction can be attributed to group homogeneity. The results
from these studies reflect that as homogeneity in the group increases, members of the
group experience an increase in job satisfaction (Jackson (1991), Egan, O’Reilly &
Tsui (1992) cited in Jones & Schaubroeck, 2004).
Studies indicating the relationship between race and job satisfaction within the South
African context are however, limited. An investigation by Erasmus (1998) from the
Unisa Business Leadership School, found a difference in job satisfaction between
White and African females within a human resources profession. The researcher
reports that White females were found to be more satisfied than their African female
colleagues. The research highlighted factors such as pay and benefits causing
dissatisfaction amongst African females. Findings of another study conducted in 2000
among readers of the apartment section of the South African Business Times,
revealed that African respondents are more likely to feel less secure in their positions
than their White counterparts. Reasons cited for their feeling of lack of job security
were as a result of restructuring, affirmative action or shrinking of industry sectors
(Robbins et al., 2003).
2.4.1.2 Gender
Several studies conducted with regard to the relationship between gender and job
satisfaction have yielded contradictory results (Chiu, 1998).

38
A study conducted by Murray and Atkinson (1981) investigating gender differences
in determinants of job satisfaction, reflected that females attach more importance to
social factors, while males place greater value on pay, advancement and other
extrinsic aspects. In support, Tang and Talpade (1999) maintain that there is a
significant difference between males and females in terms of job dimensions
impacting on job satisfaction. Their study found that men tend to have higher
satisfaction with remuneration in relation to females, while females tended to have
higher satisfaction with co-workers than males.
Findings of a survey looking at issues affecting women in the South African
workforce indicated similar findings with regard to females. The majority of
respondents revealed that they were satisfied with their jobs. The factors that
contributed the most to their job satisfaction were the company of co-workers, the
opportunity to learn new things and factors inherent in the job itself (Robbins et al.,
2003).
Oshagbemi (2000) however, failed to find that gender affects job satisfaction.
Similarly, Donohue and Heywood (2004) could not prove gender satisfaction
differences in a study conducted amongst young American and British employees.
Contrary to the above, Robbins et al. (2003) argue that no evidence exists suggesting
that gender impacts on an employee’s job satisfaction. The authors are of the opinion

39
that gender differences can have an effect on the relationship between job dimensions
and job satisfaction, but that it does not have a direct impact on job satisfaction.
2.4.1.3 Educational level
Studies conducted on the relationship between the level of education and job
satisfaction showed no consistent pattern (Kh Metle, 2003).
An investigation by Crossman and Abou-Zaki (2003) in the Lebanese banking sector
found that no statistically significant relationship existed between job satisfaction and
education (p = 0.094). Although the relationship was not significant, their research
found that a relationship between job satisfaction and education existed. In this regard
respondents in possession of a school certificate reported the lowest level of overall
job satisfaction, while employees with a college certificate reported the highest level
of overall job satisfaction. The researchers highlighted possible factors such as a lack
of skills and less favourable treatment by management as contributing to lower
satisfaction levels among staff in possession of a school certificate.
However, a similar study conducted by (Kh Metle, 2003) amongst Kuwaiti women
employed in a public government sector environment, showed that a strong
relationship existed between the level of education and overall job satisfaction. Of the
employees surveyed, 90% were in possession of a post graduate qualification.

40
Employees in possession of an intermediate level qualification reported higher levels
of satisfaction in relation to those employees who have higher levels of education.
Kh Metle (2003) suggests that job satisfaction decreases in relation to an increase in
the level of education as the expectations of employees are often not met by
employers. To concur with this finding, results obtained from a study conducted by
Johnson and Johnson (2000) whereby 288 employees in the American postal services
were surveyed, found perceived over-qualification to have a negative relationship
with the dimensions of job satisfaction.
2.4.1.4 Tenure
Tenure refers to the number of years an employee has spent working (Oshagbemi,
2003). According to Bedeian, Ferris and Kacmar (1992) cited in Robbins et al.
(2003), tenure and job satisfaction is positively related.
Ronen (1978) cited in Oshagbemi (2003) found tenure to have a U-shaped
relationship with job satisfaction. In this respect, Ronen maintains that employee
satisfaction declines within the first year of employment and remains low for several
years, after which it increases. Furthermore, he maintains that employee expectations
are high at the time of appointment, but when these expectations are not met, the
resultant effect leads to a drop in job satisfaction. As the employee becomes more
mature and experienced, the initial expectations decline to a more realistic level

41
thereby making such expectations more attainable, coinciding with increased job
satisfaction.
Research conducted by Mottaz (1988) amongst nurses in the United States of
America found a significant increase in job satisfaction with length of time on the
job. Clarke, Oswald and Warr (1996) contend that employees with longer service
may experience higher satisfaction levels because the job matches their personal
needs. In this regard, Mottaz (1987) cited in Sarker, Crossman, & Chinmeteepituck
(2003) adds that employees with long service tend to adjust their work values to the
conditions of the workplace resulting in greater job satisfaction. Oshagbemi (2000)
attribute the increase in job satisfaction over the length of time to factors such as job
stability and opportunities for promotion.
Contrary to the above, Savery (1996) cited in Sarker et al. (2003) states that longer
tenure in a job may lead to boredom and lower levels of job satisfaction. Similarly,
Clarke et al. (1996) maintain that longer tenure does not necessarily lead to increased
levels of job satisfaction. The researchers cite low job mobility and external labour
market conditions as possible factors contributing to lower levels of job satisfaction.

42
2.4.1.5 Age
Mixed evidence exists regarding the relationship between age and job satisfaction
(Robbins et al., 2003).
According to Greenberg and Baron (1995), older employees are generally happier
with their jobs than younger employees, while people who are more experienced in
their jobs are more highly satisfied than those who are less experienced. This view is
supported by Drafke and Kossen (2002). The researchers state that job satisfaction
typically increases with age as older workers have more work experience and
generally have a more realistic view of work and life in comparison to their younger
counterparts. They are of the opinion that younger workers have less experience to
draw on and have an idealistic view of what work should be like.
Research conducted by Okpara (2004) amongst managers within an IT environment
found a significant relationship between job satisfaction and age. Similarly, earlier
research supported this finding. Rhodes (1982) cited in Oshagbemi (2003) supports
the findings that the relationship between job satisfaction and age is significant. The
author reached this conclusion after a review of the findings of seven other separate
studies conducted on the relationship between age and job satisfaction.
Robbins et al. (2003) report that although most studies indicate a positive relationship
between age and job satisfaction, other studies reflect a decrease in satisfaction as

43
employees move towards middle age, at least up to the age of 60. Satisfaction
increases again from around 40 and on. The authors refer to this phenomenon as the
U-shaped relationship. Mottaz (1987) in Oshagbemi (2003) cited several reasons for
the variance in job satisfaction between older and younger workers. Mottaz’s view is
that younger workers are generally more dissatisfied than older employees because
they demand more than their jobs can provide. The author postulates that older
workers possess more seniority and work experience enabling them to move easily
into more rewarding and satisfying jobs. Older workers place less emphasis on
autonomy or promotion, thus they demand less from their jobs, making them more
satisfied than their younger counterparts. Workers tend to adjust to work values and
the work environment the longer they are employed, adding to greater job
satisfaction.
2.4.1.6 Marital status
Research on the effect of marital status on job satisfaction has yielded inconclusive
results (Robbins et al., 2003).
The results of a study conducted by Kuo and Chen (2004) investigating the level of
job satisfaction amongst IT personnel working in Taiwan, found marital status to be
highly related to general, intrinsic and overall satisfaction. They reported that the
results of the study indicated that married employees experienced higher levels of job
satisfaction in comparison to that of single employees. Research conducted by

44
Cimete, Gencalp and Keskin (2003) which involved 501 nurses employed at two
university hospitals in Istanbul, established that the job satisfaction mean score of
divorcees and widows was higher than that of single and married groups. The
difference between the mean scores was significant. Research conducted by Jamal
and Baba (1992) also found a significant relationship between job satisfaction and
marital status.
2.4.2 Organisational factors
The organisational factors impacting on job satisfaction include the work itself,
remuneration/pay, supervision, promotion opportunities, co-workers, job status and
job level.
2.4.2.1 The work itself
Locke (1995) postulates that employee job satisfaction is dependant on satisfaction
with the job components, such as the work itself.
Robbins et al. (2003, p. 77) refer to the work itself as “the extent to which the job
provides the individual with stimulating tasks, opportunities for learning and personal
growth, and the chance to be responsible and accountable for results.” According to
Robbins (1993), employees prefer jobs that present them with opportunities to
execute their competencies on a variety of tasks and that are mentally stimulating.
45
This view is supported by Lacey (1994) who states that individuals are more satisfied
with the work itself when they engage in tasks that are mentally and physically
stimulating. Robbins et al. (2003) posits that jobs that are unchallenging lead to
boredom and frustration. Contrary to the above, Johns (1996) is of the opinion that
some employees prefer jobs that are unchallenging and less demanding.
Research conducted by Vitell and Davis (1990) which involved employees in a
management information system environment, found a statistically significant
relationship between job satisfaction and the dimension of work itself. Results from
other studies conducted indicate that a dimension such as the work itself can result in
either job satisfaction or dissatisfaction (Oshagbemi, 1997; Ruthankoon & Ogunlana,
2003).
2.4.2.2 Remuneration/pay
Research appears to be equivocal regarding the influence of pay on job satisfaction.
According to Bassett (1994), a lack of empirical evidence exists to indicate that pay
alone improves worker satisfaction or reduces dissatisfaction. The author is of the
opinion that highly paid employees may still be dissatisfied if they do not like the
nature of their job and feel they cannot enter a more satisfying job. In a study
conducted by Oshagbemi (2000) amongst United Kingdom academics, a statistically

46
significant relationship between pay and rank of employees and their level of job
satisfaction was established.
However, a study conducted by Young, Worchel and Woehr (1998) in the public
sector failed to find any significant relationship between pay and satisfaction.
Similarly, results from a survey conducted by Brainard (2005) amongst postdoctoral
scientific researchers found pay and benefits to be weakly associated with job
satisfaction.
The existence of both financial reward and recognition has been found to have a
significant influence on knowledge workers (Arnolds & Boshoff, 2004; Kinnear,
1999; Kinnear & Sutherland, 2000). Individuals view their remuneration as an
indication of their value to the organisation. They compare their inputs to received
outputs relevant to that of others (Nel et al., 2004).
This view is supported by Sweeney and McFarlin (2005) who concur that
comparisons with similar others are important predictors of pay satisfaction. Their
study, which was based on the social comparison theory, highlighted the fact that
comparisons to similar others impacts on pay satisfaction. According to Boggie
(2005), inequity in terms of lack of recognition and poor pay often contribute to a
problem with employee retention.

47
2.4.2.3 Supervision
Research demonstrates that a positive relationship exists between job satisfaction and
supervision (Koustelios, 2001; Peterson, Puia & Suess, 2003; Smucker, Whisenant, &
Pederson, 2003).
Supervision forms a pivotal role relating to job satisfaction in terms of the ability of
the supervisor to provide emotional and technical support and guidance with work-
related tasks (Robbins et al., 2003). According to Ramsey (1997), supervisors
contribute to high or low morale in the workplace. The supervisor’s attitude and
behaviour toward employees may also be a contributing factor to job-related
complaints (Sherman & Bohlander, 1992). Supervisors with high relationship
behaviour strongly impact on job satisfaction (Graham & Messner, 1998). Wech
(2002) supports this view by adding that supervisory behaviour strongly affects the
development of trust in relationships with employees. The author further postulates
that trust may, in turn, have a significant relationship with job satisfaction.
A study conducted by Packard and Kauppi (1999) found that employees with
supervisors displaying democratic management styles experienced higher levels of
job satisfaction compared to those who had supervisors who exhibited autocratic or
liassez – faire leadership styles. Brewer and Hensher (1998) contend that supervisors
whose leadership styles emphasise consideration and concern for employees
generally have more satisfied workers than supervisors practicing task structuring and

48
concern for production. Bassett (1994) maintains that supervisors bringing the
humanistic part to the job, by being considerate toward their employees, contribute
towards increasing the employee’s level of job satisfaction.
2.4.2.4 Promotion opportunities
A number of researchers are of the opinion that job satisfaction is strongly related to
opportunities for promotion (Pergamit & Veum, 1999; Peterson et al., 2003; Sclafane,
1999).
This view is supported in a study conducted by Ellickson and Logsdon (2002) with
municipal government workers where satisfaction with promotional opportunities
was found to be positively and significantly related to job satisfaction. Kreitner and
Kinicki (2001) however, state that the positive relationship between promotion and
job satisfaction is dependent on perceived equity by employees.
2.4.2.5 Co-workers
A number of authors maintain that having friendly and supportive colleagues
contribute to increased job satisfaction (Johns, 1996; Kreitner & Kinicki, 2001;
Luthans, 1989).

49
Findings of a survey conducted by Madison (2000) on more than 21000 women
occupying the most demanding jobs indicated that those participants who lacked
support from co-workers, were more likely to suffer from job dissatisfaction. Another
survey conducted amongst 1250 FoodBrand employees found that positive
relationships with co-workers enhance job satisfaction (Berta, 2005).
Empirical evidence indicates that relationships with colleagues have consistently
yielded significant effects on job satisfaction of federal government workers in the
United States (Ting, 1997). A study conducted by Viswesvaran, Deshpande and
Joseph (1998) further corroborated previous findings that there is a positive
correlation between job satisfaction and co-workers.
2.4.2.6 Job status
To date, a paucity of research exists indicating the relationship between job status and
job satisfaction.
Research conducted by Feather and Rauter (2004) which involved contract and
permanent employees in the teaching environment in Australia, failed to establish a
relationship between job status and job satisfaction.

50
2.4.2.7 Job level
Satisfaction surveys reflect that a positive relationship prevails between job level and
job satisfaction (Cherrington, 1994).
Higher levels of job satisfaction are usually reported by individuals occupying higher
level positions in organisations as they offer better remuneration, greater variety,
more challenge and better working conditions (Cherrington, 1994). Research
conducted by Robie, Ryan, Schmieder, Parra and Smith (1998) corroborates the view
that a positive and linear relationship exists between job satisfaction and job level.
Results of their study indicate that as job level increased, so did job satisfaction.
In support of the above, Allen (2003) postulates that job satisfaction is strongly linked
to an employee’s position within the company. The author concludes that the higher
the ranking, the lower the job satisfaction. In contrast, Mossholder, Bedeian and
Armenakis (1981) cited in Robie et al. (1998) report that job satisfaction decreases
with an increase in the job level.

51
2.5 THE CONSEQUENCES OF JOB SATISFACTION
Numerous authors have highlighted that job satisfaction impacts on employee
productivity, turnover, absenteeism, physical and psychological health (Johns, 1996;
Luthans, 1989; Mullins, 1996).
2.5.1 Productivity
Research findings indicate that the relationship between satisfaction and productivity
is positive, but very low and inconsistent (Johns, 1996).
According to Luthans (1989), although a relationship between job satisfaction and
productivity exists, the relationship between these variables is not strong. The author
maintains that the most satisfied employee will not necessarily be the most productive
employee.
At an individual level the evidence is often inconsistent in terms of the relationship
between satisfaction and productivity, but at an organisational level a strong
relationship exists between satisfaction and productivity (Robbins et al., 2003).

52
2.5.2 Physical and psychological health
Spector (1997) states that individuals who dislike their jobs could experience
negative health effects that are either psychological or physical. On the other hand,
Luthans (2002) mentions that employees with high levels of job satisfaction tend to
experience better mental and physical health.
2.5.3 Turnover
A number of studies strongly support the view that turnover is inversely related to job
satisfaction (Griffon, Hand, Meglino & Mobley (1979) and Price (1977) cited in
Robbins et al., 2003).
According to French (2003), a high employee turnover rate is often prevalent in an
environment where employees are highly dissatisfied. Greenberg and Baron (1995)
contend that employees lacking job satisfaction often tend to withdraw from
situations and environments as a means of dealing with their dissatisfaction. A major
form of employee withdrawal is voluntary turnover. By not reporting for duty, or by
resigning to seek new job prospects, individuals might be expressing their
dissatisfaction with their jobs or attempting to escape from the unpleasant aspects
they may be experiencing. Phillips, Stone and Phillips (2001) concur that employee
turnover is the most critical withdrawal variable.

53
A study conducted by Steel and Ovalle (1984) established a moderately strong
relationship between job satisfaction and turnover, indicating that less satisfied
workers are more likely to quit their jobs. According to Lee and Mowday (1987) cited
in Luthans (1989), a moderate relationship exists between satisfaction and turnover.
The researchers posit that high job satisfaction will not necessarily contribute to a low
turnover rate, but will inadvertently assist in maintaining a low turnover rate.
2.5.4 Absenteeism
Research indicates that job satisfaction levels are related to absenteeism (Hellriegel,
Slocum & Woodman, 1989).
Nel et al. (2004, p. 548) maintain that “absenteeism is regarded as withdrawal
behaviour when it is used as a way to escape an undesirable working environment.”
According to Luthans (1989), various studies conducted on the relationship between
satisfaction and absenteeism indicates an inverse relationship between the two
variables. Thus, when satisfaction is high, absenteeism tends to be low. The converse
indicates that when satisfaction is low, absenteeism tends to be high. Contrary to this,
the findings of a study undertaken by Johns (1996) found the association between job
satisfaction and absenteeism to be moderate.
Robbins (1993) supports the view of a moderate relationship existing between
satisfaction and absenteeism. According to Robbins et al. (2003), the moderate
54
relationship between these variables could be attributed to factors such as liberal sick
leave, whereby employees are encouraged to take time off. The afore-mentioned
could ultimately reduce the correlation coefficient between satisfaction and
absenteeism.
2.6 SUMMARY OF THE CHAPTER
The chapter introduced the concept of job satisfaction and highlighted the different
motivational theories relating to job satisfaction. Furthermore, it sought to provide an
overview of the literature pertaining to job satisfaction antecedents, whereby personal
determinants and organisational factors impacting on job satisfaction were discussed.
In terms of the job satisfaction antecedents and job satisfaction consequences, various
areas where research has been conducted have been referred to.
From the literature review it is evident that job satisfaction is a phenomenon that has
been extensively researched and is of significant importance to employees and
managers alike. In this regard, the literature concludes with the relevance of job
satisfaction on the physical and psychological health of employees and the effect it
has on productivity, turnover and absenteeism.

55
CHAPTER 3
RESEARCH METHODOLOGY
3.1 INTRODUCTION
The chapter highlights how the research problem was explored, with specific
reference made to how the participants were selected and the procedure followed to
gather the data. Furthermore, the ethical considerations and confidentiality aspects are
addressed; the measuring instruments to gather the data and its ensuing psychometric
properties are discussed. The chapter concludes with the statistical techniques utilised
for the data analysis.
3.2 RESEARCH DESIGN
For the purpose of the study a non-probability sampling design in the form of a
convenience sampling method was adopted and considered to be appropriate to gather
the data. The rationale for using this sampling method was due to the respondents
being easily accessible, their availability, as well as it being less time consuming and
inexpensive to gather the research information.

56
Welman and Kruger (2001, p. 62) contend that “the advantage of non-probability
samples is that they are less complicated and more economical than probability
samples.” The authors further postulate that convenience sampling involves
collecting information of members of the population that are near and readily
available for research purposes. However, a limitation highlighted by Leedy (1993) in
terms of utilising convenience sampling is that it is not necessarily representative of
the population and therefore the results are not generalisable to other entities. Hence,
taking cognisance of the afore-mentioned and that a non-probability sample was used,
the external validity of the study was compromised. A quantitative methodology was
used to assess job satisfaction. The instruments used to gather the data included a
biographical questionnaire (Appendix B) and Job Descriptive Index (JDI), which is a
self-administered questionnaire (Appendix C).
Dessler (2000) points out the following in terms of using questionnaires as a method
of data collection:
It is a quick and efficient way to obtain information from a large number of
individuals;
It is less costly than interviewing a vast number of people; and
Questionnaires secure participants’ anonymity.

57
The major drawbacks of using questionnaires are however, outlined by Bless and
Higson- Smith (1995):
the response rate for questionnaires tend to be low;
the literacy levels of respondents are not known to the researcher in advance;
and
the researcher runs the risk of receiving incomplete questionnaires that will
have to be discarded.
3.2.1 Population
The population targeted in this study included permanent and contract employees
(N = 286), spanning across six (6) Directorates (Financial Administration, Supply
Chain Management, Professional Support Services, Labour Relations, Human
Resource Management and Information Management) at a public sector institution
under the auspices of the Department of Health in the Western Cape.
3.2.2 Sample
All employees were solicited to partake in the study. Thus, two hundred and eighty
six (286) questionnaires were administered of which two hundred and three (203)
questionnaires were returned, yielding a 71% response rate. According to Sekaran
(2000), a response rate of thirty percent (30%) is regarded as acceptable for most
research purposes. This good response rate can be attributed to inter alia: the

58
participants being informed well in advance of the purpose and objectives of the
research, buy-in from the Head of Department and the assistance of senior managers
in administering the questionnaires. Furthermore, the researcher is employed by the
Health Department: Western Cape and was therefore acquainted with the participants,
thus making it easier to ensure co-operation and follow up.
The sample (n = 203) comprised of males and females, permanent and contract
employees members on salary levels 2 to 13, extending across the following
occupational classes: Pharmacist, Pharmacist Assistant, Auxiliary Service Officer,
Administrative Clerk, Director, Personnel Officer, Administrative Officer, State
Accountant and Personnel Practitioner.
3.2.3 Procedure
Prior to conducting the study permission was obtained from the Head of the
Department of Health: Western Cape. Consent was also granted to the researcher to
have access to departmental information necessary for the research.
To evoke an interest in the study, all senior managers and employees residing under
their supervision were initially informed via e-mail about the purpose and objectives
of the study and when the study would be conducted, the confidentiality, anonymity
and voluntary nature of the study was also addressed, and assurance given that the
information acquired would only to be used for research purposes.
59
A total number of two hundred and eighty-six (286) biographical and JDI
questionnaires were distributed within the six (6) Directorates identified to partake in
the research study. Attached to the questionnaires was a cover letter (Appendix A)
re-iterating the aims and objectives of the study, assurance that anonymity would be
protected, that responses would be confidential, that the study is for research purposes
only and the instructions to complete the questionnaire.
A contact person employed within each Directorate was identified to assist with the
distribution of the research questionnaires. To ensure anonymity and confidentiality,
participants were requested to return the questionnaires to the researcher within one
(1) week in the enclosed envelope provided.
3.2.4 Biographical Questionnaire
A self-developed questionnaire was used to obtain demographic information relevant
to the sample. Participants were asked to furnish information with regard to their
occupational class, race, gender, educational level, age, marital status, monthly
income, job status and years of service employed in the public sector.

60
3.2.5 Measuring Instrument
3.2.5.1 Job Descriptive Index (JDI)
The JDI was used to elicit data on job satisfaction of employees.
3.2.5.1.1 Nature and Composition of the JDI
The JDI was developed by Smith, Kendall and Hulin in 1969 and is the most widely
used instrument measuring employees’ job satisfaction within organisations (Kreitner
& Kinicki, 1995). Spector (2000) adds that the JDI is directed towards specific areas
of satisfaction rather than merely global satisfaction and allows for different areas of
the job to be independently measured. It requires respondents to describe their work
as opposed to directly asking respondents how satisfied they are, thereby ensuring
that respondents have a job referent rather than a self-referent.
The JDI measures satisfaction perceptions for five (5) job facets, namely: pay,
promotions, supervision, co-workers and the work itself (Spector, 2000). The
measuring instrument consists of seventy two (72) items - nine (9) items each for the
facet of promotion and pay, and eighteen (18) items each for work, supervision, and
co-workers (Smucker & Kent, 2004).

61
To score the responses, employees are requested to indicate whether each statement
does or does not describe their jobs. Positively discriminating items are scored
(yes) = 3, (?) = 1, and (no) = 0 while negatively discriminating items are scored
(yes) = 0, (?) = 1, and (no) = 3 (Cherrington, 1994). The higher the score obtained,
the higher the level of job satisfaction (Kreitner & Kinicki, 2001).
3.2.5.1.2 Reliability of the JDI
According to Foxcroft and Roodt (2002, p. 41), “the reliability of a measure refers to
the consistency with which it measures whatever it measures.” In support, Anastasi
(1990, p. 103) states that “reliability refers to the consistency of scores obtained by
the same persons when re-examined with the same test on different occasions, or with
different sets of equivalent items, or under variable conditions.”
The Cronbach alpha coefficient indicates the consistency of responses to items in a
measure (Foxcroft & Roodt, 2002). Reliability assessments using Cronbach alpha
coefficient has exceeded .80 for the JDI (Smith et al., 1969).
According to Smucker et al. (2003), seventy eight (78) surveys conducted among
female sports journalists assessing their level of job satisfaction using the JDI yielded
the following results for the reliability Cronbach alphas: .88 for the facet of pay
satisfaction, .78 for promotion satisfaction, .90 for supervision satisfaction, .77 for

62
people satisfaction, .91 for work satisfaction, and .92 for overall satisfaction. The
results obtained reflect the consistency of responses to items in the measure.
A study conducted by Futrell (1979) targeting nine hundred and twenty (920)
salesmen employed in the United States, provided proof for the reliability of the JDI.
Results from the study yielded alpha coefficients ranging from .67 to .96,
demonstrating internal reliability for each scale. In a survey conducted amongst 207
full-time employees from a variety of organisations, additional evidence was obtained
for the reliability of the JDI. Results of the survey indicated internal consistency for
the indices for the JDI ranging from .83 to .90 (Nagy, 2002).
To measure the internal consistency of a measuring instrument, the split-half
reliability method is applied by splitting the test into two halves thereby obtaining the
correlation between the two halves (Cohen & Swerdlick, 2002). Smith et al. (1969)
calculated the split-half coefficients for the sub-sections of the JDI by applying the
Spearman-Brown formula. The results obtained ranged between 0.80 and .88 for the
different facets of the JDI.
Schneider and Dachler (1978) established the test-retest reliability of the JDI ranging
between 0.45 and 0.76. The test-retest reliability is a measure of a test’s stability
based on the correlation between scores of a group of respondents on two separate
occasions (Colman, 2003).

63
3.2.5.1.3 Validity of the JDI
According to Anastasi and Urbina (1997, p. 8), “validity refers to the degree to which
the test actually measures what it purports to measure.”
According to Nagy (2002), the JDI was administered in over 400 studies and has
documented proof of convergent and discriminant validity. Smith et al. (1969) cited
in Smucker et al. (2003) conducted a validation study on the JDI through factor and
cluster analysis. The results obtained from the study reflected that the JDI possessed
high levels of discriminant and convergent validity.
Additional support is provided by Futrell (1979) for the convergent and discriminant
validity of the JDI. Results from Futrell’s study indicated convergent correlations of
between .36 and .75. In addition, evidence of discriminant validity was provided by
the fact that predictably low correlations were found between the scales of the JDI
measuring satisfaction independently. According to Futrell (1979), “a measure is said
to have discriminant validity if it is independent rather than an accident of the
measurement procedure” (p. 595).
According to Smith (1981 cited in van Zyl & van der Walt, 1994, p. 22), “construct
validity concerns the extent to which a test/questionnaire measures a theoretical
construct or trait.”
64
Through meta-analysis, the construct validity of the JDI was investigated by
examining antecedents, correlates and consequences of job satisfaction from previous
empirical studies. The results obtained reflected seventy nine (79) unique correlates
with a combined total of one thousand eight hundred and sixty three (1863)
correlations being associated with the JDI sub-dimensions. The construct validity of
the JDI was supported by acceptable estimates of internal consistency, test-retest
reliability and results that demonstrated convergent and discriminate validity
(Kinicki, McKee-Ryan, Schriesheim & Carson, 2002) thereby confirming the validity
of the JDI.
3.2.5.1.4 Rationale for inclusion of the JDI
The rationale for the inclusion of the JDI to measure the construct job satisfaction is
founded by the following underlying factors:
Smith (1969) cited in Spector (1997) states that the JDI is a proven valid and
reliable instrument for the assessment of job satisfaction;
Vorster (1992) cited in Cockcroft (2001) concludes that the JDI has been
standardised and found to be suitable for South African conditions;
The JDI is regarded as the most carefully designed and developed instrument
for measuring job satisfaction (Vroom, 1964 cited in Schneider & Vaught,
1993). It is professed that over 50% of the articles published between 1970
and 1978 in seven leading management related journals that used non-ad hoc

65
measures of job satisfaction employed the JDI (Yeager, 1981 cited in
Schneider & Vaught, 1993); and
The JDI has been employed in previous surveys in the public sector to
measure employee job satisfaction levels (Schneider & Vaught, 1993).
The JDI is easy to administer and does not require a high level of reading
ability to complete (Heneman, Schwab, Fossum & Dyer, 1983).
3.2.6 Statistical Techniques
The research data were statistically analysed by means of the Statistical Package for
Social Sciences (SPSS). The data analyses involved both descriptive and inferential
statistics.
3.2.6.1 Descriptive Statistics
Descriptive statistics allow researchers to present the data acquired in a structured,
accurate and summarised manner (Huysamen, 1990). The descriptive statistics
utilised in the current research to analyse the demographic data included frequencies,
percentages, means and standard deviations.

66
3.2.6.2 Inferential Statistics
According to Sekaran (2000, p. 401), “inferential statistics allow researchers to infer
from the data through analysis the relationship between two variables; differences in
a variable among different subgroups; and how several independent variables might
explain the variance in a dependent variable.”
The following inferential statistical methods were used to test the research
hypotheses.
3.2.6.2.1 The Pearson Product Moment Correlation Coefficient
Cohen and Swerdlik (2002) posit that the Pearson Product Moment Correlation
Coefficient is a widely used statistic for obtaining an index of the relationships
between two variables when the relationships between the variables is linear and
when the two variables correlated are continuous. According to Anastasi and Urbina
(1997, p. 88), “the Pearson Product Moment Correlation Coefficient takes into
account not only the person’s position in the group but also the amount of her or his
deviation above or below the group mean.”
To ascertain whether a statistically significant relationship exists between work itself,
pay, supervision, promotion and co-workers with job satisfaction, the Product
Moment Correlation Coefficient was used. Sekaran (2000) states that the Pearson’s

67
Product Moment Correlation Coefficient provides an indication of the scope to which
the variables being investigated are related to each other or not. Sekaran further states
that it also indicates the directionality and strength of the relationship.
3.2.6.2.2 Multiple Regression Analysis
Multiple regression analysis takes into account the intercorrelations among all
variables involved. This method also takes into account the correlations among the
predictor scores (Cohen & Swerdlik, 2002). Sekaran (2000) adds that in multiple
regression analysis more than one predictor is jointly regressed against the criterion
variable.
This method is used to determine if the independent variables will explain the
variance in job satisfaction experienced by public sector employees.
3.2.6.2.3 Analysis of Variance (ANOVA)
Murphy and Davidshofer (2001) contend that Analysis of Variance (ANOVA)
provides statistical estimates of the variability in test scores associated with
systematic differences in the ratings assigned and differences in the ratings obtained.
They add that ANOVA scores can be more accurately generalised over time.
According to Hinkle, Wiersma and Jurs (1982, p. 253), “in ANOVA, the hypothesis

68
is that the mean performance in the population is the same for all groups (equality of
population means).”
This statistical method is used to establish whether statistically significant differences
exist in job satisfaction based on biographical variables.
3.2.6.2.4 Scheffe’s Multiple Comparison Method
ANOVA offers discernment into the differences between groups, but does not
provide a precise indication as to where the differences exactly remain. For this
reason the Scheffe’s Multiple Comparison Method was utilised to establish precisely
where such differences lie in job satisfaction based on the biographical variables.
Hinkle et al. (1982, p. 266) contend that “when a statistically significant F ratio is
obtained in ANOVA, and the null hypothesis is rejected, we conclude that at least one
population mean is different from the others.” They also mention that all the
population means could differ or any combinations could differ, and as a result, in
order to validate which pairs of means differ, it is necessary to do a subsequent
analysis such as the Scheffe’s Multiple Comparison procedure.
The Scheffe’s Multiple Comparison Method is thus used to ascertain where the
differences between the groups prevail.

69
3.3 SUMMARY OF THE CHAPTER
This chapter extensively outlined the research design, the nature of the sample, the
procedure used to collect the data, addressed issues concerning confidentiality, the
description of the measuring instruments adopted and statistical techniques employed
to test the research hypotheses.
70
CHAPTER 4
DISCUSSION OF RESULTS
4.1 INTRODUCTION
An overview of the results obtained in the study are presented and discussed in this
chapter. The chapter also outlines the demographic information depicted in graphical
format. The descriptive and inferential statistics are presented thereafter. The alpha
levels of .05 and .01 were selected a priori for test of significance for correlations,
while the multiple regression analysis was tested at the .05 significance level. For the
analysis of variance all values were tested at the .01 significance level.
4.2 DEMOGRAPHIC INFORMATION IN TERMS OF THE SAMPLE
The chapter commences with an analyses of the biographical data gathered from the
research sample (n = 203). The data analysed are presented in the form of bar charts.
This is followed by a description of the most salient sample characteristics by means
of frequencies and percentages.

71
2037
11
43
23 1826
10 11
0
20
40
60
80
100
Freq
uenc
y %
Pharmaci
st
Auxiliar
y Service
Offic
er
Directo
r
Administr
ative
Officer
Personn
el Prac
titioner
Occupational class ification
Figure 4.1: Occupational class ification
Pharmacis tPharmacis t Assis tantAuxiliary Service OfficerAdminis trative ClerkDirectorPersonnel OfficerAdminis trative OfficerState AccountantPersonnel Practitioner
Figure 4.1 illustrates the occupational classifications of the sample. The occupational
classes of the sample comprises 21.2% (n = 43) administrative clerks, 18.2% (n = 37)
pharmacist assistants, 12.8% (n = 26) administrative officers, 11.3% (n = 23)
directors, 9.9% (n = 20) pharmacists, 8.9% (n = 18) personnel officers, 5.4% (n = 11)
auxiliary service officers, 5.4% (n = 11) personnel practitioners and 4.9% (n = 10)
state accountants. A total of 2% (n = 4) did not indicate their occupational category.

72
18
123
6
54
0
20
40
60
80
100
120
140
Freq
uenc
y %
African
Coloured
Asian
White
Race
Figure 4.2: Race
AfricanColouredAsianW hite
As depicted in Figure 4.2, the racial composition of the sample comprises of 60.5%
(n = 123) Coloured respondents, 26.6% (n = 54) White respondents and 8.9%
(n = 18) African respondents. The least represented group (n = 6, 3%) is the Asian
group. Two individuals (n = 2, 1%) did not indicate their race group. The high
response rate in terms of the Coloured group is indicative of the demographics of the
Western Cape Province, where the majority of the workers employed in the public
sector are Coloured people.

73
125
77
0
20
40
60
80
100
120
140
Freq
uenc
y %
Male
Female
Gender
Figure 4.3: Gender
MaleFemale
Figure 4.3 presents the gender distribution of the sample. The sample was
representative of a larger number of male respondents to that of female respondents.
Male respondents comprised of 61.6% (n = 125) compared to 37.9% (n = 77) female
respondents. One (n = 1) employee or 0.5% omitted to indicate his/her gender. The
high response rate with regards to the male respondents is attributed to the fact that
the Cape Medical Depot (i.e. pharmaceutical distributions), which is a component
residing under the Directorate Supply Chain Management, has 55 Coloured males on
its payroll. The large number of males in this division is due to the nature of the work
where employees are expected to lift heavy boxes on a continuous basis.

74
11
32
83
52
23
0
20
40
60
80
100
Freq
uenc
y %
Up to std
. 6
Up to std
. 9Std.
10
3 year
degree/
diplom
a
Post grad
uate
Educational level
Figure 4.4: Educational level
Up to s td. 6Up to s td. 9Std. 103 year degree/diplomaPost graduate
Figure 4.4 illustrates the education level of the sample. The graph depicts that the
majority of the respondents, 40.9% (n = 83) has an educational level of Std. 10,
whilst 15.8% (n = 32) possess an educational level up to Std. 9. Fifty two respondents
(25.6%) has a 3 year degree/diploma and 11.3% (n = 23) possess a post graduate
qualification. A minimum of 5.4% (n = 11) has an educational level up to Std. 6. Two
(1%) of the respondents did not indicate their educational qualification. It can
therefore be concluded that the Directorates where the study was conducted mostly
employs individuals with an educational level of Std. 10.

75
22
41
105
30
30
20
40
60
80
100
120
140
Freq
uenc
y %
< 2 year
s
3-10 year
s
11-20 y
ears
21-30 y
ears
> 30 ye
ars
Number of years
Figure 4.5: Length of service
< 2 years3-10 years11-20 years21-30 years> 30 years
It can be viewed in figure 4.5 that the majority of the respondents (n = 105 or 51.7%)
fall in the 11-20 years service group and 41 respondents (20.2%) fall in the 3-10
years’ service group. Thirty respondents (14.8%) fall in the 21-30 years service group
while 22 respondents (10.8%) fall in the less than 2 years service group. The smallest
number of respondents (n = 3 or 1.5%) fall in the less than 30 years service group.
Two (1%) of the respondents did not indicate their years of service at the
organisation.

76
38
93
51
20
0
20
40
60
80
100
Freq
uenc
y %
22-29 y
ears
30-39 y
ears
40-49 y
ears
50 year
s and
older
Age
Figure 4.6: Age in years
22-29 years30-39 years40-49 years50 years and older
The graphic presentation of the age distribution of the sample is presented in
figure 4.6. The majority of the respondents (n = 93 or 45.8%) fall in the age category
30-39 years. This is followed by 51 (25.1%) of the respondents in the age category
40-49 years. The age category 22-29 years old, constitutes 18.7% (n = 38) of the
sample. The minority of the respondents (n = 20 or 9.9%) fall in the age category of
50 years and older. One (0.5%) respondent did not indicate his/her age. From the
ensuing results it can therefore be concluded that the majority of the workforce
participating in the study is fairly young, ranging between the ages 30-39 years old.
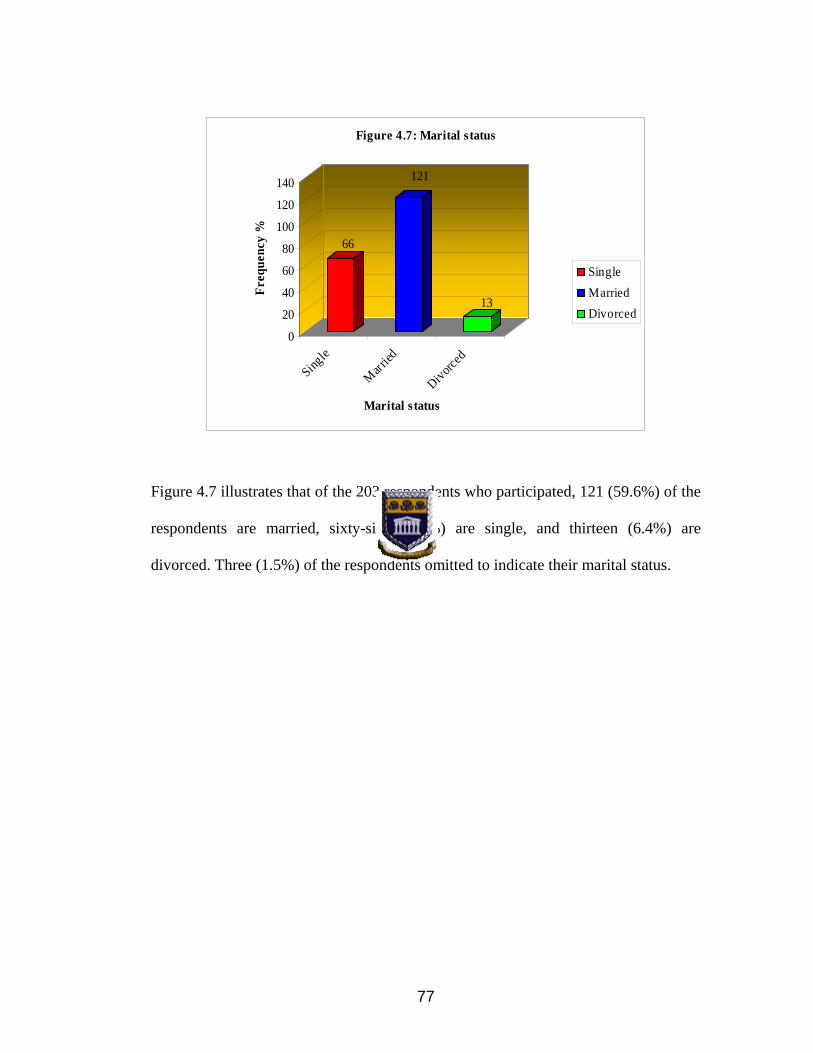
77
66
121
13
0
20
40
60
80
100
120
140
Freq
uenc
y %
Single
Married
Divorced
Marital s tatus
Figure 4.7: Marital s tatus
SingleMarriedDivorced
Figure 4.7 illustrates that of the 203 respondents who participated, 121 (59.6%) of the
respondents are married, sixty-six (32.5%) are single, and thirteen (6.4%) are
divorced. Three (1.5%) of the respondents omitted to indicate their marital status.
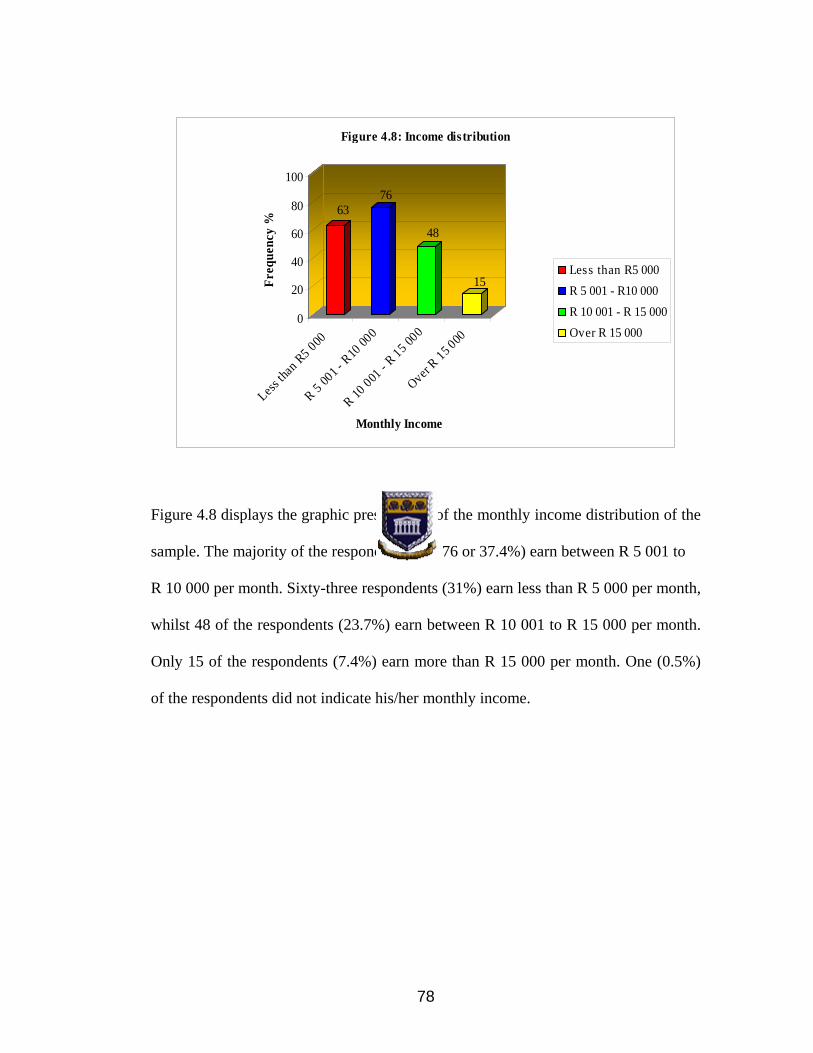
78
6376
48
15
0
20
40
60
80
100
Freq
uenc
y %
Less th
an R5 000
R 5 00
1 - R10
000
R 10 001
- R 15 0
00
Over R 15 0
00
Monthly Income
Figure 4.8: Income distribution
Less than R5 000R 5 001 - R10 000R 10 001 - R 15 000Over R 15 000
Figure 4.8 displays the graphic presentation of the monthly income distribution of the
sample. The majority of the respondents (n = 76 or 37.4%) earn between R 5 001 to
R 10 000 per month. Sixty-three respondents (31%) earn less than R 5 000 per month,
whilst 48 of the respondents (23.7%) earn between R 10 001 to R 15 000 per month.
Only 15 of the respondents (7.4%) earn more than R 15 000 per month. One (0.5%)
of the respondents did not indicate his/her monthly income.

79
177
22
020406080
100120140160180200
Freq
uenc
y %
Perman
ent
Contra
ct
Job status
Figure 4.9: Job status
PermanentContract
In figure 4.9 the job status of the sample is depicted. The graphic presentation
illustrates that the majority of the respondents (n = 177 or 87.2%) are permanently
employed. The contract employees comprise twenty two or (10.8%) respondents.
Four respondents (2%) did not indicate their job status.

80
4.3 DESCRIPTIVE STATISTICS OF THE JOB DESCRIPTIVE INDEX
QUESTIONNAIRE
Descriptive statistics in the form of arithmetic means and standard deviations for
respondents were computed for the various dimensions of job satisfaction assessed by
the JDI.
Table 4.1 Descriptive statistics for the dimensions of job satisfaction
Table 4.1 above indicates that the arithmetic means for the nature of the work,
supervision and co-worker subscales are 36.36, 30.69 and 37.73 respectively. An
approximate mean of 36 constitutes an average level of satisfaction on these
subscales. It therefore appears that the employees at the public health institution in
Variable Mean Std Dev Min Max N
Nature of the work Subscale 36.36 9.78 6 54 201
Supervision Subscale 30.69 11.98 3 51 199
Co-workers Subscale 37.73 13.42 3 54 200
Promotion Subscale 12.76 14.66 0 54 197
Pay Subscale 11.96 13.08 0 50 202
Overall Job Satisfaction 112.82 32.40 48 181 201

81
the Western Cape are relatively satisfied with the nature of the work that they
perform, as well as with their co-workers, but are less satisfied with the supervision
they receive.
Means of 12.76 and 11.96 were obtained for the promotion and pay subscales
respectively. Average levels of satisfaction on these subscales are represented by an
approximate mean score of 18. It would thus appear that the employees at the public
health institution in the Western Cape are not very satisfied with their promotion
opportunities and even less satisfied with the pay they receive.
Table 4.1 thus in summary, shows that employees at the public health institution in
the Western Cape are most satisfied with their co-workers, followed by the nature of
the work itself and the supervision they receive. They are however, less satisfied with
their opportunities for promotion and least satisfied with the compensation they
receive.

82
4.4 INFERENTIAL STATISTICS
4.4.1 Correlations for the biographical data and job satisfaction
Hypothesis 1
Alternative Hypothesis (H1)
There will be a significant relationship between biographical variables
(namely, occupational class, race, gender, educational level, tenure, age,
marital status, income and job status) and job satisfaction amongst employees
in a public health institution in the Western Cape.
Table 4.2 Correlations for the biographical data and job satisfaction
JOB SATISFACTION
Occupational class .67** Race .41** Gender .72** Educational level .38** Tenure .65** Age .26* Marital status .14 Income .53** Job status .54**
* p < 0.05 ** p < 0.01

83
Table 4.2 indicates the relationship between the respondents’ biographical
characteristics and their job satisfaction levels as measured by the Job Descriptive
Index. The correlation coefficients varied between .14 (marital status) to .72 (gender).
There was a significant relationship between respondents’ occupational class and job
satisfaction (r = 0.67, p < 0.01). The results indicate that there was a significant
relationship between race and job satisfaction (r = 0.41, p < 0.01) and between gender
and job satisfaction (r = 0.72, p < 0.01).
Furthermore, there was a significant relationship between educational level and job
satisfaction (r = 0.38, p < 0.01). There was a significant correlation between tenure
and job satisfaction (r = 0.65, p < 0.01). While there was a significant relationship
between age and job satisfaction (r = 0.26, p < 0.05), there was no significant
relationship between marital status and job satisfaction (r = 0.14, p > 0.05).
A significant relationship was found between income and job satisfaction
(r = 0.53, p < 0.01) as well as between job status and job satisfaction
(r = 0.54, p < 0.01).

84
4.4.2 Correlations for the dimensions of job satisfaction
Hypothesis 2
Alternative Hypothesis (H1)
There will be a significant relationship between nature of the job, pay,
supervision, promotion, and co-workers with job satisfaction amongst
employees in a public health institution in the Western Cape.
Table 4.3 Pearson Correlation matrix for the dimensions of job satisfaction
JOB SATISFACTION
Nature of the job 0.2141
p = 0.032 *
Pay 0.4324
p = 0.0104*
Supervision 0.4182
p = 0.012*
Promotion 0.0855
p = 0.323
Co-workers 0.0888
p = 0.302
* p < 0.05

85
Table 4.3 contains the Pearson correlations for the relationships between the various
facets of job satisfaction, as assessed by the JDI. As can be seen, the strongest
correlation was found between satisfaction with the nature of the job itself
(r = 0.2141). The correlation, nevertheless, represents a relatively weak, positive
linear relationship. This is substantiated by the coefficient of determination
(r2 = 0.0458), which indicates that only 4.58% of the variation in job satisfaction can
be explained by the variation in the nature of the work.
Although the correlation between job satisfaction with the work itself translates into a
relatively weak, positive relationship, it is nevertheless statistically significant at the
0.05 level. That is, the probability of finding that no relationship exists between these
two variables in the population from which the sample was drawn is 5% or less. It
may therefore be concluded that satisfaction depends on the nature of the work
conducted by employees.
The remaining dimensions indicate weak, positive relationships to job satisfaction.
The strongest correlation was obtained between satisfaction and pay (r = 0.4324),
while the weakest relationship was found between job satisfaction and supervision
(r = 0.4182). Nevertheless, the subscales for the relationships between job satisfaction
and pay (r = 0.4324; p = 0.0104), and job satisfaction and supervision
(r = 0.4182; p = 0.012), was found to be significant at the 0.05 confidence interval
level, while those for promotions (r = 0.0855; p = 0.323), and co-workers

86
(r = 0.0888; p = 0.302) subscales did not reach statistical significance at either the
0.01 or 0.05 levels of significance. Moreover, the aforementioned variables account
for relatively little of the variation in total job satisfaction. On the basis of the
coefficient of determination, it may be concluded that satisfaction with pay explains
approximately 19% (r2 = 0.1869) of the variation in job satisfaction, satisfaction with
opportunities for promotion and co-workers explain 0.73% (r2 = 0.0073) and 0.79%
(r2 = 0.0079), respectively, while only approximately 18% (r2 = 0.1749) of the
variation is accounted for by satisfaction with supervision. It would thus appear that
higher correlations with respect to any one of these facets is likely to translate into
higher levels of job satisfaction.
4.4.3 Multiple Regression Analysis
Multiple regression analysis was performed to determine the extent to which the
demographic variables of occupational class, race, gender, educational level, tenure,
age, marital status, income and job status will explain the variance in terms of job
satisfaction amongst employees.
Hypothesis 3
Alternative Hypothesis (H1)
The demographic variables of occupational class, race, gender, educational
level, tenure, age, marital status, income and job status will significantly

87
explain the variance in job satisfaction amongst employees in a public health
institution in the Western
The results of the multiple regression analysis regressing demographic variables
against job satisfaction, as dependent variable, are presented in Table 4.4. The
coefficient of multiple correlation between the demographic variables and job
satisfaction, as indicated by multiple R in Table 4.4, is 0.32, R square, the coefficient
of multiple determination, is 0.10005, whilst R square adjusted, is equal to 0.06858.
Therefore, 6.86% of the variance in job satisfaction can be accounted for by these
demographic variables.
Furthermore, the F statistic of 3.18 is statistically significant at the 99% level,
(p < 0.01). On the basis thereof, it may be concluded that the demographic variables
significantly explain 6.86% of the variance in job satisfaction. However, 93.14% of
the variance in job satisfaction may be explained by factors not considered in this
study. Further, the variation in job satisfaction is not affected by the job status
(p < 0.05).
Table 4.4 also indicates that when the other variables are controlled, two of the
demographic variables, tenure and age, are significant. Predictors of job satisfaction
with a Beta-value of -.305887, tenure reaches statistical significance at the 0.05 level,
and is the best predictor of job satisfaction. Similarly, age, with a Beta-value of
.217017, is also significant at the 0.05 level.

88
OVERALL JOB SATISFACTION
Variable(s) 1.. AGE 2.. EDUCATION 3.. GENDER 4.. OCCUPATIONAL CLASS 5.. TENURE 6.. RACE 7.. INCOME 8.. JOB STATUS 9.. INCOME Multiple R .31630 R Square .10005 Adjusted R Square .06858 Standard Error 34.78462 Analysis of Variance DF Sum of Squares Mean Square Regression 5 19234.87394 3846.97479 Residual 143 173025.70325 1209.96995 F = 3.17940 Signif F = .0094**
Variable B SE B Beta T Sig T
GENDER -6.962193 6.289439 -.095056 -1.107 .2702 EDUCATION -1.976216 2.138643 -.086091 -.924 .3570 TENURE -7.353274 2.298401 -.305887 -3.199 .0017* CATEGORY -10.489781 6.768922 -.145928 -1.550 .1234 AGE 10.293997 4.926160 .217017 2.090 .0384* (Constant) 150.081633 24.755461 6.063 .0000
Table 4.4 Results of Multiple Regression Analysis: Regressing demographic
variables against job satisfaction (as dependent variable)
* p < 0.05
As tenure carries a negative Beta weight, the suggestion is that an inverse relationship
exists between tenure and job satisfaction, with more tenured employees experiencing

89
lower levels of satisfaction. Age carries a positive Beta weight, suggesting that the
older the employee, the higher the level of satisfaction experienced.
Table 4.4 further shows that neither gender nor educational level was found to be
statistically significant at the 0.05 levels. Moreover, it further appears as though level
of education, with a Beta-value of –.086091 is the poorest predictor of job
satisfaction in the sample. It can thus be concluded that while tenure and age are
significant predictors of job satisfaction for employee members, gender and
educational level do not predict this variable amongst employees.
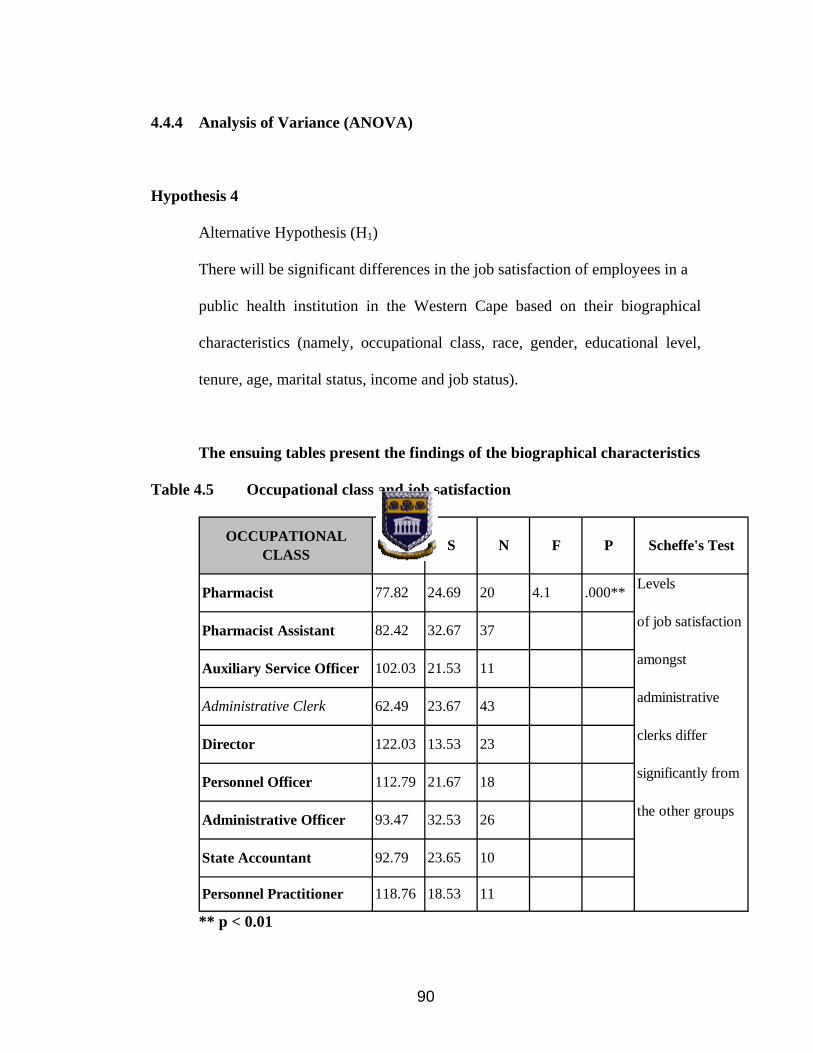
90
4.4.4 Analysis of Variance (ANOVA)
Hypothesis 4
Alternative Hypothesis (H1)
There will be significant differences in the job satisfaction of employees in a
public health institution in the Western Cape based on their biographical
characteristics (namely, occupational class, race, gender, educational level,
tenure, age, marital status, income and job status).
The ensuing tables present the findings of the biographical characteristics
Table 4.5 Occupational class and job satisfaction
Levels
of job satisfaction
amongst
administrative
clerks differ
significantly from
the other groups
F
4.1 .000**
P
Pharmacist 77.82 24.69 20
Pharmacist Assistant
Auxiliary Service Officer
Administrative Clerk
Director
Personnel Officer
Administrative Officer
State Accountant
Personnel Practitioner
82.42
102.03
62.49
122.03
112.79
93.47
92.79
118.76 18.53
23.65
32.53
21.67
13.53
23.67
21.53
32.67 37
11
43
23
18
26
10
11
Scheffe's TestOCCUPATIONAL CLASS Mean S N
** p < 0.01

91
The results from Table 4.5 indicate that there is a significant mean difference in the
job satisfaction levels of employees based on their occupational class. Administrative
clerks evidenced the lowest levels of job satisfaction with a mean score of 62.49 and
a SD of 23.67, followed by pharmacists with a mean score of 77.82 and a SD of
24.69, while directors and personnel practitioners indicated the highest levels of job
satisfaction with means of 122.03 and 118.76 and SDs of 13.53 and 18.53
respectively.
Table 4.6 Race and job satisfaction
African
respondents differed
significantly from the
other groups
Scheffe's Test RACE Mean S N
123
6
5414.45
16.31
12.43106.68
118.64
109.64
Coloured
Asian
White
African 67.98 23.27 18
F
3.92 .000**
P
** p < 0.01
Results depicted in Table 4.6 indicate that there is a significant mean difference in the
levels of job satisfaction of employees based on their race. African employees
reported the lowest levels of job satisfaction (Mean = 67.98, SD = 23.27) compared
to other groups of employees. Asian employees showed the highest level of job
satisfaction (Mean = 118.64, SD = 16.31). However, any conclusions are somewhat

92
tenuous since the number of African and Asian employees who participated in this
research was fairly small.
Table 4.7 Gender and job satisfaction
Females were
less satisfied
F
3.21 .000**
P
Male 89.82 8.62 125
Female 72.67 14.59 77
Scheffe's Test GENDER Mean S N
** p < 0.01
In terms of Table 4.7 the results indicate that there is a significant mean difference in
the levels of job satisfaction experienced by male and female employees. Females
reported lower levels of job satisfaction (Mean = 72.67, SD = 14.59) relative to male
employees (Mean = 89.82, SD = 8.62). Cognisance must however, be taken of the
fact that the number of the females who participated in the study made up only
37.93% of the sample. Thus, drawing conclusions from the results will have little
substance.

93
Table 4.8 Educational level and job satisfaction
Respondents with
educational level
up to Std.6 differ
significantly from
the other groups
F
3.95 .000**
P
Up to std. 6 68.43 32.6 11
Up to std. 9
Std. 10 / Grade 12
3 year degree / diploma
Postgraduate
82.14
93.21
112.42
102.67 14.34
16.69
12.57
23.47 32
83
52
23
Scheffe's Test EDUCATION LEVEL Mean S N
** p < 0.01
From Table 4.8 the results indicate that there is a significant mean difference in the
job satisfaction levels experienced by employees based on their education levels. In
this instance, those with education levels up to standard 6 indicated the lowest job
satisfaction relative to the other education levels. Employees at this level reflected a
mean score of 68.43 with a SD of 32.60. Respondents with a 3 years degree/diploma
reported the highest levels of job satisfaction with a mean score of 112.42 and a SD
of 16.69.

94
Table 4.9 Years of service and job satisfaction
Those employed
between 3-10 years
differ significantly
from those in the
other groups
Scheffe's Test YEARS OF SERVICE Mean S N
41
105
30
311.24
9.59
13.65
32.262.42
85.74
101.79
93.62
3-10 years
11-20 years
21-30 years
> 30 years
< 2 years 114.87 12.58 22
F
3.55 .000**
P
** p < 0.01
Table 4.9 elucidates that there is a significant mean difference in the job satisfaction
levels of employees with 3–10 years of experience compared to the other categories
of employees. Employees with 3–10 years service reflect the lowest level of job
satisfaction with a mean score of 62.42 and a SD of 32.20. Those respondents with
less than 2 years service reported the highest level of satisfaction, indicating a mean
score of 114.87 and a SD of 12.58.

95
Table 4.10 Age and job satisfaction
Respondents in the
age category 40-49
years differed
significantly from
the other groups
Scheffe's Test AGE Mean S N
38
93
51
2014.48
8.92
12.35
13.56101.71
97.64
71.94
102.63
22-29 years
30-39 years
40-49 years
50 years and older
21 years and younger 105.32 12.65
F
2.48 .000**
P
** p < 0.01
Results depicted in Table 4.10 highlight that there is a significant mean difference in
the job satisfaction levels of employees in the age group 40-49 years and employees
in the other age groups. Employees in the age group 40-49 years reported
significantly lower levels of job satisfaction compared to the other age categories
with a mean score of 71.94 and a SD of 8.92. Interestingly, employees younger than
21 years old reflect the highest level of job satisfaction having a mean of 105.32 and a
SD of 12.65.

96
Table 4.11 Marital status and job satisfaction
Married
respondents differed
significantly from
the other groups
F
2.48 .000**
P
Single 101.71 22.56 66
Married
Divorced
Widowed
71.69
103.94
102.63 12.48
14.92
17.35 121
13
Scheffe's Test MARITAL STATUS Mean S N
** p < 0.01 Table 4.11 elucidates that there is a significant mean difference in the job satisfaction
levels of employees based on their marital status. Those who are married are more
likely to report significantly lower levels of job satisfaction, compared to those who
are single, divorced or widowed. In this instance the results depict that married
employees have a Mean of 71.69 and a SD of 17.35. Single, widowed and divorced
respondents have a Mean = 101.71, SD = 22.56; Mean = 102.63, SD = 12.48 and
Mean = 103.94, SD = 14.92 respectively. Thus, it can be concluded that divorced
employees reported higher levels of job satisfaction in relation to the other
respondents.

97
Table 4.12 Income and job satisfaction
Respondents in the
lowest income group
differed significantly
from the other groups
F
2.48 .000**
P
< R5000 65.71 12.56 63
R5 001-R10 000
R10 001-R15 000
> R15 000
93.69
101.94
91.63 16.48
15.92
24.35 76
48
15
Scheffe's Test INCOME Mean S N
** p < 0.01
From Table 4.12 it can be derived that there is a significant mean difference in the job
satisfaction levels of employees based on their income group. Employees earning the
lowest income reported significantly lower levels of job satisfaction (Mean = 65.71,
SD = 12.65) relative to the other income groups. Respondents in the income bracket
R 10 001–R 15 000 reported the highest level of job satisfaction indicating a mean of
101.94 and a SD of 15.92.

98
Table 4.13 Job status and job satisfaction
Contract employees
differed significantly
from permanent employees
Scheffe's Test JOB STATUS Mean S N
2212.3181.74Contract
Permanent 101.69 15.67 177
F P
3.38 .000**
** p < 0.01
Table 4.13 illustrates that there is a significant mean difference in the job satisfaction
levels of permanent and contract employees, with permanent employees reporting
higher levels of job satisfaction having a mean of 101.69 and a SD of 15.67. Contract
employees indicated lower levels of job satisfaction with a mean of 81.74 and a SD of
12.31. However, any conclusions are somewhat tenuous since the number of
permanent employees (n = 177) far out number contract employees
(n = 22) that participated in the study.

99
4.4.5 Scheffe’s Multiple Comparison Method
The Scheffe’s test reflected the following findings in terms of levels of job
satisfaction based on the biographical variables of the sample:
Administrative clerks indicated they were the least satisfied compared to the
other occupational classes.
African respondents indicated lower levels of job satisfaction relative to the
other race groups.
Female employees experienced lower levels of job satisfaction relative to their
male counterparts.
Respondents with educational levels up to std.6 were the least satisfied group
of employees.
Those employees who had been working for the organisation between 3 and
10 years were the least satisfied.
Respondents in the age category 40-49 years evidenced the lowest levels of
job satisfaction.
Married employees reported the lowest levels of job satisfaction.
Employees on the lowest income level reported significantly lower levels of
job satisfaction relative to the other income groups.
Contract employees were less satisfied compared to permanent employees.

100
4.5 SUMMARY OF THE CHAPTER
The chapter presented the research results in tabular form. Statistically significant
mean differences between biographical data and job satisfaction were identified and
discussed in detail. The data gathered from the Job Descriptive Index (JDI) were
statistically analysed by means of the Statistical Package for the Social Sciences
(SPSS). Statistical analysis involved both descriptive and inferential statistics
(Pearson Product Moment Correlation Coefficient, Multiple Regression Analysis,
Analysis of variance, and Scheffe’s Multiple Comparison method).
Chapter five will discuss the results obtained and will also highlight other research
conducted in the field with reference to the findings that became apparent from the
research study. Finally, conclusions are drawn and recommendations are made.

101
CHAPTER 5
DISCUSSION, CONCLUSIONS AND RECOMMENDATIONS
5.1 INTRODUCTION
The chapter discusses the prominent findings of the study and makes reference to
relevant research to support the findings of the current study. The discussion include
demographic information about the sample, results obtained from the descriptive
statistics for the dimensions of job satisfaction, correlations between the dimensions
of job satisfaction, Multiple regression analysis and significant statistical differences
between biographical variables. Conclusions are drawn based on the obtained results
and recommendations for future research that may be of worth are put forth.
5.2 DISCUSSION
5.2.1 Demographic information about the sample
The sample consisted of 203 civil servants employed by the Department of Health, in
the Western Cape. Administrative clerks made up the greater number of respondents
that participated in the study (n = 43 or 21.2%). The majority of respondents were
Coloured (n = 123 or 60.5%) with the sample being more representative of males

102
than females (n = 125 or 61.6%). Most of the respondents have a std. 10 educational
level (n = 83 or 40.9%), are in the age group 30-39 years (n = 93 or 45.8%) and are
married (n = 121 or 59.6%). The majority of respondents are permanently employed
(n = 177 or 87.2%), have 11-20 years service in the public sector (n = 105 or 51.7%)
and fall in the income bracket R 5001-R 10 000 (n = 76 or 37.4%).
5.2.2 Descriptive statistics for the dimensions of job satisfaction
The results in table 4.1 indicate that employees at the public health institution in the
Western Cape, where the research was conducted, are most satisfied with their co-
workers (mean = 37.73; SD = 13.42), followed by the nature of the work itself (mean
= 36.36; SD = 9.78) and the supervision they receive (mean = 30.69; SD = 11.98).
They are however, less satisfied with promotional opportunities (mean = 12.76; SD =
14.66) and least satisfied with the pay they receive (mean = 11.96; SD = 13.08).
103
5.2.3 Inferential Results
5.2.3.1 Correlation analysis for the biographical data and job satisfaction
Significant relationships were found between the biographical data of the sample and
job satisfaction (cf. Table 4.2). The correlation coefficients ranged between .14
(marital status) to .72 (gender).
The results indicate significant relationships at the 99% confidence level between
respondents’ job satisfaction and occupational class (r = 0.67, p < 0.01), race
(r = 0.41, p < 0.01), gender (r = 0.72, p < 0.01), educational level (r = 0.38, p < 0.01),
tenure (r = 0.65, p < 0.01), income (r = 0.53, p < 0.01) as well as job status (r = 0.54,
p < 0.01).
Furthermore, there was a significant relationship between age and job satisfaction
(r = 0.26, p < 0.05) at the 95% confidence level. However, no significant relationship
between marital status and job satisfaction was found (r = 0.14, p > 0.05).
The results depicted in Table 4.2 clearly indicate that there is a significant statistical
relationship between the biographical variables with job satisfaction. Hence, the null
hypothesis is rejected.

104
5.2.3.2 Correlation analysis for the dimensions of job satisfaction
As can be derived from Table 4.3, the results indicate a strong correlation between
satisfaction with the nature of the job itself (r = 0.2141). The correlation,
nevertheless, represents a relatively weak, positive linear relationship. This is
substantiated by the coefficient of determination (r2 = 0.0458), which indicates that
only 4.58% of the variation in job satisfaction can be explained by the variation in the
nature of the work.
In addition, although the correlation between job satisfaction with the work itself
translates into a relatively weak, positive relationship, it is nevertheless statistically
significant at the 95% confidence level. The remaining dimensions indicate weak,
positive relationships to job satisfaction. The results indicate that the strongest
correlation was obtained between satisfaction and pay (r = 0.4324), while the weakest
relationship was found between job satisfaction and supervision (r = 0.4182).
Nevertheless, the subscales for the relationships between job satisfaction and pay
(r = 0.4324; p = 0.0104), and job satisfaction and supervision (r = 0.4182; p = 0.012),
was found to be significant at the 95% confidence level, while those for promotions
(r = 0.0855; p = 0.323), and co-workers (r = 0.0888; p = 0.302) did not reach
statistical significance at either the 99% or 95% confidence interval levels.
Furthermore, it can be noted that the aforementioned variables account for relatively
little of the variation in total job satisfaction. On the basis of the coefficient of

105
determination, it may be concluded that satisfaction with pay explains approximately
19% (r2 = 0.1869) of the variation in job satisfaction, satisfaction with opportunities
for promotion and co-workers explain 0.73% (r2 = 0.0073) and 0.79% (r2 = 0.0079),
respectively, while only approximately 18% (r2 = 0.1749) of the variation is
accounted for by satisfaction with supervision. It would thus appear that higher
correlations with respect to any one of these facets is likely to translate into higher
levels of job satisfaction. Hence, the null hypothesis is rejected.
5.2.3.3 Multiple Regression Analysis
The results of the multiple regression analysis regressing demographic variables
against job satisfaction, as dependent variable, indicate that demographic variables
significantly explain the variance in job satisfaction. Therefore, 6.86% of the variance
in job satisfaction can be accounted for by these demographic variables.
It can be concluded that when the other variables are controlled, tenure and age are
significant predictors of job satisfaction. In addition, findings of the study revealed
that more tenured employees experienced lower levels of satisfaction and older
employees experienced higher levels of satisfaction. Furthermore, the F statistic of
3.18 is statistically significant at the 99% level, (p < 0.01). On the basis thereof, it
may be concluded that the demographic variables significantly explain approximately
6.86% of the variance in job satisfaction. However, this finding suggests that nearly

106
93.14% of the variance in job satisfaction may be explained by factors not considered
in this study.
The null hypothesis may therefore be rejected.
5.2.3.4 Differences in job satisfaction based on biographical
characteristics - Analysis of Variance (ANOVA)
5.2.3.4.1 Race
Studies indicating the relationship between race and job satisfaction within the South
African context are limited.
Results of the current study reflect that a significant difference in job satisfaction
exists based on the respondents’ race. Asian, White and Coloured respondents
employed in the Health Department: Western Cape are significantly more satisfied
than their African colleagues. The levels of job satisfaction for African respondents
are significantly lower in comparison to the level of job satisfaction of the other racial
groups. The finding of this study is consistent with a number of studies investigating
the relationship between race and job satisfaction.
Studies have found that African employees amongst different occupational classes
experienced lower levels of job satisfaction in comparison to White employees

107
(Slocum & Strawser (1972), O’Reilly & Roberts (1973), Milutinovich (1977), Gold
et al., (1982), Davis (1985), Greenhaus et al., (1990), Tuch & Martin (1991) all cited
in Friday et al., 2004). Robbins et al. (2003) report that a study conducted in 2000
revealed that African respondents are more likely to feel less secure in their positions
than their White counterparts. Reasons cited by the authors for the feeling of a lack of
job security amongst African respondents were organisational restructuring,
affirmative action or shrinking of industry sectors.
Another study conducted by Erasmus (1998) found that White females reported
higher levels of job satisfaction in comparison to their African female colleagues.
In direct contrast to the findings of this study, an investigation conducted by Gavin
and Ewen (1974) cited in Friday et al. (2004), reflected that African employees
experienced higher levels of job satisfaction in comparison to the other racial groups.
5.2.3.4.2 Gender
There are significant differences between job satisfaction based on gender. Results of
this study indicate that female employees are less satisfied than their male
counterparts.
No evidence has been found to suggest that gender has a direct impact on job
satisfaction (Robbins et al., 2003). The authors maintain that gender differences can

108
have an effect on the relationship between job dimensions and job satisfaction, but
that it does not have a direct impact on job satisfaction.
In support of the above, and in relation to the findings of this study, Oshagbemi
(2000) states that women may experience less job satisfaction due to disparities in
factors such as pay, promotion prospects and job level. The researcher further
contends that given equal opportunity, women should however, be no less satisfied in
their jobs than their male counterparts. Hulin and Smith (1964) cited in Chui (1998)
found in a study that women experienced lower satisfaction levels as a result of
variables which covaried with gender, for example, rank and promotional
opportunities.
Contrary to the findings of this study, Clark (1997) cited in Donohue and Heywood
(2004) found women to experience greater job satisfaction. A plausible reason cited
by the researcher for the research finding is that women may experience labour
market success greater than their expectations.
Another study conducted by Tang and Talpade (1999) found significant differences
between males and females in terms of job dimensions impacting on job satisfaction.
Their study found that men tend to have higher satisfaction with remuneration in
relation to females, while females tended to have higher satisfaction with co-workers
than males.

109
Research conducted by Oshagbemi (2000) and Donohue and Heywood (2004) failed
to find support for the relationship between job satisfaction and gender.
5.2.3.4.3 Educational level
There is a significant difference in job satisfaction levels experienced by employees
based on their educational levels. Employees with the lowest qualification indicated
the lowest level of job satisfaction. Results from the study reveal that respondents
with an educational level up to standard 6 are significantly less satisfied than
respondents in possession of a higher level of education.
The finding of this study is consistent with the findings of Crossman and Abou-Zaki
(2003). Their study, which was conducted in a Lebanese banking environment, found
that employees with lower educational levels, experienced lower overall job
satisfaction in comparison to those employees who was in possession of a college
certificate.
Contrary to the findings of the current study, a number of researchers (Glenn &
Weaver (1982), Hodson (1985), Free (1990) all cited in Johnson & Johnson, 2000;
Kh Metle, 2003) found that higher educated employees experience lower levels of
organisational job satisfaction. A probable reason cited for these differences is that
highly educated employees have higher levels of expectations which companies are
often unable to fulfill.
110
The results of the current study do not support the greater number of previous
research due to the environment in which the research was conducted and also taking
into account the composition of the sample.
5.2.3.4.4 Tenure
There is a significant difference in job satisfaction based on tenure. Employees
between 3 to 10 years service differ significantly from those in the other groups.
Thus, employees with 3 to 10 years service reflect significantly lower levels of job
satisfaction in comparison to employees with less than 2 years and more than 11
years of service. The results further indicate that employees with less than 2 years
service reflect the highest level of job satisfaction and that job satisfaction increases
again from 11 years onwards.
The current situation may be attributed to the fact that employees with less than 2
years service believe that the Department will be able to meet their career
expectations. Employees with 3 to 10 years service may consider themselves as
having stagnated and no longer have faith that the Department is able to meet their
career expectations. This view is shared by Ronen (1978) cited in Oshagbemi (2003)
in that employee expectations are high at the time of appointment, but when these
expectations are not met, the resultant effect leads to a decrease in job satisfaction and
remains relatively low for the next few years. Employee satisfaction levels increase
again as the employee’s years of employment increases.
111
5.2.3.4.5 Age
There is a significant difference in job satisfaction based on respondent’s age. The
results suggest that employees in the age group 40-49 years report significantly lower
levels of job satisfaction compared to the other age categories.
The finding of the study is contrary to the view shared by Robbins et al. (2003). The
authors report that although most studies indicate a positive relationship between age
and job satisfaction, at least up to the age of 60, other studies reflect a decrease in
satisfaction as employees move towards middle age. Satisfaction increases again from
around 40 and on. Contrary to the view shared by Robbins et al. (2003), Reese,
Johnson, and Campbell (1991) found in a study conducted among 229 secondary
school physical education teachers, that educators between the age group 46-60
indicated the lowest job satisfaction levels.
Results of this study indicate that employees up to the age of 29 years old indicate
high satisfaction levels, after which there is an apparent decrease in satisfaction levels
between the age group 30-49. Furthermore, job satisfaction significantly increases
again from the age 50 years and older. This is consistent with the view shared by
international authors (Drafke & Kossen, 2002; Greenberg & Baron, 1995) that older
people are generally happier with their jobs than younger employees. As in the case
with tenure, Herzberg, Mausner, Peterson and Capwell (1957) cited in Kh Metle
(2005) found in 17 research studies that satisfaction levels is high when employees

112
start first jobs. Job satisfaction declines and remains relatively low during the next
few years and increases again as employees become older.
Mottaz (1987) in Oshagbemi (2003) cited several reasons for the variance in job
satisfaction between older and younger workers. Younger workers are generally more
dissatisfied than older employees, simply because they demand more than their jobs
can provide. The author posits that as older workers possess more seniority and work
experience it enables them to move easily into more rewarding and satisfying jobs.
As a result they place less emphasis on autonomy or promotion, therefore demanding
less from their jobs making them more satisfied than their younger counterparts.
Lastly, employees tend to adjust to work values and the work environment the longer
they are employed, adding to greater job satisfaction.
5.2.3.4.6 Marital status
There is a significant difference in job satisfaction based on marital status. Married
employees differ significantly from those in the other groups. They reported lower
levels of job satisfaction in comparison to those who are single, divorced or widowed.
International research findings with regard to the relationship between job satisfaction
and marital status appear to be equivocal. Results from the study are supported by
research conducted by Cimete, Gencalp and Keskin (2003) using a sample of 501
nurses employed at two university hospitals in Istanbul. Their study established a

113
significant difference in the job satisfaction mean scores of the participants, reporting
that the job satisfaction mean score of divorcees and widows was higher than that of
single and married groups.
Contrary to the findings of the current study, research conducted by Kuo and Chen
(2004) found that married employees experienced higher levels of job satisfaction in
comparison to that of single employees. The reason cited by the researchers for
married employees experiencing higher levels of satisfaction, is that they are often
more contented with the nature of their work.
5.2.3.4.7 Income
There is a significant difference in the job satisfaction levels of employees based on
their income. Employees earning the lowest income report significantly lower levels
of job satisfaction relative to the other income groups.
In the current context, the majority of the employees on the lowest income bracket
work within a warehouse environment where physical work is expected often under
trying conditions. It is possible that these employees might feel that equilibrium does
not exist between their production inputs in comparison to the income they receive.
Another possibility exists that employees on the lowest income level experience
lower levels of satisfaction as they have less disposable income in comparison to
employees on the other income levels.

114
Research appears to be equivocal regarding the influence of pay on job satisfaction.
According to Bassett (1994), a lack of empirical evidence exists to indicate that pay
alone improves worker satisfaction or reduces dissatisfaction. The author concludes
that highly paid employees may still be dissatisfied if they do not like the nature of
their job and feel they cannot enter a more satisfying job.
A study conducted by Oshagbemi (2000) amongst United Kingdom academics, found
a statistically significant relationship between pay and rank of employees and their
level of job satisfaction. However, Young et al. (1998) conducted a study in a public
sector environment and failed to find any significant relationship between pay and
satisfaction.
5.2.3.4.8 Job status
There is a significant difference in the job satisfaction levels of employees based on
their job status. Contract employees report significantly lower levels of job
satisfaction in comparison to permanent employees.
To date, a limited amount of research has been conducted on the relationship between
job status and job satisfaction. Research conducted by Feather and Rauter (2004) with
regards to the levels of job satisfaction that exists between contract and permanent
employees in the teaching environment in Australia, failed to establish a relationship
between job status and job satisfaction.

115
The results of the current study should be interpreted with caution in terms of job
status as the majority of the respondents are permanently employed (n = 177), in
comparison to the number of contract employees (n = 22) that participated in the
study. It is, however, suggested that the Department offer individuals permanent
contracts to enhance the contract employees’ level of job satisfaction.
5.2.3.4.9 Scheffe’s Multiple Comparison
The Scheffe’s test (ranging from Table 4.5 to Table 4.13) reflects the following
findings in terms of levels of job satisfaction based on the biographical variables of
the respondents:
Administrative clerks indicated they were the least satisfied compared to the other
occupational classes. African respondents evidenced lower levels of job satisfaction
relative to the other race groups.
Female employees indicated lower levels of job satisfaction relative to their male
counterparts. Respondents with educational levels up to std.6 were the least satisfied
group of employees.
Contract employees being less satisfied compared to permanent employees.
Furthermore employees who had been working for the organisation between 3 and 10
years were reported to be the least satisfied.

116
Employees on the lowest income level reported significantly lower levels of job
satisfaction relative to the other income groups. Married employees reported the
lowest levels of job satisfaction. Respondents in the age category 40-49 years
evidenced the lowest levels of job satisfaction.
Hence, the null hypothesis that there are no statistically significant differences in
job satisfaction of employees based on their biographical variables, is rejected.
5.3 CONCLUSIONS
The central objective of this study was to establish the impact of variables, such as
the work itself, pay, supervision, promotion and relationships with co-workers on
employees in terms of job satisfaction at a public sector institution in the Western
Cape. A literature survey was conducted to form the theoretical premise for the study.
Factors such as pay, the work itself, supervision, relationships with co-workers and
opportunities for promotions have been found to contribute to job satisfaction
(Grobler et al., 2002; Johns, 1996; Nel et al., 2004; Robbins et al., 2003).
The empirical findings from the study indicate that employees at the public health
institution in the Western Cape, where the research was conducted, are most satisfied
with their co-workers, followed by the nature of the work itself and the supervision

117
they receive. They however, indicated that they are less satisfied with promotional
opportunities and least satisfied with the pay they receive.
In terms of the stated research hypotheses the following specific empirical findings
emerged from the investigation:
There is a significant relationship between biographical variables and job
satisfaction amongst employees in a public health institution in the Western
Cape.
A significant relationship exists between work, remuneration, supervision,
promotion, and co-workers with job satisfaction amongst employees in a
public health institution in the Western Cape.
The demographic variables of occupational class, race, gender, educational
level, tenure, age, marital status, income and job status significantly explain
the variance in job satisfaction amongst employees.
There are significant differences in the job satisfaction of employees in a
public health institution in the Western Cape based on their biographical
characteristics.
The results of the study should be interpreted with caution due to the limitations of
the study. Cognisance must also be taken of the fact that the results obtained from the
research may be specific to the directorates where the investigation was conducted.
This can be attributed to the fact that a non-probability sample in the form of
convenience sampling was utilised in the study. Hence, the results acquired cannot be
118
generalised with confidence to other public institutions residing under the Department
of Health in the Western Cape.
Another contributing factor impacting on generalisability is the fact that only the
occupational categories pharmacist, pharmacist assistant, auxiliary service officer,
administration clerk, director, personnel officer, administrative officer, state
accountant and personnel practitioner are targeted in the study. Therefore, the results
of the study cannot be inferred to other occupational classes of a similar category
resulting in the external validity of the study being compromised.
In addition, although the response rate for the current study is adequate, the
composition of the sample could have introduced elements of bias in the research
findings. Most notably, it is possible that disparities in terms of biographical data of
respondents could have distorted the results obtained from the investigation.
5.4 RECOMMENDATIONS
As a caution is warranted with regard to the generalisibility of the present findings to
other public institutions and occupations, it is suggested that for future research a
proportionate stratified random sample be used to compare several public sector
institutions using a bigger sample. Various authors maintain that stratified random
sampling is the most suitable technique in that it presents greater reliability and

119
validity (Anastasi, 1990; Huysamen, 1983; Murphy & Davidshofer, 1988; Welman &
Kruger, 2001).
Empirical findings of this study suggest that the occupational classes of
administrative clerks and pharmacists were the least satisfied. From the literature
surveyed it is evident that the public sector is experiencing an exodus of professional
skilled employees to other sectors and countries. It is recommended that executive
management accord significant attention to future studies of this nature as to identify
those variables having a major impact on job satisfaction in an attempt to retain high-
quality skills, in particular scarce skills, that is in line with the human resource
development strategy of the Department of Labour. According to Marx (1995),
offering competitive salaries and opportunity for upward mobility enhances the
chances of employee retention. Meyer, Mabaso and Lancaster (2002) maintain that it
is imperative to secure the supply of scarce skills in order to meet with societal needs.
The research findings reported in this study make a valuable contribution to the
awareness of understanding the concept of job satisfaction and the effect the
underlying variables work, supervision, co-workers, promotion and pay have on job
satisfaction. However, additional research is needed to further investigate the
potential relationship and effect these variables and other extraneous variables, such
as role ambiguity, job level, contingent rewards and working conditions have on job
satisfaction.

120
Finally, future research of this nature may assist personnel managers and operational
managers on all levels to be aware of the status of job satisfaction and allow them to
pro-actively put mechanisms in place to enhance job satisfaction of employees and
ultimately, improve service delivery. Schneider and Vaught (1993) contend that being
aware of the job satisfaction of employees afford personnel managers the opportunity
to be proactive and decide on interventions that will ensure commitment and
involvement from employees.

121
REFERENCE LIST
Abdullah, W. (2002). Human resources management: A comprehensive guide.
Cape Town: Heinemann Publishers, (Pty) Limited.
Allen, C. (2003). Psychology today: Rank determines job satisfaction.
Retrieved November 11, 2004, from: http://show letter?idx
Anastasi, A. (1990). Psychological testing (6th ed.). New York: Macmillan
Publishing Company.
Anastasi, A., & Urbina, S. (1997). Psychological testing (7th ed.). New Jersey:
Prentice-Hall, Inc.
Arnolds, C.A., & Boshoff, C. (2001). The challenge of motivating top management:
A need satisfaction perspective [Electronic version]. Journal of Industrial
Psychology, 27(1), 39-42.
Arnolds, C.A., & Boshoff, C. (2004). The management of the early stages of
restructuring in a tertiary education institution: An organisational commitment
perspective. South African Journal of Business Management, 35(2), 1-13.

122
Barrows, D., & Watson, T. (n.d.). A comparative analysis of job satisfaction
among public and private sector professionals. Retrieved October 29, 2004,
from: http://job-satisfaction 2.htm
Bassett, G. (1994). The case against job satisfaction [Electronic version]. Business
Source Premier, 37(3), 61-68.
Berta, D. (2005). Put on a happy face: High morale can lift productivity [Electronic
version]. Nation’s Restaurant News, 39(20), 8.
Bless, C., & Higson-Smith, C. (1995). Fundamentals of social research methods:
An African perspective (2nd ed.). Cape Town: Juta and Co, Ltd.
Boggie, T. (2005). Unhappy employees [Electronic version]. Credit Union
Management, 28(4), 34-37.
Boshoff, A.B., Cilliers, F.V.N., & Van Wyk, R. (2003). The prediction of job
involvement for pharmacists and accountants. South African Journal of
Industrial Psychology, 29(3), 61-67.
Bottomley, M.H. (1987). Personnel management. London: Pitman Publishing.
123
Brainard, J. (2005). Postdoctoral researchers value structured training over pay,
survey says [Electronic version]. The Chronicle of Higher Education, 51(32),
21.
Brewer, A.M., & Hensher, D.A. (1998). The importance of organisational
commitment in managing change: Experience of the NSW private bus industry.
Journal of Managerial Psychology, 38, 117-130.
Buitendach, J.H., & De Witte, H. (2005). Job insecurity, extrinsic and intrinsic
job satisfaction and affective organisational commitment of maintenance workers
in a parastatal. South African Journal of Business Management, 36(2), 27-37.
Calder, G. (2000). Motivating pharmacist [Electronic version]. The Pharmaceutical
Journal, 7096(264), 729-731.
Chambers Compact Dictionary. (2005). Edinburgh: Chambers Harrap Publishers,
Ltd.
Cherrington, D.J. (1994). Organizational behavior (2nd ed.). Boston: Allyn
and Bacon, Inc.
124
Chiu, C. (1998). Do professional women have lower job satisfaction than
professional men? Lawyers as a case study [Electronic version]. Sex roles, 38,
(7/8), 521-537.
Cimete, G., Gencalp, N.S., & Keskin, G. (2003). Quality of life and job satisfaction
of nurses [Electronic version]. Journal of Nursing Care Quality, 18(2), 151-158.
Clark, A., Oswald, A., & Warr, P. (1996). Is job satisfaction U-shaped in age?
Journal of Occupational and Organizational Psychology, 69, 57-81.
Cockcroft, J. (2001). Job satisfaction and organisational commitment: An empirical
investigation in the Free State branches of a service organisation. Unpublished
honours thesis, University of the Free State, Free State.
Cohen, R.J., & Swerdlick, M.E. (2002). Psychological testing and assessment: An
introduction to test and measurement (5th ed.). New York: Mc Graw Hill
Companies, Inc.
Collins South African Thesaurus. (2004). Cape Town: HarperCollins Publishers.
Colman, A.M. (2003). Oxford Dictionary of Psychology. New York: Oxford
University Press.

125
Cronje, G.J., Du Toit, G.S., Marais, A.K., & Motlatta, M.D.C. (2003). Introduction
to business management (6th ed.). Cape Town: Oxford University Press, Inc.
Crossman, A., & Abou-Zaki, B. (2003). Job satisfaction and employee performance
of Lebanese banking employees. Journal of Managerial Psychology, 18(4),
368-376.
Cullinan, K. (2005, August 8). Framework no cure for health employeesing ills, but
a tonic for talks. Cape Times, p. 11.
Damane, T.V.P. (1992). Factors influencing job satisfaction or dissatisfaction
among female registered nurses employed by the department of Health, Transkei.
Unpublished master’s thesis, University of Natal, Durban.
Department of Health Provincial Government: Western Cape’s annual report
(2003/2004).
Derlin, R., & Schneider, G.T. (1994). Understanding job satisfaction: Principals and
teachers, urban and suburban. Urban Education, 29(1), 26.
Dessler, G. (1988). Personnel management (4th ed.). New York: Prentice-Hall, Inc.

126
Dessler, G. (2000). Human resource management (5th ed.). New York: Prentice-
Hall, Inc.
Di Rodio, W. (2002). An exploration of the concept motivation as a tool for
Psychotherapeutic assessment. Retrieved June 10, 2005, from: http://www.
practical-philosophy.org.uk/Volume5Articles/Motivation.htm
Dolliver, M. (2003). Job satisfaction. Adweek, 44(38), 38.
Donohue, S.M., & Heywood, J.S. (2004). Job satisfaction and gender: An expanded
specification from the NLSY [Electronic version]. International Journal of
Manpower, 25(2), 211-234.
Drafke, M.W., & Kossen, S. (2002). The human side of organizations (8th ed.). New
Jersey: Prentice-Hall, Inc.
Ellickson. M.C., & Logsdon, K. (2002). Determinants of job satisfaction of
municipal government employees [Electronic version]. Public Personnel
Management, 31(3), 343-358.
Erasmus, B. (1998). Workplace issues affecting women in HR. Management
Today, 14(7), 26-34.

127
Erasmus, B., Van Wyk, M., & Schenk, H. (2001). South African Human Resource
Management (2nd ed.). Cape Town: Juta & Company Ltd.
Evans, D. (1993). Supervisory management (3th ed.). London: Cassell Educational
Ltd.
Feather, N.T., & Rauter, K.A. (2004). Organizational citizenship behaviours in
relation to job status, job insecurity, organizational commitment and
identification, job satisfaction and work values. Journal of Occupational and
Organizational Psychology, 77(1), 81-94.
Foxcroft, C., & Roodt, G. (2002). An introduction to psychological assessment in
the South African context. Cape Town: Oxford University Press, Inc.
French, W.L. (2003). Human resources management (5th ed.). New York: Houghton
Mifflin Publishers.
Friday, S.S., Moss, S.E., & Friday, E. (2004). Socioethnic explanations for
racioethnic differences in job satisfaction [Electronic version]. The Journal of
Management, 23(2), 152-168.

128
Futrell, C.M. (1979). Measurement of salespeople’s job satisfaction: Convergent
and discriminant validity [Electronic version]. Journal of Marketing Research,
16(4), 594-598.
Graham, H.T. (1986). Human resources management (5th ed.). London: Pitman
Publishing.
Graham, M.W., & Messner, P.E. (1998). Principals and job satisfaction. The
International Journal of Educational Management, 12(5), 196-202.
Greenberg, J. (1999). Managing behavior in organizations (2nd ed.). Trenton:
Prentice-Hall International, Inc.
Greenberg, J., & Baron, R.A. (1995). Behavior in organizations: Understanding and
managing the human side of work (5th ed.). Trenton: Prentice-Hall
International, Inc.
Grobler, P.A., Warnich, S., Carrell, M.R., Elbert, N.F., & Hatfield, R.D. (2002).
Human resource management in South Africa (2nd ed.). London: Thomson
Learning.
Heery, E., & Noon, M. (2001). A dictionary of human resource management.
New York: Oxford University Press.

129
Heller, R., & Hindle, T. (1998). Essential manager’s manual. London: Dorling
Kindersley Ltd.
Hellriegel, D., Slocum, J.W., & Woodman, R.W. (1989). Organizational behavior
(5th ed.). New York: West Publishing Company.
Henault, R. (2004). Race matters [Electronic version]. Modern Healthcare, 34(9),
34.
Heneman, G.H., Schwab, D.P., Fossum, J.A., & Dyer, L.D. (1983). Personnel
human resource management (2nd ed.). Illinois: Irwin, Inc.
Herman, D. (2005, August 8). Children wait for ops as Red Cross short of ICU
nurses. Cape Times, p. 5.
Hinkle, D.E., Wiersma, W., & Jurs, S.G. (1982). Basic behavioral statistics. Boston
Mass: Houghton Mifflin Company.
Hoole, C., & Vermeulen, L.P. (2003). Job satisfaction among South African aircraft
pilots [Electronic version]. SA Journal of Industrial Psychology, 29(1), 52-57.
Huysamen, G.K. (1983). Psychological measurement: An introduction with South
African examples. Pretoria: Academia.

130
Huysamen, G.K. (1990). Introductory statistics and research design for the
behavioural sciences. Bloemfontein: van Schaik.
Jamal, M., & Baba, V.V. (1992). Shiftwork and department-type related to job
stress, work attitudes and behavioral intentions: A study of nurses [Electronic
version]. Journal of Organizational Behavior, 13(5), 449-465.
Jayiya, E. (2001, February 24). Plan to stem exodus from public service. Star, p. 5.
Johns, G. (1988). Organizational behavior. Boston: Scott, Foresman and Company.
Johns, G. (1996). Organizational behavior: Understanding and managing life at
work (4th ed.). Kansas City: Harper Collins College Publishers.
Johnson, G.J., & Johnson, W.R. (2000). Perceived over qualification and
dimensions of job satisfaction: A longitudinal analysis. Journal of Psychology,
134(5), 537-555.
Jones, J.R., & Schaubroeck, J. (2004). Mediators of the relationship between race
and organizational citizenship behavior [Electronic version]. Journal of
Managerial Issues, 16(4), 505-527.

131
Joubert, L. (2000). Work motivation and job satisfaction.
Retrieved April 29, 2005, from:
http://www.iol.co.za/index.php?set_id=3&click_id=428&art_id=io
1962377903498M214
Kh Metle, M. (2003). The impact of education on attitudes of female government
employees [Electronic version]. The Journal of Management Development, 22
(7/8), 603-626.
Kh Metle, M. (2005). Age-related differences in work attitudes and behavior among
Kuwaiti women employees in the public sector [Electronic version].
International Journal of Commerce and Management, 15(1), 47-67.
Kinicki, A.J., McKee-Ryan, F.M., Schriesheim, C.A., & Carson, K.P. (2002).
Assessing the construct validity of the Job Descriptive Index: A review and
meta-analysis. Journal of Applied Psychology, 87(1), 14-32.
Kinnear, L. (1999). Determinants of organisational commitment amongst
knowledge workers. Unpublished master’s thesis, University of the
Witwatersrand, Johannesburg.

132
Kinnear, L., & Sutherland, M. (2000). Determinants of organisational commitment
amongst knowledge workers. South African Journal of Business Management,
31(3), 106-112.
Koustelios, A.D. (2001). Personal characteristics and job satisfaction of Greek
teachers. The International Journal of Educational Management, 15(7), 354-358.
Kreitner, R., & Kinicki, A. (1995). Organizational behavior (3rd ed.). New York:
Irwin, Inc.
Kreitner, R., & Kinicki, A. (2001). Organizational behavior (5th ed.). New York:
Mc Graw-Hill Inc.
Kuo, Y.F., & Chen, L.S. (2004). Individual demographic differences and job
satisfaction among Information Technology personnel: An empirical study
in Taiwan. International Journal of Management, 21(2), 221-231.
Lacey, M.Y. (1994). Rewards can cost nothing? Yes they can…really [Electronic
version]. The Journal for Quality and Participation, 17(3), 6-9.
Leedy, P.D. (1993). Practical research: Planning and design (5th ed.). New York:
Macmillan Publishing Company.

133
Levine, H.Z. (1994). Why incentive plans cannot work [Electronic version]?
Compensation and benefits review, 26,(1), 77-78.
Locke, E.A. (1995). Commentary: The micro-analysis of job satisfaction:
Comments on Taber and Alliger [Electronic version]. Journal of Organizational
Behavior, 16(2), 123-126.
Luthans, F. (1989). Organizational behavior (5th ed.). New York: McGraw-Hill.
Luthans, F. (2002). Organizational behavior (9th ed.). New York: McGraw-Hill.
Madison, D. (2000). Can your job make you sick? Retrieved November 3, 2004,
from: http://www.keepmedia%20%20Psychology20Today
Malherbe, M.D., & Pearse, N.J. (2003). The relationships between job enrichment,
job satisfaction and service quality: An exploratory study in the retail industry in
South Africa. Management Dynamics, 12(2), 2-12.
Mariani, D., Gcaba, R., & Dalton, J. (2003). Survey on knowledge, attitude and
practice (KAP) on professional nurses working at primary health care level.
Retrieved February 20, 2005, from:
http://www.kznhealth.gov.za/italian/kapsyrvey.pdf

134
Marx, M.A. (1995). Keeping your best employees. Journal of Property
Management, 60(6), 26-29.
Mavanyisi, R.D. (2005). The perceptions of nurses in a district health system in
Limpopo province on job satisfaction. Unpublished master’s thesis, UNISA,
South Africa.
Mc Namara C. (n.d.). Retrieved October 24, 2004, from:
http://www.mapnp.org/library/prsn_wll/job_stfy.htm
McShane, S.L., & Von Glinow, M.A. (n.d.). Foundations of employee motivation.
Retrieved June 10, 2005, from:
http://highered.mcgraw-hill.com/sites/0072470089/student_view0/chapter5/
chapter_o
Meyer, M. (1999). Managing human resources development – An outcomes-based
approach. Durban: Butterworth Publishers (Pty) Ltd.
Meyer, M., Mabaso, J., & Lancaster, K. (2002). ETD practices in South Africa.
Durban: Butterworths.
Mottaz, C.J. (1988). Work satisfaction among hospital nurses [Electronic version].
Hospital and Health Services Administration, 33(1), 57-74.

135
Mullins, L.J. (1996). Management and organizational behavior (4th ed.). Great
Britain: Pitman Publishing.
Murphy, K.R., & Davidshofer, C.O. (1988). Psychological testing: Principles and
applications. Englewood Cliffs: Prentice-Hall, Inc.
Murphy, K.R., & Davidshofer, C.O. (2001). Psychological testing: Principles and
applications (5th ed.). New Jersey: Prentice-Hall, Inc.
Murray, M.A., & Atkinson, T. (1981). Gender differences in correlates of job
satisfaction [Electronic version]. Canadian Journal of Behavioral Sciences, 13,
44-52.
Nagy, M.S. (2002). Using a single-item approach to measure facet job satisfaction.
Journal of Occupational and Organizational Psychology, 75(1), 77-86.
Nagy, M.S. (n.d.). What to do when you are dissatisfied with job satisfaction scales:
A better way to measure job satisfaction.
Retrieved May 2, 2005, from: http://www.ipmaac.org/can/apr96/techaff.html
Nel, P.S., Van Dyk, P.S., Haasbroek, H.D., Schultz, H.B., Sono, T., & Werner, A.
(2004). Human resources management (6th ed.). Cape Town: Oxford University
Press.

136
Okpara, J.O. (2004). Personal characteristics as predictors of job satisfaction: An
exploratory study of IT managers in a developing economy [Electronic version].
Information Technology & People, 17(3), 327-338.
Oshagbemi, T. (1997). Job satisfaction and dissatisfaction in higher education
[Electronic version]. Education and Training, 39(8/9), 354-359.
Oshagbemi, T. (2000). Correlates of pay satisfaction in higher education [Electronic
version]. The International Journal of Educational Management, 14(1), 31-39.
Oshagbemi, T. (2000). Gender differences in the job satisfaction of university
students [Electronic version]. Women in Management Review, 15(7), 331-343.
Oshagbemi, T. (2003). Is length of service related to the level of job satisfaction?
International Journal of Social Economics, 27(3), 213-226.
Oshagbemi, T. (2003). Personal correlates of job satisfaction: Empirical evidence
from UK universities [Electronic version]. International Journal of Social
Economics, 30, (11/12), 1210-1232.
Packard, S.H., & Kauppi, D.R. (1999). Rehabilitation agency leadership style
[Electronic version]. Rehabilitation Counselling Bulletin, 43(1), 5-7.

137
Pergamit, M.R., & Veum, J.R. (1999). What is a promotion [Electronic version]?
Industrial & Labour Relations Review, 52(4), 21.
Peterson, D.K., Puia, G.M., & Suess, F.R. (2003). “Yo Tengo La Camiseta (I have
the shirt on)”: An exploration of job satisfaction and commitment among workers
in Mexico [Electronic version]. Journal of Leadership and Organizational
Studies, 10(2), 73-88.
Phillips, J.J., Stone, R.D., & Phillips, P.P. (2001). The Human Resources Scorecard:
Measuring the return on investment. Boston: Butterworth-Heinemann.
Pillay, R. (2003). The effect of organisational structure and managerial practices on
the clinical behaviour and job satisfaction of primary health care doctors, as
knowledge workers in the managed health care industry in South Africa.
Unpublished doctoral thesis, University of Cape Town, Cape Town.
Pohlmann, C. (1999). Study on workplace satisfaction in private, public sectors.
Retrieved April 15, 2005, from: http://www.cfib.ca/research/reports/aspects_
e.asp
Ramsey, R.D. (1997). Employee morale: Does it matter anymore? [Electronic
version]. Supervision, 58(9), 6-8.

138
Reese, S.H., Johnson, D., & Campbell, W. (1991). Teacher job satisfaction and
teacher job stress: School size, age, and teaching experience. Education, 112,
246-252.
Robbins, S.P. (1993). Organizational behavior (6th ed.). New Jersey: Prentice-Hall
International.
Robbins, S.P. (1998). Organizational behavior (8th ed.). New Jersey: Prentice-Hall
International.
Robbins, S.P., Odendaal, A., & Roodt, G. (2003). Organisational behaviour
(9th ed.). Cape Town: Prentice-Hall International.
Robie, C., Ryan, A.M., Schmieder, R.A., Parra, L.F., & Smith, P.C. (1998). The
relation between job level and job satisfaction [Electronic version]. Group and
Organization Management Thousand Oaks, 23(4), 470-495.
Rue, L.W., & Byars, L.L. (1992). Management skills and application (6th ed.). New
Jersey: Prentice-Hall International.
Ruthankoon, R., & Ogunlana, S.O. (2003). Testing Herzberg’s two-factor theory in
the Thai construction industry [Electronic version]. Engineering, Construction
and Architectural, 10(5), 333-341.

139
Sarker, S.J., Crossman, A., & Chinmeteepituck, P. (2003). The relationship of age
and length of service with job satisfaction: An examination of hotel employees
in Thailand. Journal of Managerial Psychology, 18(7/8), 745-758.
Schermerhorn, J.R. (1993). Management for productivity (4th ed.). Canada: John
Wiley & Sons, Inc.
Schleger, P.R. (1985). Approaches to training and development (2nd ed.). Canada:
Addison-Wesley Publishing Company, Inc.
Schneider, B., & Dachler, P.H. (1978). A note on the stability of the Job Descriptive
Index. Journal of Applied Psychology, 63, 650-653.
Schneider, D.S., & Vaught, B.C. (1993). A comparison of job satisfaction between
public and private [Electronic version]. Public Administration Quarterly, 17(1),
68-84.
Sclafane, S. (1999). MGA managers in sync with employees on job satisfaction
issues, survey finds. National Underwriter, 103(22), 4-24.
Sekaran, U. (2000). Research methods for business: A skill building-approach
(3rd ed.). New York: John Wiley & Sons, Inc.

140
Sempane , M.E., Rieger, H.S., & Roodt, G. (2002). Job satisfaction in relation to
Organisational Culture [Electronic version]. SA Journal of Industrial
Psychology, 28(2), 23-30.
Sherman, A.W., & Bohlander, G.W. (1992). Managing human resources (9th ed.).
Ohio: South Western Publishing Co.
Smith, P.C., Kendall, L.M., & Hulin, C.L. (1969). The measurement of satisfaction
in work and retirement. Chicago: Rand Mc Nally.
Smucker, M.K., & Kent, A. (2004). The influence of referent selection on pay,
promotion, supervision, work, and co-worker satisfaction across three distinct
sport industry segments [Electronic version]. International Sports Journal, 8(1),
27.
Smucker, M.K., Whisenant, W.A., & Pedersen, P.M. (2003). An investigation of
job satisfaction and female sports journalists [Electronic version]. International
Sports Journal, 49(7/8), 401-407.
South African Oxford School Dictionary. (2004). Cape Town: Oxford University
Press, Inc.

141
Spector, P.E. (1997). Job Satisfaction: Application, Assessment, causes and
consequences. New York: Harper & Row.
Spector, P.E. (2000). Industrial & Organizational Psychology: Research and
practice. New York: John Wiley & Sons, Inc.
Steel, R.P., & Ovalle, N.K. (1984). A review and meta-analysis of research on the
relationship between behavioral intentions and employee turnover. Journal of
Applied Psychology, 69, 673-686.
Steers, R.M., & Porter, L.W. (1991). Motivation and work behavior (5th ed.).
New York: Mc Graw Hill Inc.
Stuart-Kotze, R. (n.d.). Motivation theory. Retrieved June 10, 2005, from:
http://www.goal-setting-guide.com/motivation-theory.html
Sweeney, P.D., & McFarlin, D.B. (2005). Wage comparisons with similar and
dissimilar others [Electronic version]. Journal of Occupational and
Organizational Psychology, 78(1), 113-131.
Tang, T.L., & Talpade, M. (1999). Sex differences in satisfaction with pay and
co-workers [Electronic version]. Personnel Journal, 27(3), 5.

142
The Concise Oxford Dictionary of Current English. (1992). New York: Oxford
University Press.
Ting, Y. (1997). Determinants of job satisfaction of federal government employees.
Public Personnel Management, 26(3), 313-334.
Traut, C.A., Larsen, R., & Feimer, S.H. (2000). Hanging on or fading out?
Job satisfaction and the long-term worker [Electronic version]. Public Personnel
Management, 29(3), 343-351.
Van Zyl, E.S., & Van Der Walt, H.S. (1994). Manual for the Experience of Work
and Life Circumstances Questionnaire (WLQ). Bloemfontein: Bensu Printers.
Viswesvaran, C., Deshpande, S.P., & Joseph, J. (1998). Job satisfaction as a
function of top management support for ethical behavior. Journal of Business
Ethics, 17(4), 365-371.
Vitell, S.J., & Davis, D.L. (1990). The relationship between ethics and job
satisfaction. Journal of Business Ethics, 9(6), 489-495.
Wech, B.A. (2002). Trust context: Effect on organizational citizenship behavior,
supervisory fairness, and job satisfaction beyond the influence of leader-member
exchange [Electronic version]. Business and Society, 41(3), 353-360.

143
Welman, J.C., & Kruger, S.J. (2001). Research Methodology (2nd ed.). Cape Town:
Oxford University Press.
Young, B.S., Worchel, S., & Woehr, W.D.J. (1998). Organizational commitment
among public service employees [Electronic version]. Personnel Journal, 27(3),
339-348.

APPENDIX A
LETTER OF REQUEST TO COMPLETE
QUESTIONNAIRES

“SEEKING KNOWLEDGE FROM THE CRADLE TO THE GRAVE”
Dear Colleague
REQUEST TO COMPLETE A BIOGRAPHICAL QUESTIONNAIRE AND
RESEARCH QUESTIONNAIRE
I am a Masters student at the University of the Western Cape (Industrial Psychology
Department) conducting research for my thesis on Job Satisfaction. On 21 April 2005
I obtained permission from Professor KC Househam (Head of Department: Health) to
proceed with my research at your institution.
The attached biographical questionnaire contains questions about yourself while the
job satisfaction questionnaire (JDI) taps into feelings you may have about your
present job; pay; supervision; promotion opportunities and people you are working
with. There are no right and wrong answers. Please ensure that you circle all your
responses listed under the different facets.
Your responses will be treated with the utmost of confidentiality; therefore no
provision is made on the questionnaires for you to write down your name. It would be
appreciated if you could place the questionnaires in the envelope provided and ensure
that it is sealed on return. All questionnaires are to be returned within one (1) week of
the date of receipt thereof.

I assure you that the information provided is for research purposes only. I want to
take this opportunity to thank you for availing yourself and thereby contributing
towards making my research thesis a success.
………………..
N. LUDDY

APPENDIX B
BIOGRAPHICAL QUESTIONNAIRE

BIOGRAPHICAL INFORMATION
BIOGRAFIESE INLIGTING
Information about yourself( Inligting oor Uself )
(1) Please circle your occupational class (2) Please circle your raceOmkring asseblief u beroepsklas Omkring asseblief u ras
Pharmacist 1 African 1Pharmacist Assistant 2 Coloured 2Auxiliary Service Officer 3 Asian 3Administrative Clerk 4 White 4Director 5Personnel Officer 6Administrative Officer 7 (4) Please circle your Educational LevelState Accountant 8 Omkring asseblief u opvoedkundige vlakPersonnel Practitioner 9
Up to Std. 6 1Up to Std. 9 2
(3) Please circle your gender Std. 10 / Grade 12 3Omkring asseblief u geslag 3 Year Degree / Diploma 4
Post Graduate 5Male 1Female 2
(6) Please circle your ageOmkring asseblief u ouderdomsgroep
(5) Please circle your years of service in the Public Sector 21 years and younger 1Omkring asseblief u diensjare in 22 - 29 years 2die Publieke Sektor 30 - 39 years 3
40 - 49 years 4Less than 2 years 1 50 years and older 53 - 10 years 211 - 20 years 321 - 30 years 4 (8) Please circle your monthly incomeOver 30 years 5 Omkring asseblief u maandelikse inkomste
Less than R5 000 1(7) Please circle your marital status R5 001 - R10 000 2
Omkring asseblief u huwelikstatus R10 001 - R15 000 3Over R15 000 4
Single 1Married 2Divorced 3 (9) Please circle your job statusWidowed 4 Omkring asseblief u werkstatus
Permanent 1Contract 2
CONFIDENTIAL

APPENDIX C
JOB DESCRIPTIVE INDEX (JDI) QUESTIONNAIRE

1
JOB SATISFACTION QUESTIONNAIRE
Job Descriptive Index (JDI)
Listed below are a series of statements that represents feelings that you may have about your present job. There are no right or wrong answers
Your responses will be treated as strictly confidential.
A. Think of your present work. What is it like most of the time? How well do the
words below describe your work? Please circle the most appropriate response
next to each word.
• Y for YES if it describes your work
• N for NO if it does not describe your work
• ? if you cannot decide
WORK IN PRESENT JOB 1 Fascinating Y ? N
2 Routine Y ? N
3 Satisfying Y ? N
4 Boring Y ? N
5 Good Y ? N
6 Creative Y ? N
7 Respected Y ? N
8 Hot (temperature) Y ? N
9 Pleasant Y ? N
10 Useful Y ? N
11 Tiresome Y ? N
12 Healthful Y ? N
13 Challenging Y ? N
14 On your feet Y ? N
15 Frustrating Y ? N
16 Simple Y ? N
17 Endless Y ? N
18 Gives a sense of accomplishment Y ? N

2
B. Think of the pay you are receiving now. How well does each of the following
words describe your present pay? Please circle the most appropriate response
next to each word.
• Y for YES if it describes your work
• N for NO if it does not describe your work
• ? if you cannot decide
PRESENT PAY 1 Income adequate for normal
expenses
Y ? N
2 Satisfactory profit sharing Y ? N
3 Barely live on income Y ? N
4 Bad Y ? N
5 Income provides luxuries Y ? N
6 Insecure Y ? N
7 Less than I deserve Y ? N
8 Highly paid Y ? N
9 Underpaid Y ? N

3
C. Think of your supervision you are receiving now. How well does each of the
following words describe your present supervision? Please circle the most
appropriate response next to each word.
• Y for YES if it describes your work
• N for NO if it does not describe your work
• ? if you cannot decide
SUPERVISION ON PRESENT JOB
1 Asks my advice Y ? N
2 Hard to please Y ? N
3 Impolite Y ? N
4 Praises good work Y ? N
5 Tactful Y ? N
6 Influential Y ? N
7 Up-to-date Y ? N
8 Doesn’t supervise enough Y ? N
9 Quick tempered Y ? N
10 Tells me where I stand Y ? N
11 Annoying Y ? N
12 Stubborn Y ? N
13 Knows job well Y ? N
14 Bad Y ? N
15 Intelligent Y ? N
16 Leaves me on my own Y ? N
17 Lazy Y ? N
18 Around when needed Y ? N

4
D. Think of your opportunities for promotion that you have now. How well does
each of the following words describe your present opportunities for promotion?
Please circle the most appropriate response next to each word.
• Y for YES if it describes your work
• N for NO if it does not describe your work
• ? if you cannot decide
PRESENT OPPORTUNITIES FOR PROMOTION
1 Good opportunities for advancement Y ? N
2 Opportunities somewhat limited Y ? N
3 Promotion on ability Y ? N
4 Dead-end-job Y ? N
5 Good chance for promotion Y ? N
6 Unfair promotion policy Y ? N
7 Infrequent promotions Y ? N
8 Regular promotions Y ? N
9 Fairly good chance for promotion Y ? N

5
E. Think of the majority of the people that you are working with at the moment.
How well does each of the following words describe these people? Please circle
the most appropriate response next to each word.
• Y for YES if it describes your work
• N for NO if it does not describe your work
• ? if you cannot decide
PEOPLE IN YOUR PRESENT JOB
1 Stimulating Y ? N
2 Boring Y ? N
3 Slow Y ? N
4 Ambitious Y ? N
5 Stupid Y ? N
6 Responsible Y ? N
7 Fast Y ? N
8 Intelligent Y ? N
9 Easy to make enemies Y ? N
10 Talk too much Y ? N
11 Smart Y ? N
12 Lazy Y ? N
13 Unpleasant Y ? N
14 No privacy Y ? N
15 Active Y ? N
16 Narrow interests Y ? N
17 Loyal Y ? N
18 Hard to meet Y ? N