Job Outlook 2014 11 | 2013 · The Job Outlook 2014 survey is a forecast of hiring intentions of...
44
National Association of Colleges and Employers 62 Highland Avenue • Bethlehem, PA 18017-9085 • 610.868.1421 FAX: 610.868.0208 • www.naceweb.org ©Copyright November 2013 by the National Association of Colleges and Employers Job Outlook 2014 Free to NACE members / $49.95 list price 11 | 2013
-
Upload
trinhkhuong -
Category
Documents
-
view
216 -
download
0
Transcript of Job Outlook 2014 11 | 2013 · The Job Outlook 2014 survey is a forecast of hiring intentions of...

National Association of Colleges and Employers62 Highland Avenue • Bethlehem, PA 18017-9085 • 610.868.1421FAX: 610.868.0208 • www.naceweb.org
©Copyright November 2013 by the National Association of Colleges and Employers
Job Outlook 2014
Free to NACE members / $49.95 list price
11 |
201
3
2 | Job Outlook 2014 | National Association of Colleges and Employers
ABOUT THE JOB OUTLOOK 2014 SURVEY ...................................................................................................... 4
U.S. COLLEGE HIRING TO INCREASE 7.8 PERCENT ........................................................................................... 5Figure 1: Job Outlook hiring projections, 2008-2014Figure 2: Employers’ hiring expectationsAvailable vs. Unfilled Positions for New College GraduatesFigure 3: Available vs. unfilled positions for 2012-13, 2011-12, and 2010-11 graduatesJob Market RatingsFigure 4: Employers rate the job market for 2013-14 graduatesFigure 5: Employers’ plans to reassess hiring needsFigure 6: Percentage of college recruiting conducted in fall vs. spring, 2010-2014Figure 7: Spring 2014 recruiting plansRecruiting Methods Figure 8: Change in recruiting plans, 2010-2014, by percent of respondentsHiring by IndustryFigure 9: Total change in hiring, by industryFigure 10: Spring 2013 on-campus recruiting plans, by industryFigure 11: Job market rating, by industryHiring by RegionFigure 12: Total change in hiring, by regionFigure 13: Hiring expectations by region, by percent of respondentsFigure 14: Spring 2014 on-campus recruiting plans, by region
WHO’S IN DEMAND? ................................................................................................................................ 15Figure 15: Hiring expectations, by degree levelFigure 16: Top degrees in demand, by degree level and broad categoryFigure 17: Top degrees in demand (bachelor’s degree level)Figure 18: Top business degrees in demandFigure 19: Top engineering degrees in demandFigure 20: Top science degrees in demandFigure 21: Top communications degrees in demandFigure 22: Top liberal arts degrees in demandFigure 23: Top degrees in demand (master’s degree level)Figure 24: Top degrees in demand (doctorate degree level)Figure 25: Top five undergraduate degrees—NortheastFigure 26: Top five undergraduate degrees—Southeast
TABLE OF CONTENTS

National Association of Colleges and Employers | Job Outlook 2014 | 3
2003-04 JOB MARKET: EMPLOYER PERSPECTIVES
Copyright 2013 by the National Association of Colleges and Employers (NACE). No part of this publication may be used, adapted, or reproduced in any manner whatsoever without the written permission of NACE. Electronic reproduction is prohibited. NACE college and employer members have the permission of NACE, copyright holder, to download and photocopy this report for internal purposes only. Photocopies must include this copyright notice.
Figure 27: Top five undergraduate degrees—MidwestFigure 28: Top five undergraduate degrees—WestFigure 29: Who’s hiring by industry (bachelor’s degree level)Figure 30: Who’s hiring by region (bachelor’s degree level)International and Associate Degree Student HiringFigure 31: International student hiring plans, 2008-2014Figure 32: Associate degree student hiring, 2008-2014Figure 33: International student hiring plans, by industryFigure 34: Associate degree student hiring, by industryFigure 35: International student hiring plans, by regionFigure 36: Associate degree student hiring, by region
HOW EMPLOYERS VIEW CANDIDATES ......................................................................................................... 28Figure 37: Screen candidates by GPA, by percent of respondentsFigure 38: Screen candidates by GPA, by industryFigure 39: Attributes employers seek on a candidate’s resumeFigure 40: Influence of attributesFigure 41: Employers rate the importance of candidate skills/qualitiesFigure 42: Employers grade their average new graduate recruit on skills/attributesFigure 43: Employers’ hiring preferences relative to experience, by percent of respondentsFigure 44: Employers’ preference for work experience, by percent of respondents
COMPENSATION AND BENEFITS ................................................................................................................. 34Starting SalariesFigure 45: Employers with plans to increase starting salaries to bachelor’s degree graduatesFigure 46: Employers with plans to increase starting salaries, by industryFigure 47: Employers with plans to increase starting salaries, by regionSigning BonusesFigure 48: Employers offering signing bonusesFigure 49: Percent of employers offering signing bonuses to 2013-14 graduates, by industryFigure 50: Percent of employers offering signing bonuses in 2013-14, by regionFigure 51: Average signing bonus, by major (bachelor’s degrees)Figure 52: Average signing bonus, by major (master’s degrees)BenefitsFigure 53: Benefits and policies, Class of 2014
APPENDIX ................................................................................................................................................ 41 Figure 54: Respondents by size of department/business unit Figure 55: Respondents by industry Participating Organizations

4 | Job Outlook 2014 | National Association of Colleges and Employers
ABOUT THE JOB OUTLOOK 2014 SURVEY
The Job Outlook 2014 survey is a forecast of hiring intentions of employers as they relate to graduates of the Class of 2013-14. Each year, the National Association of Colleges and Employers (NACE) surveys its employer members about their hiring plans and other employment-related issues in order to project the market for new college graduates for the current class and to assess a variety of conditions that may influence that market.
From August 5, 2013, through September 13, 2013, data was collected for the Job Outlook 2014 survey. A total of 208 surveys were returned—a 19.8 percent response rate.
Of those responding, 16.8 percent of respondents were from the West, 23.6 percent were from the Northeast, 27.9 percent were from the Southeast, and 29.3 percent were from the Midwest. The remaining 2.4 percent of respondents were located outside of the United States. For a list of respondents by industry and size, and a partial list of organiza-tions that supplied data for this report, see page 43.
Totals throughout the report may not equal 100 percent due to rounding.
NACE expects to provide a formal update of job market information once more in the 2013-14 academic year: The Job Outlook 2014 Spring Update survey (data collected in February – March) will give NACE members a final update on hiring for 2013-14 graduates. Results will be available in early April 2014.
Please Note: A Change in This Year’s Report In the past, NACE employer members indicated their new college hire numbers from the previous year and forecast hires for the upcoming recruiting year, offering insight to the overall job market for new college graduates. While prior years’ Job Outlook surveys did not separate U.S. and international hires, this year, for the first time, employers were asked to distinguish college hires from 2012-13 and 2013-14 in the following four areas:
1. U.S. students for U.S. operations;2. International students for U.S. operations;3. U.S. students for operations outside of the United States; and, 4. International students for operations outside of the United States.
RESEARCH:Director, Strategic and Foundation Research: Edwin W. KocEmployment Information Manager: Andrea J. KonczResearch Associate: Kenneth C. TsangResearch Assistant: Anna Longenberger

Class of 2014
7.8%
2.1%
Class of 2008
16.0%
8.0%
Class of 2009
1.3%
-21.6%
Class of 2010-6.9%
5.3%
Class of 2011
13.5%
19.3%
Class of 2012
9.5% 10.2%
Class of 2013
13.0% Fall Preview
Spring Update
National Association of Colleges and Employers | Job Outlook 2014 | 5
U.S. COLLEGE HIRING TOINCREASE 7.8 PERCENT
After slow job growth and a disappointing, flat job market last spring, employers are contemplating hiring new grads from the Class of 2014 with increasing optimism. Employers plan to hire 7.8 percent more new college graduates from the Class of 2014 for their U.S. operations than they did from the Class of 2013. (See Figure 1.) Of total survey respondents, more than one-quarter indicated that they recruit new college graduates for positions outside of the United States. Further, all-told, employers responding to the Job Outlook 2014 survey report that they will hire 12 percent more U.S. and international graduates for U.S. and international positions in 2013-14 than they did in 2012-13.
Employers with plans to increase their individual college hire numbers have increased slightly from 47.5 percent for the Class of 2013 to 48.6 percent for the Class of 2014. In addition, the group of respondents that project a decrease in total hires has dropped to a new low, with just 6.1 percent having plans to decrease their college hire numbers. (See Figure 2.)
Figure 1: Job Outlook hiring projections, 2008-2014*
*Class of 2014 is the hiring projection for U.S. locations only. Prior years’ projections are shown for informational purposes only, and should not be compared to this year’s projection.

6 | Job Outlook 2014 | National Association of Colleges and Employers
Figure 2: Employers’ hiring expectations
Recruiting Year
Perc
ent o
f Res
pond
ents
0
10
20
30
40
50
60
2008-09 2009-10 2010-11 2011-12 2012-13 2013-14
Increase Maintain Decrease
39.4
%45
.4%
15.1
%
43.4
%39
.7%
16.9
%
47.7
% 40.1
%12
.2%
50.8
%37
.4%
11.8
%
47.5
% 42.4
%10
.1%
48.6
%45
.3%
6.1%
The key factors for the increase in hiring numbers, more than half of employers indicated, were larger business needs and/or company growth. An additional 20 percent mentioned a focus on building their talent pipelines by hiring more entry-level positions. Another nearly 15 percent reported an aging work force and anticipated retirements was creating the need for new college hires.
Most respondents who offered reasons for maintaining the number of new college hires had similar stories. Some noted that they are experiencing stable growth, so their college hiring numbers will stay the same. Others indicated that they are maintaining their college hires due to the dictate of business needs.
For the few organizations decreasing their college hiring numbers, the reasons were not all discouraging. While some mentioned declines in business, more than one-third of the group reported that they had hired an abundance of new graduates in 2013, so they don’t need as many new grad in this cycle.

National Association of Colleges and Employers | Job Outlook 2014 | 7
Job Market Rating
Perc
ent o
f Res
pond
ents
0
10
20
30
40
50
60
70
80
Excellent Very Good Good Fair Poor
2013-14 2012-13 2011-12
1.1% 2.1%
1.0%
14.9
%11
.9%
16.5
%
60.4
% 48.5
%45
.4%
20.9
% 33.5
%37
.5%
1.1% 1.0% 3.
1%
Available vs. Unfilled Positions for New College GraduatesIn spite of the flat job market and the worry 2013 grads expressed about getting a job in their field, some available jobs went begging. While employers forecast an average 171 positions available at their organizations, an average of eight positions remained unfilled at each firm. (See Figure 3.)
Not only has the number of available positions increased, but the total number of unfilled positions has also increased, with employers reporting an average of three more unfilled positions per employer.
Recruiting YearTotal Number of Available
Positions
Average Number of Available
Positions
Total Number of Unfilled Positions
Average Number of Unfilled Positions
Percent of Unfilled to Available Positions
2012-13 24,834 171 1,126 8 4.5%
2011-12 24,854 152 855 5 3.4%
2010-11 24,356 148 1,172 7 4.8%
Figure 3: Available vs. unfilled positions for 2012-13, 2011-2012, and 2010-11 graduates
Figure 4: Employers rate the job market for 2013-14 graduates
Job Market RatingsIn general, employers rate the overall job market for the Class of 2014 as “good.” (See Figure 4.)

Job Outlook Survey Year Fall Spring
2014 62% 38%
2013 68% 32%
2012 65% 35%
2011 64% 36%
2010 60% 40%
Figure 6: Percentage of college recruiting conducted in fall vs. spring, 2010-2014
8 | Job Outlook 2014 | National Association of Colleges and Employers
Respondents giving “very good” ratings are up from 14.9 percent for the Class of 2013 to 16.5 percent for the Class of 2014. And, the group giving less positive or “fair” ratings has dropped from 33.5 percent for 2013 grads to just over 20 percent for 2014 grads.
The highest and lowest ratings of “poor” and “excellent” show very little change over the past few years; they have fluctuated less than 2 percent.
With a more stable college job market, it appears that employers don’t need to keep as close of an eye on their college hiring needs as they did in the past. (See Figure 5.) Nearly half of respondents to this survey report that they will reassess their college hiring needs on a quarterly basis, up from 42.2 percent who had similar plans for reassessing hiring needs in the 2013 survey. Percent of Respondents
Sche
dule
0 10 20 30 40 50
Weekly
Monthly
Quarterly
Annually
Other
2013-14 2012-136.2%
7.3%
5.1%7.8%
12.4%12.5%
28.7%30.2%
47.8%42.2%
Figure 5: Employers’ plans to reassess hiring needs
Overall, employers continue to prefer the fall season for recruiting. (See Figure 6.)
While the percentage of organizations recruiting in the fall has fallen from 68 to 62 percent, 14.4 percent of respondents have plans to conduct 75 percent of their recruiting in the fall, with the remaining 25 percent to be conducted in the spring 2014.

Change % of 2014 Respondents
% of 2013 Respondents
% of 2012 Respondents
% of 2011 Respondents
% of 2010 Respondents
Using more technology in general 50.9% 57.3% 57.1% 41.1% 23.9%
Using more social networks 48.5% 59.6% 58.3% 42.6% 13.7%
Attending more career fairs 38.2% 34.8% 41.7% 33.5% 14.2%
Change in branding 33.3% 39.3% 42.3% 28.4% 2.5%
Attending fewer career fairs 23.6% 24.7% 27.4% 28.9% 27.9%
More travel 21.8% 21.3% 18.3% 19.3% 20.3%
Less travel 18.2% 21.9% 22.3% 15.2% 0.0%
Other 14.5% 18.5% 13.1% 18.3% ---
Figure 8: Change in recruiting methods, 2010-2014, by percent of respondents
Of recruiters who plan to be on campus recruiting in spring 2014, more than 40 percent have firm plans in place; just over 30 percent indicated that they have tentative plans in place for spring. (See Figure 7.) The percentage of respondents who are unsure of their spring recruiting plans has dropped from 15.5 percent among 2013 respondents, to just over 10 percent among 2014 respondents.
Recruiting Plans Spring 2014 Spring 2013
Firm recruiting plans 42.9% 37.6%
Tentative plans in place 30.3% 27.3%
All recruiting in Fall 13.7% 18.6%
Unsure 10.3% 15.5%
Not hiring 2.9% 1.0%
Figure 7: Spring 2014 recruiting plans
Recruiting MethodsWhile half of employers say they are using recruiting technology in general, and almost that many are tapping social networks to recruit the Class of 2014, career fairs—face-to-face time for graduating students and employers—is growing in use again.
In 2012, 41.7 percent of employers said they would use career fairs as a recruitment method. That percentage dropped to 34.8 percent in 2013 just as use of technology and social networks were rising among employers. For the Class of 2014, however, technology as a recruiting method has dropped from 57.3 percent for the Class of 2013 to 50.9 percent for the Class of 2014; in addition, use of social networks has dropped by about 10 percentage points, from 59.6 percent to 48.5 percent. At the same time, attending more career fairs has become more important.
National Association of Colleges and Employers | Job Outlook 2014 | 9

Industry # of 2014 Projected Hires
# of 2013 Actual Hires % Change # of
Respondents
Oil & Gas Extraction 1,098 654 67.8% 5
Utilities 376 226 66.4% 6
Construction 471 431 9.3% 7
Food & Beverage Mfg. 370 295 25.4% 6
Chemical (Pharmaceutical) Mfg. 2,301 2,234 3.0% 14
Computer & Electronics Mfg. 1,093 1,045 4.6% 11
Motor Vehicle Mfg. 877 680 28.9% 7
Misc. Mfg. 995 1,133 -12.2% 21
Retail Trade 1,223 1,096 11.6% 9
Transportation 1,450 1,409 2.9% 5
Finance, Insurance, & Real Estate 3,342 3,440 -2.8% 20
Management Consulting 1,384 1,054 31.3% 9
Misc. Prof. Services 803 723 11.1% 7
*Hiring projections are for U.S. locations only. (Only industries with 5 or more respondents are represented here.)
Figure 9: Total change in hiring, by industry*
10 | Job Outlook 2014 | National Association of Colleges and Employers
Hiring by IndustryLooking strictly at the U.S. industry hiring projections, nearly all industries represented are planning increases to college hiring. Only miscellaneous manufacturers and finance, insurance, and real estate employers are reporting overall decreases in hiring. (See Figure 9.)
In the case of miscellaneous manufacturers, the individual responses provide a better picture. Of the 21 respondents in this sector, only four are reporting decreases, with two employers planning decreases greater than 50 percent, skewing the overall decrease in hiring. Nine of the 21 respondents are maintaining their hiring numbers, and eight respondents are increasing their numbers.
While the 2.8 percent decrease in hiring for finance, insurance, and real estate employers gives a negative outlook, this sector shows the largest numbers actual hires in 2013 of 3,440 and, in 2014, projected hires of 3,342. In addition, more than half of the individual respondents in this sector are increasing their numbers, and 20 percent are maintaining their numbers. The remaining 25 percent are planning to decrease hiring, with two respondents reducing their numbers significantly—one by 47 percent and the other by 67 percent. One of the two respondents reported that they hired enough graduates from the Class of 2013 to handle current needs.
(Note: Industry projections for the Class of 2014 graduates should be examined with caution as some sectors contain a small number of respondents. Only industries with five or more respondents are listed. Additionally, due to the small number of respondents in some industries, overall percentages may be easily skewed by one or two respondents.)

National Association of Colleges and Employers | Job Outlook 2014 | 11
Industry Firm plans in place
Tentative plans
All recruiting
in Fall 2013
Not hiring Unsure # of Respondents
Oil & Gas Extraction 33.3% 16.7% 16.7% 16.7% 16.7% 6
Utilities 33.3% 33.3% 11.1% 11.1% 11.1% 9
Construction 28.6% 14.3% 42.9% 0.0% 14.3% 7
Food & Beverage Mfg. 40.0% 20.0% 40.0% 0.0% 0.0% 5
Chemical (Pharmaceutical) Mfg. 20.0% 26.7% 40.0% 6.7% 6.7% 15
Computer & Electronics Mfg. 33.3% 46.7% 13.3% 0.0% 6.7% 15
Motor Vehicle Mfg. 16.7% 66.7% 0.0% 0.0% 16.7% 6
Misc. Mfg. 63.6% 27.3% 0.0% 4.5% 4.5% 22
Wholesale Trade 60.0% 40.0% 0.0% 0.0% 0.0% 5
Retail Trade 80.0% 10.0% 0.0% 10.0% 0.0% 10
Transportation 66.7% 16.7% 0.0% 0.0% 16.7% 6
Information 30.0% 40.0% 10.0% 0.0% 20.0% 10
Finance, Insurance, & Real Estate 45.8% 29.2% 12.5% 0.0% 12.5% 24
Engineering Services 40.0% 20.0% 20.0% 0.0% 20.0% 5
Management Consulting 20.0% 40.0% 20.0% 0.0% 20.0% 10
Misc. Prof. Services 71.4% 28.6% 0.0% 0.0% 0.0% 7
Figure 10: Spring 2014 on-campus recruiting plans, by industry

12 | Job Outlook 2014 | National Association of Colleges and Employers
Industry Average Rating # of Respondents
Misc. Prof. Services 4.25 8
Information 4.10 10
Account Services 4.00 5
Retail Trade 3.90 10
Management Consulting 3.80 10
Wholesale Trade 3.40 5
Computer & Electronics Mfg. 3.37 16
Transportation 3.33 6
Utilities 3.22 9
Chemical (Pharmaceutical) Mfg. 3.20 15
Engineering Services 3.20 5
Government 3.20 5
Misc. Mfg. 3.18 22
Construction 3.14 7
Finance, Insurance, & Real Estate 3.13 24
Oil & Gas Extraction 2.83 6
Food & Beverage Mfg. 2.83 6
Motor Vehicle Mfg. 2.75 8
(*5-point scale, where 1=Poor, 2=Fair, 3=Good, 4=Very good, 5=Excellent)
Figure 11: Job market rating, by industry

National Association of Colleges and Employers | Job Outlook 2014 | 13
Region # of 2014 Projected Hires
% of 2013 Actual Hires % Change # of
Respondents
Northeast 9,589 9,274 3.4% 34
Southeast 6,819 5,916 15.3% 44
Midwest 5,170 4,920 5.1% 46
West 1,902 1,687 12.7% 24
Figure 12: Total change in hiring, by region
Figure 13: Hiring expectations by region, by percent of respondents
Hiring by RegionHiring projections by region are positive across the board, but respondents in the Southeast are projecting the largest overall increases. (See Figure 12.) In addition to projecting the largest increase, Southeastern respondents have the largest group of respondents who plan to increase their hiring numbers. (See Figure 13.)
While hiring projections for employers in the Northeast are the smallest, respondents in this region are most interested in spring recruiting. More than three-quarters of these respondents have either firm or tentative plans in place for spring 2014 recruiting. (See Figure 14.)
And, even though the Southeastern region has the highest planned increase in hiring, they are also the only region with respondents who are unsure of hiring in the spring.
Northeast51.2% Increase39.5% Maintain 9.3% Decrease 9.3% D
Southeast52.9% Increase41.2% Maintain5.9% Decrease
S5
Midwest48.2% Increase46.4% Maintain 5.4% Decrease
West35.7% Increase60.7% Maintain3.6% Decrease

14 | Job Outlook 2014 | National Association of Colleges and Employers
Recruiting Plans Northeast Southeast Midwest West
Firm plans in place 36.6% 49.0% 45.3% 40.7%
Tentative plans in place 39.0% 19.6% 28.3% 40.7%
All recruiting in fall 17.1% 9.8% 15.1% 7.4%
Unsure 0.0% 9.8% 0.0% 0.0%
Not hiring 7.3% 11.8% 11.3% 11.1%
Figure 14: Spring 2014 recruiting plans, by region

National Association of Colleges and Employers | Job Outlook 2014 | 15
Degree Level
Average Percent of
New College Hires in
2013-14
Number ofRespondents
Hiring 2013-14
Percent of Total
Respondents Hiring in 2013-14
Average Percent of
New College Hires in
2012-13
Number ofRespondents Who Hired in
2012-13
Percent of Total
Respondents Who Hired in
2012-13
Associate 2.9% 33 20.5% 3.4% 35 21.7%
Bachelor’s 78.4% 159 98.8% 78.3% 159 98.8%
Master’s 15.7% 129 80.1% 15.4% 128 79.5%
Doctorate 2.5% 43 26.7% 2.4% 42 26.1%
Professional (J.D., M.D., etc) 0.5% 11 6.8% 0.5% 12 7.5%
Figure 15: Hiring expectations, by degree level
WHO’S IN DEMAND?By degree level, bachelor’s degree graduates from the Class of 2014 are most in demand by employers— 98 percent of respondents say they will hire from this group. (See Figure 15.) Year-to-year comparisons show that the demand for advanced-degree graduates is fairly level, and there will be slightly fewer hiring graduates with associate degrees or professional degrees. In addition, the distribution of degrees that will be hired in 2013-14 has barely changed from the 2012 -13 recruiting year.

16 | Job Outlook 2014 | National Association of Colleges and Employers
Bachelor’s Broad Category # of Respondents Who Will Hire
% of Total Respondents Who Will Hire Bachelor’s Degree Students (n=196)
Business 150 86.2%
Engineering 135 77.6%
Computer & Information Sciences 110 63.2%
Sciences 82 47.1%
Communications 58 33.3%
Liberal Arts 37 21.3%
Agriculture & Natural Resources 16 9.2%
Master’s Broad Category # of Respondents Who Will Hire
% of Total Respondents Who Will Hire Master’s Degree Students (n=144)
Business 102 73.4%
Engineering 89 64.0%
Computer & Information Sciences 67 48.2%
35 25.2%
Doctorate Broad Category # of Respondents Who Will Hire
% of Total Respondents Who Will Hire Doctoral Degree Students (n=64)
Engineering 49 75.4%
Computer & Information Sciences 29 44.6%
Sciences 27 41.5%
Business 21 32.3%
Humanities & Social Sciences 9 13.8%
Education 3 4.6%
Figure 16: Top degrees in demand, by degree level and broad category
Business and technical degrees continue to surpass the other fields in the top disciplines in demand for college graduates. Business, engineering, and computer science degrees are desired at both the bachelor’s and master’s degree levels. (See Figure 16.) At the doctorate degree level, the same holds true, but degrees in the sciences are slightly more preferred than those in business.

National Association of Colleges and Employers | Job Outlook 2014 | 17
At the bachelor’s degree level, the top three majors in demand for the Class of 2014 are the same as they were for the classes of 2012 and 2013. Finance majors top the list, with computer and information sciences and accounting following closely behind. (See Figure 17.)
Major # of Respondents Who Will Hire % of Total Respondents Who Will Hire
Finance 114 65.1%
Computer & Information Sciences 110 62.9%
Accounting 100 57.1%
Mechanical Engineering 94 53.7%
Business Administration/ Mgmt. 92 52.6%
Electrical Engineering 84 48.0%
Computer Engineering 81 46.3%
Marketing/Marketing Mgmt. 81 46.3%
Management Information Systems 76 43.4%
Logistics/Materials Management 66 37.7%
Figure 17: Top degrees in demand (bachelor’s degree level)
Figures 18 through 22 show the demand for specific majors within a broad range of disciplines. Of employers that reported that they would hire business degree graduates, more than three-quarters will hire finance majors, and two-thirds will hire accounting majors. (See Figure 18.)
Employers hiring engineering graduates say they are targeting those earning degrees in mechanical or electrical engineering. (See Figure 19.)
More than 62 percent of employers planning to hire science graduates will be looking to hire math majors. (See Figure 20.) And, while just over one in five total respondents plan to hire liberal arts graduates, more than 70 percent will specifically target those earning political science degrees. (See Figure 22.) This is a shift from the 2013 survey when more than 70 percent of respondents hiring liberal arts degrees pursued graduates in psychology over the other majors.

18 | Job Outlook 2014 | National Association of Colleges and Employers
Major # of Respondents Who Will Hire % of Total Respondents Hiring Engineering Degrees (n=135)
Mechanical Engineering 94 69.6%
Electrical Engineering 84 62.2%
Computer Engineering 81 60.0%
Chemical Engineering 58 43.0%
Civil Engineering 44 32.6%
Major # of Respondents Who Will Hire % of Total Respondents Hiring Science Degrees (n=82)
Mathematics (incl. Statistics) 51 62.2%
Chemistry 34 41.5%
Physics 24 29.3%
Biology 21 25.6%
Construction Science/Management 20 24.4%
Geological & Related Sciences 10 12.2%
Figure 19: Top engineering degrees in demand
Figure 20: Top science degrees in demand
Major # of Respondents Who Will Hire % of Total Respondents Hiring Business Degrees (n=150)
Finance 114 76.0%
Accounting 100 66.7%
Business Administration/Mgmt. 92 61.3%
Management Info Systems 76 50.7%
Marketing 81 54.0%
Economics 56 37.3%
Logistics/Materials Management 66 44.0%
International Business 27 18.0%
Figure 18: Top business degrees in demand

National Association of Colleges and Employers | Job Outlook 2014 | 19
Major # of Respondents Who Will Hire % of Total Respondents Hiring Communications Degrees (n=58)
Communications 54 93.1%
Public Relations 32 55.2%
Advertising 21 36.2%
Figure 21: Top communications degrees in demand
Major # of Respondents Who Will Hire % of Total Respondents Hiring Liberal Arts Degrees (n=37)
Political Science 26 70.3%
Psychology 24 64.9%
English 23 62.2%
Sociology 20 54.1%
History 17 45.9%
Figure 22: Top liberal arts degrees in demand
Among responding employers, M.B.A. graduates are the highest in demand at the master’s level, as they were for the Class of 2013. However, at the doctorate degree level, computer engineering graduates just topped computer and information sciences grads for the most in-demand spot in 2014. (See Figures 23 and 24.)
Major # of Respondents Who Will Hire % of Total Respondents Who Will Hire
M.B.A. 95 54.3%
Computer & Information Sciences 67 38.3%
Mechanical Engineering 59 33.7%
Computer Engineering 58 33.1%
Electrical Engineering 55 31.4%
Accounting 55 31.4%
Chemical Engineering 39 22.3%
Figure 23: Top degrees in demand (master’s degree level)

20 | Job Outlook 2014 | National Association of Colleges and Employers
Figures 25 through 28 provide the top bachelor’s degrees in demand by region.
Major# of Northeast
Respondents Who Will Hire
% of Northeast Respondents Who
Will Hire
% of Total Respondents Who Will Hire
Finance 26 53.1% 65.1%
Accounting 25 51.0% 57.1%
Computer & Information Sciences 24 49.0% 62.9%
Marketing 23 46.9% 46.3%
Business Administration/Mgmt. 23 46.9% 52.6%
Major# of Southeast
Respondents Who Will Hire
% of Southeast Respondents Who
Will Hire
% of Total Respondents Who Will Hire
Computer & Information Sciences 33 56.9% 62.9%
Finance 32 55.2% 65.1%
Accounting 28 48.3% 57.1%
Mechanical Engineering 25 43.1% 53.7%
Computer Engineering 24 41.4% 46.3%
Electrical Engineering 24 41.4% 48.0%
Figure 25: Top five undergraduate majors—Northeast
Figure 26: Top five undergraduate majors—Southeast
Major # of Respondents Who Will Hire % of Total Respondents Who Will Hire
Computer Engineering 30 17.1%
Computer & Information Sciences 29 16.6%
Electrical Engineering 27 15.4%
Mechanical Engineering 23 13.1%
Chemical Engineering 21 12.0%
Business Administration/Mgmt. 21 12.0%
Figure 24: Top degrees in demand (doctorate degree level)

National Association of Colleges and Employers | Job Outlook 2014 | 21
Major# of Midwest
Respondents Who Will Hire
% of Midwest Respondents Who
Will Hire
% of Total Respondents Who Will Hire
Computer & Information Sciences 38 62.3% 62.9%
Finance 35 57.4% 65.1%
Management Information Systems 29 47.5% 43.4%
Mechanical Engineering 29 47.5% 53.7%
Accounting 28 45.9% 57.1%
Business Administration/ Management 28 45.9% 52.6%
Major# of West
Respondents Who Will Hire
% of West Respondents Who
Will Hire
% of Total Respondents Who Will Hire
Electrical Engineering 19 54.3% 48.0%
Finance 19 54.3% 65.1%
Accounting 17 48.6% 57.1%
Computer Engineering 16 45.7% 46.3%
Mechanical Engineering 16 45.7% 53.7%
Business Administration/ Management 15 42.9% 52.6%
Figure 27: Top five undergraduate majors—Midwest
Figure 28: Top five undergraduate majors—West

22 | Job Outlook 2014 | National Association of Colleges and Employers
Major Most Interested Industries % of Industry Respondents
Finance Government 100%
Finance, Insurance, & Real Estate 91%
Retail Trade 90%
Computer & Information Sciences Information 100%
Misc. Prof. Services 100%
Finance, Insurance, & Real Estate 87%
Accounting Government 100%
Retail Trade 80%
Finance, Insurance, & Real Estate 78%
Business Administration/Mgmt. Retail Trade 90%
Finance, Insurance, & Real Estate 87%
Government 80%
Mechanical Engineering Motor Vehicle Manufacturing 100%
Misc. Manufacturing 95%
Chemical (Pharmaceutical) Mfg. 93%
Figure 29: Who’s hiring by industry (bachelor’s degree level)

National Association of Colleges and Employers | Job Outlook 2014 | 23
Major Most Interested Industries % of Respondents by Region
Finance Midwest 57%
Southeast 55%
West 54%
Northeast 53%
Computer & Information Sciences Midwest 62%
Southeast 57%
Northeast 49%
West 37%
Accounting Northeast 51%
West 49%
Southeast 48%
Midwest 46%
Mechanical Engineering Midwest 48%
West 46%
Northeast 45%
Southeast 43%
Business Administration/Mgmt. Northeast 47%
Midwest 46%
West 43%
Southeast 41%
Figure 30: Who’s hiring by region (bachelor’s degree level)
24 | Job Outlook 2014 | National Association of Colleges and Employers
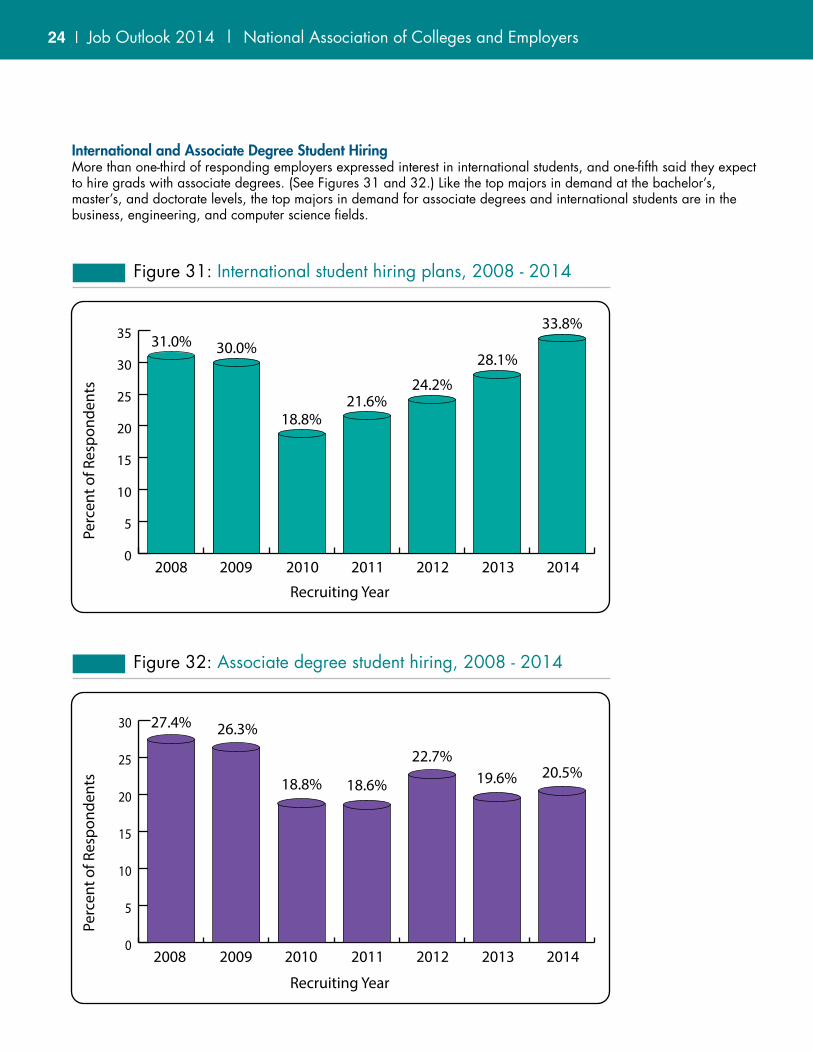
International and Associate Degree Student HiringMore than one-third of responding employers expressed interest in international students, and one-fifth said they expect to hire grads with associate degrees. (See Figures 31 and 32.) Like the top majors in demand at the bachelor’s, master’s, and doctorate levels, the top majors in demand for associate degrees and international students are in the business, engineering, and computer science fields.
Recruiting Year
Perc
ent o
f Res
pond
ents
0
5
10
15
20
25
30
35
2008 2009 2010 2011 2012 2013 2014
31.0% 30.0%
18.8%21.6%
24.2%
28.1%
33.8%
Figure 31: International student hiring plans, 2008 - 2014
Recruiting Year
Perc
ent o
f Res
pond
ents
0
5
10
15
20
25
30
2008 2009 2010 2011 2012 2013 2014
20.5%
27.4% 26.3%
18.8% 18.6%
22.7%19.6%
Figure 32: Associate degree student hiring, 2008 - 2014

National Association of Colleges and Employers | Job Outlook 2014 | 25
Engineering Services
28.6%
Transportation
Government
20.0%
Oil & Gas Extraction
42.9%
Wholesale Trade
28.6%
Utilities
18.2%
Misc. Prof. Services
50.0%
Retail Trade
18.2%
Motor Vehicle Mfg.
25.0%
Information
63.6%Computer &
Electonics Mfg.
55.6%
Accounting Services
40.0%
Finance, Insurance, & Real Estate
30.8%
Chemical (Pharmaceutical) Mfg.
38.9%
Misc. Mfg.
32.0%
Management Consulting
18.2%Construction
14.3%Food & Beverage Mfg.
14.3%
33.3%
Figure 33: International student hiring plans, by industry
Employers in the information industry and computer and electronics manufacturing industry show a strong demand for technical majors. More than half of respondents in each of these two employment sectors reported plans to hire international graduates. (See Figure 33.)

26 | Job Outlook 2014 | National Association of Colleges and Employers
Figure 34: Associate degree student hiring, by industry
Transportation
Motor Vehicle Mfg.
33.3%
Management ConsultingConstruction
14.3%
Misc. Prof Services
42.9%
Finance, Insurance, & Real Estate
26.1%
Government
20.0%
Information
28.6%
Utilities
37.5%
Misc. Mfg.
10.0%
Oil & Gas Extraction
16.7%
Computer & Electronics Mfg.
30.8%
11.1%
80.0%
Similar findings are seen in the demand for associate degree graduates. Demand for technical or engineering majors top the list. Eight in 10 transportation employers indicate plans to hire associate degree graduates. Miscellaneous pro-fessional services, utilities, and motor vehicle manufacturers also show interest in associate degree graduates, with at least one-third of respondents planning to hire them. (See Figure 34.)

National Association of Colleges and Employers | Job Outlook 2014 | 27
Demand for international students has increased in two of the four geographic regions. (See Figure 35.) In the Southeast, however, fewer employers have plans to hire international students from the Class of 2014, although the same number of employers in the West will hire Class of 2014 international students as they did in 2013.
Only employers in the Southeastern region are showing more interest in hiring associate degree graduates from the Class of 2014. (See Figure 36.) In fact, the interest from Southeastern employers is at its peak for associate degree graduates compared to the classes of 2011, 2012, and 2013. Interest in associate degree graduates has slightly decreased in the Midwest and Western regions, with the interest from Northeastern employers at an all-time low.
Region
Perc
ent o
f Res
pond
ents
0
5
10
15
20
25
30
35
40
Northeast Southeast Midwest West
2011 2012 2013 2014
14% 17
%14
%10
%
20%
32%
19%
36%
20%
20%
26%
20%
18%
12%
18%
15%
Figure 36: Associate degree student hiring, by region
Region
Perc
ent o
f Res
pond
ents
0
10
20
30
40
50
Northeast Southeast Midwest West
2011 2012 2013 2014
25% 28
%20
%39
%
20%
30% 33
%28
%
18%
14%
26%
33%
23%
23%
41%
41%
Figure 35: International student hiring plans, by region

28 | Job Outlook 2014 | National Association of Colleges and Employers
Recruiting Year
Perc
ent o
f Res
pond
ents
0
10
20
30
40
50
60
70
80
2008 2009 2010 2011 2012 2013 2014
67.1%62.3%
69.2%74.0% 76.9% 73.4%
78.3%
Figure 37: Screen candidates by GPA, by percent of respondents
HOW EMPLOYERS VIEW CANDIDATES
Employers screening candidates by grade point average (GPA) reached an all-time high with the Class of 2013, when more than 78 percent of respondents to the Job Outlook 2013 survey reported that they would do so. (See Figure 37.) Just over 67 percent of employers responding to the current survey plan to screen 2014 grads by GPA.
Almost 60 percent of employers will use 3.0 as their GPA cutoff; 23 percent use a cutoff that falls below that, and 19 percent have a higher cutoff. (See Figure 38.) The highest GPA cutoff—3.5—is demanded by engineering services employers; on the lower side, transportation and wholesale trade employers use a median GPA cutoff of 2.9.

National Association of Colleges and Employers | Job Outlook 2014 | 29
Industry % of Respondents GPA Cutoff (Reported Median)
Utilities 100.0% 3.0
Food & Beverage Mfg. 100.0% 3.0
Motor Vehicle Mfg. 100.0% 3.0
Accounting Services 100.0% 3.0
Chemical (Pharmaceutical) Mfg. 86.7% 3.0
Transportation 83.3% 2.9
Computer & Electronics Mfg. 80.0% 3.0
Management Consulting 80.0% 3.0
Information 70.0% 3.0
Finance, Insurance, & Real Estate 60.9% 3.0
Engineering Services 60.0% 3.5
Government 60.0% 3.0
Misc. Mfg. 52.4% 3.0
Retail Trade 50.0% 3.2
Misc. Professional Services 42.9% 3.0
Wholesale Trade 40.0% 2.9
Construction 28.6% 3.0
Oil & Gas Extraction 20.0% 3.0
Figure 38: Screen candidates by GPA, by industry

30 | Job Outlook 2014 | National Association of Colleges and Employers
Leadership
76.6% 76.0%
Communication skills (written)
73.1% 72.0%
Creativity
23.4%
Entrepreneurial skills/risk-taker Tactfulness
22.9% 21.7%
Analytical/quantitative skills Strong work ethic
71.4% 70.3%
Communication skills (verbal) Initiative
68.6% 68.6%
Computer skills Technical skills
65.7% 62.9%
Detail-oriented Flexibility/adaptability
61.1% 59.4%
Interpersonal skills (relates well to others) Organizational ability
58.3% 42.9%
Friendly/outgoingpersonality
Strategic planning skills
33.7% 32.6%
Problem-solving skillsAbility to work in a team
Figure 39: Attributes employers seek on a candidate’s resume
After making the GPA cut, employers look for written communication skills on their candidates’ resumes. (See Figure 39.) Leadership was the top attribute desired by employers for the Class of 2013, and now comes in a close second to written communication skills required of the Class of 2014. Analytical skills, a strong work ethic, and evidence of teamwork are also attributes that employers hope to find when screening resumes for potential new college hires.

National Association of Colleges and Employers | Job Outlook 2014 | 31
Attribute 2014 Average Influence Rating* 2013 Average Influence Rating*
Has held leadership position 3.9 4.0
Major 3.9 4.0
High GPA (3.0 or above) 3.7 3.8
Has been involved in extracurricular activities (clubs, sports, student
government, etc.)3.5 3.6
School attended 2.9 3.1
Has done volunteer work 2.8 2.8
Is fluent in a foreign language 2.4 2.4
Has studied abroad 2.2 2.3
*5-point scale, where 1=No influence at all, 2=Not much influence, 3=Somewhat of an influence, 4=Very much influence, and 5=Extreme influence.
Figure 40: Influence of attributes
If two candidates are equally qualified, having the desired major and proof of having held a leadership position are tie-breaking elements. (See Figure 40.) In the 2013 outlook survey, the top two attributes were the same. In fact, the order of Figure 40 is identical to the order for the Class of 2013, with average influence ratings in a few categories being slightly lower this year. Foreign language fluency and experience abroad were rated “low” in the eyes of employers for the 2014 graduates.
Employers place teamwork at the top of the list of overall candidate skills/qualities rated as important. (See Figure 41.) Although communication skills typically tops this list (as it did for the Class of 2013), verbal communication skills dropped to third most important, tied with the ability to plan, organize, and prioritize work. Important to note, however, is that even the lowest-rated skill/quality (ability to sell or influence others), is still rated between somewhat important and very important.

32 | Job Outlook 2014 | National Association of Colleges and Employers
Ability to work in a team
74.2%
Abilit t k i t
74.2%%
Ability to work in a team
74.2%
Abilit t k i t
74.2%%
TeamworkA-
NA - 10.66
Work EthicB+
NA - 10.30
LeadershipB+ B+
NA - 10.01
InitiativeB+
NA - 10.36
Analytical/
quantitve skillsA-
NA - 10.57
Verbal
communication
skills
B+NA - 10.02
Written
communication
skillsNA - 9.65
Problem-
solving abilityB+NA - 10.48
NA = Numerical Average
Figure 42: Employers grade their average new graduate recruit on skills/attributes
Skill/Quality Weighted Average Rating*
Ability to work in a team structure 4.55
Ability to make decisions and solve problems 4.50
Ability to plan, organize and prioritize work 4.48
Ability to verbally communicate with persons inside and outside the organization 4.48
Ability to obtain and process information 4.37
Ability to analyze quantitative data 4.25
Technical knowledge related to the job 4.01
Proficiency with computer software programs 3.94
Ability to create and/or edit written reports 3.62
Ability to sell or influence others 3.54
*5-point scale, where 1=Not at all important; 2=Not very important; 3=Somewhat important; 4=Very important; and 5=Extremely important
Figure 41: Employers rate the importance of candidate skills/qualities
It appears that employers are successfully choosing team players to fill their entry-level positions. When asked to give letter grades to their college graduate recruits, the highest grades of “A-” were in the areas of teamwork and analytical/quantitative skills. (See Figure 42.) While all of the remaining attributes received the letter grade of “B+,” communication skills (both verbal and written) received lower numerical averages in terms of grading.

National Association of Colleges and Employers | Job Outlook 2014 | 33
Hiring Preference 2014 2013 2012 2011
I prefer to hire candidates with relevant work experience 74.1% 71.0% 73.7% 72.4%
I prefer to hire candidates with any type of work experience (doesn’t matter if it’s relevant or not, just
some type of experience)20.7% 19.9% 17.5% 17.6%
Work experience doesn’t typically factor into my decision when hiring a new college graduate 1.1% 4.8% 4.1% 5.3%
Other 4.0% 4.3% 4.6% 4.7%
Figure 43: Employers’ hiring preferences relative to experience, by percent of respondents
Work experience is also a key factor when evaluating new college graduates for hire. Relevant work experience is also preferred over any type of work experience, with almost three-quarters of respondents favoring relevant work experience compared to just over 20 percent who don’t care if experience is relevant. (See Figure 43.) The group of respondents who don’t factor work experience into their hiring decisions has dropped to an all-time low of a mere 1.1 percent of respondents to this survey, which once again emphasizes the overall importance of work experience in new graduate hiring.
Digging deeper into employers’ preference for work experience, close to 60 percent of respondents favor experience gained through an internship or co-op. (See Figure 44.)
Internship/Co-op No Preference
56%
44%
Figure 44: Employers’ preference for work experience, by percent of respondents

34 | Job Outlook 2014 | National Association of Colleges and Employers
Starting SalariesThe percentage of employers with plans to increase starting salaries to bachelor’s degree graduates has returned to its highest level since 2009. (See Figure 45.) And, not only are more respondents planning increases in starting salaries to the members of the Class of 2014, but the average increase is up to 4.3 percent compared to 3.7 percent for the Class of 2013.
The median planned increase is identical to that for 2013 grads, falling at 3 percent, although nearly 40 percent of this survey’s respondents have salary increases planned in excess of 3 percent. And, while 23.5 percent of employers are planning salary increases of exactly 3 percent, a much larger group of 2013’s respondents, 43 percent, were planning such an increase. These factors help to explain what’s driving the overall average salary increase for bachelor’s degree graduates.
For master’s degree graduates, a similar group of respondents to the 2014 survey have plans to increase starting salaries as they did for members of the Class of 2013. Some 52.3 percent of respondents report that they will increase starting salaries to master’s degree graduates, which is down slightly from the 53.3 percent with plans to do so for 2013 grads. The average planned increase has also dropped slightly from 4.1 percent for 2013 grads to just 3.7 percent for 2014 grads. While the
median planned increase is the same as it was for 2013 grads, at 3 percent, almost 18 percent of respondents plan a 5 percent increase for Class of 2014 master’s degree graduates. The group of respondents planning a 5 percent increase for 2013 master’s degree graduates was somewhat higher at 20 percent.
Graduating Class
Perc
ent o
f Res
pond
ents
0
10
20
30
40
50
60
70
80
2008 2009 2010 2011 2012 2013 2014
78.5%
59.1%
29.2%
48.3%54.4% 51.9%
59.1%
Figure 45: Employers with plans to increase starting salaries to bachelor’s degree graduates
COMPENSATION AND BENEFITS
National Association of Colleges and Employers | Job Outlook 2014 | 35
Industry# of Respondents w/
Plans to Increase Bachelor’s Salaries
# of Respondents by Industry
% of Respondents by Industry
Oil & Gas Extraction 5 5 100.0%
Computer & Electronics Mfg. 9 10 90.0%
Information 4 5 80.0%
Chemical (Pharmaceutical) Mfg. 6 8 75.0%
Misc. Mfg. 11 16 68.8%
Management Consulting 4 6 66.7%
Retail Trade 5 9 55.6%
Finance, Insurance, & Real Estate 6 14 42.9%
Construction 2 5 40.0%
Misc. Prof. Services 2 6 33.3%
Government 1 5 20.0%
Figure 46: Employers with plans to increase starting salaries, by industry
Region# of Respondents
w/Plans to Increase Bachelor’s Salaries
# of Respondents by Region
% of Respondents by Region
Average projects increase*
Northeast 11 24 45.8% 3.7%
Southeast 20 36 55.6% 5.0%
Midwest 23 34 67.6% 4.2%
West 12 18 66.7% 3.5%
*average calculation based only on respondents with plans to increase salaries.
Figure 47: Employers with plans to increase starting salaries, by region
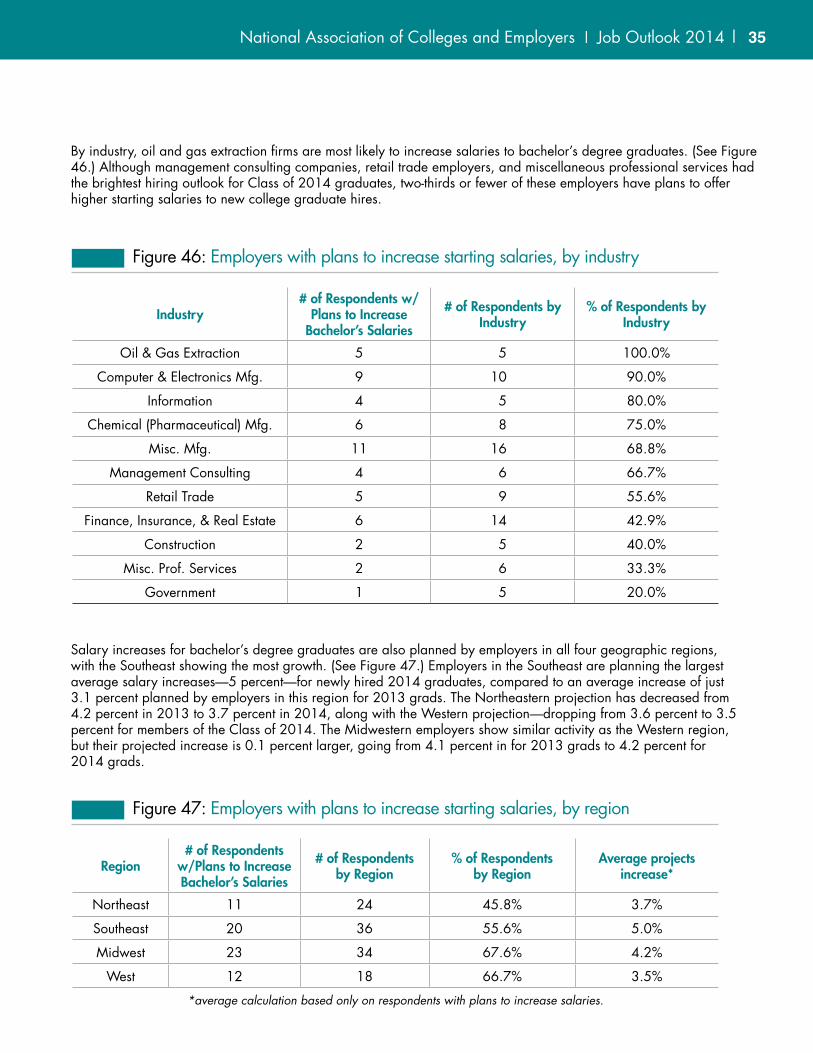
By industry, oil and gas extraction firms are most likely to increase salaries to bachelor’s degree graduates. (See Figure 46.) Although management consulting companies, retail trade employers, and miscellaneous professional services had the brightest hiring outlook for Class of 2014 graduates, two-thirds or fewer of these employers have plans to offer higher starting salaries to new college graduate hires.
Salary increases for bachelor’s degree graduates are also planned by employers in all four geographic regions, with the Southeast showing the most growth. (See Figure 47.) Employers in the Southeast are planning the largest average salary increases—5 percent—for newly hired 2014 graduates, compared to an average increase of just 3.1 percent planned by employers in this region for 2013 grads. The Northeastern projection has decreased from 4.2 percent in 2013 to 3.7 percent in 2014, along with the Western projection—dropping from 3.6 percent to 3.5 percent for members of the Class of 2014. The Midwestern employers show similar activity as the Western region, but their projected increase is 0.1 percent larger, going from 4.1 percent in for 2013 grads to 4.2 percent for 2014 grads.

36 | Job Outlook 2014 | National Association of Colleges and Employers
Recruiting Year
Perc
ent o
f Res
pond
ents
0
10
20
30
40
50
60
70
80
2006-07 2007-08 2008-09 2009-10 2010-11 2011-12 2012-13 2013-14
46.4
%
Planned Actual
54.6
%
53.6
% 60.4
%
58.4
%52
.8%
50.0
%
45.8
%46
.1%
45.0
% 52.7
%
40.8
% 48.4
%48
.0%
47.1
%
Figure 48: Employers offering signing bonuses
Signing BonusesSome 47.1 percent of employers responding to this year’s survey have plans to offer signing bonuses to Class of 2014 college graduates. Among these employers, more than one-third say they will offer bonuses to selected candidates. (See Figure 48.)
How closely do employer plans for signing bonuses match reality? As Figure 48 shows, in recent years, employers have realized or exceeded their expectations for providing signing bonuses.

National Association of Colleges and Employers | Job Outlook 2014 | 37
Industry % Offering Signing Bonuses # of Respondents
Chemical (Pharmaceutical) Mfg. 85.7% 14
Management Consulting 70.0% 10
Transportation 50.0% 6
Utilities 50.0% 8
Retail Trade 50.0% 10
Computer & Electronics Mfg. 46.7% 15
Motor Vehicle Mfg. 42.9% 7
Misc. Prof. Services 42.9% 7
Construction 42.9% 7
Misc. Mfg. 40.0% 20
Government 40.0% 5
Engineering Services 40.0% 5
Finance, Insurance,, & Real Estate 39.1% 23
Oil & Gas Extraction 20.0% 5
Wholesale Trade 20.0% 5
Information 20.0% 10
Figure 49: Percent of employers offering signing bonuses to 2013-14 graduates, by industry

38 | Job Outlook 2014 | National Association of Colleges and Employers
Region % Who Plan to Offer Signing Bonuses in 2013-14
% Who Planned to Offer Signing Bonuses in 2012-13
Northeast 52% 47%
Southeast 44% 47%
Midwest 46% 45%
West 48% 64%
Figure 50: Percent of employers offering signing bonuses in 2013-14, by region
Major 2013-14 Average Bonus (Projected)
# of Respondents 2013-14
2012-13 Average Bonus (Projected)
# of Respondents 2012-13
Accounting $4,000 6 $3,909 11
Computer Science $5,000 6 $5,038 13
Engineering – not specified $4,658 19 $4,250 12
Finance $3,500 6 $4,000 9
*where 5 or more data points were provided.
Figure 51: Average signing bonus, by major (bachelor’s degrees)*
Major 2013-14 Average Bonus (Projected)
# of Respondents 2013-14
2012 -13 Average Bonus (Projected)
# of Respondents 2012-13
M.B.A. $9,550 10 $16,583 12
*where 5 or more data points were provided.
Figure 52: Average signing bonus, by major (master’s degrees)*
BenefitsThe benefits and policies that employers offer new college graduates is generally consistent from year to year and extends to the Class of 2014 graduates. This holds true for the top six benefits/policies, all having between 94 and 100 percent of respondents who had or will be offering them to new college graduates. (See Figure 53.) A few notable changes, however, can be seen in three areas—bonus/commission plans, benefits to domestic partners, and stock options.
Just over eight in 10 respondents this year have plans to offer bonus/commission plans, which is up almost 10 percent over the 69.9 percent of respondents from the 2013 survey, and from 2011-12 when 71.6 percent of respondents planned to offer bonuses/commissions.

National Association of Colleges and Employers | Job Outlook 2014 | 39
Benefit/Policy % of Respondents Who Will Offer in 2013-14
% of Respondents Who Offered in 2012-13
% of Respondents Who Offered in 2011-12
Life insurance 98.9% 98.9% 100.0%
Medical insurance 98.9% 98.9% 99.0%
401(k) retirement plan 97.0% 97.8% 98.4%
Annual salary increases 96.4% 94.4% 94.0%
Dental insurance 94.7% 98.9% 98.9%
Employee assistance/counseling program 94.7% 93.9% 95.3%
Tuition reimbursement 86.0% 84.6% 84.5%
Casual dress policy 84.8% 87.6% 87.1%
Bonus/commission plans 80.1% 69.9% 71.6%
Planned social activities 78.7% 79.0% 79.0%
Frequent performance reviews (more than one per year) 74.7% 73.4% 75.4%
Benefits to domestic partners 74.5% 70.9% 67.9%
Flextime 65.5% 57.6% 63.4%
Family-friendly benefits 63.0% 64.0% 64.5%
More than two weeks vacation 58.8% 57.6% 56.5%
On-site fitness center 51.5% 51.4% 48.6%
Telecommuting 41.4% 39.2% 38.9%
Pension plan 31.9% 28.0% 40.0%
Stock options 30.7% 28.0% 25.9%
Day care facilities 10.5% 13.0% 9.8%
Company car 9.9% 7.9% 10.3%
Payback of existing student loans 4.3% 1.7% 2.2%
Figure 53: Benefits and policies, Class of 2014
In 2014, almost three-quarters of respondents plan to offer benefits to domestic partners.
Almost 31 percent of employers plan to offer stock options to Class of 2014 graduates, slightly more than the 28 percent of respondents hiring from the Class of 2013. The overall increase is almost 5 percent over that offered to Class of 2012 graduates—25.9 percent of employers planned to offer stock options. Although 5 percent isn’t a sizable increase, it may indicate a positive trend in the offering of this particular benefit.

40 | Job Outlook 2014 | National Association of Colleges and Employers
UPDATES FOR THE CLASS OF 2014
The Job Outlook 2014 Spring Update survey (data collected in February – March) will give NACE members a final update on hiring for 2013-14 graduates. Results will be available in early April.
The first report of starting salaries for the Class of 2014 will be published in the April 2014 Salary Survey.

National Association of Colleges and Employers | Job Outlook 2014 | 41
14.7%Fewer than 500
14.7%500 - 1,000
11.8%1,001 - 2,500
13.2%2,501 - 5,000
13.2%5,001 - 10,000
32.4%More than
10,000
Figure 54: Respondents by size of department/business unit
APPENDIX

42 | Job Outlook 2014 | National Association of Colleges and Employers
Industry # of Respondents % of Respondents
Oil & Gas Extraction 7 3.4%
Utilities 11 5.3%
Construction 7 3.4%
Food & Beverage Mfg. 7 3.4%
Chemical (Pharmaceutical) Mfg. 18 8.7%
Computer & Electronics Mfg. 18 8.7%
Motor Vehicle Mfg. 9 4.3%
Misc. Mfg. 25 12.0%
Wholesale Trade 7 3.4%
Retail Trade 11 5.3%
Transportation 6 2.9%
Messaging & Warehouse 1 0.5%
Information 11 5.3%
Finance, Insurance, & Real Estate 26 12.5%
Accounting Services 5 2.4%
Engineering Services 7 3.4%
Management Consulting 11 5.3%
Misc. Prof. Services 10 4.8%
Social Services 3 1.4%
Recreation & Hospitality 2 1.0%
Misc. Support Services 1 0.5%
Government 5 2.4%
Figure 55: Respondents by industry

National Association of Colleges and Employers | Job Outlook 2014 | 43
Participating OrganizationsBelow is a list of the organizations that responded to the Job Outlook 2014 survey. (Please note: Although 208 organizations responded, the list below includes 155 organizations, as 53 organizations preferred not to be listed.)
7-Eleven, Inc.AbbVieADPAeroVironmentAIGAlcatel-LucentAmeriHealth Mercy Family of
CompaniesAndersen WindowsArcelorMittal USAAscend Performance MaterialsAspen Technology Inc.AT&TAvery Dennison CorporationBank of AmericaBarclays CapitalBASF CorporationBrocade Communications Systems, Inc.BuhlerPrince Inc.Burgess & Niple, Inc.Burns & McDonnell Engineering
Co. Inc.C.H. Robinson Worldwide, Inc.California State AuditorCampbell Soup CompanyCaterpillar Inc.CGI FederalChevron CorporationCiena CorporationColgate-Palmolive Co.Collective Brands (Payless
ShoeSource)Con EdisonConAgra Foods, Inc.ConocoPhillips
Continental AGCOUNTRY FinancialCROSSMARKDell, Inc.Delphi Automotive Systems, LLCDick’s Sporting GoodsDiscover Financial ServicesDuPontEdward JonesEllison Surface TechnologiesEntergy Services, Inc.Ericsson Inc.Ernst & Young LLPExxon Mobil CorporationFederal Deposit Insurance
CorporationFederal-Mogul CorporationFerguson EnterprisesFreeport-McMoRan Copper & Gold
Inc.GAF CorporationGenworth FinancialGeorgia Tech Research InstituteGlobal Tax Management, Inc.Gorton’s Inc.Harris CorporationHecla Mining CompanyHuntington Ingalls IndustriesIBM CorporationINEOSInfineum USA L.P.Innovative Systems, Inc.International Game TechnologyJ.B. Hunt Transport Inc.Kellogg Company
Kimberly-Clark CorporationKPMG LLPL-3 Communications Integrated
SystemsLattice Semiconductor CorporationLevel 3 CommunicationsLevi Strauss & Co.Liberty Mutual Insurance CompanyLSI CorporationLyondellBasell IndustriesMacy’s, Inc.Mattress FirmMaximusMeijer, Inc.Merck & Co., Inc.Messer Construction Co.Michelin North AmericaModern Woodmen of AmericaMoen IncorporatedMonsanto CompanyNaval Acquisition Career CenterNetAppNewfield Exploration CompanyNewfield WirelessNexen, Inc.Oak Ridge Associated UniversitiesOlsson AssociatesPacific Gas and Electric CompanyPariveda Solutions Inc.Polaris Industries, Inc.PPL CorporationPress Ganey Associates, Inc.PrimeSource Building Products, Inc.Printpack Inc.Procter & Gamble Co.

National Association of Colleges and Employers 62 Highland Avenue • Bethlehem, PA 18017-9085 • 800.544.5272 • FAX: 610.868.0208
www.naceweb.org
44 | Job Outlook 2014 | National Association of Colleges and Employers
PSEGQuicken LoansRackspace, US Inc.Renaissance Learning, Inc.Riverhead ResourcesRosetta ResourcesRoss Stores Inc.Roux Associates, Inc.Rural Sourcing Inc.Saint-Gobain Corporation - North
AmericaSapientNitroSargent Aerospace & DefenseSCA AmericasSchlumberger Oilfield ServicesSeagate TechnologySears Holdings CorporationSimpson Gumpertz & Heger Inc.Southern California Edison Co.Southern Company
Southern Wine & Spirits of Northern California
Space Systems/Loral Inc.Stryker UK LtdSWIFTTalisman Energy Inc.Teradata CorporationTextron Inc.The Dow Chemical CompanyThe J.M. Smucker CompanyThe MathWorks Inc.The Northern Trust CompanyThe Timken CompanyThe Vanguard GroupThe Walsh GroupThurgood Marshall College FundTindall CorporationTowers WatsonTrinity Consultants Inc.Turner Construction Company
Tyco International Inc.
U.S. Comptroller of the Currency
U.S. Postal Service
UGI Utilities Inc.
Union Bank
United Launch Alliance
Unum
USS-POSCO Industries
Verso Paper Corp.
Vistaprint
W.W. Grainger, Inc.
Warner Robins Air Logistics Ctr.
Weaver LLP
WESCO International, Inc.
Westlake Financial
WorleyParsons
Zachry
Zipcar