Job Creation and Job Destruction in Russia: Some - Heinz College
45
Job Creation and Job Destruction in Russia: Some Preliminary Evidence from Enterprise-level Data Alessandro Acquisti School of Information Management and Systems, UC Berkeley, 102 South Hall, Berkeley, CA 94720-4600. [email protected] Hartmut Lehmann Heriot-Watt University, Edinburgh EH14 4AS, United Kingdom; LICOS, Leuven, Belgium; IZA, Bonn, Germany; and WDI, Ann Arbor, Michigan
Transcript of Job Creation and Job Destruction in Russia: Some - Heinz College

2
Job Creation and Job Destruction in Russia:
Some Preliminary Evidence from Enterprise-level Data
Submitted to Economic Systems
An earlier version of this paper appeared as: Trinity Economic Technical Papers, 1/00
Alessandro Acquisti
School of Information Management and Systems, UC Berkeley,
102 South Hall, Berkeley, CA 94720-4600. [email protected]
Hartmut Lehmann
Heriot-Watt University, Edinburgh EH14 4AS, United Kingdom;
LICOS, Leuven, Belgium; IZA, Bonn, Germany; and WDI, Ann Arbor, Michigan

3
Job Creation and Job Destruction in Russia:
Some Preliminary Evidence from Enterprise-level Data
Submitted to Economic Systems
An earlier version of this paper appeared as: Trinity Economic Technical Paper, 1/00
JEL Classification: P52, J40
Abstract
We study job gross flows in Russia using large enterprise-level data sets from 1997 administrative records
of firms in manufacturing and mining, construction and distribution and trade in four representative
regions. We show that in 1997 small firms were the most successful at creating jobs while medium and
large firms were mainly destroying them. Privatised firms fared no better than state-owned ones whilst new
private firms outperformed firms with other ownership type as far as job creation is concerned. However,
much of this superior performance seemed to have been related to labour market entry.
Acknoweldgements
The authors would like to thank Vladimir Gimpelson, Tatyana Gorbacheva, Vassilis Hajyvassilious, Danny Quah, Jozef
Konings, Douglas Lippoldt, Mark Schaffer, Ruslan Yemtsov and the participants at the Atlantic Economic Association
Conference, Boston 1998, at an OECD-TACIS workshop, Paris 1999, and at a Trinity College Department of Economics Brown
bag seminar for helpful discussions. Financial support from the European Commission (TACIS-ACE project T95-4099-R) and
from the Research Council of the Catholic University of Leuven is gratefully acknowledged. Acquisti wishes to also thank the
Banca Nazionale del Lavoro for financial assistance from the “Borsa di Studio BNL per il perfezionamento all'estero nelle
discipline economiche”.
Alessandro Acquisti School of Information Management and Systems
University of California at Berkeley
Hartmut Lehmann LICOS Centre for Transition Economics
Katholieke Universiteit Leuven
Herriot-Watt University, Edinburgh
and William Davidson Institute, University of Michigan

4
Job Creation and Job Destruction in Russia:
Some Preliminary Evidence from Enterprise-level Data
Alessandro Acquisti and Hartmut Lehmann
I. Introduction
More than five years after the transition to a market economy began in Russia, macro-economic evidence indicated
that, despite the initial phenomenon of hyper-inflation and a halving of industrial production, the performance of the
Russian labour market diverged from those of other reform-oriented transition economies and mass unemployment
was slow to emerge. Many enterprises seemed to have reacted to the negative shock of transition reducing working
hours, not indexing salaries to inflation and allowing wage arrears to build. As a result real wages had fallen steeply
since the beginning of the reforms and wage payments had been systematically withheld from workers in many
industrial branches of the economy (see e.g. Layard and Richter, 1996). The flip side of this strong "price
adjustment" (Lehmann, Wadsworth and Acquisti, 1999) in the Russian labour market is a quite sluggish downsizing
of the workforce. Even keeping measurement problems in mind, it is clear that in the first years of transition
employment has fallen by substantially less than GDP and by much less than industrial production. Foley (1997)
and Gimpelson and Lippoldt (1999) document, using micro data, other important stylised facts of labour market
adjustment in Russia: compared to most Central European countries transitions between employment and non-
employment are large and hiring rates are high.
To fully understand this "dynamic" labour market adjustment more hard evidence, in particular at the micro
level is needed. In this paper we use a large enterprise level data set for four representative regions1 to look at job
creation and job destruction, central measures of labour market adjustment in transition economies. Job creation
and job destruction in Russia has previously been analysed by Richter and Schaffer (1996). However, the data that
they used consisted of a sample of 435 firms collected in 1994 while we have around 6,000 medium-sized and large
establishments and 5,000 small firms in our data set, which covers the above mentioned regions. The observations
on medium and large enterprises are census-type data in the industries manufacturing, construction and trade for
1996 and 1997, while the data on small firms is a random sample in the same industries and for the same years.

5
We thus are able to extend the analysis to firms of all sizes and ownership types. In this paper we only look at the
data from the year 1997 as these data have been particularly well collected and processed. As these cross section
data have a retrospective part we are able to construct measures of job creation and destruction as developed by, for
example, Davis and Haltiwanger (1992).
There is now an emerging consensus in the literature that labour market flows in CEE are at least as much
determined by demand factors as by supply factors. Looking at how firm behaviour influences job creation and
destruction and labour turnover is, therefore, essential if one wants to get a complete picture of labour market adjustment
in a transition economy. By studying the enterprise level data we will have a fuller picture of labour market dynamics in
Russia. By analysing gross job flows we also provide an empirical contribution to the literature on restructuring that has
been mainly theoretical (e.g. Aghion and Blanchard, 1994, Chadha, Coricelli and Kranjak, 1993 and Blanchard, 1997).
There are at least three reasons why it is important to look at job creation and job destruction when analysing labour
market adjustment in transition economies. First, there is a recent increased interest from both labour and industrial
organisation economists in the theoretical and empirical aspects of gross flows of jobs (e.g. Davis and Haltiwanger,
1992). However, we know very little about gross job flows in Russia, despite the obvious relevance given the shocks
affecting the Russian economy. We expect to gain some insights into the nature of firm adjustment in the Russian
economy by studying various aspects of gross job flows, such as sector-specific, ownership and size effects.
Secondly, there is now a large literature on labour market adjustment in transition economies using aggregate
employment data and micro-data from household and labour force surveys. This literature characterises unemployment
in virtually all countries as a "stagnant pool" which imposes a heavy social burden on transition economies. Recent
evidence shows that supply-side factors cannot only be held responsible for this result. None of the policy measures in
CEE countries meant to increase job search efforts by the unemployed seem to have raised outflow rates from
unemployment in a discernible way (Boeri and Lehmann, 1999). Weak labour demand seems to drive labour market
flows in most transition economies. As was already stressed, labour market flows are different in Russia. How much
labour demand contributes to this difference can be partially explained by examining gross job flows.
Thirdly, the evidence collected in this paper will also allow us to address the question of the sources of growth of
the new private sector. Because of the distorted structure of output at the start of transition, one could expect initial rapid
growth in certain sectors: trade, services, certain consumer goods, etc. This could imply that overall private sector

6
growth will slow down after the stock adjustment process has come to an end and new firms stop entering and expanding
in underrepresented sectors. Similarly, small and medium-sized enterprises (SMEs) were rare under the socialist system.
One might, therefore, expect initial rapid growth by new firms as they enter and fill the SME "niche", followed by a
slowdown as the niche is filled. One of the crucial questions we will ask when analysing the evidence will be whether
there is robust job creation by new private firms in Russia (as found by Richter and Schaffer, 1996, and by Konings,
Lehmann and Schaffer, 1996, in the case of Poland) and whether this appears to be driven by ownership and/or life-cycle
effects rather than purely sectoral or size effects.
This paper is a rather preliminary exercise insofar as only a cross section of 1997 data is analysed. This exercise
tries to explore the data and find some stylised facts about job gross flows in Russia. As we take a snapshot of labour
market developments well into the transition of the Russian economy, we can be confident to see adjustment patterns by
enterprises that have, for the most part, been exposed to the rough climate of economic reform for several years.
The next section defines the job flow measures that we use in our analysis, discusses the Russian enterprise-level
data and gives a short description of the chosen four Russian regions. Section III presents gross job flow rates across
ownership types, industries, regions and size categories. In section IV we estimate the determination of net employment
growth rates using OLS and Instrumental Variables regressions, while section V offers some tentative conclusions.
II. Definitions, Data and the Representative Nature of the Selected Regions
Net employment change in an economy is the result of firm expansion and firm entry on the one hand and firm
contraction and firm exit on the other. The employment flows underlying this firm behaviour are referred to as
“gross flows of jobs”. We construct these flows using the net growth rates that are conventional in this literature
rather than the more common log growth rates. Following Davis and Haltiwanger (1992) we define this growth rate
as
git = nit – ni,t-1 / xit (1)
where nit stands for employment of firm i at time t and xit = (nit + ni,t-1) / 2 is the average size of firm i. This net

7
employment growth rate, being symmetric and lying in the interval [-2,2], can take account of entry, expansion,
contraction and exit of firms.2 Let Xt be total average employment of the economy or of the sector under
investigation, i.e. let Xt = Σi∈I xit, where I stands for the set of all firms in the economy or in the sector. The job
creation rate is then defined as
pos ≡ Σi∈I+ git(xit/Xt) = Σi∈I+ (nit – ni,t-1) / Xt, (2)
where I+ is the subset of expanding/entering firms. The job creation rate is thus defined as the weighted sum of all
positive net growth rates in the economy or in the sector. Alternatively we can think of this rate as the increase in
employment in expanding firms expressed as a proportion of total employment. The job destruction rate is defined
analogously as
neg ≡ Σi∈I- |git|(xit/Xt) = Σi∈I- |nit – ni,t-1| / Xt, (3)
where we now sum over the subset of contracting/exiting firms, I-. The job destruction rate, normally expressed in
absolute value, can also be interpreted as the absolute value of the decrease in employment in contracting firms as a
proportion of total employment. From the presented definitions of job creation and destruction it should be clear that
pos and neg are lower bounds as they are unable to account for gross job flows within individual firms.
Nevertheless, at the sectoral level, at the level of ownership types or for the economy as a whole these measures,
which are traditionally used in the literature, give us a very good idea about the relative dynamism of the job
creation and job destruction process.
The gross job reallocation rate (gross) is defined as the sum of pos and neg, while the net change of
employment is represented by net = pos – neg. If net employment changes are very large and mainly driven by
contraction and exit, as will be the case particularly during the early phase of transition, then gross might not capture
the reallocation of jobs very well.3 The alternative measure of job reallocation, excess = gross - |net|, is therefore
often used to catch job reallocation in excess of the amount necessary to accommodate a net aggregate employment
change. Thus understood, some authors interpret excess as a measure of “deep restructuring” (Fagio and Konings,

8
1999). We can also think of excess as an index of firm heterogeneity with respect to job creation and destruction in
an economy or a given sector.
The 1997 data sets for “medium-sized and large” enterprises (MLEs) and “small firms” respectively are
described in Tables 1 and 2.4 Before taking a closer look at the two data sets, some general comments about the data
collection process are in order. Medium-sized and large enterprises are defined by the Russian Statistical Office
(Goskomstat) in principal as those firms employing over 100 employees in manufacturing and mining, construction
or transportation, and over 50 employees in the wholesale trade or over 30 in the retail trade. Consequently, small
firms are in principal the complement with respect to these size categories. Inspecting the two data sets we found,
however, some overlap with respect to the size distributions: some MLEs should actually fall into the category
“small firms” and some small firms should be categorised as “MLEs”.
This leads one to distinguish the two data sets in a different fashion. The data on MLEs are census-type
data that go back to Soviet times. In the Soviet Union virtually all state-owned enterprises were MLEs and had to
report certain statistics to Goskomstat on a quarterly basis or annual basis. After the beginning of the reforms
Goskomstat sent modified questionnaires to the same firms accommodating the need for different information in a
changed economic environment. Small firms, which hardly existed in the Soviet Union but had been created in large
numbers after the economic regime switch, were not covered by any official data collection. Consequently, since
1994 Goskomstat has been sending a questionnaire designed for “small firms” (“malye predpriyatye”) to a sample of
such firms in each administrative region of the Russian Federation. Not much is known about the sampling frame
and design, Goskomstat gives only the information that the data constitute a 10% random sample of all small firms
in a region. Therefore, in our assessment, data on MLEs refer above all to enterprises that have already existed
under central planning and that have continued their activities during transition, while data on small firms refer for
the most parts to firms that have been born after January 1992. Contraction of some MLEs to an employment size
lower than the official threshold and the expansion of some small firms above the officially stated limits generates
the mentioned overlap in the two data sets.
These characterisations of MLEs as enterprises continuing from Soviet times and of small firms as new
firms have an important implication. The vast majority of MLEs that are labelled “private” in our data can be
considered privatised firms, while virtually all “private” firms among small firms should be regarded as new private
9
firms. Both data sets cover three industries: manufacturing and mining, construction and distribution and trade.
They make up the lion share of employment in the non-budgetary sector of the Russian economy well into the
transition and most restructuring in the Russian economy is taking place in these three industries. So, by choosing
manufacturing and mining, construction and distribution and trade we hope to capture some general patterns of job
creation and destruction in Russia.
The 1997 data on employment and on the distribution of medium and large firms, summarised in Table 1,
show that the lion share of employment is in manufacturing and mining as about two thirds of all employees in the
sample work in manufacturing and mining (column 4). This contrasts with a frequency of around one third of
manufacturing and mining firms (column 5). Nearly half of all firms in the data set are in distribution and trade; this
industry, however, has in 1997 an employment share of only 11%. One fifth of all firms are in construction with an
employment share roughly equal to their frequency. Average employment is, therefore, much larger in
manufacturing than in construction and distribution and trade, as column 3 of the table shows. The last three panels
of Table 1 show how firms and employment are distributed within an industry across ownership types. Around two
thirds of employees in manufacturing and mining work in firms with mixed domestic ownership which in turn make
up about half of all firms in this industry. Mixed domestic ownership refers to partially privatised enterprises where
private capital is domestically owned and the state still has a stake in the enterprise. A majority of construction
workers are also employed in firms with mixed ownership, while over 60% of workers in distribution and trade are
employed in private firms, which in our reading of the data are predominantly privatised firms. Enterprises where
the state is the sole owner represent about a third of the enterprises in the three industries, but have a lower
employment share, varying between 15% and 24%. We label enterprises as state-owned if they are the sole property
of the Federal government, of regional or of municipal authorities. It is also noteworthy that in all three industries
mixed firms are largest and state-owned firms smallest.
Our random sample of small firms consists to more than 80% of private firms as Table 2 shows. As argued
above, it is likely that firms, which are identified as private in Table 2, are actually new private firms. Most
probably, firms labelled “mixed domestic” are spin-offs from large partly privatised firms. They make up the rest of
the small firms data set as other ownership types are absent from our data in 1997. A comparison of tables 1 and 2
produces 2 interesting results. First, small firms are on average indeed minuscule when compared to medium and

10
large firms as the latter are roughly 27 times larger in the private and 44 times larger in the mixed sector. Secondly,
in 1997 a substantial part of employment can be found in predominantly new private and new mixed firms since the
employment numbers in our 10% sample of small firms imply that approximately one fifth of total employment in
the three industries of the four regions was in small firms. Most of the firms in the two ownership categories in
Table 2 are continuing firms, however, the proportion of new firms entering the three industries reaches nearly 25%
in the case of new private, and 35% in the case of mixed firms. These numbers would suggest that it is important to
distinguish between the performance of all small firms and of small continuing firms.
The net growth rates of employment, git , are the basic building blocs for our analysis; their distributions can,
therefore, give us some important initial insights into the job creation and destruction performance of enterprises. A
look at the four regions combined shows that these rates are very different for large and medium firms on the one
hand and for small firms on the other hand (Figure 1). Job destruction is prevalent among the former, while small
firms seem to overall create more jobs than they seem to destroy. The other point one can take from this figure is
the difference in the importance of entry to overall job creation. While there are some large and medium firms that
are new entrants in both years, the frequency of the net growth rate 2 is small in the distributions of net employment
growth rates for these firms. In contrast, the net growth rate 2, representing entry, is by far the most frequent rate in
the 1997 distribution of net employment growth rates of small firms.5 Much of the difference in job reallocation
existing in large and medium state and privatised firms and small new private firms might be driven by this large
proportion of entrants in the latter ownership form. Therefore, estimated job flow rates are presented for all medium
and large firms, but for all small firms and for continuing small firms separately. It should be kept in mind, however,
that survivor bias might be a problem, i.e. exiting firms are rarely observed in such data sets. Finally, regional
differences in net growth rates of employment are also noteworthy (cf. Figures 2-5). As far as medium and large
firms are concerned these differences are small, as job destruction dominates in all regions. The distributions of net
employment growth rates for small firms, on the other hand, differ substantially by region. In particular Moscow,
but also Chuvashia have a very large fraction of entrants. Hence, much of the job creation in these two regions is
caused by new firms entering the market. Chelyabinsk has a much lower fraction of new entrants and most of its
job creation in the small firms sector comes from relatively small positive net employment changes of continuing
firms.6

11
We conclude this section by briefly characterising the four regions that were chosen for our analysis. The
choice is meant to reflect the diffuse nature of labour market adjustment in various regions of Russia.
The City of Moscow, while interesting as a labour market in its own right given its status as the capital of
the Russian Federation, is also representative of a regional type with a diversified industrial base, like machine
building, light and food industries, production of construction materials and with a developed construction base.
The infrastructure of social services is relatively good, and large centres of science, medicine, education and culture
can be found. Private market structures are also more developed, hence the private employment share is higher than
in other regions. Demographically, this type is characterised by low natural population growth and little migration
activity. Finally, the registered unemployment rate is substantially lower than the average rate in Russia.
Chelyabinsk Oblast is representative of those regions dominated, at least historically, by the military-
industrial complex. Huge enterprises of heavy industry are concentrated there, especially machine building and
metallurgy, and are mainly related to defence. There are many settlements in these regions where the labour force is
entirely dependent on huge multi-profile enterprises. The extremely low rates of restructuring and conversion of
production, plus the dependence on deliveries of semi-finished products and energy from the outside, have been
major determinants in the dramatic drop of production. A high level of hidden unemployment has been maintained
until 1996 through support for some industries from the federal budget.
The Chuvash Republic reflects the economic situation of agro-industrial areas where processing plants are
the main form of industrial enterprise. These areas are not well endowed with minerals and energy sources.
Agriculture is geared mainly towards vegetable growing and cattle breeding and is carried out under economically,
and often also ecologically, non-viable conditions. A relatively high natural population growth and a low degree of
labour mobility can be seen in these regions. The fall in industrial and agricultural production is greater than the
average in the Russian Federation. The infrastructure of social services is underdeveloped while the level of
registered unemployment is much higher than the Russian average.
Finally, Krasnoyarski Krai is typical of the industrially developed regions dominated by extractive
industries, such as oil and gas extraction, timber production, fisheries and fish processing. Agriculture is practically
absent. Output has fallen less rapidly than the average for the Federation. The demographic situation is
characterised by a low rate of natural population growth and a high level of outward migration to more favoured

12
areas of the country, which has risen substantially during the years of economic reform. Most of these regions are in
the northern European and Asian parts of the country and make up a considerable proportion of the Russian
Federation.
III. Job Reallocation across Ownership-types, Industries, Size and Regions
Tables 3 – 5 present various statistics describing job flows in the chosen four Russian regions in 1997 for large and
medium firms. In Table 3 we aggregate across regions along industries and within industry we also look at job
flows by ownership type. As the data cover only three industries out of ten we prefer not to aggregate across
industries along regional or ownership lines and to compute for each industry job creation and destruction rates
separately.7 Since firm size, measured as average employment, seems to be an important determinant of job creation
and destruction in western countries (see e.g. Davis and Haltiwanger 1992), but also in transition economies (see
Konings, Lehmann and Schaffer 1996), size categories are introduced in the remaining two tables. Table 4 presents
the five job flow measures, which were defined above, as well as job creation and destruction shares in two-way
cells (size by industry) while Table 5 presents the same measures in three-way cells (size by industry by ownership).
Large and medium firms in the three industries destroyed many more jobs than they created in 1997 as
Table 3 clearly shows. For manufacturing and mining job destruction was 4 times as large as job creation in 1997,
while in construction this ratio was around 8. Only distribution and trade had with about 6% a substantial job
creation rate in 1997, whilst having a similar job destruction rate as the construction industry. This larger job
creation rate of the former industry can also explain why, on our measure of gross job reallocation, it has a job
reallocation process, which is much more pronounced than in the other two industries. The thus far presented results
also hold across ownership types. A further interesting fact is the relatively low job destruction rate in
manufacturing and mining. If one takes job destruction as a proxy for labour shedding, which seems sensible in the
case of downsizing firms in a transition economy, the data show a manufacturing and mining industry with very
sluggish labour adjustment. It is also interesting that privatised firms do not behave differently in this regard from
state owned firms or firms with mixed domestic ownership. We observe a much larger excess job reallocation rate
in distribution and trade than with the other industries, implying more firm heterogeneity in job reallocation or more

13
“deep restructuring” in this industry. Another interesting result is the fact that in this industry firm heterogeneity or
“deep restructuring” is more prevalent among private, i.e. privatised firms. Finally, in distribution and trade
privatised firms account for around 70% of job creation in 1997, and for around 63% of job destruction. In
manufacturing, mining and construction, on the other hand, the bulk of job creation and destruction occurs in firms
with mixed domestic ownership.
There is a strong negative correlation between firm size and job creation in all three industries: Table 4
shows job creation rates that are monotonically decreasing in size. This is in line with findings in mature economies
but also in other transition economies. A negative correlation also exists for job destruction in manufacturing and
mining and construction. In distribution and trade, on the other hand, no clear pattern emerges as far as size and job
destruction is concerned. The clear lack of relationship between size and net employment growth rate is also
noteworthy. The calculated excess job reallocation rates show, independent of industry, a much stronger job
reallocation process among firms with modest employment levels, while the job flows of large firms are dominated
by job destruction. The larger excess job reallocation rates among smaller firms also imply a more heterogeneous
behaviour of these firms as far as job creation and destruction are concerned. In contrast, large firms in the three
industries are much more uniform in their employment policies: they do not create many new jobs, while destroying
a substantial fraction of the existing jobs. An alternative interpretation of the inverse relationship between excess
job reallocation rate and firm size could be that smaller firms have already shed labour in a substantial way and are
engaged in more “deep restructuring” than larger firms.
In manufacturing and mining a very small job creation rate among large enterprises does not necessarily
mean that large firms did not contribute to the job creation that occurred. The job creation share statistics say that
firms with more than 200 employees created in 1997 around 80% of all jobs created in manufacturing and mining.
In construction and distribution and trade, on the other hand, firms with less than 200 employees contributed with
76% to job creation. As far as job destruction is concerned, very large firms in manufacturing and mining and in
construction destroyed in 1997 most jobs, while in distribution and trade job destruction was much more uniform
across the size distribution.
The three-way cells (size by industry by ownership) presented in Table 5 show very few clear patterns as
far as firm size and job flows are concerned. A negative correlation between size and job creation and job
14
reallocation can be seen only with private firms in manufacturing. With job destruction this correlation is less clear
no matter what the ownership type or the industry. Additional information can be gained from inspecting these
three-way cells, though. Especially in manufacturing and mining and distribution and trade, state firms with less
than 50 employees lag far behind private and mixed firms when it comes to job creation and job destruction. Apart
from state-owned firms in distribution and trade firms with less than 100 employees have the highest job destruction
rates no matter what the industry or the ownership type, reaching a maximum of 31% in 1997 in the case of private
manufacturing firms. In these size categories, similar patterns for excess job reallocation can be observed. What is
also noteworthy is the fact that private and mixed firms with more than 2000 employees destroyed a large fraction of
their existing jobs in the industries construction and distribution and trade, varying between one fifth and one third
of all jobs. Clearly, large firms in manufacturing and mining were much more conservative in 1997 when it came to
eliminating jobs. Enterprises with more than 2000 employees in construction and distribution and trade created no
new jobs in 1997. With respect to manufacturing and mining as well as distribution and trade we observe, however,
that, irrespective of ownership type, the largest job creation shares can be found in medium-sized firms. Finally, in
manufacturing despite a conservative employment policy among large firms between a third and half of all jobs,
which were eliminated in 1997, were destroyed by firms with more than 2000 employees.
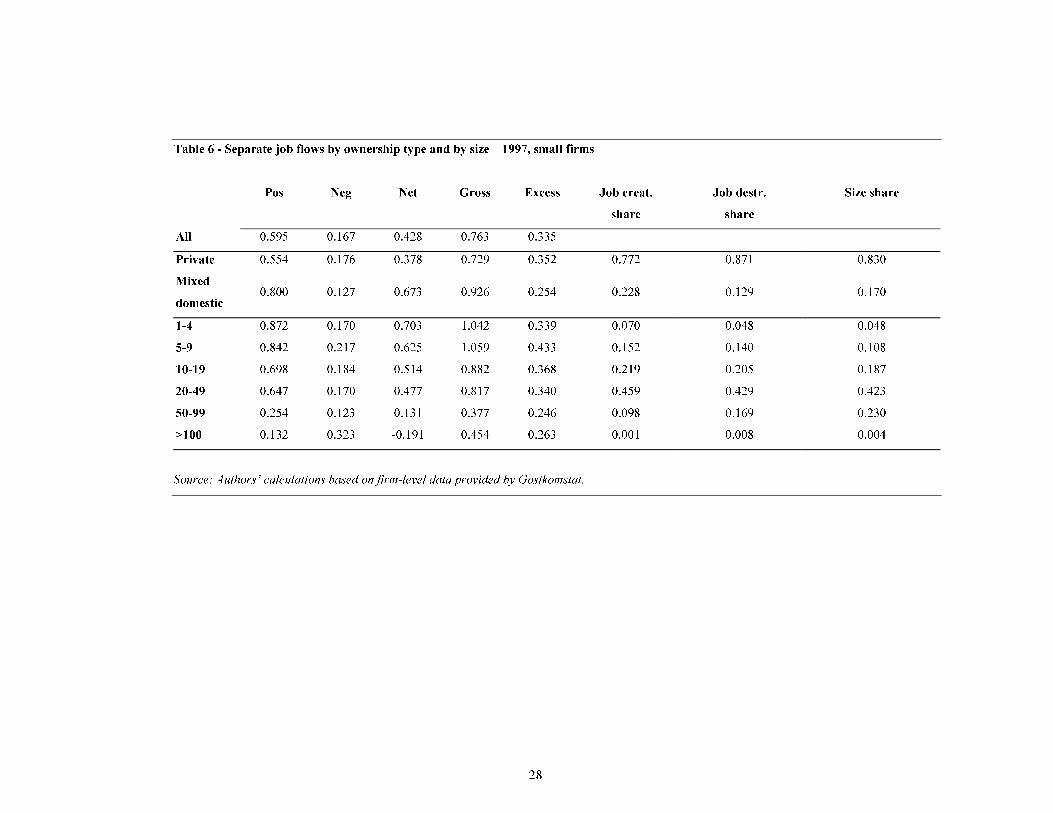
Figures 1-5 suggest that job flows are different for small firms in general and for continuing small firms.
Therefore, estimates of job flow measures for the two groups are presented separately. The data for small firms are
here aggregated over the three industries; disaggregated analysis is confined to the regressions in the next section.
Tables 6 and 7 present one-way cells of ownership type and size categories, Tables 8 and 9 two-way cells of
ownership by size for the two groups of firms. Figures 2, 4 and 5 also show differences in regional performance as
far as the net employment growth of small firms is concerned. Hence Tables 10 and 11 show the four basic job
flow measures8 for all small firms and continuing small firms respectively in three regions. One needs to stress,
though, that these job flow measures are calculated only for the three industries of the regional economies for which
we have collected data.
Tables 6 and 7 show the surprising result that both in terms of job creation and job destruction “mixed
domestic firms”, i.e. firms owned by the state and by private residents, perform better than “private firms”, i.e. new
private firms. When we take all firms, the job creation rate is about 25 percentage points higher, the job destruction

15
rate about 5 percentage points lower for mixed firms. This superior performance of mixed firms is still present
when we estimate these measures for continuing small firms only, however, it becomes less pronounced. When we
look at all small firms job creation is monotonically decreasing in size as is net employment growth. This inverse
relationship between size and these two job flow measures disappears when we restrict ourselves to continuing
firms. It is important to note that the positive net employment growth for firms with less than 100 employees is
entirely due to entry as a comparison of column 3 in Tables 6 and 7 makes apparent. In other words, continuing
small firms destroy more jobs than they create and most of the job creation observed in the three regions for which
data are available relates to new firms entering the labour market. Many of the jobs in small continuing firms are
precarious as more than one fifth of all jobs are destroyed in a year. A comparison of job flows of small continuing
firms and of medium and large firms of comparable size (columns 1 and 2 in Table 4) makes clear that the job
creation performance of the former are not spectacularly better than the performance of the latter. Small continuing
firms create more jobs, but destroy them at similar levels leading to an only slightly larger (less negative) net
employment growth rate.
The excess job reallocation rate, which we take in the case of small firms as a measure of firm
heterogeneity rather than of “deep restructuring”,9 is larger than the rate for medium and large firms of comparable
size, 10
whether all or only continuing firms are considered. This is what we would expect; small, mainly new firms
show more heterogeneity in job creation than do older, established firms. Especially for continuing firms this
heterogeneity is not a function of size. Finally, inspection of the last three columns in Tables 6 and 7 shows that
new private firms are under-represented as far as job creation is concerned, but that they have more than their
proportional job destruction share. One can also infer from these columns that firms, which employ between 20 and
49 employees, create and destroy the lion shares of jobs, but that these shares are approximately proportional to their
size share.
When interacting ownership with size in Tables 8 and 9, the same results are obtained as previously with
respect to the job creation rates. With all small firms pos is monotonically decreasing in size for both private and
mixed firms that have less than 100 employees. This inverse relationship disappears when we look only at
continuing firms. So most of the job creation occurring in the new private sector comes through the self-employed
hiring a small number of employees. For private and mixed continuing firms the excess job reallocation rate points

16
to heterogeneity in job reallocation, which does not depend on size. Firms with between 20 and 49 employees
dominate job creation in particular in the case of mixed ownership with a job creation share of more than one half in
both samples. It is also noteworthy that in this size category mixed firms perform decisively better than private
firms do as far as net employment growth is concerned. Even in the case of continuing firms net employment
growth is still positive with 3% whilst private firms have a net employment growth rate of roughly –11%.
As noted above, net job flows of small firms vary across regions. Hence we present the basic job flow
measures (pos, neg) and the job creation and destruction shares for ownership and size classes by region. With the
entire sample of small firms Moscow performs particularly well, Chelyabinsk particularly poorly as far as job
creation and job destruction are concerned. A comparison of the first rows of Tables 10 and 11 shows that this
difference in performance nearly disappears when we exclude entering firms. So, entry of new firms is absolutely
crucial for the better performance of small firms in Moscow. In all three regions private firms create less jobs and
destroy more jobs than do mixed firms even if this difference in performance becomes much weaker with continuing
firms only. For both samples job creation is inversely related to size in Moscow, but not in the other two regions.
Finally in all three regions firms of employee size between 20 and 49 dominate both job creation and job
destruction. In Chelyabinsk, though, this size class has not only a much larger job destruction share than in the other
two regions, but also a large negative employment growth rate (in absolute value) in both samples. So, the poor
performance of Chelyabinsk should be related to poorly performing firms of this size class that performs well
elsewhere.
The job flow measures presented offer many insights into the job creation and destruction behaviour of
MLEs and small firms. However, the presented results have many facets and it is not always easy to disentangle the
effects of ownership, industry, size and region on employment growth. Using regression analysis we try to establish
the determinants of employment growth in a rigorous fashion in the next section.
IV. Determination of Employment Growth: Ownership, Size and Regional Effects

17
The rates calculated to measure job creation, destruction and reallocation are all based on net growth rates at the
enterprise level. It is possible therefore to take advantage of the variation across individual firms to establish the
underlying determinants of job creation. In the industrial organisation literature there exists a large body of research
analysing firm growth, looking at the relationship between firm level growth rates and initial size.11
Following
Konings, Lehmann and Schaffer (1996) we extend this analysis by including ownership effects. The firm-level
growth rate is then a function of firm size and ownership type. One hypothesis, which we wish to test, says that in
transition economies new private firms behave differently to firms of all other ownership types: they are more
dynamic than state-owned and privatised firms and contribute, relative to their employment share, disproportionately
to positive employment growth. We are also interested in the question whether regional location matters for Russian
firms' performance once we control for industrial composition, size and ownership factors. Lehmann, Wadsworth
and Acquisti (1999) showed that the labour market experience of workers varies dramatically across Russian
regions. Here, we would like to see whether and how the regional environment affects dynamic labour demand of
firms that belong to different industries and ownership types.
We estimate a class of models, which in its most restricted form is:
git = α0 + α1ln(xit) + α2 ownershipi + α3 ln(xit) ⋅ ownershipi + uit
(4)
where git is the net growth rate of firm i in year t defined in (1), xit is the average employment of firm i over year t
and ownershipi is an indicator for the ownership category into which firm i falls,12
while uit is an error term which
we assume to be independently and normally distributed. Average employment is used rather than initial
employment to avoid Galton’s fallacy of regression towards the mean.13
Regional dummies and industry dummies
are added to the list of regressors. In manufacturing and mining we have branch identifiers which allow us to control
for a finer industrial structure.
A thus augmented version of equation (4) is first estimated for the joint data of medium and large
enterprises and small firms. These data represent the ‘combined full’ data set. We then look at the determination of
the net growth rates using a smaller data set that includes continuing firms only, 14
representing the “combined” data
set. Finally we investigate how size and ownership type impact on employment growth in medium and large firms.
These estimations are done for all MLEs and for continuing MLEs separately.

18
One econometric issue needs to be mentioned in connection with these estimations. In equation (4) the
average annual employment, xit, appears both on the left-hand and the right-hand side. If an important component of
uit is measurement error, which is very likely with this kind of data, then xit will be correlated with the error term,
and the coefficient estimates on the ownership variables and the interaction terms will be inconsistent. Following
Durbin (1955), we use the size ranking of the firm as an instrument for the average annual employment and hope to
eliminate this potential measurement error problem. We perform Hausman tests to determine whether measurement
error is present. If the null hypothesis of no measurement error is rejected by the test, OLS estimation is
inappropriate and only Instrumental Variables (IV) estimation produces consistent coefficients.
Tables 12 and 13 show results of weighted regressions for the pooled data of medium and large and small
firms. As the small firms data set consists of around 10% of all small firms in a region while medium and large
firms data are collected in a census like fashion, we give the small firms a weight that is 10 times as large as medium
and large firms. Since we do not have any data on small firms in Krasnoyarsk we use this region as the default
category in these pooled regressions.15
The results of the regressions seem robust to the estimation method for both
the full data set and continuing firms as far as significance levels are concerned. However, the Instrumental
Variables estimation gives larger values of the significant coefficients (in absolute value) and going from OLS to IV
estimation the sign of the coefficients also changes sometimes. From very different values and changing signs of
coefficients one can infer that OLS estimation gives inconsistent results. The performed Hausman tests also confirm
this: in the case of the “full combined” data set (Table 12) the null hypothesis is strongly, in the case of the
“combined” data set (Table 13) moderately rejected. In both regressions the results of the IV estimation should,
therefore, be preferred.
Size per se is clearly not a predictor of net employment growth in both Tables 12 and 13. Only when size
is interacted with ownership in Table 12 do we see a significant positive effect of size for all firms. At first sight it
seems quite surprising that private and mixed firms have a lower net employment growth than state-owned firms do.
However, the coefficients on the variables private and mixed relate to all firms, medium and large and small. Once
ownership is interacted with small firms we see very large and significant ownership effects in the “full combined”
data set of Table 12. These ownership effects clearly dominate all other effects and generate, for moderate levels of
employment, positive net growth rates. Inspection of the coefficients on triple interactions of size, small firm and

19
private ownership allows one to see that at employment levels exceeding e.g. 50 employees the predicted net growth
rate can be negative. A firm located in Moscow has on average a 25 percentage points higher net employment
growth than a firm located in Krasnoyarsk whilst Chuvashia and particularly Chelyabinsk perform worse than
Krasnoyarsk in this respect (by 20 and 50 percentage points respectively), even after size, ownership and industry
effects are taken into account.
The results of the pooled regression for continuing firms are quite different. The significant coefficients are
substantially smaller than in the case of the “full combined” data set. Also, the coefficients on the mixed ownership
dummy and its interaction terms with size and small are apart from the interaction term mixed*small in the
instrumental variables estimation no longer significant. Continuing firms both in Moscow and Chuvashia perform
now better than Krasnoyarsk, albeit only slightly, whilst a continuing firm located in Chelyabinsk is ceteris paribus
not different from such a firm located in Krasnoyarsk. Having controlled for ownership, size and regional location,
construction performs substantially worse, the food industry slightly better than the default industrial branch, energy
and mining. The main difference to the regression results using the “full combined” data set relates to the coefficient
estimates on the double and triple interaction terms that involve small firms. Inspection of the consistent
instrumental variables estimates shows that the sign of the coefficient on the term that interacts private ownership
and small firm becomes negative while the coefficient on the triple interaction term lnsize*small*private takes a
positive value. As far as continuing firms are concerned, small new private firms perform only better than large or
medium-sized state-owned or mixed firms do, when they are relatively large. When we look at all firms, including
those that just entered, the reverse seems to be the case. Small new private but also small mixed firms with relatively
few employees create more jobs than do large or medium-sized state-owned firms.
Table 14 presents some predicted net employment growth rates for firms with selected characteristics. The
predictions are based on significant coefficients of the regressions in Tables 12 and 13 and allow us to calculate size-
dependent net growth rate differentials. One of the most striking results from these predictions in the case of all
firms is the very good performance of small firms with mixed ownership that have 10 employees, which is the
average employment level of this firm type. Mixed firms of this size perform slightly better than small private firms
of a comparable size and much better than state-owned or private medium and large firms. Moreover, the size-
dependent differentials between large and medium state and mixed firms on the one hand and small private firms on

20
the other hand can be very small in the case of continuing firms. For example, if one conditions the net growth rate
of small private firms on an employment size of 10 employees, which is roughly the average size of such firms (see
Table 2), the predicted net growth rate is very close to the rate of the default category, encompassing here large and
medium-sized state-owned and mixed enterprises. On the other hand, if one conditions on an employment size of
100, new private firms (they can hardly be called small in this case) have a predicted annual growth rate that is more
than 40% points larger than the respective rate of large and medium-sized state-owned and mixed enterprises. The
slightly better performance of small private firms in Chuvashia relative to similar firms in Moscow is also
noteworthy and seems at first glance quite surprising. One explanation could be that Chuvashia, which has a long
border with Tatarstan, benefits from that region’s relatively harsh conditions for small businesses as Tatarstan
residents pursue their business interests in the more business-friendly Chuvashian environment.16
The first main point that transpires from Table 14 is the excellent growth performance of small private and
mixed firms that have 10 employees, if entrants are included in the analysis. In this case, private and mixed firms of
this size, which is representative for small private and mixed firms, have a predicted net employment growth rate
exceeding 1. We also learn from the table that, if we restrict the analysis to continuing firms, small mixed firms, no
matter what their size, no longer outperform large and medium-sized state-owned and mixed enterprises. Small
private continuing firms only do this if they are of a size that is unrepresentative for such firms (50-100 employees).
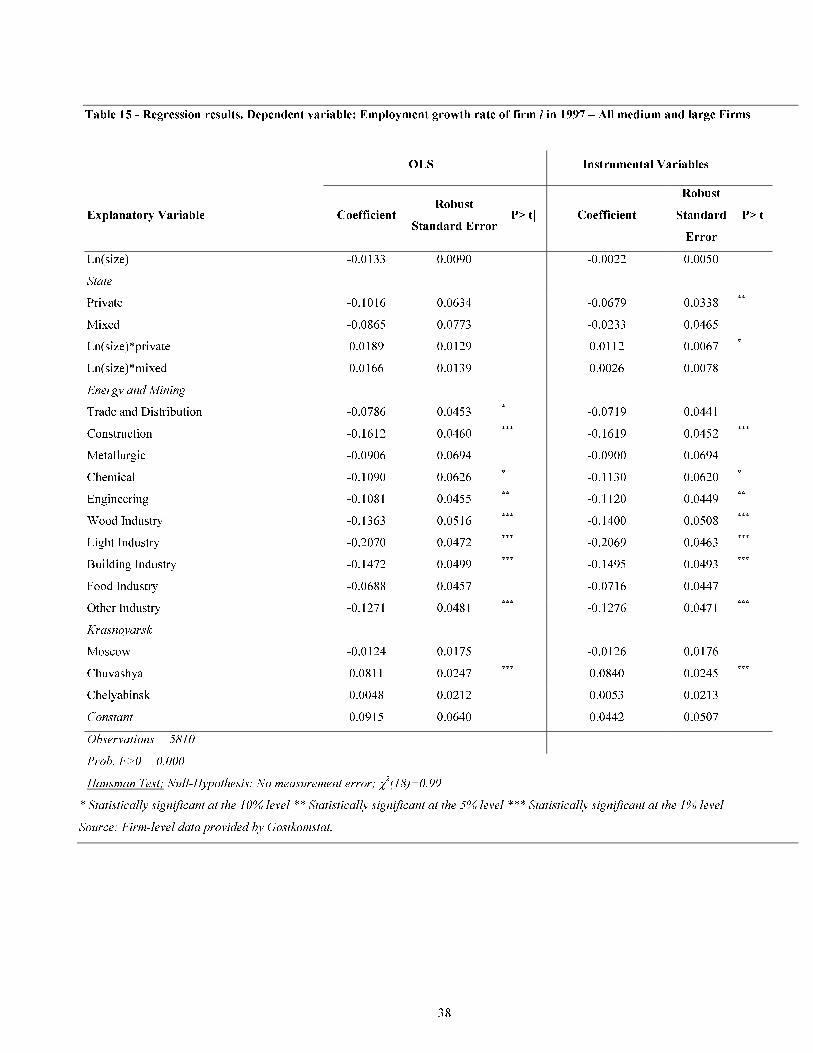
The regressions for medium and large firms in Tables 15 and 16 show for all firms and for continuing firms
coefficient estimates that are quite similar when one goes from OLS to IV estimation. Furthermore, both Hausman
tests do not reject the null hypothesis of no measurement error implying consistent coefficients independent of the
estimation method used. The regressions also show that size by itself does not predict net employment growth.
From Table 15, and in particular from Table 16, it is also possible to see that state-owned firms actually create more
jobs than private (overwhelmingly privatised) and mixed firms, albeit the ownership effects are rather small. Size
interacted with private ownership compensates somewhat for the negative ownership effect such that a large
privatised firm (with for example more than 500 employees) can overtake a state-owned firm of any size. A large or
medium-sized firm located in Chuvashia performs slightly better than such firms do in the other regions. Being
located in Moscow does not improve net employment growth for a medium-sized or large firm. Finally, relative to
energy and mining the industries trade/distribution and construction as well as all other branches within

21
manufacturing perform substantially worse on our measure of net employment growth.
There are maybe two competing explanations for the better performance of large and medium-sized firms
located in Chuvashia or in the industrial branch of energy and mining. Once we have controlled for ownership, size
and industrial sector and branches, the better performance of these firms in Chuvashia could be related to an
economic environment that is more conducive to job creation, keeping negative net employment growth at a lower
level in absolute value than in the other regions.17
Alternatively one could moot that the environment in Chuvashia
allows enterprises to resist labour shedding more than elsewhere. Competing explanations along the same lines
could be given for the better performance of the energy and mining sector. While our analysis does not permit us to
distinguish rigorously between these two explanations, there seems to be some evidence that in the case of energy
and mining the second explanation might apply. This industrial branch was the only one in 1997 that actually had
positive net employment growth. While it had an average job creation rate it had a very small job destruction rate of
1.3% compared with an average rate of 12.1% for all large and medium-sized firms in the four regions. So, labour
shedding seems be strongly resisted in this industrial branch.
V. Conclusions
In this paper we have used unique micro-evidence to explore gross job flows in four representative regions of the
Russian Federation in 1997. While this evidence is quite preliminary, some interesting facts have been established.
Figures 1 – 5 and Tables 3-11 demonstrate that medium and large firms are mainly destroying jobs while
small firms contribute significantly to job creation in the country. If we assume that private firms in the data set of
medium and large firms are mainly privatised and that private firms in the sample of small firms are mainly new
private firms, we can also see a clear difference in the job creation performance of these two types of private firms.
Privatised firms are no better than state-owned firms whilst new private firms have a decisively superior record
relative to these firms when it comes to job creation.
As is also clear from the analysis, much of this better performance is due to entry into the labour market.
Entry actually seems to drive many of the presented results: the surprisingly good performance of small firms with

22
mixed ownership is mainly due to entry. Also, the spectacular job creation rate of small firms in Moscow vanishes
if we exclude entering firms. In future work, when more waves of the data will be available it will be particularly
important to investigate the entry and exit behaviour of small firms.
What seems already clear from the evidence is that the job creation capacity of continuing new private
firms is not really different from that of firms of other ownership types. This result is in contrast with the empirical
evidence that has been gathered on other transition countries. Konings, Lehmann and Schaffer (1996) found for
Poland during the early phase of transition that new private firms were more dynamic when it came to job creation, a
result also found for Bulgaria and Romania by Bilsen and Konings (1998). Another interesting result from a
comparative perspective is the high job destruction rate of continuing new private Russian firms. In the cited paper
by Bilsen and Konings, which uses a small sample of surveyed firms, annual job destruction rates of new private
firms never exceed 5% while Russian new private firms destroy roughly 20% of their stock of jobs in a year. So, the
labour market experience for Russian workers who have found employment in new private firms is probably a lot
more volatile than the experience of their colleagues in other transition countries given the tenuous nature of many
of the jobs.
The regression results showed that continuing new private firms outperformed privatised and state-owned
firms only when they were atypically large. These results also pointed to a rather uniform and very poor job creation
performance of large and medium-sized firms across regions and industries. There was no difference in this poor
performance of state-owned and privatised enterprises and those firms with mixed ownership. The main result
coming out of the regressions deals also with the ambiguous performance of new private firms. Only if entrants are
included, is the typically sized new private firm creating more net employment than any other type of firm. With
new private firms, which already were in the labour market a year earlier, this superior net employment growth
disappears once we control for industry, size and region. In the light of the empirical literature on ownership effects
on job creation in other transition countries this is a surprising outcome. More research with more extended data
sets is needed to validate and to understand this outcome better.

23
Table 1 - Description of large and medium firms according to ownership type – 1997
Total
Employment* Number of Firms Average Employment Employment share** Frequency**
All Manufacturing, mining 1364033 2029 672 0.67 0.35
Construction 438068 1162 377 0.22 0.20
Distribution trade 229133 2635 87 0.11 0.45
State*** Manufacturing, mining 209654 644 326 0.15 0.32
Construction 95352 362 263 0.24 0.31
Distribution trade 51527 913 56 0.23 0.35
Private Manufacturing, mining 236686 425 557 0.17 0.21
Construction 116263 335 347 0.29 0.29
Distribution trade 139113 1547 90 0.61 0.59
Mixed Manufacturing, mining 917694 960 956 0.67 0.47
Domestic Construction 186865 464 403 0.47 0.40
Distribution trade 37881 170 223 0.17 0.06
• Calculated as yearly average total employment.
• ** Ownership shares and frequencies refer to the total for a given industry.
*** The ownership category of 3 firms in 1997 could not be identified.
Source: Authors’ calculations based on firm-level data provided by Gostkomstat.

24
Table 2 - Description of random sample of small firms according to ownership type – 1997
All** Private Mixed domestic
Total Employment* 54175 44979 9197
40339 34380 5960
Number of Firms 5163 4512 650
3755 3359 395
Average Employment 10.5 9.9 14.1
10.7 10.2 15.1
Employment share 0.83 0.17
0.85 0.15
Frequency 0.87 0.13
0.89 0.11
* Calculated as yearly average total employment.
** In italics: continuing firms.
**** The ownership category of 1 firm in 1997 could not be identified.
Source: Authors’ calculations based on firm-level data provided by Gostkomstat.

25
Table 3 - Job flows by ownership type and industry – 1997, large and medium firms
Industry All State Private Mixed domestic
Pos Manuf., mining 0.026 0.026 0.033 0.024
Construction 0.020 0.013 0.022 0.026
Distr., trade 0.063 0.045 0.071 0.032
Neg Manuf., mining 0.100 0.099 0.104 0.099
Construction 0.167 0.143 0.180 0.180
Distr., trade 0.157 0.122 0.162 0.190
Net Manuf., mining -0.075 -0.073 -0.071 -0.076
Construction -0.147 -0.131 -0.158 -0.154
Distr., trade -0.094 -0.076 -0.091 -0.158
Gross Manuf., mining 0.126 0.125 0.137 0.123
Construction 0.187 0.156 0.202 0.206
Distr., trade 0.220 0.167 0.233 0.222
Excess Manuf., mining 0.051 0.052 0.065 0.047
Construction 0.039 0.025 0.045 0.052
Distr., trade 0.126 0.091 0.143 0.064
Job creat. Manuf., mining 0.156 0.221 0.623
share* Construction 0.138 0.302 0.560
Distr., trade 0.164 0.695 0.085
Job destr. Manuf., mining 0.152 0.180 0.668
share* Construction 0.200 0.307 0.493
Distr., trade 0.174 0.626 0.200
* Shares refer to the total for a given industry and add up to 1 across ownership categories.
Source: Authors’ calculations based on firm-level data provided by Gostkomstat.

26
Table 4 - Job flows by size and industry – 1997, large and medium firms
Industry 1-49 50-99 100-199 200-499 500-999 1000-1999 >2000
Pos Manuf., mining 0.081 0.078 0.070 0.055 0.039 0.024 0.011
Construction 0.097 0.093 0.056 0.037 0.034 0.002 0
Distr., trade 0.101 0.076 0.088 0.064 0.018 0 0
Neg Manuf., mining 0.193 0.184 0.145 0.136 0.111 0.114 0.080
Construction 0.283 0.224 0.179 0.136 0.147 0.127 0.174
Distr., trade 0.150 0.170 0.143 0.125 0.131 0.203 0.239
Net Manuf., mining -0.112 -0.106 -0.075 -0.081 -0.072 -0.090 -0.069
Construction -0.187 -0.131 -0.123 -0.099 -0.113 -0.125 -0.174
Distr., trade -0.049 -0.093 -0.055 -0.062 -0.113 -0.203 -0.239
Gross Manuf., mining 0.274 0.262 0.214 0.192 0.150 0.138 0.090
Construction 0.380 0.316 0.236 0.172 0.180 0.129 0.174
Distr., trade 0.250 0.246 0.230 0.189 0.148 0.203 0.239
Excess Manuf., mining 0.162 0.156 0.139 0.111 0.079 0.048 0.021
Construction 0.193 0.185 0.112 0.074 0.067 0.004 0
Distr., trade 0.201 0.153 0.175 0.127 0.035 0 0
Job creat. Manuf., mining 0.016 0.051 0.136 0.260 0.189 0.118 0.231
share* Construction 0.082 0.184 0.291 0.277 0.159 0.007 0
Distr., trade 0.316 0.220 0.225 0.212 0.027 0 0
Job destr. Manuf., mining 0.010 0.031 0.072 0.163 0.136 0.143 0.446
share* Construction 0.028 0.053 0.109 0.121 0.082 0.046 0.561
Distr., trade 0.188 0.195 0.147 0.167 0.081 0.065 0.156
* Shares refer to the total for a given industry and add up to 1 across ownership categories.
Source: Authors’ calculations based on firm-level data provided by Gostkomstat.

27
Table 5 - Job flows by size, industry and ownership – 1997, large and medium firms
Pos Neg Net Excess Job creat.
share*
Job destr.
share*
Size Ownership Man Cons Dist Man Cons Dist Man Cons Dist Man Cons Dist Man Cons Dist Man Cons Dist
1- State 0.035 0.085 0.067 0.149 0.301 0.074 -0.114 -0.216 -0.007 0.069 0.170 0.134 0.030 0.243 0.468 0.034 0.075 0.193
49 Private 0.149 0.085 0.112 0.311 0.276 0.191 -0.162 -0.190 -0.079 0.299 0.171 0.224 0.012 0.049 0.308 0.008 0.020 0.231
Mixed domestic 0.194 0.120 0.254 0.277 0.263 0.223 -0.083 -0.143 0.031 0.389 0.239 0.446 0.014 0.060 0.334 0.005 0.019 0.050
50- State 0.062 0.021 0.066 0.140 0.253 0.096 -0.078 -0.231 -0.031 0.124 0.043 0.131 0.105 0.098 0.177 0.062 0.101 0.098
99 Private 0.143 0.065 0.070 0.170 0.220 0.178 -0.027 -0.155 -0.108 0.286 0.130 0.140 0.081 0.112 0.227 0.030 0.047 0.253
Mixed domestic 0.062 0.164 0.124 0.235 0.204 0.242 -0.173 -0.040 -0.118 0.124 0.329 0.248 0.026 0.245 0.306 0.023 0.044 0.101
100- State 0.037 0.029 0.082 0.113 0.142 0.158 -0.077 -0.113 -0.076 0.073 0.058 0.165 0.121 0.232 0.193 0.099 0.100 0.138
199 Private 0.079 0.044 0.093 0.137 0.190 0.139 -0.058 -0.146 -0.046 0.158 0.087 0.186 0.177 0.301 0.253 0.097 0.164 0.167
Mixed domestic 0.083 0.085 0.057 0.166 0.189 0.152 -0.082 -0.104 -0.095 0.167 0.170 0.114 0.125 0.299 0.209 0.059 0.096 0.094
200- State 0.030 0.020 0.029 0.109 0.124 0.152 -0.079 -0.105 -0.122 0.059 0.040 0.059 0.195 0.245 0.158 0.188 0.135 0.303
499 Private 0.078 0.040 0.064 0.144 0.131 0.108 -0.066 -0.090 -0.044 0.156 0.081 0.128 0.395 0.308 0.177 0.229 0.124 0.133
Mixed domestic 0.056 0.043 0.019 0.144 0.144 0.149 -0.088 -0.102 -0.130 0.112 0.085 0.039 0.228 0.269 0.120 0.139 0.131 0.156
500- State 0.028 0.016 0.002 0.077 0.154 0.235 -0.049 -0.138 -0.233 0.055 0.033 0.003 0.124 0.183 0.004 0.091 0.151 0.218
999 Private 0.025 0.053 0.030 0.111 0.124 0.088 -0.086 -0.071 -0.059 0.050 0.106 0.060 0.121 0.230 0.035 0.168 0.067 0.046
Mixed domestic 0.047 0.034 0.008 0.119 0.157 0.107 -0.072 -0.123 -0.099 0.094 0.068 0.015 0.230 0.115 0.030 0.138 0.076 0.072
1000- State 0.063 0 0 0.132 0.179 0.095 -0.069 -0.179 -0.095 0.126 0 0 0.363 0 0 0.199 0.090 0.019
1999 Private 0.026 0 0 0.077 0.217 0.236 -0.051 -0.217 -0.236 0.052 0 0 0.166 0 0 0.153 0.030 0.075
Mixed domestic 0.010 0.003 0 0.129 0.091 0.171 -0.119 -0.087 -0.171 0.019 0.007 0 0.040 0.012 0 0.127 0.046 0.073
>2000 State 0.004 0 0 0.079 0.113 0.052 -0.075 -0.113 -0.052 0.008 0 0 0.061 0 0 0.328 0.348 0.031
Private 0.004 0 0 0.087 0.197 0.331 -0.083 -0.197 -0.331 0.008 0 0 0.048 0 0 0.316 0.549 0.096
Mixed domestic 0.012 0 0 0.079 0.206 0.245 -0.066 -0.206 -0.245 0.025 0 0 0.338 0 0 0.509 0.589 0.454
* Shares refer to the total for a given industry and ownership type and add up to 1 across row entries in the corresponding ownership category.
Source: Authors’ calculations based on firm-level data provided by Gostkomstat.
28
Table 6 - Separate job flows by ownership type and by size – 1997, small firms
Pos Neg Net Gross Excess Job creat.
share
Job destr.
share
Size share
All 0.595 0.167 0.428 0.763 0.335
Private 0.554 0.176 0.378 0.729 0.352 0.772 0.871 0.830
Mixed
domestic 0.800 0.127 0.673 0.926 0.254 0.228 0.129 0.170
1-4 0.872 0.170 0.703 1.042 0.339 0.070 0.048 0.048
5-9 0.842 0.217 0.625 1.059 0.433 0.152 0.140 0.108
10-19 0.698 0.184 0.514 0.882 0.368 0.219 0.205 0.187
20-49 0.647 0.170 0.477 0.817 0.340 0.459 0.429 0.423
50-99 0.254 0.123 0.131 0.377 0.246 0.098 0.169 0.230
>100 0.132 0.323 -0.191 0.454 0.263 0.001 0.008 0.004
Source: Authors’ calculations based on firm-level data provided by Gostkomstat.

29
Table 7 - Separate job flows by ownership type and by size – 1997, continuing small firms
Pos Neg Net Gross Excess Job creat.
share
Job destr.
share Size share
All 0.126 0.211 -0.085 0.338 0.253
Private 0.122 0.216 -0.094 0.338 0.244 0.821 0.868 0.852
Mixed
domestic 0.153 0.190 -0.036 0.343 0.307 0.179 0.132 0.148
1-4 0.133 0.231 -0.098 0.364 0.266 0.039 0.041 0.038
5-9 0.126 0.328 -0.202 0.454 0.252 0.088 0.137 0.088
10-19 0.134 0.261 -0.127 0.395 0.268 0.185 0.216 0.175
20-49 0.134 0.217 -0.084 0.351 0.267 0.430 0.418 0.408
50-99 0.111 0.133 -0.022 0.244 0.222 0.251 0.180 0.286
>100 0.132 0.323 -0.191 0.454 0.263 0.006 0.009 0.006
Source: Authors’ calculations based on firm-level data provided by Gostkomstat.

30
Table 8 - Job flows by size and ownership – 1997, small firms
Size Ownership Pos Neg Net Gross Excess Job creat.
share*
Job destr.
share*
1-4 Private 0.857 0.169 0.688 1.026 0.338 0.081 0.050
Mixed without
foreign 1.019 0.173 0.846 1.192 0.345 0.033 0.035
5-9 Private 0.789 0.229 0.559 1.018 0.459 0.159 0.145
Mixed without
foreign 1.161 0.141 1.020 1.303 0.283 0.132 0.101
10-19 Private 0.633 0.186 0.447 0.819 0.372 0.216 0.200
Mixed without
foreign 1.037 0.172 0.865 1.209 0.344 0.229 0.239
20-49 Private 0.590 0.186 0.404 0.776 0.373 0.441 0.439
Mixed without
foreign 0.892 0.099 0.792 0.991 0.198 0.520 0.364
50-99 Private 0.244 0.126 0.118 0.369 0.251 0.102 0.165
Mixed without
foreign 0.307 0.109 0.198 0.416 0.218 0.087 0.195
>100 Private 0.308 0 0.308 0.308 0 0.001 0
Mixed
without
foreign
0 0.563 -0.563 0.563 0 0 0.065
* Shares refer to the total for a given ownership type.
Source: Authors’ calculations based on firm-level data provided by Gostkomstat.

31
Table 9 - Job flows by size and ownership – 1997, continuing small firms
Size Ownership Pos Neg Net Gross Excess Job creat.
share*
Job destr.
share*
1-4 Private 0.131 0.233 -0.102 0.364 0.262 0.044 0.044
Mixed without
foreign 0.155 0.197 -0.043 0.352 0.309 0.019 0.020
5-9 Private 0.125 0.334 -0.209 0.459 0.250 0.095 0.144
Mixed without
foreign 0.139 0.275 -0.136 0.414 0.278 0.056 0.089
10-19 Private 0.137 0.251 -0.114 0.388 0.274 0.204 0.211
Mixed without
foreign 0.111 0.337 -0.226 0.448 0.222 0.101 0.247
20-49 Private 0.122 0.228 -0.106 0.350 0.244 0.402 0.425
Mixed without
foreign 0.195 0.161 0.033 0.356 0.323 0.561 0.376
50-99 Private 0.108 0.135 -0.027 0.243 0.216 0.249 0.176
Mixed without
foreign 0.128 0.121 0.007 0.248 0.241 0.263 0.201
>100 Private 0.308 0.000 0.308 0.308 0.000 0.007 0.000
Mixed
without
foreign
0.000 0.563 -0.563 0.563 0.000 0.000 0.067
* Shares refer to the total for a given ownership type.
Source: Authors’ calculations based on firm-level data provided by Gostkomstat.

32
Table 10 - Separate job flows by ownership type and by size – 1997, small firms
Moscow Chelyabinsk Chuvashya
Pos Neg Job creat.
Share
Job destr.
Share Pos Neg
Job creat.
Share
Job destr.
Share Pos Neg
Job creat.
Share
Job destr.
Share
All 0.802 0.147 0.867 0.566 0.159 0.231 0.065 0.334 0.355 0.147 0.068 0.100
Private 0.771 0.152 0.772 0.828 0.143 0.244 0.791 0.929 0.306 0.155 0.754 0.922
Mixed
domestic 0.928 0.128 0.228 0.172 0.280 0.137 0.209 0.071 0.707 0.093 0.246 0.078
1-4 1.113 0.150 0.059 0.043 0.373 0.254 0.114 0.053 0.783 0.117 0.166 0.060
5-9 1.179 0.163 0.154 0.116 0.234 0.354 0.172 0.178 0.375 0.197 0.111 0.141
10-19 0.962 0.162 0.225 0.206 0.131 0.229 0.155 0.187 0.405 0.214 0.205 0.261
20-49 0.870 0.141 0.466 0.413 0.151 0.267 0.384 0.468 0.374 0.135 0.448 0.391
50-99 0.331 0.131 0.096 0.206 0.116 0.109 0.176 0.113 0.100 0.109 0.056 0.147
>100 0.000 0.563 0.000 0.015 0.308 0.000 0.014 0.000
Source: Authors’ calculations based on firm-level data provided by Gostkomstat.

33
Table 11 - Separate job flows by ownership type and by size – 1997, continuing small firms
Moscow Chelyabinsk Chuvashya
Pos Neg Job creat.
Share
Job destr.
Share Pos Neg
Job creat.
Share
Job destr.
Share Pos Neg
Job creat.
Share
Job destr.
Share
All 0.136 0.214 0.590 0.557 0.095 0.228 0.235 0.337 0.162 0.164 0.175 0.106
Private 0.135 0.214 0.821 0.822 0.091 0.238 0.842 0.926 0.144 0.169 0.793 0.923
Mixed
domestic 0.137 0.215 0.179 0.178 0.132 0.149 0.158 0.074 0.317 0.120 0.207 0.077
1-4 0.187 0.238 0.043 0.035 0.052 0.258 0.022 0.046 0.145 0.169 0.049 0.056
5-9 0.168 0.323 0.089 0.108 0.090 0.373 0.105 0.182 0.097 0.230 0.060 0.142
10-19 0.156 0.287 0.191 0.222 0.095 0.226 0.191 0.190 0.150 0.248 0.161 0.262
20-49 0.139 0.211 0.413 0.397 0.089 0.261 0.377 0.462 0.210 0.149 0.559 0.393
50-99 0.111 0.148 0.264 0.222 0.116 0.109 0.305 0.120 0.100 0.109 0.136 0.147
>100 0.000 0.563 0.000 0.016 0.308 0.000 0.035 0.000
Source: Authors’ calculations based on firm-level data provided by Gostkomstat.


35
Table 12 - Weighted regression results. Dependent variable: Employment growth rate of firm i in 1997 – All Firms
OLS
Instrumental Variables
Explanatory Variable Coefficient Robust
Standard Error P>|t| Coefficient
Robust
Standard Error P>|t|
ln(size) -0.0166 0.0107
-0.0033 0.0076
State
Private -0.4713 0.0774 ***
-0.3064 0.0462 ***
Mixed -0.1522 0.0883 *
-0.0192 0.0587
Large and State
Private*small 1.4685 0.0781 ***
3.2176 0.2430 ***
Mixed*small 1.2619 0.1271 ***
3.1147 0.5836 ***
Ln(size)*private 0.0998 0.0161 ***
0.0710 0.0102 ***
Ln(size)*mixed 0.0447 0.0164 ***
0.0185 0.0108 *
Ln(size)*small*private -0.2554 0.0195 ***
-0.8921 0.0898 ***
Ln(size)*small*mixed -0.1419 0.0398 ***
-0.8252 0.2116 ***
Energy and Mining
Trade and Distribution 0.1184 0.1751
0.1260 0.1809
Construction -0.1665 0.1763
-0.1782 0.1821
Metallurgic -0.3523 0.2025 *
-0.3421 0.2094
Chemical -0.2875 0.2175
-0.2839 0.2210
Engineering -0.0550 0.1785
-0.0569 0.1843
Wood Industry -0.0069 0.1915
-0.0188 0.1977
Light Industry 0.0122 0.1867
-0.0205 0.1922
Building Industry 0.1488 0.1983
0.1326 0.2043
Food Industry 0.1302 0.1939
0.1209 0.1989
Other Industries 0.0094 0.1892
0.0077 0.1946
Krasnoyarsk
Moscow 0.2548 0.0245 ***
0.2528 0.0247 ***
Chuvashya -0.2048 0.0411 ***
-0.1862 0.0419 ***
Chelyabinsk -0.5033 0.0340 ***
-0.5020 0.0345 ***
Constant -0.0750 0.1787
-0.1291 0.1797
Observations = 9636
Prob. F>0 = 0.000
Hausman Test; Null-Hypothesis: No measurement error; χ2(22)=1928.
* Statistically significant at the 10% level ** Statistically significant at the 5% level *** Statistically significant at the 1% level
Source: Firm-level data provided by Gostkomstat.

36
Table 13 - Weighted regression results. Dependent variable: Employment growth rate of firm i in 1997 – Continuing Firms
OLS
Instrumental Variables
Explanatory Variable Coefficient Robust
Standard Error P>|t| Coefficient
Robust
Standard
Error
P>|t|
Ln(size) 0.0025 0.0056
0.0037 0.0046
State
Private -0.1671 0.0400 ***
-0.0983 0.0264 ***
Mixed -0.0828 0.0517
-0.0513 0.0349
Large and State
Private*small 0.1592 0.0467 ***
-0.4335 0.1410 ***
Mixed*small 0.1151 0.0864
-0.3419 0.3736 **
Ln(size)*private 0.0302 0.0081 ***
0.0169 0.0057 ***
Ln(size)*mixed 0.0090 0.0093
0.0037 0.0062
Ln(size)*small*private -0.0230 0.0113 **
0.1836 0.0509 ***
Ln(size)*small*mixed -0.0032 0.0263
0.1572 0.1333
Energy and Mining
Trade and Distribution -0.0199 0.0963
-0.0156 0.0963
Construction -0.1506 0.0971
-0.1621 0.0970 *
Metallurgic 0.0122 0.1185
0.0139 0.1188
Chemical -0.1360 0.1115
-0.1327 0.1116
Engineering -0.0216 0.0984
-0.0264 0.0985
Wood Industry 0.0143 0.1057
0.0100 0.1058
Light Industry -0.0784 0.1042
-0.0863 0.1042
Building Industry -0.0029 0.1091
-0.0097 0.1091
Food Industry 0.0295 0.0991
0.0136 0.0989 *
Other Industries -0.0666 0.1037
-0.0734 0.1036
Krasnoyarsk
Moscow 0.0391 0.0152 **
0.0383 0.0152 **
Chuvashya 0.0801 0.0258 ***
0.0830 0.0258 ***
Chelyabinsk -0.0319 0.0212
-0.0278 0.0213
Constant -0.0847 0.0980
-0.0862 0.0958
Observations = 8088
Prob. F>0 = 0.000
Hausman Test; Null-Hypothesis: No measurement error; χ2(22)=36.6
* Statistically significant at the 10% level ** Statistically significant at the 5% level *** Statistically significant at the 1% level
Source: Firm-level data provided by Gostkomstat.

37
Table 14 - Predicted net employment growth rates
All OLS IV
Large and Medium State Firm, Krasnoyarsk -0.0750 -0.1291
Large and Medium State Firm, Moscow 0.1799 0.1237
Private Firm, Krasnoyarsk, 500 workers 0.0738 0.0061
Private Firm, Krasnoyarsk, 2000 workers 0.2121 0.1046
Private Firm, Moscow, 500 workers 0.3286 0.2588
Private Firm, Moscow, 2000 workers 0.4669 0.3573
Small Mixed Ownership Firm, Moscow, 50 workers 0.9092 0.0634
Small Mixed Ownership Firm, Moscow, 10 workers 1.0657 1.3617
Small Mixed Ownership Firm, Chelyabinsk, 10 workers 0.3076 0.6069
Small Private Firm, Chelyabinsk, 50 workers -0.1899 -0.9318
Small Private Firm, Chelyabinsk, 10 workers 0.0606 0.3896
Small Private Firm, Moscow, 100 workers 0.4603 -0.7461
Small Private Firm, Moscow, 50 workers 0.5682 -0.1770
Small Private Firm, Moscow, 10 workers 0.8187 1.1444
Continuing OLS IV
Large State or Mixed Firm, Krasnoyarsk or Chelyabinsk -0.0847 -0.0862
Small Private Firm, Chuvashya, 100 workers 0.0207 0.3885
Small Private Firm, Chuvashya, 50 workers 0.0157 0.2495
Small Private Firm, Chuvashya, 10 workers 0.0042 -0.0733
Small Private Firm, Moscow, 100 workers -0.0203 0.3438
Small Private Firm, Moscow, 50 workers -0.0253 0.2048
Small Private Firm, Moscow, 10 workers -0.0369 -0.1180
Source: Authors’ calculations based on regressions of Tables 12 and 13.
38
Table 15 - Regression results. Dependent variable: Employment growth rate of firm i in 1997 – All medium and large Firms
OLS Instrumental Variables
Explanatory Variable Coefficient Robust
Standard Error P>|t| Coefficient
Robust
Standard
Error
P>|t|
Ln(size) -0.0133 0.0090
-0.0022 0.0050
State
Private -0.1016 0.0634
-0.0679 0.0338 **
Mixed -0.0865 0.0773
-0.0233 0.0465
Ln(size)*private 0.0189 0.0129
0.0112 0.0067 *
Ln(size)*mixed 0.0166 0.0139
0.0026 0.0078
Energy and Mining
Trade and Distribution -0.0786 0.0453 *
-0.0719 0.0441
Construction -0.1612 0.0460 ***
-0.1619 0.0452 ***
Metallurgic -0.0906 0.0694
-0.0900 0.0694
Chemical -0.1090 0.0626 *
-0.1130 0.0620 *
Engineering -0.1081 0.0455 **
-0.1120 0.0449 **
Wood Industry -0.1363 0.0516 ***
-0.1400 0.0508 ***
Light Industry -0.2070 0.0472 ***
-0.2069 0.0463 ***
Building Industry -0.1472 0.0499 ***
-0.1495 0.0493 ***
Food Industry -0.0688 0.0457
-0.0716 0.0447
Other Industry -0.1271 0.0481 ***
-0.1276 0.0471 ***
Krasnoyarsk
Moscow -0.0124 0.0175
-0.0126 0.0176
Chuvashya 0.0811 0.0247 ***
0.0840 0.0245 ***
Chelyabinsk 0.0048 0.0212
0.0053 0.0213
Constant 0.0915 0.0640
0.0442 0.0507
Observations = 5810
Prob. F>0 = 0.000
Hausman Test; Null-Hypothesis: No measurement error; χ2(18)=0.99
* Statistically significant at the 10% level ** Statistically significant at the 5% level *** Statistically significant at the 1% level
Source: Firm-level data provided by Gostkomstat.

39
Table 16 - Regression results. Dependent variable: Employment growth rate of firm i in 1997 – All medium and large
continuing firms
OLS Instrumental Variables
Explanatory Variable Coefficient
Robust
Standard
Error
P>|t| Coefficient
Robust
Standard
Error
P>|t|
ln(size) 0.0062 0.0049
0.0054 0.0038
State
Private -0.1681 0.0362 ***
-0.0929 0.0233 ***
Mixed -0.1156 0.0485 **
-0.0793 0.0319 **
Ln(size)*private 0.0276 0.0075 ***
0.0135 0.0050 ***
Ln(size)*mixed 0.0151 0.0086 *
0.0085 0.0055
Energy and Mining
Trade and Distribution -0.0622 0.0225 ***
-0.0677 0.0214 ***
Construction -0.1308 0.0232 ***
-0.1316 0.0225 ***
Metallurgic -0.1476 0.0350 ***
-0.1427 0.0350 ***
Chemical -0.1171 0.0373 ***
-0.1150 0.0372 ***
Engineering -0.1324 0.0219 ***
-0.1321 0.0213 ***
Wood Industry -0.1176 0.0276 ***
-0.1172 0.0270 ***
Light Industry -0.1640 0.0270 ***
-0.1638 0.0262 ***
Building Industry -0.1265 0.0292 ***
-0.1249 0.0287 ***
Food Industry -0.0209 0.0252
-0.0205 0.0243
other Industry -0.0975 0.0260 ***
-0.0996 0.0253 ***
Krasnoyarsk
Moscow -0.0014 0.0113
-0.0024 0.0113
Chuvashya 0.0406 0.0146 ***
0.0405 0.0146 ***
Chelyabinsk 0.0154 0.0147
0.0150 0.0147
Constant -0.0313 0.0326
-0.0229 0.0271
Observations = 5670
Prob. F>0 = 0.000
Hausman Test; Null-Hypothesis: No measurement error; χ2(18)=0.56
* Statistically significant at the 10% level ** Statistically significant at the 5% level *** Statistically significant at the 1% level
Source: Firm-level data provided by Gostkomstat.

40
Figure 1- Net employment growth rates by firms size – All regions
Manufacturing and mining, construction and distribution and trade
-2 2
0
.296405
-2 2
0
.220459
-2 2
0
.358338
Small Firms – Net growth rate - 1997
Medium and Large Firms – Net growth rate - 1997
All Firms – Net growth rate - 1997
Fraction
Fraction

41
Figure 2 – Net employment growth rates by firms size - Moscow
Manufacturing and mining, construction and distribution and trade
Fraction
-2 2
0
.485257
Fraction
-2 2
0
.275371
All firms – Net employment growth rate - 1997 -2 2
0
.213216
Medium and large firms – Net employment growth rate - 1997
Small firms – Net employment growth rate - 1997
Fraction

42
Figure 3 - Net employment growth rates by firms size – Krasnoyarsk
Manufacturing and mining, construction and distribution and trade
Fraction
-2 2
0
.305687
Medium and large firms – Net employment growth rate - 1997

43
Figure 4 - Net employment growth rates by firms size - Chelyabinsk
Manufacturing and mining, construction and distribution and trade
Fraction
-2 2
0
.258031
Fraction
-2 2
0
.319879
Fraction
-2 2
0
.312034
All firms – Net employment growth rate - 1997
Small firms – Net employment growth rate - 1997
Medium and large firms – Net employment growth rate - 1997

44
Figure 5 - Net employment growth rates by firms size – Chuvashia
Manufacturing and mining, construction and distribution and trade
.310084
Fraction
0
.353028
-2 2
0
All firms – Net employment growth rate - 1997
-2 2
Fraction
-2 2
0
.315789
Medium and large firms – Net employment growth rate - 1997
Small firms – Net employment growth rate - 1997
Fraction

45
References
Blanchard, O., (1997), The Economics of Post-communist Reform, London.
Bilsen, Valentin and Konings, Jozef, "Job Creation, Job Destruction and Growth of Newly
Established, Privatised and State-owned Enterprises in Transition Economies: Survey Evidence from
Bulgaria, Hungary and Romania", Journal of Comparative Economcis, 26, 3: 429-445, September 1998.
Boeri, T. and Lehmann, H. (1999), Introduction: Unemployment and Labor Market Policies in Transition Countries,
Journal of Comparative Economics 27, 1: 1-3, March.
Chadha, B., Coricelli, F. and Kranjak, K. (1993), 'Economic Restructuring, Unemployment, and Growth in a
Transition Economy', IMF Staff Papers, Vol. 40, No. 4, December.
Davis, S.J., and Haltiwanger, J. (1990), “Gross Job Creation and Destruction: Microeconomic Evidence and
Macroeconomic Implications”, National Bureau of Economic Research Macroeconomics Annual, 5, 123-168.
Davis, S. and Haltiwanger, J. (1992) 'Gross Job Creation, Gross Job Destruction and Employment Reallocation',
Quarterly Journal of Economics, Vol. 106, pp. 819-863.
Dunne, T., Roberts, M. and Samuelson, L. (1989), "The Growth and Failure of US Manufacturing Plants", Quarterly
Journal of Economics, Vol. 103, pp. 495-515.
Durbin, J. (1955), "Errors in Variables", Review of International Statistical Institute, pp. 23-32.
Evans, D.S., (1987a), "Tests of Alternative Theories of Firm Growth", Journal of Political Economy, Vol. 95, pp.
657-674.
Evans, D.S., (1987b), "The Relationship between Firm Growth, Size and Age: Estimates for 100 manufacturing
industries, Journal of Industrial Economics, Vol. 35, pp. 567-581.
Faggio, G. and Konings, J. (1999), “Job Creation and Job Destruction in Bulgaria, Romania, Poland and Estonia:
Evidence from Company Accounts Data.” Mimeo, Leuven, April.
Foley, M. (1997), “Labor Market Dynamics in Russia”, Yale University, Economic Growth Center Discussion Paper
No 780, New Haven, August.
Konings, J., Lehmann, H., and Schaffer, M.E. (1996), “Job Creation and Job Destruction in a Transition Economy:
Ownership, Firm Size, and Gross Job Flows in Polish Manufacturing 1988-91”, Labour Economics, 3,3: 299-
317, September.
Layard, Richard and Richter, Andrea, "How much unemployment is needed for restructuring: the Russian
experience", Economics of Transition, Volume 3 (1), 39-58, 1995.
Lehmann, H., Wadsworth, J. and Acquisti, A. (1999), "Grime and Punishment: Job Insecurity and Wage Arrears in
the Russian Federation”, forthcoming in Journal of Comparative Economics.
Richter, Andrea, and Schaffer, Mark E., “Growth, Investment, and Newly-Established Firms in Russian
Manufacturing.” In Simon Commander, Qimiao Fan, and Mark E. Schaffer, Ed., Enterprise Restructuring
and Economic Policy in Russia , Washington DC : EDI/World Bank, 1996.

46
Footnotes
1 These regions are Moscow City, Krasnoyarsk, Chuvashia and Chelyabinsk. The reasons for choosing them as
representative economic regions within the Russian Federation are discussed below.
2 Exit and entry take on the polar values –2 and 2, while contraction and expansion will be represented by
intermediate negative and positive values respectively.
3 Assume that all firms have contracted by 10% and that no firm expanded employment. Then gross would give a
job reallocation rate of 10% even though no job reallocation occurred.
4 The 1997 data were collected at the end of June 1997, the retrospective data refer to the end of June 1996.
5 When we speak of entry in the case of small firms, we think of self-employed persons who start to hire staff in
order to expand their economic activities.
6 Unfortunately, due to logistic problems data for small firms in Krasnoyarsk were not made available.
7 Gimpelson and Lippoldt (1998), using the same data set, give such overall rates for regions and ownership types.
This, however, requires too strong assumptions about how representative these three industries are in the job
creation and job destruction process of the entire economy of the chosen regions.
8 These are pos, neg, job creation and destruction shares.
9 Since virtually all small firms are firms that starting up after the beginning of transition we can assume that most of
them are not engaged in restructuring.
10
Compare e.g. the excess rate for firms in categories 1-49 and 50-99 in Table 4.
11 Cf. For example Evans (1987a,b) and Dunne et al. (1989).
12 Ownership categories do not vary over time, so we only need one subscript across firms.
13 For a discussion of Galton’s fallacy see for example Friedman (1992).
14
We exclude firms whose net growth rate takes on the value of 2 or -2.
15 Experiments with other regressions where we all firms from Krasnoyark had been eliminated provided very
similar results.
16 We are grateful to John Litwack for drawing our attention to this possible explanation.
17
Large and medium-sized enterprises had in 1997 negative net employment growth in all regions.