JOB CREATION AND INFRASTRUCTURE IN SOUTH AFRICA March 2011 CLGF Conference (Cardiff) SALGA Economic...
23
JOB CREATION AND JOB CREATION AND INFRASTRUCTURE IN INFRASTRUCTURE IN SOUTH AFRICA SOUTH AFRICA March 2011 March 2011 CLGF Conference CLGF Conference (Cardiff) (Cardiff) SALGA SALGA Economic Development Economic Development And Planning And Planning Mayur Maganlal Mayur Maganlal
-
Upload
gabriel-mcdonald -
Category
Documents
-
view
217 -
download
3
Transcript of JOB CREATION AND INFRASTRUCTURE IN SOUTH AFRICA March 2011 CLGF Conference (Cardiff) SALGA Economic...
JOB CREATION AND JOB CREATION AND INFRASTRUCTURE INFRASTRUCTURE IN SOUTH AFRICAIN SOUTH AFRICA
March 2011March 2011
CLGF Conference (Cardiff)CLGF Conference (Cardiff)
SALGASALGAEconomic DevelopmentEconomic Development
And PlanningAnd Planning
Mayur MaganlalMayur Maganlal

• Introduction
• Unemployment Challenges
• Role of Capital Investment in Infrastructure
• Expanded Public Works Programme
• The case of Ehlanzeni (Limpopo Province)
CONTENTS

• Traditional LED is focused on “creating the enabling business environment”, given the vast poverty and unemployment challenges but current administration is taking a more proactive / focused / interventionist stance
• Job creation, public investment and rural development emerged as key points in finance minister Pravin Gordhan’s budget 2011 speech
• The SA government pursues its New Growth Path (NGP) which includes a focus on infrastructure spend– Energy, transport (road construction and maintenance), communications,
water, education and housing• Industrial Policy Action Plan (IPAP2) to support key sectors and more
focused use of government procurement to create jobs • National Programmes such as EPWP affect all spheres of Government to
invest in infrastructure projects and job creates:– Labour Intensive Construction methods– MIG Funds– For new projects and maintenance– Incentives based on performance– For LG, capital investment is often an easier than doing “LED”
INTRODUCTION

The jobs challengeLabour absorption (Percentage of
people aged 15-64 who are employed) (ILO)
South Africa 41,3%
Egypt 43,2%
India 55,6%
Argentina 56,5%
South Korea 58,1%
Malaysia 60,5%
Brazil 63,9%
China 71,0%
4Confidential
8
12
16
20
24
28
32
1980 1985 1990 1995 2000 2005
Mil
lio
ns
Working age population growth (1980-2009) =
Labour Force growth (1980-2009) = 1.9%
gap = unemployed + not participating
UNEMPLOYMENT CHALLENGE

GLOBAL ECONOMIC CRISIS : THE NATIONAL
RESPONSE
NO Reference to either the local or provincial spheresNO Reference to either the local or provincial spheres
‘Stimulus Package’ (NEDLAC/Presidency)
Investment in Infrastructure
Global Coordination
MacroeconomicPolicy
Industrial & Trade Policy
Employment Measures
Social Measures
•Transport (road, rail, public transport, port operations);•Water, dams & sanitation;•Housing;•ICT;•Electricity;•Health & education;
•Counter-cyclical (expansionary) fiscal policy •Reducing real interest rates;•Competitive exchange rate;•Tax relief to low-income households and companies in distress;
•‘Rescue package for vulnerable sectors (clothing, textile, autos, mining, capital equipment, retail, housing construction, private services);• Support for SMMEs in crisis;•‘Green’ industries;•Local procurement;•Trade: tightening import controls.
•National Jobs Initiative (R10 bn);•Support where > 50 retrenchments;•Expand Public Service (education, health, social work, CJS);•EPWP II: 2 million full-time equivalent jobs;•Training & skills development, incl. training the retrenched;
•Improve global Economic coordimation;•Prudent regulation of SA capital markets;•G20 as platform to enhance stability in fin mkts;•Use IFIs to finance counter-cyclical policies in developing countries.
•Industry-level social plans;•Improved UIF benefits;•Emergency Food Relief;• Support community food production.;•Access to FBS;•Social Grants (CSG to age 18, pension for men from age 60);•Promotion of Cooperatives;
R 787 bnR 787 bn2010 - 122010 - 12

Overarching Priority: To implement counter-cyclical policies that are customised for the locality, through a dedicated ‘local stimulus package’, ‘local stimulus package’, to mitigate the negative impacts, and to position the local economy for recoveryto position the local economy for recovery
Investment in Infrastructure
Industrial Policy
Employment Measures
Social Measures
•EPWP, • Municipal “shovel ready” Infrastructure Projects;•2010 projects
•Advice to corporates and SMMEs & support to access rescue packages & concessionary credit, Local procurement
•Employment programmes to absorb retrenched workers, leveraging on National Jobs Initiative;•Retraining
•Support to communities and households in distress through partnering with NGOs & the private sector (CSI)
Surveillance of local economySurveillance of local economyPartnership: civil society & private sectorPartnership: civil society & private sectorOngoing CommunicationOngoing Communication
GLOBAL ECONOMIC CRISIS : THE NATIONAL
RESPONSE

New Growth Path Drivers
7
SoNA:–R9 billion in the Jobs Fund over the next 3 years – public employment schemes plus subsidies to private employers–R10 bn from the IDC in next 5 years for job-creating projects–R20 billion in investment subsidies–Comprehensive support for SMEs
1. Address cost drivers and inflationary pressures across the economy
2. Active industrial policy based on increasing competitiveness and targeting sectors that can create employment directly and indirectly
3. Comprehensive rural development
4. Stronger competition policy
5. Stepping up education and skills development
6. Enterprise development
7. Reform of Broad-Based BEE
8. Reform labour policies to support productivity and improve protection for vulnerable workers
9. Technology policies geared to improving innovation in ways that support employment creation and small- and micro-enterprise
10.Developmental trade policies with a strong orientation to new growth centres
11. Investment to support African development

STATE OWNED ENTITIES - ESKOM
• Major plants located near coal reserves, with localised employment effects– Should create 2000 new jobs in the coming year
• Main employment impact from maintaining electricity supply across the country
• Also create jobs in all provinces through– Procurement from build programme– Electrification programme– Municipal electricity maintenance

Nation-wide programme which will draw significant numbers of the unemployed
into productive work, so that workers gain skills while they work, and increase their
capacity to earn an income
EXPANDED PUBLIC WORKS PROGRAMME
(EPWP)

To utilise public sector budgets to alleviate unemployment
EPWP OBJECTIVE

• Deliberate attempt by the public sector body to use expenditure on goods and services to create work opportunities coupled with training for the unemployed
• Projects usually employing workers on a temporary basis (either by government, by contractors, or by other non-governmental organisations), under code of good practice for SPWP or learnership employment conditions
WHAT IS AN EPWP PROJECT

• Increasing the labour intensity of government-funded infrastructure projects
• Creating work opportunities in public environmental programmes (eg Working for Water)
• Creating work opportunities in public social programmes (eg community health workers)
• Utilising general government expenditure on goods and services to provide the work experience component of small enterprise learnership / incubation programmes
AREAS OF OPPORTUNITIES FOR
EPWP
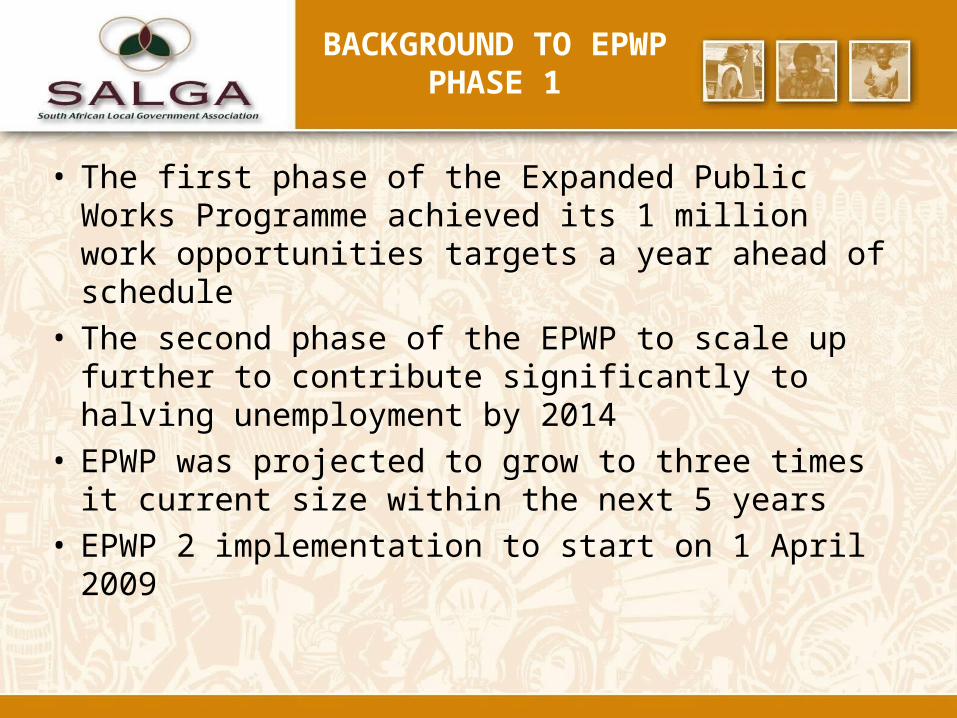
BACKGROUND TO EPWP PHASE 1
• The first phase of the Expanded Public Works Programme achieved its 1 million work opportunities targets a year ahead of schedule
• The second phase of the EPWP to scale up further to contribute significantly to halving unemployment by 2014
• EPWP was projected to grow to three times it current size within the next 5 years
• EPWP 2 implementation to start on 1 April 2009

KEY ENHANCEMENTS EPWP 2
• EPWP Employment Creation Targets• EPWP Wage Incentive• Sector Programmes
o Introduction of the Non-State Sector
(community)
• Increasing Technical Capacity and Support• Funding
Grant/ Allocation Local Municipal Infrastructure Grant 2009/10: R202 million
2010/11: R554 million 2011/12: R1.1 billion

• Overall Phase 2 targets will be distributed across all spheres of government over a five year period based on projects/programmes
• The EPWP incentive is based on paying all public bodies that create work above a minimum threshold for the EPWP target group an incentive of R50 per day for every day of work created
KEY ELEMENTS OF PHASE 2

Phase 2 targets in Full Time Equivalents broken down per sphere of government
Local Provincial National Non-State Totals
2009-2010 60 548 117 554 22 698 8 696 209 496
2010-2011 72 658 136 630 28 999 20 870 259 156
2011-2012 94 939 181 667 40 991 41 739 359 337
2012-2013 122 549 243 527 56 272 76 522 498 870
2013-2014 152 581 320 692 76 570 130 435 680 278
Totals 503 275 1 000 070 225 531 278 261 2 007 137

Infrastructure Sector
Project based employment in capital works Potential for long term employment programmes in maintenance works
INFRASTRUCTURE SECTOR

• Both the programme and budgets of the EPWP have multiple objectives:– Eradicate backlogs and create employment– Provide social services and create employment– Taken existing programmes, and institutional setups
and required additional job creation:– Municipal official who previously build roads, now has
to still build roads, but must also create jobs– Lot of energy focused on changing how existing
programmes are implemented, not establishing new institutions with the purpose of doing things more labour-intensively
OBJECTIVES FOR INFRASTRUCTURE
SECTOR

!
!
!
!
!
!!
!
!R
!
! !
! !
!P
!
!
KRUGER NATIONAL PARK
L I M P O P O L I M P O P O
P R O V I N C EP R O V I N C E
N k a n g a l aN k a n g a l a
G e r t S i b a n d eG e r t S i b a n d e
E H L A N Z E N IE H L A N Z E N I
MOZAMBIQUE
SWAZILAND
K r u g e r N a t i o n a l P a r kK r u g e r N a t i o n a l P a r k
T h a b a C h w e uT h a b a C h w e u
N k o m a z iN k o m a z i
M b o m b e l aM b o m b e l a
U m j i n d iU m j i n d i
B u s h b u c k r i d g eB u s h b u c k r i d g e
M P D M A 3 2M P D M A 3 2
M P 3 2 1M P 3 2 1
M P 3 1 4M P 3 1 4
M P 3 2 2M P 3 2 2
M P 3 2 4M P 3 2 4
M P 3 2 5M P 3 2 5
M P 3 0 1M P 3 0 1
M P 3 2 3M P 3 2 3
M P 3 1 3M P 3 1 3
Satara
Skukuza
Talamati
Berg-en-dal
Lower Sabie
Pretoriuskop
Crocodile Bridge
NELSPRUI T
Barberton
Sabie
Swadini
Belfast
Graskop
Hazyview
Badplaas
Kabokweni
Lydenburg
Ohrigstad
White River
Machadodorp
Komatipoort
Burgersfort
Pilgrim's Rest
EPWP REPORT FOR EHLANZENI DISTRICT
MUNICIPALITY

Summary of EPWP performance
- Number of projects = 25
- Expenditure = R78,953,542
- Planned jobs = 800
- Actual Jobs = 976» Youth = 388
» Women = 581
» Disabled = 7
- Training» Accredited = 2105
person/days
» Non-accredited = 1405 person/days
EHLANZENI DISTRICT: STATUS REPORT

EMPLOYMENT
PROJECT NAME LM BUDGET YOUTH WOMEN
DISABLED
TOTAL
Nyathi WTW NLM R38,000,000
24 18 3 43
Mangweni Bulk Supply
NLM R1,500,000
16 16 1 42
Buffelspruit Bus Route
NLM R6,010,000
14 22 1 37
Goba Bus Route NLM R3,490,000
15 25 0 45
Msogwaba Bus Route
MLM R3,097,773
10 8 1 19
EHLANZENI DISTRICT: STATUS REPORT (08-
09)

EMPLOYMENT
PROJECT NAME LM BUDGET YOUTH WOMEN DISABLED TOTAL
Backdoor taxi & bus route P2
MLM R2,500,00024 17 1 32
Zwelisha B Water Supply
MLM R3,500,00035 22 0 57
Nsikazi North Water Network
MLM R1,642,62753 40 2 95
Roads & Stormwater infrastructure – Shabalala P2
MLM R1,000,00025 12 0 37
TOTAL 216 180 9 407
EHLANZENI DISTRICT: STATUS REPORT (08-
09)

• Have not reached our full potential in implementing the EPWP program
• No unit dedicated to EPWP activities
• Planning
• Infrastructure sector active, however economic, social & environmental/culture sectors not reporting on activities
EHLANZENI DISTRICT: CHALLENGES