João Alberto Pinheiro Pereira de...
75
Mechanical characterization of traditional adobe masonry elements João Alberto Pinheiro Pereira de Almeida João Alberto Pinheiro Pereira de Almeida Mechanical characterization of traditional adobe masonry elements University of Minho Czech Technical University in Prague Portugal | 2012
Transcript of João Alberto Pinheiro Pereira de...

Mec
hani
cal c
hara
cter
izat
ion
of tr
aditi
onal
ado
be m
ason
ry e
lem
ents
João
Alb
erto
Pin
heiro
Per
eira
de A
lmeid
a
João Alberto Pinheiro Pereira de Almeida
Mechanical characterization oftraditional adobe masonry elements
University of Minho Czech Technical Universityin Prague
Port
ugal
| 2
012

João Alberto Pinheiro Pereira de Almeida Mechanical characterization of traditional adobe masonry elements
Czech Technical University in Prague


Mechanical characterization of traditional adobe masonry elements
Erasmus Mundus Programme
ADVANCED MASTERS IN STRUCTURAL ANALYSIS OF MONUMENTS AND HISTORICAL CONSTRUCTIONS i
DECLARATION
Name: João Alberto Pinheiro Pereira de Almeida
Email: [email protected]
Title of the
Msc Dissertation: Mechanical characterization of traditional adobe masonry elements
Supervisor(s): Daniel V. Oliveira and Humberto Varum
Year: 2012
I hereby declare that all information in this document has been obtained and presented in accordance
with academic rules and ethical conduct. I also declare that, as required by these rules and conduct, I
have fully cited and referenced all material and results that are not original to this work.
I hereby declare that the MSc Consortium responsible for the Advanced Masters in Structural Analysis
of Monuments and Historical Constructions is allowed to store and make available electronically the
present MSc Dissertation.
University: University of Minho
Date: 19th of July of 2012
Signature: ___________________________

Mechanical characterization of traditional adobe masonry elements
Erasmus Mundus Programme
ADVANCED MASTERS IN STRUCTURAL ANALYSIS OF MONUMENTS AND HISTORICAL CONSTRUCTIONS iii
ACKNOWLEDGEMENTS
I would like to express my gratitude to the European Commission and the Master Consortium for the
scholarship the opportunity to study in the Advanced Masters in Structural Analysis of Monuments and
Historical Constructions.
I would like to thank Ms. Dora Coelho and Ms. Ana Fonseca of MSc Secretariat and give a word of
appreciation for all the administrative helps especially with Erasmus scholarship.
I would like to acknowledge to all professors who made the lectures in Prague for the help during the
course work and also for the nice site visits to monuments in that beautiful city and around Czech
country.
I want to give a special acknowledgement to my thesis supervisors, Prof. Daniel Oliveira and Prof.
Humberto Varum for the encouragement given during the thesis.
I would like to acknowledge all the helpfulness from Eng. Maria Carlos, Eng. António Figueiredo,
Victor and Joao during my stay in the Laboratory of Civil Engineering of Aveiro University
I would like to acknowledge the guidance and good advices from Eng. Carlos Palha during the
experimental work in University of Minho.
I would like to express my gratitude to all my colleagues from Prague for the good moments and help
during work.
I would like to give a special acknowledgement to my colleagues Ali, Juan, Kike, Tristan and Yhosimi
for all the moments passed in Guimarães and for the good food during the thesis work.
I would like to give also a special acknowledgement to my friends Filipe and Rui for hosting me in
Aveiro during almost one month.
Last but never the least, I would like to thank Joana for understanding and supporting me in my
decision to apply for this master (.... obrigado por tudo minha princesa!), and to all my family for being
always present.

Mechanical characterization of traditional adobe masonry elements
Erasmus Mundus Programme
ADVANCED MASTERS IN STRUCTURAL ANALYSIS OF MONUMENTS AND HISTORICAL CONSTRUCTIONS v
ABSTRACT
Earthen materials have been used in construction since thousands years and several authors
estimated that around one third of the world population lives in earth constructions. In Aveiro region
the adobe masonry was used as load bearing element in numerous dwellings. The low cost and
availability of material were factors that contributed to the selection of this constructive system.
Nowadays, an important amount of these dwellings are being under rehabilitation processes and in
many cases the entities involved do not preserve the adobe masonry as load bearing due to an
absence of information on adobe masonry properties and behaviour.
A mechanical characterization of adobe specimens and adobe masonry prisms was developed using
adobe samples collected from existing buildings in order to evaluate the shear, tensile and
compressive fracture energy and mechanical properties of the unit-mortar joint. The methodology
used to the preparation of samples, tests set up and the experimental procedures from the different
tests carried within this research are presented.
With the aim of characterize the behaviour of adobe specimens and prisms when subjected to uniaxial
tensile loads tests were realized. From those tests it was possible to conclude that In the case of
specimens the size effect of the aggregates can highly contribute to the dispersion of results and for
the prisms the interface between the two blocks is obviously the weaker part of the structure.
From the campaign of compressive load tests to adobe specimens and prisms, developed with the
aim of the characterization of the compressive behaviour of adobe it was possible to conclude that
compressive strength of prisms presents a lower dispersion and higher mean value than the results
obtained for the adobe specimens. The compressive fracture energy presents a higher coefficient of
variation in the case of adobe specimens.
The experimental campaign to characterize the shear behaviour of adobe specimens and adobe
prisms with hydraulic lime mortar joints permits to infer the existence of a weaker interface in prisms
rather than in specimens. This weaker interface is ruling the behaviour of the samples when submitted
to shear loads with a normal compression. The experimental research on the behaviour of adobe
specimens and prisms with a mortar joint is an innovative approach to the characterization of this
material.


Mechanical characterization of traditional adobe masonry elements
Erasmus Mundus Programme
ADVANCED MASTERS IN STRUCTURAL ANALYSIS OF MONUMENTS AND HISTORICAL CONSTRUCTIONS vii
RESUMO
Materiais compostos por solos são utilizados na construção à vários milhares de anos e vários
autores estimam que aproximadamente um terço da população mundial viva em construções
realizadas com estes materiais. Na região de Aveiro a alvenaria de adobe foi usada como elemento
portante em enumeros edifícios. O baixo custo e a disponibilidade de material foram fatores que
contribuíram para a escolha deste sistema construtivo. Hoje em dia, uma quantidade importante de
essas moradias está em processo de reabilitação e em muitos casos, as entidades envolvidas não
preservam a alvenaria de adobe como estrutura portante devido à ausência de informação sobre as
propriedades e comportamento da alvenaria de adobe.
A caracterização mecânica realizada efectuou-se em carotes de adobe e prismas de alvenaria de
adobe, usando amostras recolhidas de um edifício existente, com a finalidade de avaliar a energia de
fractura ao corte, tracção e compressão e propriedades mecânicas da ligação unidade-argamassa. A
metodologia utilizada para a preparação de amostras, procedimentos experimentais e configuração
dos ensaios são apresentados neste trabalho.
Realizaram-se testes com o objectivo the caracterizar o comportamento mecânico de carotes de
adobe e prismas de alvenaria de adobe quando sujeitos a forças de tracção uniaxial. De estes testes
foi possível concluir que no caso de carotes o efeito do tamanho dos agregados pode ter um
importante contributo na dispersão dos resultados obtidos, enquanto que no caso de prismas de
alvenaria a interface entre os dois blocos é a parte mais frágil da estrutura.
Da campanha de ensaios de compressão em carotes e prismas de alvenaria de adobe desenvolvido
com o objectivo de caracterizar o comportamento do adobe em compressão foi possível concluir que
a resistência à compressão de prismas de alvenaria apresenta uma menor dispersão de resultados e
um valor médio mais elevado que os valores obtidos para carotes de adobe. A energia de fractura em
compressão apresenta um maior coeficiente de variação no caso de carotes de adobe.
A campanha experimental para caracterizar o comportamento ao corte em carotes prismas de
alvenaria de adobe com uma junta em argamassa de cal hidraulica permite inferir a existência de uma
fraca interface entre as duas superfices submetidas ao corte. Esta interface mais fraca rege o
comportamento dos prismas quando submetidos a forças de corte com compressão na direcção
normal. Esta investigação experimental no comportamento de carotes e prismas de alvenaria de
adobe com junta de argamassa é inovador na caracterizaçao de adobe.


Mechanical characterization of traditional adobe masonry elements
Erasmus Mundus Programme
ADVANCED MASTERS IN STRUCTURAL ANALYSIS OF MONUMENTS AND HISTORICAL CONSTRUCTIONS ix
TABLE OF CONTENTS
CHAPTER 1 INTRODUCTION ...................................................................................................... 1
1.1 Foreword ................................................................................................................................. 1
1.2 Motivation ................................................................................................................................ 2
1.3 Scope and objectives .............................................................................................................. 2
CHAPTER 2 STATE OF THE ART ................................................................................................ 5
2.1 General aspects ...................................................................................................................... 5
PRINCIPAL TECHNIQUES USED IN EARTHEN ARCHITECTURE ..................................................... 6
2.2 Adobe constructions in Aveiro Region .................................................................................... 7
2.3 Mechanical characterization of adobe masonry ...................................................................... 8
2.3.1 Compressive strength ............................................................................................................. 8
2.3.2 Tensile strength ..................................................................................................................... 11
2.3.3 Shear strength ....................................................................................................................... 12
2.3.4 Fracture energy ..................................................................................................................... 14
CHAPTER 3 MORTAR CHARACTERIZATION .......................................................................... 17
3.1 General overview ................................................................................................................... 17
3.1 Aggregate granulometric distribution..................................................................................... 18
3.2 Mortar characterization .......................................................................................................... 20
3.2.1 Flow table test ....................................................................................................................... 20
3.2.2 Flexural and compressive strength of mortar ........................................................................ 21
CHAPTER 4 TENSILE LOAD TESTS IN SPECIMENS AND PRISMS ....................................... 25
4.1 Specimens and prisms preparation ....................................................................................... 25
4.1.1 Specimens preparation ......................................................................................................... 26
4.1.2 Prisms preparation ................................................................................................................ 26
4.2 Test set up and test procedure .............................................................................................. 27
4.3 Tests results .......................................................................................................................... 28
4.4 Discussion ............................................................................................................................. 30
CHAPTER 5 COMPRESSIVE LOAD TESTS IN SPECIMENS AND PRISMS ........................... 33
5.1 Specimens and prisms preparation ....................................................................................... 33
5.1.1 Specimens preparation ......................................................................................................... 33
5.1.2 Prisms preparation ................................................................................................................ 34
5.2 Test set up and test procedure .............................................................................................. 35
5.3 Tests results .......................................................................................................................... 36
5.3.1 Fracture energy ..................................................................................................................... 37
5.4 Discussion ............................................................................................................................. 39
CHAPTER 6 SHEAR LOAD TESTS IN SPECIMENS AND PRISMS ......................................... 43

CHAPTER 1 - Introduction
Erasmus Mundus Programme
x ADVANCED MASTERS IN STRUCTURAL ANALYSIS OF MONUMENTS AND HISTORICAL CONSTRUCTIONS
6.1 Specimens and prisms preparation ....................................................................................... 43
6.1.1 Specimens preparation .......................................................................................................... 43
6.1.2 Prisms preparation ................................................................................................................. 44
6.2 Test set up and test procedure .............................................................................................. 45
6.3 Tests results........................................................................................................................... 46
6.4 Discussion.............................................................................................................................. 50
CHAPTER 7 CONCLUSIONS AND FURTHER RESEARCH ..................................................... 53
7.1 Conclusions ........................................................................................................................... 53
7.2 Further research .................................................................................................................... 54
REFERENCES ........................................................................................................................... 55

Mechanical characterization of traditional adobe masonry elements
Erasmus Mundus Programme
ADVANCED MASTERS IN STRUCTURAL ANALYSIS OF MONUMENTS AND HISTORICAL CONSTRUCTIONS xi
LIST OF FIGURES
Figure 1 – World distribution of earthen architecture [7]. ........................................................................ 5
Figure 2 - Schematic description of the different building techniques with earth [4]. .............................. 7
Figure 3 - Examples of stress vs. strain relations obtained in simple compression tests on adobe
specimens: a) adobes from houses; b) adobes from dividing walls [13]................................................. 9
Figure 4 – Stress-strain curves for specimens stabilised with natural polymers and without natural
polymers [9]. .......................................................................................................................................... 10
Figure 5 - Influence of cement and clay content on block compressive strength [21]. ......................... 10
Figure 6 – a) Curves stress-strain for adobe specimens tested in tension [24]; b) Mean tensile strength
of adobe specimens taken from houses and land dividing walls, with indication of standard deviation
[13]. ........................................................................................................................................................ 11
Figure 7 – Stress-strain curves obtained from diagonal compression tests on adobe wallets [18]. ..... 12
Figure 8 – In-situ shear test: a) test set up; b) stress-strain relation for the first test loading history [28]
............................................................................................................................................................... 13
Figure 9 - Different types of shear tests: (a) couplet test; (b) van der Pluijm test; and, (c) triplet test,
[29]. ........................................................................................................................................................ 13
Figure 10 - Direct shear tests: (a) shear strength; (b) adobe specimens’ height variation [28]. ........... 14
Figure 11 - Typical behaviour of quasi-brittle materials under uniaxial loading and definition of fracture
energy: (a) tensile loading; (b) compressive loading [31]. .................................................................... 15
Figure 12 - Behaviour of masonry under shear and definition of mode II, fracture energy GIIf (c denotes
the cohesion) [31].. ................................................................................................................................ 15
Figure 13 - Granulometric analysis of adobe sample............................................................................ 18
Figure 14 – Grading obtained from the granulometric analysis to one adobe sample. ........................ 20
Figure 15 – Flow table test to the hydraulic lime mortar. ...................................................................... 21
Figure 16 - Specimens used to the mechanical characterization of the mortar. ................................... 22
Figure 17 - Preparation of specimens: cutting process and preparation to the application of one layer
of polyester resin. .................................................................................................................................. 26
Figure 18 - Specimen assembling, paper stripes were used to produce a weaker section to promote
the crack development in a controlled surface. ..................................................................................... 27
Figure 19 - Effect of the boundary conditions on the softening shape [37]. .......................................... 28
Figure 20 - Geometry of the specimens and LVDT’s position. ............................................................. 28
Figure 21 – Evolution of the tensile test in time, two different speeds were used in this preliminary test.
............................................................................................................................................................... 29
Figure 22 – Results of the tests to specimens and prisms ................................................................... 31
Figure 23 – Crack development of tested adobe specimen (T_S_04); a) front face; b) back face; c)
detail of crack path. ............................................................................................................................... 31
Figure 24 – Samples with approximately 85 mm diameter and 170 mm high, the upper and lower
surfaces were cut perpendicular to the cylinder axis. ........................................................................... 34

CHAPTER 1 - Introduction
Erasmus Mundus Programme
xii ADVANCED MASTERS IN STRUCTURAL ANALYSIS OF MONUMENTS AND HISTORICAL CONSTRUCTIONS
Figure 25 – Preparation of prisms for compressive load tests. ............................................................. 34
Figure 26 - View of the testing set up: a) LVDTs and deformation measurements in the specimens; b)
general view of the equipment and data acquisition system used in the tests of the prisms. ............... 35
Figure 27 – Typical diagram stress-strain of prisms obtained from the compressive load test. ........... 36
Figure 28 – Method used to calculate the fracture energy, graphs plotted to samples C_P_06 and
C_S_03. ................................................................................................................................................. 38
Figure 29 - Correlation between peak compressive stress (fc) and the compressive fracture energy for
the tested specimens. ............................................................................................................................ 40
Figure 30 - Correlation between peak compressive stress (fc) and the modulus of elasticity for the
tested specimens. .................................................................................................................................. 40
Figure 32 - Correlation between peak compressive stress (fc) and the compressive fracture energy for
the tested prisms. .................................................................................................................................. 40
Figure 31 - Correlation between peak compressive stress (fc) and the modulus of elasticity for the
tested prisms. ........................................................................................................................................ 41
Figure 33 – Specimens to test in shear with axial compressive load: a) dimensions of specimens
(mm); specimens after preparation, without notches. ........................................................................... 44
Figure 34 – Assembling process of prisms to shear test. ...................................................................... 44
Figure 35 – Test set up adopted (samples were instrumented with four LVDTs, two in each direction).
............................................................................................................................................................... 45
Figure 36 – Complete curve shear stress vs. displacement of specimen S_N3_07, data obtained from
LVDT_P1 and LVDT_P2........................................................................................................................ 47
Figure 37 – Curves representing the shear stress vs. displacement from specimens tested with
different normal stress level, data obtained from LVDT_P2. ................................................................. 47
Figure 38 – Samples after the shear load test: a) specimen, failure by the weakened surface; b) prism,
failure by the bonding surface mortar/block........................................................................................... 48
Figure 39 - Relationship between normal and shear stress in specimens. ........................................... 51
Figure 40 - Relationship between normal and shear stress in prisms. ................................................. 51
LIST OF TABLES
Table 1 – Strength of adobe from different locations (adapted from [13]). ............................................ 11
Table 2 - Data from the granulometric analysis of the adobe sample. .................................................. 19
Table 3- Flow rest values of the mortar prepared to the prisms assemblage. ...................................... 20
Table 4 - Results from the three point bending test to mortar specimens. ............................................ 22
Table 5 - Results of the compression test to mortar specimens. .......................................................... 23
Table 6 - Values of the mechanical properties and fracture energy for the specimens. ....................... 29
Table 7 - Values of the mechanical properties and fracture energy for the prisms. .............................. 30
Table 8 - Elastic properties and compressive strength of the adobe specimens. ................................. 37
Table 9 - Elastic properties and the compressive strength of the prisms. ............................................. 37

Mechanical characterization of traditional adobe masonry elements
Erasmus Mundus Programme
ADVANCED MASTERS IN STRUCTURAL ANALYSIS OF MONUMENTS AND HISTORICAL CONSTRUCTIONS xiii
Table 10 - Values of the mechanical properties and compressive fracture energy for the adobe
specimens. ............................................................................................................................................ 38
Table 11 - Values of the mechanical properties and compressive fracture energy for the prisms. ...... 39
Table 12 –Mechanical and fracture properties of the specimens (normal stress level of 0.1 N/mm2 ). 48
Table 16 –Mechanical and fracture properties of the specimens (normal stress level of 0.2 N/mm2 ). 49
Table 17 –Mechanical and fracture properties of the specimens (normal stress level of 0.3 N/mm2). . 49
Table 12 –Mechanical and fracture properties of the prisms (normal stress level of 0.1 N/mm2 ). ....... 49
Table 13 –Mechanical and fracture properties of the prisms (stress level of 0.2 N/mm2). ................... 50
Table 14 –Mechanical and fracture properties of the prisms (normal stress level of 0.3 N/mm2 ). ....... 50

Erasmus Mundus Programme
ADVANCED MASTERS IN STRUCTURAL ANALYSIS OF MONUMENTS AND HISTORICAL CONSTRUCTIONS 1
CHAPTER 1
INTRODUCTION
1.1 Foreword
Earthen architecture is considered one of the most ingenious methods used by humankind to create a
built environment using local existing resources. Since thousands of years ago palaces, religious
constructions and monuments, buildings in city centres and rural constructions have been created with
earthen techniques [1]. After their construction some of these monuments gained an important cultural
connotation, however in other cases, as in many city centres, the recognition of their cultural
significance only occurred mainly in the last decades.
Constructions using earthen materials are not only an inheritance from the past. At present time about
30% of the world population and 50% of the population in the developing countries lives in earthen
buildings [2]. Currently, in many continents, it can be found houses and other constructions being used
by the population where earth is used as raw material. In certain countries in Africa, for example, an
important part of the traditional buildings located in rural areas are built with earthen solutions, as for
the case of some countries in South America and some regions in Asia. In Middle East, this type of
architecture reached a high level of specialization and technical quality with the use of vaulted
systems and domes, and in some cases it can be found buildings with several storeys [3]. Also in
Europe, an important number of earthen buildings made during the last century can be found, mainly
in rural areas. As example of this significance, Houben and Guillaud estimates that 15% of the French
rural population lives in buildings made with adobe, rammed earth or daub [4].
Preservation and protection of this heritage is nowadays a difficult mission to the local and
international community. Especially because of the increasing threats represented by natural hazards
and man-made actions, earthen structures need specific attention in terms of conservation and
maintenance. In response to this demand UNESCO started a programme devoted to this type of
construction, i.e. World Heritage Earthen Architecture Programme (WHEAP), [1] [5].

CHAPTER 1 - Introduction
Erasmus Mundus Programme
2 ADVANCED MASTERS IN STRUCTURAL ANALYSIS OF MONUMENTS AND HISTORICAL CONSTRUCTIONS
1.2 Motivation
Due to the lack of knowledge and information about the adobe masonry properties motivates the
development of this experimental research. Thus, the development of this experimental campaign was
justified by the absence of information about some mechanical characteristics presented by existing
traditional adobe masonry. Previous studies have been dedicated to characterize the behaviour of this
constructive technique, the capacity of adobe masonry walls, and the properties of the materials, but it
is recognized the need for specific experimental data for the calibration of numerical models.
The amount and importance of adobe constructions in Aveiro region justifies the effort in obtaining
data to support strengthening and rehabilitation measures. The personal interest of the author in
traditional materials and low environmental impact interventions during the rehabilitation process was
a source of extra motivation to develop the research work that is presented in the next chapters.
1.3 Scope and objectives
This thesis aims to provide experimental data about properties that are considered essential when
talking about adobe masonry characterization. In general, information obtained from experimental
campaigns is limited to compressive strength and in some cases also indirect tensile strength and
elasticity modulus. The present research is dedicated to determine also the fracture energy in
compressive, tensile and shear tests.
The thesis is divided in seven chapters presented in the following sequence:
Chapter 1: In this chapter a brief introduction to earthen architecture; motivation to the research;
scopes and objectives are presented.
Chapter 2: Presentation of the state of the art, special attention is given to the characterization of
adobe. In the first section a general description of the main techniques using earthen materials and
their historical importance is presented. In the second the importance of adobe construction in Aveiro
region is reported. Finally, the third and last section is dedicated to the description of the mechanical
characterization and the different strategies used to obtain properties that can be used to define the
behaviour of this material in structural elements.
Chapter 3: Description of the experimental campaign to the mortar used in the prisms is presented. In
the first section the type of mortars used in adobe constructions from Aveiro region is explained. The
second section presents the granulometric analysis done to the material used to prepare the mortar
applied on the prisms joints. The third section is referred to the mechanical characterization of the
mortar samples prepared during the assemblage of the prisms.

Mechanical characterization of traditional adobe masonry elements
Erasmus Mundus Programme
ADVANCED MASTERS IN STRUCTURAL ANALYSIS OF MONUMENTS AND HISTORICAL CONSTRUCTIONS 3
Chapter 4: The research developed with the aim to characterize the behaviour of adobe specimens
and prisms when subjected to uniaxial tensile loads is presented. The chapter is composed by four
sections. The first section is dedicated to describe the preparation of the specimens and prisms used
in the testing. In the second section the test set up and the procedures followed during the tests are
presented. In the third section the results obtained from the tests are presented and finally the fourth
section is dedicated to the analysis and discussion of the results.
Chapter 5: The campaign of compressive load tests to adobe specimens and prisms is presented in
this chapter. The first section is devoted to define the tasks done during the preparation of the
specimens and prisms used in the testing. The second section is dedicated to the test set up and the
procedures followed during the testing campaign. Results obtained from the tests are presented in the
chapter three and the last section is dedicated to results analysis and discussion.
Chapter 6: Dedicated to the experimental campaign to characterize the shear behaviour of adobe
specimens and adobe prisms with hydraulic lime mortar joints. The structure of the chapter is divided
in four sections: the first introduces the work carried to prepare the samples; the second presents the
testing set up and the procedures followed during the execution of the campaign; in the third section
results obtained in the shear load tests are exposed; in the fourth section the analysis and discussion
of the results can be consulted.
Chapter 7: This last chapter is dedicated to the conclusions of developed work and to further research
needs about this area of investigation.
.


Erasmus Mundus Programme
ADVANCED MASTERS IN STRUCTURAL ANALYSIS OF MONUMENTS AND HISTORICAL CONSTRUCTIONS 5
CHAPTER 2
STATE OF THE ART
In this chapter a brief description of the state of the art is presented, giving particular attention to the
characterization of earthen materials, namely adobe. The chapter is divided in sub-sections for a
better understanding of the evolution of the knowledge and of the scientific work produced in the last
years.
In the first section, a general description of the main techniques using earthen materials and their
historical importance is presented. In the second the significance of adobe construction in Aveiro
region is reported. Finally, the third and last section is dedicated to the description of the testing
strategies and results of tests for the mechanical characterization adobe in structural elements.
2.1 General aspects
Earthen materials present several attractive characteristics: low cost, locally available, recyclable,
good thermal and acoustic properties and reduced energy consumption during the transformation into
a building material or element [6]. These characteristics lead to a wide distribution around the world,
Figure 1, of earth constructions, justified by the advantages associated to earthen construction, in
contrast to other industrialized building materials and solutions.
Figure 1 – World distribution of earthen architecture [7].

CHAPTER 2 - State of the art
Erasmus Mundus Programme
6 ADVANCED MASTERS IN STRUCTURAL ANALYSIS OF MONUMENTS AND HISTORICAL CONSTRUCTIONS
Principal techniques used in earthen architecture
A wide a group of techniques are generally cited when referring to earthen architecture, as stated by
Houben and Guillaud in [4] where they present the results of a survey on techniques commonly used
around the world, and also techniques that are only used in specific regions or communities, Figure 2.
In the next paragraphs the three techniques with higher dispersion geographically are briefly
introduced.
Adobe, also known as ”mud bricks”, is a very simple technique that consists in filling wooden
formworks with earth that was previously mixed with water. Straw or another type of fibres can be also
added to the mix in order to improve the strength of the blocks. The use of adobe generally leads to
very simple building techniques, evidencing the fact that many of the ancient earth constructions were
made of adobe. Adobe was used also in complex structures, like vaults and domes [6] [8].
CEB - the use of compressed earth blocks (CEB) has been increasing significantly in the last
decades. The CEB represent an “evolution” of the adobe bricks, using a specific device, machine or
tool to compress the earth inside a mould. The pressure can be carried out manually or mechanically
depending on the type of device used. The earth consistency is comparable to that used in rammed
earth allowing obtaining earth blocks that are heavier and more resistant than traditional adobe bricks.
The first machine used to make CEB was the CINVA-Ram constructed in 1956 and since then other
models were developed. Nowadays, it is possible to find machines that achieved an high level of
industrialization procedure [8].
The use of binders and fibres to achieve higher compressive strength and a better behaviour in the
presence of moister has been studied by several authors, obtaining an improvement of both
characteristics [9] [10] [11].
Rammed earth - Rammed earth is a construction technique in which soil is taken from the ground and
compacted to form monolithic walls. Removable formwork is installed, and the soil is compacted within
it. Since the first times in this technique wooden formwork were used, nowadays steel formwork is
replacing the wood [8].
Some examples of monumental constructions can be found in Lhasa, the Potala Palace, portions of
the Great Wall in China, or the Alhambra in Granada, Spain. Rammed earth has been used by man
for thousands of years and is currently experiencing a revival in some parts of the world as a result of
its inherent characteristics promoting the sustainability. It was shown by Jaquin et al. that rammed
earth technique is likely to have originated independently in China and around the Mediterranean
region, and spread to other parts of the world associated to the movement of people [12].

Mechanical characterization of traditional adobe masonry elements
Erasmus Mundus Programme
ADVANCED MASTERS IN STRUCTURAL ANALYSIS OF MONUMENTS AND HISTORICAL CONSTRUCTIONS 7
Figure 2 - Schematic description of the different building techniques with earth [4].
2.2 Adobe constructions in Aveiro Region
Adobe was intensely used in almost all types of buildings in Aveiro region until the second half of the
last century. According the information from local authorities, about 25% of the existing buildings in
Aveiro city are made of adobe, and considering the entire district the percentage raises to 40% [13].
During centuries, structural masonry walls from houses, churches and other constructions were built
with this material in the region of Aveiro. A significant number of urban adobe buildings are of cultural,
historical and architectonic recognized value, namely of the “Art Nouveau” style. Nevertheless, the
main part of adobe construction can be found in the outskirts of the city and rural areas, where adobe
was used in the construction of rural houses, walls for the delimitation of properties, water wells and
warehouses [14].
Recent studies from Silveira et al. [15] observed that, in the two neighbourhoods of Vera Cruz and
Glória, at present a significant number of adobe buildings are still being in use. The majority of these
buildings are used with residential purposes, justifying the need for increasing the knowledge
regarding the material and masonries that can support future rehabilitation and strengthening actions.
In this document, it is also reported that about 70% of the buildings have been considered with a
“satisfactory” or better sate of conservation, and only about a 7% have been evaluated as “bad”. The

CHAPTER 2 - State of the art
Erasmus Mundus Programme
8 ADVANCED MASTERS IN STRUCTURAL ANALYSIS OF MONUMENTS AND HISTORICAL CONSTRUCTIONS
majority of these existing buildings, if properly rehabilitated and strengthened, can fulfil the
requirements of safety and comfort compatible with those required to new constructions.
The generalised use of adobe in the constructions in this region was largely extended, due to the
availability of the raw material, in this case the coarse sand and argillaceous earth. The use of lime as
binder was frequent [13].
2.3 Mechanical characterization of adobe masonry
With the diffusion of the laboratory equipment, the mechanical characterization of materials is
nowadays more common than in the last decades.
Several mechanical properties have been studied by different authors. Some works are focused on
the characterization of adobe units and other are focussed in the study of the interface (joint) between
the mortar and the units. Generally, the properties considered relevant to characterize the behaviour
of adobe constructions are: compressive strength, shear strength and elastic modulus. Only in a
reduced number of documents it is analysed the tensile strength and fracture energy. The tensile
strength is typically considered as 10% of the corresponding compressive strength [6], as in the case
of other brittle materials.
Relevant previous research outputs regarding the mechanical characterization of adobe units and
masonry are briefly mentioned in the next sections.
2.3.1 Compressive strength
Generally, compressive strength is the most studied property of brittle and quasi-brittle materials. This
is also verified in the case of adobe. Several correlations between this property and the modulus of
elasticity or tensile strength can be found in the literature ([13], [16]), and also in normative documents
[17].
Minke [6] refers that in general the compressive strength of dry building elements made of earth can
range in general from 0.5 to 5.0 MPa. These values depend not only on the quantity and type of clay
used, but also on the grain size distribution of silt and aggregates, as well as on the method of
preparation and compaction of the units.
An extensive experimental campaign for the characterization of adobe units from Aveiro region was
developed in Aveiro University, [18][19][13][20]. From the results obtained in the compressive load
tests, it was observed a large variability of the compressive strength, which is typical for this
heterogeneous material. The values obtained for the compressive strength of adobes collected from

Mechanical characterization of traditional adobe masonry elements
Erasmus Mundus Programme
ADVANCED MASTERS IN STRUCTURAL ANALYSIS OF MONUMENTS AND HISTORICAL CONSTRUCTIONS 9
existing buildings range from 0.5 to 1.5 MPa. Figure 3 shows the typical stress-strain diagrams
obtained.
Figure 3 - Examples of stress vs. strain relations obtained in simple compression tests on adobe specimens: a) adobes from houses; b) adobes from dividing walls [13].
A similar work was developed in Calabria, Italy, where specimens from earth buildings called
“casedde” were collected and tested in compression. From the mechanical characterization of adobe
samples from seven different buildings, it was observed a compressive strength ranging from 0.4 to
0.7 MPa [2].
The inclusion of fibres and stabilizers in the adobe is common in some parts of the world. Achenza [9]
studied the compressive strength of earthen specimens when a natural stabilizer and natural polymers
are added to the soil. In that study, residues of beetroot and tomatoes from production of sugar and
tomato-sauce were used. The stabilization with polymers can give to the earth a good behaviour under
the water action. It was also found that compression strength increased significantly, see Figure 4.
From the compressive tests, were obtained strength values of 4.4 MPa for dry specimens stabilized
with fibres and natural polymers, 2.6 MPa for wet specimens stabilized with fibres and natural
polymers, and 2.5 MPa for dry specimens stabilized only with fibres.

CHAPTER 2 - State of the art
Erasmus Mundus Programme
10 ADVANCED MASTERS IN STRUCTURAL ANALYSIS OF MONUMENTS AND HISTORICAL CONSTRUCTIONS
Figure 4 – Stress-strain curves for specimens stabilised with natural polymers and without natural polymers [9].
In the production of adobes and compressed earth blocks, commonly, it is used a binder to stabilize
the soil, normally cement or lime. Walker [21] proved that the compressive strength of blocks from soil
stabilized with cement, the so called soil-cement blocks, presents a strength that increases linearly
with the cement content and decreases if clay is added to the mixture. From his study, it was observed
also that the total water absorption and initial rates of absorption increased with the clay mineral
content of the test blocks. In Figure 5 it is observed the compressive strength values obtained for two
types of blocks, with different cement and clay contents.
Figure 5 - Influence of cement and clay content on block compressive strength [21].

Mechanical characterization of traditional adobe masonry elements
Erasmus Mundus Programme
ADVANCED MASTERS IN STRUCTURAL ANALYSIS OF MONUMENTS AND HISTORICAL CONSTRUCTIONS 11
2.3.2 Tensile strength
Tensile strength tests are less commonly adopted for the material characterization than the
compressive strength tests. Moreover, direct tensile tests are a first option to obtain the values of
tensile behaviour material properties. But, with this test is difficult to perform due to the test setup and
equipment required. On the other hand, indirect tensile bending tests “CPC 6 Tension by splitting of
concrete specimens” [22], are commonly accepted for determining the mechanical properties in
tension and the fracture energy in case of both elastic-plastic and brittle-like materials (i.e. rocks,
concrete, masonry, ceramics, etc.) [23].
A testing campaign to characterise adobe specimens with indirect tensile strength tests was carried
out by Silveira et al. [13]. It was used a testing machine controlled in displacement and the splitting
tests were carried out with a velocity rate of 1 mm/min. From these tests was obtained an average
tensile strength of 0.19 MPa. In Figure 6-b is represented the mean tensile strength of adobe
specimens taken from houses and land dividing walls in Aveiro. Comparing these values with the
results obtained by other authors, in research works characterizing adobes from different locations, it
is possible to observe that the range of adobe tensile strength may range between 0.17 and 0.43 MPa
(see Table 1).
Table 1 – Strength of adobe from different locations (adapted from [13]).
Location Compressive strength
(MPa) Tensile strength
(MPa)
Aveiro – Portugal 1.17 0.18 Mexico 1.18 0.27 Mexico 0.51–1.57 0.20–0.43
Colombia 3.04 0.41 Morocco 2.83a 0.18-0.35
Italy 0.29–1.56 0.17–0.40
a) b)
Figure 6 – a) Curves stress-strain for adobe specimens tested in tension [24]; b) Mean tensile strength of adobe specimens taken from houses and land dividing walls, with indication of standard deviation
[13].

CHAPTER 2 - State of the art
Erasmus Mundus Programme
12 ADVANCED MASTERS IN STRUCTURAL ANALYSIS OF MONUMENTS AND HISTORICAL CONSTRUCTIONS
2.3.3 Shear strength
Shear failure may occur in adobe masonry walls when subjected to in-plane loading. As a
consequence, the structural behaviour of masonry joints has been carefully studied, for a
comprehensive analysis works can be consulted, see for example [25], [26] and [27].
The shear strength of adobe prisms assembled with units cut from existing adobe blocks was studied
by Varum et al [18]. From diagonal compression tests on 8 specimens according to the method
presented in RILEM, [22], it was found a shear strength varying from 0.05 to 0.19 MPa. The obtained
stress-strain curves are presented in Figure 7.
Figure 7 – Stress-strain curves obtained from diagonal compression tests on adobe wallets [18].
The shear strength characterization can be performed with in-situ tests. Liberatore et al. [28] have
performed several tests to characterise the properties of adobe masonry walls. The shear strength
may be obtained in diagonal compression tests, as presented in Figure 8a, with a test procedure
developed with two distinct loading histories: 1. a cycle of loading-unloading, followed by a monotonic
loading up to failure; 2. a monotonic loading up to failure. The diagrams of load-strain along the loaded
diagonal and the secondary diagonal for the first load testing conditions are reported in Figure 8b.
From the first test, an equivalent initial shear strength, fv0, can be calculated by (1):
fv0 = P/ (√2 bt) (1)
where, P represents the force, b and t represents the length of the tested wall and its thickness (b =
0.895 m ; t = 0.200 m, for the example showed in the figure).
The very low value of fv0, 0.0206 MPa, confirms the weakness of adobe walls in terms of this
mechanical property.
0.00
0.05
0.10
0.15
0.20
0.25
0.000 0.002 0.004 0.006 0.008 0.010 0.012
Strain (mm/mm)
Stress (MPa) H_10_w 02d
H_10_w 03d
H_05_w 03d
H_05_w 04d
H_05_w 05d
W_10_w 03d
W_10_w 04d
W_10_w 05d

Mechanical characterization of traditional adobe masonry elements
Erasmus Mundus Programme
ADVANCED MASTERS IN STRUCTURAL ANALYSIS OF MONUMENTS AND HISTORICAL CONSTRUCTIONS 13
a) b)
Figure 8 – In-situ shear test: a) test set up; b) stress-strain relation for the first test loading history [28]
The capacity of masonry joints or units under shear associated to a normal compression can be
represented by the Coulomb friction law, which establishes a linear relationship between the shear
stress (τ) and the normal stress (σ):
τ = c + tan ø.σ
(2)
where, c represents the cohesion and tan ø is the tangent of the friction angle on the interface of the
surface under failure. When higher normal compressive stresses are achieved the validity of Coulomb
failure mechanism is lost, instead a new failure mechanism occur due to crushing and shearing of the
material. In this case, a cap model can be adopted to represent failure of the combined fracture
surfaces [29].
The change of volume of the sample when shear loads are acting is called dilatancy angle and
represents the ratio between the normal displacement un and the shear displacement us. The opening
of the crack or joint is associated to positive dilation, whereas negative values of dilatancy represent
the compaction of the crack joint.
a) b) c)
Figure 9 - Different types of shear tests: (a) couplet test; (b) van der Pluijm test; and, (c) triplet test, [29].

CHAPTER 2 - State of the art
Erasmus Mundus Programme
14 ADVANCED MASTERS IN STRUCTURAL ANALYSIS OF MONUMENTS AND HISTORICAL CONSTRUCTIONS
In the research carried out by Liberatore et al, [28], adobe specimens previously collected from the
building site were tested to evaluate the shear resistance in a dry state combined with normal stress.
Three specimens, with cylindrical shape (diameter of 60 mm and height of 23 mm), trimmed from the
existing blocks, were tested to evaluate the shear resistance of dry adobe. The values of the normal
stresses adopted in the laboratory testing were assigned taking into account the in-situ stress state
(0.025 MPa, 0.050 MPa and 0.100 MPa). The experimental results presented in Figure 10 show the
variations of the shear and vertical displacement (sv) versus the horizontal displacement (sh). Positive
vertical displacement indicates a reduction of specimen height.
a) b)
Figure 10 - Direct shear tests: (a) shear strength; (b) adobe specimens’ height variation [28].
2.3.4 Fracture energy
The bond between units and mortar is often the weakest link in masonry assemblages. The nonlinear
response of the joints, which is controlled by the unit–mortar interface, is one of the most relevant
features of masonry behaviour characterisation. Two different phenomena occur at the unit–mortar
interface, one associated with tensile failure (mode I) and the other associated with shear failure
(mode II). For the purpose of numerical simulation, direct tension testing should be adopted because it
allows for the full representation of the stress–displacement diagram and provides the correct strength
value [30].
The typical stress-displacement diagram for quasi-brittle materials in tension and compression is
presented in Figure 11. It is assumed that the inelastic behaviour in tension and compression is
described by the integral of the diagram stress-displacement. The integral of these diagrams, define
the material properties called respectively as fracture energy Gf and compressive fracture energy Gc.

Mechanical characterization of traditional adobe masonry elements
Erasmus Mundus Programme
ADVANCED MASTERS IN STRUCTURAL ANALYSIS OF MONUMENTS AND HISTORICAL CONSTRUCTIONS 15
Masonry presents other type of failure mechanism, normally identified as mode II, consisting in the slip
of the unit-mortar interface when subjected to shear loading, see Figure 12. Once more, it is assumed
that the inelastic behaviour in shear can be described by the mode II fracture energy GIIf defined by
the integral of the stress-displacement diagram in the absence of normal confining load.
a) b)
Figure 11 - Typical behaviour of quasi-brittle materials under uniaxial loading and definition of fracture energy: (a) tensile loading; (b) compressive loading [31].
Figure 12 - Behaviour of masonry under shear and definition of mode II, fracture energy GIIf (c denotes
the cohesion) [31]..


Erasmus Mundus Programme
ADVANCED MASTERS IN STRUCTURAL ANALYSIS OF MONUMENTS AND HISTORICAL CONSTRUCTIONS 17
CHAPTER 3
MORTAR CHARACTERIZATION
Herein a description of the experimental campaign aiming at the characterization of the adobe and
mortar used in the prisms is presented. The research was carried out in the Laboratory of the
Department of Civil Engineering of the University of Aveiro.
The chapter is divided in three parts. The first describes the type of mortars that can be find in adobe
constructions from Aveiro region. The second section presents the granulometric analysis done to the
material used to prepare the mortar applied on the prisms joints. The third section is referred to the
mechanical characterization of the mortar samples prepared during the assemblage of the prisms.
Once the prisms used to the shear and tensile tests were made in a different day than the ones for the
compression tests, two set of values are presented for the mechanical characterization.
3.1 General overview
A characterization of the mortars used in adobe constructions from Aveiro region was developed by
Coroado [32]. In this research, it was concluded that the mechanical compressive strength average
values were 1.55 MPa and 1.22 MPa for the rendering and joint mortars respectively. Also the adobe
mechanical compressive strength was found to be in general low, near 0.50 MPa. Other researches
have been implemented in order to obtain values of the compressive strength of mortars from existing
buildings from this region, [19], [18]. The results obtained in these works show a big variability of
mortars properties, with unconfined average compressive strengths values ranging from 1.68 MPa to
0.45 MPa.
Adobe masonry requires to be protected with more resistant air lime type renders but presenting a
compatible composition with the support. It must be stressed that traditionally, for general ancient
masonry, joint mortars and renders are generally more deformable, mechanically weaker and more
permeable to water than the other masonry elements. Consequently the mortar elements have a
protection function delaying the water penetration process and contributing to the wall strength
allowing the dissipation of tensions produced by small movements of the structure [32].

CHAPTER 3 - Mortar characterization
Erasmus Mundus Programme
18 ADVANCED MASTERS IN STRUCTURAL ANALYSIS OF MONUMENTS AND HISTORICAL CONSTRUCTIONS
Considering the generally low values of the compressive strength, the mortar formulated to this
research intended to equalize the mortar from existing buildings. The option of the hydraulic lime
selection as binder was taken due to the lower curing time presented by this material comparing to air
lime. The aggregate used in the mortar was the same used in the studied adobes once historically
most of the times there was no distinction between the aggregate used to make adobes and the ones
used in the joint mortar.
The hydraulic lime used in the preparation of the mortar was from a commercial brand, Cimpor
category NHL5, and the formulation 1:3 (binder: aggregate in volume) with an amount of water of 1/5
of the total volume was followed.
3.1 Aggregate granulometric distribution
In order to obtain the particle size distribution, grading of the adobe a granulometric analysis was
carried out. The granulometric analysis was made to a sample obtained from one adobe considered
representative of the material collected to this research. In Figure 13 is possible to observe the main
steps to complete the test procedure according the standard NP EN 933-1 [33].
The sample was crushed and then divided into size fractions throughout the dry sieving method,
passing by it in decreasing apertures, results of the process can be consulted in Table 2.
Figure 13 - Granulometric analysis of adobe sample.
The aggregate used in the mortar was the same of the crushed adobe, but in order to obtain a better
workability the fraction with the lower sieve sizes, d, larger or equal to 4.0 mm was subtracted. The
total dry mass of the adobe sample was 1405.5 g and the mortar aggregate was considered to have a
mass of 1357.9 g.

Mechanical characterization of traditional adobe masonry elements
Erasmus Mundus Programme
ADVANCED MASTERS IN STRUCTURAL ANALYSIS OF MONUMENTS AND HISTORICAL CONSTRUCTIONS 19
Table 2 - Data from the granulometric analysis of the adobe sample.
mesh mm retained material
(g) % retained
material %cumulative
retained material %cumulative
passed material
adobe mortar adobe mortar adobe mortar adobe mortar
2 1/2 63.0 0.0 - 0.00 0.00 0.00 0.00 100.00 100.00
1 1/4 31.5 0.0 - 0.00 0.00 0.00 0.00 100.00 100.00
5/8 16.0 0.0 - 0.00 0.00 0.00 0.00 100.00 100.00
5/16 8.0 4.2 - 0.30 0.00 0.30 0.00 99.70 100.00
5 4.0 38.4 - 2.73 0.00 3.03 0.00 96.97 100.00
10 2.0 246.0 246.0 17.50 18.11 20.53 18.11 79.47 81.89
18 1.0 570.1 570.1 40.56 41.98 61.09 60.10 38.91 39.90
35 0.500 490.9 490.9 34.92 36.15 96.01 96.24 3.99 3.76
60 0.250 47.1 47.1 3.35 3.47 99.37 99.71 0.63 0.29
120 0.125 2.8 2.8 0.20 0.21 99.56 99.92 0.44 0.08
230 0.063 1.0 1.0 0.07 0.07 99.64 99.99 0.36 0.01
- fines 0.1 0.1 - - - - - -
total weight (g) 1400.5 1357.9
% fines passing by sieve 0.063 mm 0.01 0.01
The amount of material on each sieve was measured and then the grading of the sample was
calculated. The results of the sieve analysis were plotted on a log scale to produce a particle size
distribution chart, see
Figure 14. The range of grading of the adobe sample according NP EN 933-1 and BS EN 13139,
corresponds to 20.2% of coarse aggregates (larger aggregate sizes with D greater or equal to 4 mm
and d greater than or equal to 2 mm), and 96.6% of fine aggregates (D less than or equal to 4 mm,
where d and D represents the lower and upper sieve sizes respectively).
To validate the results, the percentage of fines was calculated in accordance to (3).
f = 100*P / M1 (3)
Where:
- f is the percentage of fines;
- P is the mass of the material remaining in the pan;
- M1 is the dried mass of the tested portion.
To the validation of the results f must be less than 1%; in this test a value of 0.36% was obtained.

CHAPTER 3 - Mortar characterization
Erasmus Mundus Programme
20 ADVANCED MASTERS IN STRUCTURAL ANALYSIS OF MONUMENTS AND HISTORICAL CONSTRUCTIONS
Figure 14 – Grading obtained from the granulometric analysis to one adobe sample.
3.2 Mortar characterization
Several tests have been made to characterize the mortar used in the joints of prisms subjected to
compression, tension and shear loads. The mortar characterization campaign was implemented to
provide information about the workability and compressive and flexural strength.
3.2.1 Flow table test
According to EN 1015-3 Methods of test for mortar for masonry [34], the workability of the hydraulic
lime mortar can be estimated with the flow table test, see Figure 15. The flow value is determined by
measuring the mean diameter of a test sample. The test procedure involves placing the mould in the
midpoint of the table and filling it in two layers, each layer being tamped ten times with a tamper. The
excess of mortar is then removed from the top of the mould. After 15 seconds the table is jolted 15
times at a rate of one jolt per second. The diameter of the spread mortar is measured in two directions
at right angles to each other using the scale printed on the flow table, and both results can be
consulted in Table 3.
Table 3- Flow rest values of the mortar prepared to the prisms assemblage.
Sample d1
mm d2
mm Average
mm
mortar 22/05, (shear and tensile prisms) 145 150 148
mortar 28/05, (compression prisms) 150 155 153
0
10
20
30
40
50
60
70
80
90
100
0.0 0.1 1.0 10.0 100.0
% c
um
ula
tive p
assed m
ate
rial
square aperture of the mesh (mm)
mortaraggregate
adobe

Mechanical characterization of traditional adobe masonry elements
Erasmus Mundus Programme
ADVANCED MASTERS IN STRUCTURAL ANALYSIS OF MONUMENTS AND HISTORICAL CONSTRUCTIONS 21
The workability of mortars can be divided in three categories: stiff mortars, when presenting a flow
value less than 140 mm; plastic mortars with flow value between 140 mm and 200 mm; soft mortars
exhibiting a flow value greater than 200 mm [35]. Both of the prepared mortars can be considered as
plastic mortars according the read flow table value of 148 and 153 mm.
Figure 15 – Flow table test to the hydraulic lime mortar.
3.2.2 Flexural and compressive strength of mortar
The flexural strength of a hardened mortar can be determined by the three point loading test of a
specimen. After the failure is reached, the compressive strength is determined in each half of the
specimen.
The determination of flexural strength according the EN 1015-11 is carried out when the specimens
present an age of twenty-eight days. In this research the main objective was the characterization of
the mortar at the time of the testing campaign to prisms, due to this condition the flexural and
compressive tests were made to the mortar specimens at an age of six weeks.
The dimensions of the specimen must to be 160 mm x 40 mm x 40 mm. Previously to the execution of
the specimens the metal mould is lubricated with a thin layer of mineral oil. The mould is filled in two
layers each layer being compacted with twenty five strokes of the tamper [36], see also Figure 16.

CHAPTER 3 - Mortar characterization
Erasmus Mundus Programme
22 ADVANCED MASTERS IN STRUCTURAL ANALYSIS OF MONUMENTS AND HISTORICAL CONSTRUCTIONS
Figure 16 - Specimens used to the mechanical characterization of the mortar.
The equipment used was a universal testing machine from Shimadzu, model AG-IC 100kN with a load
cell of 5 kN. This equipment presents two supporting rollers and one loading roller, located above the
test specimen at the midway between the supporting rollers as indicated in the standards.
The load was applied to the test specimens at a rate of 10 N/s producing the failure in the period of
time period recommended in standards, thirty to ninety seconds. The flexural strength, f, is calculated
from (4) and is presented in Table 4:
f = 1.5*F*l /(b*d2)
(4)
Where b and d are the internal dimensions of the prism mould, l is the distance between the
supporting rollers and F is the applied force.
Table 4 - Results from the three point bending test to mortar specimens.
Sample Max. Force Max. Stress
(N) (N/mm2)
Prisms shear and tensile load test
HM_S_T_22/05 383.05 0.90
HM_S_T_22/05 337.78 0.79
HM_S_T_22/05 283.44 0.66
Average 300.17 0.70
Standard deviation
80.27 0.19
CoV (%)
27 27
Prisms compression load test
HM_S_T_28/05 325.97 0.76
HM_S_T_28/05 424.91 1.00
HM_S_T_28/05 380.94 0.89
Average 377.27 0.88
Standard deviation
49.57 0.12
CoV (%)
13 13

Mechanical characterization of traditional adobe masonry elements
Erasmus Mundus Programme
ADVANCED MASTERS IN STRUCTURAL ANALYSIS OF MONUMENTS AND HISTORICAL CONSTRUCTIONS 23
After the flexural test the compressive strength was determined using the broken halves of the prism
by means of a compression jig in the testing machine. The load applied to a face casted against the
steel face of the mould with a rate of 50 N/s must to produce the failure of the specimen in a time
period of thirty to ninety seconds. The compressive strength was recorded in all the six halves of
mortar specimen and is presented in Table 5.
Table 5 - Results of the compression test to mortar specimens.
Specimen Max. Force Max. Stress
(N) (N/mm2)
Prisms shear and tensile load test
HM_C_22/05 4316.41 2.70
HM_C_22/05 4078.13 2.55
HM_C_22/05 3802.19 2.38
HM_C_22/05 3787.50 2.37
HM_C_22/05 4353.13 2.72
HM_C_22/05 4585.94 2.87
Average
4153.88 2.60
Standard deviation
321.39 0.20
CoV (%)
8 8
Prisms compression load test
HM_C_28/05 cell limit -.-
HM_C_28/05 4766.41 2.98
HM_C_28/05 4856.56 3.04
HM_C_28/05 4457.81 2.79
HM_C_28/05 3949.69 2.47
HM_C_28/05 3888.59 2.43
Average
4383.81 2.74
Standard deviation
449.74 0.28
CoV (%)
10 10
The results obtained from the testing campaign show values slightly higher than the ones that can be
expected in existing constructions, nevertheless these results can be used as indicator to conservation
and rehabilitation situations were new mortars are used.


Erasmus Mundus Programme
ADVANCED MASTERS IN STRUCTURAL ANALYSIS OF MONUMENTS AND HISTORICAL CONSTRUCTIONS 25
CHAPTER 4
TENSILE LOAD TESTS IN SPECIMENS AND PRISMS
This chapter presents the research developed with the aim of characterizing the behaviour of adobe
specimens and prisms when subjected to uniaxial tensile loads. The chapter is composed by four
sections. The first section is dedicated to the description of the preparation of the specimens and
prisms used in the testing. The second section presents the test set up and the procedures followed
during the tests. In the third section the results obtained from the tests are presented and finally the
fourth section is dedicated to the analysis and discussion of the results.
4.1 Specimens and prisms preparation
As mentioned in the introductory chapter, the adobe blocks where collected from a building in the
region of Aveiro and then stored in the Laboratory of the Civil Engineering Department from the
University of Aveiro.
The preparation of the samples started with the cutting of the adobes with a universal table saw using
a circular diamond blade. This cutting system uses water to refrigerate the blade, but this process can
affect the adobe resistance once the material gets saturated with water. To prevent the disintegration
of the adobe samples, a controlled amount of water was used, sufficient to refrigerate the blade and at
same time not enough to cause damage to the samples.
After cutting the specimens and blocks to the prisms assemblage, they were stored in an area with
natural ventilation to promote the decreasing of the moisture content to levels considered as room
humidity, air relative humidity around 70%.
The material used to glue the samples to the plates was a polyester resin generally used for fixings in
masonry, concrete and other type of materials. The advantage of using this resin is the processing
time of 5 min and the curing time of 60 min, to a temperature around 25 ºC, this way it was possible to
prepare the specimen and place it in the testing machine plates before the resin started to cure.

CHAPTER 4 - Tensile load tests in specimens and prisms
Erasmus Mundus Programme
26 ADVANCED MASTERS IN STRUCTURAL ANALYSIS OF MONUMENTS AND HISTORICAL CONSTRUCTIONS
4.1.1 Specimens preparation
The specimens used in the uniaxial tensile load tests were cut with the dimensions of 180 x 130 x
110 mm3, (length, width, height). The setting of these dimensions was affected by the dimensions of
the plates used in the testing machine.
Once reached a lower level of moisture in the specimens, the next step was to create a weaker
section to promote the crack development in a controlled surface. Several tests were done previously
to obtain an optimum ratio between the glued area and the surface where the crack will develop.
During a first set of experimental tests, it was perceived that with two notches of 30 mm the bonding
strength of the glue/specimen was higher than the tensile strength of the adobe specimen in the
weakened surface.
To promote the adherence between the resin and the specimen several small slots on the surface
were made, as illustrated in Figure 17. Adobe surface tend to disintegrate when subjected to tensile
loads, but the slots increase the contact area and a better bond is obtained.
Figure 17 - Preparation of specimens: cutting process and preparation to the application of one layer of polyester resin.
4.1.2 Prisms preparation
The prisms preparation was carried in two phases; firstly the two blocks that are part of the prism were
cut with 180 x 130 x 50 mm3 (length, width, height) and small slots were made as in the specimens;
secondly the prisms were assembled with a hydraulic lime mortar described in chapter three. To
induce a weaker surface, two pieces of paper with 180 x 30 mm2 were inserted in the mortar joint, see
Figure 18. The size of the paper was such that the ratio between the two areas presented the same
value as the specimens. The final dimension of the prisms was 180 x 130 x 110 mm3, the mortar joint
thickness was planned to be the same in all the prisms, (mortar joints from adobe masonry can vary
from 10 mm to 20 mm). These dimensions were set according the equipment dimensions once there
was an effective height of approximately 130 mm.

Mechanical characterization of traditional adobe masonry elements
Erasmus Mundus Programme
ADVANCED MASTERS IN STRUCTURAL ANALYSIS OF MONUMENTS AND HISTORICAL CONSTRUCTIONS 27
Figure 18 - Specimen assembling, paper stripes were used to produce a weaker section to promote the crack development in a controlled surface.
4.2 Test set up and test procedure
When the main purpose is to characterize the post-peak behaviour of a material as in this case, the
complete stress-displacement diagrams are essential. The uniaxial tensile tests were performed in the
Laboratories of the Civil Engineering Department of the University of Minho, using a CS7400S servo-
controlled universal testing machine with fixed end platens, with closed-loop control. This equipment
possesses a load cell connected to the vertical actuator with a maximum capacity of 22 kN, being
particularly appropriate for tests where the applied loads are not excessively high.
The shape of the softening branch depends on the boundary conditions and consequently the fracture
energy values can be affected by this behaviour. In case of pin-ended boundary conditions, the
specimens are free to rotate when macro cracks start to form. In this case no additional restraint is
introduced. By the other hand, in the case of fixed end platens, the eccentricity originated by the crack
opening must to be balanced by the introduction of bending moments that provokes the development
of multiple cracks. The described behaviour influences the softening branch to a certain extent, where
a horizontal plateau is possible to occur when a second macrocrack develops. The higher cracking
density found in fixed boundary conditions is associated in general to larger values of fracture energy
relatively to the ones achieved in uniaxial tension tests conducted using pin-ended platens, see [37]
for further details. In this research all the tensile tests were done under the same conditions, using
fixed end platens and the same type of polyester resin was used in the gripping of the samples.
Tests were performed under displacement control using an external Linear Variable Displacement
Transducer (LVDT). Two LVDT’s were used, both measuring the vertical displacement. In the
specimens the displacement was measured between the notch lips and in the prisms the measured
distance was done across the mortar joint, see Figure 20.

CHAPTER 4 - Tensile load tests in specimens and prisms
Erasmus Mundus Programme
28 ADVANCED MASTERS IN STRUCTURAL ANALYSIS OF MONUMENTS AND HISTORICAL CONSTRUCTIONS
Figure 19 - Effect of the boundary conditions on the softening shape [37].
Due to the lack of information about testing procedures in adobe samples, preliminary tests were
carried to obtain an acceptable test velocity. During the first calibration tests it was found that for the
control speed used, 0.05 mm / min, the rupture of the samples was occurring in the first seconds of
the test, thus that value was reduced as to obtain more information from each test. Several
combinations of speed rate were experimented, once adobe is not a homogeneous material there was
some difficulty to set this main test parameter, it was established to impose displacements in the
LVDT_1 at a rate of 0.01 mm / min.
Figure 20 - Geometry of the specimens and LVDT’s position.
4.3 Tests results
The stress-displacement diagrams that describes the tensile behaviour is resultant of the average
displacement measured by the LVDT_1 and LVDT_3 placed in the faces with notches. The normal
polyester resin
polyester resin
control
LVDT 1 LVDT 3
LVDT 3control
LVDT 1
10
15
LVDT 3
control
LVDT 1
130
110
180
30
130

Mechanical characterization of traditional adobe masonry elements
Erasmus Mundus Programme
ADVANCED MASTERS IN STRUCTURAL ANALYSIS OF MONUMENTS AND HISTORICAL CONSTRUCTIONS 29
stress was calculated as the ratio between the vertical load and the effective cross section, measured
at the midpoint of the notched section.
Unexpected failures have occurred immediately after the peak load. In this case, there was no
possibility of obtaining the stable fracture process and only the pre-peak behaviour could be
determined. Furthermore some tests were not successful due to failures that occurred in the surface
between the resin and the sample. It was decided to apply the resin in a higher area of the sample,
reaching that way a better bonding between both materials.
Figure 21 – Evolution of the tensile test in time, two different speeds were used in this preliminary test.
In Table 6 and
Table 7 the ft is referred to the tensile strength, Δun,ft is referred to the displacement until peak, Ko
represents the initial stiffness and Gf,meas Gest and Gf represent the fracture energy measured,
estimated and total, respectively.
Table 6 - Values of the mechanical properties and fracture energy for the specimens.
Specimen ft Δun,ft Ko Gf,meas Gest Gf
(N/mm2) (mm/mm) (N/mm
3) (N/mm) (N/mm) (N/mm)
T_S_04 0.110 0.0159 9.6620 0.0108 0.0005 0.0113
T_S_05 0.042 0.0173 3.8147 0.0020 0.0002 0.0022
T_S_07 0.144 0.0090 - 0.0119 0.0001 0.0120
T_S_08 0.055 0.0186 8.6548 0.0066 0.0000 0.0066
T_S_09 0.069 0.0238 8.3616 0.0161 0.0073 0.0234
T_S_11 0.068 0.0200 7.5174 0.0203 0.0125 0.0329
Average 0.081 0.0174 7.6021 0.0113 0.0034 0.0147
0
0.1
0.2
0.3
0.4
0.5
0.6
0.7
0.8
0.9
1
0
500
1000
1500
2000
2500
3000
3500
4000
0 200 400 600 800 1000 1200
Dis
pla
cem
ent (
mm
)
Fo
rce (
N)
Time (s)
Load_ax
Stroke_ax
LVDT_#1
LVDT_#3

CHAPTER 4 - Tensile load tests in specimens and prisms
Erasmus Mundus Programme
30 ADVANCED MASTERS IN STRUCTURAL ANALYSIS OF MONUMENTS AND HISTORICAL CONSTRUCTIONS
St. dev. 0.035 0.0045 2.0139 0.0060 0.0048 0.0104
CoV (%) 43 26 26 53 140 70
Table 7 - Values of the mechanical properties and fracture energy for the prisms.
Prism ft Δun,ft Ko Gf,meas Gest Gf
(N/mm2) (mm) (N/mm
3) (N/mm) (N/mm) (N/mm)
T_P_01 0.027 0.0112 7.8917 0.0188 0.0010 0.0198
T_P_03 0.002 0.0000 7.8917 0.0006 0.0000 0.0006
T_P_05 0.009 0.0000 1.1105 0.0007 0.0005 0.0011
T_P_07 0.004 0.0000 0.4414 0.0005 0.0000 0.0005
T_P_08 0.008 0.0000 0.5208 0.0005 0.0000 0.0005
Average 0.010 0.0022 3.5712 0.0042 0.0003 0.0045
St. dev. 0.009 0.0045 3.5352 0.0073 0.0004 0.0076
CoV (%) 88 200 99 174 130 170
4.4 Discussion
Besides the strength, also the stiffness of small specimens can vary strongly with the presence or
absence of large aggregates in the smallest cross section [38]. In the case of specimens the size
effect of the aggregates can highly contribute to the dispersion of results, see Figure 22. As for the
prisms the interface between the two blocks is obviously the weaker part of the structure. The low
values of bonding between the units and the mortar joint is a good representation of reality, once in
existing constructions this weakened interface can be frequently seen.
0.00
0.05
0.10
0.15
0.20
0.25
0.30
0.35
0.40
0.45
0.000 0.010 0.020 0.030 0.040 0.050
Str
ess (
N/m
m2)
Δun (mm)
specimens
Prisms

Mechanical characterization of traditional adobe masonry elements
Erasmus Mundus Programme
ADVANCED MASTERS IN STRUCTURAL ANALYSIS OF MONUMENTS AND HISTORICAL CONSTRUCTIONS 31
Figure 22 – Results of the tests to specimens and prisms
Failure modes
The typical failure modes are presented in Figure 23. It was possible to observe the non-linearity of
the developed crack due to the heterogeneity of the material, also in some cases the crack path went
out of the notched section.In that case the test was aborted once the system couldn’t get any
response from the controlling LVDT.
a) b) c)
Figure 23 – Crack development of tested adobe specimen (T_S_04); a) front face; b) back face; c) detail of crack path.
T_04_Front T_04_Back
T_05_Front T_05_Back
T_04_Front T_04_Back
T_05_Front T_05_Back


Erasmus Mundus Programme
ADVANCED MASTERS IN STRUCTURAL ANALYSIS OF MONUMENTS AND HISTORICAL CONSTRUCTIONS 33
CHAPTER 5
COMPRESSIVE LOAD TESTS IN SPECIMENS AND PRISMS
The campaign of compressive load tests to adobe specimens and prisms, developed with the aim of
the characterization of the compressive behaviour of adobe, is presented in this chapter, which is
structured in four sections. In the first section are described the works done during the preparation of
the specimens and prisms for this testing campaign. In the second section are described the test set
up and procedures followed in the testing campaign. Results obtained from the tests are presented in
the third section and the last section is dedicated to the analysis and discussion of the results.
The compressive load tests and the preparation of the samples were carried in the Laboratory of Civil
Engineering Department at the University of Aveiro.
5.1 Specimens and prisms preparation
5.1.1 Specimens preparation
Specimens used in the compression load tests were prepared with a diamond core drill machine,
normally used to extract samples from concrete or masonry structural elements. To extract the
cylindrical specimens a bit with internal diameter of 102 mm was used. The final specimens diameter
varied from 82 to 87mm. In the case of adobes with coarse granulometry, this method may no allow to
extract the specimens. For these cases, instead of cylindrical samples parallelepiped samples with a
width/height ratio equal to two may be used.
After the extraction of the samples from adobe blocks, they were rectified in order to obtain two
parallel bases with the final dimensions of approximately 85 mm diameter and 170 mm height, see
Figure 24. A cap of self-levelling mortar was applied to both base surfaces, where the compressive
load is applied. The mortar used is from a commercial brand, Webber niv-dur, and it was applied in a
layer with a thickness of approximately 5 mm. In this way, it was guaranteed a better parallelism
between these surfaces.

CHAPTER 5 - Compressive load tests in specimens and prisms
Erasmus Mundus Programme
34 ADVANCED MASTERS IN STRUCTURAL ANALYSIS OF MONUMENTS AND HISTORICAL CONSTRUCTIONS
Figure 24 – Samples with approximately 85 mm diameter and 170 mm high, the upper and lower surfaces were cut perpendicular to the cylinder axis.
5.1.2 Prisms preparation
The prisms used in the compression load tests were prepared using the cutting equipment described
in section 4.1 above. The dimensions of the blocks used to assemble the prisms were 200 x 150 x 50
mm3.
The prisms assembled have the final dimensions of 200 x 150 x 300 mm3, with four hydraulic mortar
joints 10mm thick each. A formwork was used to control the geometry of the prisms. The thickness of
the joints was also controlled during the construction of the prisms.
After the assemblage of the prisms, and in order to guarantee the parallelism between the top and
bottom surfaces, a cap of self-levelling mortar was applied as adopted for the adobe specimens (see
previous section).
The final step of the prisms preparation was fixing steel elements for the support of the LVDTs. Thus,
drills with approximately 40 mm depth and 5 mm diameter were made in the prisms. Then, the holes
are filled with polyester resin, and finally threaded rods with 70mm length were inserted.
Figure 25 – Preparation of prisms for compressive load tests.

Mechanical characterization of traditional adobe masonry elements
Erasmus Mundus Programme
ADVANCED MASTERS IN STRUCTURAL ANALYSIS OF MONUMENTS AND HISTORICAL CONSTRUCTIONS 35
5.2 Test set up and test procedure
Test set up
The testing equipment and also the control system represent the major factors for a successful
compression test conducted on adobe or other brittle material. The stiffness of the testing machine,
including loading devices and the frame plays a central role, when the characterization of the
behaviour beyond the peak load is required. These tests were controlled in displacement.
To perform the tests a MultiPlex 50-E equipment was used. This machine was designed to perform
CBR, Marshall and load/strain related tests. The apparatus consists of a reaction frame, with an
adjustable top crosshead, mounted on vertical steel elements attached to the base of the machine.
The base support a geared screwjack on which the platen is attached and is driven upward at a
constant rate. Centrally, under the crosshead, is placed a load ring or load cell of 50 kN capacity. The
platen movement is controlled by the micro-processor accessed via command buttons located on the
front panel. The equipment allows for the platen speed to be set from 0.5 to 50.8 mm/min.
During the compression tests, several LVDTs were used to measure the vertical deformation of the
samples in several points. In the case of tests in prisms four LVDTs were used, and for the tests in
specimens three LVDTs were mounted in a ring structure, see Figure 26.
a) b)
Figure 26 - View of the testing set up: a) LVDTs and deformation measurements in the specimens; b) general view of the equipment and data acquisition system used in the tests of the prisms.

CHAPTER 5 - Compressive load tests in specimens and prisms
Erasmus Mundus Programme
36 ADVANCED MASTERS IN STRUCTURAL ANALYSIS OF MONUMENTS AND HISTORICAL CONSTRUCTIONS
Testing procedure
The first step of the testing was the annotation of all the dimensions of the samples, immediately after,
the LVDTs were placed in position, fixed and the initial distance between the supports of the LVDTs
was also measured. Afterwards, the samples were moved to the platen in the machine. Two neoprene
sheets were placed between the sample and the platens to promote a better distribution of the load,
and to reduce the local confinement.
The test speed adopted for the prisms was set in order to obtain the failure of the prisms between 20
and 30 min after the starting of the test, as specified in EN 1052-1 - Methods of test for masonry [39].
After a first calibration test with a speed of 1 mm/min, it was decided to adopt the speed corresponding
to the limit of the equipment (0.5 mm/min). With this value the failure of the prisms occurred in the
range recommended in the standard. In the case of tests in specimens the rate used was 2 mm/min
and the duration of each test was approximately 10min.
5.3 Tests results
As mentioned above, the main goal of the present compression testing campaign was the
characterization of the compressive behaviour of the adobes. From the stress-strain diagrams, it was
obtained the main characteristics of the material, as the modulus of elasticity, see Table 8 and Table
9, and the compressive fracture energy.
Figure 27 – Typical diagram stress-strain of prisms obtained from the compressive load test.
0.0
0.2
0.4
0.6
0.8
1.0
1.2
1.4
1.6
-5 0 5 10 15 20 25 30 35
Str
ess (
N/m
m2)
Strain x10-3 (mm/mm)
LVDT_1
LVDT_2
LVDT_3
LVDT_4
Av._vertical

Mechanical characterization of traditional adobe masonry elements
Erasmus Mundus Programme
ADVANCED MASTERS IN STRUCTURAL ANALYSIS OF MONUMENTS AND HISTORICAL CONSTRUCTIONS 37
Table 8 - Elastic properties and compressive strength of the adobe specimens.
Specimen fc εfc E
(N/mm2) 10
-3 (mm/mm) (N/mm
2)
C_S_01 0.805 1.014 617
C_S_02 0.798 0.040 722
C_S_03 0.904 1.389 1014
C_S_04 1.005 1.451 1256
C_S_05 1.569 1.045 1478
C_S_06 1.645 3.903 1320
C_S_07 1.171 2.490 669
C_S_08 1.110 1.492 1764
C_S_09 1.572 1.267 1397
C_S_10 1.310 1.659 1126
Average 1.176 1.566 1138
St. dev. 0.320 1.020 380
CV (%) 27 65 33
Table 9 - Elastic properties and the compressive strength of the prisms.
Prism fc εfc E
(N/mm2) 10
-3 (mm/mm) (N/mm
2)
C_P_02 1.717 1.744 3.556
C_P_03 1.239 1.535 2.237
C_P_04 1.294 1.157 3.488
C_P_05 1.326 1.800 0.920
C_P_06 1.345 1.543 1.252
C_P_07 1.827 1.328 1.402
C_P_08 1.589 0.798 -
C_P_09 1.407 2.361 1.556
C_P_10 1.496 1.121 1.673
Average 1.468 1.533 2.059
St. dev. 0.202 0.437 0.996
CV (%) 14 28 48
5.3.1 Fracture energy
Loading in compressive quasi-brittle materials, as rock and concrete, leads to localization of macro-
cracks when the peak stress is reached. Before the peak stress is reached, the stress-strain diagram
describes the compressive behaviour of the continuum bulk rock, both for the elastic and inelastic
zone corresponding to the formation of predominantly longitudinal micro-cracks. Immediately after
reach the peak, strain localization occurs, the material outside the damage zone unloads. The area
described by this loading path is the pre-peak fracture energy, which is associated to the micro-
cracking. The post-peak diagram describes the deformation at the damaged zone that includes the

CHAPTER 5 - Compressive load tests in specimens and prisms
Erasmus Mundus Programme
38 ADVANCED MASTERS IN STRUCTURAL ANALYSIS OF MONUMENTS AND HISTORICAL CONSTRUCTIONS
deformation related to the formation and coalescence of distributed longitudinal cracks and the
deformation at localized zone [37].
To calculate the fracture energy, the plastic displacement, δplast, was computed and then plotted in a
graph stress-δplast, see Figure 28. The area under the curve represents the fracture energy.
Figure 28 – Method used to calculate the fracture energy, graphs plotted to samples C_P_06 and C_S_03.
In Table 10 and Table 11, fc represents the compressive strength, Gc,meas, Gest and Gc represent the
compressive fracture energy measured, estimated and the total, respectively.
Table 10 - Values of the mechanical properties and compressive fracture energy for the adobe specimens.
Specimen fc Gc,meas Gest Gc
(N/mm2) (N/mm) (N/mm) (N/mm)
C_S_01 0.805 0.888 0.033 0.921
C_S_02 0.798 0.958 0.264 1.222
C_S_03 0.904 0.698 0.059 0.758
C_S_04 1.005 0.599 0.059 0.658
C_S_05 1.569 1.490 0.006 1.496
C_S_06 1.645 1.841 0.406 2.247
C_S_07 1.171 1.017 0.128 1.146
C_S_08 1.110 0.881 0.149 1.031
C_S_09 1.572 1.907 0.156 2.062
C_S_10 1.310 1.557 0.253 1.810
Average 1.176 1.142 0.140 1.282
St. dev. 0.320 0.456 0.120 0.524
CV (%) 27 40 85 41
0.0
0.2
0.4
0.6
0.8
1.0
1.2
1.4
1.6
0.00 0.20 0.40 0.60 0.80 1.00
Str
ess (
Mpa)
δplast (mm)
0.0
0.1
0.2
0.3
0.4
0.5
0.6
0.7
0.8
0.9
1.0
0.00 0.50 1.00 1.50
Str
ess (
Mpa)
δplast (mm)

Mechanical characterization of traditional adobe masonry elements
Erasmus Mundus Programme
ADVANCED MASTERS IN STRUCTURAL ANALYSIS OF MONUMENTS AND HISTORICAL CONSTRUCTIONS 39
Table 11 - Values of the mechanical properties and compressive fracture energy for the prisms.
Prism fc Gc,meas Gest Gc
(N/mm2) (N/mm) (N/mm) (N/mm)
C_P_02 1.717 1.350 0.102 1.452
C_P_03 1.239 0.883 0.204 1.087
C_P_04 1.294 - - -
C_P_05 1.326 0.790 - 0.790
C_P_06 1.345 0.967 0.113 1.080
C_P_07 1.827 - - -
C_P_08 1.589 - - -
C_P_09 1.407 0.920 - 0.920
C_P_10 1.496 0.841 - 0.841
Average 1.468 0.982 0.140 1.066
St. dev. 0.202 0.193 0.046 0.222
CV (%) 14 20 33 21
5.4 Discussion
From the results obtained with the tested samples, it is observed a considerable dispersion, expressed
by the coefficient of variation, CV, values presented in Table 8 and Table 9. Compressive strength of
prisms presents a lower dispersion and higher mean value than the results obtained for the adobe
specimens.
The obtained factor fe, the relation between the compressive strength and the modulus of elasticity,
E=939fc, is higher than the value proposed in the standard NZS 4298:1998 - Materials and
workmanship for earth buildings [17] (E=300fc). The obtained value is also higher than the obtained by
Silveira et al. in [13], in their work, from the best fit correlation for adobes collected from houses
(E=181fc).
The compressive fracture energy presents a higher coefficient of variation in the case of adobe
specimens. The same was verified for the compressive strength, although, as can be seen in Figure
29 the correlation between this properties presents a low value.

CHAPTER 5 - Compressive load tests in specimens and prisms
Erasmus Mundus Programme
40 ADVANCED MASTERS IN STRUCTURAL ANALYSIS OF MONUMENTS AND HISTORICAL CONSTRUCTIONS
Figure 29 - Correlation between peak compressive stress (fc) and the compressive fracture energy for the tested specimens.
Figure 30 - Correlation between peak compressive stress (fc) and the modulus of elasticity for the tested specimens.
Figure 31 - Correlation between peak compressive stress (fc) and the compressive fracture energy for the tested prisms.
y = 1.4251x - 0.3595 R² = 0.6987
0.0
0.5
1.0
1.5
2.0
2.5
0.0 0.5 1.0 1.5 2.0
Gc (
N/m
m)
fc (N/mm2)
y = 939.23x R² = 0.2946
0
200
400
600
800
1000
1200
1400
1600
1800
2000
0.0 0.2 0.4 0.6 0.8 1.0 1.2 1.4 1.6 1.8
E (
N/m
m2)
fc (N/mm2)
y = 0.8558x - 0.1881 R² = 0.3581
0.00
0.20
0.40
0.60
0.80
1.00
1.20
1.40
1.60
0.00 0.50 1.00 1.50 2.00
Gc (N
/mm
)
fc (N/mm2)

Mechanical characterization of traditional adobe masonry elements
Erasmus Mundus Programme
ADVANCED MASTERS IN STRUCTURAL ANALYSIS OF MONUMENTS AND HISTORICAL CONSTRUCTIONS 41
Figure 32 - Correlation between peak compressive stress (fc) and the modulus of elasticity for the tested prisms.
.
y = 1.3627x R² = -0.035
0.00
0.50
1.00
1.50
2.00
2.50
3.00
3.50
4.00
0.00 0.50 1.00 1.50 2.00
E (
N/m
m2)
fc (N/mm2)


Erasmus Mundus Programme
ADVANCED MASTERS IN STRUCTURAL ANALYSIS OF MONUMENTS AND HISTORICAL CONSTRUCTIONS 43
CHAPTER 6
SHEAR LOAD TESTS IN SPECIMENS AND PRISMS
Chapter six is dedicated to describe and present the results of the experimental campaign to
characterize the shear behaviour of adobe specimens and adobe prisms with hydraulic lime mortar
joints.
The structure of the chapter is divided in four sections: the first section introduces the work carried to
prepare the samples; the second section presents the testing set up and the procedures followed
during the execution of the campaign; in the third section the results obtained in the shear load tests
are exposed; in the fourth section the analysis and discussion of the results can be consulted.
6.1 Specimens and prisms preparation
The specimen and prisms preparation was conducted in the Laboratory of the Civil Engineering
Department from the University of Aveiro and latter transported to the Laboratory of the Civil
Engineering Department of the University of Minho.
The first phase of the specimen and prisms preparation was similar in all the tests, uniaxial tensile,
uniaxial compressive and shear load tests, and only small differences in the dimensions and details
can be perceived. Due to the similarity between this task and the preparation of samples, previously
described in the section 4.1, only the different arrangement details are mentioned in the next sections.
Being aware of possible problems that could occur with testing procedures, a total of 30 specimens
and 30 prisms were prepared to this campaign. The goal to this set of tests was 15 valid results for
each type of samples.
6.1.1 Specimens preparation
The preparation of specimens to shear load tests was made in a similar way in the three types of
tests, as said before, however differences can be found among them. In the current case the
procedure was reduced to the cutting of the adobes with diamond saw, obtaining specimens with

CHAPTER 6 - Shear load tests in specimens and prisms
Erasmus Mundus Programme
44 ADVANCED MASTERS IN STRUCTURAL ANALYSIS OF MONUMENTS AND HISTORICAL CONSTRUCTIONS
regular dimensions of 180 x130 x110 mm3, see Figure 33. Latter it was found to be an erroneous
strategy and notches with 30 mm were done in both sides of the specimen to promote a weaker
section, obtaining an effective area of 180 x 70 mm2.
a) b)
Figure 33 – Specimens to test in shear with axial compressive load: a) dimensions of specimens (mm); specimens after preparation, without notches.
6.1.2 Prisms preparation
Prisms were assembled with two adobe blocks, which previously have been cut with 180 x 130 x
50 mm3, and a hydraulic mortar joint 10 mm thick. The two blocks were wetted and then the first was
situated inside a formwork, after a layer of mortar was spread and the second block placed above.
The formwork was used to guarantee the same height to all the prisms. In this case no weaker surface
was promoted. A rupture surface in the interface mortar/block was expected.
Figure 34 – Assembling process of prisms to shear test.
130
180
110
30
130
180
110
10

Mechanical characterization of traditional adobe masonry elements
Erasmus Mundus Programme
ADVANCED MASTERS IN STRUCTURAL ANALYSIS OF MONUMENTS AND HISTORICAL CONSTRUCTIONS 45
6.2 Test set up and test procedure
Test set up
The direct shear load tests were performed with a servo-controlled testing machine, described in
section 4.2, conceived to carry out tests on bituminous specimens. This equipment has two platens,
each one controlled under load or displacement by an independent loading actuator. Both actuators
can apply a maximum force of 20kN.
Due to geometric restrictions related to the maximum distance allowed between platens, 85 mm, a
new set up was developed, see Figure 35. Using this new scheme it was possible to use other set of
platens, allowing a maximum distance of 130 mm. Because of this change, samples dimensions were
increased, reducing this way the scale effect on the results.
The specimens were instrumented with four LVDTs, placed according to Figure 35. In one face of the
prism two LVDTs measured the relative vertical displacement while the third LVDT measured the
relative horizontal displacement along the notch or the joint. In the other face one LVDT was placed,
only the relative horizontal displacement was measured. All the LVDTs were placed recurring to
Cyanoacrylate glue.
Compressive and shear forces were measured by means of two built-in load cells, each one
associated to a loading actuator. As said before, the machine platens were modified by adding a steel
element, fastened with screws, to transmit the force to the sample. In addition, a pre-compressive load
was applied by means of a clamp to avoid any relative sliding between the unit and the platen during
shear loading adjustments. To promote a better distribution of the vertical load cardboards were
placed between the platen and the tested sample.
Figure 35 – Test set up adopted (samples were instrumented with four LVDTs, two in each direction).
LVDT_N1
LVDT_P1
LVDT_N2
platen
clamp
LVDT_P2
clamp
LVDT_N1
LVDT_P1
LVDT_N2
platen
clamp
LVDT_P2
clamp
CHAPTER 6 - Shear load tests in specimens and prisms
Erasmus Mundus Programme
46 ADVANCED MASTERS IN STRUCTURAL ANALYSIS OF MONUMENTS AND HISTORICAL CONSTRUCTIONS
Test procedure
The first step of the testing procedure was to fix the LVDTs holders, meanwhile the glue was curing
the samples dimensions and the distances between LVDTs holder were registered. After, the samples
were put in the machine platen with the cardboards to distribute the vertical load, and the sample
adjusted to the stop element, the clamp was adjusted applying that way a pre-compression. The next
step was to place the LVDTs in the holders and clamp the platens to the testing machine.
The test was started by imposing a compressive stress state to the sample. In this first part of the test
the force was applied from zero to the wanted level in 60 seconds under force control. The shear load
tests were planned in such a way that three different levels of compressive stress were applied,
0.1MPa, 0.2MPa and 0.3MPa. In order to obtain the required level of stresses the effective area of
each sample was calculated previously and the vertical load corrected to each test. Immediately
afterwards, a displacement rate of 0.015 mm/min (0.25 µm/s) was imposed, this displacement was
controlled by the LVDT_P2.
The duration of each test was approximately 3600 s, due to different working ranges from the LVDTs
the information of vertical displacements and horizontal relative displacement from LVDT_N1 is
available only until the second 1800.
In the case of tests in prisms with a vertical stress level of 0.3 MPa it was necessary to change the
vertical stress level because the machine clamp was not strong enough to avoid horizontal
displacement of the platen. Instead a stress level of 0.25 MPa was applied in three of five tests.
6.3 Tests results
The stress-displacement (τ - δ) diagram describes the shear behaviour when a certain level of normal
stress is applied to the sample; in this diagram the curves from both horizontal LVDTs and the
average value are represented. The shape of this curve, presented in Figure 36, can be considered as
characteristic to this type of test.
The plotted diagram presents LVDT_N1 and LVDT_P2 response; additionally it can be observed that
the first LVDT reaches the working range earlier than LVDT_P2. However the test was stopped only
after obtaining a constant shear force. The normal and shear stresses were calculated as the ratio
between the vertical load and the effective cross section of each sample, measured at the midpoint of
the effective section, (5) and (6).
σ =Fn / Aeff (5)
τ = Fs / Aeff (6)


CHAPTER 6 - Shear load tests in specimens and prisms
Erasmus Mundus Programme
48 ADVANCED MASTERS IN STRUCTURAL ANALYSIS OF MONUMENTS AND HISTORICAL CONSTRUCTIONS
a) b)
Figure 38 – Samples after the shear load test: a) specimen, failure by the weakened surface; b) prism, failure by the bonding surface mortar/block.
The shear strength fv, the fracture energy GIIf, and the relative displacement of the crack, Δus, are
used in order to characterize the softening diagram. Fracture energy is identified with the work that is
carried out for complete separation of the two faces of the macrocrack, per unit of area. For the
calculation of the fracture energy the correction of the elastic energy was computed, fracture energy is
presented in the tables resuming the data from tests, Table 15 to
Table 14.
Table 12 –Mechanical and fracture properties of the specimens (normal stress level of 0.1 N/mm2 ).
Prism fv ζN Δus K0 GIIf
(N/mm2) (N/mm
2) mm (N/mm
3) (N/mm)
S_S_N1_01 0.449 -0.140 0.003 90.826 0.764
S_S_N1_06 0.439 -0.131 0.013 69.497 -
S_S_N1_09 0.349 -0.131 0.076 8.653 0.853
S_S_N1_10 0.347 -0.128 0.011 3.745 0.854
S_S_N1_12 0.402 -0.146 0.004 20.008 0.798
average 0.397 -0.135 0.021 38.546 0.817
St. dev. 0.048 0.007 0.031 39.178 0.044
CV (%) 12 -6 145 101.639 5
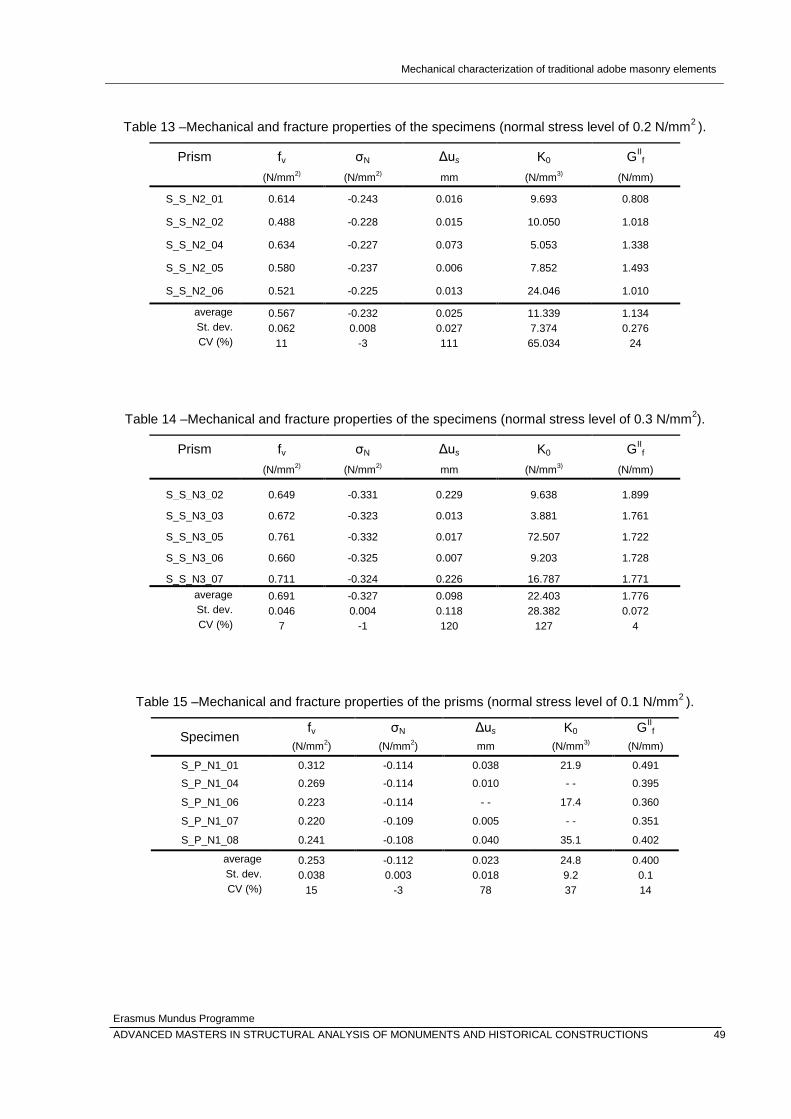
Mechanical characterization of traditional adobe masonry elements
Erasmus Mundus Programme
ADVANCED MASTERS IN STRUCTURAL ANALYSIS OF MONUMENTS AND HISTORICAL CONSTRUCTIONS 49
Table 13 –Mechanical and fracture properties of the specimens (normal stress level of 0.2 N/mm2 ).
Prism fv ζN Δus K0 GII
f
(N/mm2) (N/mm
2) mm (N/mm
3) (N/mm)
S_S_N2_01 0.614 -0.243 0.016 9.693 0.808
S_S_N2_02 0.488 -0.228 0.015 10.050 1.018
S_S_N2_04 0.634 -0.227 0.073 5.053 1.338
S_S_N2_05 0.580 -0.237 0.006 7.852 1.493
S_S_N2_06 0.521 -0.225 0.013 24.046 1.010
average 0.567 -0.232 0.025 11.339 1.134
St. dev. 0.062 0.008 0.027 7.374 0.276
CV (%) 11 -3 111 65.034 24
Table 14 –Mechanical and fracture properties of the specimens (normal stress level of 0.3 N/mm2).
Prism fv ζN Δus K0 GII
f
(N/mm2) (N/mm
2) mm (N/mm
3) (N/mm)
S_S_N3_02 0.649 -0.331 0.229 9.638 1.899
S_S_N3_03 0.672 -0.323 0.013 3.881 1.761
S_S_N3_05 0.761 -0.332 0.017 72.507 1.722
S_S_N3_06 0.660 -0.325 0.007 9.203 1.728
S_S_N3_07 0.711 -0.324 0.226 16.787 1.771
average 0.691 -0.327 0.098 22.403 1.776
St. dev. 0.046 0.004 0.118 28.382 0.072
CV (%) 7 -1 120 127 4
Table 15 –Mechanical and fracture properties of the prisms (normal stress level of 0.1 N/mm2 ).
Specimen fv ζN Δus K0 G
IIf
(N/mm2) (N/mm
2) mm (N/mm
3) (N/mm)
S_P_N1_01 0.312 -0.114 0.038 21.9 0.491
S_P_N1_04 0.269 -0.114 0.010 - - 0.395
S_P_N1_06 0.223 -0.114 - - 17.4 0.360
S_P_N1_07 0.220 -0.109 0.005 - - 0.351
S_P_N1_08 0.241 -0.108 0.040 35.1 0.402
average 0.253 -0.112 0.023 24.8 0.400
St. dev. 0.038 0.003 0.018 9.2 0.1
CV (%) 15 -3 78 37 14

CHAPTER 6 - Shear load tests in specimens and prisms
Erasmus Mundus Programme
50 ADVANCED MASTERS IN STRUCTURAL ANALYSIS OF MONUMENTS AND HISTORICAL CONSTRUCTIONS
Table 16 –Mechanical and fracture properties of the prisms (stress level of 0.2 N/mm2).
Specimen fv ζN Δus K0 G
IIf
(N/mm2) (N/mm
2) mm (N/mm
3) (N/mm)
S_P_N2_01 0.394 -0.212 0.028 28.8 0.701
S_P_N2_03 0.323 -0.218 0.774 23.3 0.727
S_P_N2_04 0.375 -0.207 0.009 - - 0.693
S_P_N2_05 0.311 -0.214 0.133 39.2 0.672
S_P_N2_06 0.414 -0.214 0.133 8.2 0.126
average 0.363 -0.213 0.215 24.869 0.584
St. dev. 0.045 0.004 0.317 12.896 0.257
CV (%) 12 -2 148 52 44
Table 17 –Mechanical and fracture properties of the prisms (normal stress level of 0.3 N/mm2 ).
Specimen fv ζN Δus K0 G
IIf
(N/mm2) (N/mm
2) mm (N/mm
3) (N/mm)
S_P_N3_01 0.511 -0.311 0.000 70.448 0.441
S_P_N3_02 0.515 -0.306 0.004 - 0.091
S_P_N3_03 0.504 -0.303 0.035 84.122 0.888
S_P_N3_05 0.470 -0.260 0.012 102.941 0.777
S_P_N3_06 0.493 -0.269 0.111 111.744 0.930
average 0.499 -0.290 0.032 92.314 0.625
St. dev. 0.018 0.024 0.046 18.580 0.355
CV (%) 4 -8 142 20 57
6.4 Discussion
From the test campaign carried out to specimens and prisms it is possible to infer the existence of a
weaker interface in prisms rather than in specimens. This weaker interface is ruling the behaviour of
the samples when submitted to shear loads with a normal compression.
From the data presented in Figure 39 and Figure 40 is possible to identify the cohesion, c, and the
tangent of the friction angle, tan ø. These properties present higher value in the case of the
specimens, the cohesion is 0.148 N/mm2 and the tangent of the friction angle is 1.5762, in the case of
prisms cohesion is 0.0957 N/mm2 and the tangent of the friction angle is 1.3466.
The experimental research on the behaviour of adobe specimens and prisms with a mortar joint can
be considered innovative once there are no works published about this topic. On other hand the
comparison and verification of result is more difficult to perform and cannot be done in a direct way.
These values can be compared with old clay units for which a cohesion of 0.127 N/mm2
and a tangent
of the friction of 0.695 are reported [37].

Mechanical characterization of traditional adobe masonry elements
Erasmus Mundus Programme
ADVANCED MASTERS IN STRUCTURAL ANALYSIS OF MONUMENTS AND HISTORICAL CONSTRUCTIONS 51
Figure 39 - Relationship between normal and shear stress in specimens.
Figure 40 - Relationship between normal and shear stress in prisms.
y = -1.5762x + 0.1843 R² = 0.90
0.00
0.10
0.20
0.30
0.40
0.50
0.60
0.70
0.80
-0.40 -0.35 -0.30 -0.25 -0.20 -0.15 -0.10 -0.05 0.00
Shear
Str
ess [M
Pa]
Normal Stress [MPa]
y = -1.3466x + 0.0957 R² = 0.89
0.00
0.10
0.20
0.30
0.40
0.50
0.60
-0.35 -0.30 -0.25 -0.20 -0.15 -0.10 -0.05 0.00
Shear
Str
ess [M
Pa]
Normal Stress [MPa]


Erasmus Mundus Programme
ADVANCED MASTERS IN STRUCTURAL ANALYSIS OF MONUMENTS AND HISTORICAL CONSTRUCTIONS 53
CHAPTER 7
CONCLUSIONS AND FURTHER RESEARCH
7.1 Conclusions
Mechanical properties have been studied by different authors. Part of the works is focused on the
characterization of adobe units and other are focussed in the study of the interface (joint) between the
mortar and the units. Generally, the properties considered relevant to characterize the behaviour of
adobe constructions are: compressive strength, shear strength and elastic modulus. Only in a reduced
number of documents it is analysed the tensile strength and fracture energy.
A description of the experimental campaign aiming at the characterization of the adobe and mortar
used in the prisms was presented. The type of mortars that can be find in adobe constructions from
Aveiro region was described and the mechanical characterization of the mortar samples prepared
during the assemblage of the prisms presented.
With the aim of characterize the behaviour of adobe specimens and prisms when subjected to uniaxial
tensile loads tests were realized. From these tests it was possible to conclude that In the case of
specimens the size effect of the aggregates can highly contribute to the dispersion of results and for
the prisms the interface between the two blocks is obviously the weaker part of the structure. The low
values of bonding between the units and the mortar joint is a good representation of reality, once in
existing constructions this weakened interface can be frequently seen.
From the campaign of compressive load tests to adobe specimens and prisms, developed with the
aim of the characterization of the compressive behaviour of adobe it was possible to conclude that
compressive strength of prisms presents a lower dispersion and higher mean value than the results
obtained for the adobe specimens. The obtained factor fe, the relation between the compressive
strength and the modulus of elasticity, E=939fc, is higher than the value proposed in the standard NZS
4298:1998 - Materials and workmanship for earth buildings [17] (E=300fc). The compressive fracture
energy presents a higher coefficient of variation in the case of adobe specimens.
From the experimental campaign to characterize the shear behaviour of adobe specimens and adobe
prisms with hydraulic lime mortar joints test carried out it was possible to infer the existence of a
weaker interface in prisms rather than in specimens. This weaker interface is ruling the behaviour of

CHAPTER 7 - CONCLUSIONS AND FURTHER RESEARCH
Erasmus Mundus Programme
54 ADVANCED MASTERS IN STRUCTURAL ANALYSIS OF MONUMENTS AND HISTORICAL CONSTRUCTIONS
the samples when submitted to shear loads with a normal compression. From the data obtained was
possible to identify the cohesion, c, and the tangent of the friction angle, tan ø. These properties
presented higher value in the case of the specimens, the cohesion was 0.148 N/mm2 and the tangent
of the friction angle was 1.5762, in the case of prisms cohesion was 0.0957 N/mm2 and the tangent of
the friction angle was 1.3466. The experimental research on the behaviour of adobe specimens and
prisms with a mortar joint can be considered innovative once there are no works published about this
topic.
7.2 Further research
During the experimental campaign to characterize the shear behaviour of adobe specimens and
adobe prisms it was obtained information about the normal displacements, due to lack of time the
analysis of this data was not carried within the frame of this work. From this data is possible to obtain
the dilatancy values of adobe specimens and prisms.
In future developments of the present work several issues must to be researched, especial attention
must be given to the characterization of adobe masonry using traditional air lime mortars.
Finally the standardization of tests procedures to fragile materials as adobe must to be carried,
exceptional attention must to be given to tensile tests were the equipment needs to present high
precision in the control of displacements and loads otherwise acquired data can present some
distortion of the real behaviour of the material.

Mechanical characterization of traditional adobe masonry elements
Erasmus Mundus Programme
ADVANCED MASTERS IN STRUCTURAL ANALYSIS OF MONUMENTS AND HISTORICAL CONSTRUCTIONS 55
REFERENCES
[1] UNESCO World Heritage Centre, “World Heritage Earthen Architecture Programme (WHEAP),” 2012. [Online]. Available: http://whc.unesco.org/en/earthen-architecture/. [Accessed: 11-Jun-2012].
[2] F. Fratini, E. Pecchioni, L. Rovero, and U. Tonietti, “The earth in the architecture of the historical centre of Lamezia Terme (Italy): Characterization for restoration,” Applied Clay Science, vol. 53, no. 3, pp. 509-516, Sep. 2011.
[3] S. Onnis, M. Paglini, L. Rovero, and U. Tonietti, “Analyse constructive et structurale des coupoles «EN encorbellement», en terre, dans la région d’Alep,” in Mediterra 2009, 1st Mediterranean Conference on Earth Architecture, 2009, pp. 85–97.
[4] H. Houben and H. Guillaud, Earth construction: A comprehensive guide. ITDG Publishing,, 1994, p. 376.
[5] A. Abufayed, A. Rghei, and A. A. Aboufayed, “Adobe cities of Libya : Unique world heritage architecture at risk,” in Terra 2008: 10th International Conference on the Study and Conservation of Earthen Architectural Heritage, February 1-5, 2008, pp. 36-41.
[6] G. Minke, Building with earth: design and technology of a sustainable architecture. Basel, Berlin, Boston: Birkhäuser – Publishers for Architecture, 2006, p. 199.
[7] S. Pollak, “Earth building: participation and performance a locally tailored experiment,” in Proceedings of the 11th International Conference on Non-conventional Materials and Technologies (NOCMAT 2009), 2009, no. September, p. 8.
[8] F. Pacheco-Torgal and S. Jalali, “Earth construction: Lessons from the past for future eco-efficient construction,” Construction and Building Materials, vol. 29, no. 1, pp. 512-519, 2012.
[9] M. Achenza and L. Fenu, “On earth stabilization with natural polymers for earth masonry construction,” Materials and Structures, vol. 39, no. 1, pp. 21-27, Mar. 2006.
[10] C.-M. Chan, “Effect of natural fibres inclusion in clay bricks : Physico-mechanical properties,” International Journal of Civil and Environmental Engineering, vol. 3, no. 1, pp. 51-57, 2011.
[11] C. Galán-Marín, C. Rivera-Gómez, and J. Petric, “Clay-based composite stabilized with natural polymer and fibre,” Construction and Building Materials, vol. 24, no. 8, pp. 1462-1468, Aug. 2010.
[12] P. A. Jaquin, C. E. Augarde, and C. M. Gerrard, “Chronological description of the spatial development of rammed earth techniques,” International Journal of Architectural Heritage, vol. 2, no. 4, pp. 377-400, Nov. 2008.
[13] D. Silveira, H. Varum, A. Costa, T. Martins, H. Pereira, and J. Almeida, “Mechanical properties of adobe bricks in ancient constructions,” Construction and Building Materials, vol. 28, no. 1, pp. 36-44, Mar. 2012.
[14] H. Varum, A. Costa, A. Velosa, T. Martins, H. Pereira, and J. Almeida, “Caracterização mecânica e patológica das construções em adobe no distrito de Aveiro como suporte em intervenções de reabilitação,” in Sessão de estudo dedicada à “Conservação, Significado e Qualidade Urbana da Arquitectura em Terra”, in the framework of the project “Houses and

CHAPTER 7 - CONCLUSIONS AND FURTHER RESEARCH
Erasmus Mundus Programme
56 ADVANCED MASTERS IN STRUCTURAL ANALYSIS OF MONUMENTS AND HISTORICAL CONSTRUCTIONS
towns built with earth: conservation, significance and urban dignity”, European Programme Cultura 2000, 2005, pp. 41- 45.
[15] D. Silveira, H. Varum, A. Costa, and E. Lima, “Survey and characterization of the adobe built park in Aveiro city,” in Proceedings of 6
o Seminário de Arquitectura de Terra em Portugal and
9o Seminário Ibero-Americano de Construção e Arquitectura com Terra ,February 20–23, 2010
[in Portuguese]., 2010.
[16] CEN, “ENV 1996-1-1:1995 Eurocode 6 - Design of masonry structures - Part 1-1: General rules for reinforced and unreinforced masonry structures,” Management. pp. 1-123, 2005.
[17] Standards New Zealand, “NZS 4298:1998 Materials and workmanship for earth buildings,” no. 1. p. 88, 1998.
[18] H. Varum, A. Costa, H. Pereira, and J. Almeida, “Comportamento estrutural de elementos resistentes em alvenaria de adobe,” in TerraBrasil2006 - I Seminário Arquitetura e Construção com Terra no Brasil and IV Seminário Arquitectura de Terra em Portugal, 2006, p. 8.
[19] H. Varum et al., “Structural behaviour characterization of existing adobe constructions in Aveiro,” in First Euro-Mediterranean Regional Conference - Traditional Mediterranean Architecture: Present and Futur - Reference no. 090, 2007, no. 090, pp. 470-471.
[20] H. Varum, T. Gomes, and V. Costa, “Avaliação da segurança estrutural na fase anterior à reabilitação da Casa Major Pessoa,” in 2008 - 4 th International Conference on Structural Defects and Repair - Civil Engineering Department, University of Aveiro, 2008.
[21] P. Walker and T. Stace, “Properties of some cement stabilised compressed earth blocks and mortars,” Materials and Structures, vol. 30, no. November, pp. 545-551, 1997.
[22] International Union of Testing and Research Laboratories for Materials and Structures, Rilem technical recommendations for the testing and use of construction materials. London: , 1994, p. 618.
[23] R. S. Olivito and P. Stumpo, “Fracture mechanics in the characterisation of brick masonry structures,” vol. 34, no. May, pp. 217-223, 2001.
[24] H. Varum, A. Costa, H. Pereira, J. Almeida, H. Rodrigues, and D. Silveira, “Experimental evaluation of the structural behaviour of adobe masonry structural elements,” in Evaluation of the Structural Behaviour of Adobe Masonry Structural Elements - 5 th International Conference on Seismology and Earthquake Engineering (SEE5), 13-16 May, 2007, p. 9.
[25] P. Jukes and J. Riddington, “A review of masonry joint shear strength test methods,” Masonry International, vol. 11, no. 2, pp. 37-41, 1997.
[26] R. Atkinson, B. Amadei, S. Saeb, and S. Sture, “Response of masonry bed joints in direct shear,” Journal of Structural Engineering, vol. 115, no. 9, pp. 2276-2296, 1989.
[27] R. Van der Pluijm, “Shear behaviour of bed joints,” in 6th North American Masonry Conference, Vol. I, 1993, pp. 125-136.
[28] D. Liberatore, G. Spera, M. Mucciarelli, M. R. Gallipoli, D. Santarsiero, and C. Tancredi, “Typological and Experimental Investigation on the Adobe Buildings of Aliano ( Basilicata , Italy ),” in Structural Analysis of Historical Constructions Constructions, 2006, pp. 851-858.
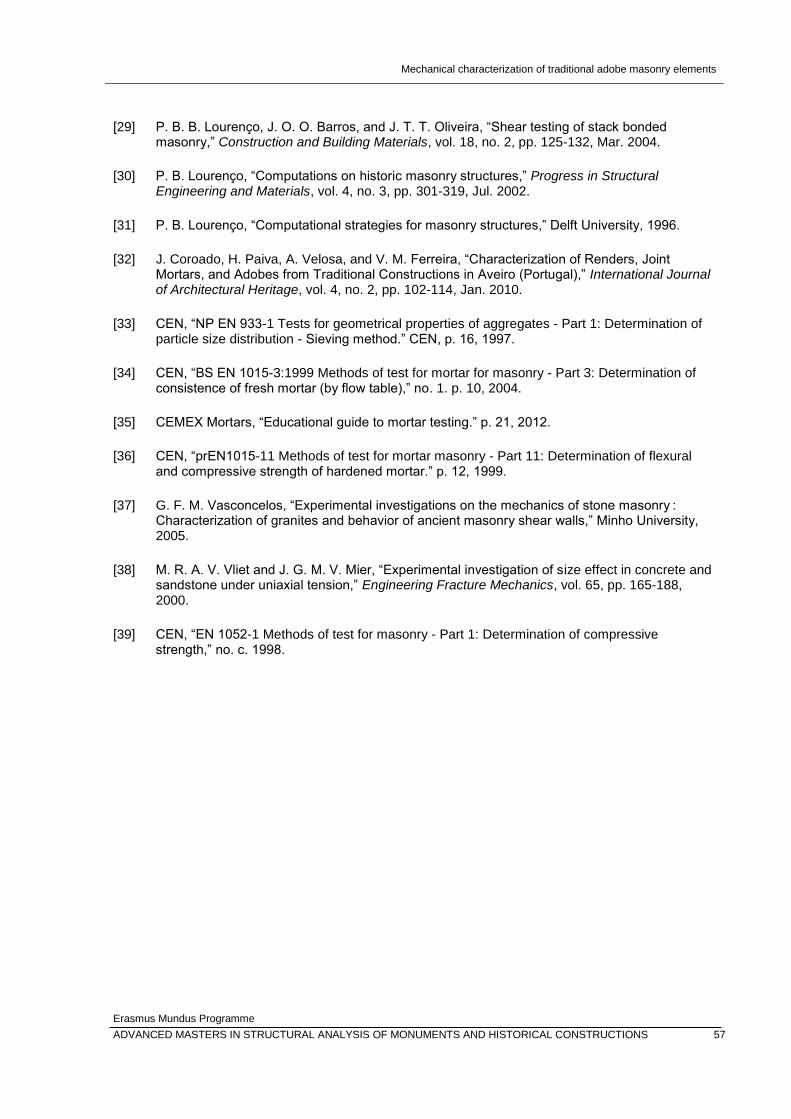
Mechanical characterization of traditional adobe masonry elements
Erasmus Mundus Programme
ADVANCED MASTERS IN STRUCTURAL ANALYSIS OF MONUMENTS AND HISTORICAL CONSTRUCTIONS 57
[29] P. B. B. Lourenço, J. O. O. Barros, and J. T. T. Oliveira, “Shear testing of stack bonded masonry,” Construction and Building Materials, vol. 18, no. 2, pp. 125-132, Mar. 2004.
[30] P. B. Lourenço, “Computations on historic masonry structures,” Progress in Structural Engineering and Materials, vol. 4, no. 3, pp. 301-319, Jul. 2002.
[31] P. B. Lourenço, “Computational strategies for masonry structures,” Delft University, 1996.
[32] J. Coroado, H. Paiva, A. Velosa, and V. M. Ferreira, “Characterization of Renders, Joint Mortars, and Adobes from Traditional Constructions in Aveiro (Portugal),” International Journal of Architectural Heritage, vol. 4, no. 2, pp. 102-114, Jan. 2010.
[33] CEN, “NP EN 933-1 Tests for geometrical properties of aggregates - Part 1: Determination of particle size distribution - Sieving method.” CEN, p. 16, 1997.
[34] CEN, “BS EN 1015-3:1999 Methods of test for mortar for masonry - Part 3: Determination of consistence of fresh mortar (by flow table),” no. 1. p. 10, 2004.
[35] CEMEX Mortars, “Educational guide to mortar testing.” p. 21, 2012.
[36] CEN, “prEN1015-11 Methods of test for mortar masonry - Part 11: Determination of flexural and compressive strength of hardened mortar.” p. 12, 1999.
[37] G. F. M. Vasconcelos, “Experimental investigations on the mechanics of stone masonry : Characterization of granites and behavior of ancient masonry shear walls,” Minho University, 2005.
[38] M. R. A. V. Vliet and J. G. M. V. Mier, “Experimental investigation of size effect in concrete and sandstone under uniaxial tension,” Engineering Fracture Mechanics, vol. 65, pp. 165-188, 2000.
[39] CEN, “EN 1052-1 Methods of test for masonry - Part 1: Determination of compressive strength,” no. c. 1998.