jMeter - aaterminals.com.au€¦ · JMeter i About the Tutorial jMeter is an open source testing...
89
JMeter i
Transcript of jMeter - aaterminals.com.au€¦ · JMeter i About the Tutorial jMeter is an open source testing...

JMeter
i
JMeter
i
About the Tutorial
jMeter is an open source testing software. It is 100% pure Java application for load and
performance testing.
jMeter is designed to cover various categories of tests such as load testing, functional testing, performance testing, regression testing, etc., and it requires JDK 5 or higher.
This tutorial provides an in-depth coverage of jMeter framework including its test plans, listeners, functions, and regular expressions.
Audience
This tutorial is designed for software professionals in the domain of Testing who are required
to test enterprise-level applications for robustness and reliability.
Prerequisites
Before proceeding with this tutorial, you should have a basic understanding of Java
programming language. As you are going to use jMeter to perform all types of testing
(regression, functional, load, performance, etc.) at different stages of a Java project, it is
recommended that you have a good grip over software development and software testing processes.
Copyright & Disclaimer
Copyright 2015 by Tutorials Point (I) Pvt. Ltd.
All the content and graphics published in this e-book are the property of Tutorials Point (I)
Pvt. Ltd. The user of this e-book is prohibited to reuse, retain, copy, distribute or republish
any contents or a part of contents of this e-book in any manner without written consent of the publisher.
We strive to update the contents of our website and tutorials as timely and as precisely as
possible, however, the contents may contain inaccuracies or errors. Tutorials Point (I) Pvt.
Ltd. provides no guarantee regarding the accuracy, timeliness or completeness of our website
or its contents including this tutorial. If you discover any errors on our website or in this tutorial, please notify us at [email protected]
JMeter
ii
Table of Contents
About the Tutorial ........................................................................................................................................ i
Audience ...................................................................................................................................................... i
Prerequisites ................................................................................................................................................ i
Copyright & Disclaimer ................................................................................................................................. i
Table of Contents .........................................................................................................................................ii
1. JMETER ─ OVERVIEW ............................................................................................................... 1
What is JMeter? .......................................................................................................................................... 1
JMeter Features .......................................................................................................................................... 1
How JMeter Works? .................................................................................................................................... 2
2. JMETER ─ ENVIRONMENT........................................................................................................ 3
System Requirements ................................................................................................................................. 3
3. JMETER ─ TEST PLAN ............................................................................................................... 7
What is a Test Plan? .................................................................................................................................... 7
Writing a Test Plan ...................................................................................................................................... 7
4. JMETER ─ TEST PLAN ELEMENTS ........................................................................................... 12
Thread Group ............................................................................................................................................. 12
Controllers ................................................................................................................................................. 13
Listeners ..................................................................................................................................................... 15
Timers ........................................................................................................................................................ 15
Assertions .................................................................................................................................................. 16
Configuration Elements .............................................................................................................................. 17
Pre-processor Elements .............................................................................................................................. 18
Post-processor Elements ............................................................................................................................ 18
Execution Order of Test Elements .............................................................................................................. 19
JMeter
iii
5. JMETER ─ WEB TEST PLAN ..................................................................................................... 20
Start JMeter ............................................................................................................................................... 20
Rename the Test Plan ................................................................................................................................ 20
Add Thread Group ...................................................................................................................................... 21
Add Sampler............................................................................................................................................... 22
Add Listener ............................................................................................................................................... 24
Run the Test Plan ....................................................................................................................................... 24
View the Output ......................................................................................................................................... 25
6. JMETER ─ DATABASE TEST PLAN............................................................................................ 28
Create JMeter Test Plan ............................................................................................................................. 28
Adding JDBC Requests ................................................................................................................................ 29
Create Listener ........................................................................................................................................... 31
Save and Execute Test Plan ........................................................................................................................ 32
7. JMETER ─ FTP TEST PLAN ....................................................................................................... 34
Rename Test Plan ....................................................................................................................................... 34
Add Thread Group ...................................................................................................................................... 34
Add Sampler – FTP Request ........................................................................................................................ 35
Add Listener ............................................................................................................................................... 36
8. JMETER ─ WEBSITE TEST PLAN .............................................................................................. 40
Create Webservice Project ......................................................................................................................... 40
Create JMeter Test plan ............................................................................................................................. 43
9. JMETER ─ JMS TEST PLAN ...................................................................................................... 49
Building a JMS Point-to-Point Test Plan ...................................................................................................... 50
Building a JMS Topic Test Plan ................................................................................................................... 55
JMeter
iv
10. JMETER ─ MONITOR TEST PLAN ............................................................................................ 63
Setup Tomcat Server .................................................................................................................................. 63
Write JMeter Test Plan ............................................................................................................................... 65
11. JMETER ─ LISTENERS ............................................................................................................. 71
Default Configuration ................................................................................................................................. 71
CSV Log format ........................................................................................................................................... 72
Saving Response Data ................................................................................................................................ 73
Loading (Reading) Response Data .............................................................................................................. 73
Saving the Listener GUI Data ...................................................................................................................... 73
12. JMETER ─ FUNCTIONS ........................................................................................................... 74
JMeter Functions and User Variables ......................................................................................................... 74
List of Functions ......................................................................................................................................... 74
Where to Use Functions and Variables? ..................................................................................................... 76
Referencing Variables and Functions .......................................................................................................... 77
The Function Helper Dialog ........................................................................................................................ 77
Pre-defined Variables ................................................................................................................................. 78
Pre-defined Properties ............................................................................................................................... 78
13. JMETER ─ REGULAR EXPRESSIONS ......................................................................................... 79
14. JMETER ─ BEST PRACTICES .................................................................................................... 84
JMeter
1
Before going into the details of JMeter, let us first understand a few jargons associated with the testing of any application.
Performance Test: This test sets the best possible performance expectation under
a given configuration of infrastructure. It also highlights early in the testing process
if any changes need to be made before the application goes into production.
Load Test: This test is basically used for testing the system under the top load it was
designed to operate under.
Stress Test: This test is an attempt to break the system by overwhelming its
resources.
What is JMeter?
JMeter is a software that can perform load test, performance-oriented business (functional) test, regression test, etc., on different protocols or technologies.
Stefano Mazzocchi of the Apache Software Foundation was the original developer of
JMeter. He wrote it primarily to test the performance of Apache JServ (now called as Apache
Tomcat project). Apache later redesigned JMeter to enhance the GUI and to add functional
testing capabilities.
JMeter is a Java desktop application with a graphical interface that uses the Swing graphical
API. It can therefore run on any environment / workstation that accepts a Java virtual machine, for example: Windows, Linux, Mac, etc.
The protocols supported by JMeter are:
Web: HTTP, HTTPS sites 'web 1.0' web 2.0 (ajax, flex and flex-ws-amf)
Web Services: SOAP / XML-RPC
Database via JDBC drivers
Directory: LDAP
Messaging Oriented service via JMS
Service: POP3, IMAP, SMTP
FTP Service
JMeter Features
Following are some of the features of JMeter:
Being an open source software, it is freely available.
It has a simple and intuitive GUI.
JMeter can conduct load and performance test for many different server types: Web
- HTTP, HTTPS, SOAP, Database via JDBC, LDAP, JMS, Mail - POP3, etc.
1. jMeter ─ Overview
JMeter
2
It is a platform-independent tool. On Linux/Unix, JMeter can be invoked by clicking
on JMeter shell script. On Windows, it can be invoked by starting the jmeter.bat file.
It has full Swing and lightweight component support (precompiled JAR uses packages
javax.swing.* ).
JMeter stores its test plans in XML format. It means you can generate a test plan
using a text editor.
Its full multi-threading framework allows concurrent sampling by many threads and
simultaneous sampling of different functions by separate thread groups.
It is highly extensible.
It can also be used to perform automated and functional testing of the applications.
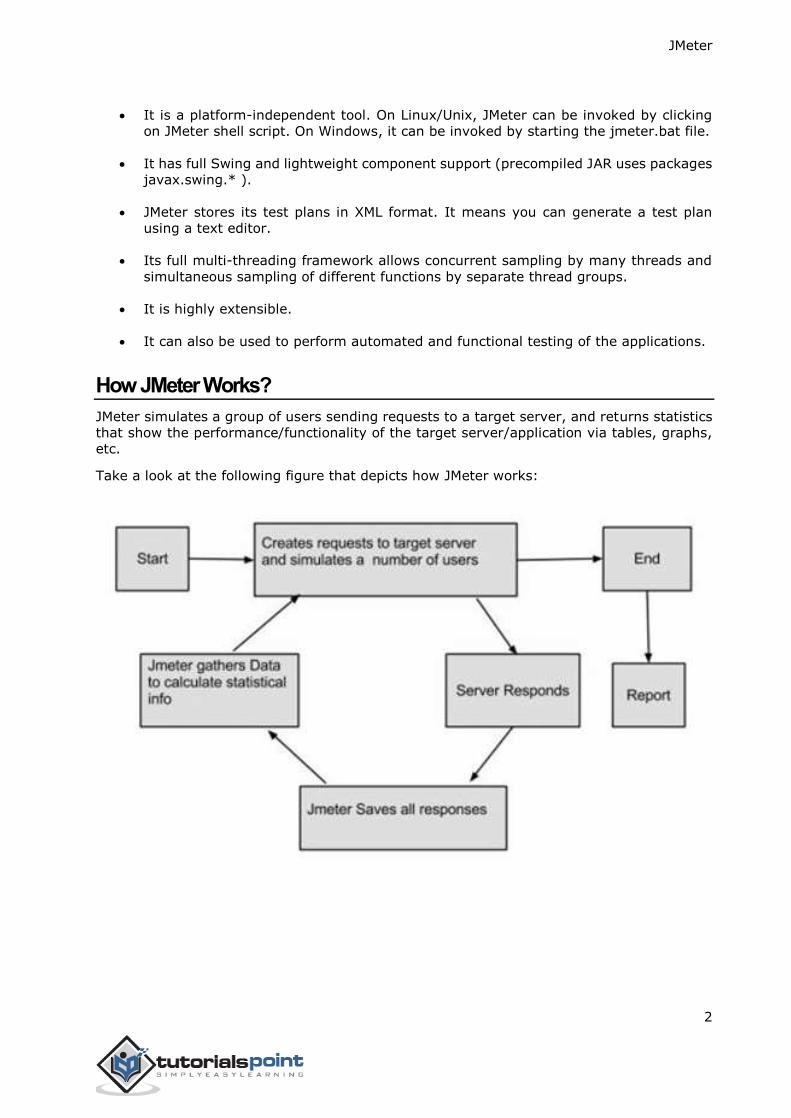
How JMeter Works?
JMeter simulates a group of users sending requests to a target server, and returns statistics
that show the performance/functionality of the target server/application via tables, graphs,
etc.
Take a look at the following figure that depicts how JMeter works:
JMeter
3
JMeter is a framework for Java, so the very first requirement is to have JDK installed in your machine.
System Requirements
JDK 1.6 or above.
Memory No minimum requirement.
Disk Space No minimum requirement.
Operating System No minimum requirement.
Step 1 - Verify Java Installation
First of all, verify whether you have Java installed in your system. Open your console and execute one of the following java commands based on the operating system you are working
on.
OS Task Command
Windows Open Command Console c:\> java -version
Linux Open Command Terminal $ java -version
Mac Open Terminal machine:~ joseph$ java -version
If you have Java installed in your system, you would get an appropriate output based on the OS you are working on.
OS Output
Windows java version "1.7.0_25"
Java(TM) SE Runtime Environment (build 1.7.0_25-b15)
Java HotSpot(TM) 64-Bit Server VM (build 23.25-b01, mixed mode)
Linux java version "1.7.0_25"
2. jMeter ─ Environment
JMeter
4
Java(TM) SE Runtime Environment (build 1.7.0_25-b15)
Java HotSpot(TM) 64-Bit Server VM (build 23.25-b01, mixed mode)
Mac java version "1.7.0_25"
Java(TM) SE Runtime Environment (build 1.7.0_25-b15)
Java HotSpot(TM) 64-Bit Server VM (build 23.25-b01, mixed mode)
If you do not have Java installed, install the Java Software Development Kit (SDK) from http://www.oracle.com/technetwork/java/javase/downloads/index.html. We are assuming Java
1.7.0_25 as the installed version for this tutorial.
Step 2: Set Java Environment Set the JAVA_HOME environment variable to point to the base directory location, where
Java is installed on your machine. For example:
OS Output
Windows Set the environment variable JAVA_HOME to C:\Program Files\Java\jdk1.7.0_25
Linux export JAVA_HOME=/usr/local/java-current
Mac export JAVA_HOME=/Library/Java/Home
Append Java compiler location to System Path.
OS Output
Windows Append the string; C:\Program Files\Java\jdk1.7.0_25\bin to the end of the system variable, Path.
Linux export PATH=$PATH:$JAVA_HOME/bin/
Mac not required
Verify Java Installation using java -version command as explained above.
JMeter
5
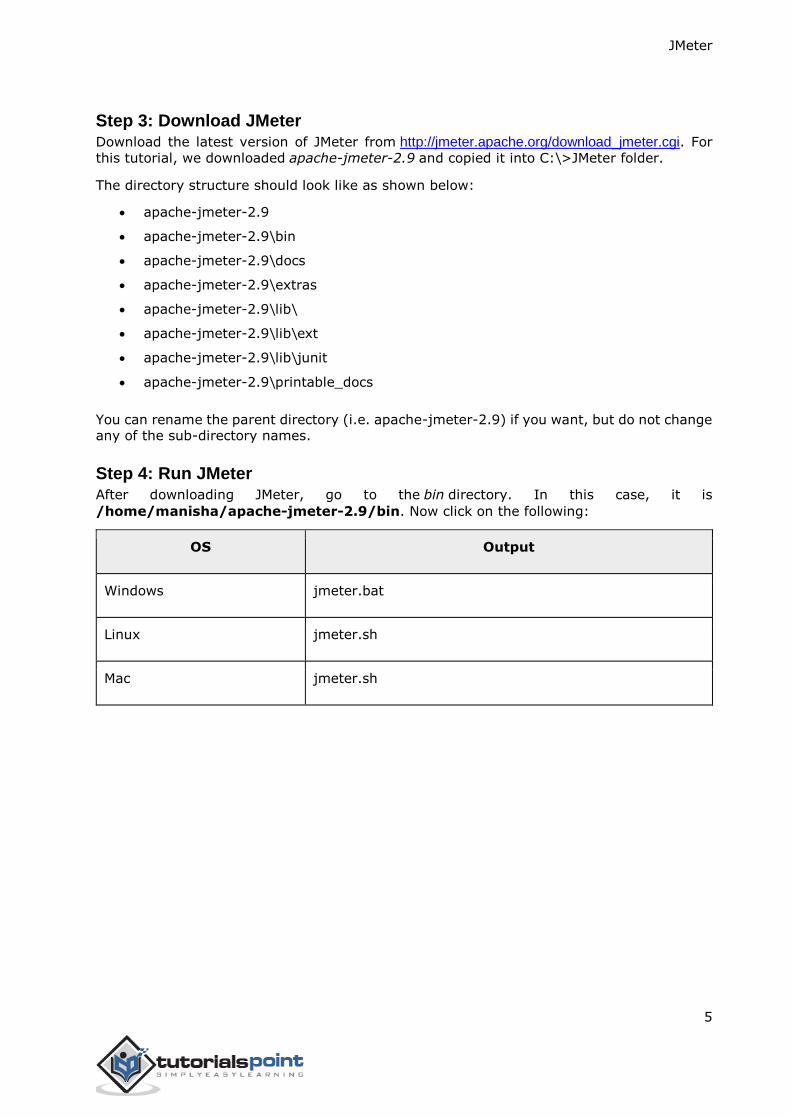
Step 3: Download JMeter Download the latest version of JMeter from http://jmeter.apache.org/download_jmeter.cgi. For
this tutorial, we downloaded apache-jmeter-2.9 and copied it into C:\>JMeter folder.
The directory structure should look like as shown below:
apache-jmeter-2.9
apache-jmeter-2.9\bin
apache-jmeter-2.9\docs
apache-jmeter-2.9\extras
apache-jmeter-2.9\lib\
apache-jmeter-2.9\lib\ext
apache-jmeter-2.9\lib\junit
apache-jmeter-2.9\printable_docs
You can rename the parent directory (i.e. apache-jmeter-2.9) if you want, but do not change any of the sub-directory names.
Step 4: Run JMeter After downloading JMeter, go to the bin directory. In this case, it is
/home/manisha/apache-jmeter-2.9/bin. Now click on the following:
OS Output
Windows jmeter.bat
Linux jmeter.sh
Mac jmeter.sh
JMeter
6
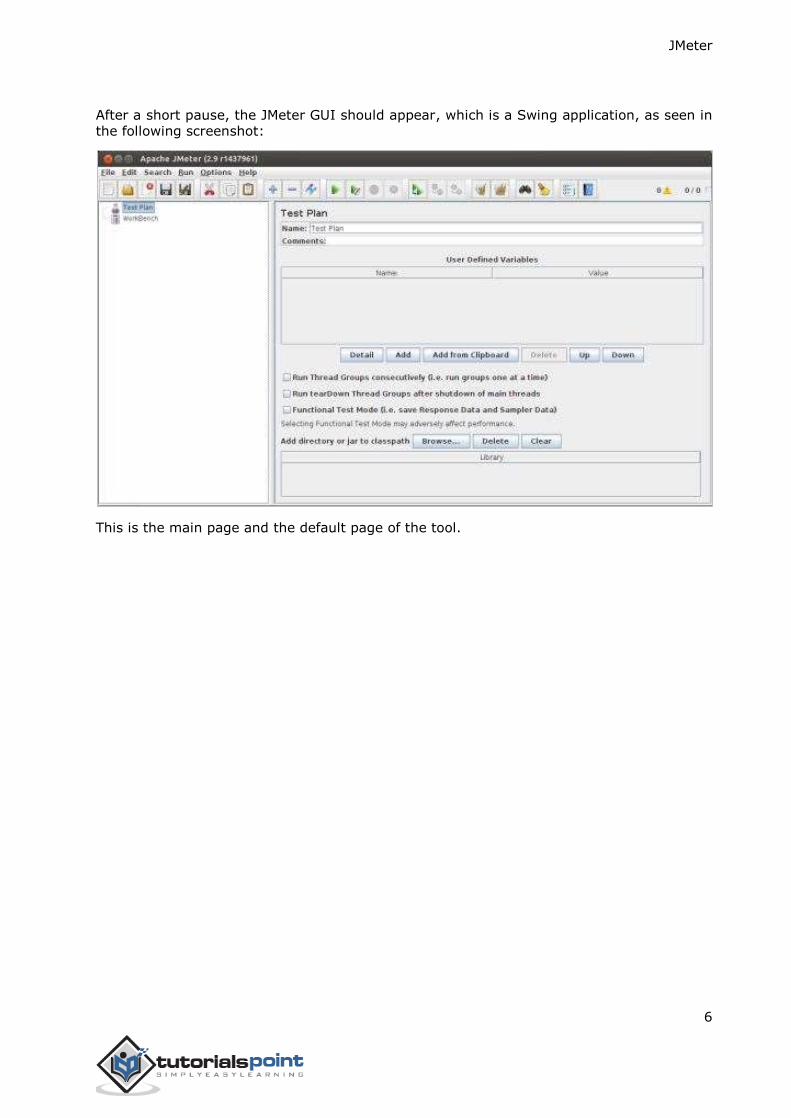
After a short pause, the JMeter GUI should appear, which is a Swing application, as seen in the following screenshot:
This is the main page and the default page of the tool.
JMeter
7
What is a Test Plan?
A Test Plan can be viewed as a container for running tests. It defines what to test and how
to go about it. A complete test plan consists of one or more elements such as thread groups,
logic controllers, sample-generating controllers, listeners, timers, assertions, and configuration elements. A test plan must have at least one thread group.
Writing a Test Plan
Follow the steps given below to write a test plan:
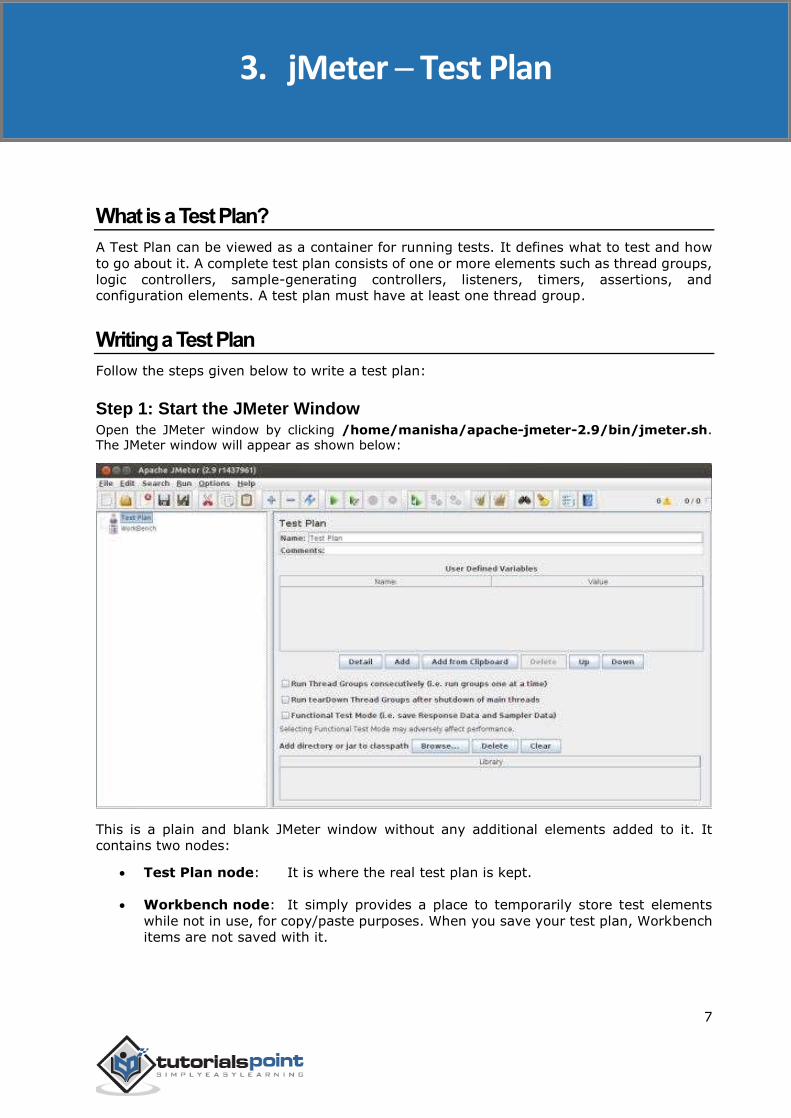
Step 1: Start the JMeter Window Open the JMeter window by clicking /home/manisha/apache-jmeter-2.9/bin/jmeter.sh. The JMeter window will appear as shown below:
This is a plain and blank JMeter window without any additional elements added to it. It
contains two nodes:
Test Plan node: It is where the real test plan is kept.
Workbench node: It simply provides a place to temporarily store test elements
while not in use, for copy/paste purposes. When you save your test plan, Workbench
items are not saved with it.
3. jMeter ─ Test Plan
JMeter
8
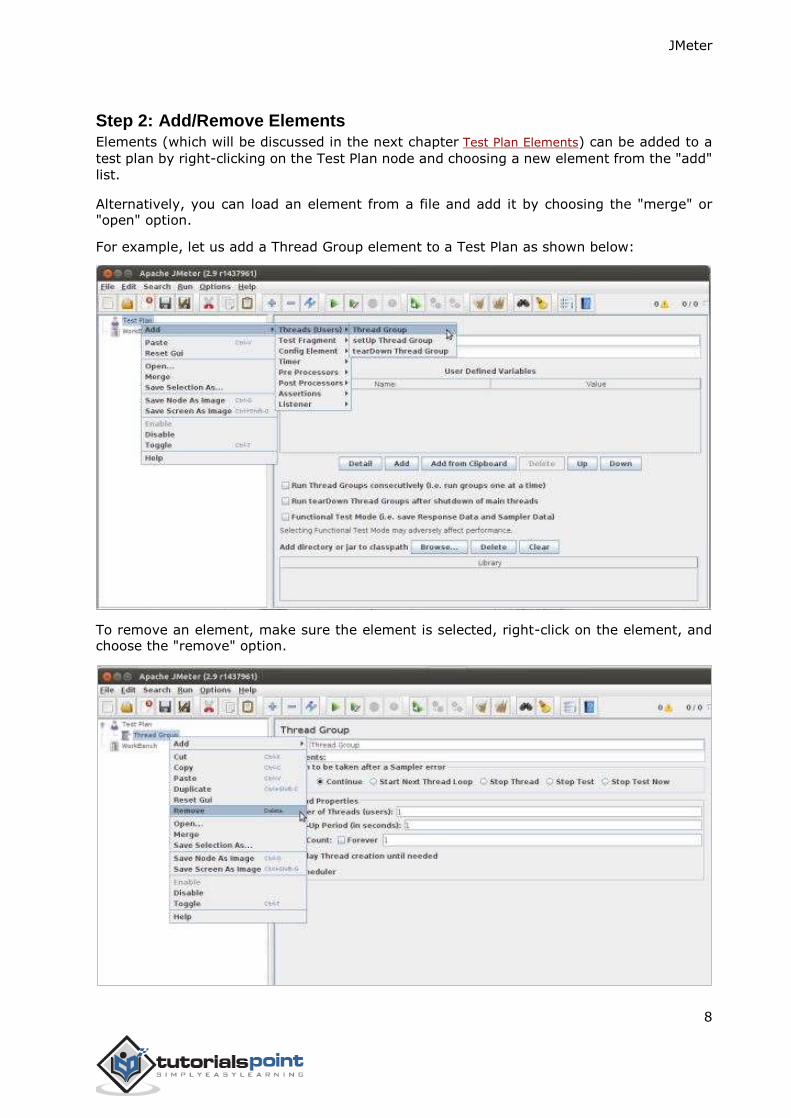
Step 2: Add/Remove Elements Elements (which will be discussed in the next chapter Test Plan Elements) can be added to a
test plan by right-clicking on the Test Plan node and choosing a new element from the "add"
list.
Alternatively, you can load an element from a file and add it by choosing the "merge" or "open" option.
For example, let us add a Thread Group element to a Test Plan as shown below:
To remove an element, make sure the element is selected, right-click on the element, and choose the "remove" option.
JMeter
9
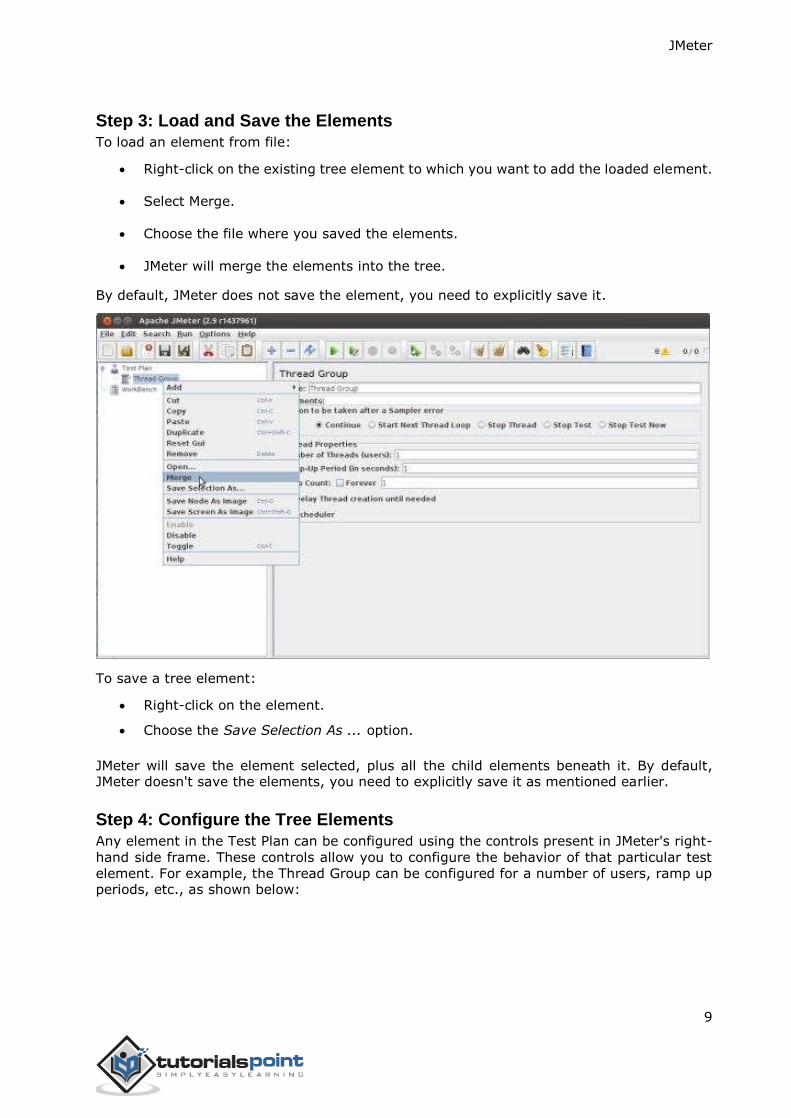
Step 3: Load and Save the Elements
To load an element from file:
Right-click on the existing tree element to which you want to add the loaded element.
Select Merge.
Choose the file where you saved the elements.
JMeter will merge the elements into the tree.
By default, JMeter does not save the element, you need to explicitly save it.
To save a tree element:
Right-click on the element.
Choose the Save Selection As ... option.
JMeter will save the element selected, plus all the child elements beneath it. By default, JMeter doesn't save the elements, you need to explicitly save it as mentioned earlier.
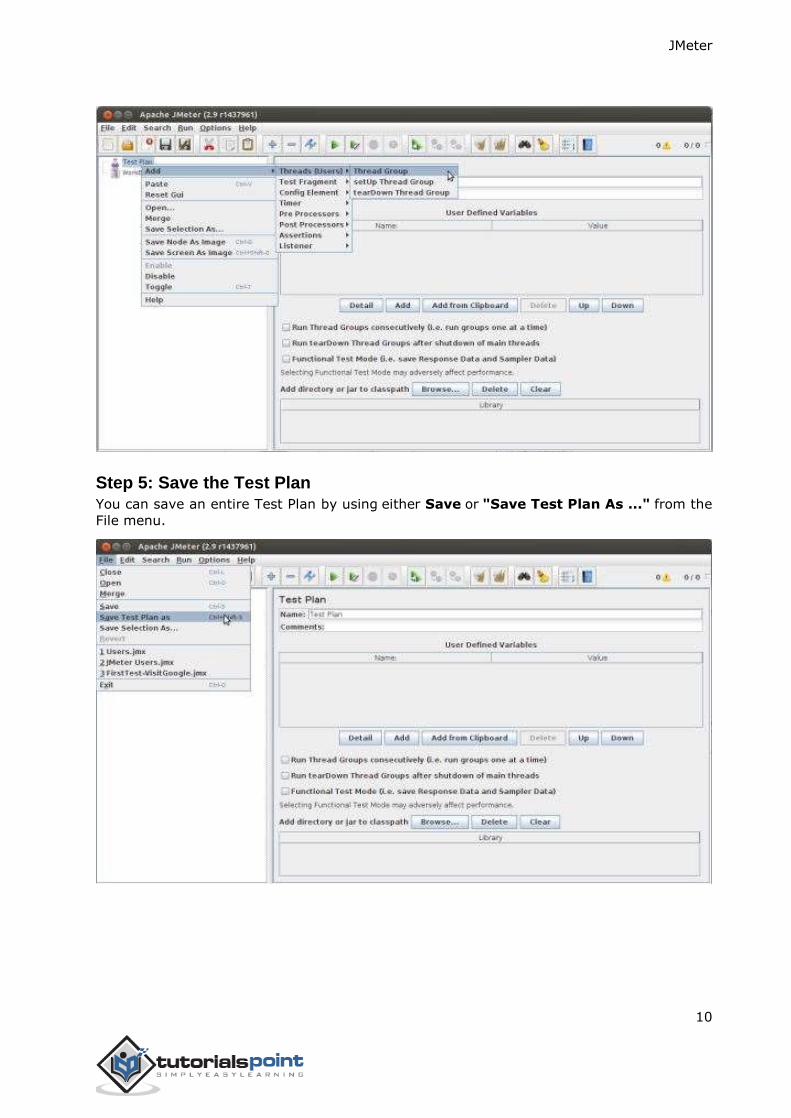
Step 4: Configure the Tree Elements
Any element in the Test Plan can be configured using the controls present in JMeter's right-
hand side frame. These controls allow you to configure the behavior of that particular test
element. For example, the Thread Group can be configured for a number of users, ramp up periods, etc., as shown below:
JMeter
10
Step 5: Save the Test Plan
You can save an entire Test Plan by using either Save or "Save Test Plan As ..." from the
File menu.
JMeter
11
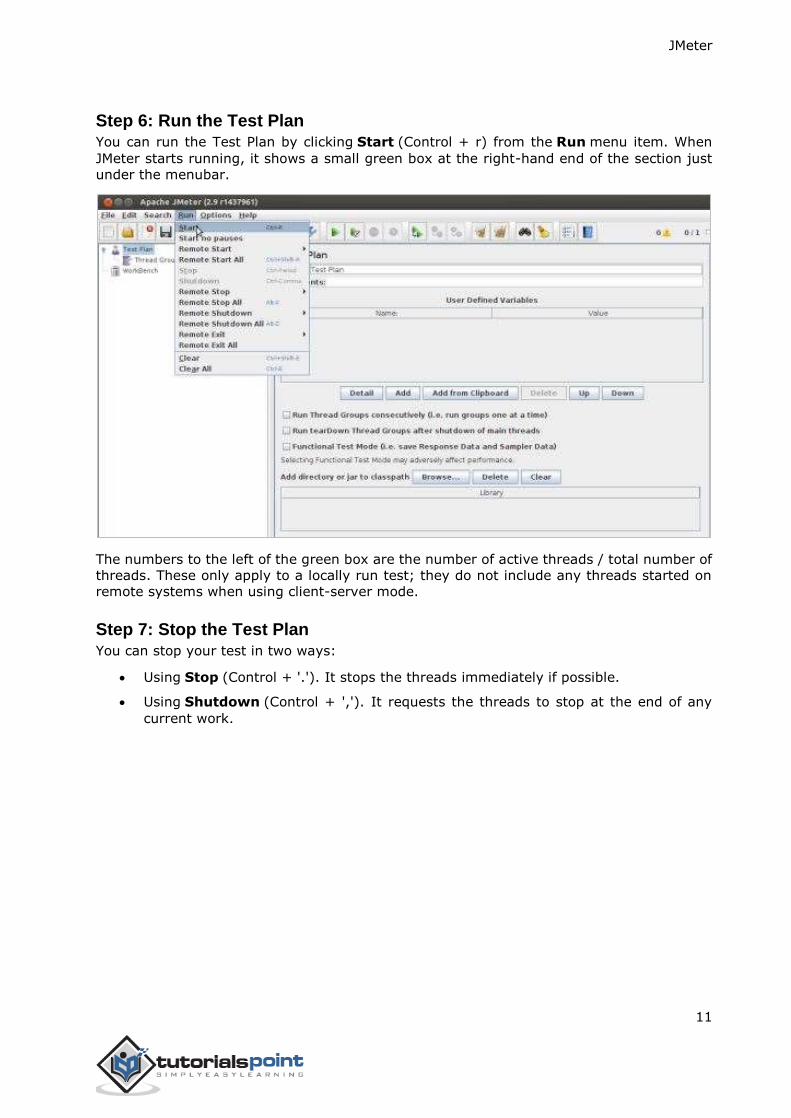
Step 6: Run the Test Plan You can run the Test Plan by clicking Start (Control + r) from the Run menu item. When
JMeter starts running, it shows a small green box at the right-hand end of the section just
under the menubar.
The numbers to the left of the green box are the number of active threads / total number of
threads. These only apply to a locally run test; they do not include any threads started on
remote systems when using client-server mode.
Step 7: Stop the Test Plan
You can stop your test in two ways:
Using Stop (Control + '.'). It stops the threads immediately if possible.
Using Shutdown (Control + ','). It requests the threads to stop at the end of any
current work.
JMeter
12
A JMeter Test Plan comprises of test elements discussed below. A Test Plan comprises of at
least one Thread Group. Within each Thread Group, we may place a combination of one or
more of other elements: Sampler, Logic Controller, Configuration Element, Listener, and
Timer. Each Sampler can be preceded by one or more Pre-processor element, followed by
Post-processor element, and/or Assertion element. Let us see each of these elements in detail:
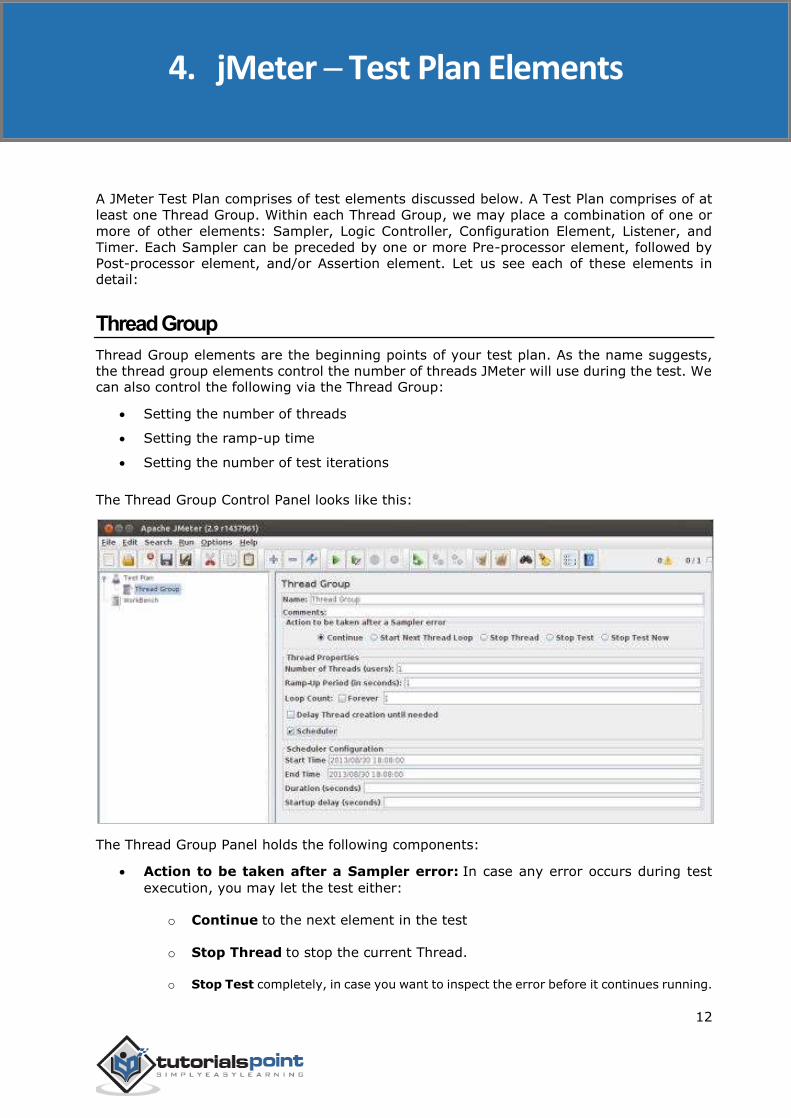
Thread Group
Thread Group elements are the beginning points of your test plan. As the name suggests,
the thread group elements control the number of threads JMeter will use during the test. We can also control the following via the Thread Group:
Setting the number of threads
Setting the ramp-up time
Setting the number of test iterations
The Thread Group Control Panel looks like this:
The Thread Group Panel holds the following components:
Action to be taken after a Sampler error: In case any error occurs during test
execution, you may let the test either:
o Continue to the next element in the test
o Stop Thread to stop the current Thread.
o Stop Test completely, in case you want to inspect the error before it continues running.
4. jMeter ─ Test Plan Elements
JMeter
13
Number of Threads: Simulates the number of users or connections to your server application.
Ramp-Up Period: Defines how long it will take JMeter to get all threads running.
Loop Count: Defines the number of times to execute the test.
Scheduler checkbox: Once selected, the Scheduler Configuration section appears
at the bottom of the control panel.
Scheduler Configuration: You can configure the start and end time of running the test.
Controllers
JMeter has two types of Controllers: Samplers and Logic Controllers.
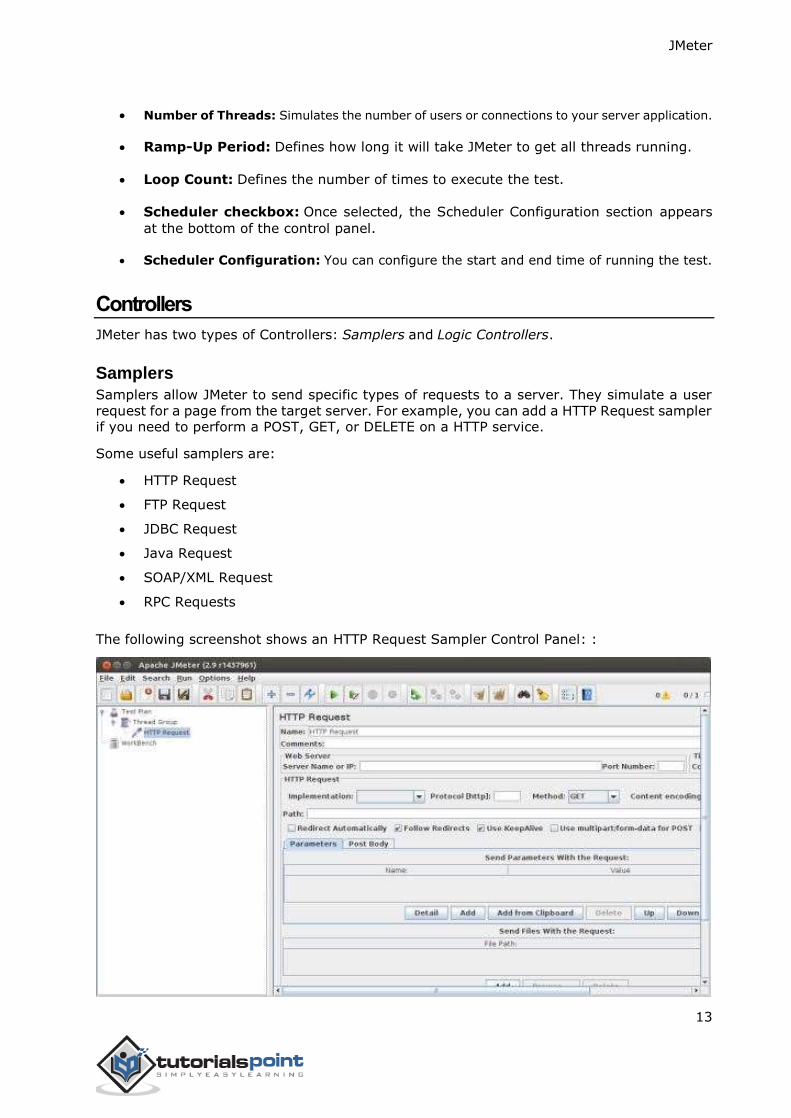
Samplers
Samplers allow JMeter to send specific types of requests to a server. They simulate a user
request for a page from the target server. For example, you can add a HTTP Request sampler if you need to perform a POST, GET, or DELETE on a HTTP service.
Some useful samplers are:
HTTP Request
FTP Request
JDBC Request
Java Request
SOAP/XML Request
RPC Requests
The following screenshot shows an HTTP Request Sampler Control Panel: :
JMeter
14
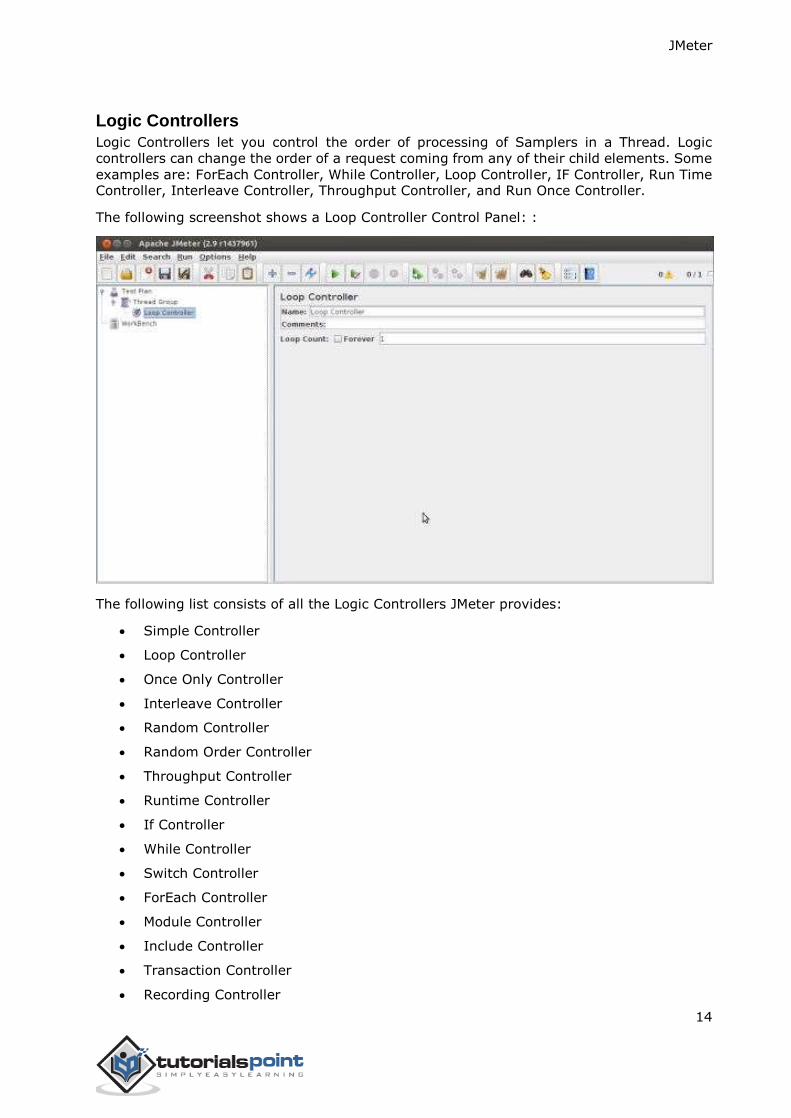
Logic Controllers
Logic Controllers let you control the order of processing of Samplers in a Thread. Logic
controllers can change the order of a request coming from any of their child elements. Some
examples are: ForEach Controller, While Controller, Loop Controller, IF Controller, Run Time Controller, Interleave Controller, Throughput Controller, and Run Once Controller.
The following screenshot shows a Loop Controller Control Panel: :
The following list consists of all the Logic Controllers JMeter provides:
Simple Controller
Loop Controller
Once Only Controller
Interleave Controller
Random Controller
Random Order Controller
Throughput Controller
Runtime Controller
If Controller
While Controller
Switch Controller
ForEach Controller
Module Controller
Include Controller
Transaction Controller
Recording Controller
JMeter
15
Test Fragments
A Test Fragment is a special type of element placed at the same level as the Thread Group
element. It is distinguished from a Thread Group in that it is not executed unless it is
referenced by either a Module Controller or an Include_Controller. This element is purely for code re-use within Test Plans.
Listeners
Listeners let you view the results of Samplers in the form of tables, graphs, trees, or simple
text in some log files. They provide visual access to the data gathered by JMeter about the
test cases as a Sampler component of JMeter is executed.
Listeners can be added anywhere in the test, including directly under the test plan. They will
collect data only from elements at or below their level. The following list consists of all the Listeners JMeter provides:
Sample Result Save Configuration
Graph Full Results
Graph Results
Spline Visualizer
Assertion Results
View Results Tree
Aggregate Report
View Results in Table
Simple Data Writer
Monitor Results
Distribution Graph (alpha)
Aggregate Graph
Mailer Visualizer
BeanShell Listener
Summary Report
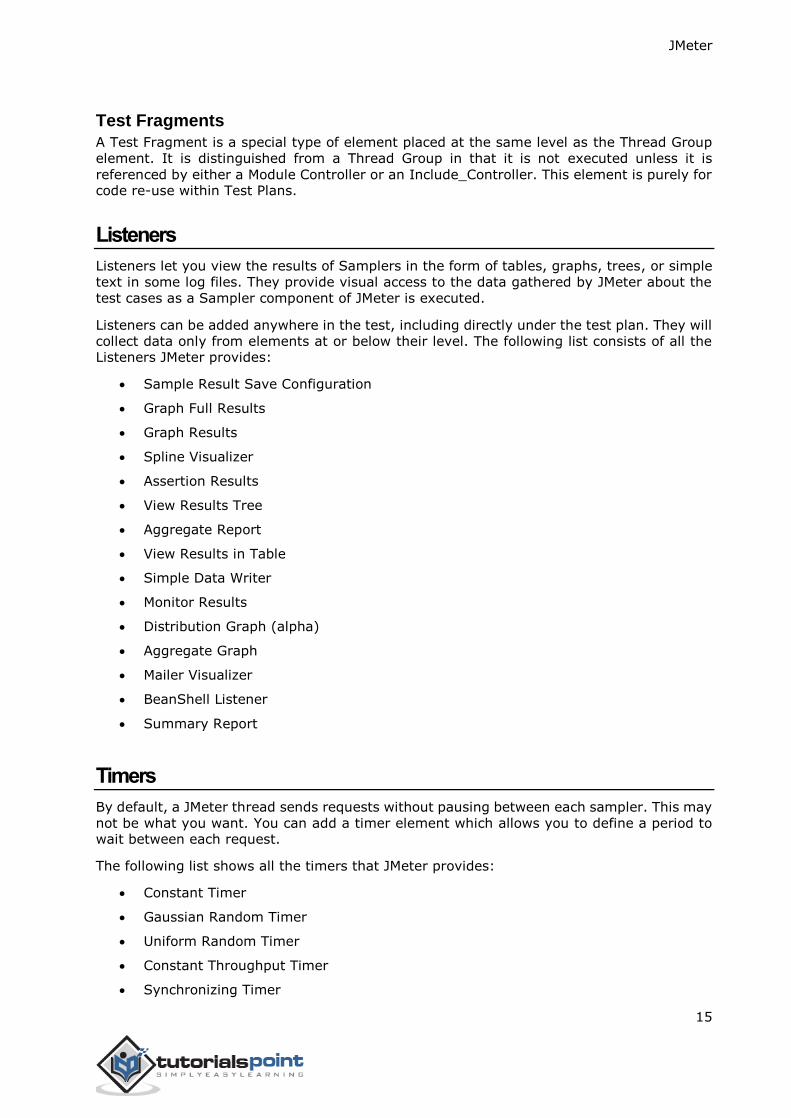
Timers
By default, a JMeter thread sends requests without pausing between each sampler. This may
not be what you want. You can add a timer element which allows you to define a period to wait between each request.
The following list shows all the timers that JMeter provides:
Constant Timer
Gaussian Random Timer
Uniform Random Timer
Constant Throughput Timer
Synchronizing Timer
JMeter
16
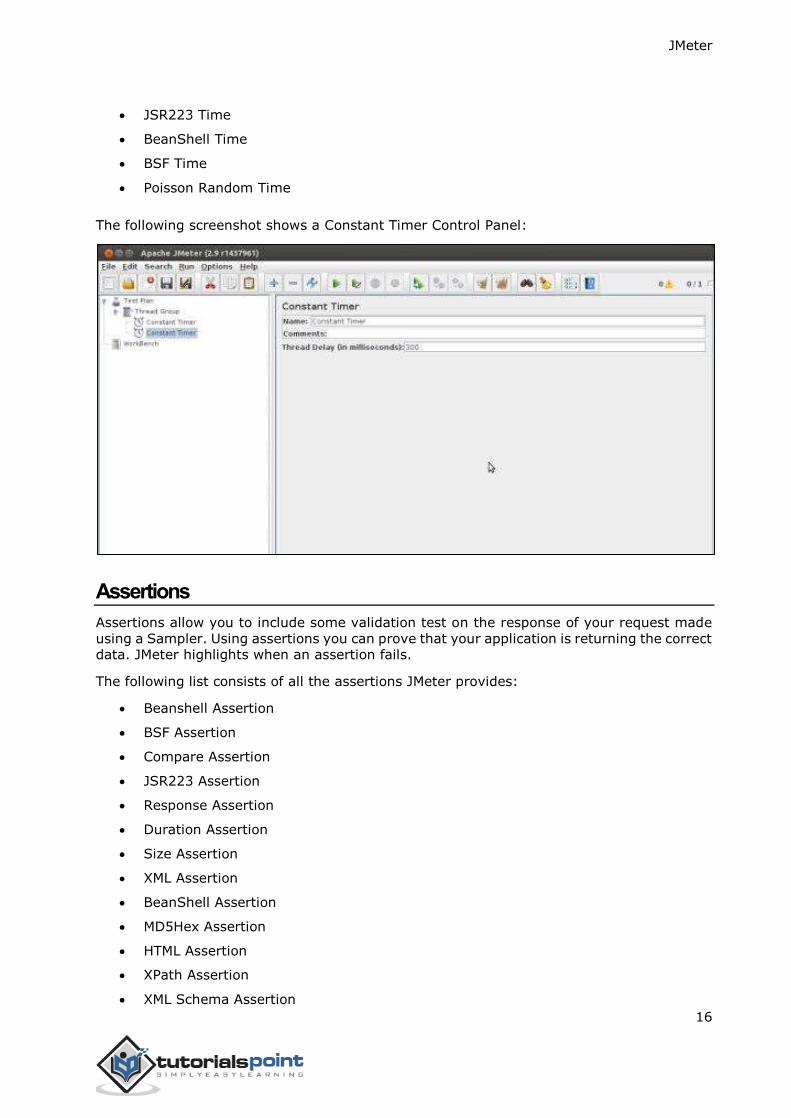
JSR223 Time
BeanShell Time
BSF Time
Poisson Random Time
The following screenshot shows a Constant Timer Control Panel:
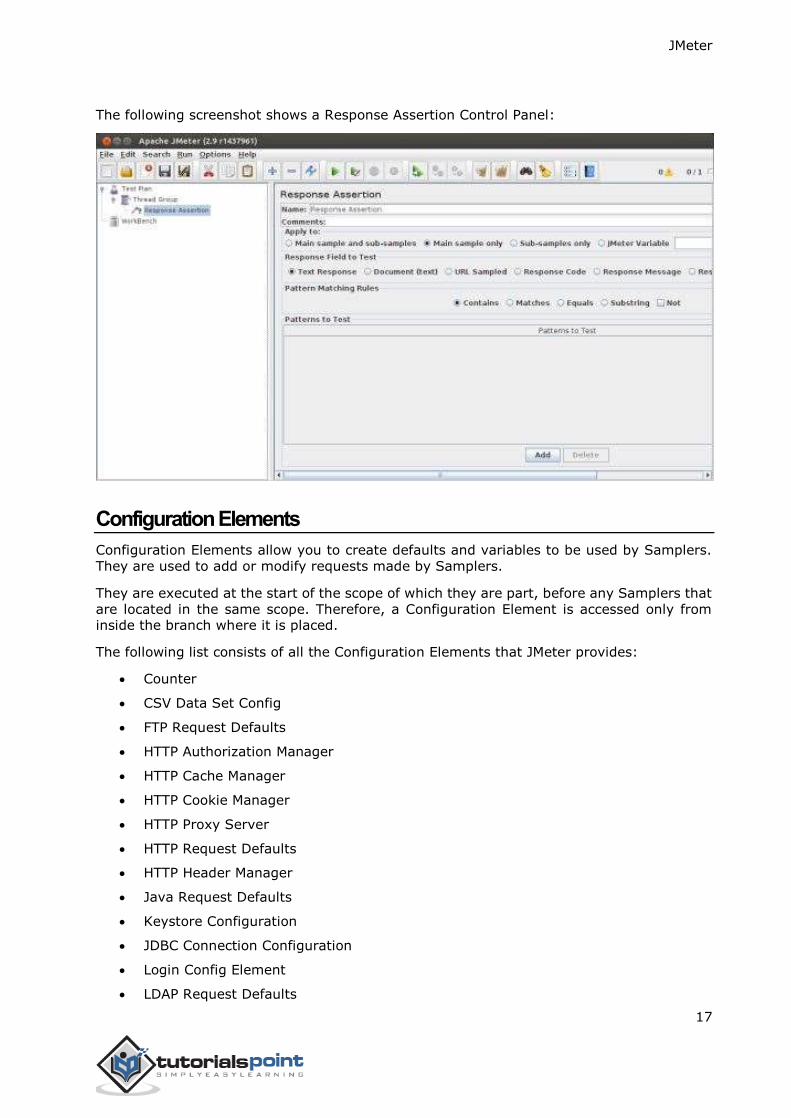
Assertions
Assertions allow you to include some validation test on the response of your request made
using a Sampler. Using assertions you can prove that your application is returning the correct data. JMeter highlights when an assertion fails.
The following list consists of all the assertions JMeter provides:
Beanshell Assertion
BSF Assertion
Compare Assertion
JSR223 Assertion
Response Assertion
Duration Assertion
Size Assertion
XML Assertion
BeanShell Assertion
MD5Hex Assertion
HTML Assertion
XPath Assertion
XML Schema Assertion
JMeter
17
The following screenshot shows a Response Assertion Control Panel:
Configuration Elements
Configuration Elements allow you to create defaults and variables to be used by Samplers.
They are used to add or modify requests made by Samplers.
They are executed at the start of the scope of which they are part, before any Samplers that
are located in the same scope. Therefore, a Configuration Element is accessed only from inside the branch where it is placed.
The following list consists of all the Configuration Elements that JMeter provides:
Counter
CSV Data Set Config
FTP Request Defaults
HTTP Authorization Manager
HTTP Cache Manager
HTTP Cookie Manager
HTTP Proxy Server
HTTP Request Defaults
HTTP Header Manager
Java Request Defaults
Keystore Configuration
JDBC Connection Configuration
Login Config Element
LDAP Request Defaults
JMeter
18
LDAP Extended Request Defaults
TCP Sampler Config
User Defined Variables
Simple Config Element
Random Variable
Pre-processor Elements
A pre-processor element is something that runs just before a sampler executes. They are
often used to modify the settings of a Sample Request just before it runs, or to update variables that are not extracted from response text.
The following list consists of all the pre-processor elements that JMeter provides:
HTML Link Parser
HTTP URL Re-writing Modifier
HTTP User Parameter Modifier
User Parameters
JDBC Pre-processor
JSR223 Pre-processor
RegEx User Parameters
BeanShell Pre-processor
BSF Pre-processor
Post-processor Elements
A post-processor executes after a sampler finishes its execution. This element is most often
used to process the response data, for example, to retrieve a particular value for later use.
The following list consists of all the post-processor elements that JMeter provides:
Regular Expression Extractor
XPath Extractor
Result Status Action Handler
JSR223 Post-processor
JDBC Post-processor
BSF Post-processor
CSS/JQuery Extractor
BeanShell Post-processor
Debug Post-processor
JMeter
19
Execution Order of Test Elements
Following is the execution order of the test plan elements:
1. Configuration elements
2. Pre-Processors
3. Timers
4. Sampler
5. Post-Processors (unless SampleResult is null)
6. Assertions (unless SampleResult is null)
7. Listeners (unless SampleResult is null)
JMeter
20
Let us build a simple test plan which tests a web page. We write a test plan in Apache JMeter
so that we can test the performance of the web page shown by the
URL:http://www.tutorialspoint.com/.
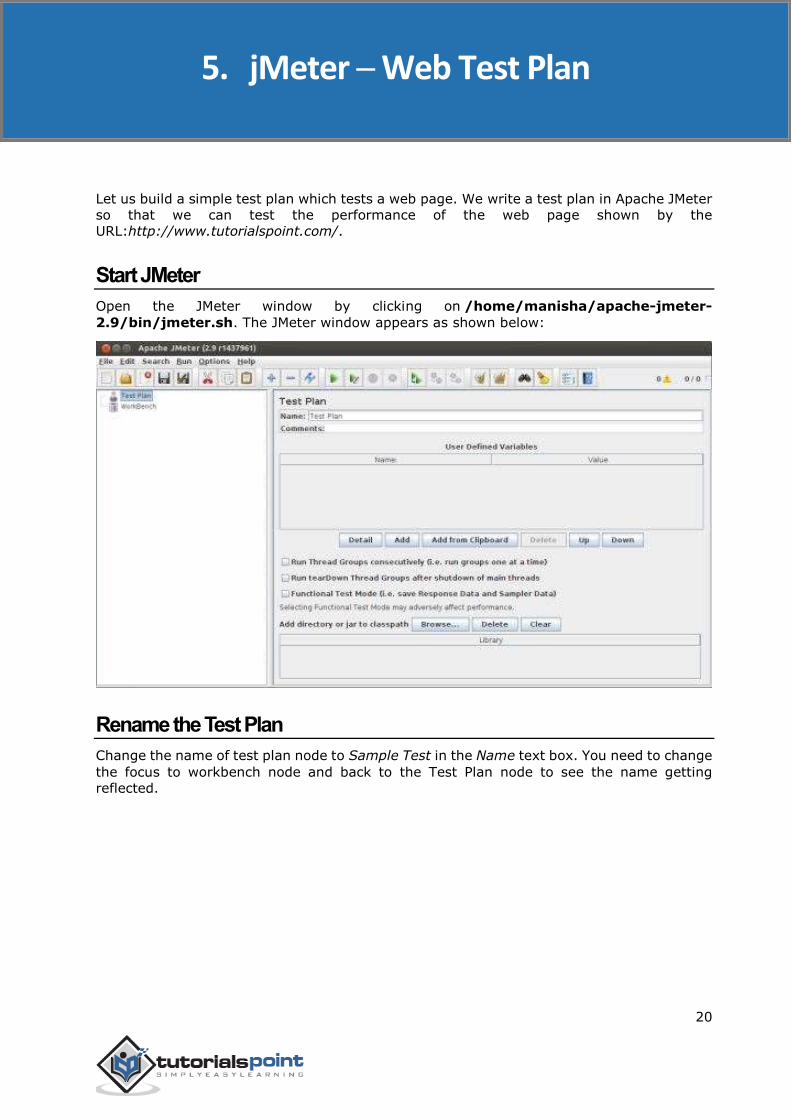
Start JMeter
Open the JMeter window by clicking on /home/manisha/apache-jmeter-
2.9/bin/jmeter.sh. The JMeter window appears as shown below:
Rename the Test Plan
Change the name of test plan node to Sample Test in the Name text box. You need to change
the focus to workbench node and back to the Test Plan node to see the name getting
reflected.
5. jMeter ─ Web Test Plan
JMeter
21
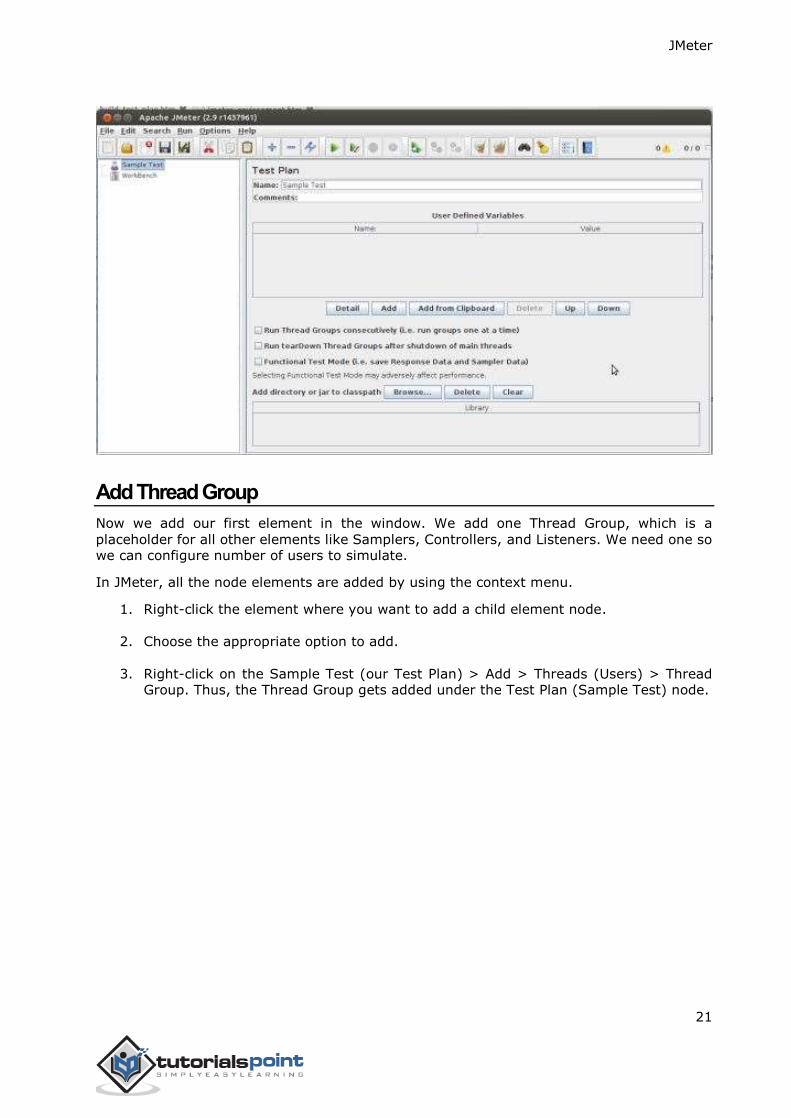
Add Thread Group
Now we add our first element in the window. We add one Thread Group, which is a
placeholder for all other elements like Samplers, Controllers, and Listeners. We need one so we can configure number of users to simulate.
In JMeter, all the node elements are added by using the context menu.
1. Right-click the element where you want to add a child element node.
2. Choose the appropriate option to add.
3. Right-click on the Sample Test (our Test Plan) > Add > Threads (Users) > Thread Group. Thus, the Thread Group gets added under the Test Plan (Sample Test) node.
JMeter
22
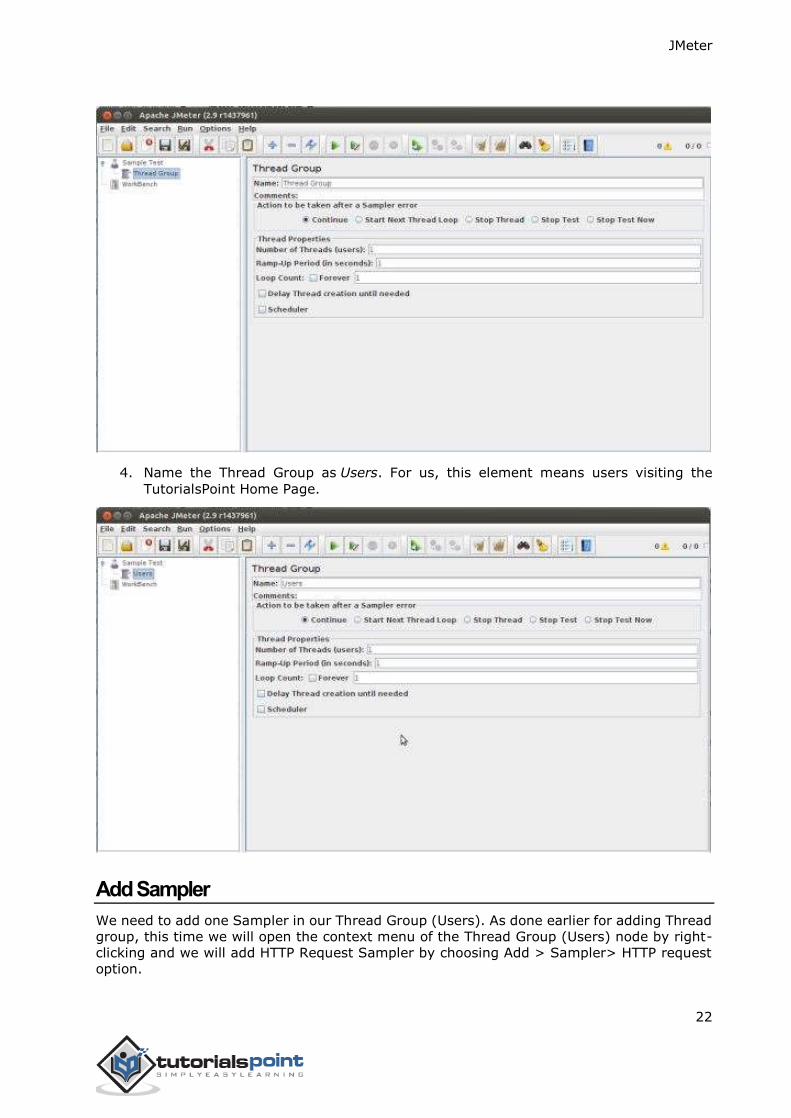
4. Name the Thread Group as Users. For us, this element means users visiting the
TutorialsPoint Home Page.
Add Sampler
We need to add one Sampler in our Thread Group (Users). As done earlier for adding Thread
group, this time we will open the context menu of the Thread Group (Users) node by right-
clicking and we will add HTTP Request Sampler by choosing Add > Sampler> HTTP request
option.
JMeter
23
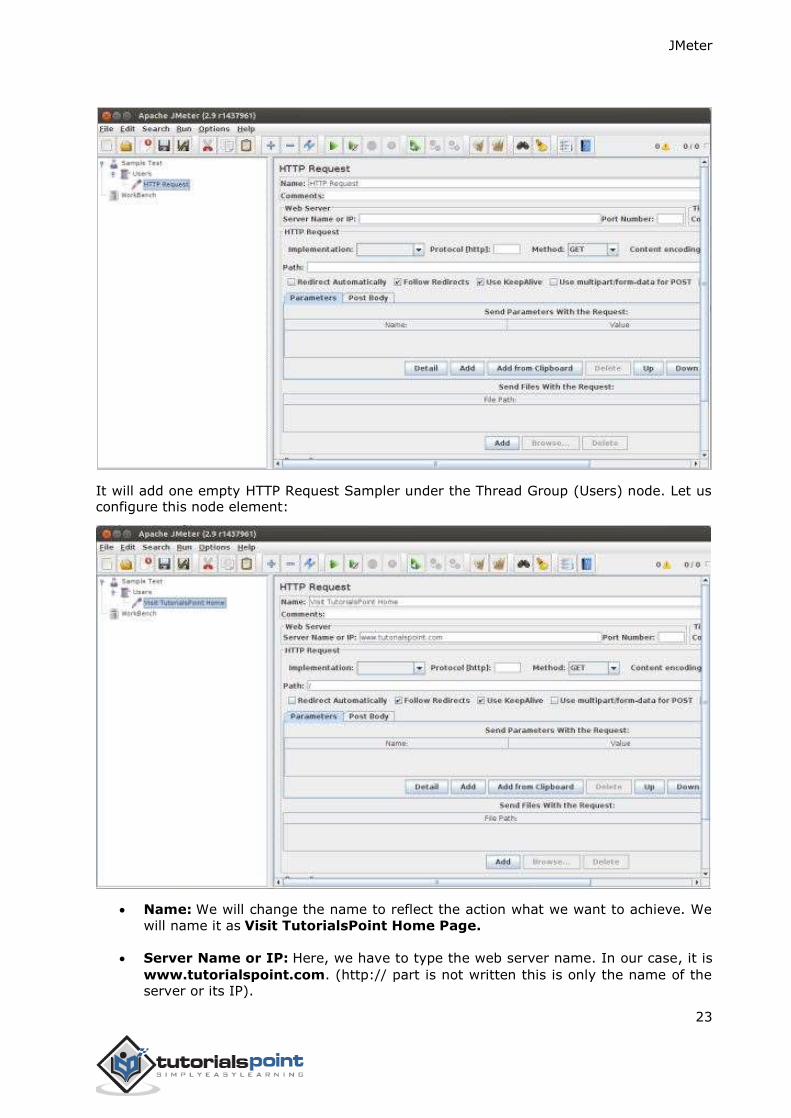
It will add one empty HTTP Request Sampler under the Thread Group (Users) node. Let us configure this node element:
Name: We will change the name to reflect the action what we want to achieve. We
will name it as Visit TutorialsPoint Home Page.
Server Name or IP: Here, we have to type the web server name. In our case, it is
www.tutorialspoint.com. (http:// part is not written this is only the name of the
server or its IP).
JMeter
24
Protocol: We will keep this blank, which means we want HTTP as the protocol.
Path: We will type path as / (slash). It means we want the root page of the server.
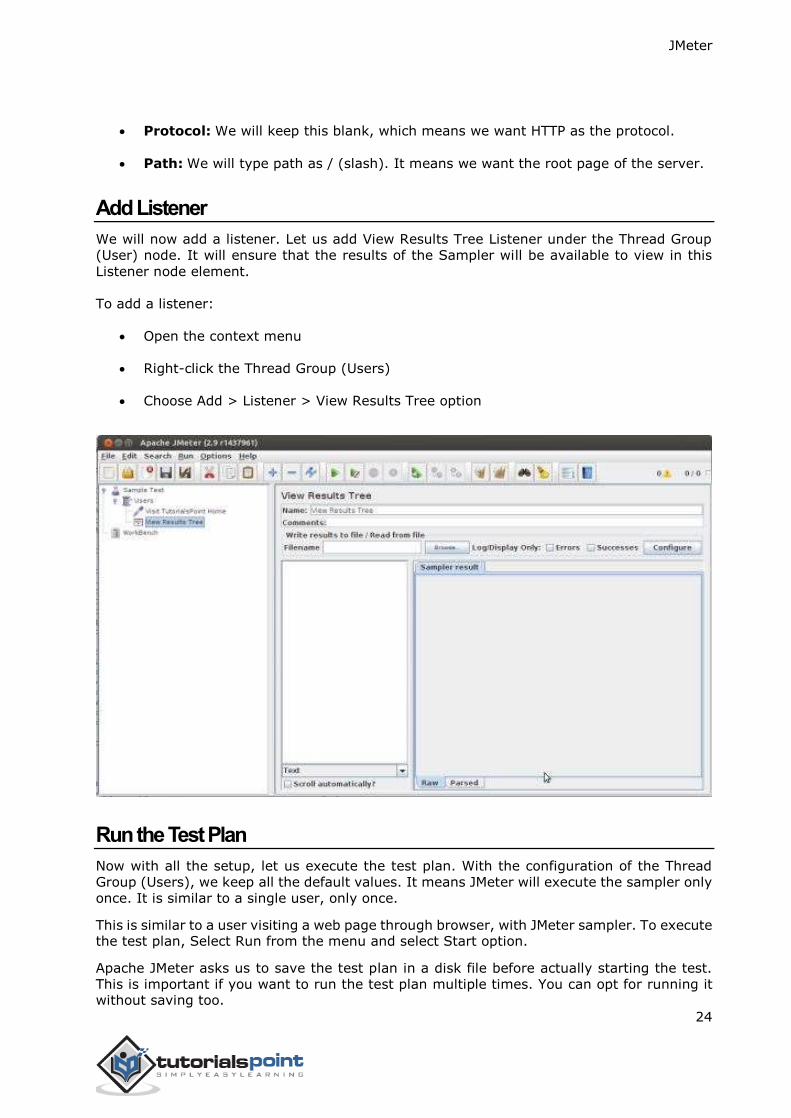
Add Listener
We will now add a listener. Let us add View Results Tree Listener under the Thread Group
(User) node. It will ensure that the results of the Sampler will be available to view in this
Listener node element.
To add a listener:
Open the context menu
Right-click the Thread Group (Users)
Choose Add > Listener > View Results Tree option
Run the Test Plan
Now with all the setup, let us execute the test plan. With the configuration of the Thread
Group (Users), we keep all the default values. It means JMeter will execute the sampler only
once. It is similar to a single user, only once.
This is similar to a user visiting a web page through browser, with JMeter sampler. To execute the test plan, Select Run from the menu and select Start option.
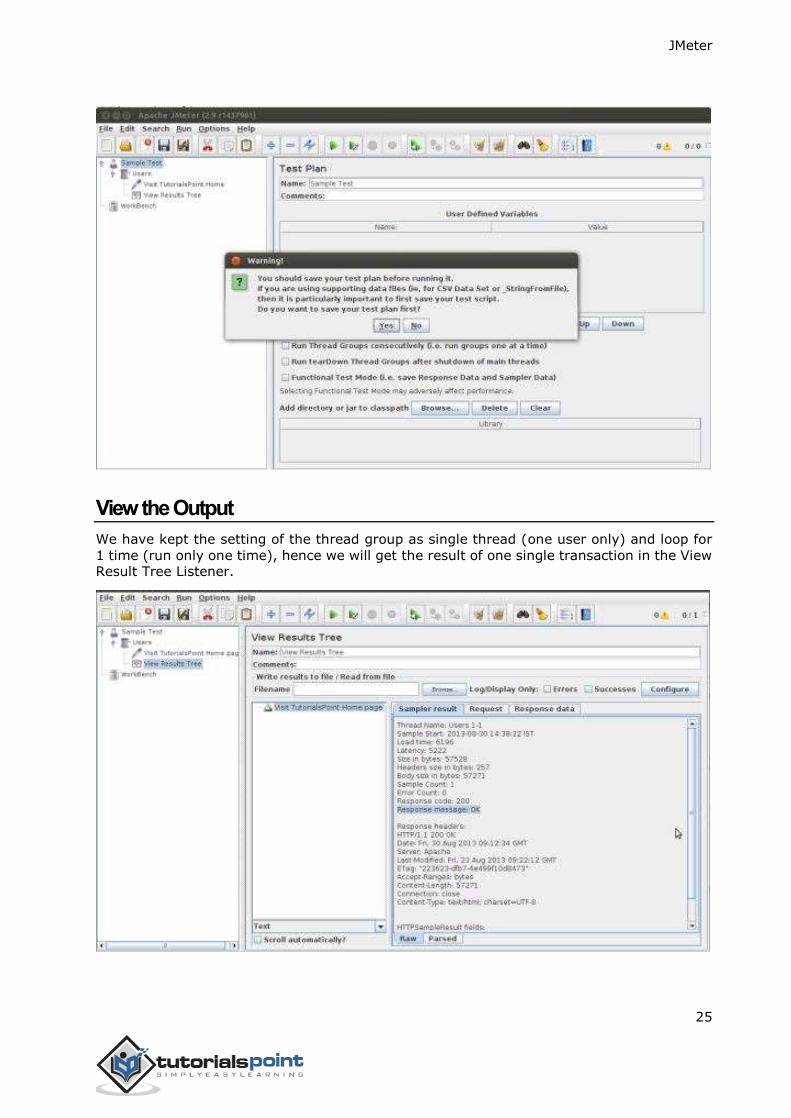
Apache JMeter asks us to save the test plan in a disk file before actually starting the test.
This is important if you want to run the test plan multiple times. You can opt for running it without saving too.
JMeter
25
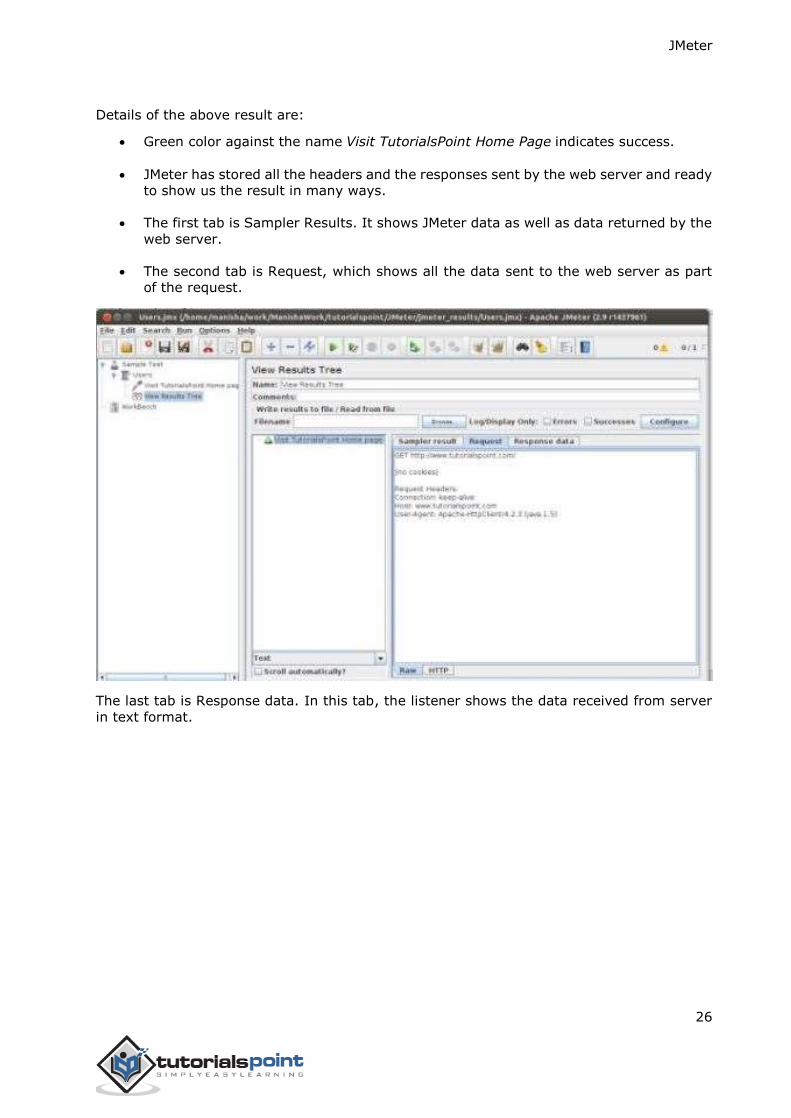
View the Output
We have kept the setting of the thread group as single thread (one user only) and loop for
1 time (run only one time), hence we will get the result of one single transaction in the View Result Tree Listener.
JMeter
26
Details of the above result are:
Green color against the name Visit TutorialsPoint Home Page indicates success.
JMeter has stored all the headers and the responses sent by the web server and ready
to show us the result in many ways.
The first tab is Sampler Results. It shows JMeter data as well as data returned by the
web server.
The second tab is Request, which shows all the data sent to the web server as part
of the request.
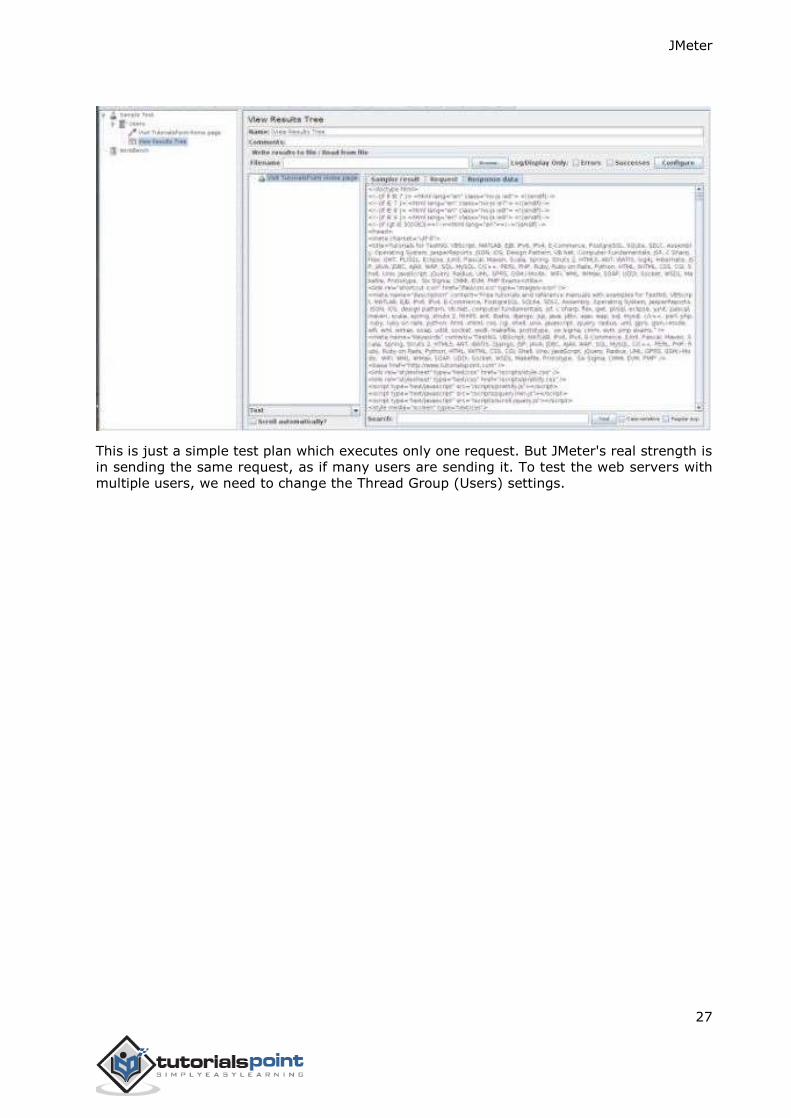
The last tab is Response data. In this tab, the listener shows the data received from server
in text format.
JMeter
27
This is just a simple test plan which executes only one request. But JMeter's real strength is
in sending the same request, as if many users are sending it. To test the web servers with
multiple users, we need to change the Thread Group (Users) settings.
JMeter
28
In this chapter, we will see how to create a simple test plan to test the database server. For
our test purpose we use the MYSQL database server. You can use any other database for testing. For installation and table creation in MYSQ please refer MYSQL Tutorial.
Once MYSQL is installed, follow the steps below to setup the database:
Create a database with name "tutorial".
Create a table named tutorials_tbl.
Insert records into tutorials_tbl as shown below:
mysql> use TUTORIALS;
Database changed
mysql> INSERT INTO tutorials_tbl
->(tutorial_title, tutorial_author, submission_date)
->VALUES
->("Learn PHP", "John Poul", NOW());
Query OK, 1 row affected (0.01 sec)
mysql> INSERT INTO tutorials_tbl
->(tutorial_title, tutorial_author, submission_date)
->VALUES
->("Learn MySQL", "Abdul S", NOW());
Query OK, 1 row affected (0.01 sec)
mysql> INSERT INTO tutorials_tbl
->(tutorial_title, tutorial_author, submission_date)
->VALUES
->("JAVA Tutorial", "Sanjay", '2007-05-06');
Query OK, 1 row affected (0.01 sec)
mysql>
Copy the appropriate JDBC driver to /home/manisha/apache-jmeter-2.9/lib.
Create JMeter Test Plan
Let us start the JMeter from /home/manisha/apache-jmeter-2.9/bin/jmeter.sh.
Add Users
To create a Thread group,
1. Right-click on Test Plan.
2. Select Add > Threads (Users) > Thread Group.
6. jMeter ─ Database Test Plan
JMeter
29
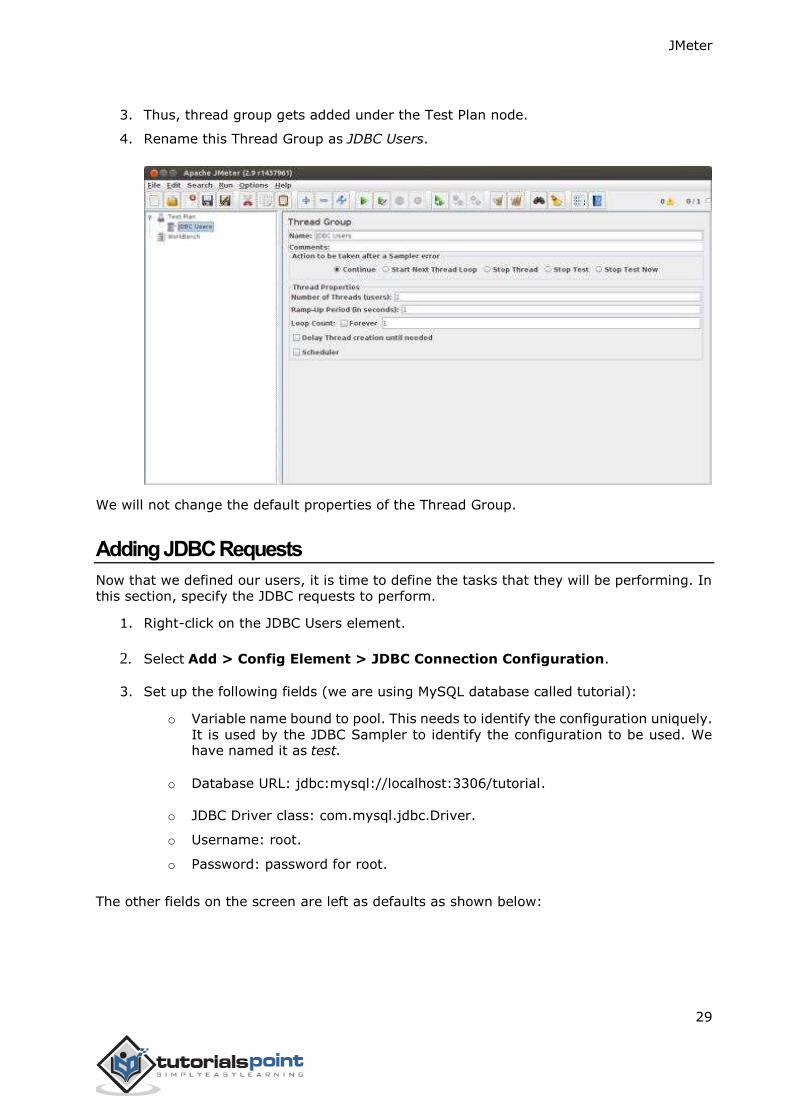
3. Thus, thread group gets added under the Test Plan node.
4. Rename this Thread Group as JDBC Users.
We will not change the default properties of the Thread Group.
Adding JDBC Requests
Now that we defined our users, it is time to define the tasks that they will be performing. In this section, specify the JDBC requests to perform.
1. Right-click on the JDBC Users element.
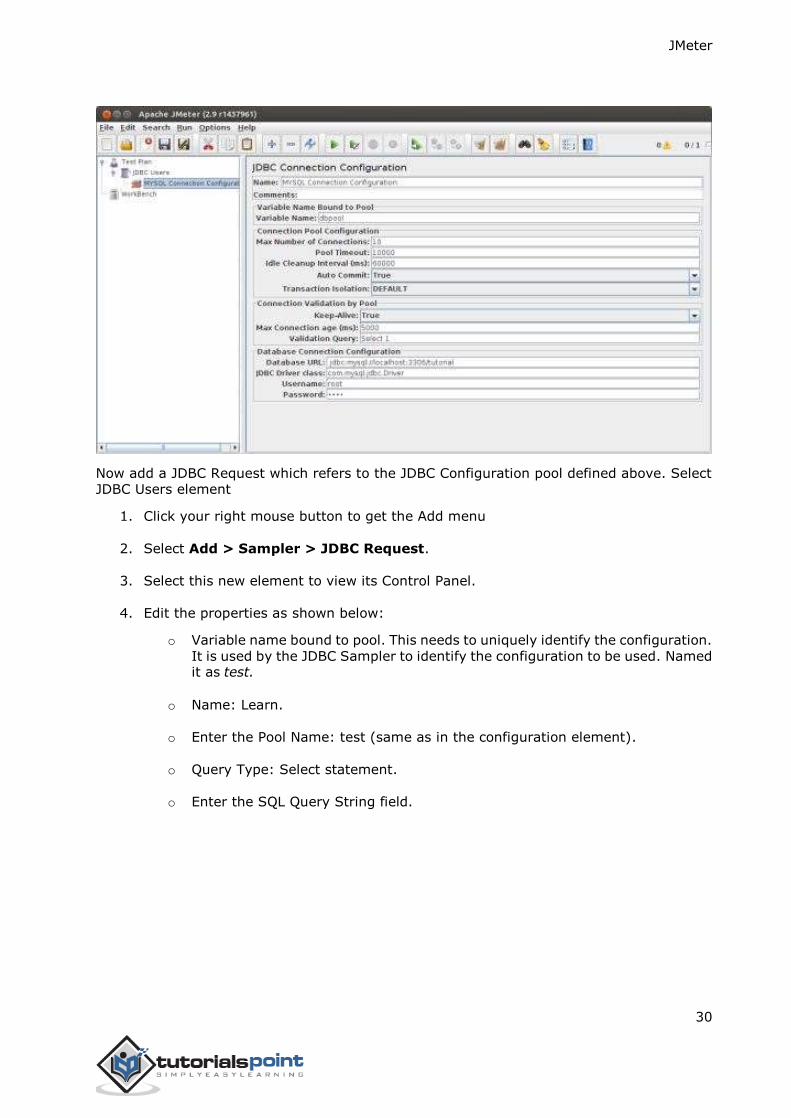
2. Select Add > Config Element > JDBC Connection Configuration.
3. Set up the following fields (we are using MySQL database called tutorial):
o Variable name bound to pool. This needs to identify the configuration uniquely.
It is used by the JDBC Sampler to identify the configuration to be used. We have named it as test.
o Database URL: jdbc:mysql://localhost:3306/tutorial.
o JDBC Driver class: com.mysql.jdbc.Driver.
o Username: root.
o Password: password for root.
The other fields on the screen are left as defaults as shown below:
JMeter
30
Now add a JDBC Request which refers to the JDBC Configuration pool defined above. Select JDBC Users element
1. Click your right mouse button to get the Add menu
2. Select Add > Sampler > JDBC Request.
3. Select this new element to view its Control Panel.
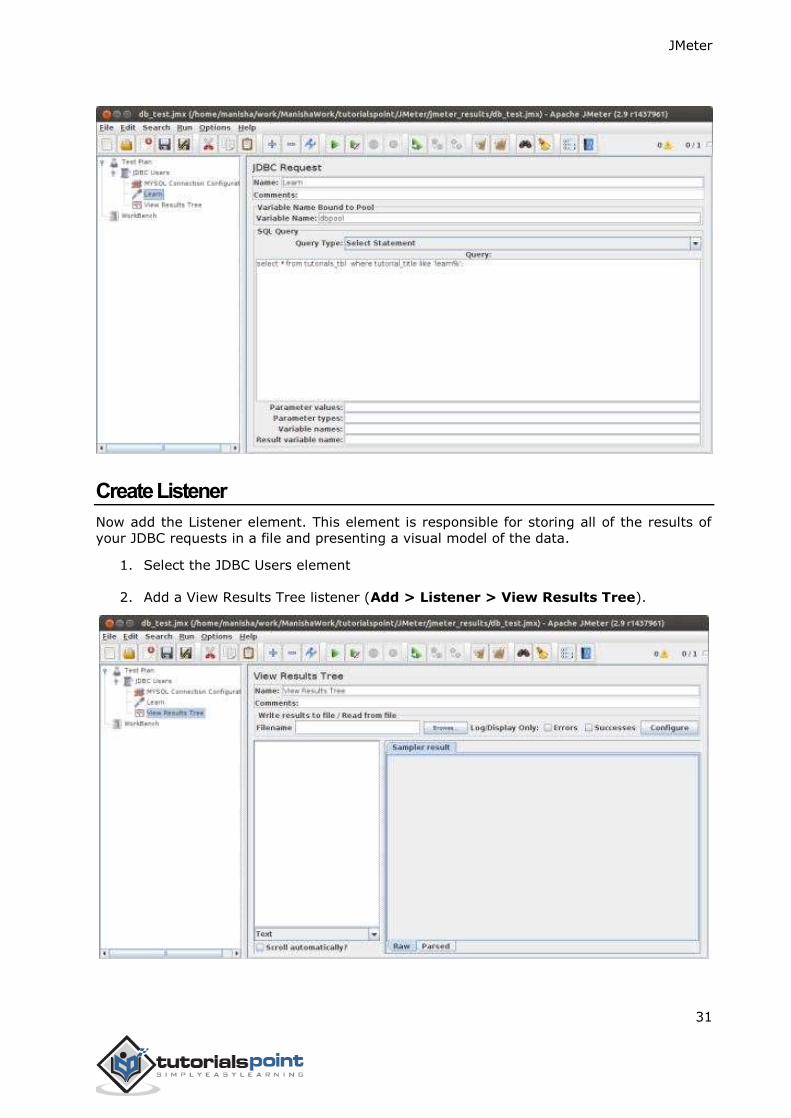
4. Edit the properties as shown below:
o Variable name bound to pool. This needs to uniquely identify the configuration.
It is used by the JDBC Sampler to identify the configuration to be used. Named it as test.
o Name: Learn.
o Enter the Pool Name: test (same as in the configuration element).
o Query Type: Select statement.
o Enter the SQL Query String field.
JMeter
31
Create Listener
Now add the Listener element. This element is responsible for storing all of the results of
your JDBC requests in a file and presenting a visual model of the data.
1. Select the JDBC Users element
2. Add a View Results Tree listener (Add > Listener > View Results Tree).
JMeter
32
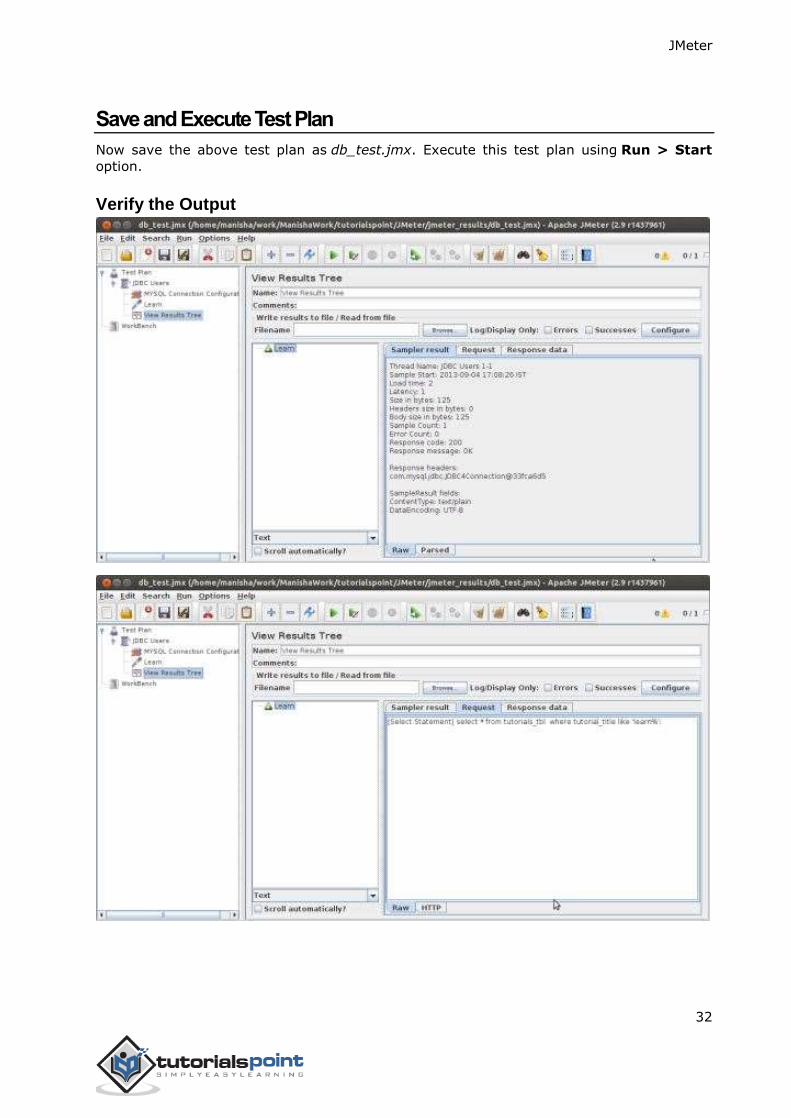
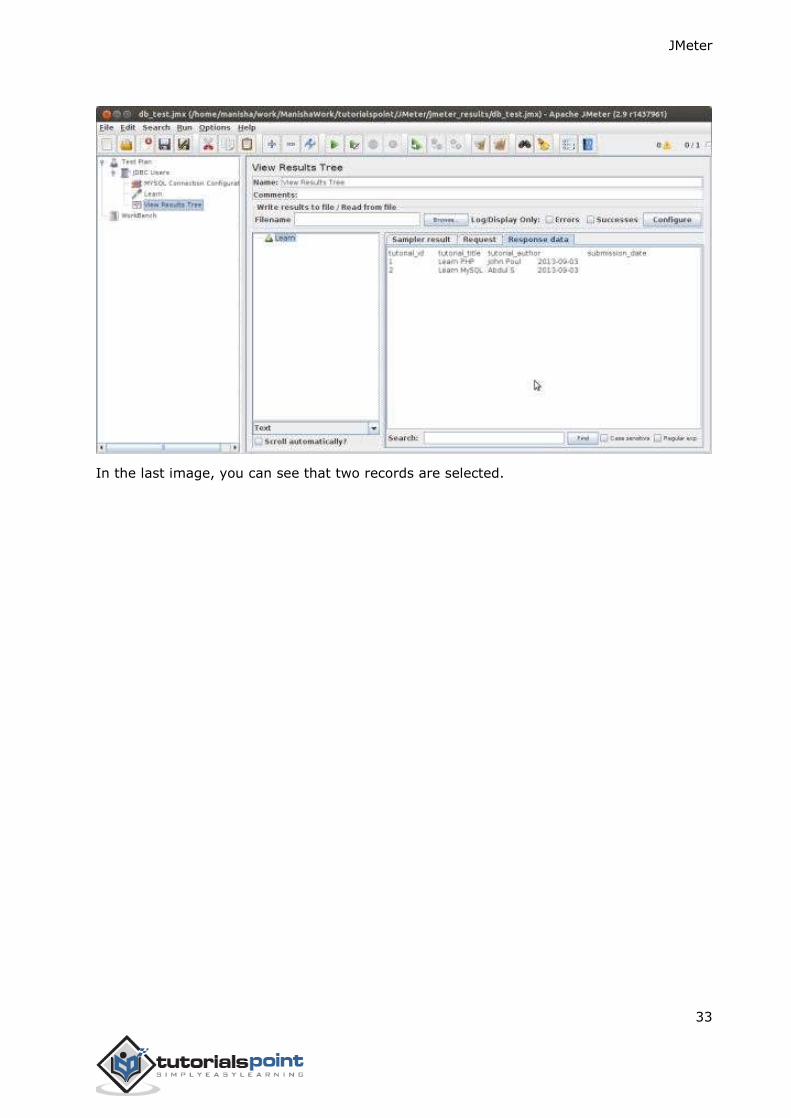
Save and Execute Test Plan
Now save the above test plan as db_test.jmx. Execute this test plan using Run > Start
option.
Verify the Output
JMeter
33
In the last image, you can see that two records are selected.
JMeter
34
In this chapter, we will see how to test a FTP site using JMeter. Let us create a Test Plan to test the FTP site.
Rename Test Plan
1. Open the JMeter window by clicking /home/manisha/apache-jmeter-
2.9/bin/jmeter.sh.
2. Click the Test Plan node.
3. Rename this Test Plan node as TestFTPSite.
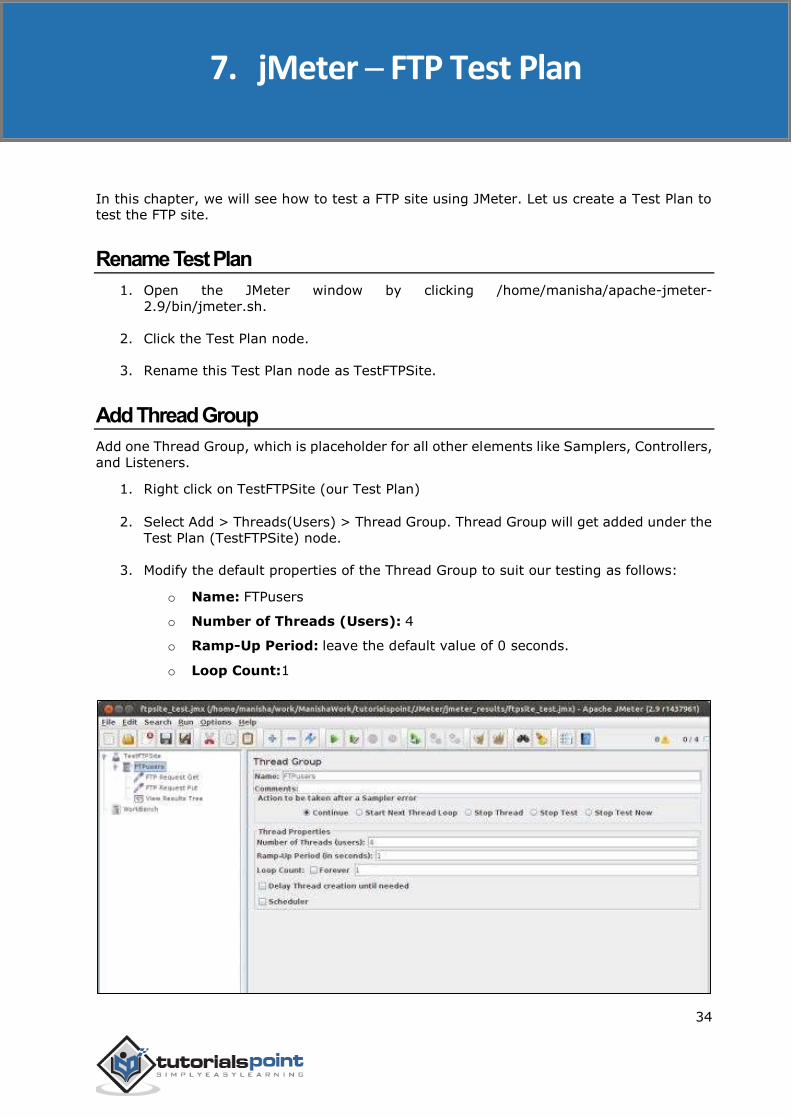
Add Thread Group
Add one Thread Group, which is placeholder for all other elements like Samplers, Controllers,
and Listeners.
1. Right click on TestFTPSite (our Test Plan)
2. Select Add > Threads(Users) > Thread Group. Thread Group will get added under the
Test Plan (TestFTPSite) node.
3. Modify the default properties of the Thread Group to suit our testing as follows:
o Name: FTPusers
o Number of Threads (Users): 4
o Ramp-Up Period: leave the default value of 0 seconds.
o Loop Count:1
7. jMeter ─ FTP Test Plan
JMeter
35
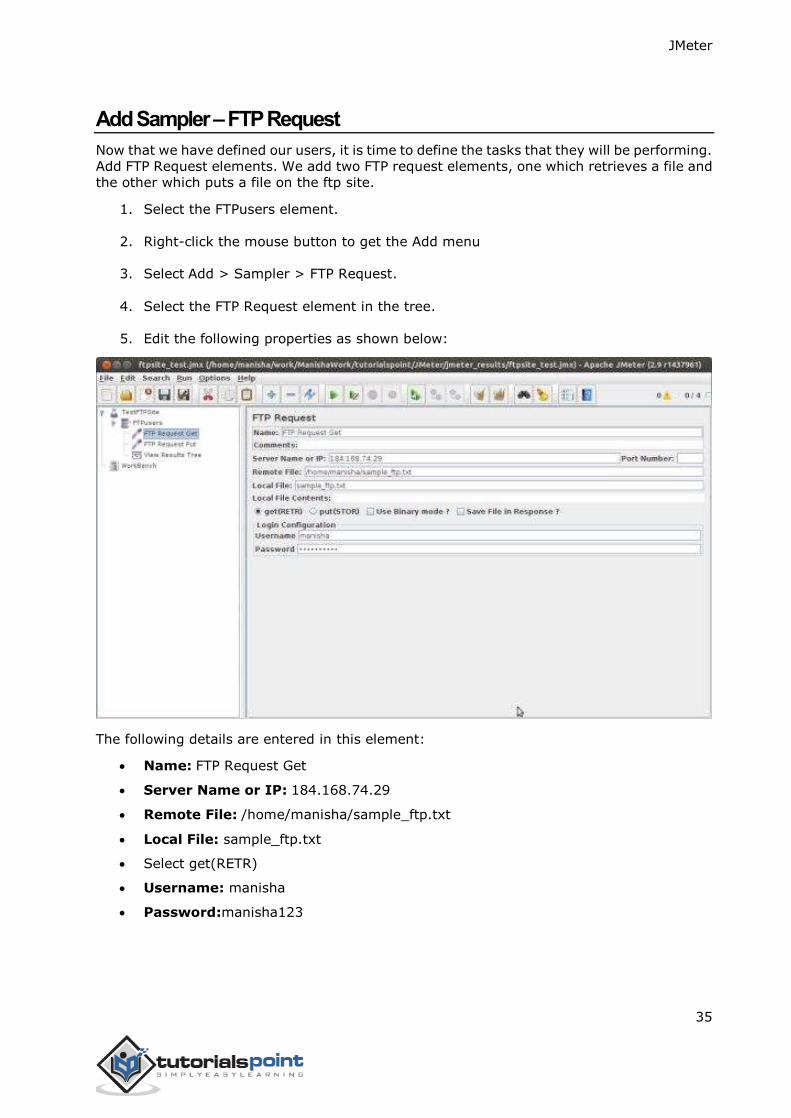
Add Sampler – FTP Request
Now that we have defined our users, it is time to define the tasks that they will be performing.
Add FTP Request elements. We add two FTP request elements, one which retrieves a file and
the other which puts a file on the ftp site.
1. Select the FTPusers element.
2. Right-click the mouse button to get the Add menu
3. Select Add > Sampler > FTP Request.
4. Select the FTP Request element in the tree.
5. Edit the following properties as shown below:
The following details are entered in this element:
Name: FTP Request Get
Server Name or IP: 184.168.74.29
Remote File: /home/manisha/sample_ftp.txt
Local File: sample_ftp.txt
Select get(RETR)
Username: manisha
Password:manisha123
JMeter
36
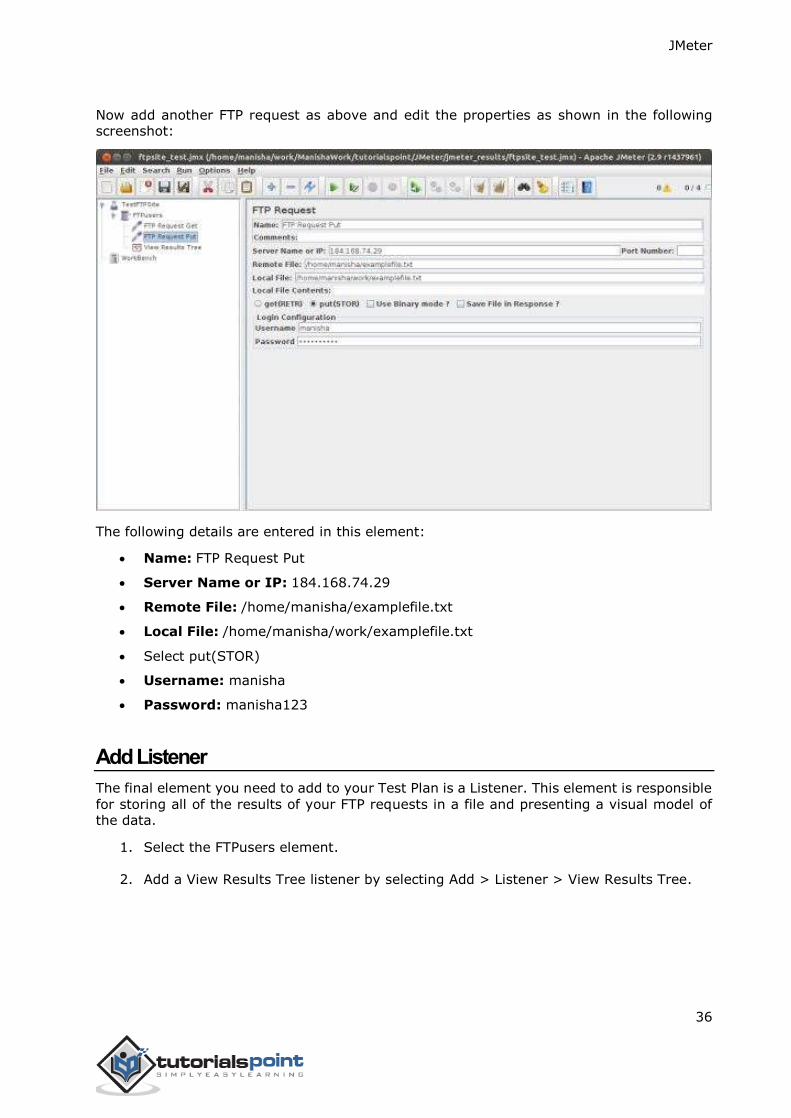
Now add another FTP request as above and edit the properties as shown in the following screenshot:
The following details are entered in this element:
Name: FTP Request Put
Server Name or IP: 184.168.74.29
Remote File: /home/manisha/examplefile.txt
Local File: /home/manisha/work/examplefile.txt
Select put(STOR)
Username: manisha
Password: manisha123
Add Listener
The final element you need to add to your Test Plan is a Listener. This element is responsible
for storing all of the results of your FTP requests in a file and presenting a visual model of the data.
1. Select the FTPusers element.
2. Add a View Results Tree listener by selecting Add > Listener > View Results Tree.
JMeter
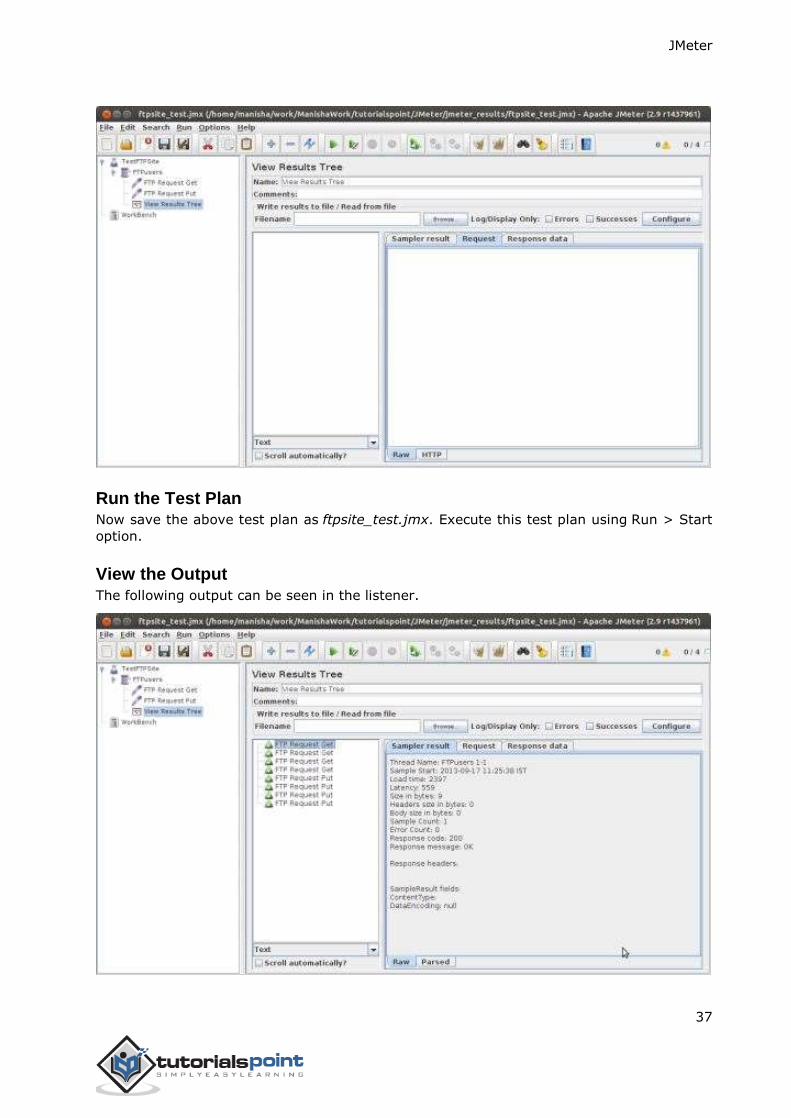
37
Run the Test Plan Now save the above test plan as ftpsite_test.jmx. Execute this test plan using Run > Start
option.
View the Output
The following output can be seen in the listener.
JMeter
38
JMeter
39
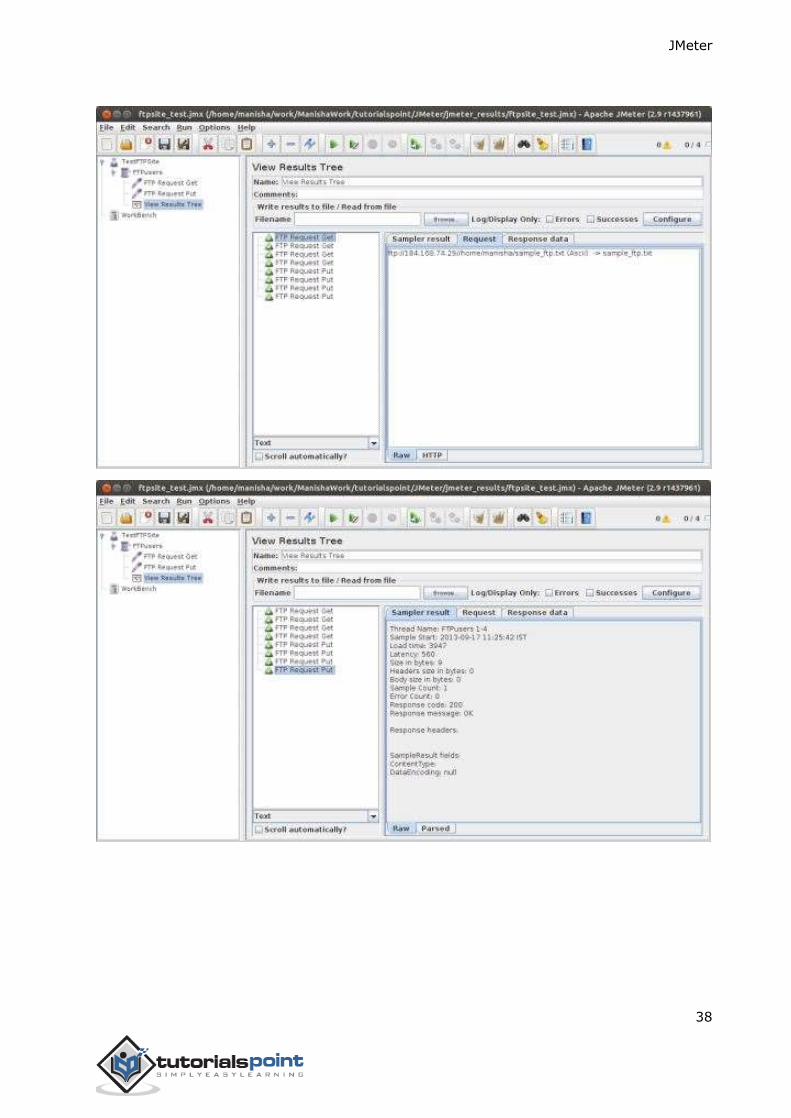
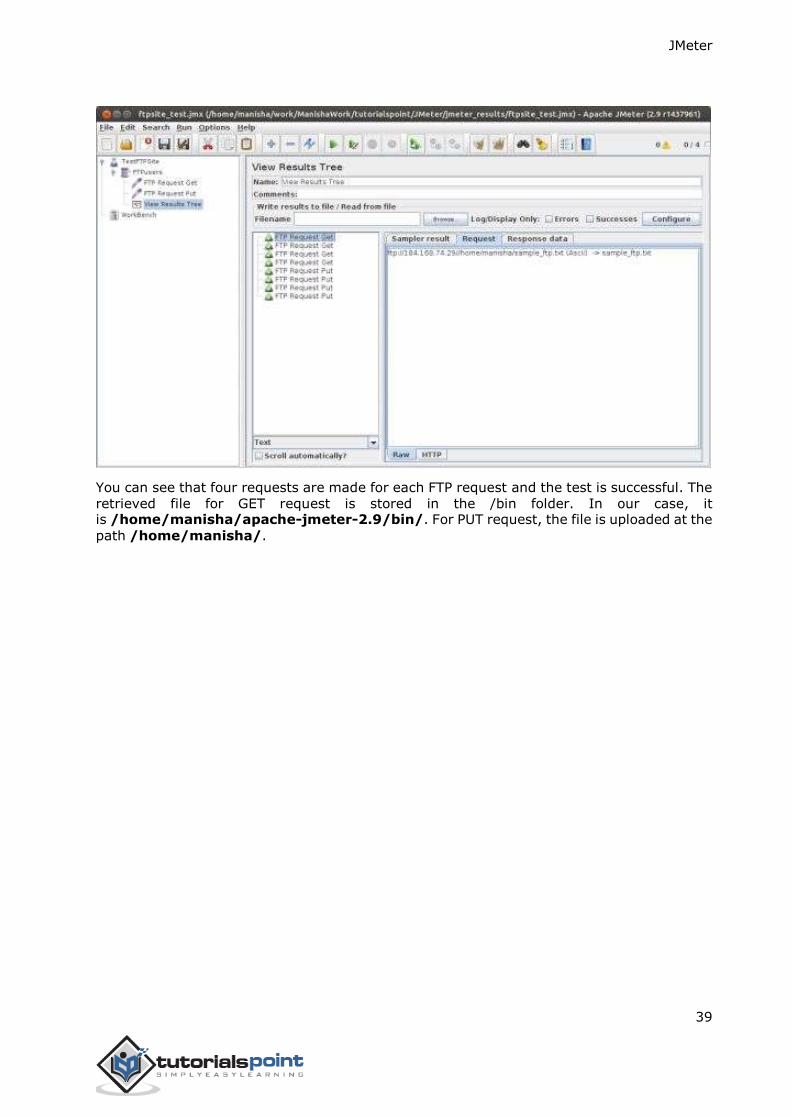
You can see that four requests are made for each FTP request and the test is successful. The
retrieved file for GET request is stored in the /bin folder. In our case, it is /home/manisha/apache-jmeter-2.9/bin/. For PUT request, the file is uploaded at the
path /home/manisha/.
JMeter
40
In this chapter, we will learn how to create a Test Plan to test a WebService. For our test
purpose, we have created a simple webservice project and deployed it on the Tomcat server
locally.
Create Webservice Project
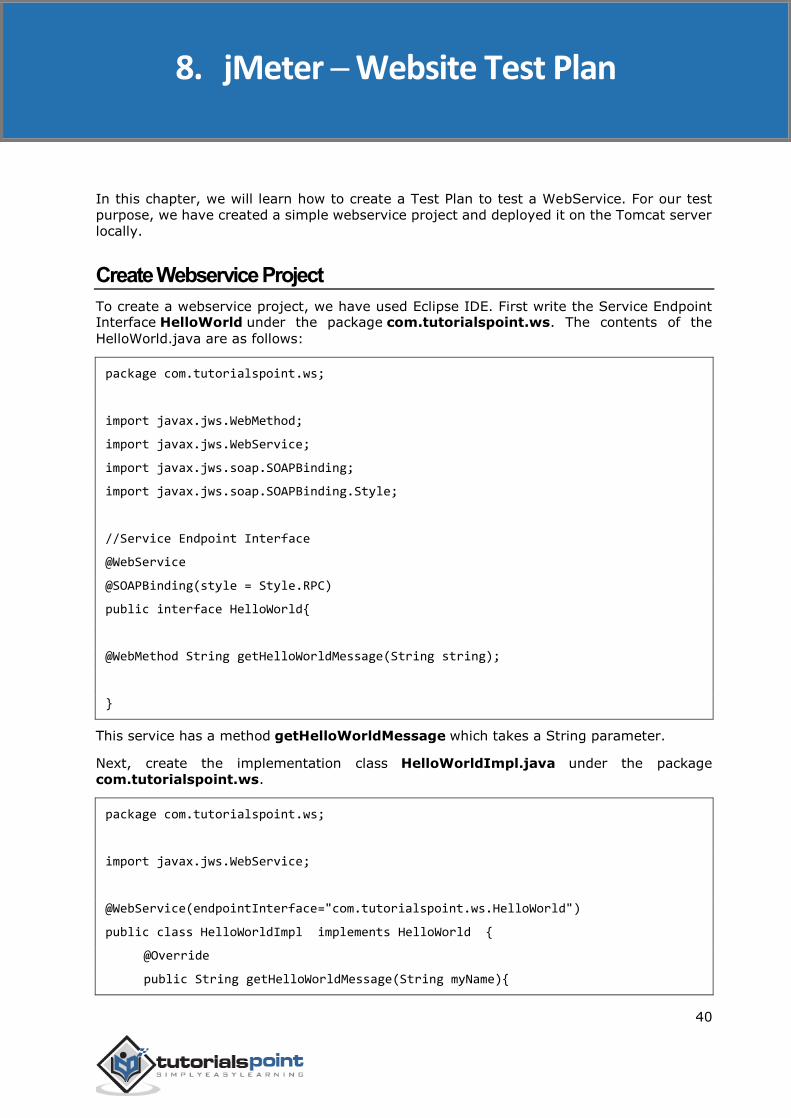
To create a webservice project, we have used Eclipse IDE. First write the Service Endpoint Interface HelloWorld under the package com.tutorialspoint.ws. The contents of the
HelloWorld.java are as follows:
package com.tutorialspoint.ws;
import javax.jws.WebMethod;
import javax.jws.WebService;
import javax.jws.soap.SOAPBinding;
import javax.jws.soap.SOAPBinding.Style;
//Service Endpoint Interface
@WebService
@SOAPBinding(style = Style.RPC)
public interface HelloWorld{
@WebMethod String getHelloWorldMessage(String string);
}
This service has a method getHelloWorldMessage which takes a String parameter.
Next, create the implementation class HelloWorldImpl.java under the package
com.tutorialspoint.ws.
package com.tutorialspoint.ws;
import javax.jws.WebService;
@WebService(endpointInterface="com.tutorialspoint.ws.HelloWorld")
public class HelloWorldImpl implements HelloWorld {
@Override
public String getHelloWorldMessage(String myName){
8. jMeter ─ Website Test Plan
JMeter
41
return("Hello "+myName+" to JAX WS world");
}
}
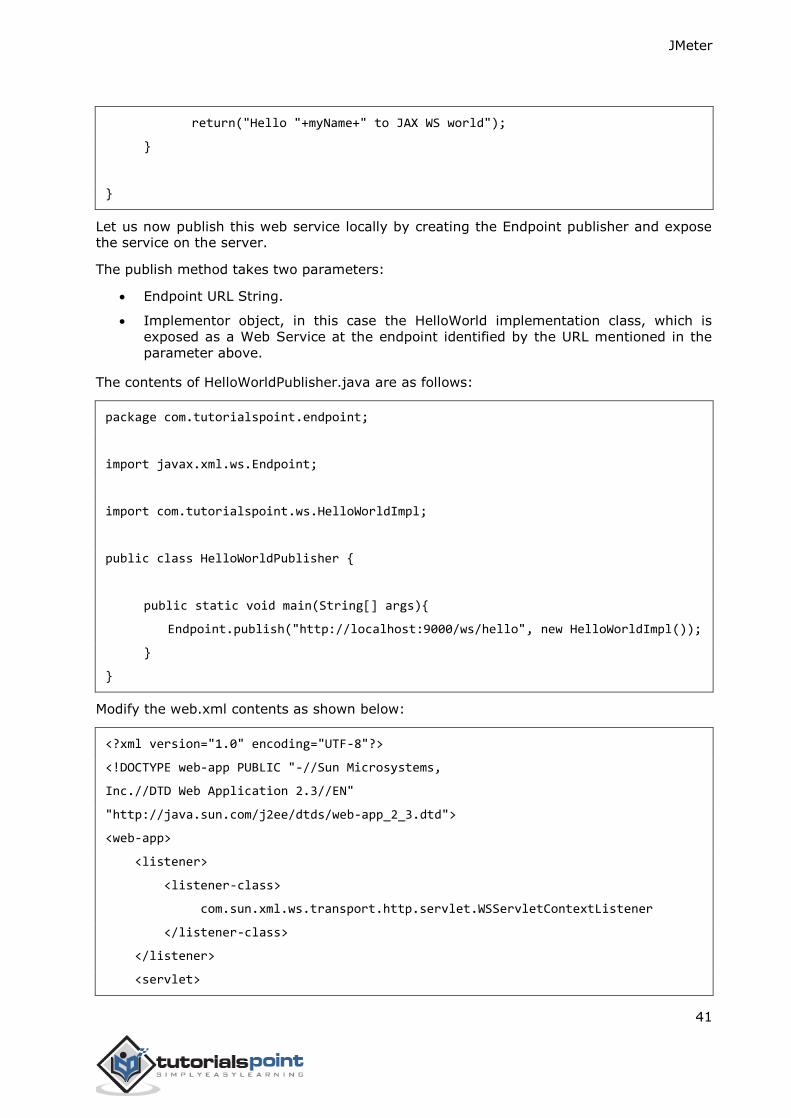
Let us now publish this web service locally by creating the Endpoint publisher and expose the service on the server.
The publish method takes two parameters:
Endpoint URL String.
Implementor object, in this case the HelloWorld implementation class, which is
exposed as a Web Service at the endpoint identified by the URL mentioned in the
parameter above.
The contents of HelloWorldPublisher.java are as follows:
package com.tutorialspoint.endpoint;
import javax.xml.ws.Endpoint;
import com.tutorialspoint.ws.HelloWorldImpl;
public class HelloWorldPublisher {
public static void main(String[] args){
Endpoint.publish("http://localhost:9000/ws/hello", new HelloWorldImpl());
}
}
Modify the web.xml contents as shown below:
<?xml version="1.0" encoding="UTF-8"?>
<!DOCTYPE web-app PUBLIC "-//Sun Microsystems,
Inc.//DTD Web Application 2.3//EN"
"http://java.sun.com/j2ee/dtds/web-app_2_3.dtd">
<web-app>
<listener>
<listener-class>
com.sun.xml.ws.transport.http.servlet.WSServletContextListener
</listener-class>
</listener>
<servlet>
JMeter
42
<servlet-name>hello</servlet-name>
<servlet-class>
com.sun.xml.ws.transport.http.servlet.WSServlet
</servlet-class>
<load-on-startup>1</load-on-startup>
</servlet>
<servlet-mapping>
<servlet-name>hello</servlet-name>
<url-pattern>/hello</url-pattern>
</servlet-mapping>
<session-config>
<session-timeout>120</session-timeout>
</session-config>
</web-app>
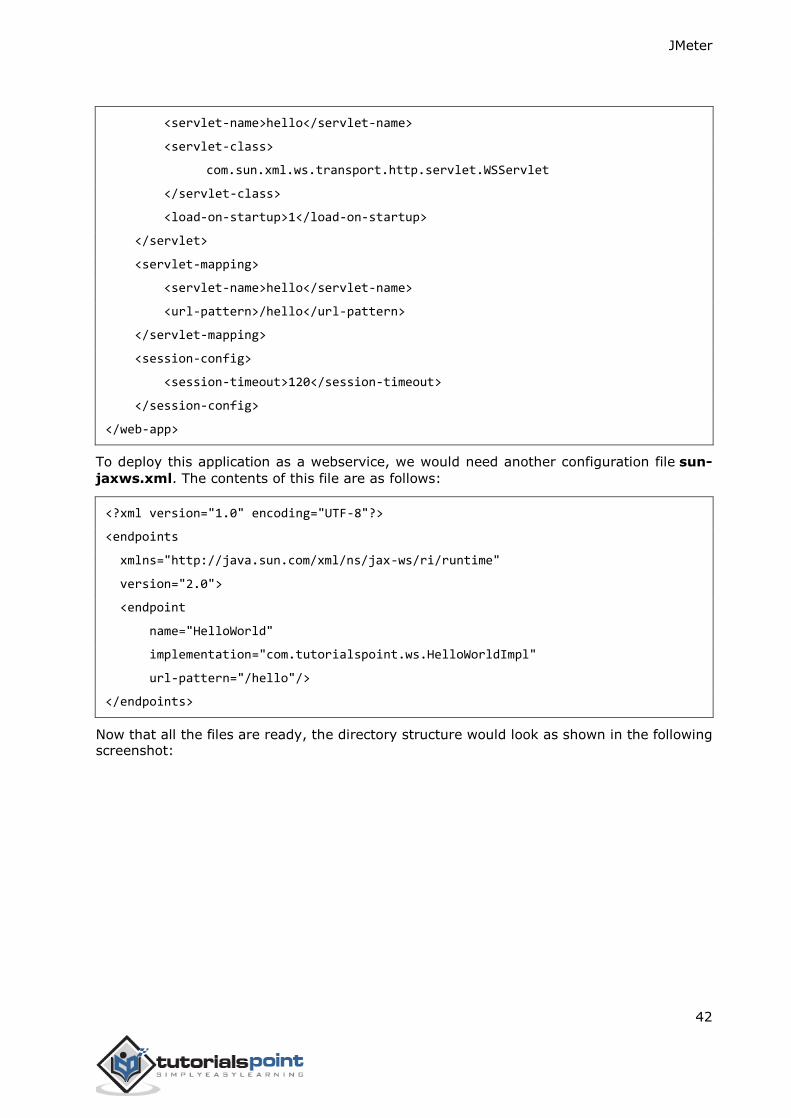
To deploy this application as a webservice, we would need another configuration file sun-
jaxws.xml. The contents of this file are as follows:
<?xml version="1.0" encoding="UTF-8"?>
<endpoints
xmlns="http://java.sun.com/xml/ns/jax-ws/ri/runtime"
version="2.0">
<endpoint
name="HelloWorld"
implementation="com.tutorialspoint.ws.HelloWorldImpl"
url-pattern="/hello"/>
</endpoints>
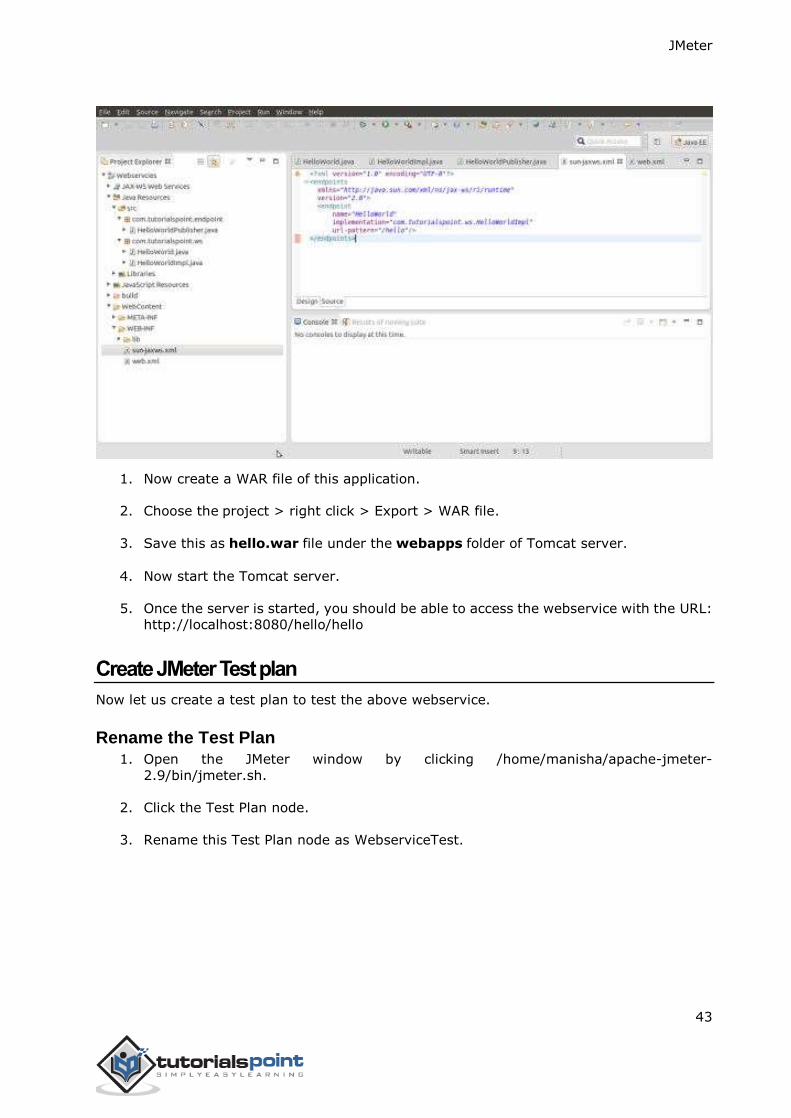
Now that all the files are ready, the directory structure would look as shown in the following screenshot:
JMeter
43
1. Now create a WAR file of this application.
2. Choose the project > right click > Export > WAR file.
3. Save this as hello.war file under the webapps folder of Tomcat server.
4. Now start the Tomcat server.
5. Once the server is started, you should be able to access the webservice with the URL:
http://localhost:8080/hello/hello
Create JMeter Test plan
Now let us create a test plan to test the above webservice.
Rename the Test Plan
1. Open the JMeter window by clicking /home/manisha/apache-jmeter-
2.9/bin/jmeter.sh.
2. Click the Test Plan node.
3. Rename this Test Plan node as WebserviceTest.
JMeter
44
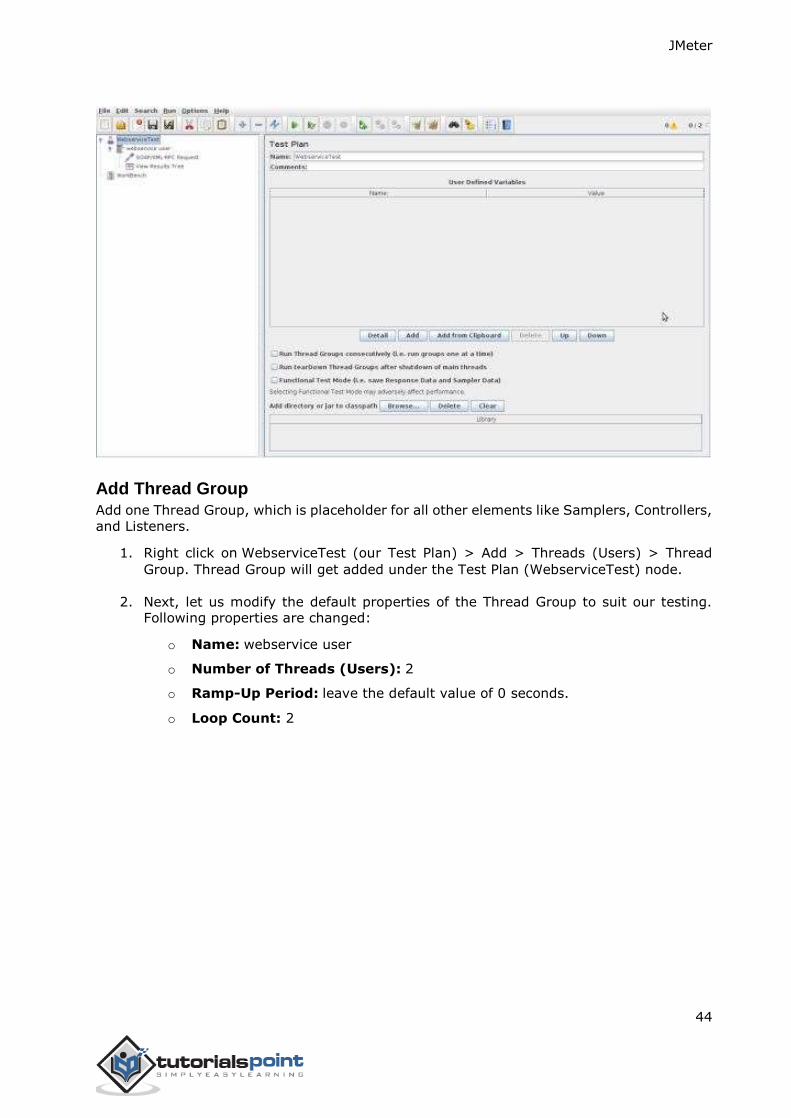
Add Thread Group
Add one Thread Group, which is placeholder for all other elements like Samplers, Controllers,
and Listeners.
1. Right click on WebserviceTest (our Test Plan) > Add > Threads (Users) > Thread
Group. Thread Group will get added under the Test Plan (WebserviceTest) node.
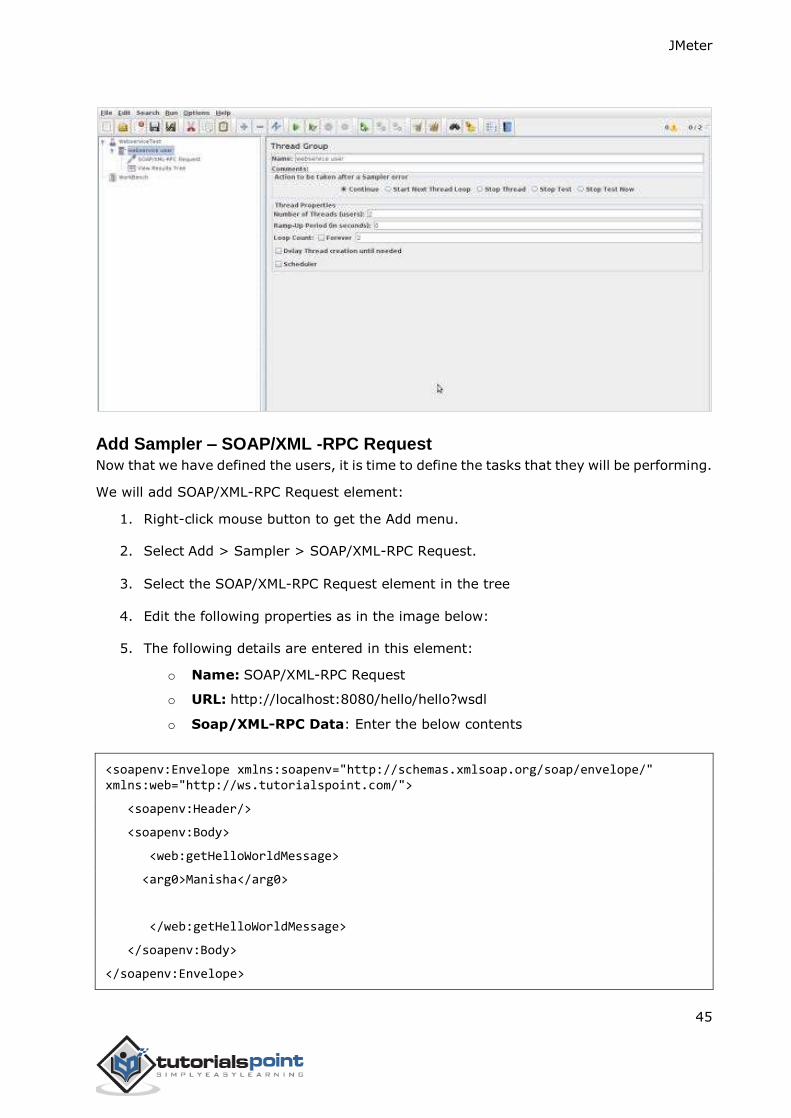
2. Next, let us modify the default properties of the Thread Group to suit our testing. Following properties are changed:
o Name: webservice user
o Number of Threads (Users): 2
o Ramp-Up Period: leave the default value of 0 seconds.
o Loop Count: 2
JMeter
45
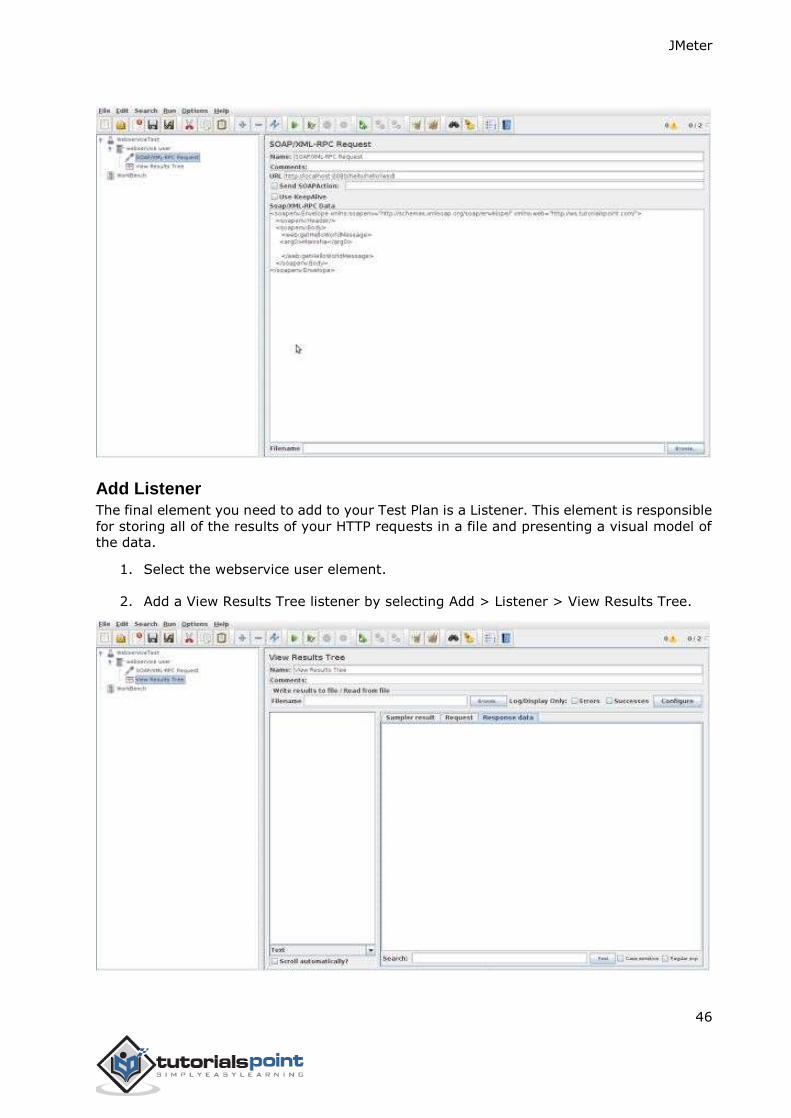
Add Sampler – SOAP/XML -RPC Request
Now that we have defined the users, it is time to define the tasks that they will be performing.
We will add SOAP/XML-RPC Request element:
1. Right-click mouse button to get the Add menu.
2. Select Add > Sampler > SOAP/XML-RPC Request.
3. Select the SOAP/XML-RPC Request element in the tree
4. Edit the following properties as in the image below:
5. The following details are entered in this element:
o Name: SOAP/XML-RPC Request
o URL: http://localhost:8080/hello/hello?wsdl
o Soap/XML-RPC Data: Enter the below contents
<soapenv:Envelope xmlns:soapenv="http://schemas.xmlsoap.org/soap/envelope/" xmlns:web="http://ws.tutorialspoint.com/">
<soapenv:Header/>
<soapenv:Body>
<web:getHelloWorldMessage>
<arg0>Manisha</arg0>
</web:getHelloWorldMessage>
</soapenv:Body>
</soapenv:Envelope>
JMeter
46
Add Listener
The final element you need to add to your Test Plan is a Listener. This element is responsible
for storing all of the results of your HTTP requests in a file and presenting a visual model of the data.
1. Select the webservice user element.
2. Add a View Results Tree listener by selecting Add > Listener > View Results Tree.
JMeter
47
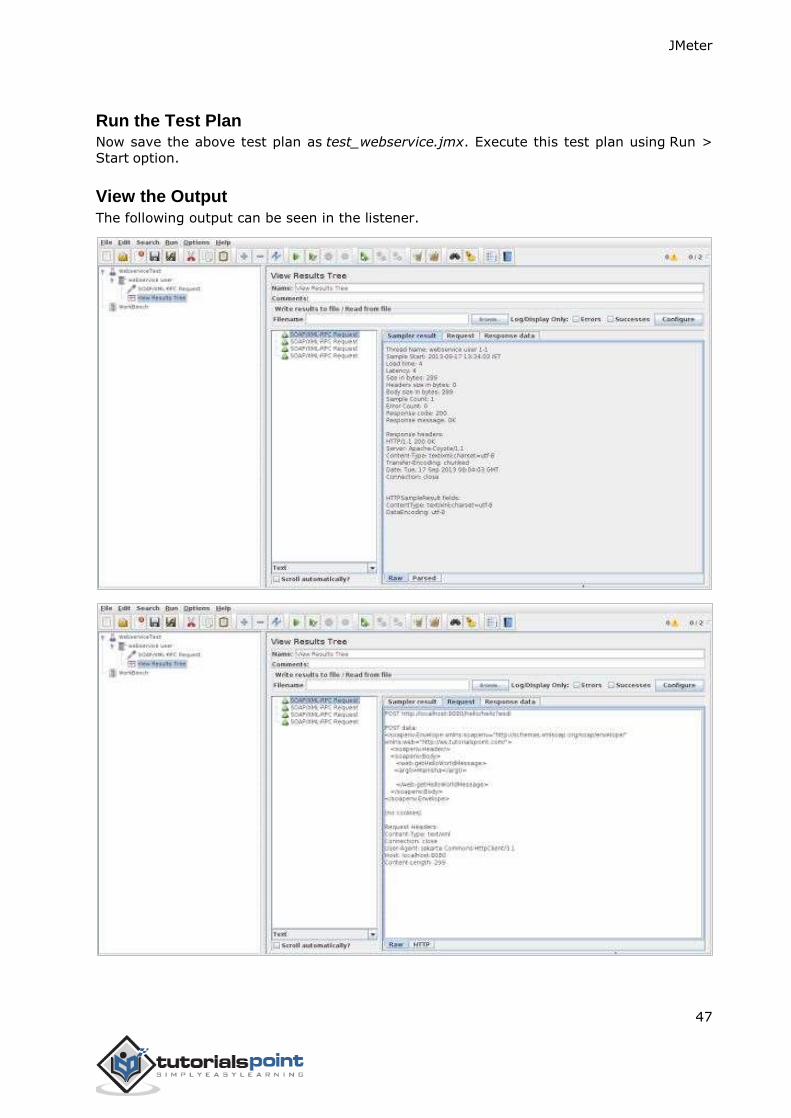
Run the Test Plan Now save the above test plan as test_webservice.jmx. Execute this test plan using Run >
Start option.
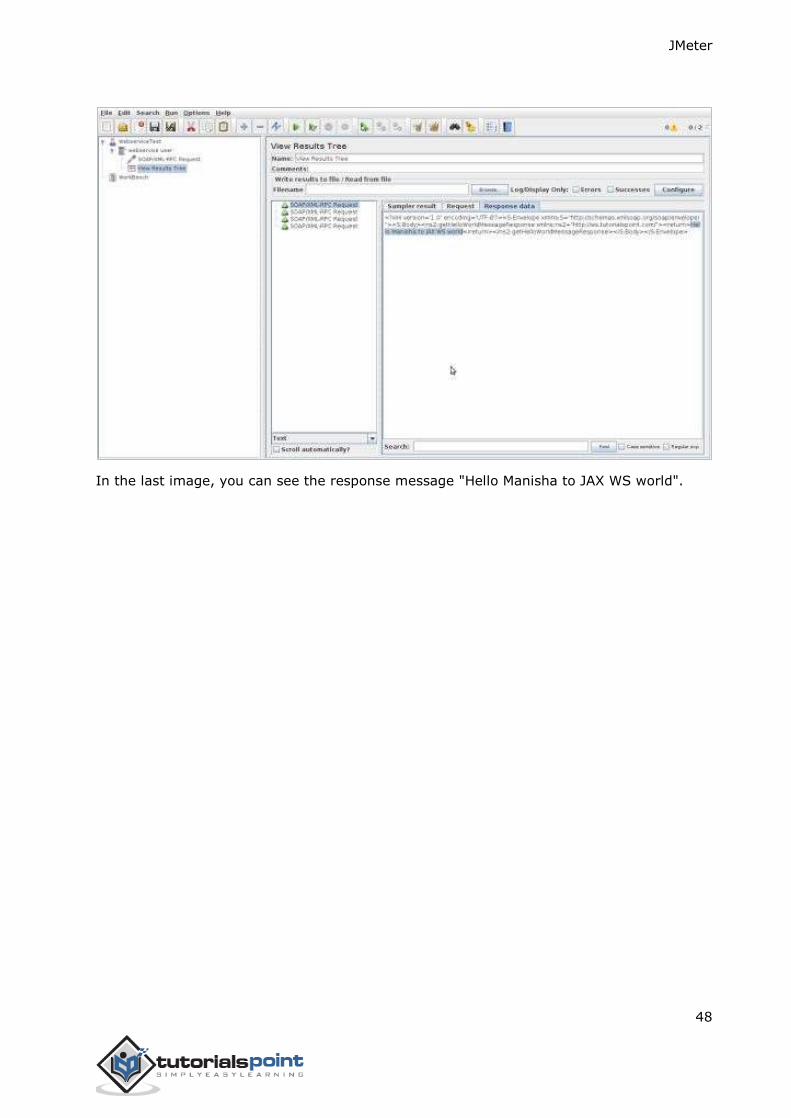
View the Output
The following output can be seen in the listener.
JMeter
48
In the last image, you can see the response message "Hello Manisha to JAX WS world".
JMeter
49
In this chapter, we will learn how to write a simple test plan to test Java Messaging Service (JMS). JMS supports two types of messaging:
Point-to-Point messaging: Queue messaging is generally used for transactions
where the sender expects a response. Messaging systems are quite different from
normal HTTP requests. In HTTP, a single user sends a request and gets a response.
Topic messaging: Topic messages are commonly known as pub/sub messaging.
Topic messaging is generally used in cases where a message is published by a
producer and consumed by multiple subscribers.
Let us see a test example for each of these. The pre-requisites for testing JMS are:
We use Apache ActiveMQ in the example. There are various JMS servers like IBM WebSphere MQ (formerly MQSeries), Tibco, etc. Download it from the binaries from the Apache ActiveMQ website.
Unzip the archive, go to the decompressed directory, and run the following command
from the command console to start the ActiveMQ server:
.\bin\activemq start
You can verify if the ActiveMQ server has started by visiting the admin interface at the
following address http://localhost:8161/admin/. If it asks for authentication, then enter the userid and password as admin. The screen is similar as shown below:
Now copy the activemq-all-x.x.x.jar (XXX depending on the version) from the ActiveMQ unzipped directory to /home/manisha/apache-jmeter-2.9/lib.
9. jMeter ─ JMS Test Plan
JMeter
50
With the above setup, let us build the test plan for:
JMS Point-to-Point Test Plan
JMS Topic Test Plan
Building a JMS Point-to-Point Test Plan
Now let us write a JMeter test plan to test a JMS Point-to-Point messaging solution. The setup
of the test is one threadgroup with one thread or user sending 2 messages each through a request queue.
Let us start the JMeter from /home/manisha/apache-jmeter-2.9/bin/jmeter.sh.
Add Users
1. Create a Thread group.
2. Right-click the Test Plan node.
3. Select Add > Threads (Users) > Thread Group. Thread Group gets added under the
Test Plan node.
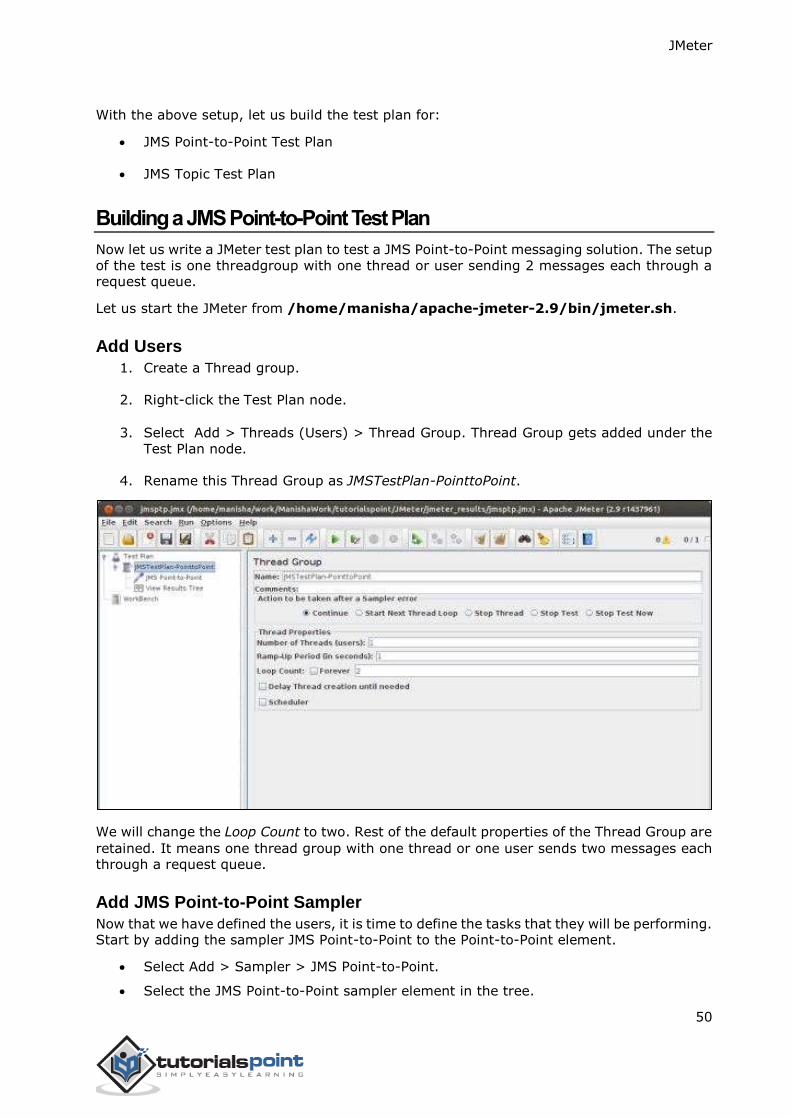
4. Rename this Thread Group as JMSTestPlan-PointtoPoint.
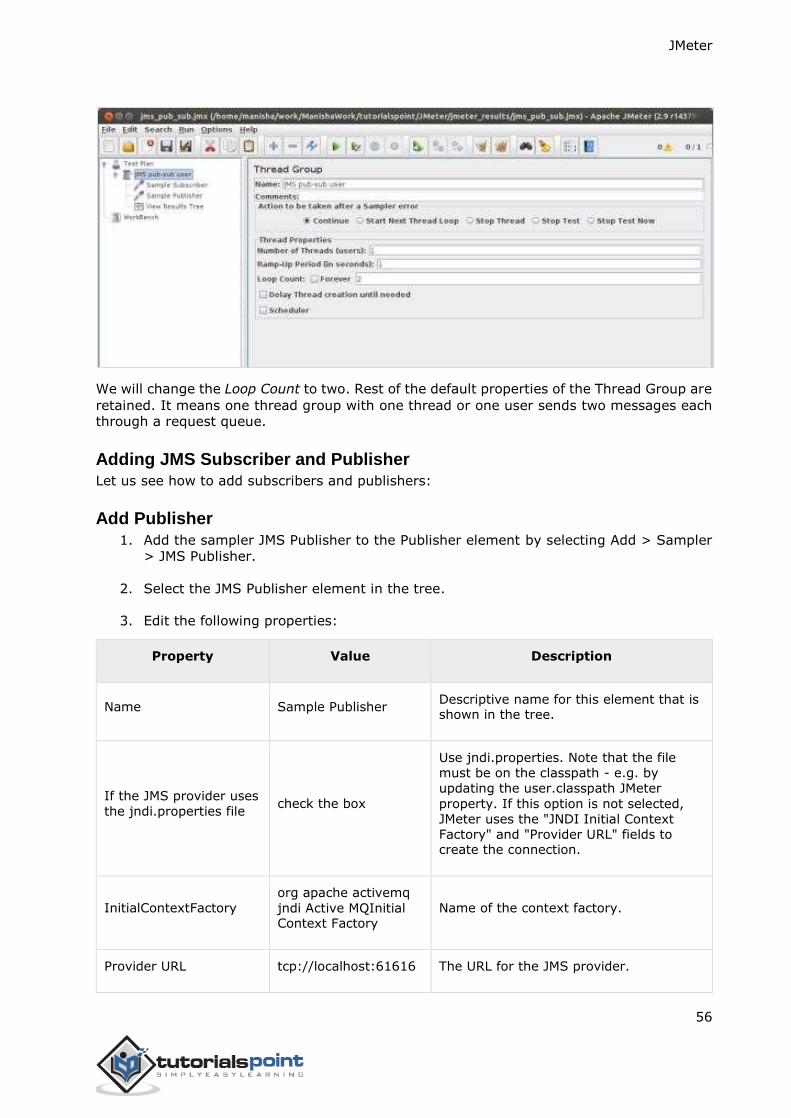
We will change the Loop Count to two. Rest of the default properties of the Thread Group are
retained. It means one thread group with one thread or one user sends two messages each through a request queue.
Add JMS Point-to-Point Sampler
Now that we have defined the users, it is time to define the tasks that they will be performing. Start by adding the sampler JMS Point-to-Point to the Point-to-Point element.
Select Add > Sampler > JMS Point-to-Point.
Select the JMS Point-to-Point sampler element in the tree.
JMeter
51
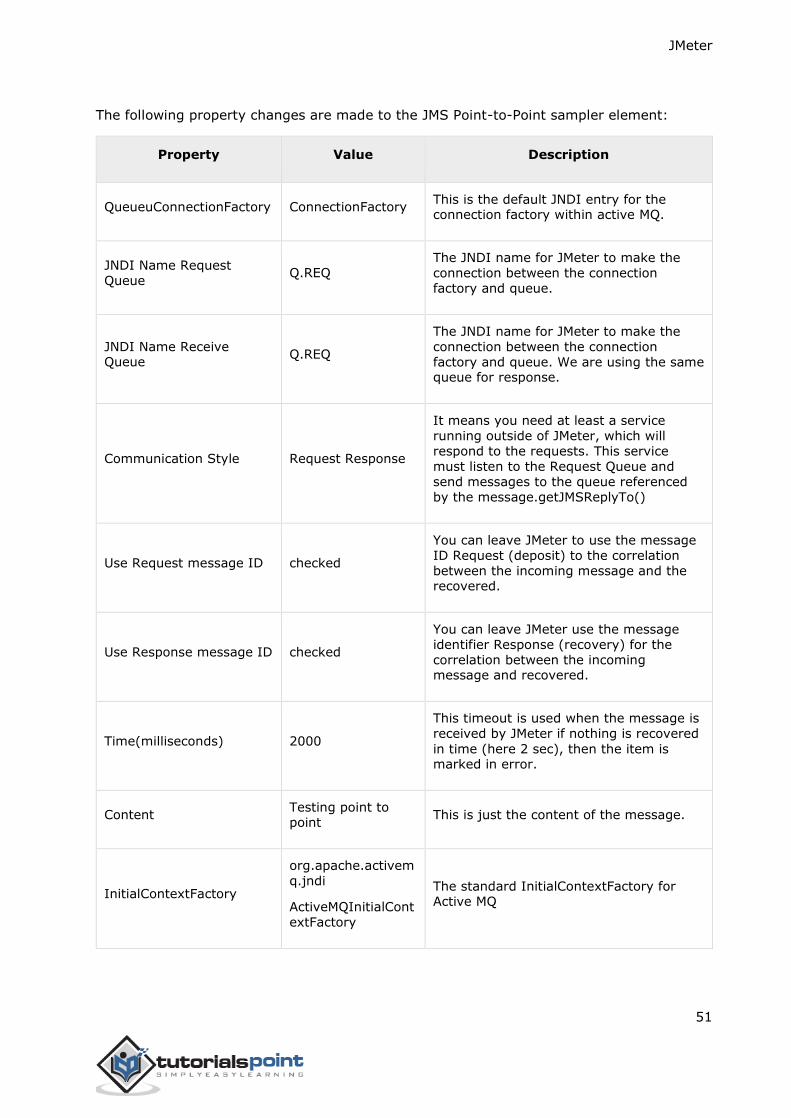
The following property changes are made to the JMS Point-to-Point sampler element:
Property Value Description
QueueuConnectionFactory ConnectionFactory This is the default JNDI entry for the connection factory within active MQ.
JNDI Name Request
Queue Q.REQ
The JNDI name for JMeter to make the
connection between the connection
factory and queue.
JNDI Name Receive Queue
Q.REQ
The JNDI name for JMeter to make the
connection between the connection
factory and queue. We are using the same queue for response.
Communication Style Request Response
It means you need at least a service
running outside of JMeter, which will
respond to the requests. This service
must listen to the Request Queue and
send messages to the queue referenced
by the message.getJMSReplyTo()
Use Request message ID checked
You can leave JMeter to use the message
ID Request (deposit) to the correlation
between the incoming message and the recovered.
Use Response message ID checked
You can leave JMeter use the message
identifier Response (recovery) for the
correlation between the incoming message and recovered.
Time(milliseconds) 2000
This timeout is used when the message is
received by JMeter if nothing is recovered
in time (here 2 sec), then the item is marked in error.
Content Testing point to point
This is just the content of the message.
InitialContextFactory
org.apache.activem
q.jndi
ActiveMQInitialCont
extFactory
The standard InitialContextFactory for Active MQ
JMeter
52
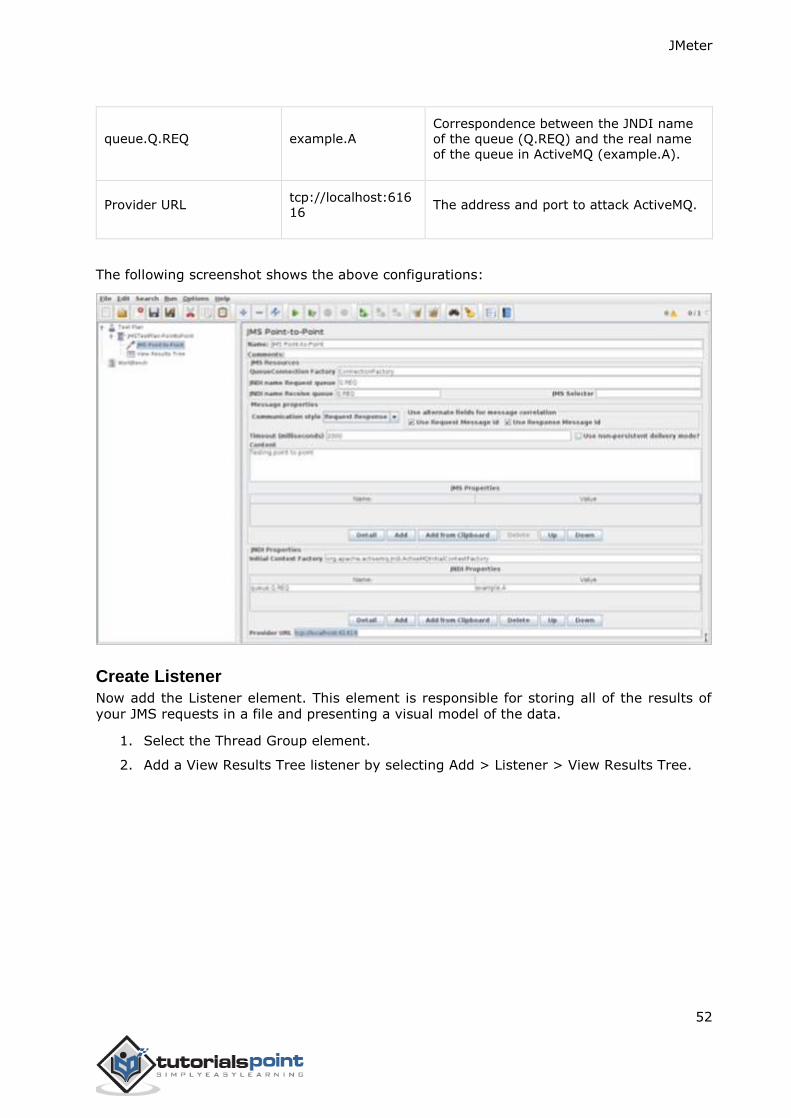
queue.Q.REQ example.A Correspondence between the JNDI name
of the queue (Q.REQ) and the real name
of the queue in ActiveMQ (example.A).
Provider URL tcp://localhost:61616
The address and port to attack ActiveMQ.
The following screenshot shows the above configurations:
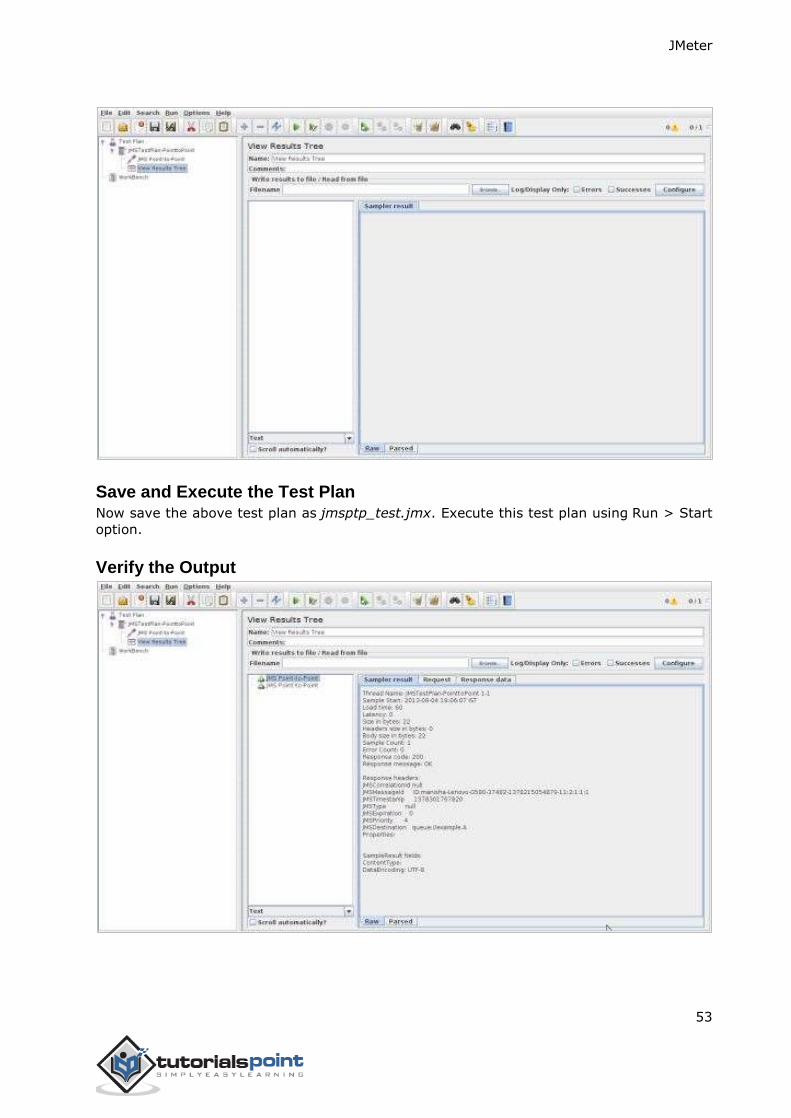
Create Listener
Now add the Listener element. This element is responsible for storing all of the results of your JMS requests in a file and presenting a visual model of the data.
1. Select the Thread Group element.
2. Add a View Results Tree listener by selecting Add > Listener > View Results Tree.
JMeter
53
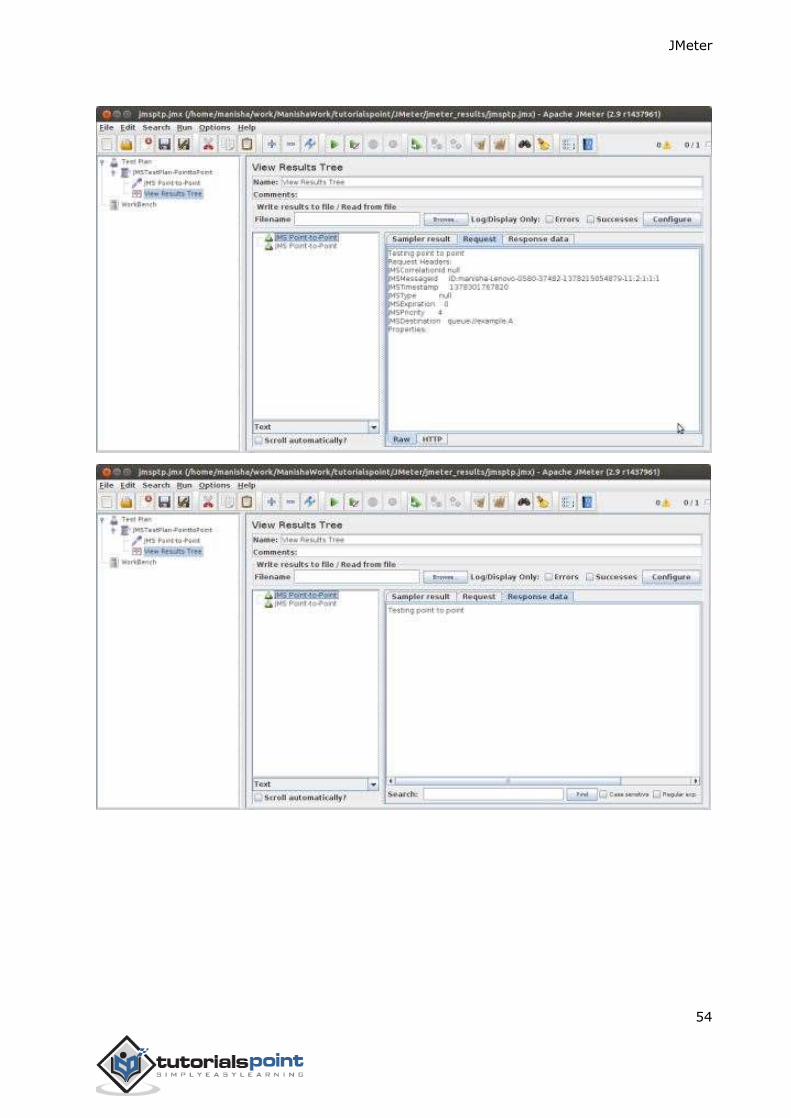
Save and Execute the Test Plan Now save the above test plan as jmsptp_test.jmx. Execute this test plan using Run > Start
option.
Verify the Output
JMeter
54
JMeter
55
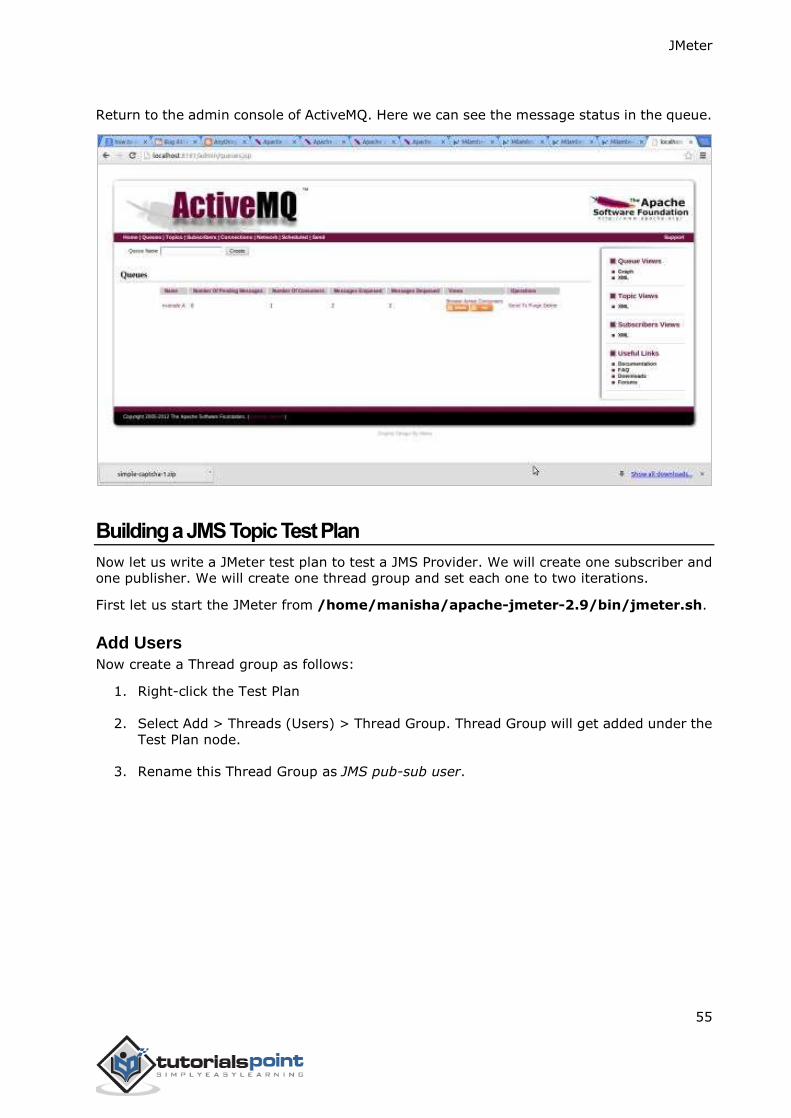
Return to the admin console of ActiveMQ. Here we can see the message status in the queue.
Building a JMS Topic Test Plan
Now let us write a JMeter test plan to test a JMS Provider. We will create one subscriber and one publisher. We will create one thread group and set each one to two iterations.
First let us start the JMeter from /home/manisha/apache-jmeter-2.9/bin/jmeter.sh.
Add Users
Now create a Thread group as follows:
1. Right-click the Test Plan
2. Select Add > Threads (Users) > Thread Group. Thread Group will get added under the
Test Plan node.
3. Rename this Thread Group as JMS pub-sub user.
JMeter
56
We will change the Loop Count to two. Rest of the default properties of the Thread Group are
retained. It means one thread group with one thread or one user sends two messages each through a request queue.
Adding JMS Subscriber and Publisher
Let us see how to add subscribers and publishers:
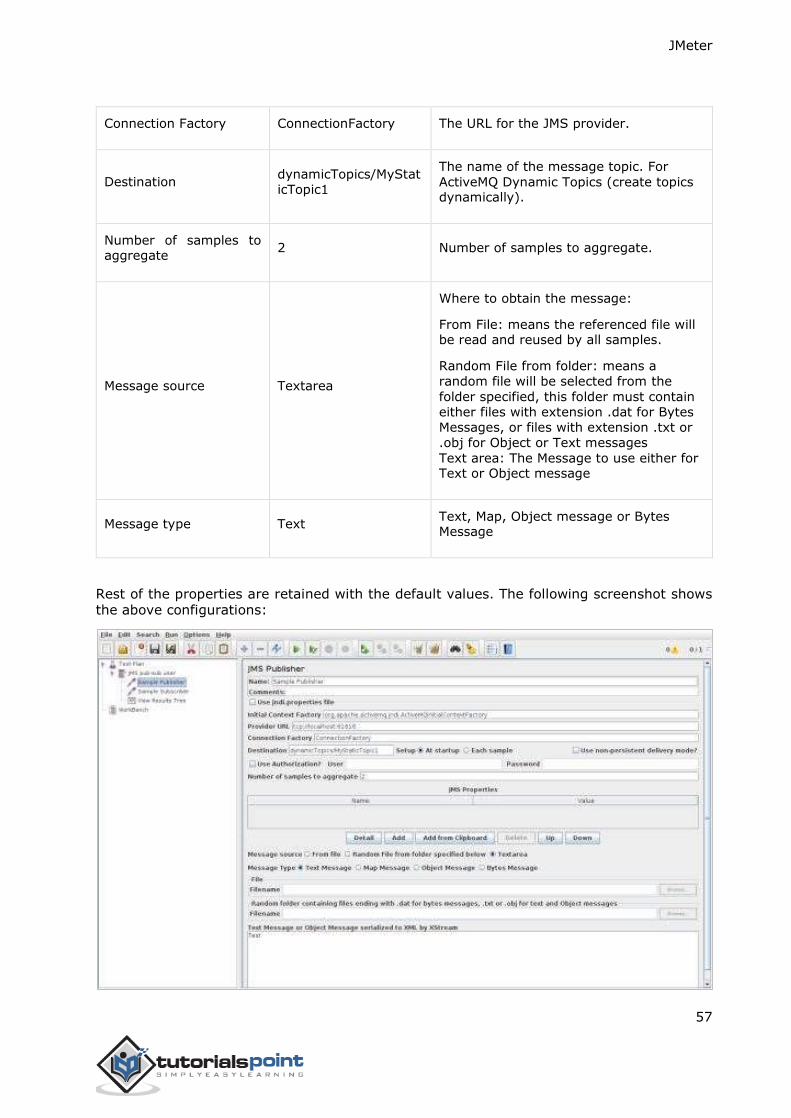
Add Publisher
1. Add the sampler JMS Publisher to the Publisher element by selecting Add > Sampler
> JMS Publisher.
2. Select the JMS Publisher element in the tree.
3. Edit the following properties:
Property Value Description
Name Sample Publisher Descriptive name for this element that is shown in the tree.
If the JMS provider uses
the jndi.properties file check the box
Use jndi.properties. Note that the file
must be on the classpath - e.g. by
updating the user.classpath JMeter
property. If this option is not selected,
JMeter uses the "JNDI Initial Context
Factory" and "Provider URL" fields to create the connection.
InitialContextFactory
org apache activemq
jndi Active MQInitial Context Factory
Name of the context factory.
Provider URL tcp://localhost:61616 The URL for the JMS provider.
JMeter
57
Connection Factory ConnectionFactory The URL for the JMS provider.
Destination dynamicTopics/MyStat
icTopic1
The name of the message topic. For
ActiveMQ Dynamic Topics (create topics dynamically).
Number of samples to aggregate
2 Number of samples to aggregate.
Message source Textarea
Where to obtain the message:
From File: means the referenced file will be read and reused by all samples.
Random File from folder: means a
random file will be selected from the
folder specified, this folder must contain
either files with extension .dat for Bytes
Messages, or files with extension .txt or
.obj for Object or Text messages
Text area: The Message to use either for Text or Object message
Message type Text Text, Map, Object message or Bytes Message
Rest of the properties are retained with the default values. The following screenshot shows the above configurations:
JMeter
58
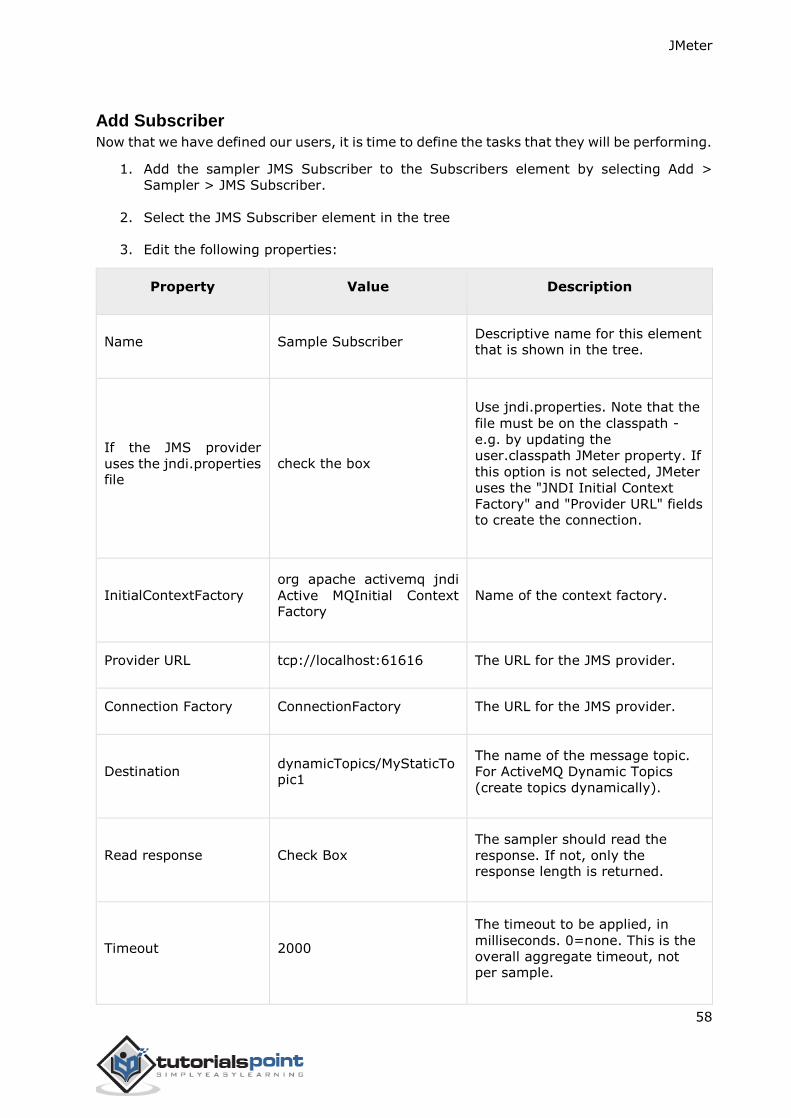
Add Subscriber
Now that we have defined our users, it is time to define the tasks that they will be performing.
1. Add the sampler JMS Subscriber to the Subscribers element by selecting Add >
Sampler > JMS Subscriber.
2. Select the JMS Subscriber element in the tree
3. Edit the following properties:
Property Value Description
Name Sample Subscriber Descriptive name for this element that is shown in the tree.
If the JMS provider
uses the jndi.properties file
check the box
Use jndi.properties. Note that the
file must be on the classpath -
e.g. by updating the
user.classpath JMeter property. If
this option is not selected, JMeter
uses the "JNDI Initial Context
Factory" and "Provider URL" fields to create the connection.
InitialContextFactory
org apache activemq jndi
Active MQInitial Context Factory
Name of the context factory.
Provider URL tcp://localhost:61616 The URL for the JMS provider.
Connection Factory ConnectionFactory The URL for the JMS provider.
Destination dynamicTopics/MyStaticTopic1
The name of the message topic.
For ActiveMQ Dynamic Topics
(create topics dynamically).
Read response Check Box The sampler should read the
response. If not, only the response length is returned.
Timeout 2000
The timeout to be applied, in
milliseconds. 0=none. This is the
overall aggregate timeout, not per sample.
JMeter
59
Rest of the properties are retained with the default values. The following screenshot shows the above configurations:
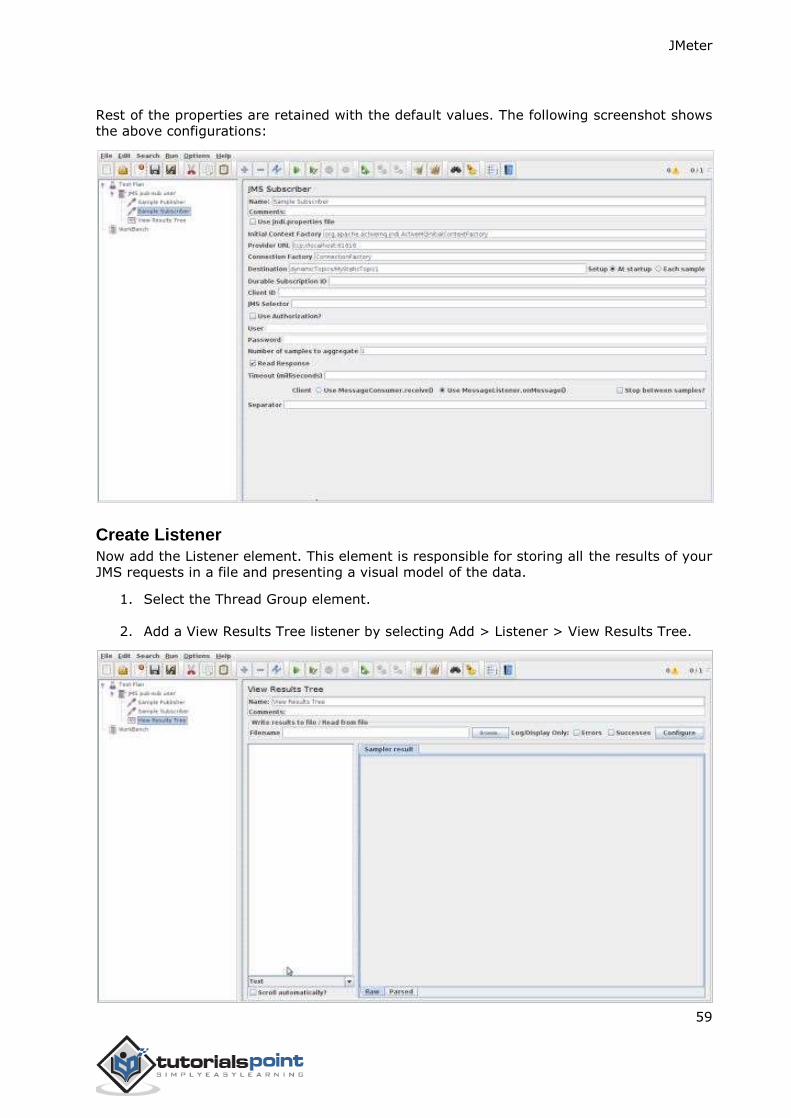
Create Listener
Now add the Listener element. This element is responsible for storing all the results of your JMS requests in a file and presenting a visual model of the data.
1. Select the Thread Group element.
2. Add a View Results Tree listener by selecting Add > Listener > View Results Tree.
JMeter
60
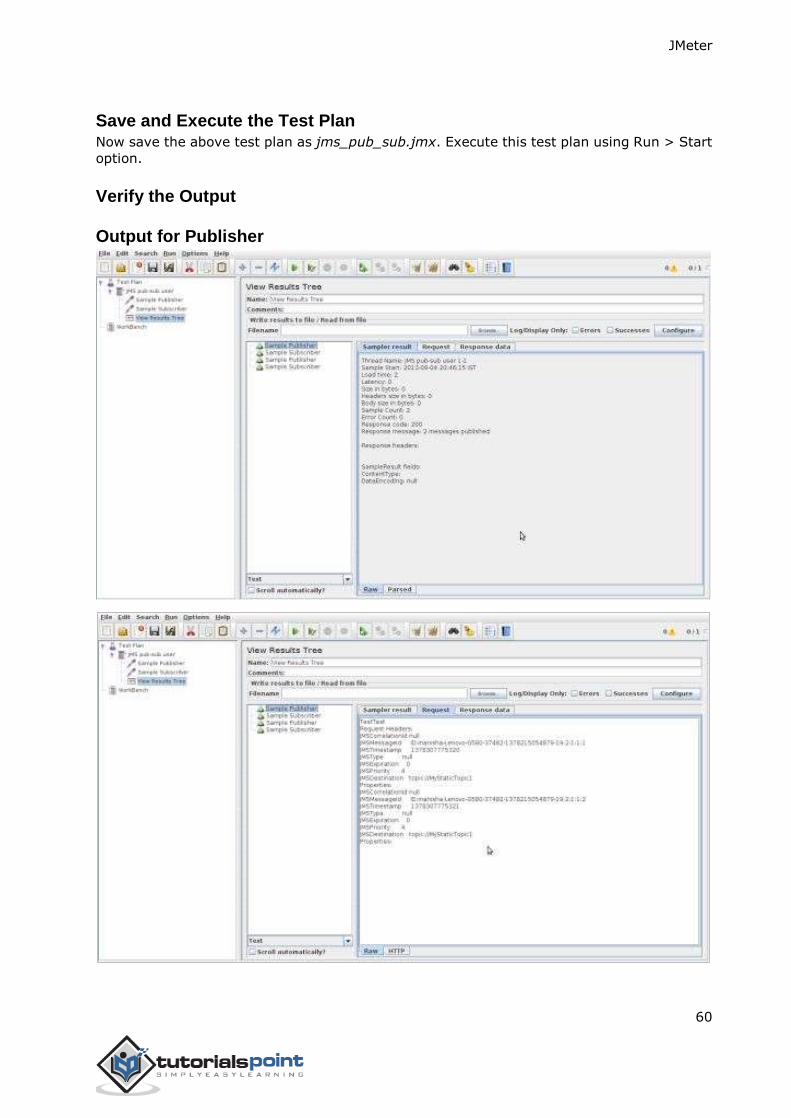
Save and Execute the Test Plan Now save the above test plan as jms_pub_sub.jmx. Execute this test plan using Run > Start
option.
Verify the Output
Output for Publisher
JMeter
61
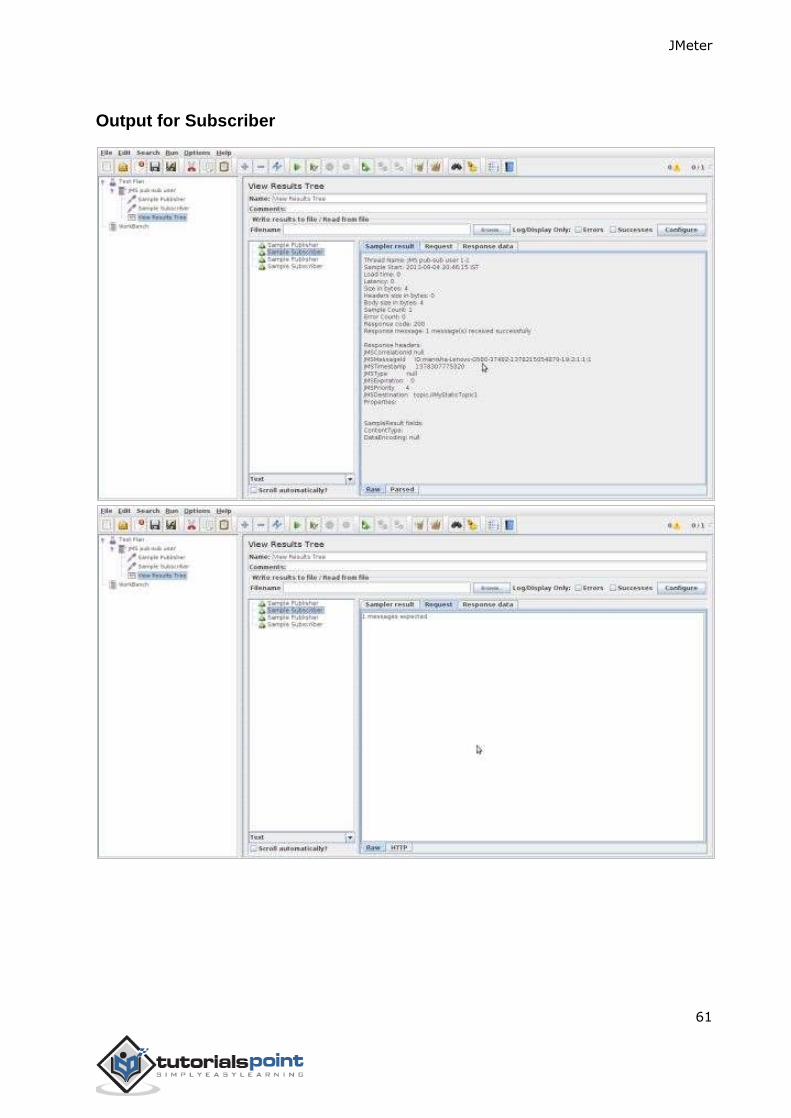
Output for Subscriber
JMeter
62
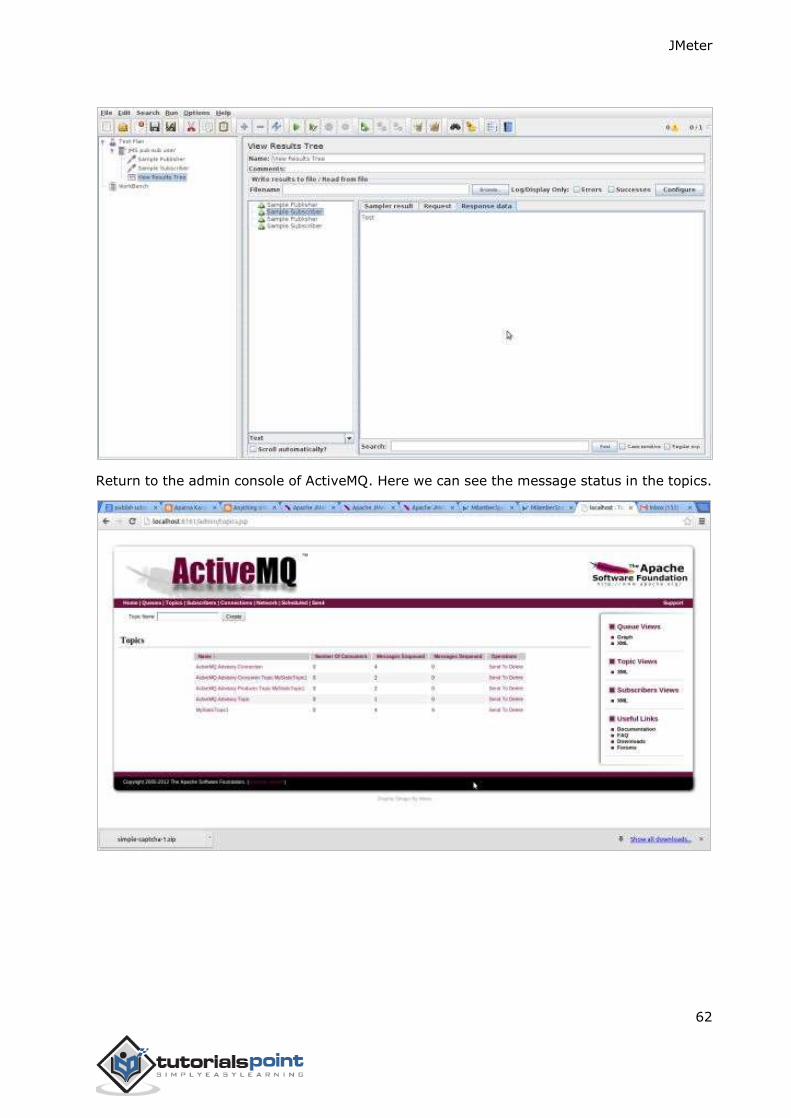
Return to the admin console of ActiveMQ. Here we can see the message status in the topics.
JMeter
63
In this chapter, we will discuss how to create a Test Plan using JMeter to monitor webservers. The uses of monitor tests are as follows:
Monitors are useful for a stress testing and system management.
Used with stress testing, the monitor provides additional information about server
performance.
Monitors make it easier to see the relationship between server performance and
response time on the client side.
As a system administration tool, the monitor provides an easy way to monitor multiple
servers from one console.
We need Tomcat 5 or above for monitoring. For our test purpose, we will monitor Tomcat
7.0.42 server. You can test any servlet container that supports Java Management Extension
(JMX). Let us write a test case to monitor the Tomcat server. Let us first set up our tomcat server.
Setup Tomcat Server
We start with opening the Tomcat service status. To do this, edit the configuration file for users, <TOMCAT_HOME>/conf/tomcat-users.xml. This file contains a tomcat-users
section (commented) as shown:
<tomcat-users>
<!--
<role rolename="tomcat"/>
<role rolename="role1"/>
<user username="tomcat" password="tomcat" roles="tomcat"/>
<user username="both" password="tomcat" roles="tomcat,role1"/>
<user username="role1" password="tomcat" roles="role1"/>
-->
</tomcat-users>
We need to change this section to add the admin roles, manager, manager-gui and assign the user "admin". The revised file is as follows:
<tomcat-users>
<role rolename="manager-gui"/>
<role rolename="manager-script"/>
10. jMeter ─ Monitor Test Plan
JMeter
64
<role rolename="manager-jmx"/>
<role rolename="manager-status"/>
<user username="admin" password="admin" roles="manager-gui,manager-script,manager-jmx,manager-status"/>
</tomcat-users>
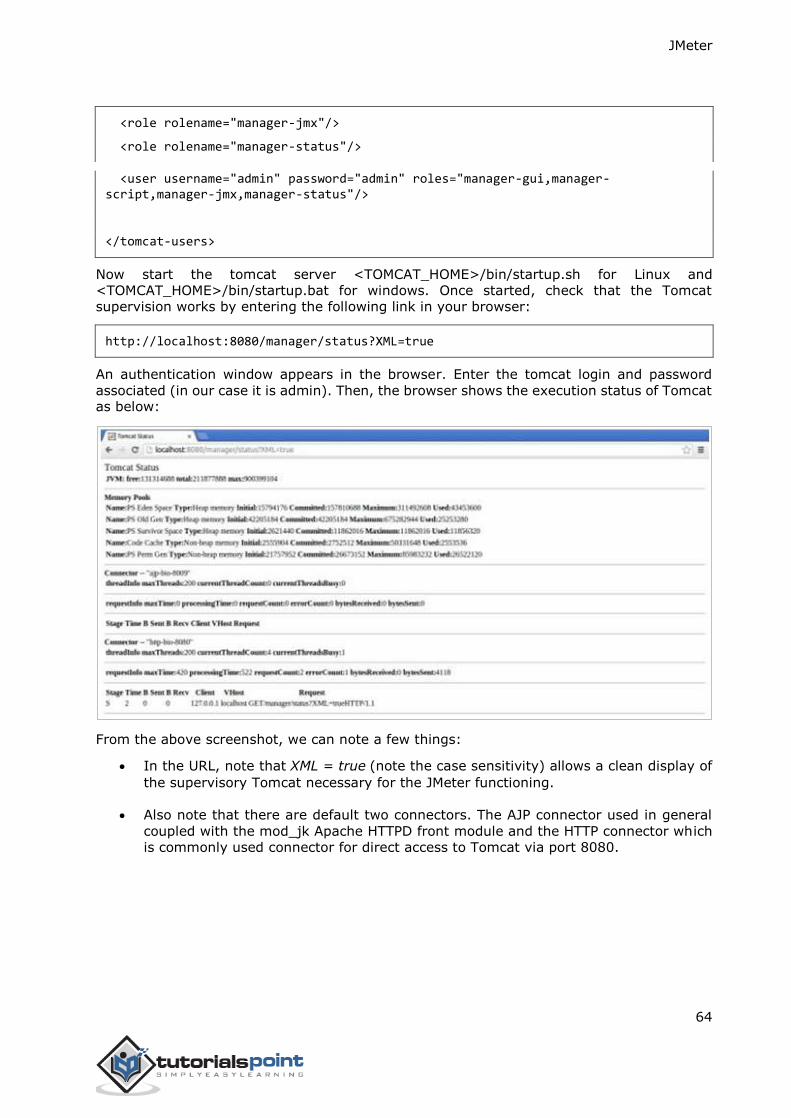
Now start the tomcat server <TOMCAT_HOME>/bin/startup.sh for Linux and
<TOMCAT_HOME>/bin/startup.bat for windows. Once started, check that the Tomcat
supervision works by entering the following link in your browser:
http://localhost:8080/manager/status?XML=true
An authentication window appears in the browser. Enter the tomcat login and password
associated (in our case it is admin). Then, the browser shows the execution status of Tomcat as below:
From the above screenshot, we can note a few things:
In the URL, note that XML = true (note the case sensitivity) allows a clean display of
the supervisory Tomcat necessary for the JMeter functioning.
Also note that there are default two connectors. The AJP connector used in general
coupled with the mod_jk Apache HTTPD front module and the HTTP connector which
is commonly used connector for direct access to Tomcat via port 8080.
JMeter
65
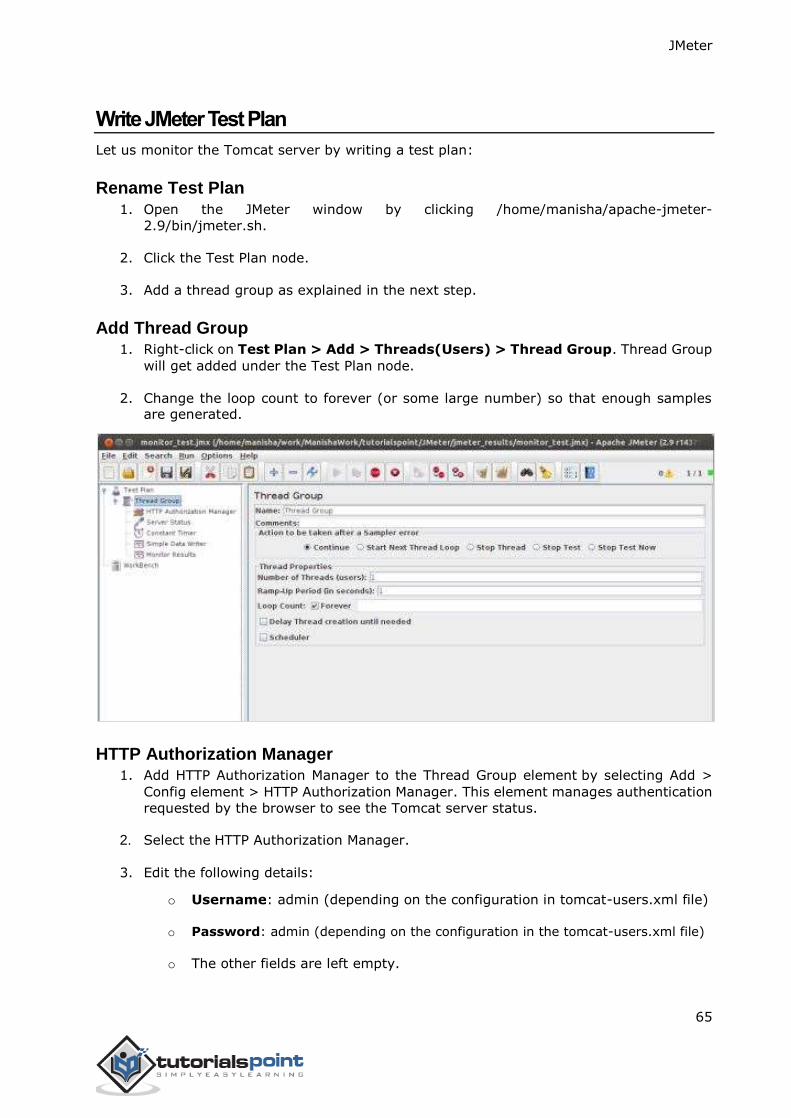
Write JMeter Test Plan
Let us monitor the Tomcat server by writing a test plan:
Rename Test Plan
1. Open the JMeter window by clicking /home/manisha/apache-jmeter-
2.9/bin/jmeter.sh.
2. Click the Test Plan node.
3. Add a thread group as explained in the next step.
Add Thread Group 1. Right-click on Test Plan > Add > Threads(Users) > Thread Group. Thread Group
will get added under the Test Plan node.
2. Change the loop count to forever (or some large number) so that enough samples are generated.
HTTP Authorization Manager 1. Add HTTP Authorization Manager to the Thread Group element by selecting Add >
Config element > HTTP Authorization Manager. This element manages authentication
requested by the browser to see the Tomcat server status.
2. Select the HTTP Authorization Manager.
3. Edit the following details:
o Username: admin (depending on the configuration in tomcat-users.xml file)
o Password: admin (depending on the configuration in the tomcat-users.xml file)
o The other fields are left empty.
JMeter
66
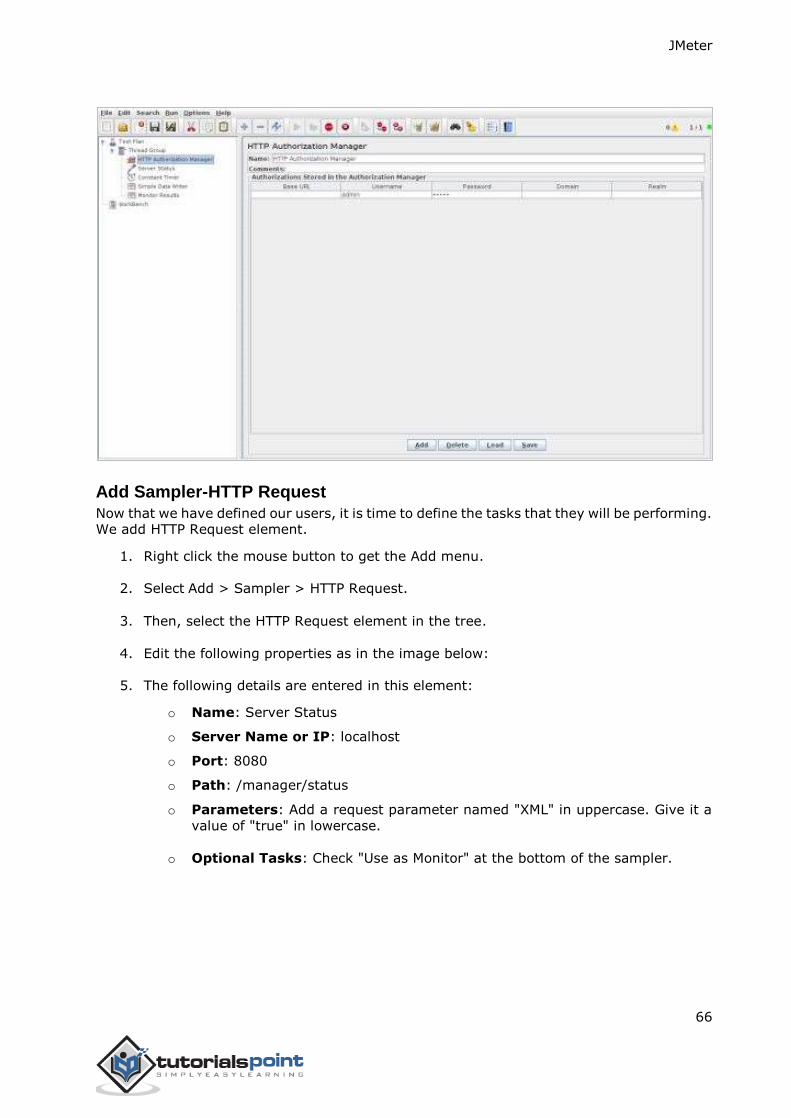
Add Sampler-HTTP Request
Now that we have defined our users, it is time to define the tasks that they will be performing. We add HTTP Request element.
1. Right click the mouse button to get the Add menu.
2. Select Add > Sampler > HTTP Request.
3. Then, select the HTTP Request element in the tree.
4. Edit the following properties as in the image below:
5. The following details are entered in this element:
o Name: Server Status
o Server Name or IP: localhost
o Port: 8080
o Path: /manager/status
o Parameters: Add a request parameter named "XML" in uppercase. Give it a
value of "true" in lowercase.
o Optional Tasks: Check "Use as Monitor" at the bottom of the sampler.
JMeter
67
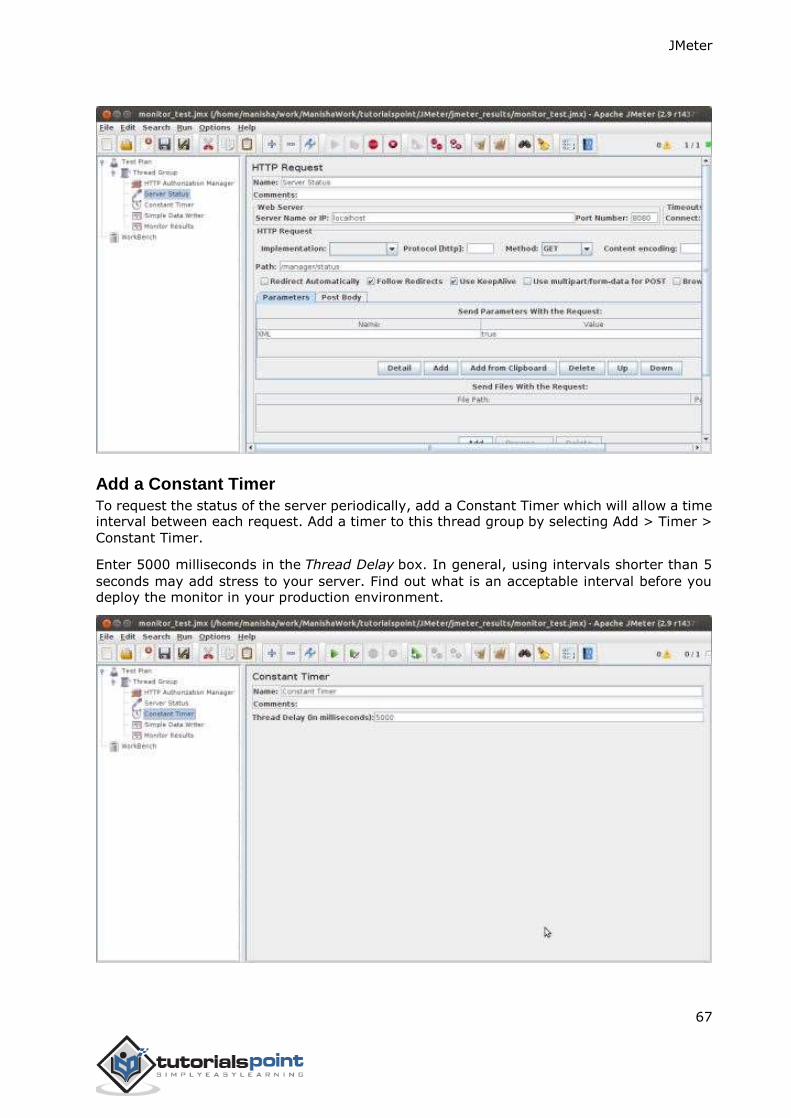
Add a Constant Timer
To request the status of the server periodically, add a Constant Timer which will allow a time interval between each request. Add a timer to this thread group by selecting Add > Timer >
Constant Timer.
Enter 5000 milliseconds in the Thread Delay box. In general, using intervals shorter than 5
seconds may add stress to your server. Find out what is an acceptable interval before you deploy the monitor in your production environment.
JMeter
68
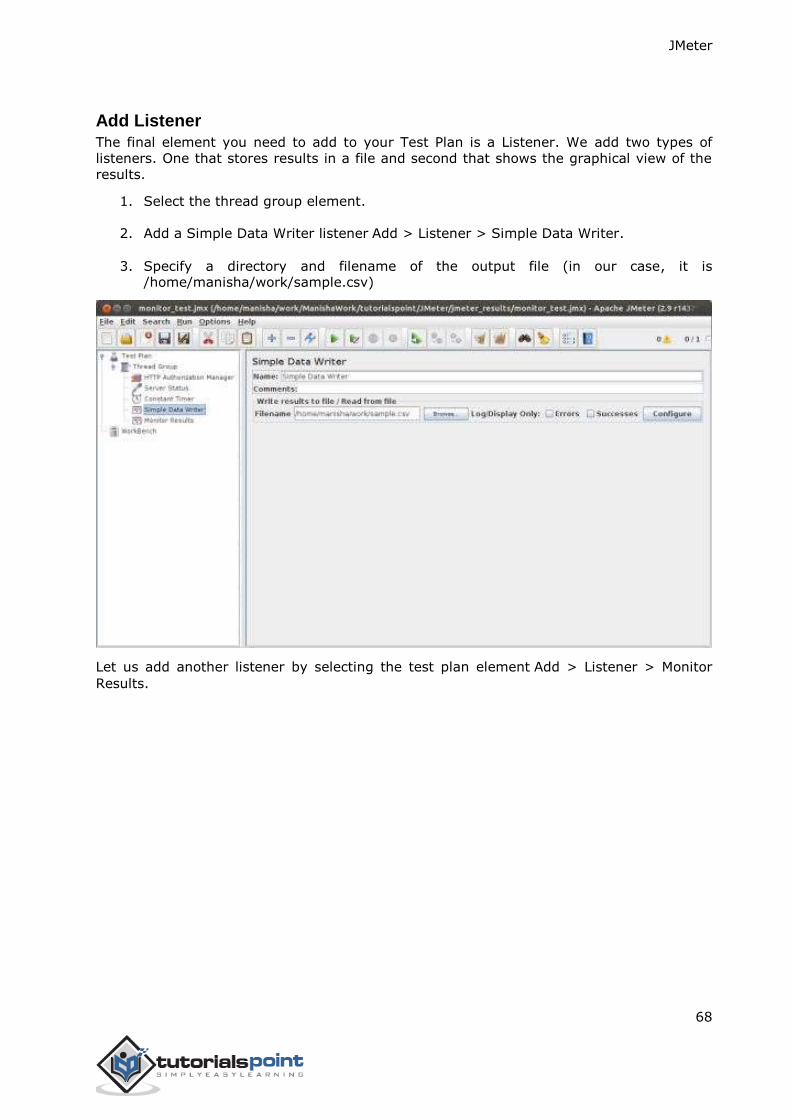
Add Listener
The final element you need to add to your Test Plan is a Listener. We add two types of
listeners. One that stores results in a file and second that shows the graphical view of the
results.
1. Select the thread group element.
2. Add a Simple Data Writer listener Add > Listener > Simple Data Writer.
3. Specify a directory and filename of the output file (in our case, it is /home/manisha/work/sample.csv)
Let us add another listener by selecting the test plan element Add > Listener > Monitor
Results.
JMeter
69
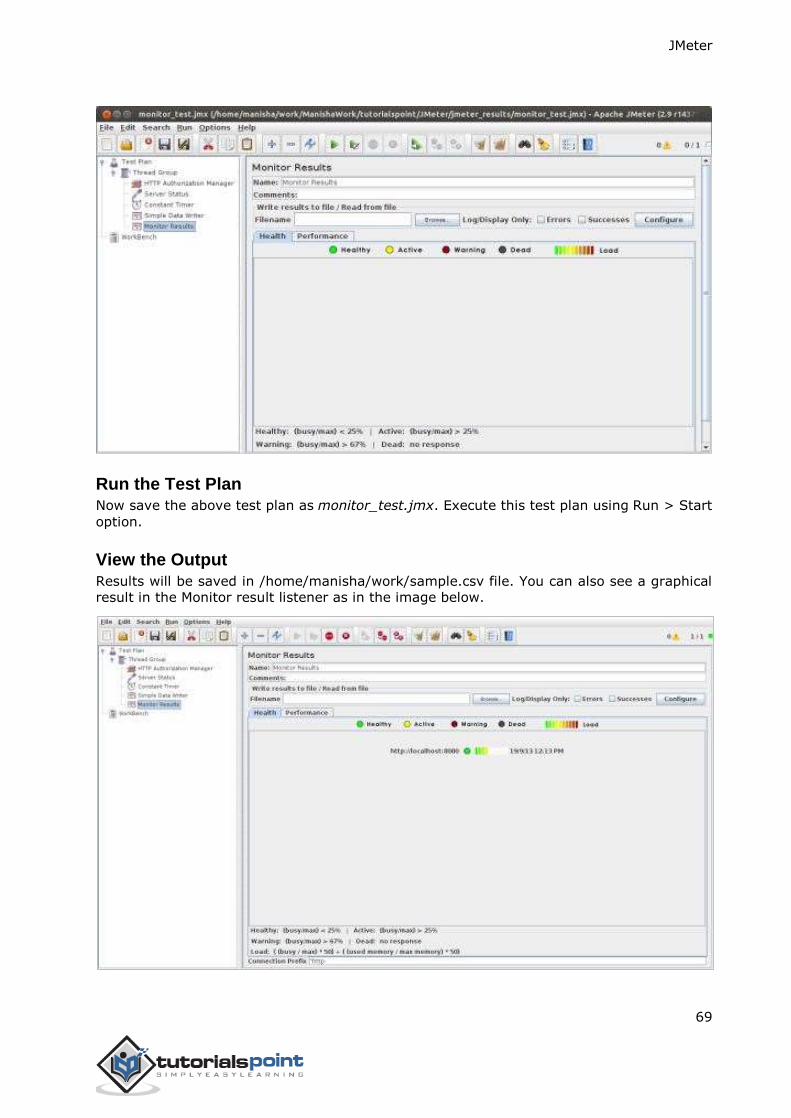
Run the Test Plan
Now save the above test plan as monitor_test.jmx. Execute this test plan using Run > Start
option.
View the Output
Results will be saved in /home/manisha/work/sample.csv file. You can also see a graphical
result in the Monitor result listener as in the image below.
JMeter
70
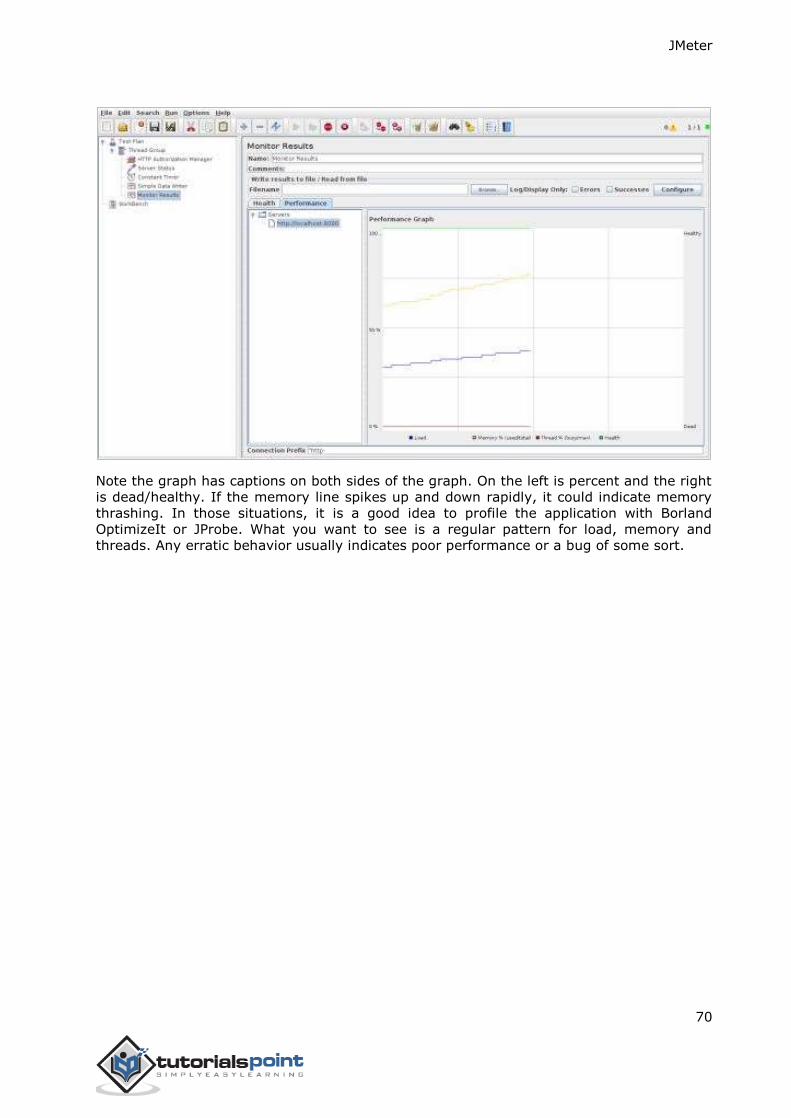
Note the graph has captions on both sides of the graph. On the left is percent and the right
is dead/healthy. If the memory line spikes up and down rapidly, it could indicate memory
thrashing. In those situations, it is a good idea to profile the application with Borland
OptimizeIt or JProbe. What you want to see is a regular pattern for load, memory and
threads. Any erratic behavior usually indicates poor performance or a bug of some sort.
JMeter
71
Listeners provide access to the information JMeter gathers about the test cases while JMeter runs. The results or information gathered by listeners can be shown in the form of:
tree
tables
graphs
log file
All listeners write the same raw data to the output file when one is specified.
Default Configuration
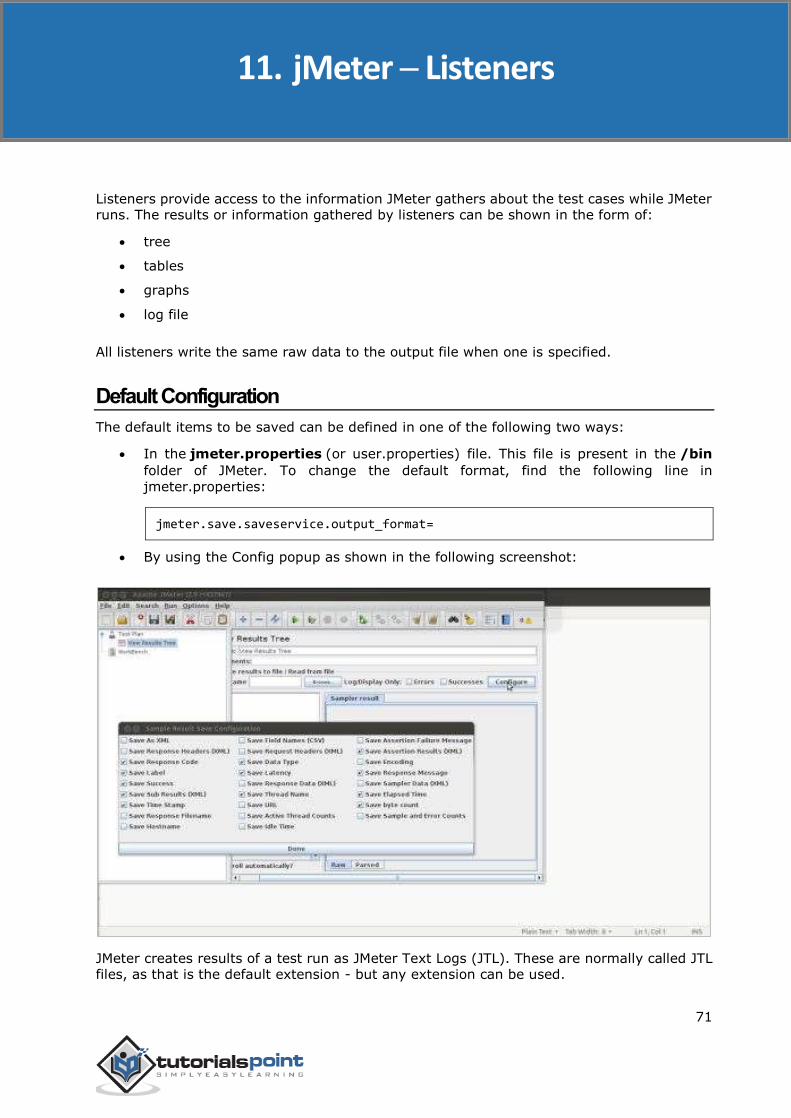
The default items to be saved can be defined in one of the following two ways:
In the jmeter.properties (or user.properties) file. This file is present in the /bin
folder of JMeter. To change the default format, find the following line in
jmeter.properties:
jmeter.save.saveservice.output_format=
By using the Config popup as shown in the following screenshot:
JMeter creates results of a test run as JMeter Text Logs (JTL). These are normally called JTL files, as that is the default extension - but any extension can be used.
11. jMeter ─ Listeners
JMeter
72
If multiple tests are run using the same output file name, then JMeter automatically appends new data at the end of the file.
The listener can record results to a file but not to the UI. It is meant to provide an efficient means of recording data by eliminating GUI overhead.
When running in:
GUI mode: use the listener Simple Data Writer
non-GUI mode: the -l flag can be used to create a data file
Listeners can use a lot of memory if there are a lot of samples. To minimize the amount of memory needed, use the Simple Data Writer with CSV format.
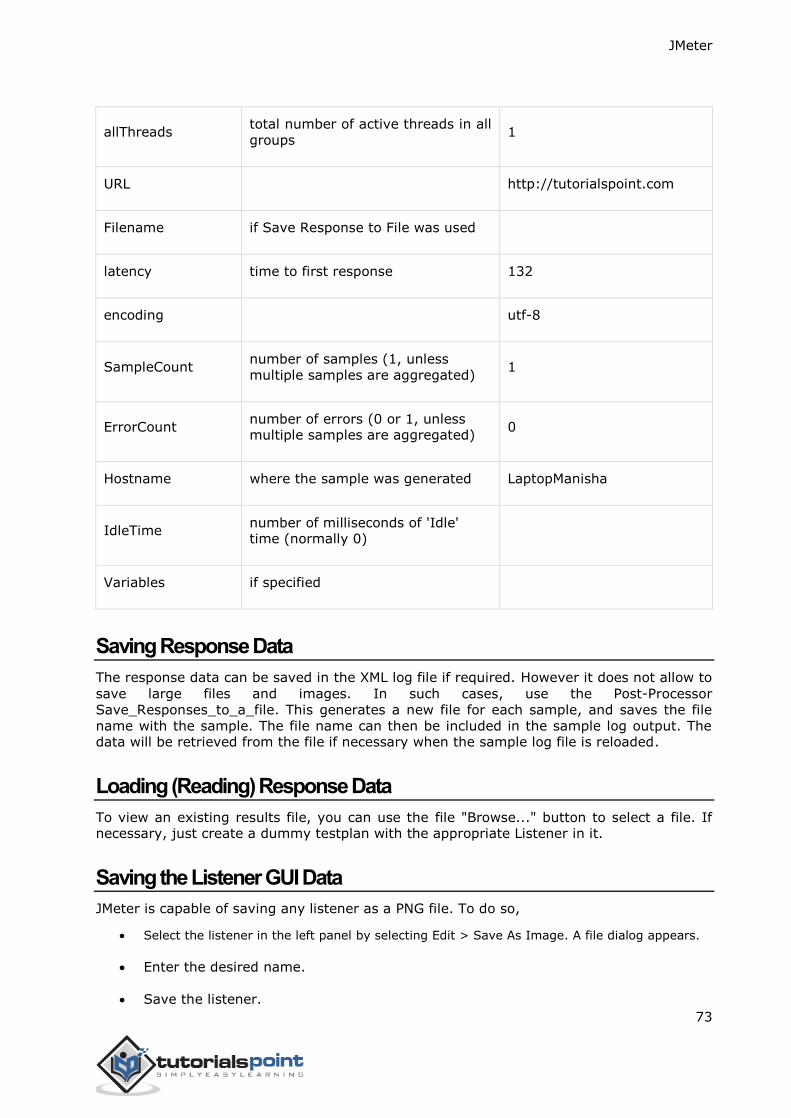
CSV Log format
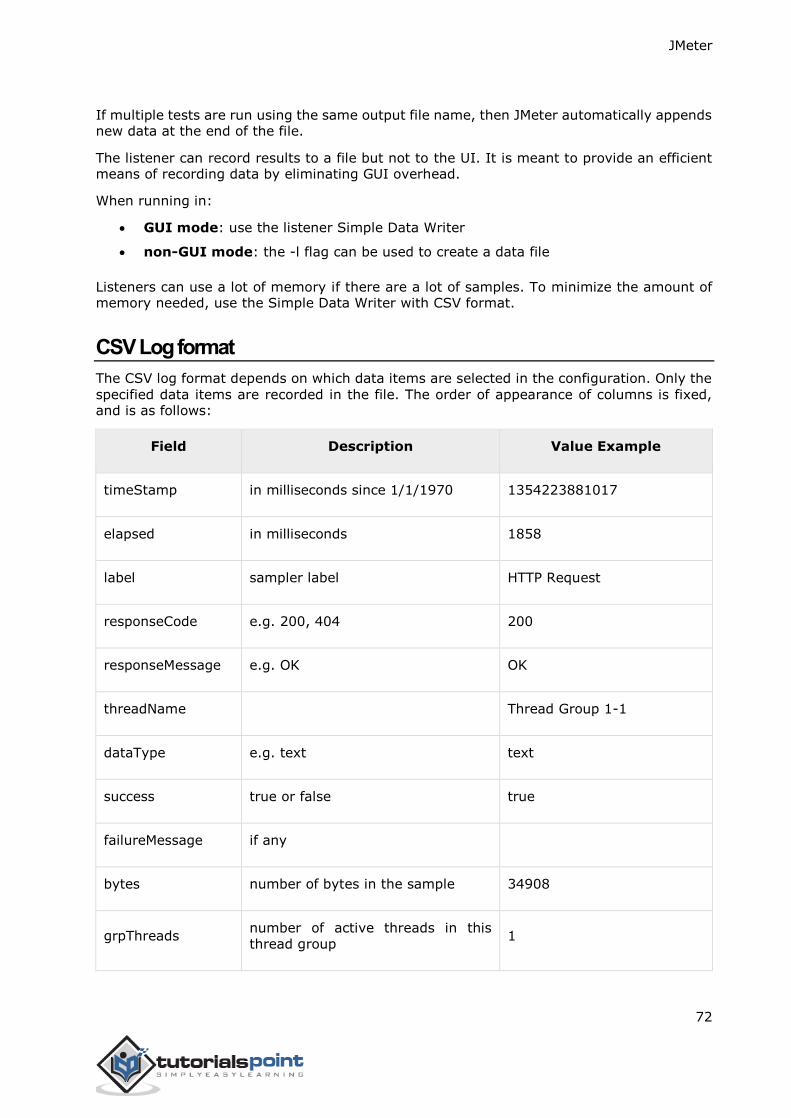
The CSV log format depends on which data items are selected in the configuration. Only the
specified data items are recorded in the file. The order of appearance of columns is fixed, and is as follows:
Field Description Value Example
timeStamp in milliseconds since 1/1/1970 1354223881017
elapsed in milliseconds 1858
label sampler label HTTP Request
responseCode e.g. 200, 404 200
responseMessage e.g. OK OK
threadName Thread Group 1-1
dataType e.g. text text
success true or false true
failureMessage if any
bytes number of bytes in the sample 34908
grpThreads number of active threads in this
thread group 1
JMeter
73
allThreads total number of active threads in all
groups 1
URL http://tutorialspoint.com
Filename if Save Response to File was used
latency time to first response 132
encoding utf-8
SampleCount number of samples (1, unless
multiple samples are aggregated) 1
ErrorCount number of errors (0 or 1, unless multiple samples are aggregated)
0
Hostname where the sample was generated LaptopManisha
IdleTime number of milliseconds of 'Idle' time (normally 0)
Variables if specified
Saving Response Data
The response data can be saved in the XML log file if required. However it does not allow to
save large files and images. In such cases, use the Post-Processor
Save_Responses_to_a_file. This generates a new file for each sample, and saves the file
name with the sample. The file name can then be included in the sample log output. The data will be retrieved from the file if necessary when the sample log file is reloaded.
Loading (Reading) Response Data
To view an existing results file, you can use the file "Browse..." button to select a file. If necessary, just create a dummy testplan with the appropriate Listener in it.
Saving the Listener GUI Data
JMeter is capable of saving any listener as a PNG file. To do so,
Select the listener in the left panel by selecting Edit > Save As Image. A file dialog appears.
Enter the desired name.
Save the listener.
JMeter
74
JMeter Functions and User Variables
JMeter functions are special values that can populate fields of any Sampler or other element in a test tree.
A function call looks like this:
${__functionName(var1,var2,var3)}
_functionName matches the name of a function. For example, ${__threadNum}.
If a function parameter contains a comma, then make sure you escape this with "\"
as shown below:
${__time(EEE\, d MMM yyyy)}
Variables are referenced as:
${VARIABLE}
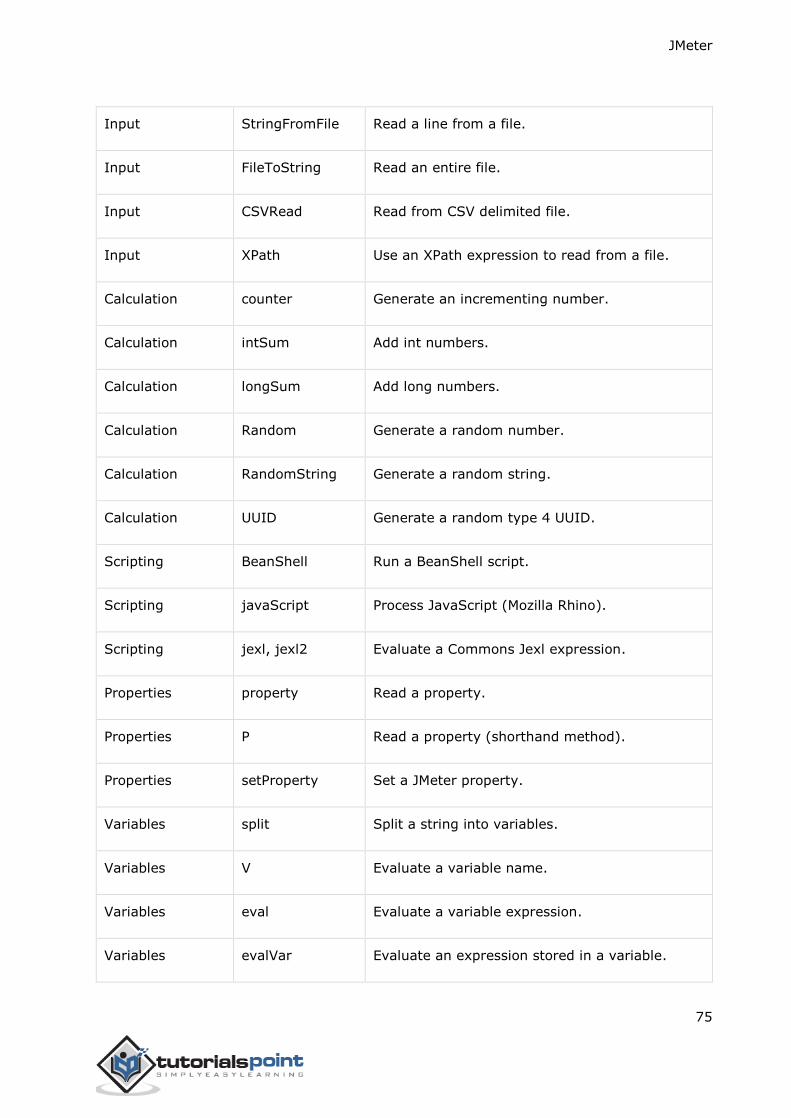
List of Functions
Following table lists a group of functions loosely grouped into types:
Function Type Name Comment
Information threadNum Get thread number.
Information samplerName Get the sampler name (label).
Information machineIP Get the local machine IP address.
Information machineName Get the local machine name.
Information time Return current time in various formats.
Information log Log (or display) a message (and return the value).
Information logn Log (or display) a message (empty return value).
12. jMeter ─ Functions
JMeter
75
Input StringFromFile Read a line from a file.
Input FileToString Read an entire file.
Input CSVRead Read from CSV delimited file.
Input XPath Use an XPath expression to read from a file.
Calculation counter Generate an incrementing number.
Calculation intSum Add int numbers.
Calculation longSum Add long numbers.
Calculation Random Generate a random number.
Calculation RandomString Generate a random string.
Calculation UUID Generate a random type 4 UUID.
Scripting BeanShell Run a BeanShell script.
Scripting javaScript Process JavaScript (Mozilla Rhino).
Scripting jexl, jexl2 Evaluate a Commons Jexl expression.
Properties property Read a property.
Properties P Read a property (shorthand method).
Properties setProperty Set a JMeter property.
Variables split Split a string into variables.
Variables V Evaluate a variable name.
Variables eval Evaluate a variable expression.
Variables evalVar Evaluate an expression stored in a variable.
JMeter
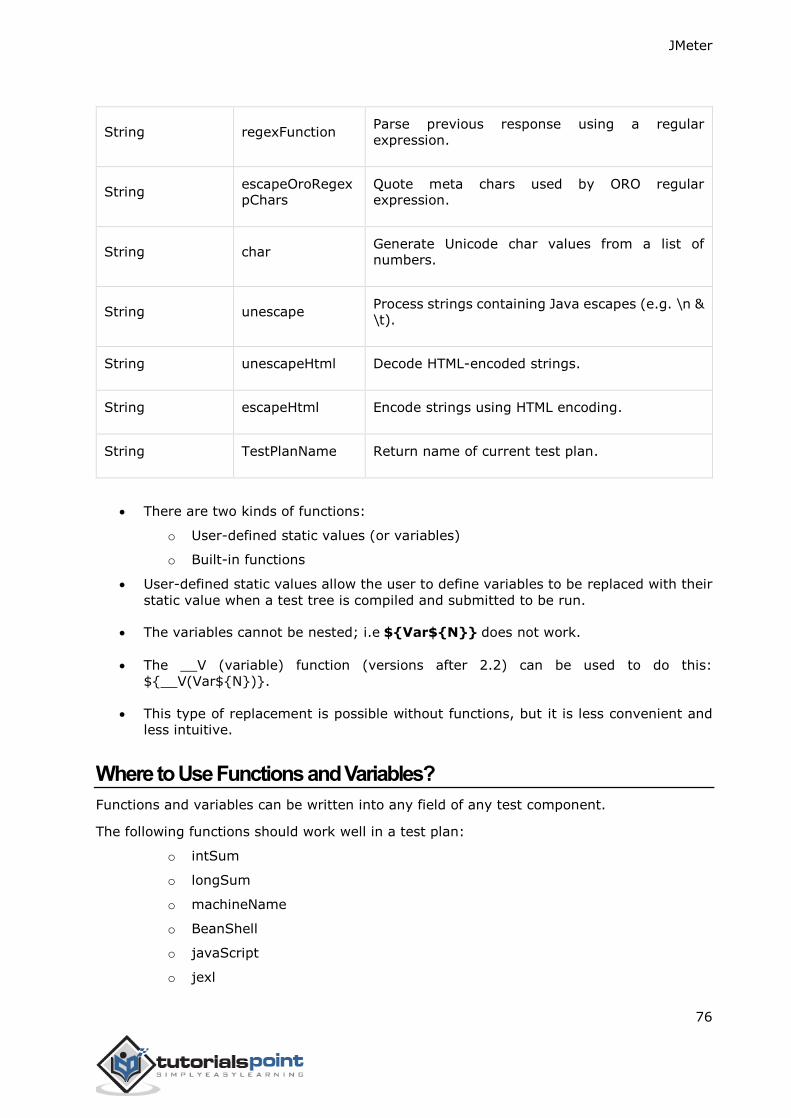
76
String regexFunction Parse previous response using a regular
expression.
String escapeOroRegexpChars
Quote meta chars used by ORO regular expression.
String char Generate Unicode char values from a list of numbers.
String unescape Process strings containing Java escapes (e.g. \n & \t).
String unescapeHtml Decode HTML-encoded strings.
String escapeHtml Encode strings using HTML encoding.
String TestPlanName Return name of current test plan.
There are two kinds of functions:
o User-defined static values (or variables)
o Built-in functions
User-defined static values allow the user to define variables to be replaced with their
static value when a test tree is compiled and submitted to be run.
The variables cannot be nested; i.e ${Var${N}} does not work.
The __V (variable) function (versions after 2.2) can be used to do this:
${__V(Var${N})}.
This type of replacement is possible without functions, but it is less convenient and
less intuitive.
Where to Use Functions and Variables?
Functions and variables can be written into any field of any test component.
The following functions should work well in a test plan:
o intSum
o longSum
o machineName
o BeanShell
o javaScript
o jexl
JMeter
77
o random
o time
o property functions
o log functions
Functions which are used on the Test Plan have some restrictions. JMeter thread variables
will have not been fully set up when the functions are processed, so variable names passed
as parameters will not be set up and variable references will not work. Hence, split() and regex() and the variable evaluation functions will not work. The
threadNum() function will not work and it does not make sense at test plan level.
Referencing Variables and Functions
Referencing a variable in a test element is done by bracketing the variable name with
'${' and '}'.
Functions are referenced in the same manner, but by convention, the names of
functions begin with "__" to avoid conflict with user value names.
Some functions take arguments to configure them, and these go in parentheses,
comma-delimited. If the function takes no arguments, the parentheses can be
omitted. For example:
${__BeanShell(vars.put("name"\,"value"))}
Alternatively, you can define your script as a variable, e.g. on the Test Plan:
SCRIPT vars.put("name","value")
The script can then be referenced as follows:
${__BeanShell(${SCRIPT})}
The Function Helper Dialog
The Function Helper Dialog is available from JMeter's Options tab.
Using the Function Helper, you can select a function from the pull down, and assign
values for its arguments. The left column in the table provides a brief description of
the argument, and the right column is where you write the value for that argument.
Different functions take different arguments.
Once you have done this, click the “Generate" button, and the appropriate string is
generated, which you can copy-paste into the test plan wherever you need to.
JMeter
78
Pre-defined Variables
Some variables are defined internally by JMeter. They are:
COOKIE_cookiename - contains the cookie value.
JMeterThread.last_sample_ok - whether or not the last sample was OK - true/false.
Note: this is updated after PostProcessors and Assertions have been run.
START variables.
Pre-defined Properties
Some built-in properties are defined by JMeter. These are listed below. For convenience, the START properties are also copied to variables with the same names.
START.MS - JMeter start time in milliseconds.
START.YMD - JMeter start time as yyyyMMdd.
START.HMS - JMeter start time as HHmmss.
TESTSTART.MS - test start time in milliseconds.
Note that the START variables / properties represent JMeter startup time, not the test start time. They are mainly intended for use in file names etc.
JMeter
79
Regular expressions are used to search and manipulate text, based on patterns. JMeter
interprets forms of regular expressions or patterns being used throughout a JMeter test plan, by including the pattern matching software Apache Jakarta ORO.
With the use of regular expressions, we can certainly save a lot of time and achieve greater
flexibility as we create or enhance a Test Plan. Regular expressions provide a simple method to get information from pages when it is impossible or very hard to predict an outcome.
A standard usage example of using expressions is to get a session ID from the server response. If the server returns a unique session key we can easily get it using expressions in our load script.
To use regular expressions in your test plan, you need to use the Regular Expression Extractor of JMeter. You can place regular expressions in any component in a Test Plan.
It is worth stressing the difference between contains and matches, as used on the
Response Assertion test element:
contains means that the regular expression matched at least some part of the target,
so 'alphabet' "contains" 'ph.b.' because the regular expression matches the substring
'phabe'.
matches means that the regular expression matched the whole target. Hence the
'alphabet' is "matched" by 'al.*t'.
Suppose you want to match the following portion of a web-page:
name="file" value="readme.txt"
And you want to extract readme.txt. A suitable regular expression would be:
name="file" value="(.+?)">
The special characters above are:
( and ) - these enclose the portion of the match string to be returned
. - match any character
+ - one or more times
? - stop when first match succeeds
Create JMeter Test Plan Let us understand the use of Regular expressions in the Regular Expression Extractor—a
Post-Processor Element by writing a test plan. This element extracts text from the current
page using a Regular Expression to identify the text pattern that a desired element conforms with.
First we write an HTML page which a list of people and their email IDs. We deploy it to our
tomcat server. The contents of html (index.html) are as follows:
13. jMeter ─ Regular Expressions
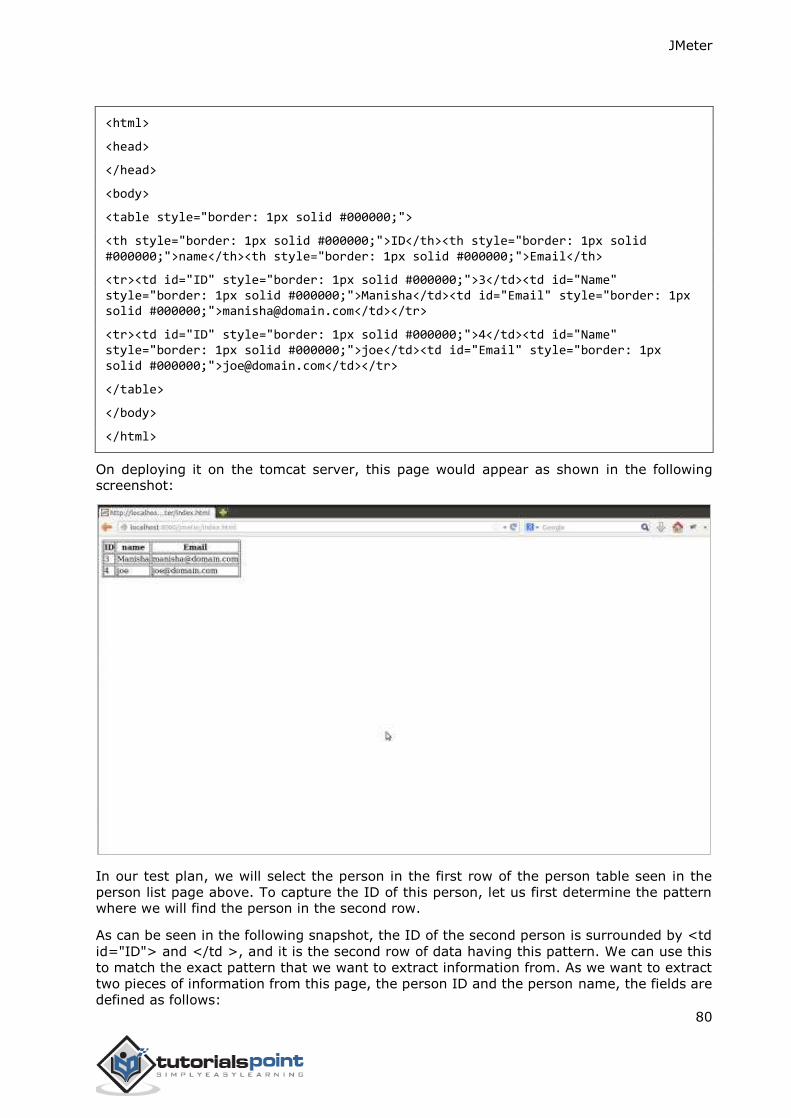
JMeter
80
<html>
<head>
</head>
<body>
<table style="border: 1px solid #000000;">
<th style="border: 1px solid #000000;">ID</th><th style="border: 1px solid #000000;">name</th><th style="border: 1px solid #000000;">Email</th>
<tr><td id="ID" style="border: 1px solid #000000;">3</td><td id="Name" style="border: 1px solid #000000;">Manisha</td><td id="Email" style="border: 1px solid #000000;">[email protected]</td></tr>
<tr><td id="ID" style="border: 1px solid #000000;">4</td><td id="Name" style="border: 1px solid #000000;">joe</td><td id="Email" style="border: 1px solid #000000;">[email protected]</td></tr>
</table>
</body>
</html>
On deploying it on the tomcat server, this page would appear as shown in the following screenshot:
In our test plan, we will select the person in the first row of the person table seen in the
person list page above. To capture the ID of this person, let us first determine the pattern where we will find the person in the second row.
As can be seen in the following snapshot, the ID of the second person is surrounded by <td
id="ID"> and </td >, and it is the second row of data having this pattern. We can use this
to match the exact pattern that we want to extract information from. As we want to extract
two pieces of information from this page, the person ID and the person name, the fields are
defined as follows:
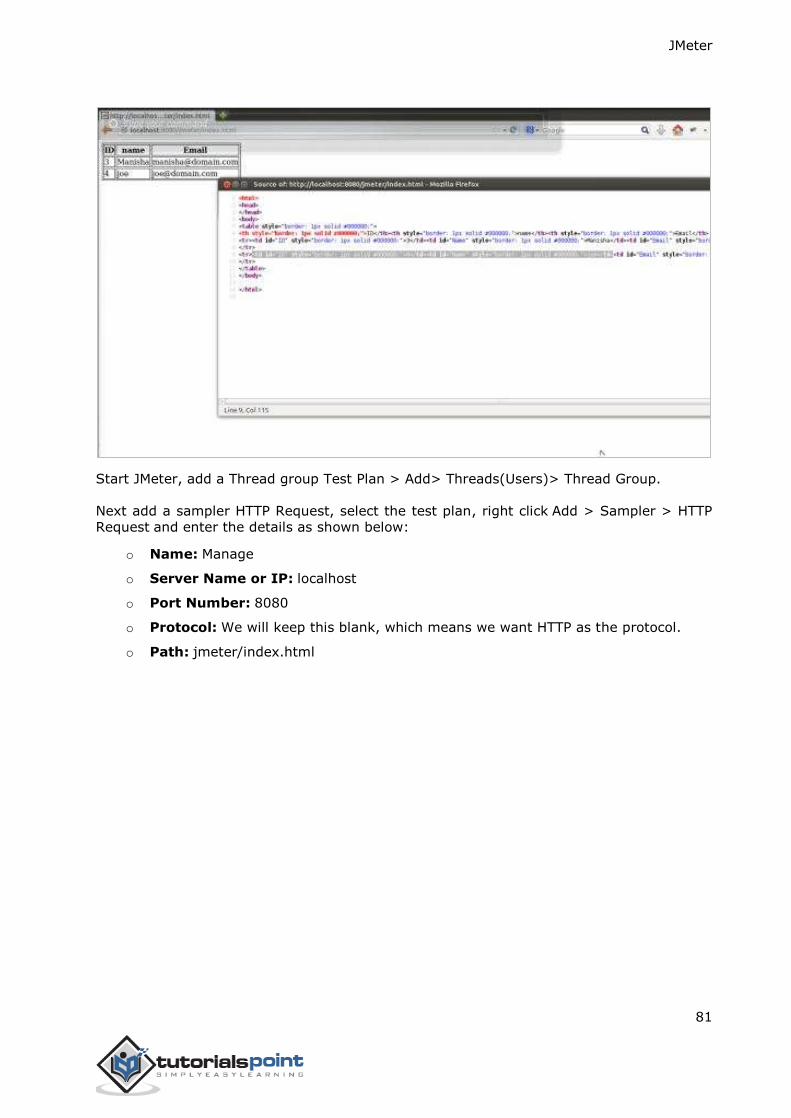
JMeter
81
Start JMeter, add a Thread group Test Plan > Add> Threads(Users)> Thread Group.
Next add a sampler HTTP Request, select the test plan, right click Add > Sampler > HTTP
Request and enter the details as shown below:
o Name: Manage
o Server Name or IP: localhost
o Port Number: 8080
o Protocol: We will keep this blank, which means we want HTTP as the protocol.
o Path: jmeter/index.html
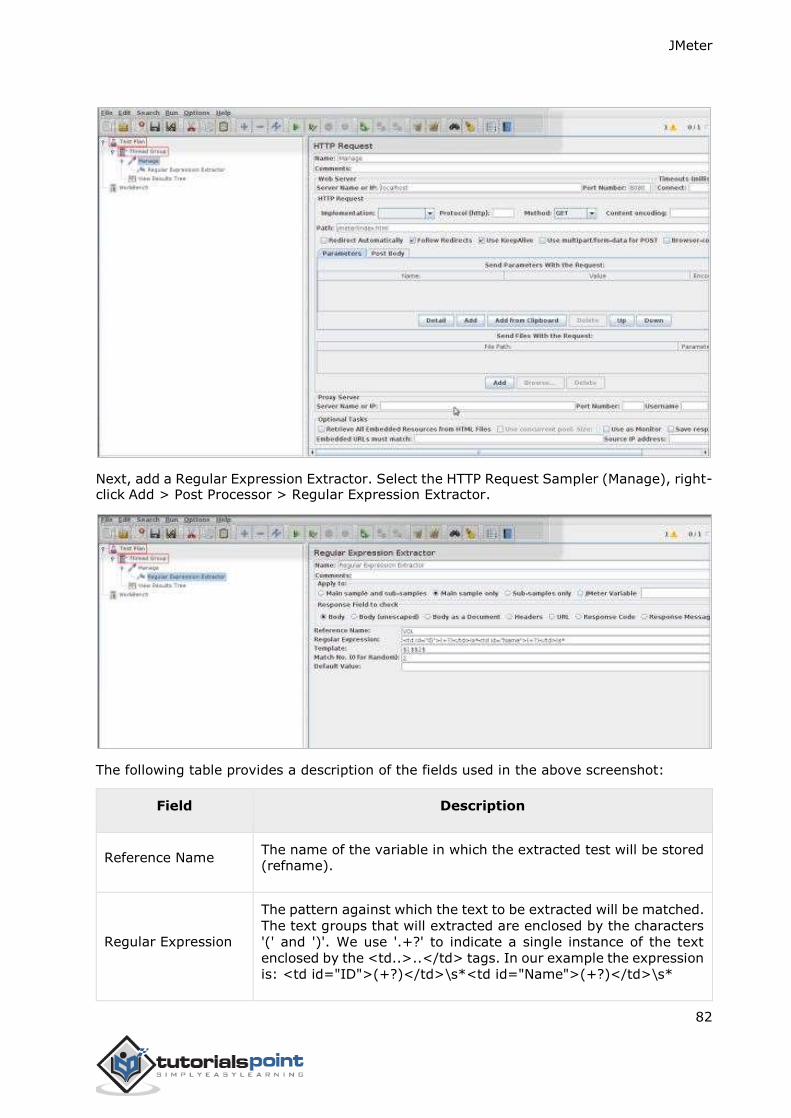
JMeter
82
Next, add a Regular Expression Extractor. Select the HTTP Request Sampler (Manage), right-click Add > Post Processor > Regular Expression Extractor.
The following table provides a description of the fields used in the above screenshot:
Field Description
Reference Name The name of the variable in which the extracted test will be stored (refname).
Regular Expression
The pattern against which the text to be extracted will be matched.
The text groups that will extracted are enclosed by the characters
'(' and ')'. We use '.+?' to indicate a single instance of the text
enclosed by the <td..>..</td> tags. In our example the expression
is: <td id="ID">(+?)</td>\s*<td id="Name">(+?)</td>\s*
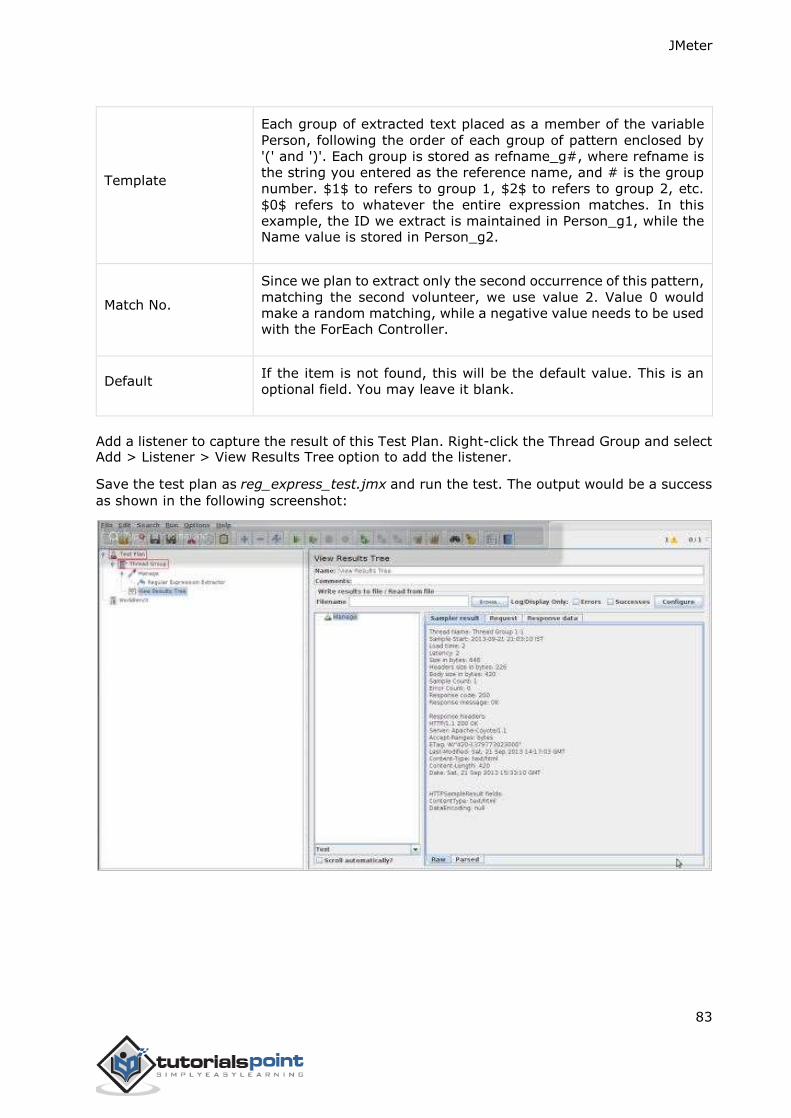
JMeter
83
Template
Each group of extracted text placed as a member of the variable
Person, following the order of each group of pattern enclosed by
'(' and ')'. Each group is stored as refname_g#, where refname is
the string you entered as the reference name, and # is the group
number. $1$ to refers to group 1, $2$ to refers to group 2, etc.
$0$ refers to whatever the entire expression matches. In this
example, the ID we extract is maintained in Person_g1, while the Name value is stored in Person_g2.
Match No.
Since we plan to extract only the second occurrence of this pattern,
matching the second volunteer, we use value 2. Value 0 would
make a random matching, while a negative value needs to be used with the ForEach Controller.
Default If the item is not found, this will be the default value. This is an
optional field. You may leave it blank.
Add a listener to capture the result of this Test Plan. Right-click the Thread Group and select Add > Listener > View Results Tree option to add the listener.
Save the test plan as reg_express_test.jmx and run the test. The output would be a success
as shown in the following screenshot:
JMeter
84
JMeter has some limitations especially when it is run in a distributed environment. Following these guidelines will assist in creating a real and continuous load:
Use multiple instances of JMeter in case, the number of threads are more.
Check the Scoping Rules and design accordingly.
Use naming conventions always for all elements.
Check the default browser Connectivity settings, before executing scripts.
Add Listeners appropriately.
Here are some suggestion to reduce resource requirements:
o Use non-GUI mode: jmeter -n -t test.jmx -l test.jtl.
o Use as few Listeners as possible; if using the -l flag as above, they can all be
deleted or disabled.
o Disable the “View Result Tree” listener as it consumes a lot of memory and
can result in the console freezing or JMeter running out of memory. It is,
however, safe to use the “View Result Tree” listener with only “Errors”
checked.
o Rather than using lots of similar samplers, use the same sampler in a loop,
and use variables (CSV Data Set) to vary the sample. Or perhaps use the
Access Log Sampler.
o Do not use functional mode.
o Use CSV output rather than XML.
o Only save the data that you need.
o Use as few Assertions as possible.
o Disable all JMeter graphs as they consume a lot of memory. You can view all
of the real time graphs using the JTLs tab in your web interface.
o Do not forget to erase the local path from CSV Data Set Config if used.
o Clean the Files tab prior to every test run.
14. jMeter ─ Best Practices