JMeter for - PTC Community
47
Page 1 of 47 JMeter for A Comprehensive Guide on Load Testing with JMeter Contents Overview.......................................................................................................................................................................................................... 2 Getting Started With JMeter ........................................................................................................................................................... 3 Tutorial: Downloading and Installing JMeter........................................................................................................... 3 Tutorial: Creating a Test ........................................................................................................................................................... 4 Thread Groups .......................................................................................................................................................................................... 14 Tutorial: Adding More Thread Groups ........................................................................................................................ 14 Parameterization in JMeter Tests............................................................................................................................................. 23 Tutorial: Parameterizing the Thread Groups ........................................................................................................ 23 Post Processors and Extractors .................................................................................................................................................26 Tutorial: Adding JSON and Regex Extractors ......................................................................................................26 Distributed Testing ............................................................................................................................................................................... 28 Tutorial: Setting Up Distributed Testing on One Host ..................................................................................29 Client-Side Reports in JMeter ..................................................................................................................................................... 33 Tutorial: Creating JMeter Reports ................................................................................................................................. 33 Server-Side Results in DynaTrace ........................................................................................................................................... 37 How to Use the Test Results....................................................................................................................................................... 40 Conclusion .................................................................................................................................................................................................. 42 Appendix I: JMeter Best Practice Tips .................................................................................................................................. 43 Appendix II: General Load Testing Guidelines............................................................................................................... 46
Transcript of JMeter for - PTC Community

Page 1 of 47
JMeter for
A Comprehensive Guide on Load Testing with JMeter
Contents Overview .......................................................................................................................................................................................................... 2
Getting Started With JMeter ........................................................................................................................................................... 3
Tutorial: Downloading and Installing JMeter........................................................................................................... 3
Tutorial: Creating a Test ........................................................................................................................................................... 4
Thread Groups .......................................................................................................................................................................................... 14
Tutorial: Adding More Thread Groups ........................................................................................................................ 14
Parameterization in JMeter Tests ............................................................................................................................................. 23
Tutorial: Parameterizing the Thread Groups ........................................................................................................ 23
Post Processors and Extractors ................................................................................................................................................. 26
Tutorial: Adding JSON and Regex Extractors ...................................................................................................... 26
Distributed Testing ............................................................................................................................................................................... 28
Tutorial: Setting Up Distributed Testing on One Host .................................................................................. 29
Client-Side Reports in JMeter ..................................................................................................................................................... 33
Tutorial: Creating JMeter Reports ................................................................................................................................. 33
Server-Side Results in DynaTrace ........................................................................................................................................... 37
How to Use the Test Results....................................................................................................................................................... 40
Conclusion .................................................................................................................................................................................................. 42
Appendix I: JMeter Best Practice Tips .................................................................................................................................. 43
Appendix II: General Load Testing Guidelines ............................................................................................................... 46
Overview JMeter for ThingWorx
Page 2 of 47
Overview Apache JMeter is an open-source tool designed for load testing and measuring the performance of a web application. JMeter has a wide range of features to facilitate this testing, including support for a variety of server and protocol types, a full-featured testing IDE with the ability to record the test steps from both a browser or a native application, and built-in debugging tools. Information about JMeter can be found on Apache’s website.
Working with JMeter is not always intuitive, but it also isn’t that much harder than regular software development. Take some time to explore the official Apache JMeter Documentation and figure out where things go and how to mechanically make use of the JMeter IDE. Then step through this guide to create a basic test that logins to ThingWorx, accesses a mashup, and clicks on a few widgets.
Then, continue on in this guide to make that simple project more complex, working towards a better representation of a real load test. Note that the screenshots do appear a little differently in later sections because a new “Look and Feel” was selected for the JMeter application (switched from “Metal” to “Windows Classic”) to provide more readable screenshots. There are sections on creating and configuring thread groups, as well as parametrizing the procedures defined by each thread group.
Running JMeter to the scale required by most customers is something that demands additional considerations. At scale, a test may need to simulate thousands of users, which will require more than just one JMeter client be set-up on one or many hosts, as shown in the section on distributed testing.
Finally, learn how to push the limits of an application with your load testing, as well as how to generate and analyze the reports once the testing completes. Multiple criteria can be used to evaluate results, including: response time (as monitored both by JMeter, and by some other tool on the system side), throughput, number of errors, resource saturation, CPU, Memory, disk, and network utilization.
Depending on use case, some of these may be considered more important than others. For instance, some customers don't care if users wait a while for results to appear on the page (response time), because they set their users' expectations and mitigate the experience with well-designed loading graphics. With response times secondary, the real issues center around data loss or system outages, with resource utilization and number of errors becoming the more important indicators of system health. Request and database timeout errors are more important indicators, as they occur most often when resources are saturated and there is data loss.
It is typical for many customers to find preventing data loss and/or promoting data integrity to be more important than preventing long response times. Consider which of these factors is most important to your use case as you determine what kind of information to gather and review in your reports.
This guide is a comprehensive, but relatively basic guide to JMeter. Anyone should be able to perform enterprise-level load testing after reviewing the content here, but further reading and development may also be required depending on the needs and complexities of any individual application.

Getting Started With JMeter JMeter for ThingWorx
Page 3 of 47
Getting Started With JMeter JMeter is not a PTC owned tool, but rather Apache. Download it from Apache’s website, as shown in the tutorial below.
Tutorial: Downloading and Installing JMeter
1. Download JMeter from Apache’s website.
2. Unpack the archive and copy the files to a desired location.
3. Run the application by double clicking on the “ApacheJMeter.jar” file within the bin directory.
4. JMeter is now installed and ready to use.
Getting Started With JMeter JMeter for ThingWorx
Page 4 of 47
Tutorial: Creating a Test
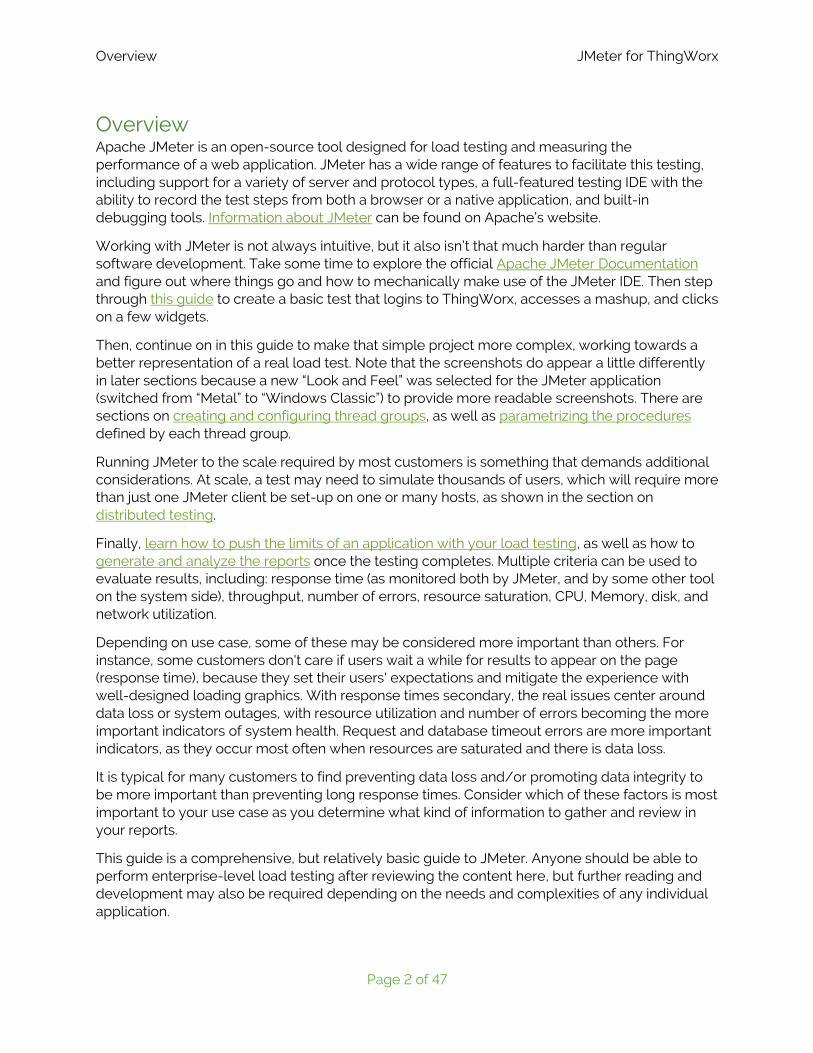
1. Set up a proxy in your browser of choice (or on the OS in settings).
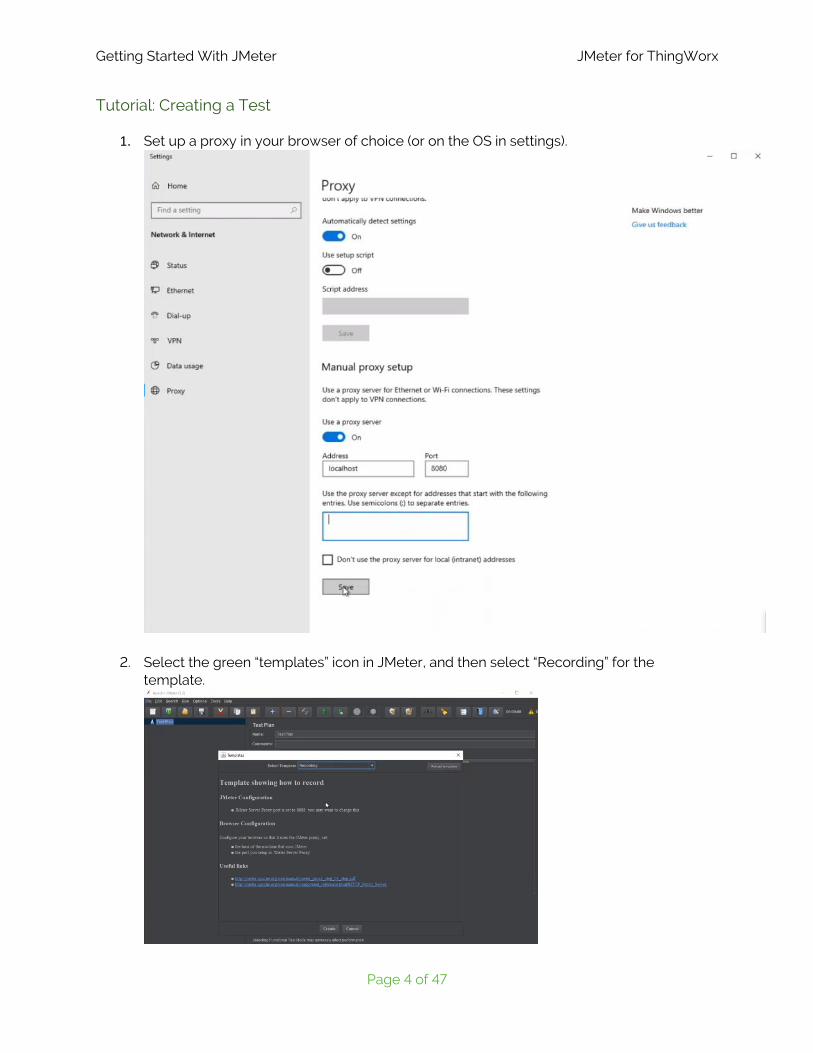
2. Select the green “templates” icon in JMeter, and then select “Recording” for the template.

Getting Started With JMeter JMeter for ThingWorx
Page 5 of 47
3. Configure the recording template to point towards your ThingWorx Navigate or Foundation server, then click “Create”.
4. Hit “Start” under the “HTTP(S) Test Script Recorder” tab of the new JMeter project. Make sure the port is set correctly under Global Settings.
5. A pop-up box will appear that always stays visible on top of the active browser window, so that the recording can be controlled and stopped at any time. Leave the “Transaction name” field empty so that each transaction recorded by the software is automatically named after the web request (this helps differentiate one from the other, and they can each be renamed later).
6. Open your browser, and navigate (via direct URL if possible, to keep things simple) to the mashup you wish to test. Login and let the page load.
7. Click on anything you’d like on the mashup to capture, the activity of that test.
8. Then click “Stop” on the pop-up recorder window to stop the recording.

Getting Started With JMeter JMeter for ThingWorx
Page 6 of 47
9. Each transaction will be assigned an index as well, and the source code behind each of these transactions can be reviewed and manually modified in the main JMeter window. Here is the login request for instance:
10. The HTTP Authorization Manager is used to automatically authorize a defined user login for the thread to any of the Base URLs listed. In this case, though, there are two separate servers being accessed during the test, and one may need to be added manually:
11. Save the project before continuing, as manual modifications are next.
12. Within the task page as you do the recording, a set of parameters or body data will be recorded. Modifying this is how you want to parametrize the test scenario, variables like the username and password. To simulate logging in as other users, you have to parameterize this, and not rely on the administrator account name and password entered into the browser.
Getting Started With JMeter JMeter for ThingWorx
Page 7 of 47
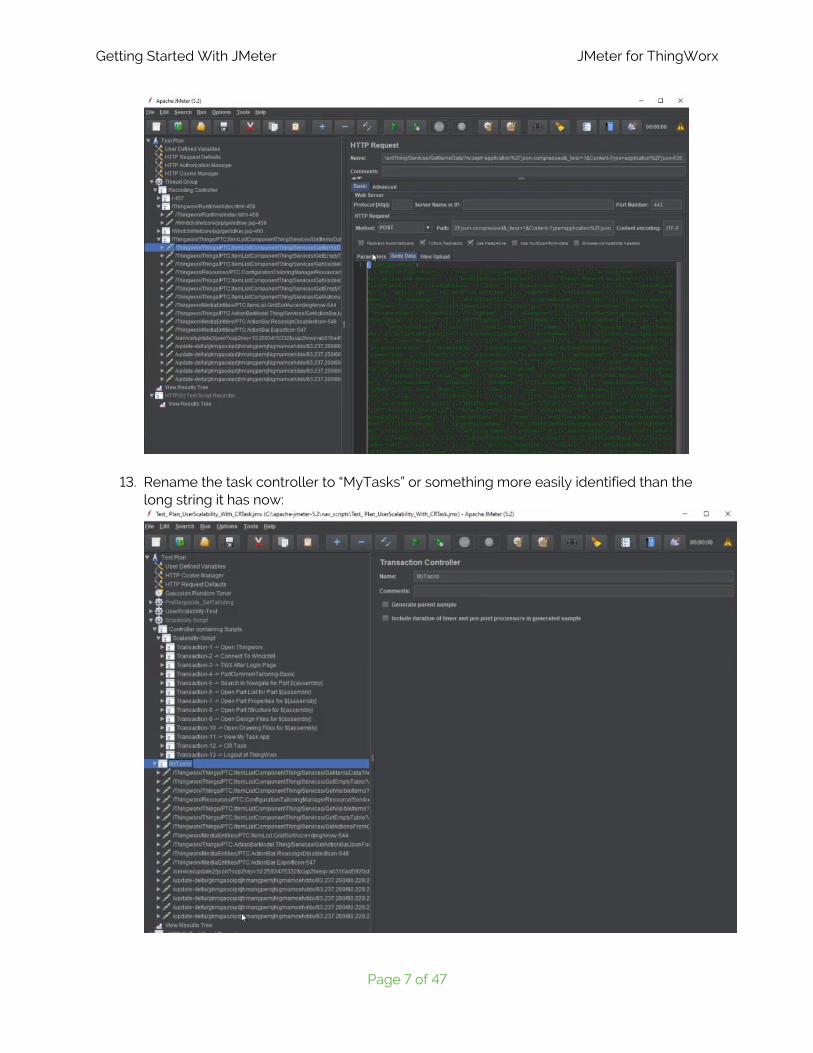
13. Rename the task controller to “MyTasks” or something more easily identified than the long string it has now:

Getting Started With JMeter JMeter for ThingWorx
Page 8 of 47
14. Some recorded items like static images and stylesheets will be non-essential, things the browser processes for better graphical representation, but which are often cached and do not greatly affect the scalability results of the test. These can be highlighted and disabled all at once:
15. Also ensure that any cascading stylesheets have been disabled.
16. Enable the “View Results Tree” to ensure you can review the results of the test script during the editing phase. However, this “Listener” element has a high memory footprint during test execution, so it should be disabled before running an actual scale test.
17. Next we need to parametrize the user login information and pull it from a csv file.
The colon means that “Administrator” is the default user to use for login.

Getting Started With JMeter JMeter for ThingWorx
Page 9 of 47
18. You can add other properties as well, like ramp up time, run time, number of users, and protocols to use.
The ramp up time determines how quickly the threads are allocated for the test, which if done slowly enough, prevents the thundering herd scenario.
19. In more complex scenarios, logic controllers can be inserted to control the flow of the test. This allows for options such as if-then conditions for different user permissions, or parameter-based routes for better randomization of actions in different threads. This is mentioned in more detail in Appendix I.
20. Pre- and Post-Processors can be used as well, with the latter being used here much more than the former, to extract information from the response, in order to then use that as part of the variables going into one of the follow up requests.

Getting Started With JMeter JMeter for ThingWorx
Page 10 of 47
For example, see the script in this image:
This one has a variable that it extracts from the object number property, defined in the CSV file, and converts it into another variable that is used in subsequent scripts.
Getting Started With JMeter JMeter for ThingWorx
Page 11 of 47
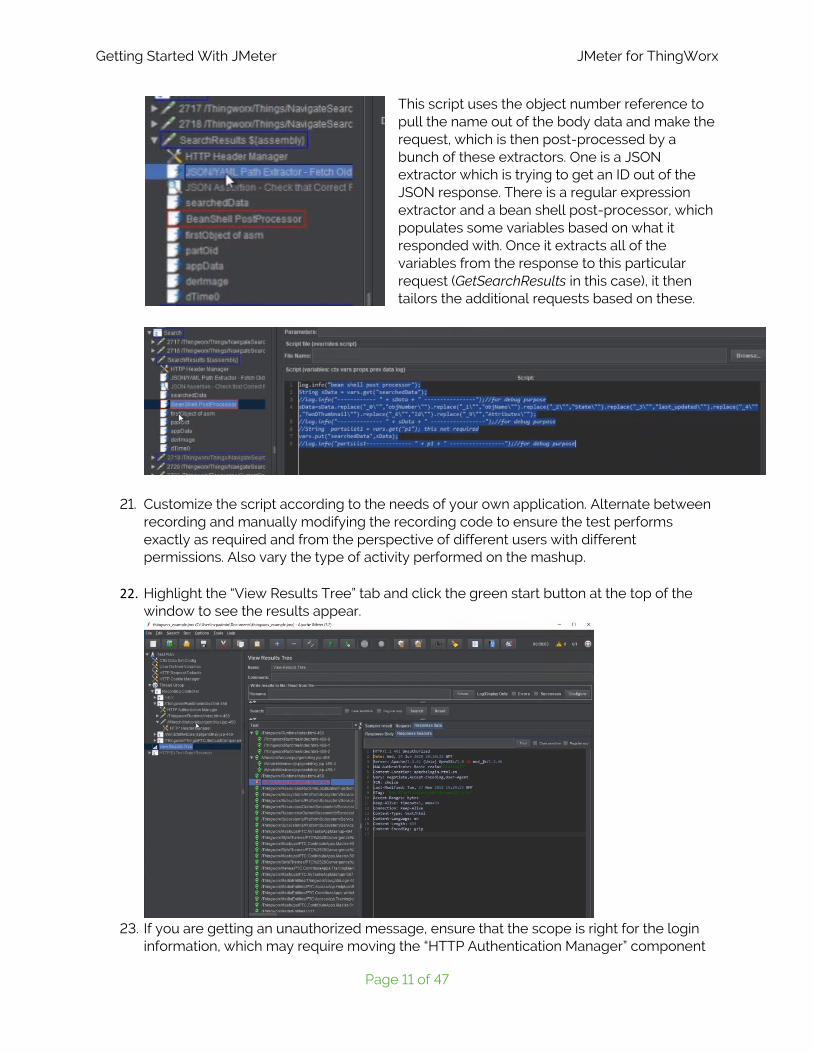
This script uses the object number reference to pull the name out of the body data and make the request, which is then post-processed by a bunch of these extractors. One is a JSON extractor which is trying to get an ID out of the JSON response. There is a regular expression extractor and a bean shell post-processor, which populates some variables based on what it responded with. Once it extracts all of the variables from the response to this particular request (GetSearchResults in this case), it then tailors the additional requests based on these.
21. Customize the script according to the needs of your own application. Alternate between recording and manually modifying the recording code to ensure the test performs exactly as required and from the perspective of different users with different permissions. Also vary the type of activity performed on the mashup.
22. Highlight the “View Results Tree” tab and click the green start button at the top of the window to see the results appear.
23. If you are getting an unauthorized message, ensure that the scope is right for the login
information, which may require moving the “HTTP Authentication Manager” component

Getting Started With JMeter JMeter for ThingWorx
Page 12 of 47
around in the project. Be sure to check the URLs and credentials entered for each type of user. Occasionally the recorder will insert a long authentication string into the URL, and you want to manually set the URL for the credentials to the most generic URL possible for the server.
This can be parametrized too:
Referencing the CSV file defined here:
Getting Started With JMeter JMeter for ThingWorx
Page 13 of 47
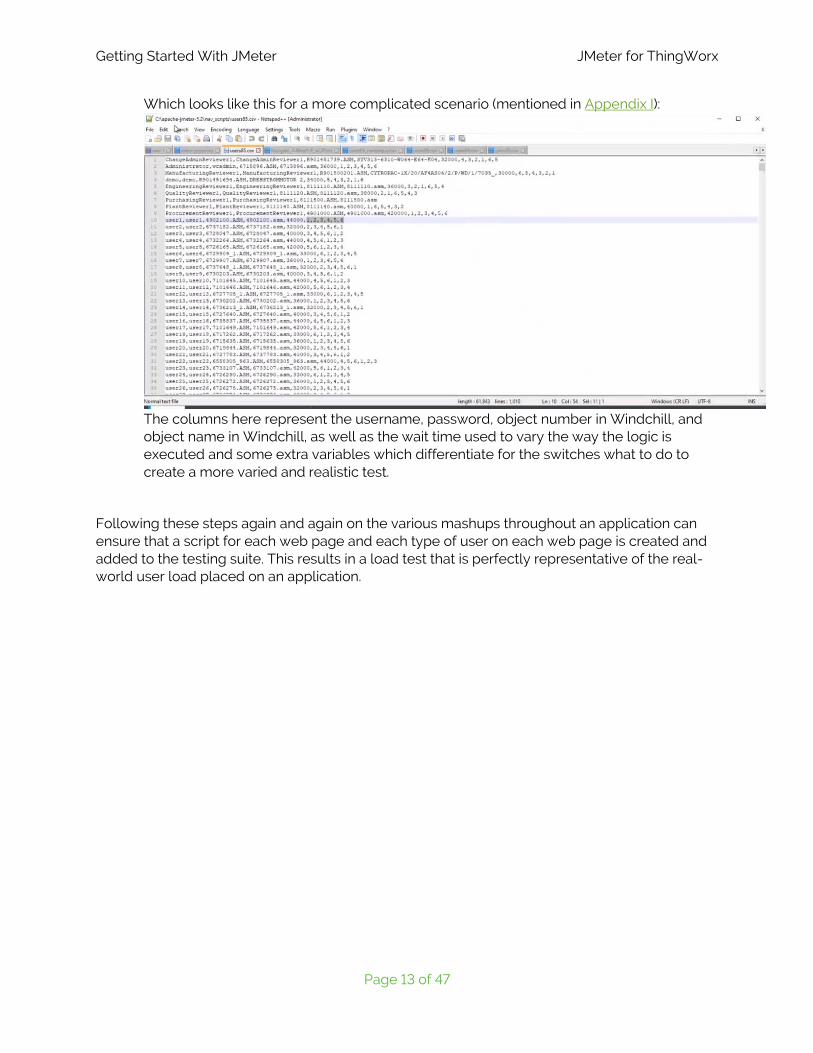
Which looks like this for a more complicated scenario (mentioned in Appendix I):
The columns here represent the username, password, object number in Windchill, and object name in Windchill, as well as the wait time used to vary the way the logic is executed and some extra variables which differentiate for the switches what to do to create a more varied and realistic test.
Following these steps again and again on the various mashups throughout an application can ensure that a script for each web page and each type of user on each web page is created and added to the testing suite. This results in a load test that is perfectly representative of the real-world user load placed on an application.

Thread Groups JMeter for ThingWorx
Page 14 of 47
Thread Groups Within JMeter, thread groups are used to organize the HTTP requests in a test into various processes or procedures, such that different mashups (and all of the HTTP requests required on each) or processes can be executed simultaneously by different thread groups throughout the test. Varying the number of threads in a group is how to vary the number of users accessing that mashup during the test, a number which increases over time in accordance with the ramp up time. The thread group name will also show up in the Summary Report tab at the end of the test, making it easier to parse through and graph the results.
Tutorial: Adding More Thread Groups
1. Start by renaming the existing thread groups so that their process or procedure names are recognizable at the end of the test:
2. Highlight the line which reads “HTTP(S) Test Script Recorder”.

Thread Groups JMeter for ThingWorx
Page 15 of 47
(Optional) Add an Include filter to only capture the URLs relevant to your application using the Requests Filtering tab. For example, the escape character \ necessary for ‘.’, so that: myhost.mycompany.mydomain becomes: myhost\.mycompany\.mydomain
3. Now record a new thread group clicking the “Start” button:
4. Once the control box shows up in
the top left corner, click to open a browser and access the ThingWorx Navigate application. Then click on “View Parts List” or some other mashup:

Thread Groups JMeter for ThingWorx
Page 16 of 47
5. Once the mashup loads, search using a string and/or wildcard, or click on one of the recent results if any exist:
6. Wait for the mashup to fully load with the details on that part or assembly, and then click “Stop” in the recording controller window:
Thread Groups JMeter for ThingWorx
Page 17 of 47
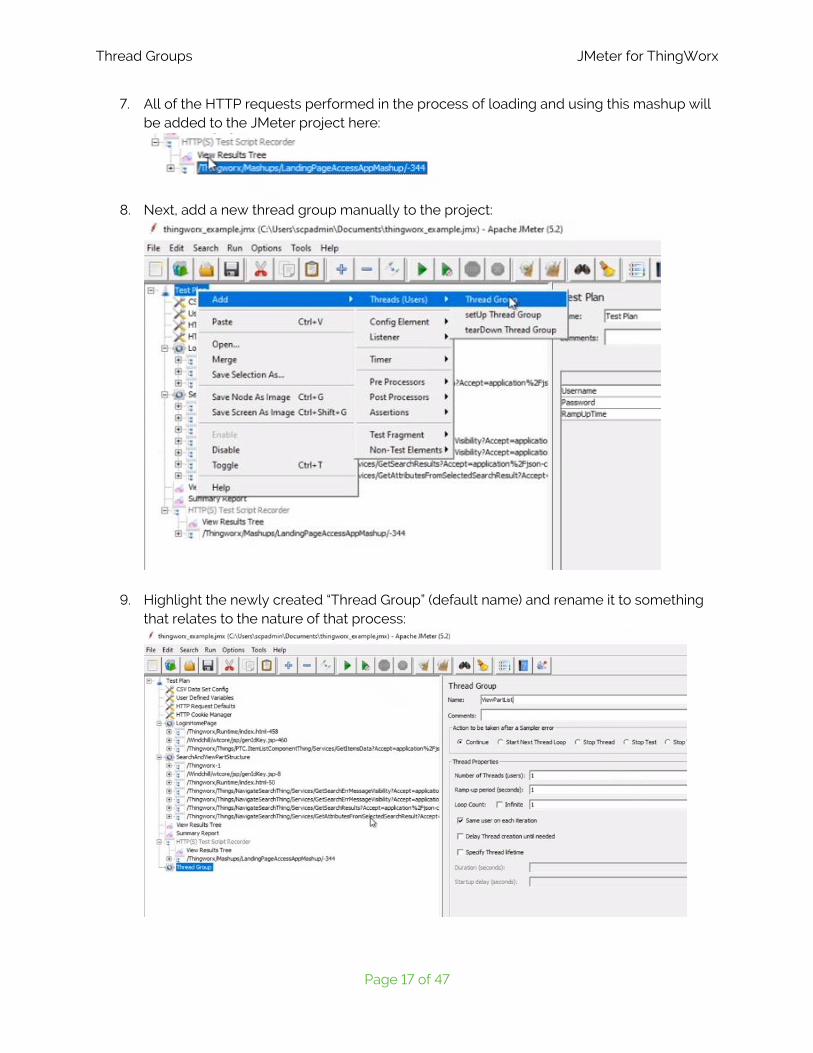
7. All of the HTTP requests performed in the process of loading and using this mashup will be added to the JMeter project here:
8. Next, add a new thread group manually to the project:
9. Highlight the newly created “Thread Group” (default name) and rename it to something that relates to the nature of that process:

Thread Groups JMeter for ThingWorx
Page 18 of 47
10. Drag and drop the new collection of requests so that it is considered a part of the new thread group:
11. Then drag the whole group up so that it is next to the other thread groups in the test:
12. In more complex projects, different thread groups may be added at different times, and each time, the service calls are all assigned an index (at the end of the request URL, for example: <request>-344). These indexes may not be unique depending on how and when the thread groups were created, especially in more complex tests. The easiest way to fix this issue is save the test from the JMeter GUI, then open the JMX file in a text editor and perform a find and replace within the

Thread Groups JMeter for ThingWorx
Page 19 of 47
relevant section of text. This is usually done using a regular expression for the number. For example, if the request name indexes are numbered -500 through -525, a regular expression to increase them to -700 through -725 would be (in Notepad++):
Find: -5([0-9])([0-9])
Replace: -7\1\2
13. Note that if you do not use a Request Filter, sometimes the recorder will log URLs that are not part of the target application, like these “generate” samplers. These URLs are typically happening in the background of the browser to track performance, security and errors. These can be deleted:
14. At other times, you will be repeating steps that are already part of another thread group, for example: logging in. This genidkey is a part of the login, as you can see if you look back at the login thread group. Because logging in is only necessary once, and it is assumed to be complete by the time the test starts on the second thread group, this entire section can be deleted.
15. To see for sure if a request can be removed because it is called in a previous thread group, do a non-case-sensitive search for the name of the request.
Thread Groups JMeter for ThingWorx
Page 20 of 47
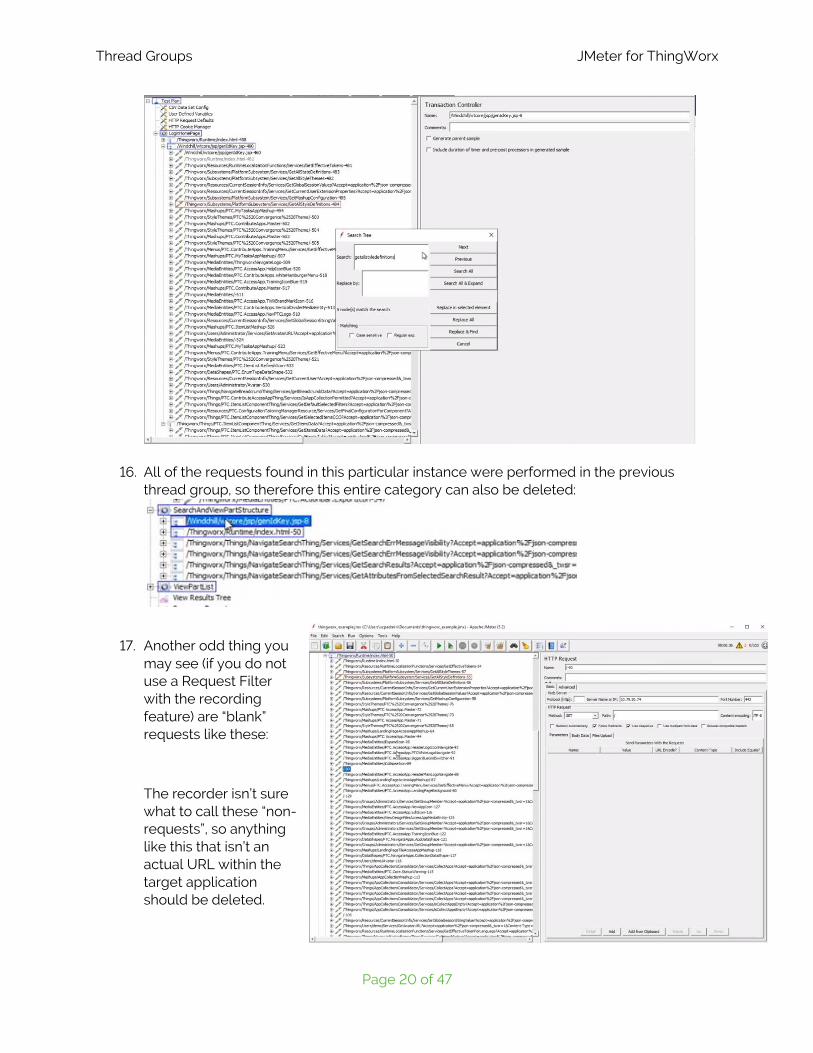
16. All of the requests found in this particular instance were performed in the previous thread group, so therefore this entire category can also be deleted:
17. Another odd thing you may see (if you do not use a Request Filter with the recording feature) are “blank” requests like these:
The recorder isn’t sure what to call these “non-requests”, so anything like this that isn’t an actual URL within the target application should be deleted.

Thread Groups JMeter for ThingWorx
Page 21 of 47
18. Static downloads should be disabled or deleted from scale testing since they are usually cached by the user browser client. In this ThingWorx example, there are static “MediaEntites” which can be deleted or disabled:
Within the JMeter client there is no good way to highlight and reset them all at once, unfortunately. The easiest way to remove all of these at once is to open the JMX file in a text editor and use regex expressions for search and replace “enabled=true” with “enabled=false”.

Thread Groups JMeter for ThingWorx
Page 22 of 47
Most text editors have examples on how to use regular expressions within their Help topics. The above example is for Notepad++.

Parameterization in JMeter Tests JMeter for ThingWorx
Page 23 of 47
Parameterization in JMeter Tests Parameterization is usually the part of creating a JMeter test that takes the most effort and knowledge. Some requests will require the same information for every thread, information which can therefore be defined statically within the JMeter element rather than being parameterized. Some values used within the JMeter test script can be parameterized as inputs in the top level of the test controller, for example: Duration, RampUp time, ApplicationHost, ApplicationPort.
Other values may be unique to only one thread group and could be defined in a User Defined Variables element within that group controller. The value(s) used within a request can also be determined on the fly by the results of earlier requests within a thread group. These request results typically must be post-processed and parameterized for later thread elements to function correctly.
The highest level values that are unique to each thread should be inputs from a CSV file that are passed into the threads as parameters, for example Username and Password. Data used within the test is usually parameterized in order to better emulate real world application use by multiple users. In the following example, we will parameterize the number of users for each thread group by adding a user- defined variable.
Tutorial: Parameterizing the Thread Groups
1. Start by selecting the new thread group and parametrizing the number of threads (i.e. the number of users accessing this mashup at a time during the test). The way to enter a variable is with syntax like this: $(searchandviewpartstructure_threads)
2. In this case, make this a user defined variable:
Parameterization in JMeter Tests JMeter for ThingWorx
Page 24 of 47
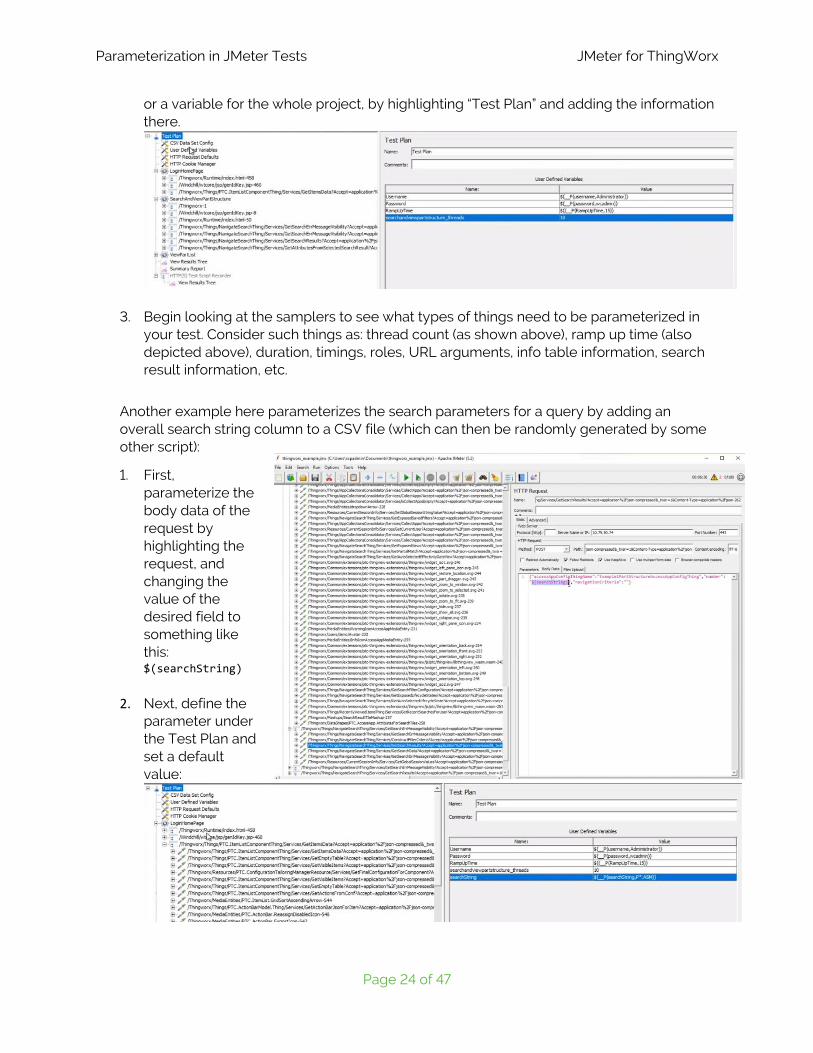
or a variable for the whole project, by highlighting “Test Plan” and adding the information there.
3. Begin looking at the samplers to see what types of things need to be parameterized in your test. Consider such things as: thread count (as shown above), ramp up time (also depicted above), duration, timings, roles, URL arguments, info table information, search result information, etc.
Another example here parameterizes the search parameters for a query by adding an overall search string column to a CSV file (which can then be randomly generated by some other script):
1. First, parameterize the body data of the request by highlighting the request, and changing the value of the desired field to something like this: $(searchString)
2. Next, define the parameter under the Test Plan and set a default value:

Parameterization in JMeter Tests JMeter for ThingWorx
Page 25 of 47
3. Now define the searchString column again as part of the CSV Data Set:
Now it can be varied simply by providing different pseudo-random values with wildcards and/or known values in the CSV file.
Removing extraneous requests from thread groups reduces the overall ambiguity of which groups represent which processes or mashup calls. Parameterizing individual requests is typically necessary in creating a real replica of user load, and things like Windchill URL and hostname, search parameters and part IDs, timings, durations, offsets, anything at all that influence the results of the test, should not be hard-coded. It is better to create variables for these things to ensure that all of the various simulated activities are configured in the exact same way every time. That way, the system can be tested again and again under various strains and loads until the capabilities of the application are verified.

Post Processors and Extractors JMeter for ThingWorx
Page 26 of 47
Post Processors and Extractors Most JMeter load tests become more complex when the results of one request are sent as parameters into later requests. This is done in JMeter by using Post Processors (Extractors), tools which facilitate extracting information out of the request results so it can be assigned to JMeter parameters.
There are many different types of extractors which can process the results of previous requests:
• CSS Selector Extractor – commonly used extractor for values returned as html attributes • JSON Extractor – processes JSON objects using regular expressions • BeanShell Post Processor –facilitates using code scripts to process return text • Regular Expression Extractor –support for use of regular expressions on request results
The JSON Extractor can be used to find and store information like the partOID number for a Windchill part as a parameter in JMeter, which can then be used to build more realistic workflows within the JMeter test. The example below steps you through setting up a JSON Post Processor.
Tutorial: Adding JSON and Regex Extractors
1. Start by right-clicking the request that contains the results of our search. Then click “Add” > “Post Processors”> “JSON Extractor”, as shown in the image below:
Post Processors and Extractors JMeter for ThingWorx
Page 27 of 47
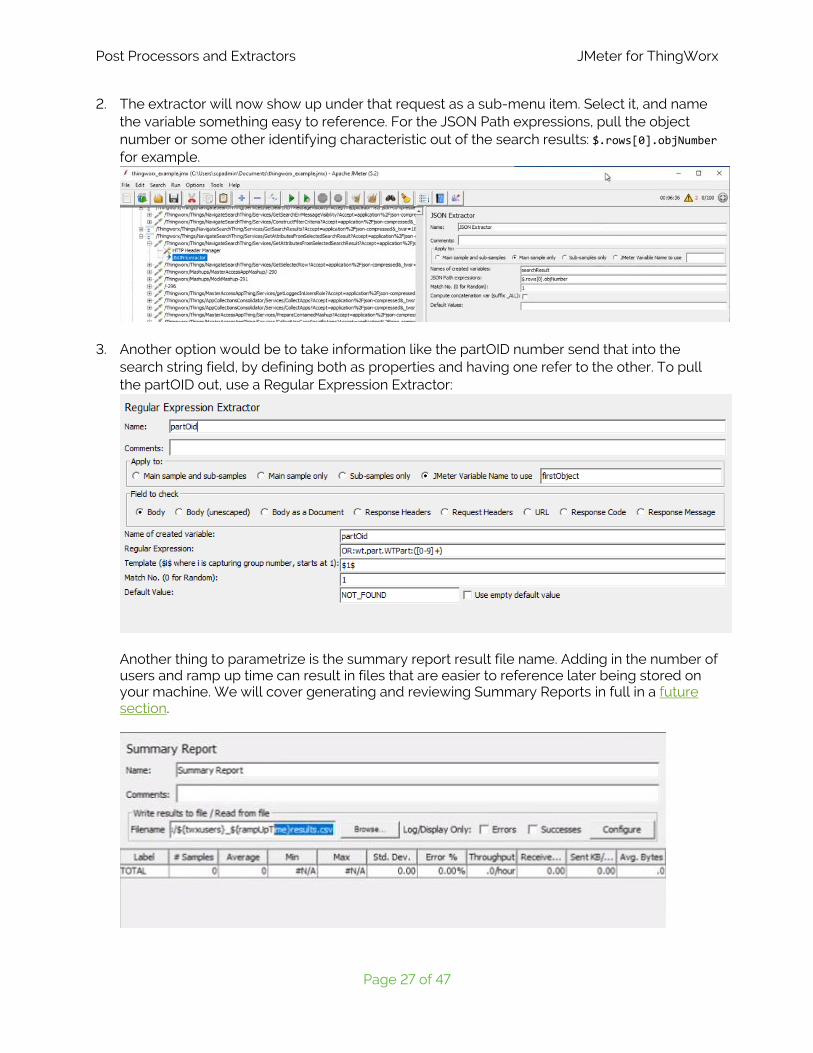
2. The extractor will now show up under that request as a sub-menu item. Select it, and name the variable something easy to reference. For the JSON Path expressions, pull the object number or some other identifying characteristic out of the search results: $.rows[0].objNumber for example.
3. Another option would be to take information like the partOID number send that into the search string field, by defining both as properties and having one refer to the other. To pull the partOID out, use a Regular Expression Extractor:
Another thing to parametrize is the summary report result file name. Adding in the number of users and ramp up time can result in files that are easier to reference later being stored on your machine. We will cover generating and reviewing Summary Reports in full in a future section.

Distributed Testing JMeter for ThingWorx
Page 28 of 47
Distributed Testing One key aspect of a proper JMeter load test is distributed or remote testing, i.e. making use of more than one JMeter client at a time to simulate the user load on the Application server. There are many reasons to make use of a network of clients such as this, like mimicking cross-region user access to the Foundation server, simulating different levels of latency for different users, and increasing the overall number of users which can contribute to the load test, while minimizing the performance cost of hosting that many threads on any single server.
A single JMeter client has a practical limit of 150-250 threads across all groups and requires about 1 CPU and 8 GB of RAM. After this point, the amount of garbage collection and other processing there is for each client to do is substantial. As the client processes its own data and sends requests to the Application server at the same time, there are diminishing returns, and the responses begin to take longer (or errors start occurring) simply because of resource starvation within the client process rather than on the Application server. Therefore, distributed testing is required for most customers doing larger load tests using JMeter. Many applications will have more than a few hundred users and/or will have users accessing the system from a variety of regions and networks, each of which could have significantly different network latency. So, in order to work with the limitations of the JMeter executable and address regional concerns, distributed or remote testing is typically required for almost all of PTC’s customers who scale test with JMeter.
With a simple (monolithic) distributed test, all of the JMeter clients are located on the same host and share an IP address, but each must be configured with a unique RMI port to connect to the controlling process. If these are located on a VM, then the resource specifications can merely be increased and the VM sized larger as necessary to ensure the network of JMeter clients runs as expected. Each JMeter client requires around 8 GB for its heap size and 1 CPU (with some additional resources for the host operating system).
Multi-hosted testing becomes the required option when limited by physical hardware (or a relatively small VM hardware host). If there are only 4-core, 32-GB machines, then plan for a machine per every 3 JMeter clients. If simulating thousands of users, this could mean half a dozen machines or more are required, which can still sometimes work out to be more cost efficient than one large, 256 GB, VM hosted in the cloud. Using many hosts in physical locations can also simulate regions with different network characteristics.
Figure 1 -Remote Testing configuration in which the main JMeter client is located at one IP address, controlling the rest as they step through their own copies of the JMeter tests, based on their own unique data files as necessary, to simulate a user load across a network, a series of regions, or simply across many machines if limited by the size of the physical hardware [image citation].
Distributed Testing JMeter for ThingWorx
Page 29 of 47
A tutorial for distributed testing across one host is shown here. For more information, see the Apache web articles on each topic: Remote Testing and Distributed Testing Step by Step.
Tutorial: Setting Up Distributed Testing on One Host
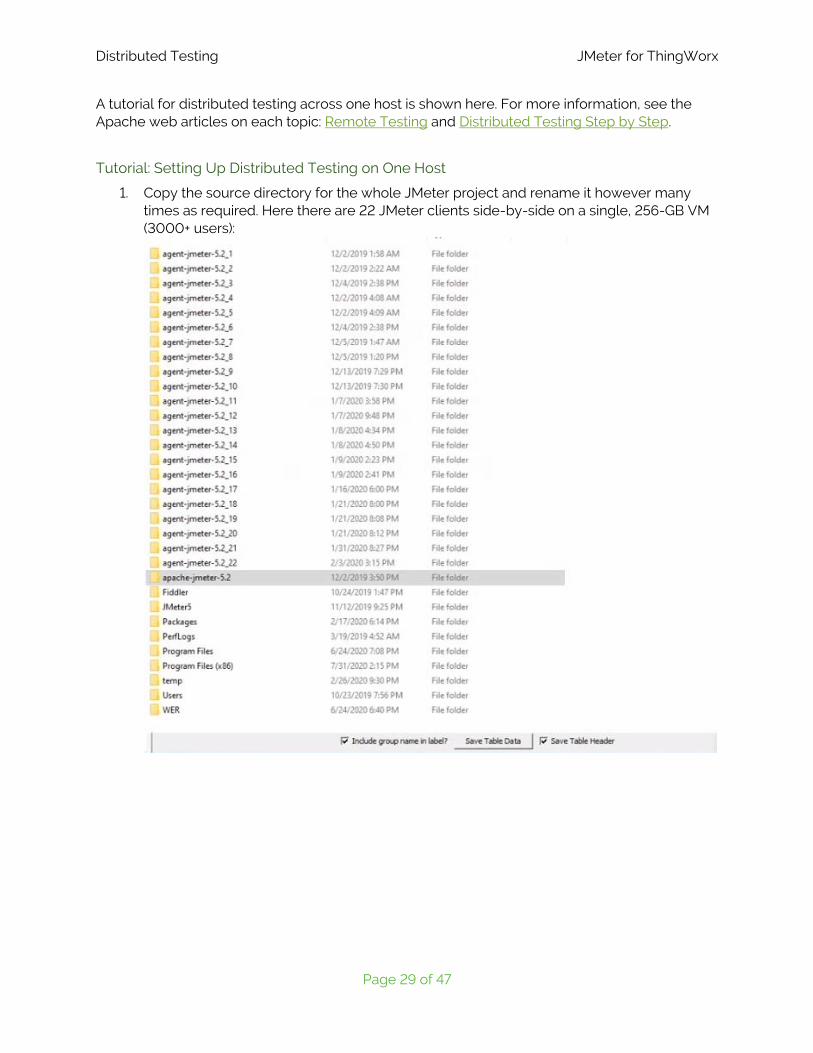
1. Copy the source directory for the whole JMeter project and rename it however many times as required. Here there are 22 JMeter clients side-by-side on a single, 256-GB VM (3000+ users):
Distributed Testing JMeter for ThingWorx
Page 30 of 47
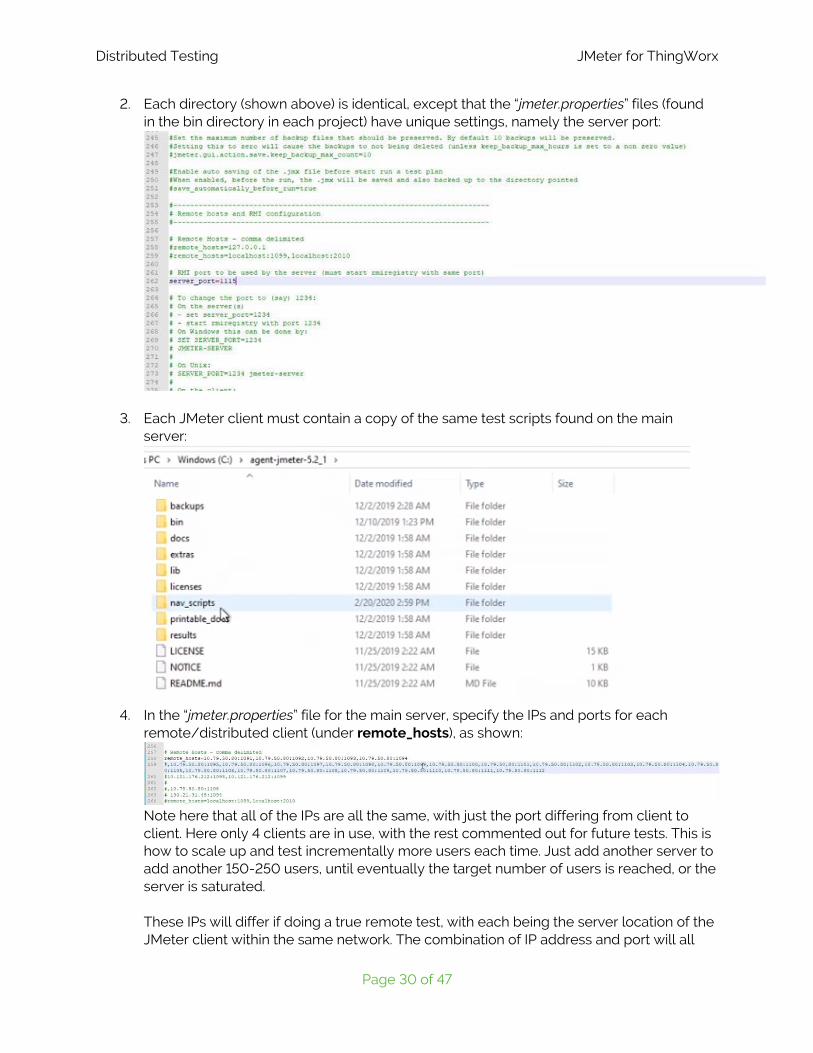
2. Each directory (shown above) is identical, except that the “jmeter.properties” files (found in the bin directory in each project) have unique settings, namely the server port:
3. Each JMeter client must contain a copy of the same test scripts found on the main server:
4. In the “jmeter.properties” file for the main server, specify the IPs and ports for each
remote/distributed client (under remote_hosts), as shown:
Note here that all of the IPs are all the same, with just the port differing from client to client. Here only 4 clients are in use, with the rest commented out for future tests. This is how to scale up and test incrementally more users each time. Just add another server to add another 150-250 users, until eventually the target number of users is reached, or the server is saturated. These IPs will differ if doing a true remote test, with each being the server location of the JMeter client within the same network. The combination of IP address and port will all

Distributed Testing JMeter for ThingWorx
Page 31 of 47
still need to be unique, and communication between the overall jmeter controller and the clients over the RMI ports needs to be allowed by the network/firewalls.
5. Also note that the number of users is set using the parameter under “Test Plan” which was set-up last time. This value represents the number of users by specifying the number of threads per thread group, and it can remain the same for every client or vary accordingly, if for instance one region is smaller than another. The “Test Plan” parameters are shown here:
6. To optionally start all of the clients at once in preparation for test execution, create a basic batch or shell script which goes to the bin directory of each agent and calls the start command: “jmeter-server”. In this image from a Windows JMeter host, only the first few agents are in use, but removing the “rem” to uncomment the other start command lines in this file would add more servers to be started. Note how the Java parameter for java.rmi.server.hostname must match the main JMeter client network configuration here for them to connect (see Apache links above for more information). This will start each of them in their own CMD window, which once closed, will terminate the JMeter client processes.
Distributed Testing JMeter for ThingWorx
Page 32 of 47
7. Parameter like rampUp time within the main test script will scale with the number of client processes. For example, 100 users and 300 seconds rampUp with 4 clients results in 400 overall user threads that are all logged in after 300 seconds.
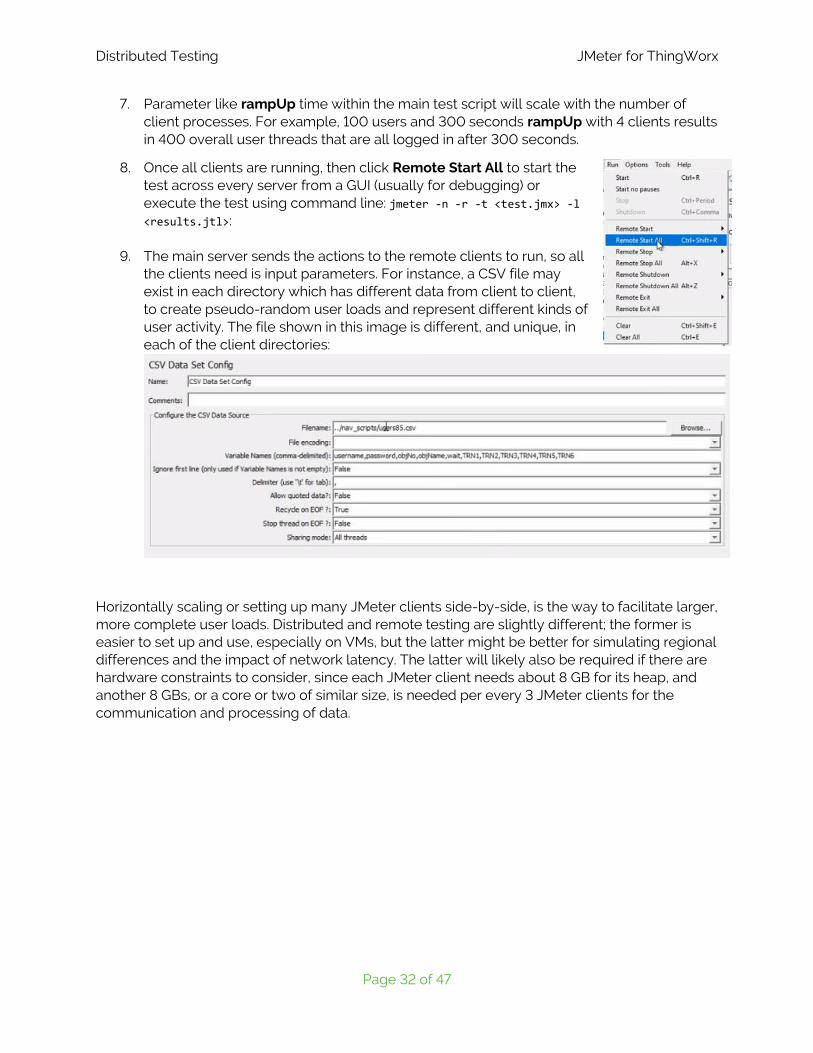
8. Once all clients are running, then click Remote Start All to start the test across every server from a GUI (usually for debugging) or execute the test using command line: jmeter -n -r -t <test.jmx> -l <results.jtl>:
9. The main server sends the actions to the remote clients to run, so all the clients need is input parameters. For instance, a CSV file may exist in each directory which has different data from client to client, to create pseudo-random user loads and represent different kinds of user activity. The file shown in this image is different, and unique, in each of the client directories:
Horizontally scaling or setting up many JMeter clients side-by-side, is the way to facilitate larger, more complete user loads. Distributed and remote testing are slightly different; the former is easier to set up and use, especially on VMs, but the latter might be better for simulating regional differences and the impact of network latency. The latter will likely also be required if there are hardware constraints to consider, since each JMeter client needs about 8 GB for its heap, and another 8 GBs, or a core or two of similar size, is needed per every 3 JMeter clients for the communication and processing of data.

Client-Side Reports in JMeter JMeter for ThingWorx
Page 33 of 47
Client-Side Reports in JMeter Creating reports for the client-side data is very simple using JMeter, both from the command line and within the UI (as shown in the tutorial below). These reports have graphical displays of response times, information about the number and type of response errors, and other criteria of performance used to gauge the success or failure of a load test. Follow these steps to generate an index file, which when opened in your browser of choice, will show all of the relevant JMeter data.
Tutorial: Creating JMeter Reports
1. Create an empty directory in which to store reports:
2. Start the JMeter test with these options, or run these commands after the fact, to generate the HTML report:
a. Once the test completes, use: jmeter -g <outputfile.jtl/csv> -o <path to output folder for html report>
b. To start a test correctly for report generation, use this command: jmeter -n -t <test JMX file> -l <outputfile.jtl/csv> -e -o <Path to output folder>
c. Running the above commands will generate these files:
3. When the test is complete, the many JMeter client consoles will look like this:
4. Go ahead and close the windows to terminate once they are finished. Optionally you can run multiple tests sequentially using the same jmeter-server windows.
Client-Side Reports in JMeter JMeter for ThingWorx
Page 34 of 47
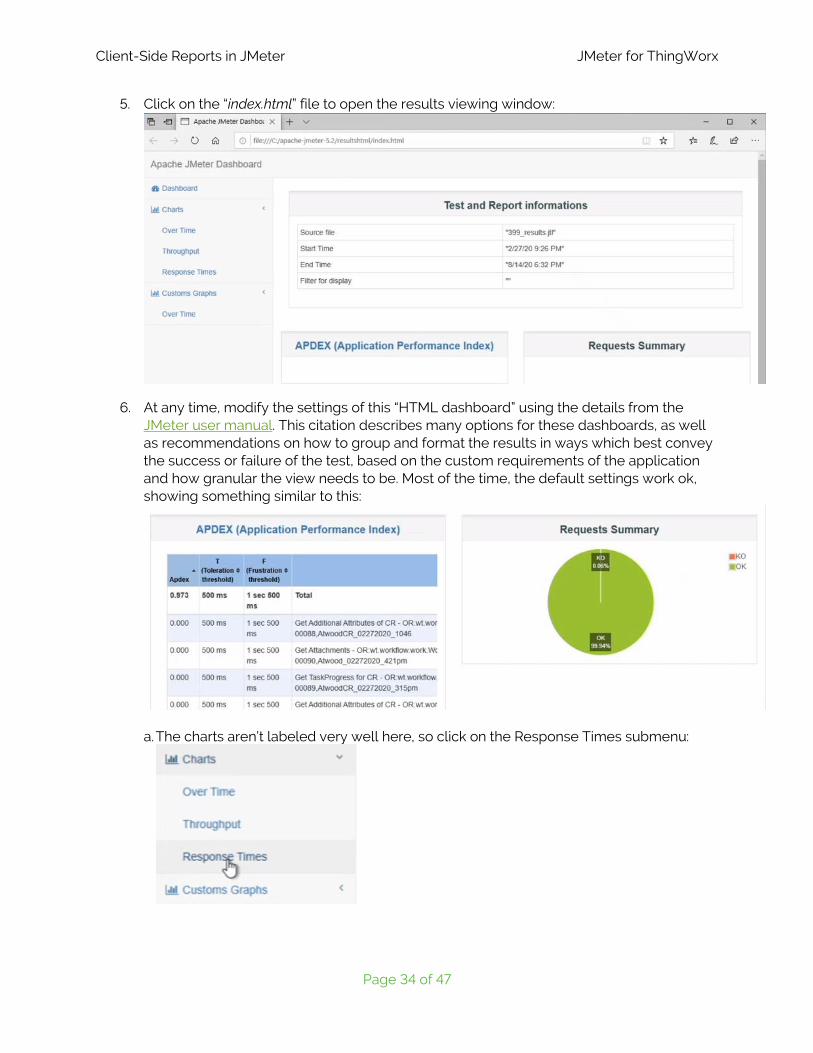
5. Click on the “index.html” file to open the results viewing window:
6. At any time, modify the settings of this “HTML dashboard” using the details from the JMeter user manual. This citation describes many options for these dashboards, as well as recommendations on how to group and format the results in ways which best convey the success or failure of the test, based on the custom requirements of the application and how granular the view needs to be. Most of the time, the default settings work ok, showing something similar to this:
a. The charts aren’t labeled very well here, so click on the Response Times submenu:

Client-Side Reports in JMeter JMeter for ThingWorx
Page 35 of 47
This page may take some time to render if there is a lot of data.
b. Next, scroll down to see all the requests that occurred and sort them by how long they took to complete. Anything which took over 5 seconds (or more depending on what is expected) should be investigated as part of the post-test analysis. Does something need to be tuned or optimized? This is how to tell which request is holding things up for your customers.
c. There is also a chart that shows the overview, grouping the response times by how long they took to demonstrate the health of the system more concretely. Typically, the bars look something like this:
This represents expected behavior, where most of the requests are quite fast, and then there are a few that had errors or took a bit longer. This is pretty typical for web activity.

Client-Side Reports in JMeter JMeter for ThingWorx
Page 36 of 47
7. You can also generate the report through the main JMeter client:
a. Give it a results file and an output directory to generate the same index file:
8. There are log files in each of the JMeter client directories called “jmeter-server.log”:
a. These files may show the wrong timezone, but the elapsed times are correct, and
they will show when the JMeter clients started, how many threads they ran, which servers were which, and if there were any errors. Not all errors will mean a failed test, so review anything that appears and determine what is expected.
b. Consider designing a batch script to gather all of these logs together, or even analyze them automatically to extract only relevant information.
Generating and reviewing reports within JMeter is straight-forward and easily customizable. Continue on to the next section to see how to monitor the system itself using an external tool like DynaTrace.
Server-Side Results in DynaTrace JMeter for ThingWorx
Page 37 of 47
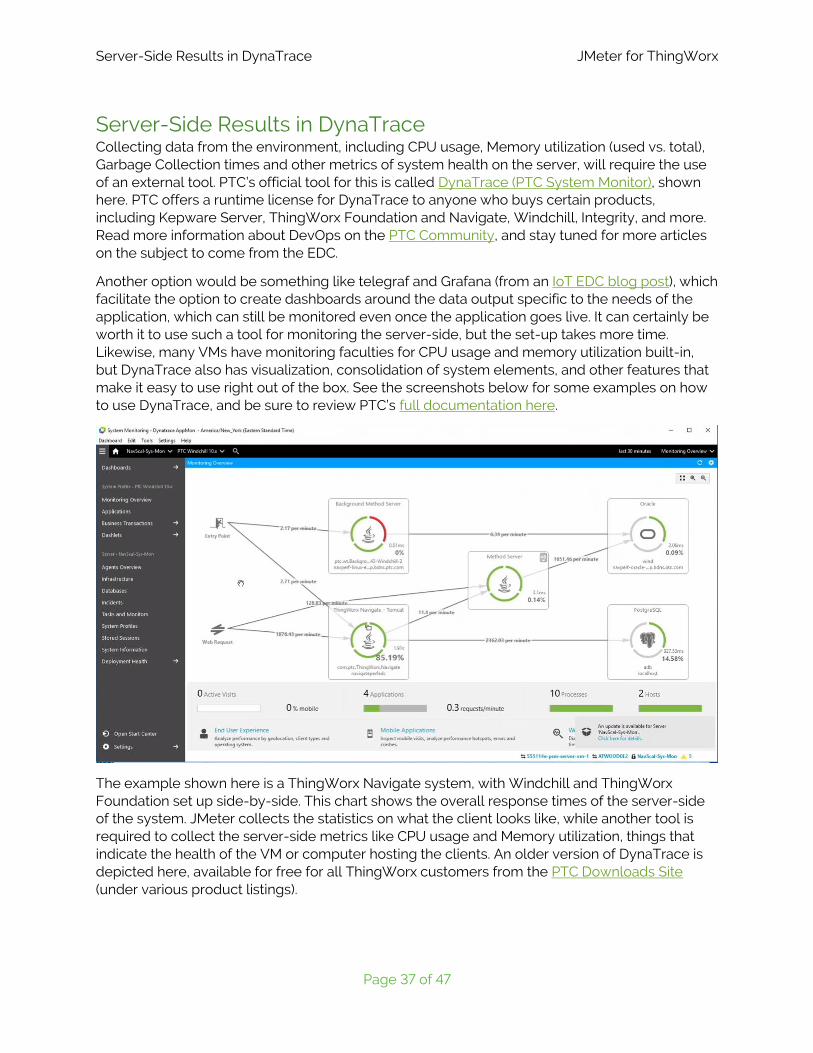
Server-Side Results in DynaTrace Collecting data from the environment, including CPU usage, Memory utilization (used vs. total), Garbage Collection times and other metrics of system health on the server, will require the use of an external tool. PTC’s official tool for this is called DynaTrace (PTC System Monitor), shown here. PTC offers a runtime license for DynaTrace to anyone who buys certain products, including Kepware Server, ThingWorx Foundation and Navigate, Windchill, Integrity, and more. Read more information about DevOps on the PTC Community, and stay tuned for more articles on the subject to come from the EDC.
Another option would be something like telegraf and Grafana (from an IoT EDC blog post), which facilitate the option to create dashboards around the data output specific to the needs of the application, which can still be monitored even once the application goes live. It can certainly be worth it to use such a tool for monitoring the server-side, but the set-up takes more time. Likewise, many VMs have monitoring faculties for CPU usage and memory utilization built-in, but DynaTrace also has visualization, consolidation of system elements, and other features that make it easy to use right out of the box. See the screenshots below for some examples on how to use DynaTrace, and be sure to review PTC’s full documentation here.
The example shown here is a ThingWorx Navigate system, with Windchill and ThingWorx Foundation set up side-by-side. This chart shows the overall response times of the server-side of the system. JMeter collects the statistics on what the client looks like, while another tool is required to collect the server-side metrics like CPU usage and Memory utilization, things that indicate the health of the VM or computer hosting the clients. An older version of DynaTrace is depicted here, available for free for all ThingWorx customers from the PTC Downloads Site (under various product listings).

Server-Side Results in DynaTrace JMeter for ThingWorx
Page 38 of 47
In DynaTrace, you can build new dashboards using PurePaths:
You can also look at the response times for each service but be sure to change the response limit to a large number so that all the results are returned.
Changing the response limit to a large number to ensure all of the results show in the PurePaths dashboard.
Server-Side Results in DynaTrace JMeter for ThingWorx
Page 39 of 47
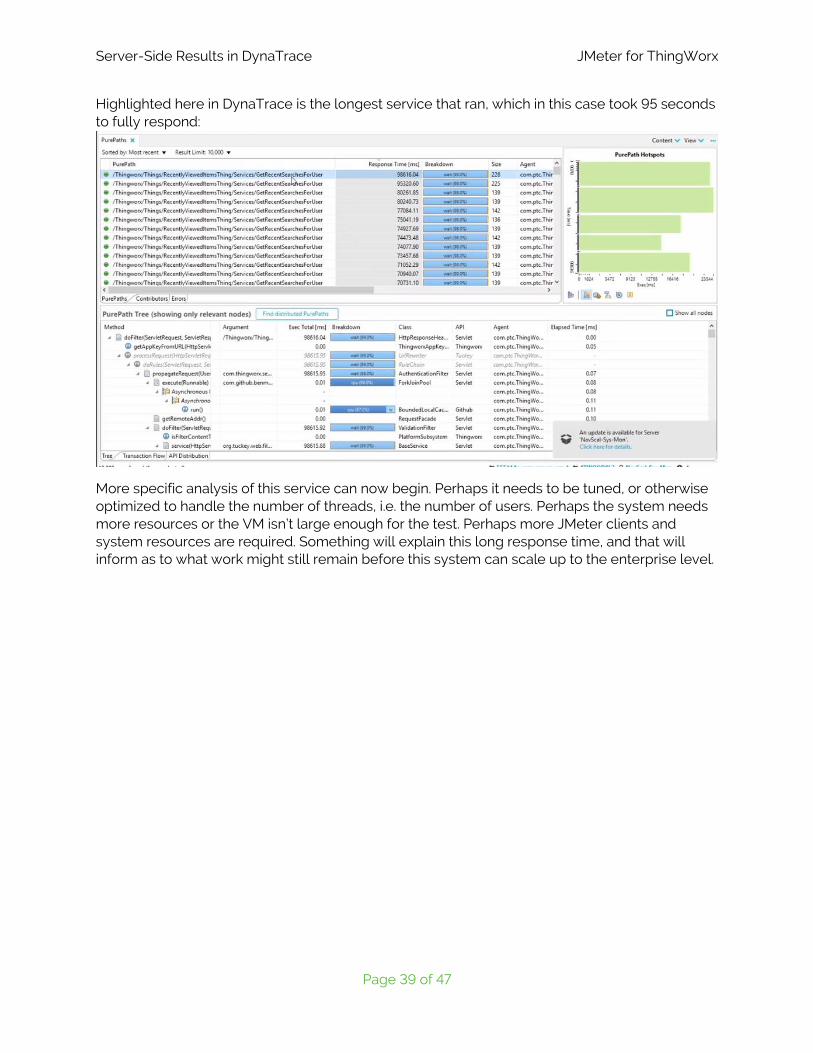
Highlighted here in DynaTrace is the longest service that ran, which in this case took 95 seconds to fully respond:
More specific analysis of this service can now begin. Perhaps it needs to be tuned, or otherwise optimized to handle the number of threads, i.e. the number of users. Perhaps the system needs more resources or the VM isn’t large enough for the test. Perhaps more JMeter clients and system resources are required. Something will explain this long response time, and that will inform as to what work might still remain before this system can scale up to the enterprise level.

How to Use the Test Results JMeter for ThingWorx
Page 40 of 47
How to Use the Test Results Load Testing often means scaling the test up a little more each time until the system eventually breaks, or the target performance is reached. Within JMeter, this won’t mean increasing the overall number of threads per one JMeter client, but instead, scaling horizontally to other JMeter clients (as covered in a previous section). Now that the remote or distributed clients are configured and the test running, how do we know when the test is beginning to fail?
It turns out that this answer is not a simple one. Which results are considered desirable will vary from one customer to the next based on many factors, and analyzing the test results is a massive topic all on its own. However, there is one thing that any customer would care to review, and that is the response time overview chart found within the JMeter reports. This chart can be used to compare the performance of the majority of threads against a baseline, indicating the point at which the test begins to fail, i.e. the point at which the limits of the system are reached.
The easiest way to determine a good standard response time for a load test, a baseline, is to start with a single JMeter client and record the response times for just 1-5 threads. You can record the response times for individual requests, particularly queries and other services with expected long response times, or the average response times across all requests or groups of requests, if the performance of some mashups are more important than others.
This approach is better than relying on the response times seen in a browser because HTML pages load differently when rendered in a browser, with differing graphical resource requirements than what is requested in JMeter. Note that some customers will also manually record response times within a separate browser-based test scenario during load testing as either a sanity check or as part of their overall benchmarking in order to further validate the scalability of the application, but this wouldn’t involve JMeter given that browsers load things differently and cross-comparison is a bad idea.
Once the baseline response times are established, start increasing the thread counts across the many JMeter clients until you see the response times go up on average. PTC’s standard criteria for load testing is exceeded when the average response times are roughly doubled, or when the system seems overwhelmed with the user load on the server side (which is what to look out for in DynaTrace or the external system monitor). At this point, the application is said to have reached a bottleneck, which could be a simple tuning problem, or it could be saturated by resource requirements. Either way, the bottleneck is proof that the system can’t take any more threads without users beginning to notice and the response times approaching an unreasonable delay.
Other criteria can be used as well, say if any one thread takes more than 5 seconds to respond. Also ensure there are no unexpected errors, as gateway errors represent failed tests too. Sometimes there will be errors even when the test is successful, though, so consider monitoring the error percentage, a column in the Summary Report tab of JMeter, to see what is normal. The throughput column may also be something to monitor. Many watch for increases in throughput as the thread count increases to ensure there is no degradation in performance (which may indicate hardware or sizing constraints).
How to Use the Test Results JMeter for ThingWorx
Page 41 of 47
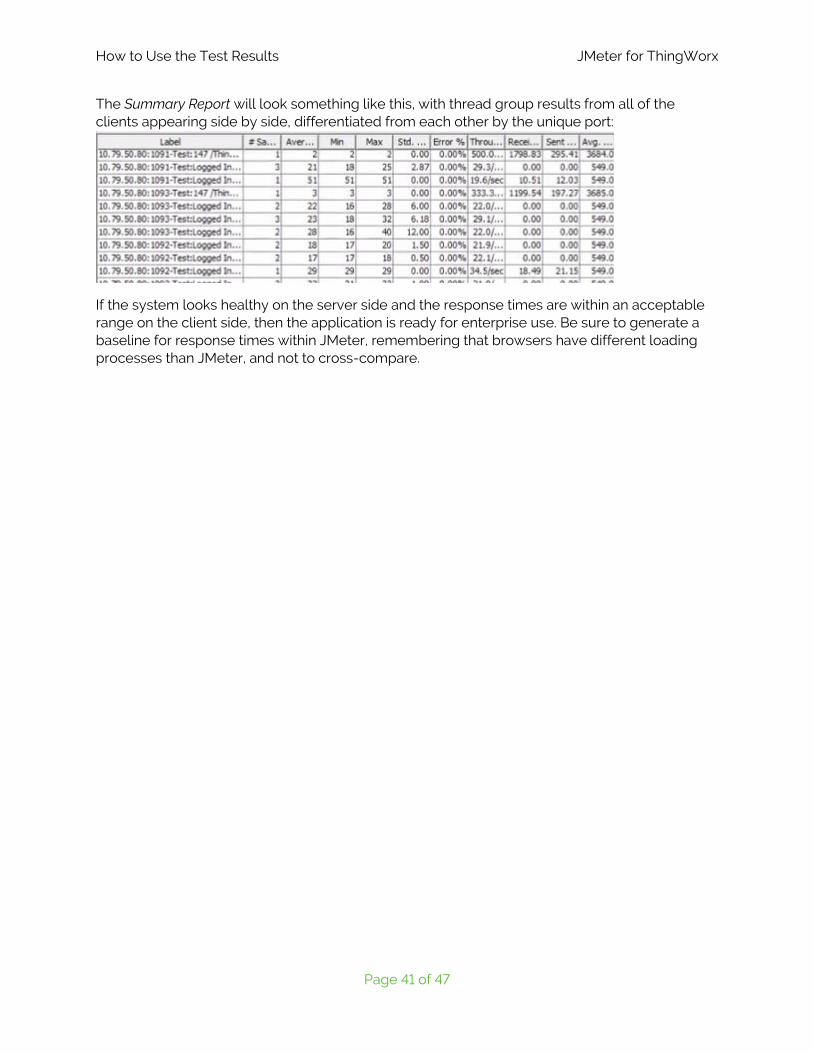
The Summary Report will look something like this, with thread group results from all of the clients appearing side by side, differentiated from each other by the unique port:
If the system looks healthy on the server side and the response times are within an acceptable range on the client side, then the application is ready for enterprise use. Be sure to generate a baseline for response times within JMeter, remembering that browsers have different loading processes than JMeter, and not to cross-compare.

Conclusion JMeter for ThingWorx
Page 42 of 47
Conclusion Load testing is a critical part of the development lifecycle in any application, and ThingWorx is no exception. Any further questions about the capabilities of JMeter not covered here, can be answered by the whole JMeter user manual, found on the Apache website.
Proper load tests can become quite complex, as shown here in an example of one tool PTC uses for internal QA of a ThingWorx Navigate application (specifically its built-in mashups):
Something similar to this tool may eventually be released by PTC, but in the meantime, feel free to use the tutorials above to create scripts of your own. Any issues building your custom load tests in JMeter can be discussed on the PTC Community.

Appendix I: JMeter Best Practice Tips JMeter for ThingWorx
Page 43 of 47
Appendix I: JMeter Best Practice Tips
➢ Use Distributed Testing o As already mentioned in a previous section, each JMeter client can only handle
about 150-250 threads depending on the complexity of the tests, and each client will need around 1 CPU and up to 8 GB of RAM for the Java heap.
o Some test plans will run with fewer host resources, so resizing the test client VM up or down is often required during test development.
o Create a batch or shell script to start the multiple JMeter clients for greater ease of use.
➢ Use Non-Graphical Mode o Non-graphical mode allows the system to scale up higher; client processing
uses up resources just to keep the simulation running, but with graphical mode turned off, there is less of an impact on the response times and other results.
o Graphical mode is essentially only used for debugging.
➢ Turn off Embedded Resources o This setting reloads all of the typically cached requests over and over; there
will be far more download requests, and to the exclusion of other requests, than is helpful.
o Ensure this box is not checked, especially in the HTTP Requests Defaults element:
o Browser caching means that this setting doesn’t actually simulate a proper user load, given that many of the reloaded resources would not be reloaded by actual users.
o Use this incrementally, for one or two HTTP requests only, if there is a reason why those requests might need to download fresh images, scripts, or other resources with each call; for instance, simulate page timeouts using this once per hour or something similar.
o Using this across the whole project will prevent it from scaling well, while not actually simulating real-world conditions.
➢ Avoid Using Listeners o For instance, the “View Results Tree”, which uses additional resources that may
impact the results in disingenuous ways, based around the needs of the clients themselves and not the actual response times of the server.
o Many listeners are only for debugging a handful of threads while designing the tests.

Appendix I: JMeter Best Practice Tips JMeter for ThingWorx
Page 44 of 47
o A list of recommended listeners for different purposes is in JMeter documentation.
o Summary Report is the only one you want enabled, as that exports the results as a csv or similarly formatted file, which can then be used to build reports.
➢ JMeter CAN handle SSO o JMeter can authenticate into and test an SSO-enabled system.
o Sometimes the SSO configuration is essential for customers, and they may be quick to assume therefore that they cannot use JMeter, but that’s not entirely true.
o Some external tools that might help with this are BlazeMeter (mentioned again in just a moment) and Fiddler, a good tool for decoding what data a particular SSO setup is exchanging during the authentication process.
➢ Use Logic Controllers for Parametrization o Parametrization is critical to mirroring a proper user load, and allowing different
data sets to be queried or created; the load should seem organic, random in the right ways, with actions occurring at random times, not predictable times, to prevent seeing artificial peaks of usage that don’t represent real usage of the Foundation server.
o Random order controllers direct the threads down different paths based on random dice rolls, allowing for a randomized collection of user activity each time, not something that has to be regenerated like a set of Boolean values that is specified in an input CSV and used to navigate a series of true or false switches.
o Switches just look for an environment variable to be either 1 or 0, and when it hits a switch that’s a 1, it triggers the switch below, running them in the order given under the transaction controller that goes with the switch.

Appendix I: JMeter Best Practice Tips JMeter for ThingWorx
Page 45 of 47
o In this image, the 1’s and 0’s are given in the CSV input file; randomizing that input file therefore randomizes the execution of the switches too:
➢ Use Commercial Add-Ons o There are many external, add-on tools and plugins which enhance JMeter’s
capabilities.
o One external tool that can enhance JMeter’s capabilities is Blazemeter, which has some free and some paid options to help create better reports, removing automatically much of the “garbage” REST calls (which would otherwise need to be manually deleted), and provide more consumable test reports right out of the box.
o Other tools and plugins include: ▪ Maven ▪ Netbeans ▪ SonarQube ▪ Jenkins ▪ Autometer ▪ Gradle ▪ Amazon EC2 ▪ Lightning ▪ IntelliJ IDEA ▪ Cassandra ▪ Grafana
➢ For more best practice information, see the JMeter Best Practice Manual.

Appendix II: General Load Testing Guidelines JMeter for ThingWorx
Page 46 of 47
Appendix II: General Load Testing Guidelines ➢ Concurrency Requirements – How to Properly Estimate the Size of the Load Test
o Take a brand new ThingWorx-based app. How people will be accessing the system and how often? How many are business users? How many are engineers? What do they do?
o Many assume that every named user in the corporate LDAP will need to access to the server, often 10s of thousands of users; this generally drastically oversizes the system.
o Load testing for many thousands of users is very hard and requires a lot of set-up, tuning, and optimization to get right; so if it seems that thousands of users are expected, then validating this claim is important: most customers don’t really have that many concurrent users in an engineering system.
o Use estimates based on how many people work at which offices, which time zones those people are in, and what kinds of users they are. Do they need access to engineering data? Perhaps there are simpler mashups for them that uses less resources.
o One tool for these sorts of estimations that PTC offers is the office time zone overlap Windchill Sizing Calculator (shown here)
Figure 2 – This tool for Windchill can be helpful here too, calculating the number of users over a peak duration based on the type of the users and how many live within each region. The tool as directions to follow which make it very easy to use, and it is free to download.

Appendix II: General Load Testing Guidelines JMeter for ThingWorx
Page 47 of 47
o Other ways to estimate include:
• Analyzing the business processes, things like how long workloads typically take to complete and how many workloads are generated per day, converted into hour, minute, or second as desired for the peak duration, the length of the test.
• “Day in the Life” modelling, or considering things like “what does user X do in a day?” Maybe, user X checks out some drawings, edits them, and then checks them back in at 4:30. Maybe user Y actually digs into the underlying parts and assemblies, putting in change requests or orders throughout the day, instead of waiting for the end. Models are made based around the types of users.
o Also consider: • What are worst case scenarios? • What are the longest running activities? • What produces the largest data transfers? • What activities have large, heavy data base queries? • When is the peak overlap of usage?
o Beginning and end of day downloads and check ins? o Reports that are generated regularly? o How do these impact the foreground users?
o For a simpler estimate, start with a percentage of the named user count, anywhere from 5-15% is a good ballpark percentage.
o Don’t overestimate to feel like the application has been financially worth it; even if everyone is logged in and using it all at once, which is unlikely, load testing for every single user doesn’t take into account the fact that people pause in between clicking on things to think, type emails, get coffee, and so forth.
o Fewer people than expected are actually doing concurrent activities like loading web pages and updating data streams.
o Whenever possible, use concurrency data from existing customer systems to guide the estimate for the new system. Legacy system are great places to start.
➢ Use Grafana to monitor the system side throughout the load test, which is also required to know the test has been successful; also set up Grafana to monitor the application once it goes live, to both prevent and mitigate more rapidly any technical issues with the server.
➢ Also remember that PTC Technical Support is here to help! Provide thread dumps with an open case to any TSE, and they will help troubleshoot the tests and review any errors in the ThingWorx or Tomcat logs.