JLL 2014 Q1 Rotterdam Office Market Profile
2
* % Change for Prime Rents and Capital Values calculated using local currency Office Market Overview Q1 2014 saw a slowdown in demand over the quarter, with a quarterly take-up recorded at 21,225 sq m. Although take-up was down 43% q-o-q, it was up 183% y-o-y, strongly driven by the largest deal of the quarter in which, LyondellBasell Industries took 9,000 sq m of grade A space at Rotterdam Centre. Tenants remain focused on cost optimisation and activity driven by consolidation and flight to quality. This trend is to continue in the near term before growth picks-up and business confidence improves. The vacancy rate increased by 60 bps to 18.3%, on the back of space consolidation. Grade A office space remains scarce, but the gap was plugged to some extent with the completion of mixed use project “De Rotterdam”, adding 60,000 sq m of office space. Prime rents were pushed upwards to €210 / sq m pa. Developers and investors are now looking to upgrade office stock around the recently completed Central Train Station that connects Rotterdam to Paris and Brussels. One example is the construction of “First Rotterdam” straight across the Central Station, where Benelux law firm NautaDutilh will be moving upon completion in 2015. The overall development pipeline remains thin with just 3,100 sq m of fully pre-let space expected to complete next quarter. No completions are anticipated for the remainder of 2014. It is expected, that there will be some further upward movement in prime rents in the near term, buoyed by the delivery of new projects closer to transport hubs. Rents in the peripheral submarkets remained stable at €156/ sq. m pa. Incentives were unchanged and included 12-15 months’ rent free on a 5+5 year lease contract for prime office space and ranged between 12-20 months’ rent free for the same lease length at the overall market level. Office investment in Q1 2014 totalled € 35.3 million. Prime office yields remained unchanged at 5.75%. Figure 1: Take-up Figure 2: Supply and Vacancy Rates Figure 3: Prime Rents and Rental Growth Figure 4: Prime Yields Source all Charts: JLL 0 50 100 150 200 250 2004 2005 2006 2007 2008 2009 2010 2011 2012 2013 Q1'14 000s sqm Take Up 10yr Average 0 5 10 15 20 0 100 200 300 400 500 600 700 800 2004 2005 2006 2007 2008 2009 2010 2011 2012 2013 Q1'14 000s sqm Vacancy Total Vacancy Rate Vacancy Rate % -3 -2 -1 0 1 2 3 4 5 6 170 175 180 185 190 195 200 205 210 2004 2005 2006 2007 2008 2009 2010 2011 2012 2013 Q1'14 Rental Growth Prime Rent Prime Rent (psm pa) Annual Rental Growth* 4.50 5.00 5.50 6.00 6.50 7.00 7.50 Q4 98 Q4 99 Q4 00 Q4 01 Q4 02 Q4 03 Q4 04 Q4 05 Q4 06 Q4 07 Q4 08 Q4 09 Q4 10 Q4 11 Q4 12 Q1 14 Prime Yield 10 Yr Ave 20 Yr Ave Prime Yield (%) Rotterdam Office Market Profile - Q1 2014 EMEA Office Research 12 Month Summary Statistics Q1 14 Q-o-Q Y-o-Y Outlook Take-up (000s sqm) 21 -33.8 % 183.1 % Vacancy Rate (% ) 18.3 60 bps 170 bps Prime Rent (psm) €210 2.4 % 2.4 % 12 Month Q1 14 Q-o-Q Y-o-Y Outlook Capital Value (psm) €3652 2.4 % 2.4 % Prime Yield % 5.75 0 bps 0 bps Change* Change*
description
VDMARA2014Q2
Transcript of JLL 2014 Q1 Rotterdam Office Market Profile

* % Change for Prime Rents and Capital Values calculated using local currency
Office Market Overview
Q1 2014 saw a slowdown in demand over the quarter, with a quarterly take-up recorded at 21,225 sq m. Although take-up was down 43% q-o-q, it was up 183% y-o-y, strongly driven by the largest deal of the quarter in which, LyondellBasell Industries took 9,000 sq m of grade A space at Rotterdam Centre. Tenants remain focused on cost optimisation and activity driven by consolidation and flight to quality. This trend is to continue in the near term before growth picks-up and business confidence improves. The vacancy rate increased by 60 bps to 18.3%, on the back of space consolidation. Grade A office space remains scarce, but the gap was plugged to some extent with the completion of mixed use project “De Rotterdam”, adding 60,000 sq m of office space. Prime rents were pushed upwards to €210 / sq m pa. Developers and investors are now looking to upgrade office stock around the recently completed Central Train Station that connects Rotterdam to Paris and Brussels. One example is the construction of “First Rotterdam” straight across the Central Station, where Benelux law firm NautaDutilh will be moving upon completion in 2015. The overall development pipeline remains thin with just 3,100 sq m of fully pre-let space expected to complete next quarter. No completions are anticipated for the remainder of 2014. It is expected, that there will be some further upward movement in prime rents in the near term, buoyed by the delivery of new projects closer to transport hubs. Rents in the peripheral submarkets remained stable at €156/ sq. m pa. Incentives were unchanged and included 12-15 months’ rent free on a 5+5 year lease contract for prime office space and ranged between 12-20 months’ rent free for the same lease length at the overall market level. Office investment in Q1 2014 totalled € 35.3 million. Prime office yields remained unchanged at 5.75%.
Figure 1: Take-up
Figure 2: Supply and Vacancy Rates
Figure 3: Prime Rents and Rental Growth
Figure 4: Prime Yields
Source all Charts: JLL
050
100150200250
2004
2005
2006
2007
2008
2009
2010
2011
2012
2013
Q1'14
000s sqm
Take Up 10yr Average
0
5
10
15
20
0100200300400500600700800
2004
2005
2006
2007
2008
2009
2010
2011
2012
2013
Q1'14
000s sqm
Vacancy Total Vacancy Rate
Vacancy Rate %
-3-2-10123456
170175180185190195200205210
2004
2005
2006
2007
2008
2009
2010
2011
2012
2013
Q1'14
Rental Growth Prime Rent
Prime Rent (psm pa) Annual Rental Growth*
4.505.005.506.006.507.007.50
Q4 98
Q4 99
Q4 00
Q4 01
Q4 02
Q4 03
Q4 04
Q4 05
Q4 06
Q4 07
Q4 08
Q4 09
Q4 10
Q4 11
Q4 12
Q1 14
Prime Yield 10 Yr Ave 20 Yr Ave
Prime Yield (%)
Rotterdam Office Market Profile - Q1 2014 EMEA Office Research
12 MonthSummary Statistics Q1 14 Q-o-Q Y-o-Y Outlook
Take-up (000s sqm) 21 -33.8 % 183.1 %
Vacancy Rate (% ) 18.3 60 bps 170 bps
Prime Rent (psm) €210 2.4 % 2.4 %
12 MonthQ1 14 Q-o-Q Y-o-Y Outlook
Capital Value (psm) €3652 2.4 % 2.4 %
Prime Yield % 5.75 0 bps 0 bps
Change*
Change*
www.joneslanglasalle.eu
COPYRIGHT © JONES LANG LASALLE IP, INC. 2014. All rights reserved. No part of this publication may be reproduced or transmitted in any form or by any means without prior written consent of Jones Lang LaSalle. It is based on material that we believe to be reliable. Whilst every effort has been made to ensure its accuracy, we cannot offer any warranty that it contains no factual errors. We would like to be told of any such errors in order to correct them.
JLL Contacts
Dré van Leeuwen Head of Capital Markets Amsterdam +31 20 540 7912 [email protected]
Sven Bertens Head of Research Amsterdam +31 20 540 7926 [email protected]
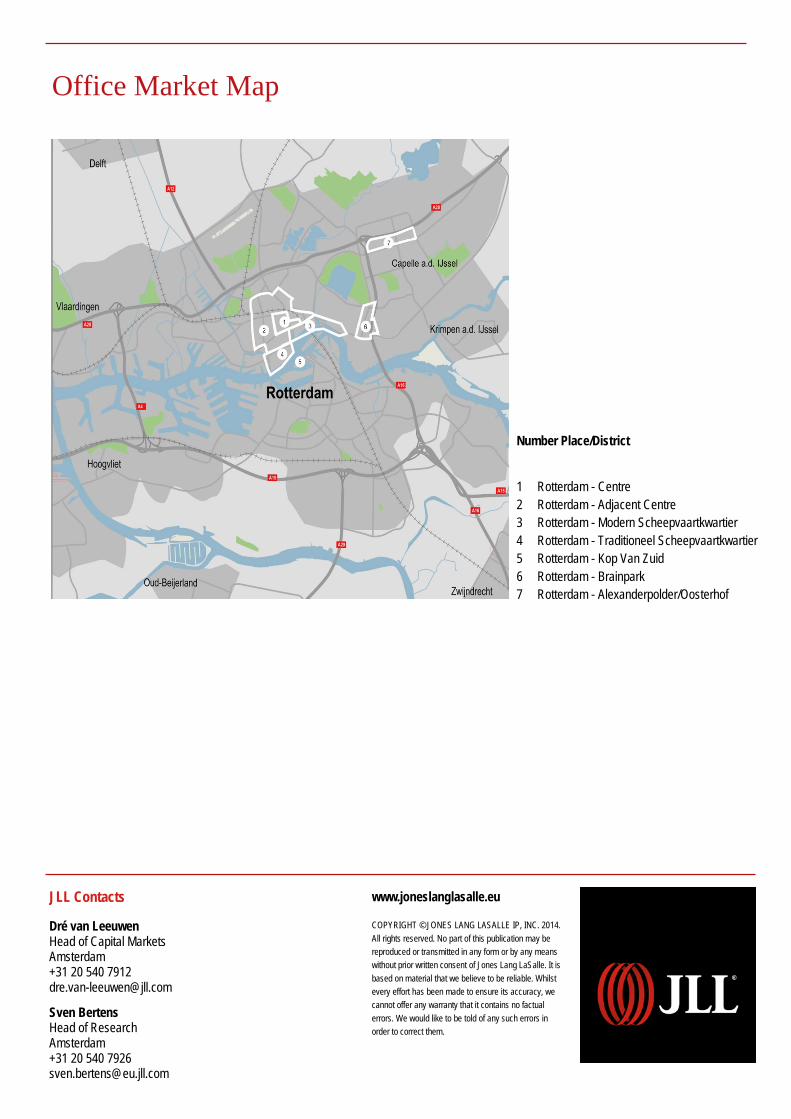
Office Market Map
Number Place/District 1 Rotterdam - Centre 2 Rotterdam - Adjacent Centre 3 Rotterdam - Modern Scheepvaartkwartier 4 Rotterdam - Traditioneel Scheepvaartkwartier 5 Rotterdam - Kop Van Zuid 6 Rotterdam - Brainpark 7 Rotterdam - Alexanderpolder/Oosterhof