JJanuary 20, 1973 - Centers for Disease Control and...
8
CENTER FOR DISEASE CONTROL ' T f t a n liU c U t u <utd U.S. DEPARTMENT OF HEALTH, EDUCATION, AND WELFARE / PUBLIC HEALTH SERVICE H Vol. 22, No. 3 M WEEKLY 1 REPORT = ;■ ft /fe = For 'AN p M Week Ending ^/ ’JJanuary 20, 1973 C L!ijnA !«tift^$^*yiCES XWo mental health administration DATE OF RELEASE: JANUARY 26. 1973 - ATLANTA, GEORGIA 30333 SOS# epidemiologic notes and reports waterborne shigella sonnei infection - iowa During November 1972, 208 cases of gastrointestinal illness occurred among 289 students and 25 staff members at a junior high school in Stockport, Iowa. Prominent symp toms included headache (77%), loose (76%) and frequent (61%) bowel movements, fever (72%), nausea (65%), abdom inal cramps (61%), chills (48%), and vomiting (44%). Bloody stools and tenesmus were infrequent. A similar illness also affected 12 of 26 visiting basketball players from 2 high schools who had participated in a scrimmage at the junior high school gymnasium on November 1 5. Epidemiologic investigation revealed that sporadic cases °f illness occurred during the 1st week of November, but that the explosive phase of the outbreak began on Novem ber 10, when 18 students and the 1st staff member became dl (Figure 1). New cases continued to occur for 1 week until CONTENTS Epidemiologic Notes and Reports Waterborne Shigella sonnei Infection — Iowa .........................21 Brill-Zlnsser Disease — V irg in ia ........................................... 22 Current Trends Influenza — United States ............................................... 22 a 2nd and larger wave of the outbreak produced 73 cases on November 16 and 17. Rectal swab specimens from 108 stu dents and 2 staff members were positive for Shigella sonnei. Between November 7 and December 4, 99 apparently secondary cases of diarrhea occurred in household contacts of the students and faculty members at the school. S. sonnei infection was documented in a few patients who submitted stool specimens. Further investigation revealed that gastrointestinal ill ness among students was significantly more frequent (p<0.02) TABLE I . CASES OF SPECIFIED NOTIFIABLE DISEASES: UNITED STATES (Cumulative totals include revised and delayed reports through previous weeks) 3rd WEEK ENDING MEDIAN 1968-1972 CUMULATIVE, FIRST 3 WEEKS DISEASE January 20, 1973 January 22, 1972 1973 1972 MEDIAN 1968-1972 Aseptic meningitis .................................................... Brucellosis Chickenpox . . . Diphtheria . . Encephalitis, primary: Arthropod-borne and unspecified ................. 70 3 5,141 3 19 4 41 2 3,185 1 17 7 41 1 2 18 7 142 4 12,015 5 37 7 125 6 8,435 5 48 12 106 4 7 53 16 Hepatitis, serum (Hepatitis B ) .............................. Hepatitis, infectious (Hepatitis A ) ...................... Malaria Measles (rubeola) .................................................... Meningococcal infections, t o ta l ............................ Civilian Military .»................................................................ Mumps Rubella (German measles) .................................... tetanus Tuberculosis, new active ....................................... tularemia Typhoid fever ............................................................. typhus, tick-borne (Rky. Mt. spotted fever) . . Venereal Diseases: 136 1,076 60S 33 32 1 2,441 403 1 584 3 3 1 211 1,075 11 714 37 36 1 2,087 526 477 4 2 1 132 1,075 36 714 51 49 2 2,528 526 2 1 3 376 2,674 6 1,599 83 77 6 4,912 873 1 1,393 7 9 2 532 3,102 152 1,913 103 99 4 6,014 1,147 1,310 8 10 5 382 3,102 143 1,913 166 157 4 6,764 1,347 2 5 15 1 Gonorrhea ............................................................. Syphilis, primary and secondary ................... Kabies in animals .................................................. 15,835 603 58 12,113 405 60 60 41,054 1,543 139 36,975 1,163 181 181 TABLE I I . NOTIFIABLE DISEASES OF LOW FREQUENCY Anthrax : .................................... Botulism: ......................... Congenital rubella syndrome: ^*prosy: .................................... J^Ptospirosis: Calif. — 1 ... . .Hague; ........................... Poliomyelitis, total: . Paralytic: ........... Psittacosis: Calif. - 1 Rabies in man: .... Trichinosis: .............. Typhus, murine: . . . Cum.
-
Upload
trinhnguyet -
Category
Documents
-
view
214 -
download
0
Transcript of JJanuary 20, 1973 - Centers for Disease Control and...
CENTER FOR DISEASE CONTROL
'T f t a n l i U c U t u
< u t d
U.S. DEPARTMENT OF HEALTH, EDUCATION, AND WELFARE / PUBLIC HEALTH SERVICE
H Vol. 22, No. 3
M WEEKLY
1 REPORT= ;■ f t / f e = For
'AN p M Week Ending^ / ’JJanuary 20, 1973
C L ! i jn A!« tift^$^*yiCES XWo m e n t a l h e a l t h a d m in is t r a t io n
DATE OF RELEASE: JANUARY 26. 1973 - ATLANTA, G EO R G IA 30333 S O S #
e p i d e m i o l o g i c n o t e s a n d r e p o r t s
w a t e r b o r n e s h i g e l l a s o n n e i i n f e c t i o n - iowa
During November 1972, 208 cases o f gastrointestinal illness occurred among 289 students and 25 staff members at a junior high school in Stockport, Iowa. Prom inent symptoms included headache (77%), loose (76%) and frequent (61%) bowel movements, fever (72%), nausea (65%), abdom inal cramps (61%), chills (48%), and vomiting (44%). Bloody stools and tenesmus were infrequent. A similar illness also affected 12 o f 26 visiting basketball players from 2 high schools who had participated in a scrimmage at the junior high school gymnasium on November 1 5.
Epidemiologic investigation revealed that sporadic cases ° f illness occurred during the 1st week o f November, but that the explosive phase o f the outbreak began on November 10, when 18 students and the 1st staff m em ber became dl (Figure 1). New cases continued to occur for 1 week until
CO NTENTS
Epidemiologic Notes and ReportsWaterborne Shigella sonnei Infection — Iowa .........................21Brill-Zlnsser Disease — V irg in ia ........................................... 22
Current TrendsInfluenza — United States ............................................... 22
a 2nd and larger wave o f the outbreak produced 73 cases on November 16 and 17. Rectal swab specimens from 108 students and 2 staff members were positive for Shigella sonnei.
Between November 7 and December 4, 99 apparently secondary cases o f diarrhea occurred in household contacts o f the students and faculty members at the school. S. sonnei infection was documented in a few patients who subm itted stool specimens.
Further investigation revealed that gastrointestinal illness among students was significantly more frequent (p<0.02)
TABLE I . CASES OF SPECIFIED NOTIFIABLE DISEASES: UNITED STATES (Cumulative totals include revised and delayed reports through previous weeks)
3rd WEEK ENDINGMEDIAN1968-1972
CUMULATIVE, FIRST 3 WEEKSDISEASE January 20,
1973January 22,
1972 1973 1972MEDIAN
1968-1972Aseptic m eningitis....................................................Brucellosis Chickenpox . . .Diphtheria . .Encephalitis, primary:
Arthropod-borne and unspecified .................
703
5,1413
194
412
3,1851
177
411
2
187
1424
12,0155
377
1256
8,4355
4812
1064
7
5316
Hepatitis, serum (Hepatitis B ) ..............................Hepatitis, infectious (Hepatitis A ) ......................MalariaMeasles (rubeola) ....................................................Meningococcal infections, t o t a l ............................
CivilianMilitary .»................................................................
MumpsRubella (German measles) ....................................tetanusTuberculosis, new active .......................................tularemiaTyphoid fever.............................................................typhus, tick-borne (Rky. Mt. spotted fever) . . Venereal Diseases:
1361,076
60S3332
12,441
4031
584331
2111,075
11714
3736
12,087
526
477421
1321,075
36714
5149
22,528
5262
13
3762,674
61,599
8377
64,912
8731
1,393792
5323,102
1521,913
10399
46,0141,147
1,3108
105
3823,102
1431,913
166157
46,7641,347
2
515
1
Gonorrhea.............................................................Syphilis, primary and secondary ...................
Kabies in animals ..................................................
15,835603
58
12,113405
60 60
41,0541,543
139
36,9751,163
181 181
TABLE I I . NOTIFIABLE DISEASES OF LOW FREQUENCY
Anthrax : ....................................Botulism: .........................Congenital rubella syndrome:^*prosy: ....................................J^Ptospirosis: Calif. — 1 . . . . .Hague; ...........................
Poliomyelitis, total: .Paralytic: ...........
Psittacosis: Calif. - 1 Rabies in man: . . . .Trichinosis: ..............Typhus, murine: . . .
Cum.
22 M orbidity and M ortality W eek ly Report JANUARY 20, 1973
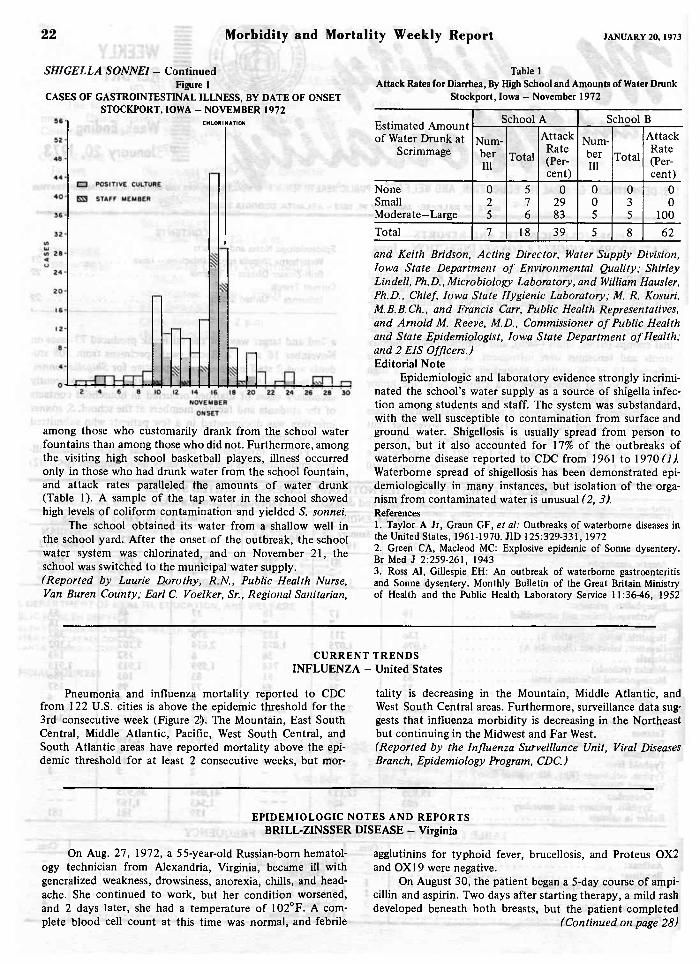
SH IGELLA S O N N E I- Continued Figure 1
CASES OF GASTROINTESTINAL ILLNESS, BY DATE OF ONSET STOCKPORT, IOWA - NOVEMBER 1972
CHLORINATION
Table 1Attack Rates for Diarrhea, By High School and Amounts of Water Drunk
Stockport, Iowa — November 1972
among those who customarily drank from the school water fountains than among those who did not. Furtherm ore, among the visiting high school basketball players, illnesS occurred only in those who had drunk water from the school fountain, and attack rates paralleled the am ounts o f w ater drunk (Table 1). A sample o f the tap water in the school showed high levels o f coliform contam ination and yielded S. sonnei.
The school obtained its w ater from a shallow well in the school yard. A fter the onset o f the outbreak, the school water system was chlorinated, and on November 21, the school was switched to the municipal w ater supply.(Reported by Laurie Dorothy, R .N ., Public Health Nurse, Van Buren County; Earl C. Voelker, Sr., Regional Sanitarian,
Estimated Amount o f Water Drunk at
Scrimmage
School A School B
Number111
Total
AttackRate(Percent)
Number111
Total
AttackRate(Percent)
None 0 5 0 0 0 0Small 2 7 29 0 3 0M oderate—Large 5 6 83 5 5 100Total 7 18 39 5 8 62
and Keith Bridson, A cting Director, Water Supply Division, Iowa State D epartm ent o f Environmental Quality; Shirley Lindell, Ph.D.,M icrobiology Laboratory, and William Hausler, Ph.D., Chief, Iowa State Hygienic Laboratory; M. R. Kosuri, M.B.B.Ch., and Francis Carr, Public Health Representatives, and A rnold M. Reeve, M.D., Commissioner o f Public Health and State Epidemiologist, Iowa State D epartm ent o f Health; and 2 E IS Officers.)Editorial Note
Epidemiologic and laboratory evidence strongly incriminated the school’s water supply as a source o f shigella infection among students and staff. The system was substandard, w ith the well susceptible to contam ination from surface and ground water. Shigellosis is usually spread from person to person, but it also accounted for 17% o f the outbreaks o f waterborne disease reported to CDC from 1961 to 1910(1). W aterborne spread o f shigellosis has been dem onstrated epi- demiologically in many instances, but isolation of the organism from contam inated w ater is unusual (2, 3).References1. Taylor A Jr, Graun GF, et al: Outbreaks of waterborne diseases in the United States, 1961-1970. JID 125:329-331, 19722. Green CA, Macleod MC: Explosive epidemic of Sonne dysentery. Br Med J 2:259-261, 19433. Ross Al, Gillespie EH: An outbreak of waterborne gastroenteritis and Sonne dysentery. Monthly Bulletin of the Great Britain Ministry of Health and the Public Health Laboratory Service 11:36-46, 1952
C U R R E N T T R E N D S INFLUENZA — U nited States
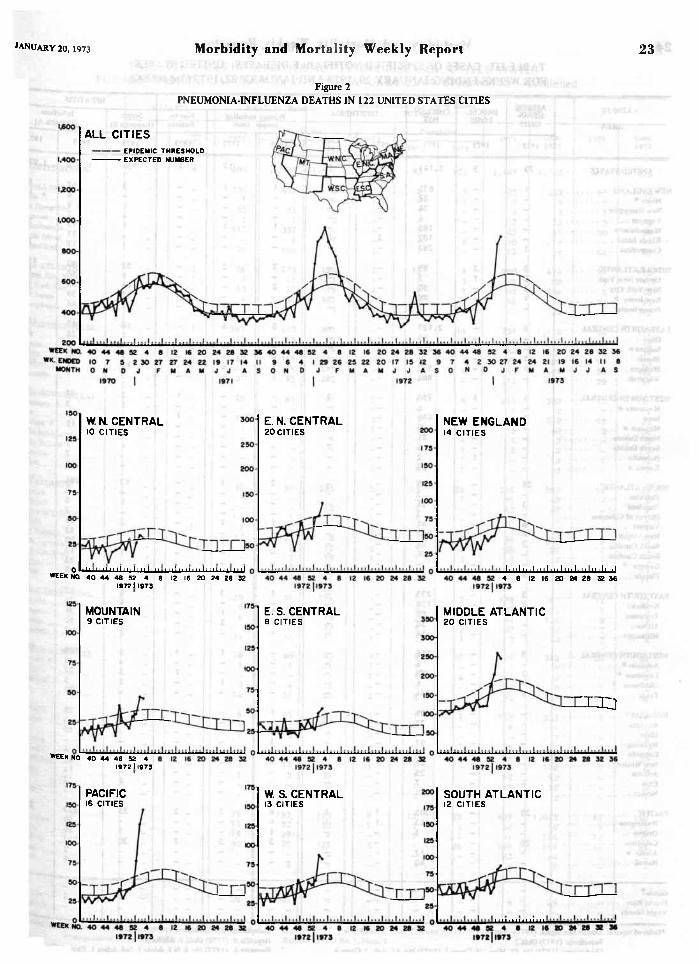
Pneumonia and influenza m ortality reported to CDC from 122 U.S. cities is above the epidemic threshold for the 3rd consecutive week (Figure 2). The Mountain, East South Central, Middle A tlantic, Pacific, West South Central, and South A tlantic areas have reported m ortality above the epidemic threshold for at least 2 consecutive weeks, bu t m or
tality is decreasing in the Mountain, Middle A tlantic, and West South Central areas. Furtherm ore, surveillance data suggests tha t influenza m orbidity is decreasing in the Northeast but continuing in the Midwest and Far West.(R eported by the Influenza Surveillance Unit, Viral Diseases Branch, Epidemiology Program, CDC.)
EPIDEM IOLOGIC N O TE S A N D REPO RTS BRILL-ZINSSER DISEASE - Virginia
On Aug. 27, 1972, a 55-year-old Russian-born hem atology technician from Alexandria, Virginia, became ill with generalized weakness, drowsiness, anorexia, chills, and headache. She continued to work, but her condition worsened, and 2 days later, she had a tem perature o f 102°F. A complete blood cell count at this time was norm al, and febrile
agglutinins for typhoid fever, brucellosis, and Proteus 0X 2 and 0X 19 were negative.
On August 30, the patient began a 5-day course o f ampi- cillin and aspirin. Two days after starting therapy, a mild rash developed beneath both breasts, but the patient completed
(C ontinued on page 28)
ALL CITIESEPIDEM IC THRESHOLD EXPECTED NUMBER
E. N. CENTRAL20 CITIES
W. N. CENTRAL10 C IT IES
NEW ENGLAND14 C IT IE S
1 I I I I 1 I I I I I I I I I I I I I I I I I I I I 1 I I I I I I I4 8 12 16 20 24 28 32 36
0 m 111111111111111111111111 il 111 li n i i i l l m l m l WEEK NO 4 0 44 48 52 4 8 12 16 20 24 28 32
1972 I 1973
MOUNTAIN9 CITIES
E. S. CENTRAL8 C IT IES
MIDDLE ATLANTIC20 C IT IES
n í a
WEEK n o . 4 0 44 48 52 41972 11973
PACIFIC16 CITIES
W. S. CENTRAL13 CITIES
SOUTH ATLANTIC12 C IT IES
Figure 2PNEUMONIA-INFLUENZA DEATHS IN 122 UNITED STATES CITIES
January20,1973 M orbidity and M ortality W eek ly R eport 23

2 4 Morbidity and Mortality Weekly Report
TABLE II I . CASES OF SPECIFIED NOTIFIABLE DISEASES: UNITED STATES FOR WEEKS ENDING JANUARY 20, 1973 AND JANUARY 22, 1972 (3rd WEEK)
ASEPTICBRUCEL
LOSISCHICKEN-
POX
ENCEPHALITIS HEPATITIS
AREAMENINGITIS
DIPHTHERIA Primary including unspec. cases
Post Infectious
Serum (Hepatitis B)
Infectious (Hepatitis A)
1973 1973 1973 1973 Cum.1973 1973 1972 1973 1973 1973 1972
UNITED STATES 70 3 5 ,1 4 1 3 5 19 17 4 13 6 1 ,0 7 6 1 ,0 7 5
NEW E N G L A N D ......................... 1 _ 6 3 5 2 2 1 1 _ 3 5 7 8 2Maine * ....................................... - - 28 • - - - - - - 4 11New H am p sh ire ....................... - - 34 - - - - - 1 4 5V erm o n t.................................... - — 4 — - — - — — 2 7Massachusetts ......................... - - 18 5 - - 1 1 - 1 19 3 3Rhode Is la n d ............................ - - 10 2 2 2 - - - - 11 6Connecticut ............................ 1 - 2 8 2 - - - - - 1 17 20
MIDDLE A T L A N T IC ................. 5 2 89 _ _ 2 2 _ 5 2 1 8 2 1 5 0Upstate New Y o r k ................. 2 1 7 - - - - - 9 5 0 3 3New York City ...................... 2 - 8 0 - - 2 - - 14 27 57New Jersey * ............................ 1 - NN - - - - - 12 59 57P ennsylvania ............................ - 1 2 - - - 2 - 17 4 6 3
EAST NORTH C E N T R A L ____ 8 _ 2 ,1 2 7 _ _ 6 6 _ 1 8 16 3 15 8Ohio .......................................... - - 85 - - - - - 1 2 6 2 3
— — 2 6 6 — — — — — — 6I ll in o is ....................................... 1 - - - - - - - 2 33 19M ichigan.................................... 7 - 8 9 2 - - 5 6 - 12 9 2 1 0 3W isco n sin ................................. - - 8 8 4 ~ - 1 - - 3 7 7
WEST NORTH CENTRAL . . . . 1 1 7 5 0 _ 2 _ _ 1 2 37 5 8Minnesota * ............................... - - 6 - - - - - 1 3 6Iowa .......................................... 1 - 6 8 6 - - - - 1 - 5 2Missouri * .................................. _ _ 9 _ _ _ _ _ _ 15 6North Dakota ......................... _ _ 21 _ _ _ - _ 1 - 10South Dakota ......................... - _ 6 _ 2 _ _ _ _ 7 4Nebraska .................................. - 1 2 _ _ _ - _ _ 2 4Kansas * .................................... - - 20 - - - - - - 5 26
SOUTH A T L A N T IC .................... 24 - 4 7 9 - - 2 1 - 13 164 1 6 4Delaware ................................. — — 3 - - - - — - 4 1Maryland ................................. 3 - 21 - - - - - 1 6 26District o f Columbia .............. - — 3 — - - — - - 2 2Virginia .................................... 6 - 41 - - 1 1 - 5 2 8 2 2West V irg in ia ............................ - - 38 7 - — - — — - 13 10North C aro lina ......................... 3 - NN - - - - - - 2 0 29South C aro lina ......................... - - 2 4 - - - - - 1 13 7Georgia * .................................. - - - - -
1- - - 23 11
5 6F lo rid a ....................................... 12~ “ — “ — 6 55
EAST SOUTH C E N T R A L ____ 3 — 2 3 3 _ _ 1 3 _ 6 6 7 75K e n tu c k y .................................. 2 - 1 5 9 - - - - - 1 2 4 34T en n essee .................................. 1 - NN - - 1 1 - - 31 33A lab am a .................................... - - 30 - - - 2 - 3 10 5M ississippi................................. ~ 4 4 “ — — — 2 2 3
WEST SOUTH C E N T R A L ____ 8 - 3 1 6 _ _ _ 1 1 5 1 0 8 1 0 2Arkansas * ................................. - - 6 - - - - - - 4 7Louisiana * ............................... 7 - NN - - - - 1 3 2 2 9Oklahoma . * ............................ - - 6 - - - 1 - 2 5 36T e x a s .......................................... 1 - 3 0 4 - - - - - - 77 5 0
M O U N TA IN .................................. _ _ 2 0 9 _ _ 1 _ _ 2 75 41M o n ta n a .................................... - - 22 - - - - - - 3 3Idaho .......................................... - - - - - - - - - 10 _Wyoming .................................. - - 93
5011
- - 1 - -11
7New Mexico ............................ _ _ _ _ _ _ _ 4 0Arizona .................................... - - 25 - - - - _ - 14 15Utah .......................................... — - 7 _ _ — _ _ 1 2 5N evada....................................... - - 1 - - - - - - 2 -
PACIFIC ....................................... 2 0 _ 30 3 1 1 6 3 2 35 2 2 3 24 5W ash ing ton ............................... - - 2 4 3 1 1 - _ _ _ 19 19O re g o n ....................................... - - 3 - - 1 _ - 5 36 30C a lifo rn ia .................................. 20 - - - - 5 3 2 30 157 190Alaska * .................................... _ _ 17 _ - _ _ _ _ 2 3H a w a ii ....................................... — - 4 0 ~ ~ - - - - 9 3
Guam * ............................................. - - - - - - - - - _ 1Puerto R ic o .................................... - - 11 - - - - - - 2 1Virgin Islands ............................... " ~ ' " ~ — - —
•Delayed reports: Aseptic meningitis: (1972) Minn. 4 Encephalitis, post-infectious: (1972) Minn. 1Brucellosis: (1972) Okla.2 Hepatitis B: (1972) Okla. 1, Alaska 3Chickcnpox: (1972) Me. 68, Minn. 25, Guam 2, (1973) Mo. 63, Ark. 2, Guam 8 Hepatitis A: (1972) Me. 8, N .J. delete 1, Ind. delete 1, Kans. 4, Ga. 2, Ark. 2, Encephalitis, primary: (1972) Minn. 1, Ark. 1 La. delete 1, Okla. 4, Alaska 3, Guam 1, (1973) Mo. 20, Ark. 2
TABLE II I . CASES OF SPECIFIED NOTIFIABLE DISEASES: UNITED STATES FOR WEEKS ENDING JANUARY 20, 1973 AND JANUARY 22, 1972 (3rd WEEK) - Continued
Morbidity and Mortality Weekly Report 2 5
AREA
M F N iN n n r n r r a i iM F F m n N SMALARIA M tA S L tS (Rubeola) TOTAL MUMF5 KUBfcLLA
Cum.1973
Cumulative1973
Cumulative1973 Cum. 1973 Cum.
19731973 19731973 1972 1973 1972 1973
- 6 6 0 5 1 ,5 9 9 1 ,9 1 3 3 3 8 3 1 0 3 2 ,4 4 1 4 , 9 1 2 4 0 3 8 7 3
- - 2 3 3 6 1 5 4 6 1 6 3 75 2 2 3 6 9 94- - 1 1 6 - - 1 2 5 1 1- - 35 9 2 4 - 1 - 4 5 1 1- - 1 1 2 - - - 2 5 3 3 4- - 1 4 2 33 7 - - 3 - 45 91 2 0 39- - - 4 27 - - 2 10 15 - -- - 54 18 0 7 1 2 - 12 5 4 4 4 49
- 2 26 1 3 3 1 9 0 7 15 8 2 0 0 4 7 4 9 4 1 2 8- 1 7 14 3 1 1 3 NN NN 5 11- - 13 77 19 4 6 1 89 2 8 6 2 10- - 4 31 165 1 4 3 6 6 9 3 79 9 5“ 1 2 11 3 1 4 1 45 9 5 8 12
- 1 161 4 1 3 901 _ 3 16 759 1 ,4 5 6 84 19 7- - 12 18 19 - 3 8 41 1 4 8 7 18- - 13 4 0 27 9 - - 1 5 0 121 20 5 4- - 5 3 165 24 9 - - 3 70 2 2 9 11 2 4- 1 4 6 10 5 1 1 2 - - 4 3 8 5 501 20 5 2- - 37 85 2 4 2 - - - 2 1 3 4 5 7 2 6 49
- - 2 0 4 8 31 5 6 4 24 5 3 2 0 16 145- - - 3 1 - - - 2 2 1 1- - 19 44 22 2 3 - 2 3 5 2 4 8 11 2 3- - 1 1 3 1 1 - 5 40 3 106- - - - 4 - - - 1 5 - 5
s . — — - - 1 — — 1 2 2 — -
- - - - - - - 1 - 13 1 10- - - - - 2 2 2 - 10 - -
- 3 37 61 2 3 2 5 13 25 2 1 6 5 0 8 19 37- - - - - - - 1 15 4 0 - . -- - - - 2 - 4 - 45 9 8 - 1- - 1 1 - 1 1 - 2 4 - 1- 2 2 7 - 1 2 10 6 41 1 1- - 17 21 8 - - 3 89 2 0 3 8 16- 1 - 2 10 2 5 4 NN NN 1 3- - - 2 19 1 1 3 3 8 3 3- - — 1 19 — - - - - 1 1- - 17 2 7 174 - - 4 5 6 11 4 5 11
- - 25 34 1 2 4 1 7 7 11 8 261 12 27- - 8 10 73 - 3 3 32 5 3 1 2- - 6 10 18 - 2 1 47 126 8 18- - - - 22 - 1 2 37 72 1 3- - 11 14 11 1 1 1 2 10 2 4
- - 18 6 0 8 3 4 8 10 9 9 3 1 2 36 67- - 1 1 1 1 1 - 2 5 - 5- - - - - 1 1 4 2 2 - _- - 3 4 2 - - - 2 8 1 2- - 14 5 5 80 2 6 6 9 3 2 9 7 35 60
- - 6 4 2 12 3 1 7 1 1 2 0 33 5 6 2 8- - 1 1 1 - - - 6 14 1 1- - 1 3 1 - - - _ 3 - 4- - - - - - - 1 24 77 - -
- - 1 16 79 - 2 - 14 25 4 13- - 2 17 4 1 1 - 5 0 1 0 8 1 6- - 1 5 35 - 1 - 12 9 3 - 3- - - - 3 - 1 - 12 13 - -
- - - - - - 2 - 2 2 - 1
- - 79 1 9 3 1 8 3 9 18 29 6 0 9 1 ,0 2 3 6 7 150- - 15 9 2 5 2 1 2 2 5 2 9 8 7 25- - 14 29 4 - 2 1 71 1 8 4 13 31- - 5 0 70 121 8 1 4 26 4 4 9 6 6 9 47 9 4- - - - - - - - 33 6 4 - -“ ~ ~ 2 6 - - - ■ 4 8 - -
_ _ _ _ _
- - 20 9 5 6 - - - 8 29 - 3
■— — — “ - - - - -
UNITED STATES
NEW EN G L A N D ...........Maine .*.New Hampshire . .Vermont......MassachusettsRhode Is la n d ..............Connecticut
n E ATLANTIC upstate New York Ne* York City New Jersey Pennsylvania
e a s t n o r t h c e n t r a l .OhioIndiana . . . .MinoisM ich igan . . . . . . . . Wisconsin
WEST NORTH CENTRAL . M'nnesota Iowa
North Dakota So“ lh Dakota Nebraska Kansas .
SOUTHATLANTICDelawareMaryland . . ! ’ ’ ^ t r i c t of Columbia v ,rg in ia . . .
Virginia ! ” " (North Carolina South Carolina . . . .G e° rg ia .....................F lo r id a . .
E« T SOUTH CENTRAL Kentucky Tennessee Alabama Mlssissinni *
' VEf r S0U T H C EN TR A L Arkansas *.L°uisiana Oklahoma *Texas .
M°UNTAINMontana . Idaho .
y°mingCol°rado^ ew Mexico Ar‘zona Utah Nevada .
PACIFIc
* ashingto„ regon .
California Alaska Hawaii
puam * > o ¿ c o ;Pu,
V'̂ in Islands
'DelayedrePorts: Measles (1972) N.H. 3, Miss, delete 4, (1973) Miss, delete 6
Meningococcal infections: (1972) N.H. 1, Ark. 1Mumps: (1972) Me. 4 , Minn. 3 , Okla. 1, Guam 3 , (1973) Mo. 30 Rubella: (1972) Me. 5, Minn. 1
2 6 Morbidity and Mortality Weekly Report
TABLE II I . CASES OF SPECIFIED NOTIFIABLE DISEASES: UNITED STATES FOR WEEKS ENDING JANUARY 20, 1973 AND JANUARY 22, 1972 (3rd WEEK) - Continued
TETANUS TUBERCULOSIS(New Active)
TULAREMIA
TYPHOIDFEVER
TYPHUS-FEVER TICK-BORNE
(Rky. Mt. spotted fever)
VENEREAL DISEASESRABIES IN ANIMALSGONOR SYPHILIS
RHEA (Pri.&Sec.)Cumulative Cum. Cumulative 1973 Cum. 1973 Cum. 1973
Cum.1973 1973 1973 1973 1973 1973 1973 1973
UNITED STATES ........... 1 584 1,393 7 3 9 1 2 15,835 603 58 139
NEW E N G L A N D ......................... - 12 27 - - - - - 521 12 5 8M ain e .......................................... — — — — — - - — 13 - 5 8New H am p sh ire ....................... - - - - - - - - 12 - - -V e rm o n t..................................... — - - - — — — — 12 - ” -Massachusetts ......................... - 12 23 - - - - - 283 4 - -Rhode I s la n d ............................ - - 3 - - - - - 76 - - -Connecticut ............................ - - 1 — — — “ 125 8 — “
MIDDLE A T L A N T IC ................. 1 111 241 _ _ 3 _ 1 2,865 108 - 2Upstate New Y o r k ................. - 41 78 - - - - - 362 9 - -New York City ...................... 1 25 69 - - 3 - - 1,398 66 - -New J e r s e y ............................... — 21 54 — - — - — 350 16 - —Pennsy lvan ia ............................ - 24 40 - “ - - 1 755 17 — 2
EAST NORTH C E N T R A L ____ _ 100 234 _ _ 1 - _ 1 ,496 31 1 9Ohio .......................................... - 42 103 - - - - - 365 6 - -In d ian a ....................................... - 5 13 - - - - - 187 2 1 2I l l in o is ....................................... - 22 53 - - - - - 229 7 - 1Michigan * ................................. - 19 19 - - 1 - - 583 15 - -W isconsin .................................. - 12 46 - - - - - 132 1 — 6
WEST NORTH C E N TR A L____ _ 16 32 1 _ _ _ _ 725 8 13 46Minnesota 3*............................... - - 1 - - - - - 203 4 5 9Iowa .......................................... _ 2 10 _ - - - - 82 - 1 17M isso u ri.................................... - 5 9 1 - - - - 340 4 4 7North Dakota ................... _ _ _ - - - - - 14 - 3 10South Dakota * ......................... - 4 5 - - - - - 53 - - 3Nebraska * .................................. - 2 3 - - - - - 33 - - -Kansas t .................................... - 3 4 - - “ - - - - -
SOUTH A T L A N T IC ................... _ 135 322 1 1 - - 3,647 166 10 19Delaware ................................. - - 2 - - - - - 47 1 - -Maryland .................................. - 10 29 - - - - - 327 19 - -District of C o lu m b ia .............. - 1 14 - — - - - 435 13 - -Virginia ..................................... - 24 53 1 - - - - 324 52 4 9West V irg in ia ............................ - 6 12 - - - - - 75 2 1 3North C aro lina......................... - 20 44 - — — - — 458 4 - —South C aro lina......................... - 19 59 - - - - - 481 17 - -Georgia .................................... - 17 45 - - - - - 572 31 2 3F lo rid a ....................................... - 38 64 - 1 - - 928 27 3 4
EAST SOUTH C E N T R A L ____ _ 41 106 3 1 1 1 1 1,342 36 16 30Kentucky .*............................... - 8 23 1 - - - - 158 20 4 9T en n essee .................................. — 12 32 2 - — - — 509 7 5 14A lab am a .................................... - 10 36 - 1 1 1 1 371 2 7 7M ississippi.................................. “ 11 15 - - - - - 304 7 - -
WEST SOUTH C E N T R A L ____ _ 52 122 2 _ _ _ _ 2,003 86 7 11A rkansas.................................... _ 9 20 - _ - - - 154 2 - 1Louisiana * ............................... - _ 11 _ _ - - - 272 23 2 2O k lah o m a ................................. _ 4 12 2 _ _ - - 182 2 - 3T e x a s .......................................... - 39 79 - - - - - 1 ,395 59 5 5
M O U N TA IN ................................. _ 15 62 _ _ - - - 601 7 - 3M o n ta n a .................................... - - - - - - - - 39 - - -I d a h o .......................................... - - - - - - - - 35 1 - -Wyoming ................................. - - 2 - - - - - - - - -Colorado .................................. - 1 1 - — - - - 162 4 - -New Mexico ............................ - 4 10 - - - - - 112 - - -Arizona * .................................. - 9 46 - - - - - 169 1 - 3Utah .......................................... - - - - - - - - 35 - - -N ev ad a ....................................... - 1 3 - - - - - 49 1 - -
PACIFIC ....................................... _ 102 247 _ 2 3 _ _ 2,635 149 6 11W ashington............................... - 18 29 - - - - - 233 13 - -O reg o n ....................................... - 4 4 - - - - - 306 5 - -
C alifo rn ia .................................. - 77 203 - 2 3 - - 2,018 127 5 10Alaska ....................................... - - - - - - - - 33 - 1 1H a w a ii ....................................... - 3 11 - - - - - 45 4 - -
___-
- - 1 — — - - — - - — -Puerto R ic o .......................... . . . . - 13 23 - - - - - 69 22 1 3Virgin Islands ............................... — - — - — — — — 6 — - -
•Delayed reports: TB: (1972) Mich. 34, Minn. 6, Neb. 6, Kans. 3, Ky. delete 1, Guam 1, (1973) Guam 1 Gonorrhea: (1972) Kans. 96, La. delete 12, Guam 5, (1973) Ariz. 38, Guam 21 Animal rabies: (1972) S. Dak. 15, Kans. 1, (1973) Ariz. 2
Week No. 3
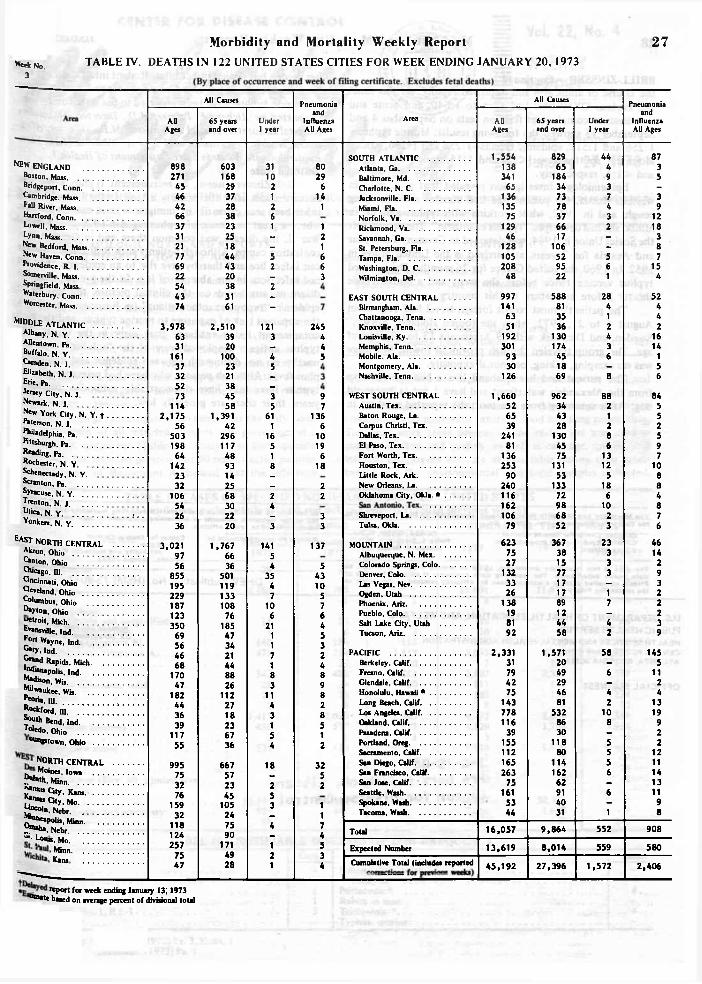
Morbidity and Mortality Weekly Report TABLE IV. DEATHS IN 122 UNITED STATES CITIES FOR WEEK ENDING JANUARY 20, 1973
2 7
All Causes
All 65 years UnderAges and over 1 year
898 603 31271 168 1045 29 246 37 142 28 266 38 637 23 131 25 -21 18 -
77 44 569 43 222 20 -
54 38 243 31 -74 61 -
3,978 2,510 12163 39 331 20 -
161 100 437 23 532 21 -52 38 -73 45 3
114 58 52,175 1,391 61
56 42 1503 296 16198 117 564 48 1
142 93 823 14 -
32 25 -106 68 254 30 426 22 _36 20 3
3,021 1,767 14197 66 556 36 4
855 501 35195 119 4229 133 7187 108 10123 76 6350 185 21
69 47 156 34 146 21 768 44 1
170 88 847 26 3
182 112 1144 27 436 18 339 23 1
117 67 555 36 4
995 667 1875 57 -32 23 276 45 5
159 105 332 24 -
118 75 4124 90 -
257 171 175 49 247 28 1
Pneumonia and
Influenza AU Ages
Ail Causes Pneumonia
Area AUAges
65 years and over
Under 1 year
and Influenza All Ages
SOUTH ATLANTIC ...................... 1,554 829 44 87Atlanta, Ga........................................ 138 65 4 3Baltimore, Md.................................. 341 184 9 5Charlotte, N. C................................. 65 34 3 -Jacksonville, F la.............................. 136 73 7 3Miami, Fla......................................... 135 78 4 9Norfolk, Va....................................... 75 37 3 12Richmond, Va.................................. 129 66 2 18Savannah, Ga.................................... 46 17 - 3St. Petersburg, Fla........................... 128 106 - 8Tampa, Fla........................................ 105 52 5 7Washington, D. C............................ 208 95 6 15Wilmington, Del............................... 48 22 1 4
EAST SOUTH CENTRAL ........... 997 588 28 52Birmingham, Ala.............................. 141 81 4 4Chattanooga, Tenn.......................... 63 35 1 4Knoxville, T enn............................... 51 36 2 2Louisville, Ky................................... 192 130 4 16Memphis, Tenn................................. 301 174 3 14Mobile, Ala........................................ 93 45 6 1Montgomery, Ala............................ 30 18 - 5Nashville, Tenn................................ 126 69 8 6
WEST SOUTH CENTRAL ........... 1,660 962 88 84Austin, Tex....................................... 52 34 2 5Baton Rouge, La............................. 65 43 1 5Corpus Christi, Tex........................ 39 28 2 2Dallas, Tex........................................ 241 130 8 5El Paso, Tex...................................... 81 45 6 9Fort Worth, Tex.............................. 136 75 13 7Houston, Tex.................................... 253 131 12 10Little Rock, Ark.............................. 90 53 5 8New Orleans, La.............................. 240 133 18 8Oklahoma City, Okla. * .............. 116 72 6 4
162106
9868
10 87Shreveport, La.................................. 2
Tulsa, Okla........................................ 79 52 3 6
MOUNTAIN ....................................... 623 367 23 46Albuquerque, N. Mex..................... 75 38 3 14Colorado Springs, Colo.................. 27 15 3 2Denver, Colo..................................... 132 77 3 9Las Vegas, Nev................................. 33 17 - 3Ogden, Utah .................................. 26 17 1 2Phoenix, Ariz.................................... 138 89 7 2Pueblo, Colo..................................... 19 12 - 2Salt Lake City, Utah ................. 81 44 4 3Tucson, Ariz..................................... 92 58 2 9
PACIFIC ............................................. 2,331 1,571 58 145Berkeley, Calif.................................. 31 20 - 5Fresno, Calif..................................... 79 49 6 11Glendale, Calif................................. 42 29 - 2Honolulu, Hawaii * ...................... 75 46 4 4Long Beach, Calif............................ 143 81 2 13Los Angeles, Calif........................... 778 532 10 19Oakland, Calif. ............................ 116 86 8 9Pasadena, Calif. ............................ 39 30 - 2Portland, Oreg.................................. 155 118 5 2Sacramento, Calif............................ 112 80 5 12San Diego, Calif. ......................... 165 114 5 11San Francisco, Calif. ................. 263 162 6 14San Jose, Calif.................................. 75 62 - 13Seattle, Wash.................................... 161 91 6 11Spokane, Wash................................. 53 40 - 9Tacoma, Wash................................... 44 31 1 8
Total 16,057 9,864 552 908
Expected Number 13,619 8,014 559 580
Cumulative Total (includes reported *5,192 27,396 1,572 2,406
NEW ENGLAND ...........Boston, Mass....................Bridgeport, Conn. . . . Cambridge, Mass. . . . Fall River, Mass.Hartford, Conn................Lowell, Mass....................Lynn, Mass.......................New Bedford, Mass. . . New Haven, Conn. . . .Providence, R. 1..............Somerville, Mass..............s Pringfield, Mass. . . . Waterbury, Conn. . . . Worcester, Mass...............
Mi*>DLE ATLANTIC . . .Albany, N. Y...................Allentown, Pa..................Buffalo, N. Y...................Camden, N. J ...................Elizabeth, N. J .................Erie, Pa.Jersey City, N. J.Newark, N. J ....................New York City, N. Y. fP e r so n , N. J ..................Philadelphia, Pa...............Pittsburgh, Pa...................Reading, Pa.......................Rochester, N. Y..............Schenectady, N. Y.Scranton, Pa.....................Syracuse, N. Y.................Trenton, N. J ...................Utica, N. Y .......................honkers, N. Y.................
£AST NORTH CENTRALAkron, Ohio .................Canton, Ohio ..............^ 'r a g o . Ill.......................Cincinnati, OhioCleveland, Ohio ...........c »lumbus, Ohio . . . .“ •Won, Ohio ..............« • ro i l , Mich. . .E*«nsvil|e , ind .................fo rt Wayne, Ind. . . .G" y , lad ...........................? r*nd Rapids, Mich. . ¡"‘‘“ »apolis, Ind. . . .Madison, Wis....................¡^» » u k ee , Wis................p» r ia . III..........................Rockford, III.! ° U<1> Bend, Ind. . . .* ° '« lo , Ohio ..............
ooogstown, Ohio . . .
NORTH c e n t r a l Moines, Iowa . . .
? u,u">. Minn...................i* "* “ City, Kans. . . .F 1“ “ City, Mo..............! ? co,n, Nebr...................^ “ “ •Polb, Minn. . .? “* • . Nebr....................“ • |-0"B, Mo...................
Minn..................Kans
80296
141
121663
245445
97
136 6
10196
18
22
33
137
54310576453 248 9 8 2 85 1
2
3252
1174534
report for week ending January 13; 1973 ^^te based on average percent of divisional total
28 Morbidity and M ortality W eek ly Report JANUARY 20, 1973
BRILL-ZINSSER — Continuedthe course o f ampicillin and improved rapidly. At this time, the Proteus 0X 19 tite r had risen to 1:640, and acute and convalescent complement fixation tests on Septem ber 4 and Septem ber 15 showed the following results: Murine typhus— 1:256 and 1:512, epidemic typhus—1:256 and 1:256, Rocky M ountain spotted fever < 1 :8 and 1:16, and Q fever < 1 :8 and < 1 :8 , respectively.
Epidemiologic investigation revealed that as a child in western Russia, the patient had had measles and whooping cough, and in 1942, while working w ith typhus patients in Minsk, she had developed “ typhus exanthem ” . The patient left the Soviet Union in 1944, was detained in Germany for 1 year and Austria for 7 years, and arrived in the United States in 1952. In I9 6 0 ,she visited Greece for 26 months. She received typhus vaccine twice before she went and a booster dose shortly before her return to this country.
The patient’s most recent foreign travel had been from August 6 to 21, 1972, when she toured Holland, Norway, Sweden, and Denmark with 39 Americans 13 to 79 years o f age. The group traveled through provincial towns, but there was no camping, hiking, or animal exposure.
The patient and her husband live a half hour’s drive from the Alexandria w aterfront and have 1 pet, a 9-year-old dog. A fter returning from the tour, she reported working in
her garden but denied insect bites. Rodent infestation has not been a problem in her home or neighborhood, and no cases o f murine typhus have been reported in the state for 3 years. (Reported by Richard E. Palmer, M.D., Director, Alexandria Hospital Laboratory; Angel A. Cardona, M.D., Director, A lex andria Health Department; and Karl A. Western, M.D., State Epidemiologist, Virginia State Department o f Health.) Editorial Note
Brill-Zinsser disease, or recrudescent typhus fever, can occur decades after the primary attack. In the U nited States, it has been seen primarily in immigrants from eastern Europe, where a great pandemic o f typhus raged in 1920-21. In World War II, the disease was common there and in German concentration camps. Although patients with Brill-Zinsser disease can infect lice and thereby give rise to an epidemic, they are not infectious in the absence o f lice. In the present case, the diagnosis was based on the clinical picture, the history of epidemic “ typhus exanthem aticus” (in European literature), the apparent lack o f exposure to murine typhus, and the high complement fixing antibody titer early in the illness. The typhus antigens employed were o f the “ soluble” type and usually do not distinguish between epidemic and murine ty phus fever. Although persons who have had primary epidemic typhus fever may have demonstrable antibodies for many years, their titers are generally low.
The M o rb id ity and M o rta lity W eekly Report, c ircu la t io n 30 ,500 , is published by the Center fo r Disease C ontro l, Atlanta, Ga.
Director, Center for Disease Contro l D irector, E p id em io log y Program, C D C Ed ito r, M M W R
David J. Sencer, M .D . Ph ilip S. B rachm an, M .D .
M ichael B. Gregg, M .D.
In add ition to the established procedures for. reporting m orb id ity and m ortality, the editor welcom es accounts of interesting outbreaks o r case investigations of current interest to health officials.
Address all correspondence to:
The data in this report are p rovisional, based on weekly telegraphs to C D C by state health departments. The reporting week concludes at close o f business on Friday; com piled data on a national basis are o ffic ia lly released to the public on the succeeding Friday.
Center fo r Disease Contro l A ttn : E d ito r
M o rb id ity and M o rta lity W eek ly R e p o r t Atlanta, Georgia 30 33 3
DHEW Publication No. (HSM) 73-8017
U.S. D EPA R TM EN T OF HEALTH, EDU CATIO N, A N D W ELFAREPUBLIC HEALTH SERVICEHEALTH SERV ICES AND MENTAL HEALTH ADM INISTRATIONC E N T E R F O R D I S E A S E C O N T R O L A T L A N T A , G E O R G IA 30 3 3 3
O F F IC IA L BUSINESS
P O S T A G E A N D F E E S P A ID
U .S . D E P A R T M E N T O F HEW
H E W 396
3-G -19-08Mrs Mary F Jackson, Library Center fo r Disease Control