Jindal Stainless Cost of Poor Qualityiim-delhi.com/upload_events/06JindalStainless.pdfCoPQ : Cost of...
42
Jindal Stainless Cost of Poor Quality
Transcript of Jindal Stainless Cost of Poor Qualityiim-delhi.com/upload_events/06JindalStainless.pdfCoPQ : Cost of...
Jindal Stainless
Cost of Poor Quality
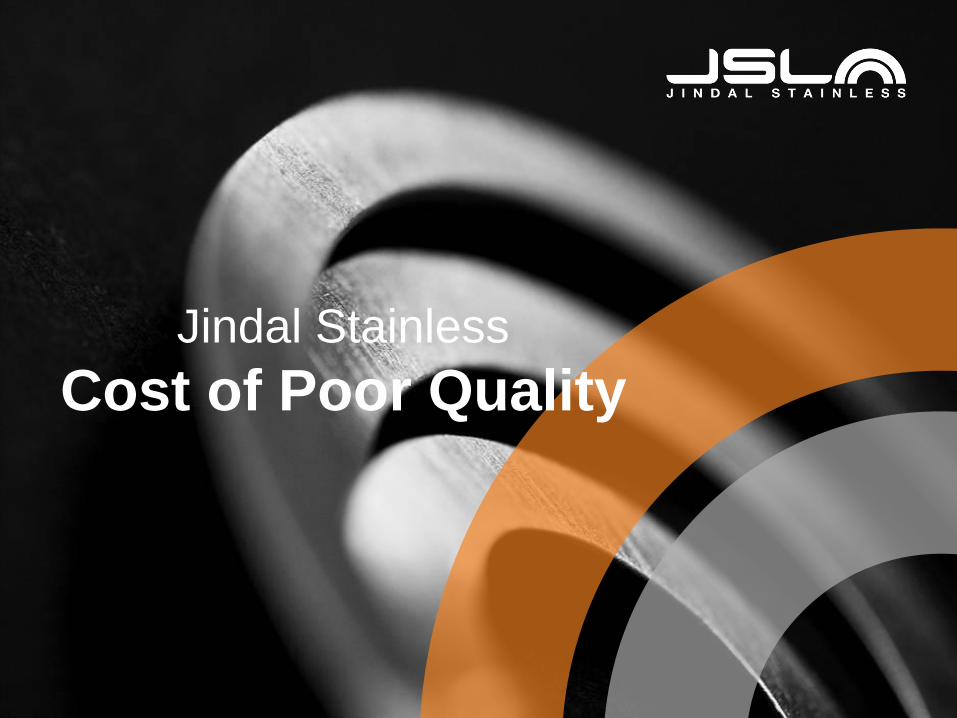
1.8Million Mt Stainless Steel.
Sales Turnover : Rs13,000 Crores/Annum
Hisar (HR/CR Products & Specialty Products)
Jajpur (HR/CR Products, Ferro-alloys, Power)
Vizag (Ferro-alloys)
Surabaya, Indonesia (CR Products)
Service Centers- Jindal Stainless Steelway Limited India:
Gurgaon, Mumbai, Chennai, Vadodra
- Iberjindal S.L, Spain: Valencia
Subsidiaries (Major)- Austenitic Creation Pvt. Limited (ACPL)
- Jindal Architecture Limited (JAL)
Jindal Stainless
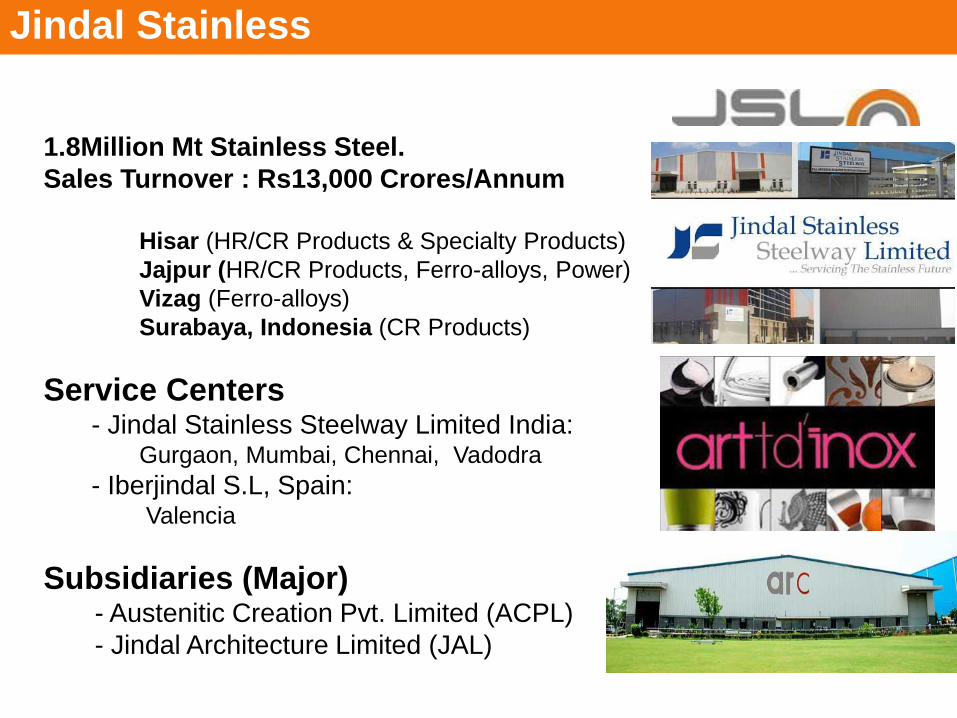
India’s fully Integrated Stainless Steel Plant, to produce Stainless Steel Slabs,
Blooms, Hot Rolled Plates, Hot Rolled, Cold Rolled Coils & Specialty Steels with
state-of-the-art facilities
Hisar Cold Rolling Complex
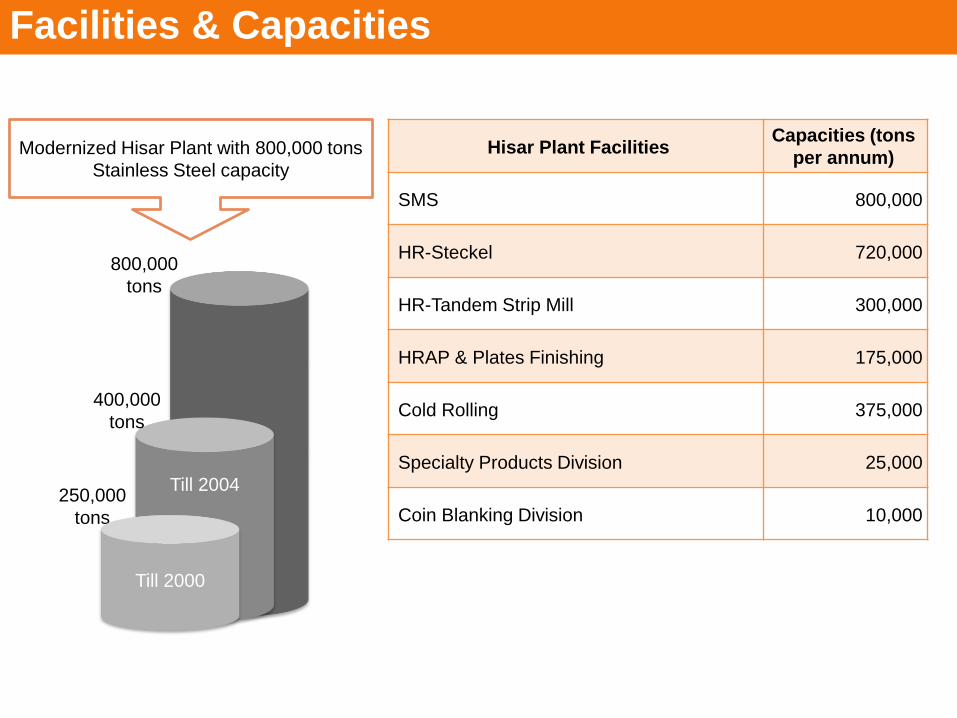
Modernized Hisar Plant with 800,000 tons
Stainless Steel capacity
250,000
tons
Till 2004
Till 2000
400,000
tons
800,000
tons
Hisar Plant FacilitiesCapacities (tons
per annum)
SMS 800,000
HR-Steckel 720,000
HR-Tandem Strip Mill 300,000
HRAP & Plates Finishing 175,000
Cold Rolling 375,000
Specialty Products Division 25,000
Coin Blanking Division 10,000
Facilities & Capacities
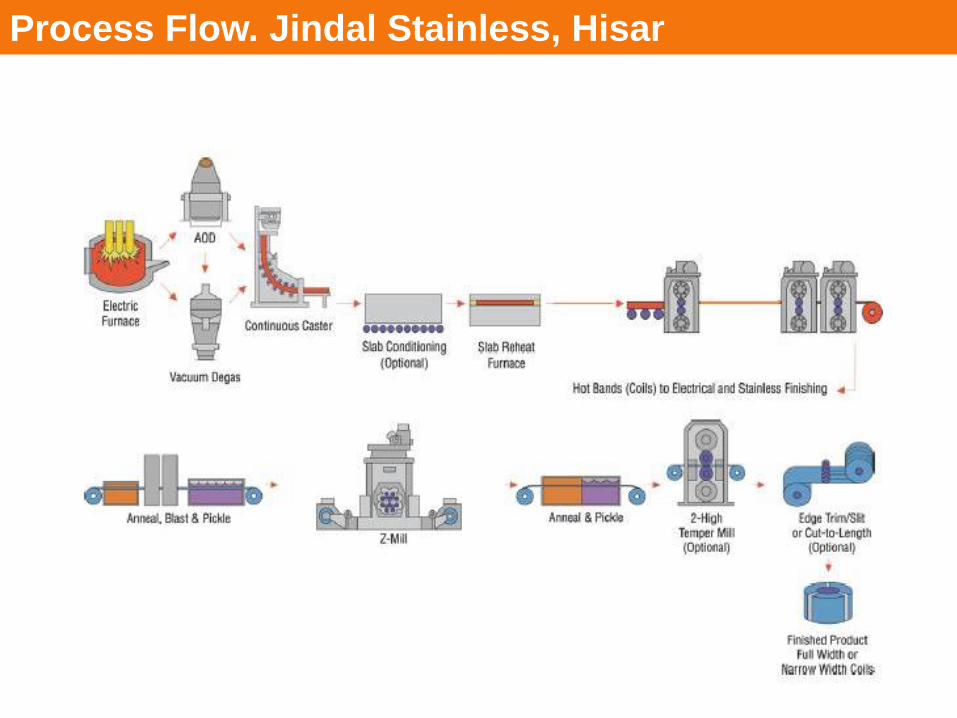
Process Flow. Jindal Stainless, Hisar
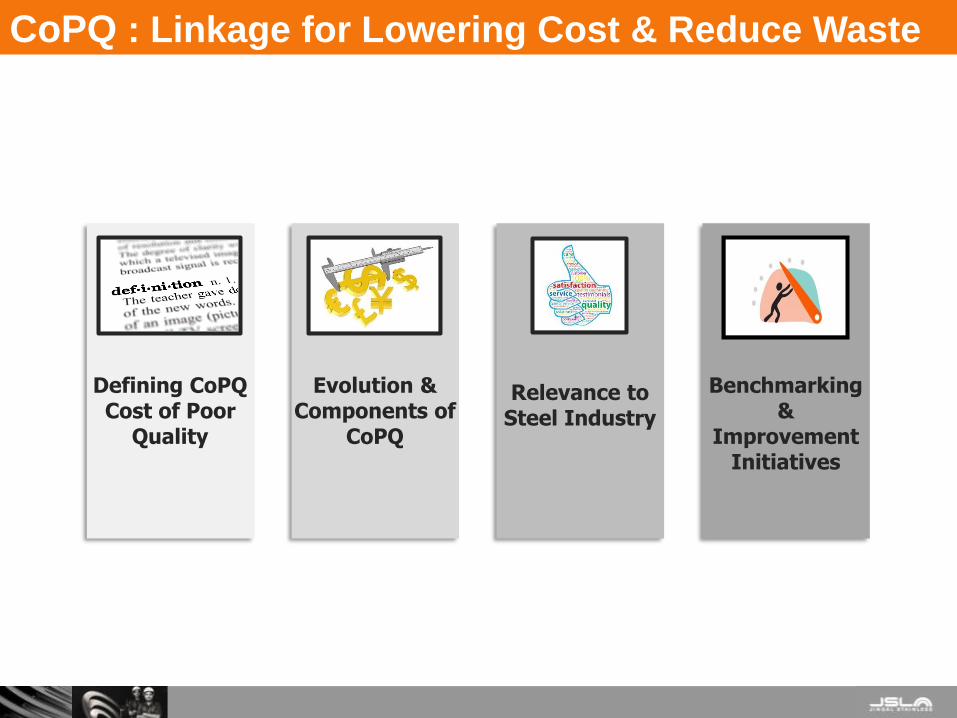
CoPQ : Linkage for Lowering Cost & Reduce Waste
Defining CoPQCost of Poor
Quality
Evolution & Components of
CoPQ
Relevance to Steel Industry
Benchmarking&
Improvement Initiatives
October 3, 2017 7October 3, 2017 7
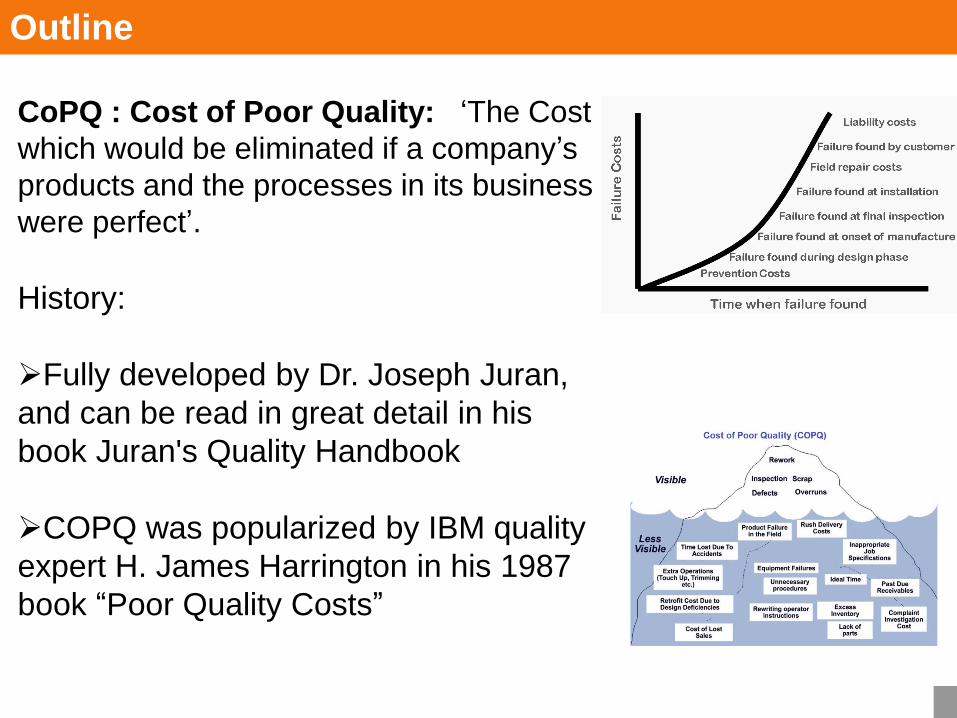
CoPQ : Cost of Poor Quality: ‘The Cost
which would be eliminated if a company’s
products and the processes in its business
were perfect’.
History:
➢Fully developed by Dr. Joseph Juran,
and can be read in great detail in his
book Juran's Quality Handbook
➢COPQ was popularized by IBM quality
expert H. James Harrington in his 1987
book “Poor Quality Costs”
Outline
October 3, 2017 8October 3, 2017 8
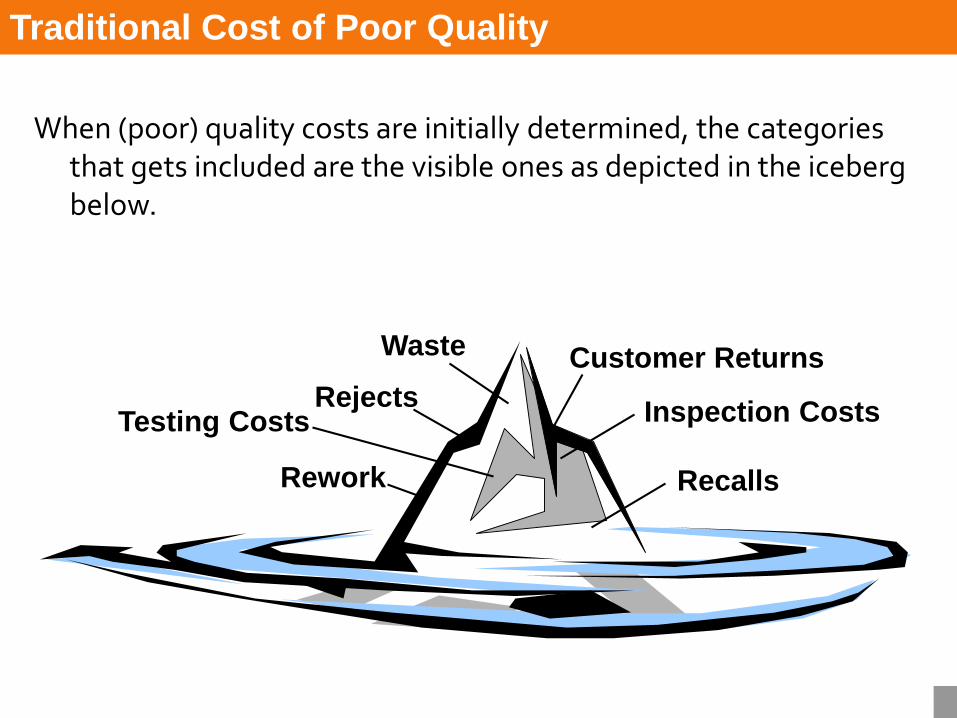
When (poor) quality costs are initially determined, the categories that gets included are the visible ones as depicted in the iceberg below.
Waste
Testing Costs
Rework
Customer Returns
Inspection CostsRejects
Recalls
Traditional Cost of Poor Quality
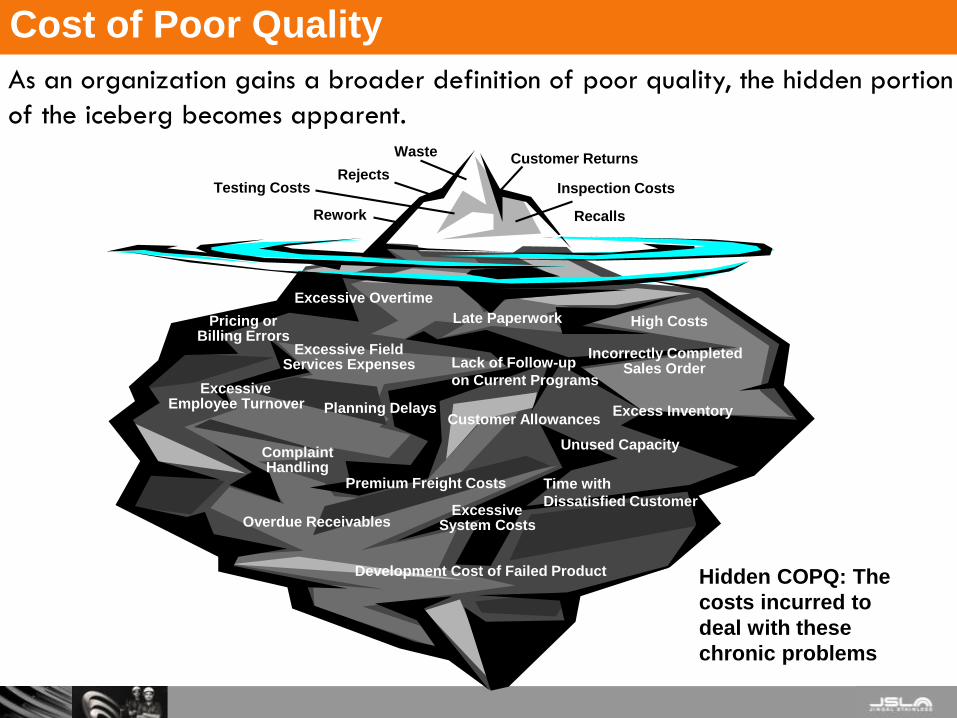
As an organization gains a broader definition of poor quality, the hidden portion
of the iceberg becomes apparent.
Late Paperwork High CostsPricing orBilling Errors
Excessive FieldServices Expenses
Incorrectly CompletedSales OrderLack of Follow-up
on Current ProgramsExcessive
Employee Turnover Planning Delays Excess Inventory
ExcessiveSystem CostsOverdue Receivables
ComplaintHandling
Unused Capacity
Time with
Dissatisfied Customer
Excessive Overtime
Waste
Testing Costs
Rework
Customer Returns
Inspection CostsRejects
Recalls
Development Cost of Failed Product Hidden COPQ: The
costs incurred to
deal with these
chronic problems
Premium Freight Costs
Customer Allowances
Cost of Poor Quality
10October 3, 2017 10
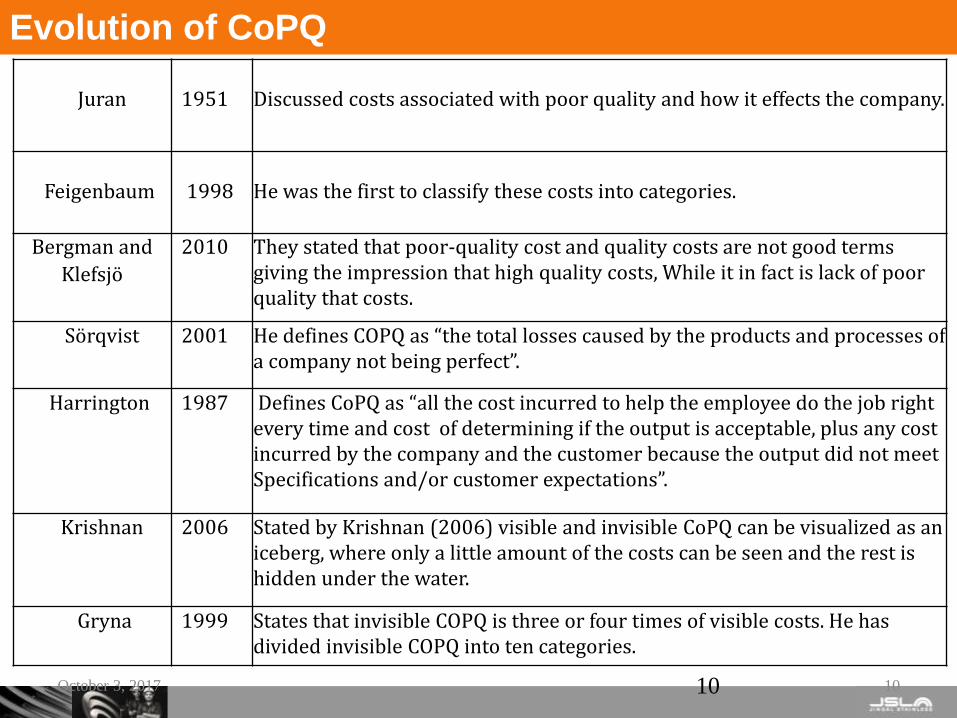
Juran 1951 Discussed costs associated with poor quality and how it effects the company.
Feigenbaum 1998 He was the first to classify these costs into categories.
Bergman and 2010 They stated that poor-quality cost and quality costs are not good terms giving the impression that high quality costs, While it in fact is lack of poor quality that costs.
Klefsjö
Sörqvist 2001 He defines COPQ as “the total losses caused by the products and processes of a company not being perfect”.
Harrington 1987 Defines CoPQ as “all the cost incurred to help the employee do the job right every time and cost of determining if the output is acceptable, plus any cost incurred by the company and the customer because the output did not meet Specifications and/or customer expectations”.
Krishnan 2006 Stated by Krishnan (2006) visible and invisible CoPQ can be visualized as an iceberg, where only a little amount of the costs can be seen and the rest is hidden under the water.
Gryna 1999 States that invisible COPQ is three or four times of visible costs. He has divided invisible COPQ into ten categories.
Evolution of CoPQ

11 11
Sigma
6 sigma
5 sigma
4 sigma
3 sigma
2 sigma
CoPQ
<10% of sales
10-15% of sales
15-20% of sales
20-30% of sales
30-40% of sales
Quantifying the CoPQ
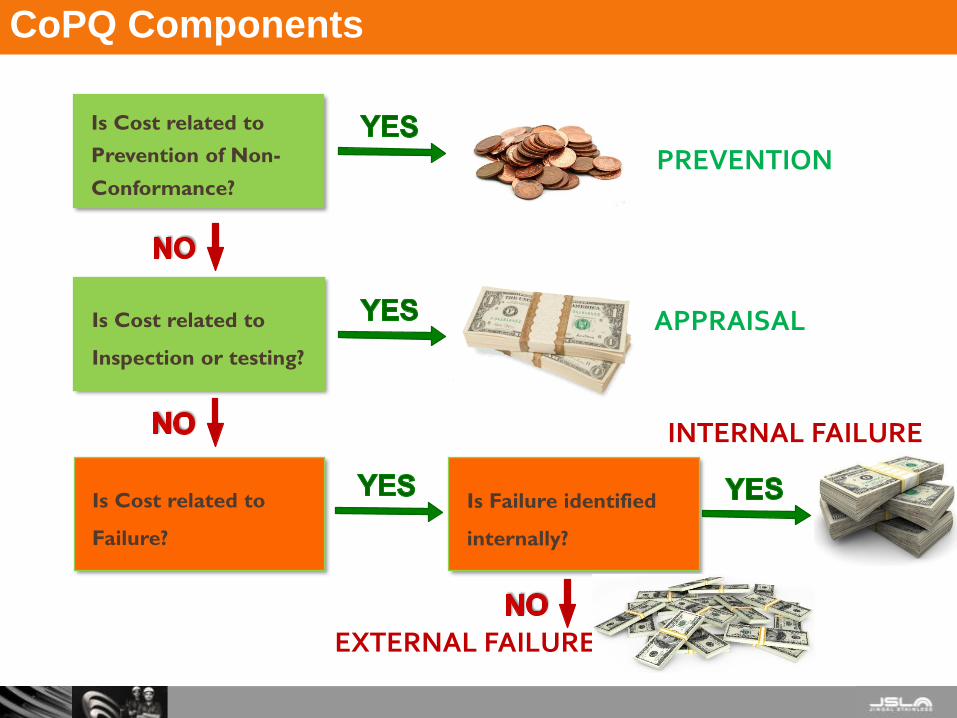
Is Cost related to
Prevention of Non-
Conformance?
Is Cost related to
Inspection or testing?
PREVENTION
APPRAISAL
Is Cost related to
Failure?
Is Failure identified
internally?
INTERNAL FAILURE
EXTERNAL FAILURE
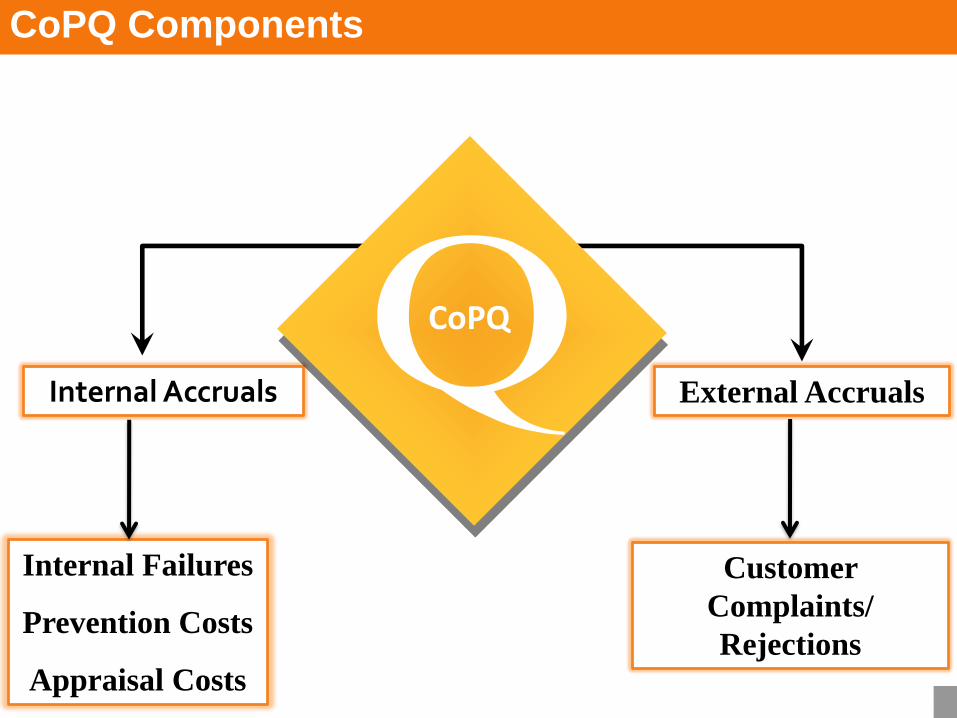
CoPQ Components
October 3, 2017 13October 3, 2017 13
External Accruals Internal Accruals
CoPQ
Internal Failures
Prevention Costs
Appraisal Costs
Customer
Complaints/
Rejections
CoPQ Components
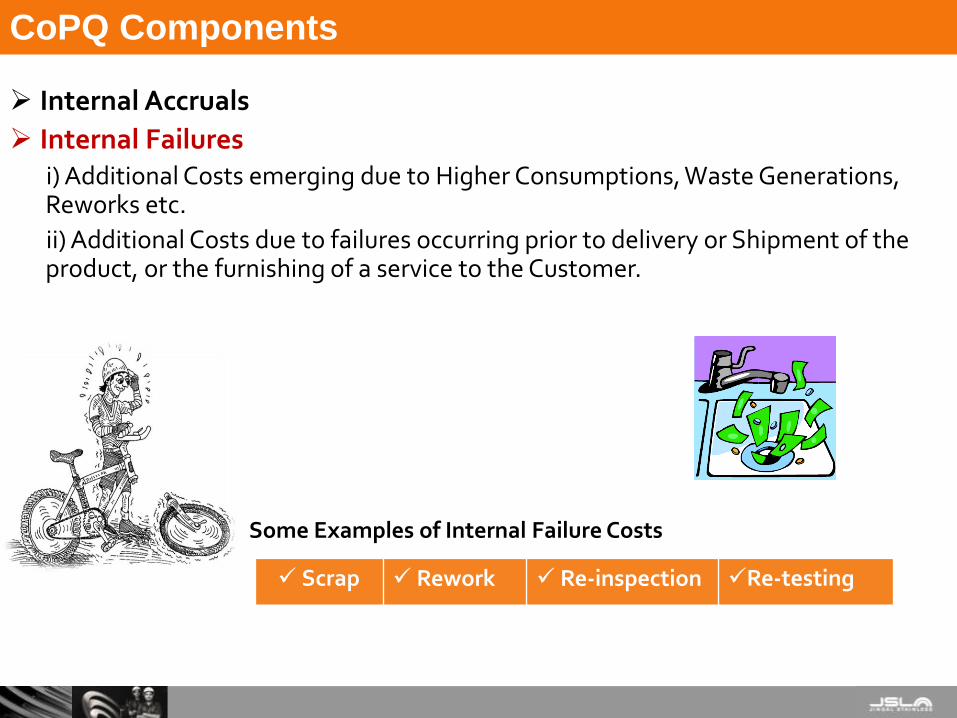
➢ Internal Accruals
➢ Internal Failuresi) Additional Costs emerging due to Higher Consumptions, Waste Generations, Reworks etc.
ii) Additional Costs due to failures occurring prior to delivery or Shipment of the product, or the furnishing of a service to the Customer.
Some Examples of Internal Failure Costs
✓ Scrap ✓ Rework ✓ Re-inspection ✓Re-testing
CoPQ Components
➢Preventive CostsThe costs of all activities specifically designed to prevent poor quality in products or services.
Examples are the costs of: • New product review • Quality planning • Supplier capability surveys • Quality improvement team meetings • Quality improvement projects • Quality education and training
➢ In the ideal situation, Prevention costs will be the largest portion of the Total Costof Quality
CoPQ Components
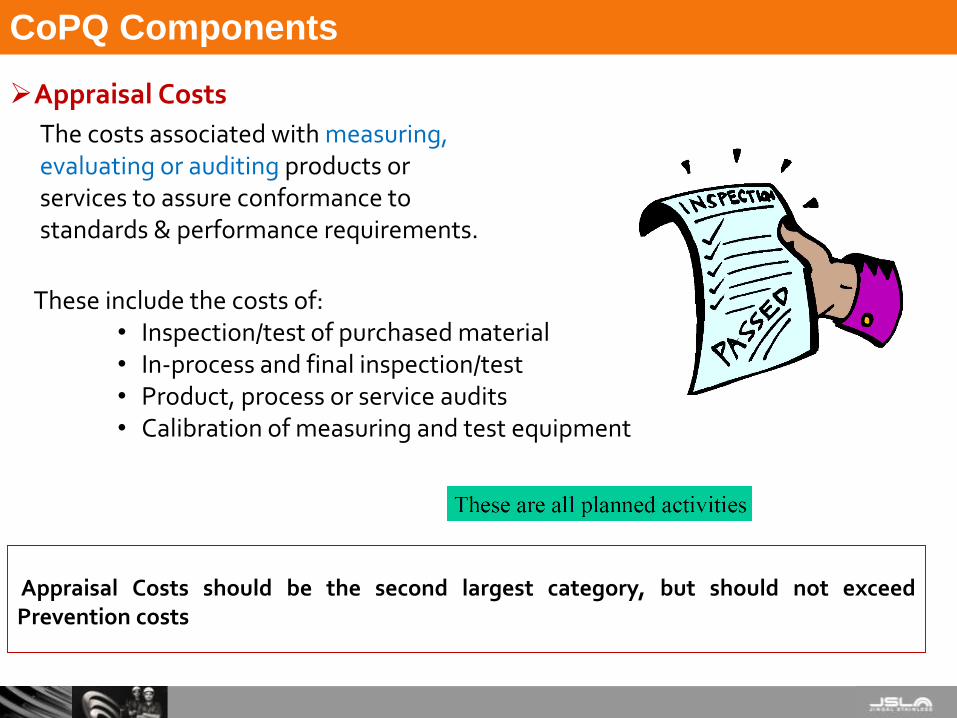
➢Appraisal Costs
The costs associated with measuring, evaluating or auditing products or services to assure conformance to standards & performance requirements.
Appraisal Costs should be the second largest category, but should not exceedPrevention costs
These include the costs of: • Inspection/test of purchased material • In-process and final inspection/test • Product, process or service audits • Calibration of measuring and test equipment
CoPQ Components
➢ External Accruals
• External Failure Costs
Failure costs occurring after delivery or shipment of the product — and during or after furnishing of a service —to the customer.
Examples are the costs of:
✓Processing customer complaints
✓Customer returns
✓Warranty claims
✓Product recalls
CoPQ Components

➢CoPQ Assessment
All these Costs Cannot be Zero
Take Targets against Bench-Marked Costs; Anything in excess of the Target becomes a CoPQ
Bench-Marking can be done:
-Best Cost ever achieved on Monthly basis
-Best Cost achieved in 3 best Months of previous Year
-Bench-Marking against Global Best, if one has access to this Data
-Out of Box Thinking
CoPQ Assessment
BENCH MARKING
FOR
EVALUATING COPQ
20
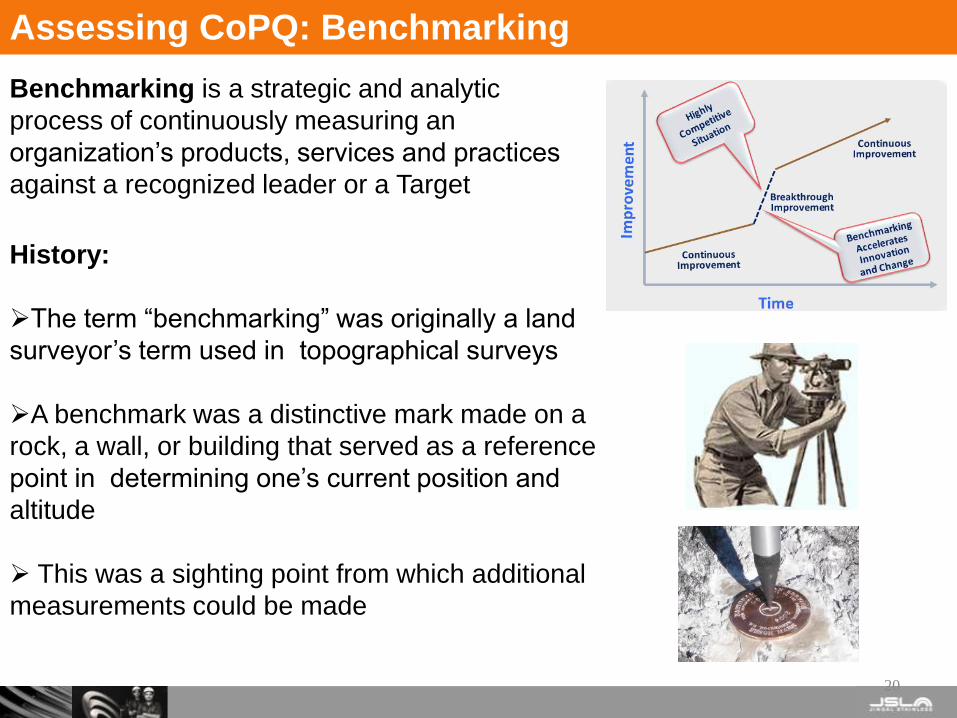
Benchmarking is a strategic and analytic
process of continuously measuring an
organization’s products, services and practices
against a recognized leader or a Target
History:
➢The term “benchmarking” was originally a land
surveyor’s term used in topographical surveys
➢A benchmark was a distinctive mark made on a
rock, a wall, or building that served as a reference
point in determining one’s current position and
altitude
➢ This was a sighting point from which additional
measurements could be made
Assessing CoPQ: Benchmarking
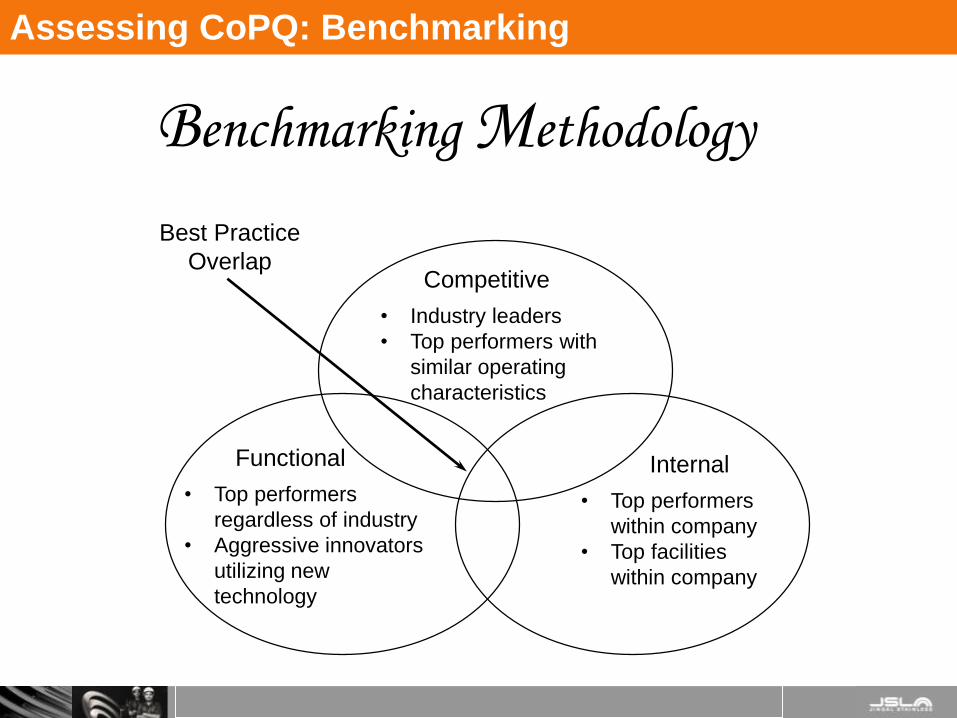
Competitive
• Industry leaders
• Top performers with
similar operating
characteristics
Functional
• Top performers
regardless of industry
• Aggressive innovators
utilizing new
technology
Internal
• Top performers
within company
• Top facilities
within company
Best Practice
Overlap
Benchmarking Methodology
Assessing CoPQ: Benchmarking
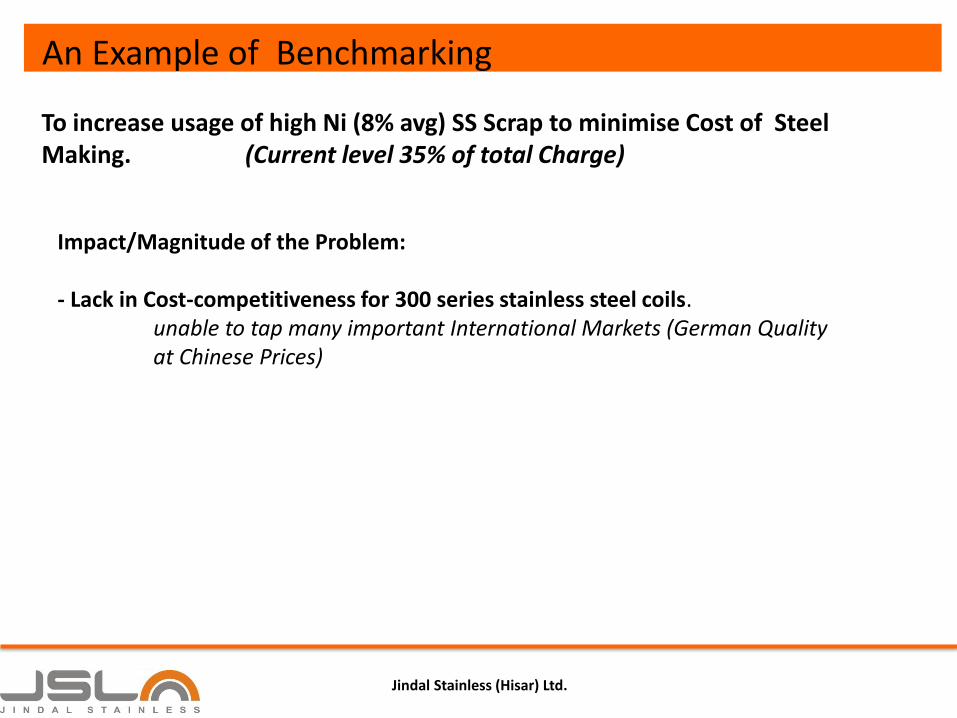
An Example of Benchmarking
To increase usage of high Ni (8% avg) SS Scrap to minimise Cost of Steel Making. (Current level 35% of total Charge)
Impact/Magnitude of the Problem:
- Lack in Cost-competitiveness for 300 series stainless steel coils. unable to tap many important International Markets (German Quality at Chinese Prices)
Jindal Stainless (Hisar) Ltd.
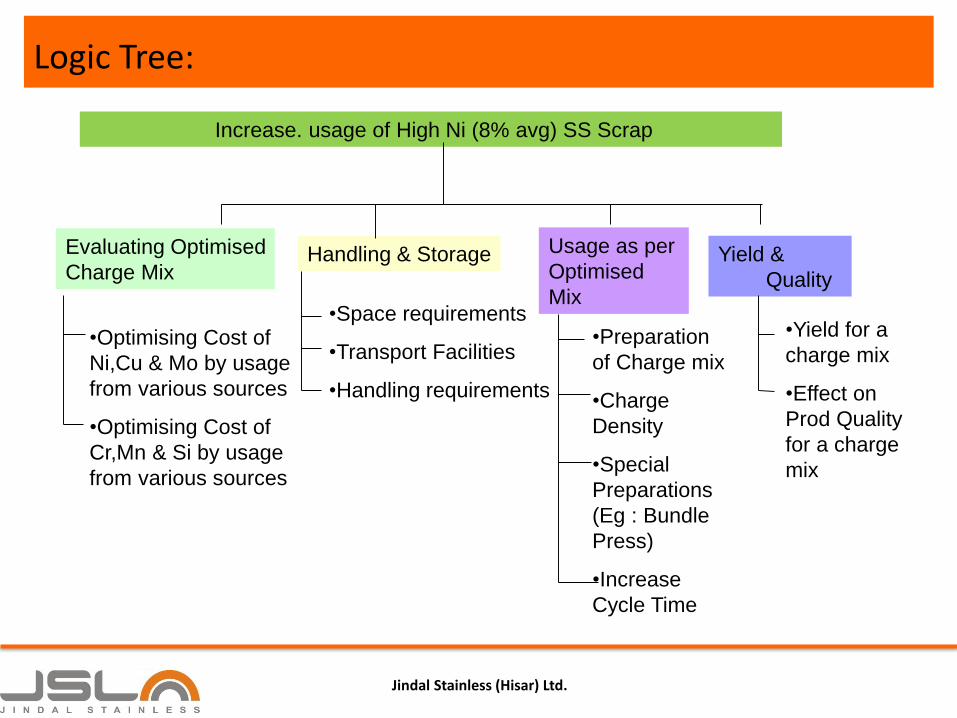
Logic Tree:
Increase. usage of High Ni (8% avg) SS Scrap
Evaluating Optimised
Charge Mix
•Optimising Cost of
Ni,Cu & Mo by usage
from various sources
•Optimising Cost of
Cr,Mn & Si by usage
from various sources
Handling & Storage
•Space requirements
•Transport Facilities
•Handling requirements
Usage as per
Optimised
Mix
Yield &
Quality
•Preparation
of Charge mix
•Charge
Density
•Special
Preparations
(Eg : Bundle
Press)
•Increase
Cycle Time
•Yield for a
charge mix
•Effect on
Prod Quality
for a charge
mix
Jindal Stainless (Hisar) Ltd.
Constraints :
Jindal Stainless (Hisar) Ltd.
•Higher usage of SS Scrap led to higher Power Cost•Non Availability of SS scrap•Scrap Handling
Jindal Stainless (Hisar) Ltd.
%Ni Used from Scrap
Po
we
r C
on
su
m.
100806040200
21000
20000
19000
18000
17000
16000
15000
14000
S 1677.72
R-Sq 0.2%
R-Sq(adj) 0.0%
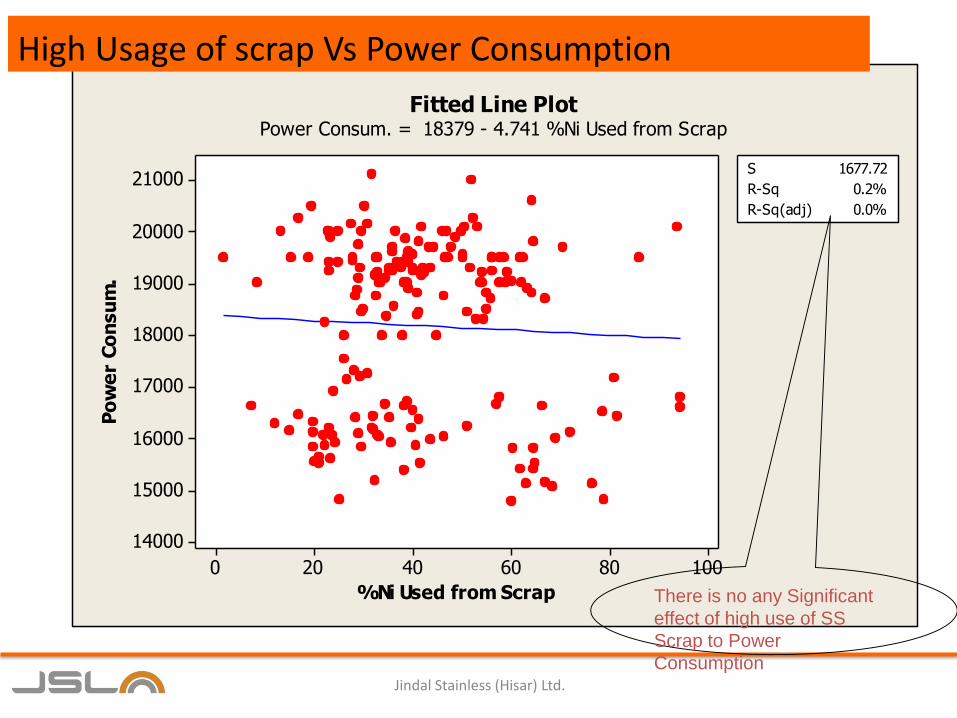
Fitted Line PlotPower Consum. = 18379 - 4.741 %Ni Used from Scrap
There is no any Significant
effect of high use of SS
Scrap to Power
Consumption
High Usage of scrap Vs Power Consumption
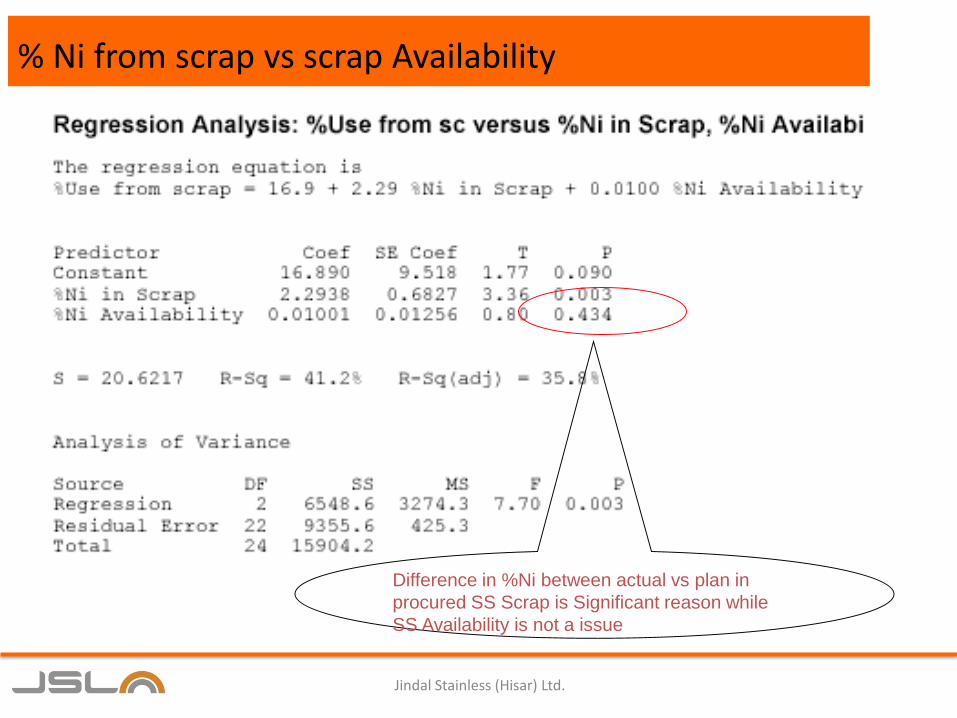
% Ni from scrap vs scrap Availability
Difference in %Ni between actual vs plan in
procured SS Scrap is Significant reason while
SS Availability is not a issue
Jindal Stainless (Hisar) Ltd.

Scrap Handling & Space Utilization
Size of Bins = 15 X 15 (Double of Size of Truck), Bins Possible = 78
Width of Road = 30 feet's
Domestic Truck Dimension = 17f X 7f (including engine)
54mtr89.9mtr
35mtr 54+24
=78
Blocks
Existing Road
Size of Bin may be adjusted according to requirement & material adjustment
15 30 30 30 30 30 30 30 30 30 30 30 30 30 =405/432
Jindal Stainless (Hisar) Ltd.
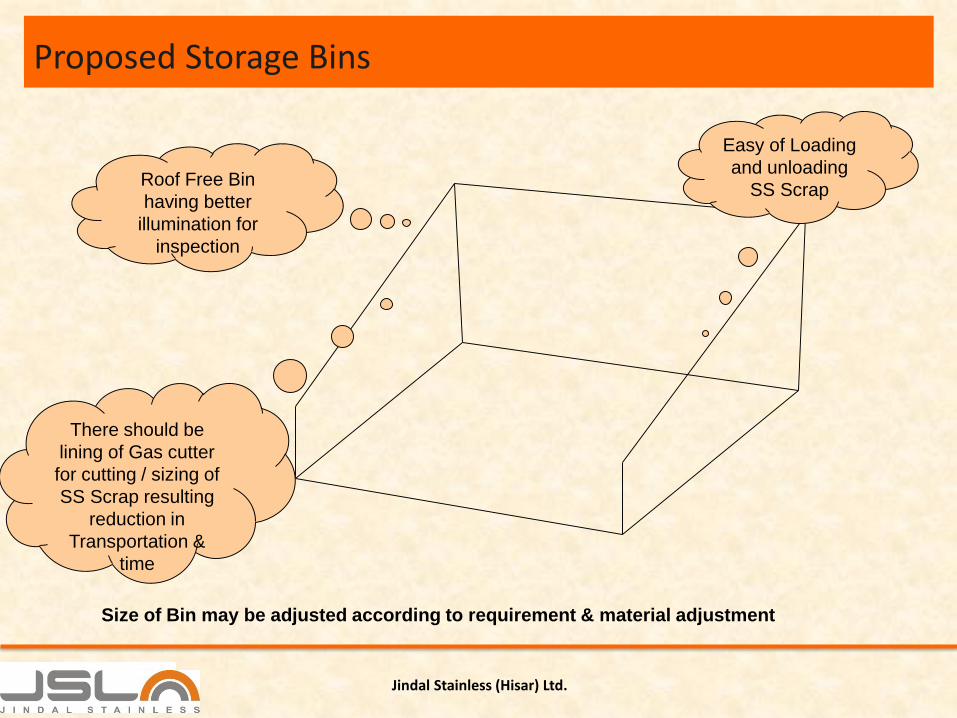
Proposed Storage Bins
Size of Bin may be adjusted according to requirement & material adjustment
There should be
lining of Gas cutter
for cutting / sizing of
SS Scrap resulting
reduction in
Transportation &
time
Easy of Loading
and unloading
SS ScrapRoof Free Bin
having better
illumination for
inspection
Jindal Stainless (Hisar) Ltd.

Benefits:
• Usage of Scrap has been increased for 35 % to 65% giving benefits of Rs.1.45 Cr in 1st Year itself
• Availability of Identified & Proper Sized SS Scrap in Shop
• Model for Ni Consumption has been placed to optimize the scrap availability and it usage
Jindal Stainless (Hisar) Ltd.
MAPPING COPQ IN A STEEL PLANT
MFG & NON MFG
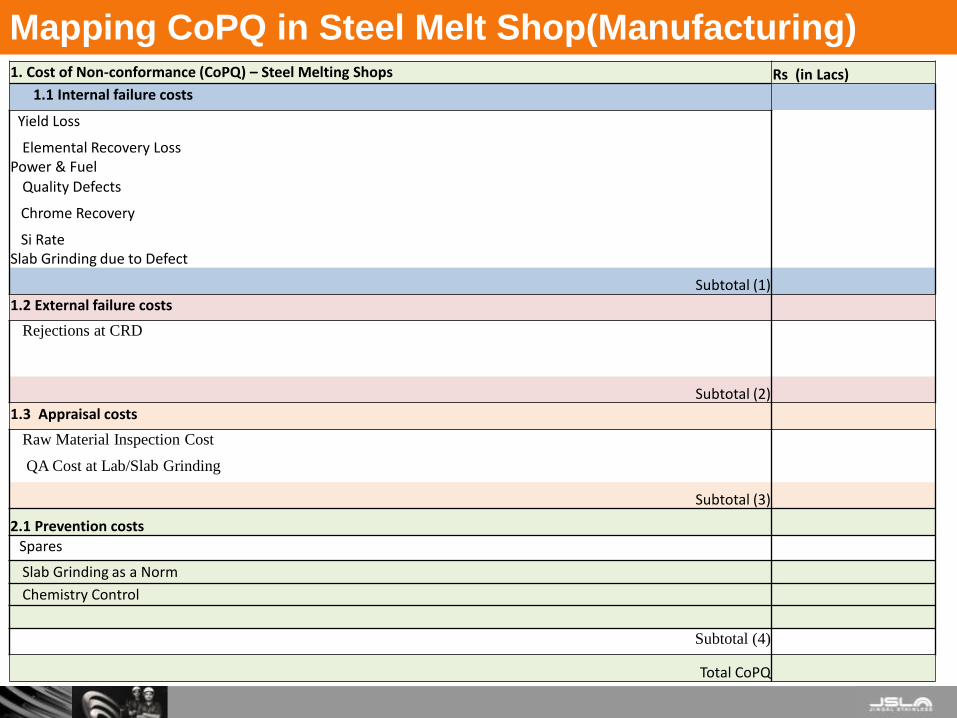
1. Cost of Non-conformance (CoPQ) – Steel Melting Shops Rs (in Lacs)
1.1 Internal failure costs
Yield Loss
Elemental Recovery LossPower & Fuel
Quality Defects
Chrome Recovery
Si RateSlab Grinding due to Defect
Subtotal (1)
1.2 External failure costs
Rejections at CRD
Subtotal (2)
1.3 Appraisal costs
Raw Material Inspection Cost
QA Cost at Lab/Slab Grinding
Subtotal (3)
2.1 Prevention costs
Spares
Slab Grinding as a Norm
Chemistry Control
Subtotal (4)
Total CoPQ
Mapping CoPQ in Steel Melt Shop(Manufacturing)
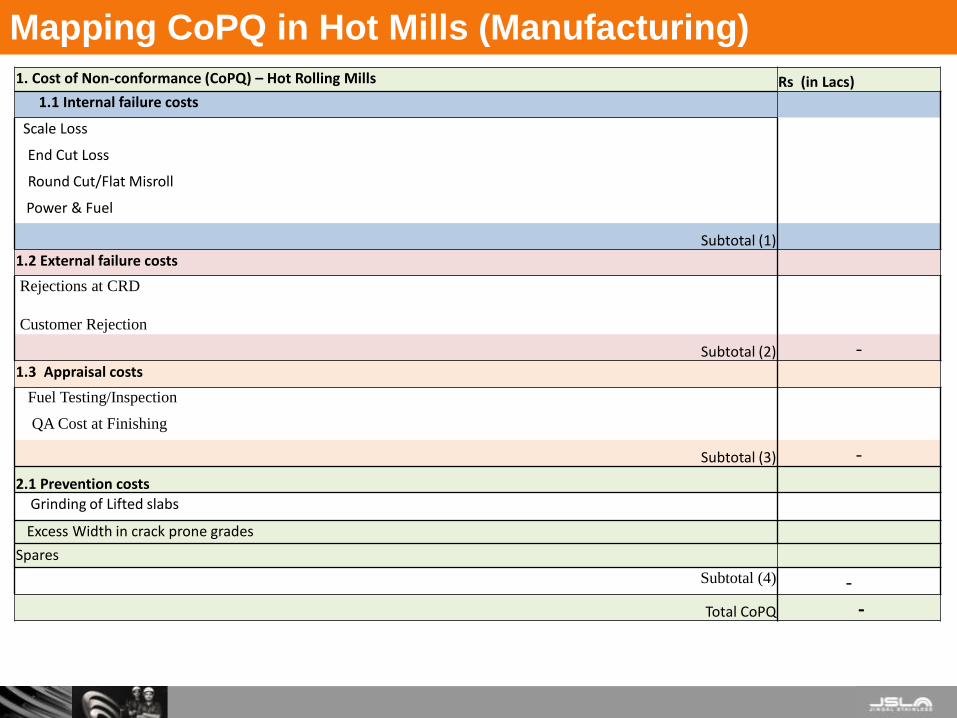
1. Cost of Non-conformance (CoPQ) – Hot Rolling Mills Rs (in Lacs)
1.1 Internal failure costs
Scale Loss
End Cut Loss
Round Cut/Flat Misroll
Power & Fuel
Subtotal (1)
1.2 External failure costs
Rejections at CRD
Customer Rejection
Subtotal (2) -1.3 Appraisal costs
Fuel Testing/Inspection
QA Cost at Finishing
Subtotal (3) -
2.1 Prevention costs
Grinding of Lifted slabs
Excess Width in crack prone grades
Spares
Subtotal (4) -
Total CoPQ -
Mapping CoPQ in Hot Mills (Manufacturing)
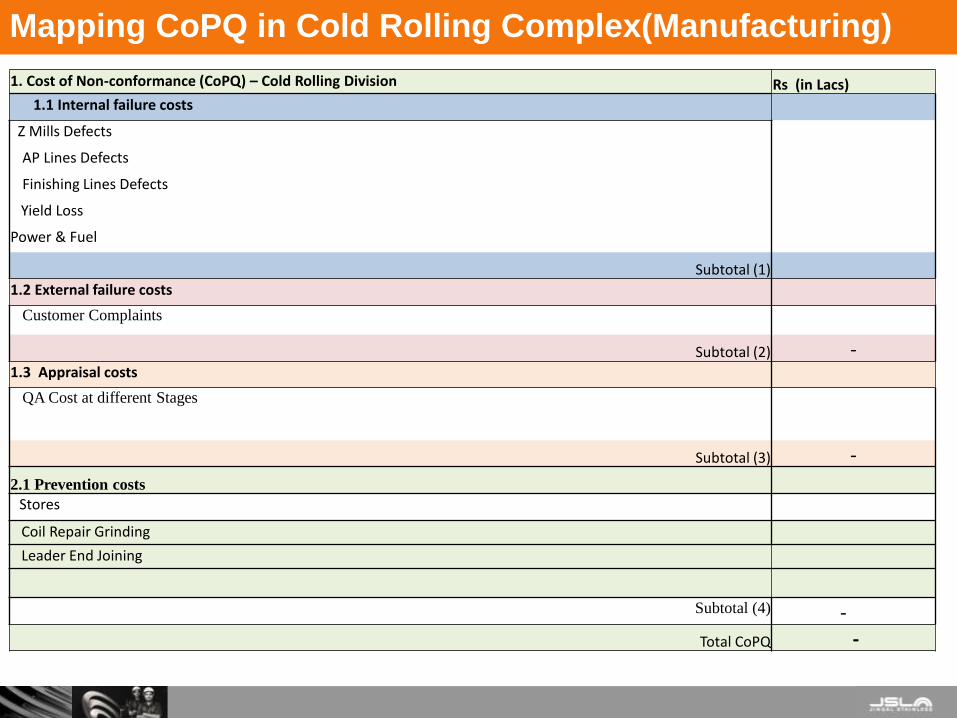
1. Cost of Non-conformance (CoPQ) – Cold Rolling Division Rs (in Lacs)
1.1 Internal failure costs
Z Mills Defects
AP Lines Defects
Finishing Lines Defects
Yield Loss
Power & Fuel
Subtotal (1)
1.2 External failure costs
Customer Complaints
Subtotal (2) -1.3 Appraisal costs
QA Cost at different Stages
Subtotal (3) -
2.1 Prevention costs
Stores
Coil Repair Grinding
Leader End Joining
Subtotal (4) -
Total CoPQ -
Mapping CoPQ in Cold Rolling Complex(Manufacturing)
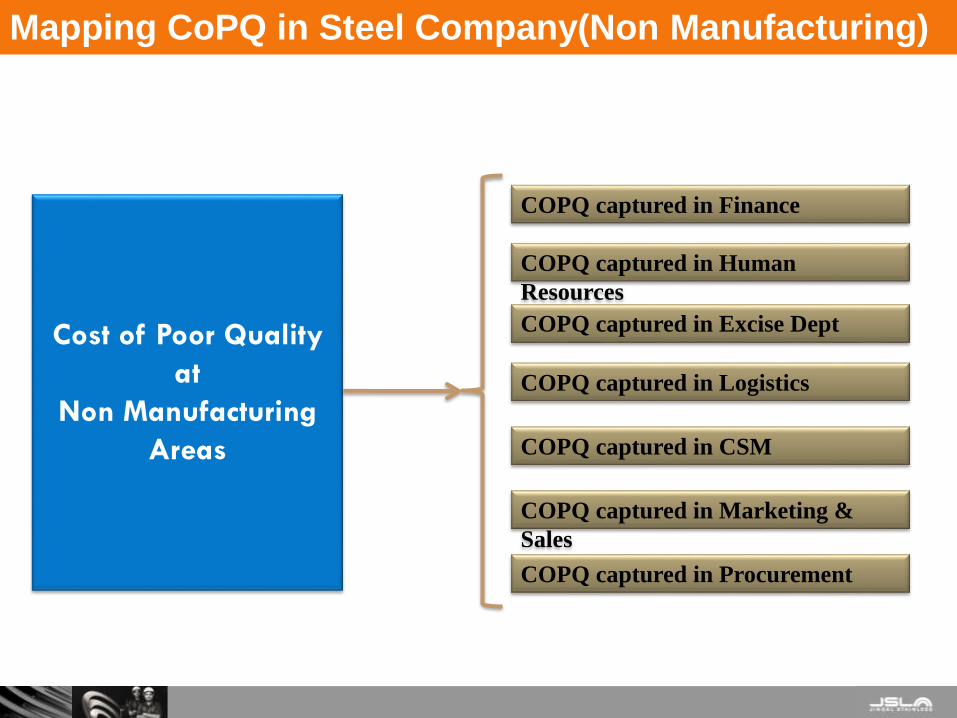
Cost of Poor Quality
at
Non Manufacturing
Areas
COPQ captured in Finance
COPQ captured in Human
Resources
COPQ captured in Procurement
COPQ captured in Marketing &
Sales
COPQ captured in Excise Dept
COPQ captured in Logistics
COPQ captured in CSM
Mapping CoPQ in Steel Company(Non Manufacturing)

1. Cost of Non-conformance (CoPQ) – Finance Rs (in Lacs)
1.1 Internal failure costs
• Excess Cost of Finance (In Comparison of Industry Norms)
• Issuance of Debit Notes
• Bank Charges
• Unutilized LCs
• Interest on Overdue Debtors
• Penal Interest on Overdrawn Funds
Subtotal (1)
1.2 External failure costs
• Bad Debts
• Overdue Accounts
• Delay in Refund of Claims
Subtotal (2)
1.3 Appraisal costs
• Internal Audit
• Litigation Fees
Subtotal (3)
Total Non-conformance Cost
2. Cost of Conformance
2.1 Prevention costs
Total Conformance Cost
Mapping CoPQ in Finance (Non Manufacturing)
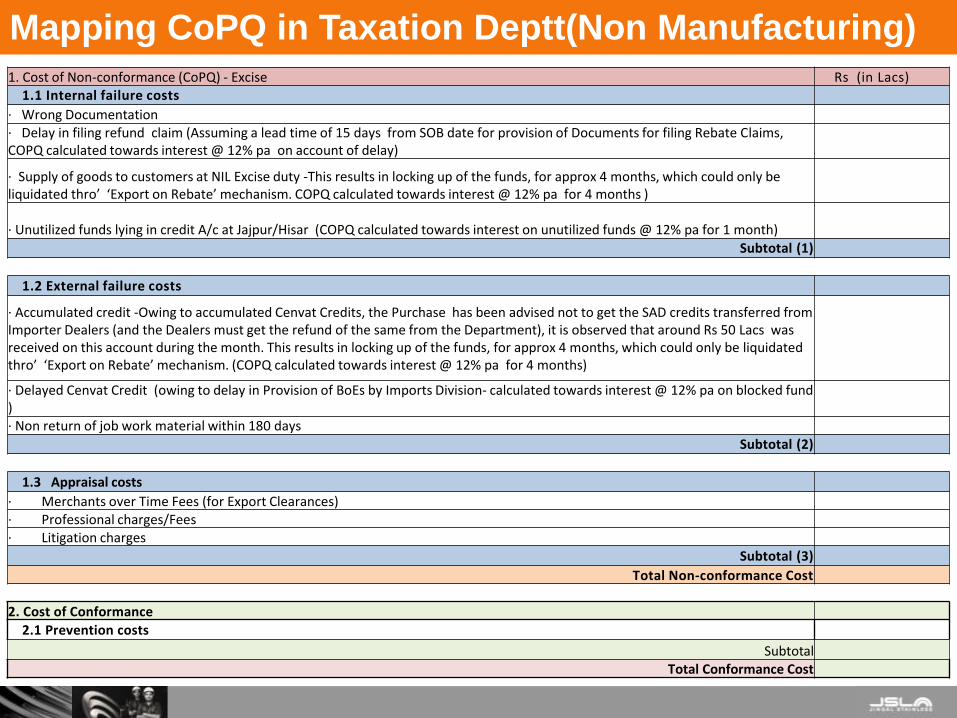
1. Cost of Non-conformance (CoPQ) - Excise Rs (in Lacs)1.1 Internal failure costs
· Wrong Documentation · Delay in filing refund claim (Assuming a lead time of 15 days from SOB date for provision of Documents for filing Rebate Claims, COPQ calculated towards interest @ 12% pa on account of delay)
· Supply of goods to customers at NIL Excise duty -This results in locking up of the funds, for approx 4 months, which could only be liquidated thro’ ‘Export on Rebate’ mechanism. COPQ calculated towards interest @ 12% pa for 4 months )
· Unutilized funds lying in credit A/c at Jajpur/Hisar (COPQ calculated towards interest on unutilized funds @ 12% pa for 1 month)
Subtotal (1)
1.2 External failure costs
· Accumulated credit -Owing to accumulated Cenvat Credits, the Purchase has been advised not to get the SAD credits transferred from Importer Dealers (and the Dealers must get the refund of the same from the Department), it is observed that around Rs 50 Lacs was received on this account during the month. This results in locking up of the funds, for approx 4 months, which could only be liquidated thro’ ‘Export on Rebate’ mechanism. (COPQ calculated towards interest @ 12% pa for 4 months)
· Delayed Cenvat Credit (owing to delay in Provision of BoEs by Imports Division- calculated towards interest @ 12% pa on blocked fund )· Non return of job work material within 180 days
Subtotal (2)
1.3 Appraisal costs
· Merchants over Time Fees (for Export Clearances)· Professional charges/Fees· Litigation charges
Subtotal (3)
Total Non-conformance Cost
2. Cost of Conformance
2.1 Prevention costs
SubtotalTotal Conformance Cost
Mapping CoPQ in Taxation Deptt(Non Manufacturing)
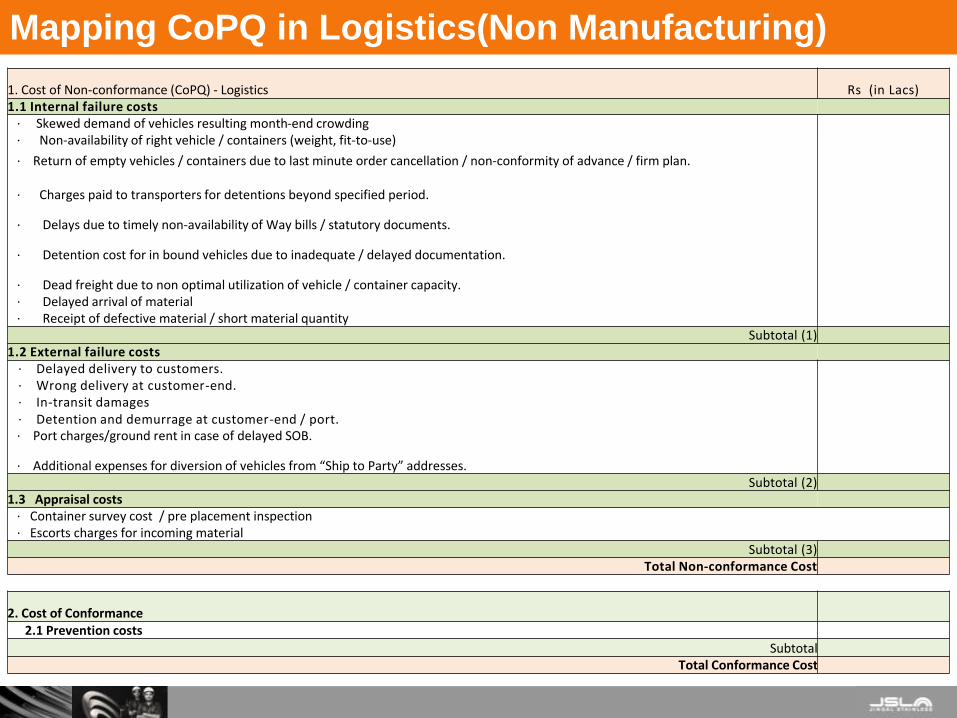
1. Cost of Non-conformance (CoPQ) - Logistics Rs (in Lacs)1.1 Internal failure costs
· Skewed demand of vehicles resulting month-end crowding· Non-availability of right vehicle / containers (weight, fit-to-use)
· Return of empty vehicles / containers due to last minute order cancellation / non-conformity of advance / firm plan.
· Charges paid to transporters for detentions beyond specified period.
· Delays due to timely non-availability of Way bills / statutory documents.
· Detention cost for in bound vehicles due to inadequate / delayed documentation.
· Dead freight due to non optimal utilization of vehicle / container capacity. · Delayed arrival of material· Receipt of defective material / short material quantity
Subtotal (1)1.2 External failure costs
· Delayed delivery to customers. · Wrong delivery at customer-end.· In-transit damages · Detention and demurrage at customer-end / port.· Port charges/ground rent in case of delayed SOB.
· Additional expenses for diversion of vehicles from “Ship to Party” addresses.Subtotal (2)
1.3 Appraisal costs· Container survey cost / pre placement inspection· Escorts charges for incoming material
Subtotal (3)Total Non-conformance Cost
2. Cost of Conformance2.1 Prevention costs
SubtotalTotal Conformance Cost
Mapping CoPQ in Logistics(Non Manufacturing)
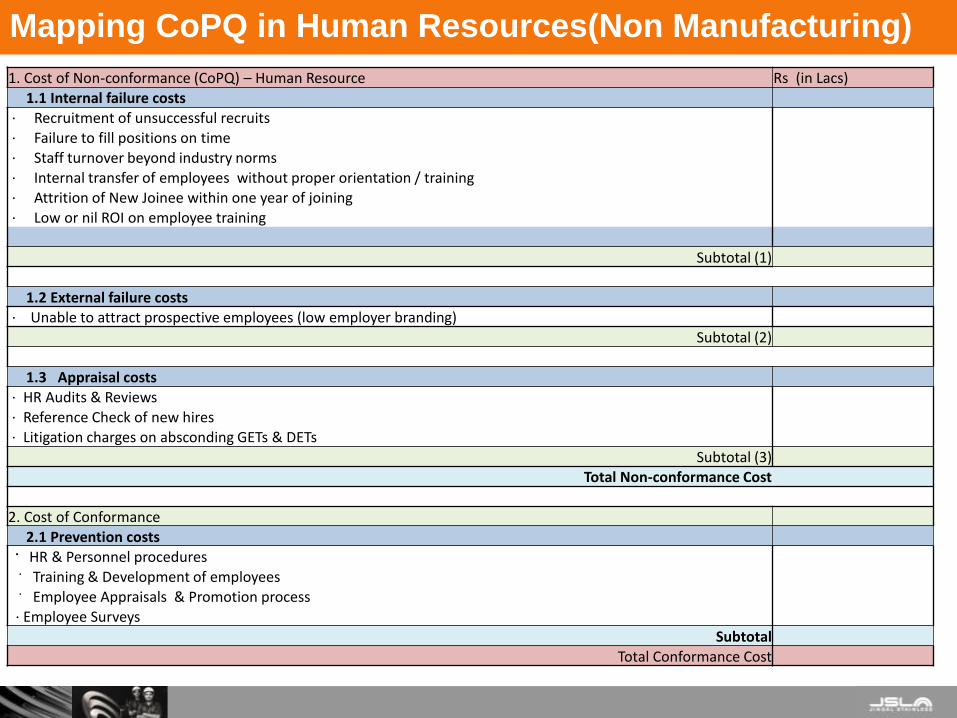
1. Cost of Non-conformance (CoPQ) – Human Resource Rs (in Lacs)
1.1 Internal failure costs· Recruitment of unsuccessful recruits· Failure to fill positions on time· Staff turnover beyond industry norms · Internal transfer of employees without proper orientation / training· Attrition of New Joinee within one year of joining · Low or nil ROI on employee training
Subtotal (1)
1.2 External failure costs· Unable to attract prospective employees (low employer branding)
Subtotal (2)
1.3 Appraisal costs· HR Audits & Reviews · Reference Check of new hires· Litigation charges on absconding GETs & DETs
Subtotal (3)Total Non-conformance Cost
2. Cost of Conformance2.1 Prevention costs
· HR & Personnel procedures · Training & Development of employees· Employee Appraisals & Promotion process· Employee Surveys
SubtotalTotal Conformance Cost
Mapping CoPQ in Human Resources(Non Manufacturing)
➢ Any reduction in CoPQ comes directly in Profit
➢ Tool for driving Improvements : PIPs
➢ Promotes the effective use of resources – Hidden factory
concept ; factory within factory
➢ Maps the Performance : Showing the Mirror
➢ Provides incentives for doing the job right first time.
Relevance of CoPQ
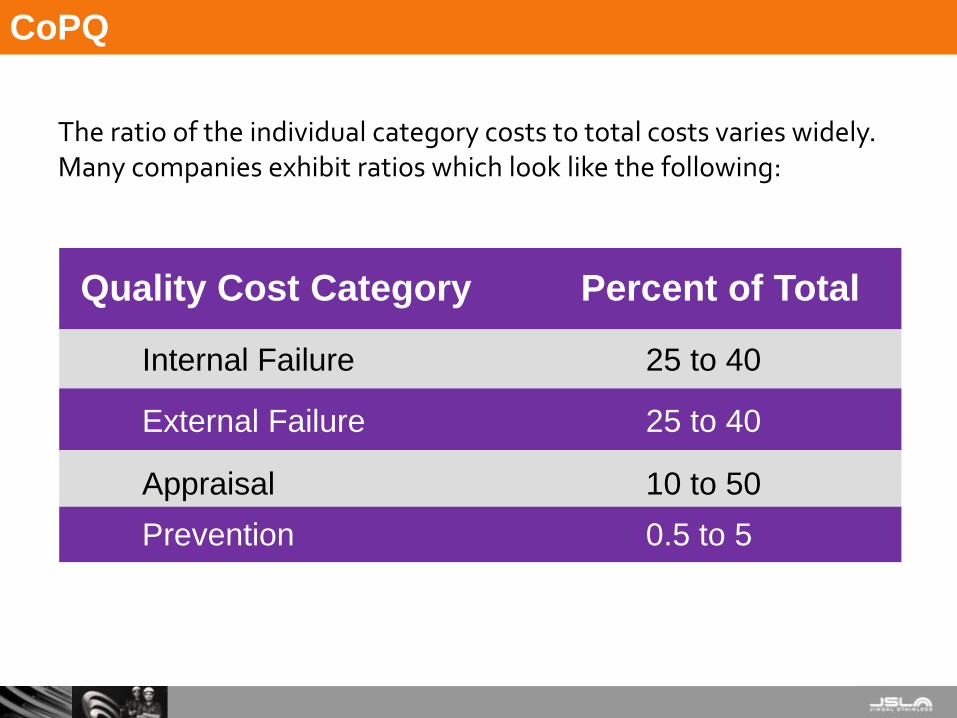
The ratio of the individual category costs to total costs varies widely. Many companies exhibit ratios which look like the following:
Quality Cost Category Percent of Total
Internal Failure 25 to 40
External Failure 25 to 40
Appraisal 10 to 50
Prevention 0.5 to 5
CoPQ
Set Your Own Targets & Goals : Global Best…….
✓Map performance with Self Best
✓ Take Stretch Targets…. Question Everything
✓Evaluate Minimum Theoretical Consumptions required
✓Use Statistical Tools to break the Myths
✓Waste Minimization & Re-Use
✓ Process Innovation
✓ Introduce Value Provider Products
Benchmarking

Thanks