
jim09st
20
U.S. Department of Justice Office of Justice Programs Bureau of Justice Statistics Bureau of Justice Statistics June 2010, NCJ 230122 Statisti cal T ables For a list of publications in this series go to http://bjs.ojp.usdoj.gov/index.cfm?ty=pbse&sid=38 Jail Inmates at Midyear 2009–Statistical Tables Todd D. Minton BJS Statistician Between midyear 2008 and midyear 2009, the con- fined inmate population in county and city jails (767,620) declined by 2.3% (down 17,936 inmates) (figure 1). Since midyear 2005, growth in the U.S. jail population has slowed ( table 1), but this is the first actual decline in the jail population since the Bureau of Justice Statistics (BJS) began the Annual Survey of Jails in 1982. During the 12 months ending June 30, 2009, the number of male (-1.7%), female (-6.0%), and adult (-2.2%) inmates declined. Also juvenile inmates held as adults (-8.8%) declined between midyear 2008 and 2009 ( tables 6 and 7). At midyear 2009, whites represented 42.5% of all jail inmates; blacks, 39.2%; and Hispanics, 16.2%. These percents have remained nearly stable since midyear 2000. At midyear 2009, about 6 in 10 unconvicted offend- ers in jail were awaiting court action on a current charge, a trend unchanged since 2005. Similarly, the unconvicted male (54.8%) and female (7.4%) popu- lation has remained relatively stable during that time period. Jail jurisdictions held more than 24,200 inmates at midyear 2009 for the U.S. Immigration and Cus- toms Enforcement, nearly double the number held at midyear 2000 (12,500) ( table 8). Figure 1 Inmates confined in local jails at midyear and annual percent change in the jail population, 2000-2009 J J J J J J J J J J 2000 2001 2002 2003 2004 2005 2006 2007 2008 2009 400,000 450,000 500,000 550,000 600,000 650,000 700,000 750,000 800,000 -3 -2 -1 0 1 2 3 4 5 6 Annual percent change Number of inmates at midyear Number of inmates % Annual percent change
-
Upload
matthew-bowers -
Category
Documents
-
view
217 -
download
0
Transcript of jim09st

8/7/2019 jim09st
http://slidepdf.com/reader/full/jim09st 1/20
U.S. Department of Justice
Office of Justice Programs
Bureau of Justice Statistics
Bureau of Justice Statistics
June 2010, NCJ 230122Statistical Tables
For a list of publications in this series go to http://bjs.ojp.usdoj.gov/index.cfm?ty=pbse&sid=38
Jail Inmates at Midyear 2009–Statistical TablesTodd D. Minton
BJS Statistician
Between midyear 2008 and midyear 2009, the con-fined inmate population in county and city jails(767,620) declined by 2.3% (down 17,936 inmates)(figure 1). Since midyear 2005, growth in the U.S.jail population has slowed (table 1), but this is thefirst actual decline in the jail population since theBureau of Justice Statistics (BJS) began the AnnualSurvey of Jails in 1982.
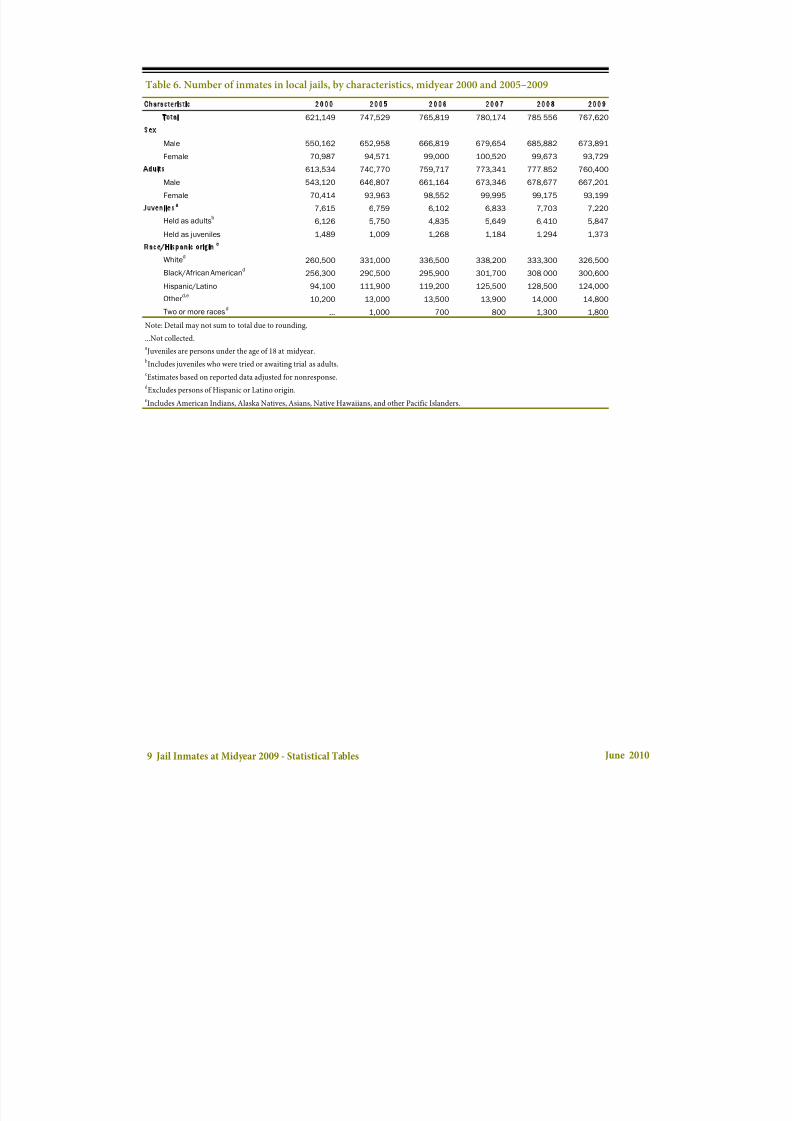
During the 12 months ending June 30, 2009, thenumber of male (-1.7%), female (-6.0%), and adult(-2.2%) inmates declined. Also juvenile inmatesheld as adults (-8.8%) declined between midyear2008 and 2009 (tables 6 and 7).
At midyear 2009, whites represented 42.5% of alljail inmates; blacks, 39.2%; and Hispanics, 16.2%.These percents have remained nearly stable sincemidyear 2000.
At midyear 2009, about 6 in 10 unconvicted offend-ers in jail were awaiting court action on a currentcharge, a trend unchanged since 2005. Similarly, theunconvicted male (54.8%) and female (7.4%) popu-lation has remained relatively stable during thattime period.
Jail jurisdictions held more than 24,200 inmates atmidyear 2009 for the U.S. Immigration and Cus-toms Enforcement, nearly double the number heldat midyear 2000 (12,500) (table 8).
Figure 1Inmates confined in local jails at midyear and annual percent change in the jail population,
2000-2009
J
J
J
J
J
J
J
J
J
J
2000 2001 2002 2003 2004 2005 2006 2007 2008 2009
400,000
450,000
500,000
550,000
600,000
650,000
700,000
750,000
800,000
-3
-2
-1
0
1
2
3
4
5
6
Annual percent change
Number of inmatesat midyear
Number of inmates
%Annual percentchange
8/7/2019 jim09st
http://slidepdf.com/reader/full/jim09st 2/20
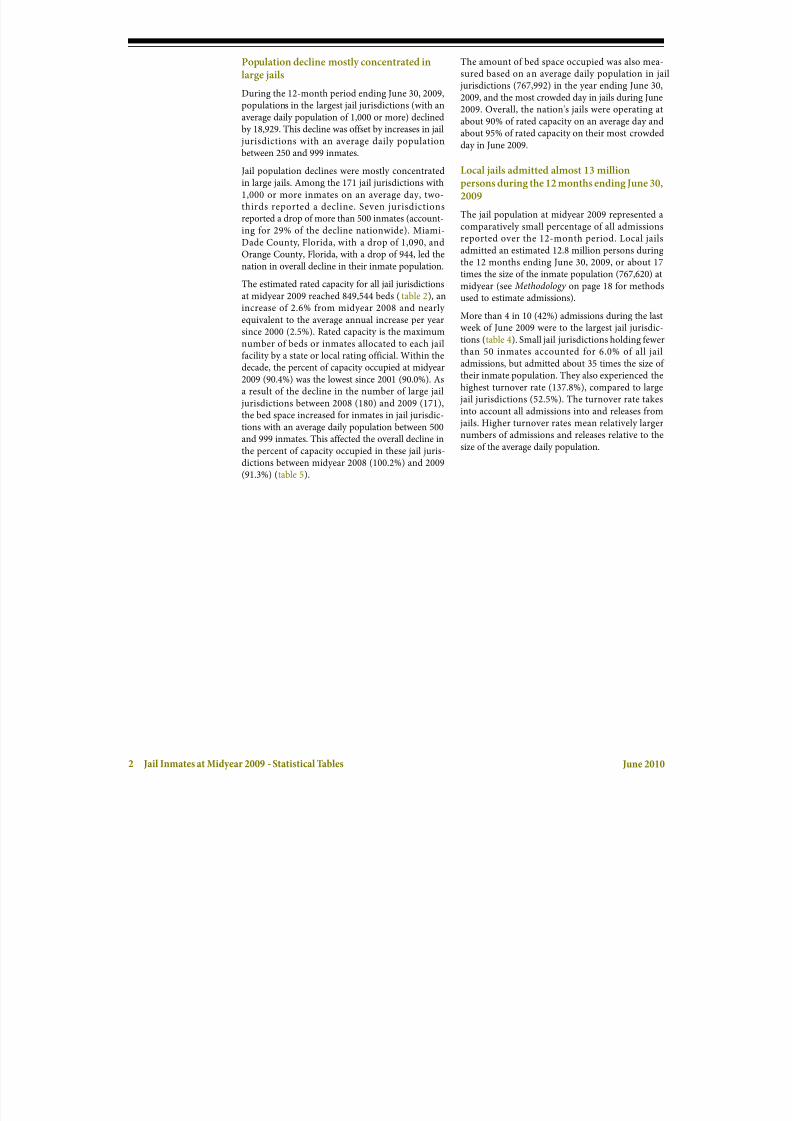
Population decline mostly concentrated inlarge jails
During the 12-month period ending June 30, 2009,populations in the largest jail jurisdictions (with anaverage daily population of 1,000 or more) declinedby 18,929. This decline was offset by increases in jailjurisdictions with an average daily population
between 250 and 999 inmates.
Jail population declines were mostly concentratedin large jails. Among the 171 jail jurisdictions with1,000 or more inmates on an average day, two-thirds reported a decline. Seven jurisdictionsreported a drop of more than 500 inmates (account-ing for 29% of the decline nationwide). Miami-Dade County, Florida, with a drop of 1,090, andOrange County, Florida, with a drop of 944, led thenation in overall decline in their inmate population.
The estimated rated capacity for all jail jurisdictionsat midyear 2009 reached 849,544 beds (table 2), anincrease of 2.6% from midyear 2008 and nearly equivalent to the average annual increase per yearsince 2000 (2.5%). Rated capacity is the maximumnumber of beds or inmates allocated to each jailfacility by a state or local rating official. Within thedecade, the percent of capacity occupied at midyear2009 (90.4%) was the lowest since 2001 (90.0%). Asa result of the decline in the number of large jailjurisdictions between 2008 (180) and 2009 (171),the bed space increased for inmates in jail jurisdic-tions with an average daily population between 500and 999 inmates. This affected the overall decline in
the percent of capacity occupied in these jail juris-dictions between midyear 2008 (100.2%) and 2009(91.3%) (table 5).
The amount of bed space occupied was also mea-sured based on an average daily population in jajurisdictions (767,992) in the year ending June 302009, and the most crowded day in jails during June2009. Overall, the nation's jails were operating aabout 90% of rated capacity on an average day andabout 95% of rated capacity on their most crowdedday in June 2009.
Local jails admitted almost 13 millionpersons during the 12 months ending June 30,2009
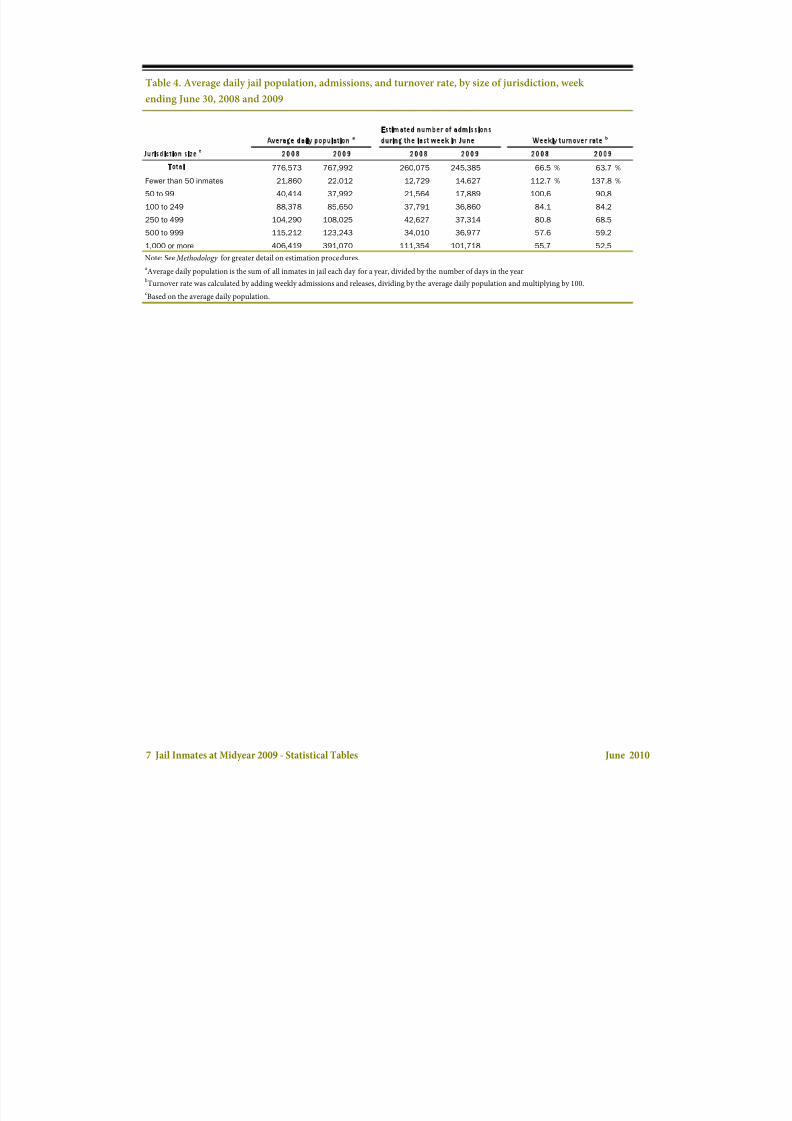
The jail population at midyear 2009 represented acomparatively small percentage of all admissionsreported over the 12-month period. Local jailsadmitted an estimated 12.8 million persons duringthe 12 months ending June 30, 2009, or about 17times the size of the inmate population (767,620) atmidyear (see Methodology on page 18 for method
used to estimate admissions).More than 4 in 10 (42%) admissions during the lastweek of June 2009 were to the largest jail jurisdictions (table 4). Small jail jurisdictions holding fewethan 50 inmates accounted for 6.0% of all jaiadmissions, but admitted about 35 times the size otheir inmate population. They also experienced thehighest turnover rate (137.8%), compared to largejail jurisdictions (52.5%). The turnover rate takesinto account all admissions into and releases fromjails. Higher turnover rates mean relatively largenumbers of admissions and releases relative to thesize of the average daily population.
June 20102 Jail Inmates at Midyear 2009 - Statistical Tables
8/7/2019 jim09st
http://slidepdf.com/reader/full/jim09st 3/20
2009 Statistical TablesTable 1. Inmates confined in local jails at midyear, average daily populationand incarceration rates, 2000-2009
Table 2. Rated capacity of local jails and percent of capacity occupied, 2000-2009
Table 3. Inmates confined in local jails at midyear, by size of jurisdiction, 2008and 2009
Table 4. Average daily jail population, admissions, and turnover rate,by size of jurisdiction, week ending June 30, 2008 and 2009
Table 5. Percent of jail capacity occupied at midyear, by size of jurisdiction,2000, 2008, and 2009
Table 6. Number of inmates in local jails, by characteristics, midyear 2000 and2005-2009
Table 7. Percent of inmates in local jails, by characteristics, midyear 2000 and2005-2009
Table 8. Inmate population in jail jurisdictions reporting on confined personsbeing held for U.S. Immigration and Customs Enforcement, midyear 2002-2009
Table 9. The 50 largest local jail jurisdictions: Number of inmates held, averagedaily population, and rated capacity, midyear 2007-2009
Table 10. Persons under jail supervision, by confinement status andtype of program, midyear 2000 and 2006-2009
Table 11. Estimated standard errors by confinement status, Annual Survey of Jails,2009
Table 12. Estimated standard errors by selected characteristics, Annual Survey of Jails, 2009
Table 13. Estimated percentages of local jail inmates, by selected characteristics
and ratio estimates, 2009
June 20103 Jail Inmates at Midyear 2009 - Statistical Tables

8/7/2019 jim09st
http://slidepdf.com/reader/full/jim09st 4/20
Year
621,149 2.5 % 618,319 1.7 % 226
631,240 1.6 625,966 1.2 222
665,475 5.4 652,082 4.2 231
691,301 3.9 680,760 4.4 238
713,990 3.3 706,242 3.7 243
747,529 4.7 733,442 3.9 252
765,819 2.4 755,320 3.0 256
780,174 1.9 773,138 2.4 259
785,556 0.7 776,573 0.4 258
767,620 -2.3 767,992 -1.1 250
2000-2008 3.0 % 2.9 %
2008-2009 -2.3 -1.1
bNumber of inmates confined at midyear per 100,000 U.S. residents.
Number
2008
2009
Average annual
change,
Table 1. Inmates confined in local jails at midyear, average daily
population, and incarceration rates, 2000–2009
aAverage daily population is the sum of all inmates in jail each day for a year, divided by the number of days in the year
Inmates confined at
midyear
Percent
change Jail incarceration rate b
2000
2001
2002
2003
2004
2005
2006
2007
Average daily populationa
Percent
changeNumber
4 Jail Inmates at Midyear 2009 - Statistical Tables June 2010

8/7/2019 jim09st
http://slidepdf.com/reader/full/jim09st 5/20
Year Number
677,787 25,466 3.9 % 92.0 %
699,309 21,522 3.2 90.0
713,899 14,590 2.1 93.0
736,471 22,572 3.2 94.0
755,603 19,132 2.6 94.0
786,954 33,398 4.1 95.0
794,984 8,638 1.0 96.3
810,543 15,863 2.0 96.3
828,413 17,870 2.2 94.8
849,544 21,131 2.6 90.4
2000-2008 2.5 % 22,381
2008-2009 2.6 21,131
Note: Capacity data for 2000-2004 and 2006-2009 were survey estimates subject to sampling error.
Year-to-year change in
capacitya
Table 2. Rated capacity of local jails and percent of capacity occupied, 2000–2009
bRated capacity is the number of beds or inmates assigned by a rating official to facilities within each jurisdiction.
aIncrease or reduction in the number of beds during the 12 months ending midyear of each year. Number and percent change
for 2000 are calculated using the rated capacity of 652,321 for 1999..
Percent of capacity
occupiedc
cNumber of confined inmates on the last weekday in June divided by the rated capacity and multiplied by 100
PercentRated capacityb
2000
2001
2002
2003
2004
2005
2006
2007
2008
2009
Average annual
increase,
5 Jail Inmates at Midyear 2009 - Statistical Tables June 2010

8/7/2019 jim09st
http://slidepdf.com/reader/full/jim09st 6/20
Jurisdiction size* 2008 2009 Difference 2008 2009
Total 785,556 767,620 -17,936 -2.3 % 100.0 % 100.0 %
Fewer than 50 inmates 23,484 22,046 -1,438 -6.1 % 3.0 % 2.9 %
50 to 99 41,445 37,838 -3,607 -8.7 5.3 4.9
100 to 249 90,466 86,279 -4,187 -4.6 11.5 11.2
250 to 499 105,620 108,462 2,842 2.7 13.4 14.1
500 to 999 116,057 123,442 7,385 6.4 14.8 16.1
1,000 or more 408,483 389,554 -18,929 -4.6 52.0 50.7
Note: Detail may not add to total because of rounding.
Number of inmates Percent of all inmates
Table 3. Inmates confined in local jails at midyear, by size of jurisdiction, 2008 and 2009
*Based on the average daily population. Average daily population is the sum of all inmates in jail each day for a year, divided by the number of
days in the year.
Percent
change
6 Jail Inmates at Midyear 2009 - Statistical Tables June 2010
8/7/2019 jim09st
http://slidepdf.com/reader/full/jim09st 7/20
2008 2009 2008 2009
Total 776,573 767,992 260,075 245,385 66.5 % 63.7 %
Fewer than 50 inmates 21,860 22,012 12,729 14,627 112.7 % 137.8 %
50 to 99 40,414 37,992 21,564 17,889 100.6 90.8
100 to 249 88,378 85,650 37,791 36,860 84.1 84.2
250 to 499 104,290 108,025 42,627 37,314 80.8 68.5
500 to 999 115,212 123,243 34,010 36,977 57.6 59.2
1,000 or more 406,419 391,070 111,354 101,718 55.7 52.5
Note: See Methodology for greater detail on estimation procedures.
cBased on the average daily population.
Table 4. Average daily jail population, admissions, and turnover rate, by size of jurisdiction, week
ending June 30, 2008 and 2009
2008 2009
Weekly turnover rateb
Average daily populationa
Estimated number of admissions
during the last week in June
Jurisdiction size c
aAverage daily population is the sum of all inmates in jail each day for a year, divided by the number of days in the year
bTurnover rate was calculated by adding weekly admissions and releases, dividing by the average daily population and multiplying by 100.
7 Jail Inmates at Midyear 2009 - Statistical Tables June 2010

8/7/2019 jim09st
http://slidepdf.com/reader/full/jim09st 8/20
Total 91.6 % 94.8 % 90.4 %
Fewer than 50 inmates 66.4 % 67.3 % 62.2 %
50 to 99 80.4 83.6 78.6
100 to 249 94.1 91.0 84.3
250 to 499 95.7 96.0 93.5
500 to 999 94.3 100.2 91.3
1,000 or more 94.1 97.6 94.5
aNumber of inmates at midyear divided by the rated capacity multiplied by 100.
bBased on the average daily population.
2009
Table 5. Percent of jail capacity occupied at midyear, by size of jurisdiction, 2000,
2008, and 2009
Percent of capacity occupieda
Jurisdiction sizeb
2000 2008
8 Jail Inmates at Midyear 2009 - Statistical Tables June 2010
8/7/2019 jim09st
http://slidepdf.com/reader/full/jim09st 9/20
2000 2005 2006 2007 2008 2009
Total 621,149 747,529 765,819 780,174 785,556 767,620
Male 550,162 652,958 666,819 679,654 685,882 673,891
Female 70,987 94,571 99,000 100,520 99,673 93,729
613,534 740,770 759,717 773,341 777,852 760,400
Male 543,120 646,807 661,164 673,346 678,677 667,201
Female 70,414 93,963 98,552 99,995 99,175 93,199
7,615 6,759 6,102 6,833 7,703 7,220
Held as adultsb
6,126 5,750 4,835 5,649 6,410 5,847
Held as juveniles 1,489 1,009 1,268 1,184 1,294 1,373
Whited
260,500 331,000 336,500 338,200 333,300 326,500
Black/African Americand
256,300 290,500 295,900 301,700 308,000 300,600
Hispanic/Latino 94,100 111,900 119,200 125,500 128,500 124,000
Otherd,e
10,200 13,000 13,500 13,900 14,000 14,800Two or more races
d... 1,000 700 800 1,300 1,800
Note: Detail may not sum to total due to rounding.
...Not collected.aJuveniles are persons under the age of 18 at midyear.
bIncludes juveniles who were tried or awaiting trial as adults.
cEstimates based on reported data adjusted for nonresponse.
dExcludes persons of Hispanic or Latino origin.
eIncludes American Indians, Alaska Natives, Asians, Native Hawaiians, and other Pacific Islanders.
Table 6. Number of inmates in local jails, by characteristics, midyear 2000 and 2005–2009
Characteristic
Sex
Adults
Juvenilesa
Race/Hispanic originc
9 Jail Inmates at Midyear 2009 - Statistical Tables June 2010

8/7/2019 jim09st
http://slidepdf.com/reader/full/jim09st 10/20
Characteristic
Male 88.6 % 87.3 % 87.1 % 87.1 % 87.3 % 87.8 %
Female 11.4 12.7 12.9 12.9 12.7 12.2
98.8 % 99.1 % 99.2 % 99.1 % 99.0 % 99.1 %
Male 87.4 86.5 86.3 86.3 86.4 86.9
Female 11.3 12.6 12.9 12.8 12.6 12.1
1.2 % 0.9 % 0.8 % 0.9 % 1.0 % 0.9 %
Held as adultsb
1.0 0.8 0.6 0.7 0.8 0.8
Held as juveniles 0.2 0.1 0.2 0.2 0.2 0.2
Whited
41.9 % 44.3 % 43.9 % 43.3 % 42.5 % 42.5 %
Black/African Americand
41.3 38.9 38.6 38.7 39.2 39.2
Hispanic/Latino 15.2 15.0 15.6 16.1 16.4 16.2
Otherd,e
1.6 1.7 1.8 1.8 1.8 1.9
Two or more racesd
... 0.1 0.1 0.1 0.2 0.2
Convicted 44.0 % 38.0 % 37.9 % 38.0 % 37.1 % 37.8 %
Male 39.0 33.2 32.8 32.9 32.3 33.0
Female 5.0 4.9 5.0 5.2 4.8 4.8
Unconvicted 56.0 62.0 62.1 62.0 62.9 62.2
Male 50.0 54.2 54.3 54.3 55.2 54.8
Female 6.0 7.7 7.8 7.7 7.8 7.4
Note: Detail may not sum to total due to rounding.
...Not collected.
bIncludes juveniles who were tried or awaiting trial as adults.
eIncludes American Indians, Alaska Natives, Asians, Native Hawaiians, and other Pacific Islanders.
Sex
Adults
Juvenilesa
Race/Hispanic originc
Conviction status b
Table 7. Percent of inmates in local jails, by characteristics, midyear 2000 and 2005–2009
2009
aPersons under age 18 at midyear.
cEstimates based on reported data and adjusted for nonresponse.
dExcludes persons of Hispanic or Latino origin.
2000 2005 2006 2007 2008
10 Jail Inmates at Midyear 2009 - Statistical Tables June 2010

8/7/2019 jim09st
http://slidepdf.com/reader/full/jim09st 11/20
Year
2002 2,961 626,870 12,501 2.0 %
2003 2,940 637,631 13,337 2.1
2004 2,962 673,807 14,120 2.1
2005 2,824 703,084 11,919 1.7
2006 2,784 698,108 13,598 1.9
2007 2,713 683,640 15,063 2.2
2008 2,699 704,278 20,785 3.0
2009 2,643 685,500 24,278 3.5
bNot all jurisdictions reported on this specific characteristic.
aICEImmigration and Customs Enforcement.
Table 8. Jurisdictions reporting on holdings for ICE, midyear
2002–2009
Number
Percent of all
inmates
Jurisdications
reporting on
holdings for ICE b
Total number
of inmates
Confined persons held for ICEa
11 Jail Inmates at Midyear 2009 - Statistical Tables June 2010

8/7/2019 jim09st
http://slidepdf.com/reader/full/jim09st 12/20
2007 2008 2009 2007 2008 2009 2007 2008 2009
Total 226,838 229,710 226,073 226,213 227,565 225,068 239,033 243,287 245,270
Los Angeles County, CA 19,175 19,533 19,869 19,266 19,836 19,437 21,364 22,349 22,477
New York City, NY 14,120 13,804 13,130 14,004 13,849 13,365 19,686 19,554 19,636
Harris County, TX 9,900 10,063 11,360 9,430 10,000 11,361 9,391 9,391 9,391
Cook County, IL 9,410 9,984 9,737 9,496 9,900 9,383 10,158 10,158 10,607
Philadelphia City, PA 8,607 8,824 9,436 8,448 8,811 9,359 8,685 8,685 8,685
Maricopa County, AZ 9,466 9,536 8,745 8,941 9,265 9,215 7,270 9,395 9,395
Orange County, CA 6,841 6,216 5,990 6,571 6,000 6,255 7,019 7,019 7,019
Miami-Dade County, FL 6,835 7,082 5,992 6,844 7,050 6,051 6,005 5,845 5,845
Dallas County, TX 6,261 6,252 6,222 6,389 6,385 6,039 7,145 7,665 8,097
Shelby County, TN 5,741 5,925 5,961 5,570 5,765 5,943 6,811 6,675 6,669
San Bernardino County, CA 5,639 5,596 5,923 5,596 5,593 5,591 5,914 5,970 5,914
San Diego County, CA 5,133 5,435 5,215 5,172 5,363 5,263 4,778 4,972 4,664
Broward County, FL 5,782 5,509 4,915 6,051 5,500 4,981 6,452 5,722 5,504
Sacramento County, CA 4,361 4,592 4,796 4,592 4,563 4,700 4,775 5,075 5,075
Santa Clara County, CA 4,748 4,664 4,244 4,852 4,660 4,498 4,169 3,825 3,825
Alameda County, CA 3,978 4,345 4,405 4,282 4,371 4,444 4,505 4,243 4,673
Orange County, FL 4,180 4,665 3,721 4,146 4,294 4,206 4,721 4,721 4,721
Bexar County, TX 4,088 4,279 4,377 4,067 4,062 4,093 4,294 4,598 4,528
Baltimore City, MD 4,182 4,265 3,957 4,126 4,010 3,997 3,683 3,683 3,683
Jacksonville City, FL 3,581 3,799 3,950 3,725 3,606 3,728 3,137 3,137 3,137
Hillsborough County, FL 3,913 3,857 3,503 3,949 3,985 3,658 4,190 4,190 4,190
Davidson County, TN 3,641 3,934 3,748 3,445 3,528 3,567 3,679 3,679 4,010
Riverside County, CA 3,492 3,597 3,675 3,433 3,530 3,472 3,129 3,132 3,132
Tarrant County, TX 3,341 3,574 3,151 3,500 3,500 3,432 4,564 4,379 4,562
DeKalb County, GA 2,772 3,365 3,304 2,619 2,906 3,404 3,636 3,636 3,636
Gwinnett County, GA 3,142 3,415 3,289 3,033 3,311 3,361 3,538 3,419 3,492
Pinellas County, FL 3,510 3,463 3,233 3,644 3,559 3,145 3,353 4,155 4,151
Table 9. The 50 largest local jail jurisdictions: Number of inmates held, average daily population and rated capacity
Number of inmatesa
Rated capacityc
Average daily populationb
12 Jail Inmates at Midyear 2009 - Statistical Tables

8/7/2019 jim09st
http://slidepdf.com/reader/full/jim09st 13/20

8/7/2019 jim09st
http://slidepdf.com/reader/full/jim09st 14/20
Confinement status and type of program 2000 2006 2007 2008 2009
Total 687,033 826,041 848,419 858,407 837,833
Held in jail 621,149 765,819 780,174 785,556 767,620
Supervised outside of a jail facilitya
65,884 60,222 68,245 72,852 70,213
Weekender programs 14,523 11,421 10,473 12,325 11,212
Electronic monitoring 10,782 10,999 13,121 13,539 11,834
Home detentionb
332 807 512 498 738
Day reporting 3,969 4,841 6,163 5,758 6,492
Community service 13,592 14,667 15,327 18,475 17,738
Other pretrial supervision 6,279 6,409 11,148 12,452 12,439
Other work programsc
8,011 8,319 7,369 5,808 5,912
Treatment programsd
5,714 1,486 2,276 2,259 2,082
Other 2,682 1,273 1,857 1,739 1,766
a
Excludes persons supervised by a probation or parole agency.bIncludes only persons without electronic monitoring.
cIncludes persons in work release programs, work gangs, and other alternative work programs.
dIncludes persons under drug, alcohol, mental health, and other medical treatment.
Number of persons under jail supervision
Table 10. Persons under jail supervision, by confinement status and type of program, midyear 2000
and 2006–2009
14 Jail Inmates at Midyear 2009 - Statistical Tables June 2010

8/7/2019 jim09st
http://slidepdf.com/reader/full/jim09st 15/20
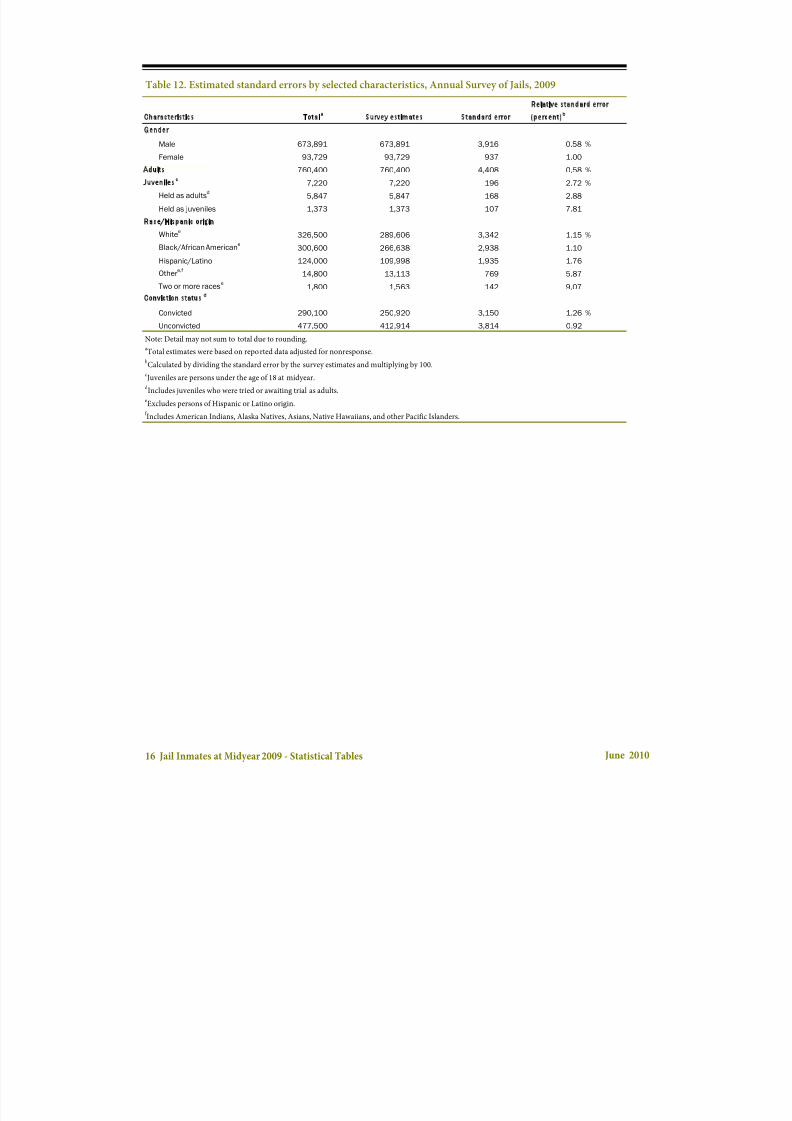
Characteristics
Total 837,833 4,794 0.57 %
Held in jail 767,620 4,453 0.58 %
Supervised outside a jail facility 70,213 1,539 2.19
Excluding weekenders 59,001 1,492 2.53
Weekender programs 11,212 351 3.13
Average daily population 767,992 4,347 0.57
Rated capacity 849,544 6,622 0.78
Admissions 245,385 3,424 1.40
*Calculated by dividing the standard error by the survey estimates and multiplying by 100.
Survey estimates Standard error Relative standard error*
Table 11. Estimated standard errors by confinement status, Annual Survey of Jails, 2009
15 Jail Inmates at Midyear 2009 - Statistical Tables June 2010
8/7/2019 jim09st
http://slidepdf.com/reader/full/jim09st 16/20
Gender
Male 673,891 673,891 3,916 0.58 %
Female 93,729 93,729 937 1.00
Adults 760,400 760,400 4,408 0.58 %
Juvenilesc
7,220 7,220 196 2.72 %
Held as adultsd
5,847 5,847 168 2.88
Held as juveniles 1,373 1,373 107 7.81
Race/Hispanic origin
Whitee
326,500 289,606 3,342 1.15 %
Black/African Americane
300,600 266,638 2,938 1.10
Hispanic/Latino 124,000 109,998 1,935 1.76
Othere,f
14,800 13,113 769 5.87
Two or more racese
1,800 1,563 142 9.07
Conviction status
d
Convicted 290,100 250,920 3,150 1.26 %
Unconvicted 477,500 412,914 3,814 0.92
Note: Detail may not sum to total due to rounding.aTotal estimates were based on reported data adjusted for nonresponse.
bCalculated by dividing the standard error by the survey estimates and multiplying by 100.
cJuveniles are persons under the age of 18 at midyear.
dIncludes juveniles who were tried or awaiting trial as adults.
eExcludes persons of Hispanic or Latino origin.
f Includes American Indians, Alaska Natives, Asians, Native Hawaiians, and other Pacific Islanders.
Characteristics
Relative standard error
(percent)b
Survey estimates Standard error
Table 12. Estimated standard errors by selected characteristics, Annual Survey of Jails, 2009
Totala
16 Jail Inmates at Midyear 2009 - Statistical Tables June 2010
8/7/2019 jim09st
http://slidepdf.com/reader/full/jim09st 17/20
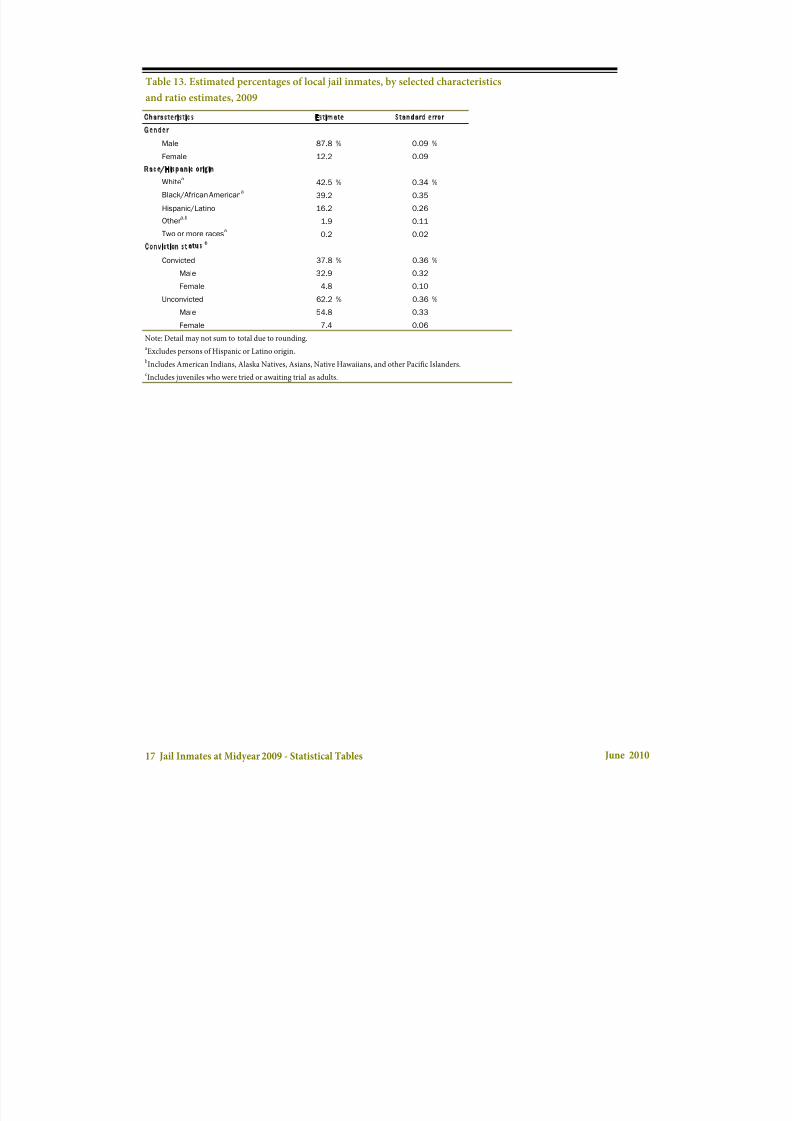
Characteristics
Gender
Male 87.8 % 0.09 %
Female 12.2 0.09
Race/Hispanic origin
Whitea
42.5 % 0.34 %
Black/African Americana
39.2 0.35
Hispanic/Latino 16.2 0.26
Othera,b
1.9 0.11
Two or more racesa
0.2 0.02
Conviction statusc
Convicted 37.8 % 0.36 %
Male 32.9 0.32
Female 4.8 0.10
Unconvicted 62.2 % 0.36 %Male 54.8 0.33
Female 7.4 0.06
Table 13. Estimated percentages of local jail inmates, by selected characteristics
and ratio estimates, 2009
cIncludes juveniles who were tried or awaiting trial as adults.
bIncludes American Indians, Alaska Natives, Asians, Native Hawaiians, and other Pacific Islanders.
aExcludes persons of Hispanic or Latino origin.
Note: Detail may not sum to total due to rounding.
Estimate Standard error
17 Jail Inmates at Midyear 2009 - Statistical Tables June 2010

8/7/2019 jim09st
http://slidepdf.com/reader/full/jim09st 18/20
Methodology
Annual Survey of Jails
In years between complete census of local jails, BJS conducts theAnnual Survey of Jails (ASJ). ASJ is a sample survey of local jailsused to estimate the number and characteristics of local inmatesnationwide. For the 2009 ASJ, the U.S. Census Bureau, as the
collection agent, drew a sample of 874 jurisdictions and 934 jailfacilities. This sample represents approximately 2,829 jail juris-dictions nationwide. Local jail jurisdictions included counties(parishes in Louisiana) or municipal governments that adminis-tered one or more local jails. Data were estimated for one juris-diction that did not respond to the survey. Two jail facilitieswere closed during the survey collection.
The 2009 ASJ sample included all jails with certainty (67) thatwere operated jointly by two or more jurisdictions, or multi-jurisdictional jails. Other jail jurisdictions included with cer-tainty (268) were those that
• held juvenile inmates at the time of the 2005 Census of JailInmates and had an average daily population of 500 or moreinmates during the 12 months ending June 30, 2005.
• held only adult inmates and had an average daily population of 750 or more.
The remaining jurisdictions were stratified into two groups:jurisdictions with jails holding at least one juvenile on June 30,2005, and jails holding only adults on that date. Using stratifiedrandom sampling, 541 jurisdictions were selected from 8 stratabased on the two conditions enumerated above and 4 stratabased on the average daily jail inmate population during 2005.The average daily jail inmate population was derived from the
2005 Census of Jail Inmates.Data were obtained from sampled jurisdictions by mail-out andweb-based survey questionnaires. After follow-up phone callsand facsimiles to respondents, the response rate for the survey was 100% for critical items, such as the number of inmates con-fined, average daily population, and rated capacity. (See appen-dix tables 11, 12, and 13 for standard errors associated withreported estimates from the ASJ 2009 at<http://www.ojp.usdoj.gov/bjs/pub/pdf/jim09st.pdf>.
Weekly admission and release estimation procedures
Based on the 2009 ASJ, 861 of the 934 jail facilities (92%) provided valid data on weekly admissions and releases. Becausethere were non response and incomplete data on admissionsand releases, data on offender flows through local jails were esti-mated for 73 jail facilities to calculate a weekly estimate.
Estimates were based on• Data for 45 jail facilities included admission and release data
based on estimates from the 2008 Annual Survey of Jails.
• Data for 21 jail facilities included admission and release databased on estimates from the 2007 Annual Survey of Jails.
• Release data for 7 jail facilities was based on admission datareported in 2009.
Calculating annual admissions
Based on findings from the 2004 Survey of Large Jails (SLJ), BJSdetermined that the June admission data were a reliable source
to calculate a nationwide annual admission estimate. Althoughthe number of admissions to jails fluctuated throughout theyear, the SLJ tracked monthly movements from January 2003 toJanuary 2004 and determined that the June 2003 count(339,500) closely matched the annual average number of admis-sions (342,956). The number of annual admissions was calcu-lated by multiplying the weekly admissions by the sum of 365days divided by 7 days.
Calculating weekly turnover rates
Weekly jail turnover rates were modeled after the Bureau ofLabor Statistics' Job Openings and Labor Turnover Survey
Additional information on turnover rates is available at<http://www.bls.gov/jlt/>. Jail turnover rates were calculated byadding admissions and releases and dividing by the averagedaily population. The turnover rate takes into account admissions into and releases from jails and gives an indication of thevolatility of the jail population. Higher turnover rates mean rela-tively larger numbers of admissions and releases relative to thesize of the average daily population.
June 201018 Jail Inmates at Midyear 2009 - Statistical Tables

8/7/2019 jim09st
http://slidepdf.com/reader/full/jim09st 19/20
Functions and definitions relating to the Annual Survey of Jails (ASJ)
Jails in the ASJ include confinement facilitiesusually admin-istered by a local law enforcement agencythat are intendedfor adults but may hold juveniles before or after adjudication.Facilities include jails and city/county correctional centers, spe-cial jail facilities such as medical or treatment release centers,
halfway houses, work farms, and temporary holding or lockupfacilities that are part of the jail's combined function. Inmatessentenced to jail facilities usually have a sentence of 1 year orless.
Jail functions. Within the ASJ, jail functions are to
• receive individuals pending arraignment and hold themawaiting trial, conviction, or sentencing
• readmit probation, parole, and bailbond violators andabsconders
• temporarily detain juveniles pending transfer to juvenileauthorities
• hold mentally ill persons pending their movement to appro-priate mental health facilities
• hold individuals for the military, for protective custody, forcontempt, and for the courts as witnesses
• release convicted inmates to the community upon completionof sentence
• transfer inmates to federal, state, or other authorities
• house inmates for federal, state, or other authorities because of crowding of their facilities
• sometimes operate community-based programs as alterna-tives to incarceration.
Admissions. Persons are officially booked and housed in jailsby formal legal document and the authority of the courts orsome other official agency. Jail admissions include persons sen-tenced to weekend programs and who are booked into the facil-ity for the first time. Excluded from jail admissions are inmatesreentering the facility after an escape, work release, medicalappointment or treatment facility, and bail and court appear-ances. BJS collects jail admissions for the last 7 days in June.
Average daily population. The average is derived by the sum of inmates in jail each day for a year, divided by the number of
days in the year (i.e., between July 1, 2008, and June 30, 2009).
Average annual change. This term denotes the mean averagechange across a 12-month time period.
Calculating annual admissions. BJS collects the number of jailadmissions during the last 7 days in June. Annual jail admis-sions are calculated by multiplying weekly admissions by thesum of 365 days divided by 7 days.
Calculating weekly jail turnover rate. This rate is calculated by adding admissions and releases and dividing by the averagedaily population. See Methodology for additional information.
Inmates confined at midyear. This term refers to the numberof inmates held in custody on the last weekday in June.
Jail incarceration rate. This term refers to the number of inmates held in the custody of local jails, per 100,000 U.S. resi-dents.
Percent of capacity occupied. The percent of jail capacity occupied is calculated by taking the number of inmates at mid-year, dividing by the rated capacity, and multiplying by 100.
Rated capacity. This term describes the number of beds orinmates assigned by a rating official to a facility, excluding sepa-rate temporary holding areas.
Releases. Persons released after a period of confinement (e.g.,sentence completion, bail/bond releases, other pretrial releases,transfers to other jurisdictions, and deaths). Releases includethose persons who have completed their weekend program andwho are leaving the facility for the last time. Excluded from jailreleases are temporary discharges including work release, medi-cal appointment or treatment center, court appearance, fur-lough, day reporting, and transfers to other facilities within thejail's jurisdiction.
Under jail supervision but not confined. This classificationincludes all persons in community-based programs operated by a jail facility. Programs include electronic monitoring, housearrest, community service, day reporting, and work programs.The classification excludes persons on pretrial release and whoare not in a community-based program run by the jail, as wellas persons under supervision of probation, parole or otheragencies, inmates on weekend programs, and inmates who par-ticipate in work release programs and return to the jail at night.
Weekend programs. Offenders in these programs are allowedto serve their sentences of confinement only on weekends (i.e.,Friday-Sunday).
June 201019 Jail Inmates at Midyear 2009 - Statistical Tables
8/7/2019 jim09st
http://slidepdf.com/reader/full/jim09st 20/20
U.S. Department of Justice
Office of Justice ProgramsBureau of Justice Statistics
Washington, DC 20531
Official BusinessPenalty for Private Use $300
PRESORTED STANDARD
POSTAGE & FEES PAID
DOJ/BJS
Permit No. G-91
*NCJ~230122*
The Bureau of Justice Statistics is the statistics agency of theU.S. Department of Justice. Michael D. Sinclair is acting
director.
The tables were prepared and data were analyzed by Todd D.Minton. James J. Stephan verified the report.
Lisa A. McNelis carried out the data collection andprocessing with assistance provided by Alonzo Johnson,Janean Darden, Andrea Arroyo, and Brittany Whitakerunder the supervision of Stephen Simoncini, GovernmentsDivision, Census Bureau, U.S. Department of Commerce.Duane H. Cavanaugh and Diron J. Gaskins providedtechnical assistance.
Catherine Bird and Jill Duncan edited the report, Tina
Dorsey produced the report, and Jayne Robinson preparedthe report for final printing under the supervision of Doris J.James.
June 2010, NCJ 230122
This report in portable document format and in ASCII and
its related statistical data and tables are available at the BJSWorld Wide Web Internet site: <http://bjs.ojp.usdoj.gov/index.cfm?ty=pbdetail&iid=2195.
Office of Justice Programs
Innovation • Partnerships • Safer Neighborhoodshttp://www.ojp.usdoj.gov


