
JIC Geophysical and Geotechnical Survey Environment Plan ... · Survey Vessel and Support...
74
Jansz-Io Compression JIC Geophysical and Geotechnical Survey Environment Plan Summary Document No: G7-NT-PLNX0000089 Revision: 1 Revision Date: 15 March 2018 Copy No: IP Security: Public
Transcript of JIC Geophysical and Geotechnical Survey Environment Plan ... · Survey Vessel and Support...

Jansz-Io Compression JIC Geophysical and Geotechnical Survey Environment Plan Summary
Document No: G7-NT-PLNX0000089 Revision: 1
Revision Date: 15 March 2018 Copy No:
IP Security: Public

Document No.: G7-NT-PLNX0000089 Jansz-Io Compression: Revision Date: 15 March 2018 JIC Geophysical and Geotechnical Survey Environment Plan Summary Revision: 1
© Chevron Australia Pty Ltd Public Page 5 Uncontrolled When Printed Printed Date: 19 March 2018
Table of Contents 1. Introduction ............................................................................................................................... 7
Overview ...................................................................................................................... 7
Scope ........................................................................................................................... 7
Licence Holder and Operator Details ........................................................................... 7
Stakeholder Engagement ............................................................................................ 9 1.4.1 Identification of Relevant Stakeholders ........................................................ 9 1.4.2 Assessment of Merit of any Objections or Claims ...................................... 10 1.4.3 Ongoing Consultation ................................................................................. 10
2. Description of the Activity ...................................................................................................... 22
Overview .................................................................................................................... 22 2.1.1 Time Frame ................................................................................................ 22 2.1.2 Location ...................................................................................................... 22 2.1.3 Operational Area ........................................................................................ 22
Survey Program ......................................................................................................... 23 2.2.1 Geophysical ................................................................................................ 23 2.2.2 Geotechnical ............................................................................................... 25
Survey Vessel and Support Operations..................................................................... 26
3. Description of the Environment ............................................................................................. 27
Regional Overview ..................................................................................................... 27 3.1.1 Marine Environment ................................................................................... 27 3.1.2 Socioeconomic Environment ...................................................................... 31 3.1.3 Cultural Heritage ......................................................................................... 32 3.1.4 Particular Values and Sensitivities ............................................................. 32
4. Environmental Risk Assessment Methodology ................................................................... 34
4.1.1 Control Measures and ALARP ................................................................... 36
Risk and Impact Acceptance Criteria ......................................................................... 36 4.2.1 Summary of Acceptance Criteria ................................................................ 37
5. Environmental Risk Assessment and Management Strategy – Petroleum Activity ........ 38
Physical Presence (Marine Users and Marine Fauna) .............................................. 38
Light Emissions .......................................................................................................... 39
Underwater Sound ..................................................................................................... 41
Physical Presence – Seabed ..................................................................................... 45
Atmospheric Emissions.............................................................................................. 45 Planned Discharge ..................................................................................................... 46
5.6.1 Planned Discharge – Drilling Fluids and Cuttings ...................................... 46 5.6.2 Planned Discharge – Cooling and Brine water .......................................... 47 5.6.3 Planned Discharge – Ballast Water (and Biofouling) ................................. 49 5.6.4 Planned Discharge – Sewage, Greywater, and Putrescible Wastes ......... 50
Accidental Release .................................................................................................... 52 5.7.1 Waste.......................................................................................................... 52

Document No.: G7-NT-PLNX0000089 Jansz-Io Compression: Revision Date: 15 March 2018 JIC Geophysical and Geotechnical Survey Environment Plan Summary Revision: 1
© Chevron Australia Pty Ltd Public Page 6 Uncontrolled When Printed Printed Date: 19 March 2018
5.7.2 Single-point Failure ..................................................................................... 53 5.7.3 Loss of Containment during Transfer ......................................................... 53 5.7.4 Loss of Equipment ...................................................................................... 54 5.7.5 Vessel Collision .......................................................................................... 55
6. Implementation Strategy ........................................................................................................ 57
Systems, Practices, and Procedures ......................................................................... 57 6.1.1 Management of Change (OE-04) ............................................................... 59 6.1.2 Compliance Assurance (OE-12.01) ............................................................ 59
Emergency Management (OE-11) ............................................................................. 60 (OE-11.01.01) Emergency Management Process ..................................................... 60
6.3.1 Vessel Spills ............................................................................................... 60 6.3.2 Monitoring, Evaluation and Surveillance .................................................... 60 6.3.3 Testing of spill response arrangements ..................................................... 65
Environment Plan Review .......................................................................................... 65
7. Acronyms, Abbreviations, and Terms .................................................................................. 66
8. References ............................................................................................................................... 70
List of Tables Table 1-1: Nominated Liaison Person Contact Details ............................................................................... 7
Table 1-2: List of Relevant Stakeholders Consulted .................................................................................. 9
Table 1-3: Summary of Stakeholder Responses, Objections, and Claims .............................................. 11
Table 1-4: Summary of Notifications and Ongoing Consultation.............................................................. 21
Table 2-1: Geospatial Coordinates of the Operational Area .................................................................... 22
Table 2-2: General Survey Parameters .................................................................................................... 23 Table 2-3: MBES Survey Parameters ...................................................................................................... 23
Table 2-4: Side-scan Sonar Survey Parameters ...................................................................................... 24
Table 2-5: Sub-bottom Survey Parameters .............................................................................................. 24
Table 3-1: Description of Provincial Bioregions ........................................................................................ 27
Table 3-2: State and Commercial Managed Fisheries ............................................................................. 31 Table 3-3: Montebello Australian Marine Park ......................................................................................... 32
Table 4-1: Acceptability Criteria ................................................................................................................ 37
Table 6-1: OEMS Elements Relevant to this Activity ............................................................................... 57
Table 6-2: Monitor, Evaluation, and Surveillance Implementation Guide ................................................ 61
Table 6-3: Response Strategy Capability – Monitoring, Evaluation, and Surveillance ............................ 62
Table 7-1: Acronyms, Abbreviations, and Terms ..................................................................................... 66
List of Figures Figure 1-1: Location of the Petroleum Activity ............................................................................................ 8 Figure 4-1: Chevron Corporation’s Integrated Risk Prioritization Matrix .................................................. 35
Figure 4-2: ALARP Decision Support Framework .................................................................................... 36
Figure 6-1: CAPL OEMS Process Overview ............................................................................................ 57

Document No.: G7-NT-PLNX0000089 Jansz-Io Compression: Revision Date: 15 March 2018 JIC Geophysical and Geotechnical Survey Environment Plan Summary Revision: 1
© Chevron Australia Pty Ltd Public Page 7 Uncontrolled When Printed Printed Date: 19 March 2018
1. Introduction
Overview
Chevron Australia Pty Ltd (CAPL) is the operator for the Gorgon Gas Development (also known as the Gorgon Project) on behalf of the Gorgon Joint Venture. Offshore production wells and pipeline infrastructure associated with the Jansz–Io and Gorgon gas fields gather and transport gas to the Gorgon Gas Treatment Plant on Barrow Island, Western Australia (WA), where it is processed.
Compression facilities are expected to be installed to support the future recovery of hydrocarbons from the Jansz–Io gas field once the pressure in the reservoir is depleted and is insufficient to sustain peak production rates. Compression facilities will enable efficient recovery of hydrocarbons within the Jansz–Io gas field, and from other gas reserves in the Greater Gorgon area. The proposed geophysical and geotechnical surveys will be used as a basis for the engineering design of the compression facility location, mooring locations, and flowline routes.
This Environment Plan (EP) Summary has been prepared to meet Regulation 11(4) of the Commonwealth Offshore Petroleum and Greenhouse Gas Storage (Environment) Regulations 2009 (OPGGS(E)R) and summarises the information provided in the jansz Compression Project EP accepted by the National Offshore Petroleum Safety and Environmental Management Authority (NOPSEMA).
Scope
The scope of the EP addresses those activities in Commonwealth Waters associated with geophysical and geotechnical surveys (as described in Section 2) and that occur within the defined Operational Area (Section 2.1.3), within licenses WA-36-L, WA-39-L and WA-75-R.
Licence Holder and Operator Details
In accordance with Regulation 15(2) of the OPGGS(E)R, details of the titleholder’s nominated liaison person are listed in Table 1-1.
Table 1-1: Nominated Liaison Person Contact Details
Company Name CAPL
Nominated Liaison Person Christopher Oliver
Position Project Manager
Business Address QV1, 250 St Georges Terrace, Perth, WA, 6000
Telephone Number +61 8 6224 1433
Email Address [email protected]

Document No.: G7-NT-PLNX0000089 Jansz-Io Compression: Revision Date: 15 March 2018 JIC Geophysical and Geotechnical Survey Environment Plan Summary Revision: 1
© Chevron Australia Pty Ltd Public Page 8 Uncontrolled When Printed Printed Date: 19 March 2018
Figure 1-1: Location of the Petroleum Activity

Document No.: G7-NT-PLNX0000089 Jansz-Io Compression: Revision Date: 15 March 2018 JIC Geophysical and Geotechnical Survey Environment Plan Summary Revision: 1
© Chevron Australia Pty Ltd Public Page 9 Uncontrolled When Printed Printed Date: 19 March 2018
Stakeholder Engagement
CAPL applied this methodology when undertaking the consultation for this activity:
• identify relevant stakeholders
• provide sufficient information to enable stakeholders to understand how this activity may affect their functions, interests, or activities
• assess the merit of any objections or claims raised by stakeholders
• provide a response to the objection or claim, and ensure this is captured in the EP.
This methodology was based on:
• NOPSEMA Decision-Making Guideline – Criterion-10A(g) Consultation Requirements (Ref. 85)
• The Australian Petroleum Production and Exploration Association (APPEA) Stakeholder Consultation and Engagement Principles and Methodology – Draft (Ref. 86).
1.4.1 Identification of Relevant Stakeholders
Since starting the Gorgon Project, CAPL has developed and maintained a list of stakeholders considered relevant to the potential impacts and risks associated with the Project.
Table 1-2 summarises the stakeholders considered relevant to this activity.
Table 1-2: List of Relevant Stakeholders Consulted
Stakeholder Type Functions, Interests, Activities and List of Stakeholders Consulted
Commonwealth and State Fisheries (and peak body associations)
This activity has the potential to impact on fish and thus affect the catch rates of commercial fisheries: • Western Australian Fishing Industry Council • Aquarium Specimen Collectors Association of WA • Australian Southern Bluefin Tuna Industry Association • Commonwealth Fisheries Association • Pearl Producers Association • Professional Specimen Shell Fishermen's Association • individual fishery licence holders in these fisheries: Mackerel Managed Fishery (State) Marine Aquarium Fish (State) Onslow Prawn (State) Pilbara Line Fishery (State) Pilbara Trap Managed Fishery (State) Pilbara Fish Trawl Interim Managed Fishery (State) Specimen Shell (State) North West Slope Trawl Fishery (Commonwealth) Western Skipjack Tuna Fishery (Commonwealth) Western Tuna and Billfish Fishery (Commonwealth)
Recreational fishers (and peak body associations)
This activity has the potential to impact on fish and thus affect the catch rates of recreational fisheries including: • WA Boating Industry Association • RecFishWest • various fishing clubs • individual charter operators
Equity holders and other petroleum
Hydrocarbon spills have the potential to result in exclusion zones and potential impacts to other operators in the region including:

Document No.: G7-NT-PLNX0000089 Jansz-Io Compression: Revision Date: 15 March 2018 JIC Geophysical and Geotechnical Survey Environment Plan Summary Revision: 1
© Chevron Australia Pty Ltd Public Page 10 Uncontrolled When Printed Printed Date: 19 March 2018
Stakeholder Type Functions, Interests, Activities and List of Stakeholders Consulted operators in the area
• Quadrant Energy • BHP Macedon • Vermilion Energy • Woodside Burrup Pty. Ltd.
Government agencies
Government agencies responsible for managing marine reserves, or responsible for providing support in the event of a spill were considered relevant. These included: • former WA Department of Transport (from 1 July 2017: WA Department of Primary
Industries and Regional Development [DPIRD; formerly Department of Agriculture and Food, Department of Fisheries, and Department of Regional Development and Lands])
• former WA Department of Parks and Wildlife (from 1 July 2017: WA Department of Biodiversity, Conservation, and Attractions [DBCA]_
• former WA Department of Mines and Petroleum (from 1 July 2017: WA Department of Mines, Industry Regulation and Safety [DMIRS])
• Commonwealth Department of Defence • Commonwealth Department of the Environment and Energy • Australian Border Force • Australian Maritime Safety Authority(AMSA) • Australasian Hydrographic Service (AHS) • Australian Fisheries Management Authority • former WA Department of Fisheries (from 1 July 2017: DPIRD) • Commonwealth Department of Communications and the Arts • Pilbara Port Authority • Shire of Ashburton
Emergency Response
• AECOM • Quadrant Energy Ltd • Australian Marine Oil Spill Response Centre (AMOSC) • Barrow Island Emergency Management Coordinator • Department of Transport (DoT) - OSRC Unit • Environmental Resources Management (ERM) • Intertek Geotech • Oil Spill Response Limited (OSRL)
Other • Onslow Chamber of Commerce and Industry • traditional owners of the local area
1.4.2 Assessment of Merit of any Objections or Claims
Table 1-3 summarises the objections and claims made by relevant stakeholders, assesses their merits, and describes how each objection or claim is managed in the EP.
1.4.3 Ongoing Consultation
From the stakeholder consultation undertaken, the notifications and ongoing consultation required for this activity is captured in Table 1-4.

Document No.: G7-NT-PLNX0000089 Jansz-Io Compression: Revision Date: 15 March 2018 JIC Geophysical and Geotechnical Survey Environment Plan Summary Revision: 1
© Chevron Australia Pty Ltd Public Page 11 Uncontrolled When Printed Printed Date: 19 March 2018
Table 1-3: Summary of Stakeholder Responses, Objections, and Claims
Date Stakeholder Objection or Claim Assessment of Merits Additional Actions
19 July 2017
Hans Kemps - DPIRD WA
Stated that in order to provide Chevron with relevant and project-specific advice, Fisheries requested additional information on the following:
- CAPL responded to DPIRD objections and claims 08 August 2017
Physical presence & consultation plan – Details of the consultation plan outlining how Chevron proposes to: i) consult with fishers (and other fisheries-relevant stakeholders, e.g. WAFIC, PPA) and consider feedback on the timing of planned activities; and ii) notify fishers of planned movements in a timely manner;
Details of how CAPL consult with other stakeholders is relevant for this stakeholder given they are the government agency for this industry. No specific objection or claim. Considered as a trigger for ongoing consultation
CAPL provided a list of stakeholders (including WAFIC and other industry bodies) to DoF who was emailed the fact sheet.
CAPL noted that advance notification is included as a trigger for ongoing consultation (Table 1-4) of this EP Summary. Also noted the that information would be available via Notice to Mariners.
Underwater Sound – Planned acquisition parameters and other relevant operational details; additional information on the proposed commencement and duration of activities; an assessment of the potential impacts of the activities on aquatic resources (including fish and invertebrates); details of the impact management and risk control measures (where necessary) to ensure residual impacts will be ALARP and acceptable;
As underwater noise is an applicable aspect associated with this activity and information regarding the evaluation of potential impact to commercial fisheries is appropriate for this stakeholder given they are the government agency for this industry.
CAPL provided an excerpt of the risk evaluation completed in Section 5.3 of the EP.
Biosecurity – Details of biosecurity plan. Given that DPIRD are the governmental body
CAPL noted that the control measures for

Document No.: G7-NT-PLNX0000089 Jansz-Io Compression: Revision Date: 15 March 2018 JIC Geophysical and Geotechnical Survey Environment Plan Summary Revision: 1
© Chevron Australia Pty Ltd Public Page 12 Uncontrolled When Printed Printed Date: 19 March 2018
Date Stakeholder Objection or Claim Assessment of Merits Additional Actions responsible for the implementation of the Fish Resources Management Act 1994 and as the associated regulations indicate transferring live non-endemic or noxious fish (including marine pests) into WA waters is an offense this a relevant claim.
managing the introduction of invasive marine pests proposed for the activity includes actively using a biofouling management plan and record book that meets all requirements under the current edition of the International Maritime Organisation’s Guidelines for the Control and Management of Ships’ Biofouling to Minimise the Transfer of Invasive Aquatic Species - Section 5.6 of the EP.
28 August 2017
Hans Kemps – DPIRD WA
Noted that the level of information only allows for basic understanding of the planned activities and stated that they expect proponents to demonstrate that: An informed assessment has been conducted of the risks and potential impacts associated with the proposed activities on potentially affected fisheries and aquatic resources; and Appropriate impact management and risk control measures will be in place (where necessary) to ensure residual impacts will be as low as reasonably practicable (ALARP) and acceptable.
No specific objection or claim provided.
CAPL responded to DPIRD objections and claims 05 October2017
Underwater sound – Whilst it is acknowledged that multibeam echosounder-related acoustic impacts are typically of a lesser order (when compared with seismic impacts), Fisheries would appreciate a more robust assessment of the potential impacts of underwater sound on aquatic resources, based on the best available information. This should include: (i) a description of the sound profile/characteristics, and
There is merit in the request given the operational area overlaps the Onslow Prawn Fishery which is a DPIRD state managed fishery.
CAPL provided an excerpt from the underwater noise assessment conducted in Section 5.3 to answer the departments query. Specifically, information included the evaluation
Document No.: G7-NT-PLNX0000089 Jansz-Io Compression: Revision Date: 15 March 2018 JIC Geophysical and Geotechnical Survey Environment Plan Summary Revision: 1
© Chevron Australia Pty Ltd Public Page 13 Uncontrolled When Printed Printed Date: 19 March 2018
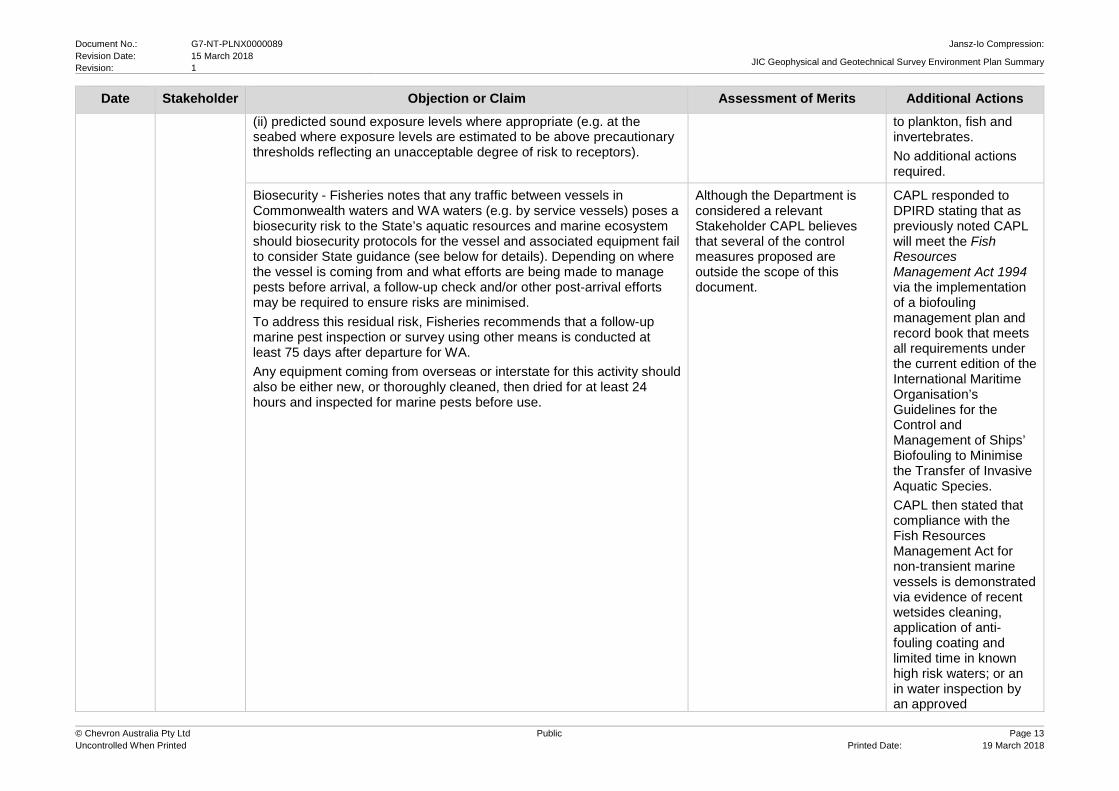
Date Stakeholder Objection or Claim Assessment of Merits Additional Actions (ii) predicted sound exposure levels where appropriate (e.g. at the seabed where exposure levels are estimated to be above precautionary thresholds reflecting an unacceptable degree of risk to receptors).
to plankton, fish and invertebrates. No additional actions required.
Biosecurity - Fisheries notes that any traffic between vessels in Commonwealth waters and WA waters (e.g. by service vessels) poses a biosecurity risk to the State’s aquatic resources and marine ecosystem should biosecurity protocols for the vessel and associated equipment fail to consider State guidance (see below for details). Depending on where the vessel is coming from and what efforts are being made to manage pests before arrival, a follow-up check and/or other post-arrival efforts may be required to ensure risks are minimised. To address this residual risk, Fisheries recommends that a follow-up marine pest inspection or survey using other means is conducted at least 75 days after departure for WA. Any equipment coming from overseas or interstate for this activity should also be either new, or thoroughly cleaned, then dried for at least 24 hours and inspected for marine pests before use.
Although the Department is considered a relevant Stakeholder CAPL believes that several of the control measures proposed are outside the scope of this document.
CAPL responded to DPIRD stating that as previously noted CAPL will meet the Fish Resources Management Act 1994 via the implementation of a biofouling management plan and record book that meets all requirements under the current edition of the International Maritime Organisation’s Guidelines for the Control and Management of Ships’ Biofouling to Minimise the Transfer of Invasive Aquatic Species. CAPL then stated that compliance with the Fish Resources Management Act for non-transient marine vessels is demonstrated via evidence of recent wetsides cleaning, application of anti-fouling coating and limited time in known high risk waters; or an in water inspection by an approved

Document No.: G7-NT-PLNX0000089 Jansz-Io Compression: Revision Date: 15 March 2018 JIC Geophysical and Geotechnical Survey Environment Plan Summary Revision: 1
© Chevron Australia Pty Ltd Public Page 14 Uncontrolled When Printed Printed Date: 19 March 2018
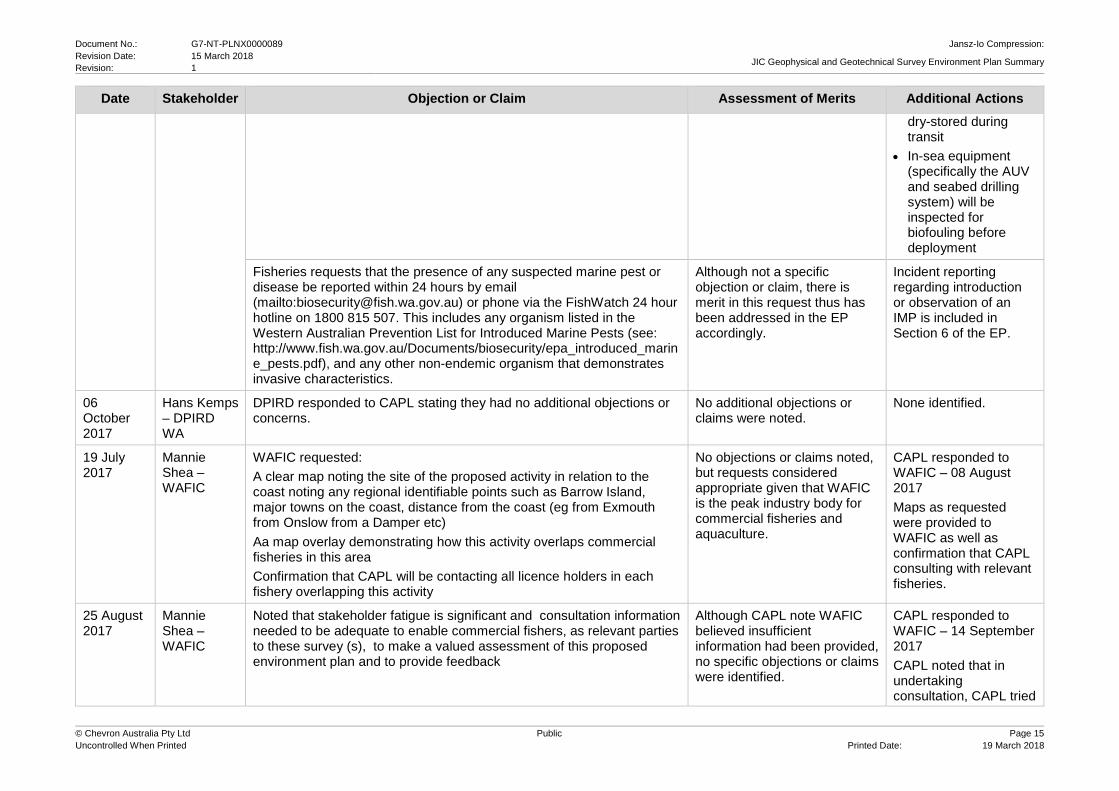
Date Stakeholder Objection or Claim Assessment of Merits Additional Actions Department of Fisheries Marine Biologist prior to entering WA waters, but noted as , the scope of the Environment Plan is limited to Commonwealth waters and these control measures are not captured within the EP, but captured via Chevron Australia’s internal processes. Thus these have not been captured in the EP. In addition, CAPL confirmed that in accordance with the Department’s advice that “any equipment coming from overseas or interstate for this activity should also be either new, or thoroughly cleaned, then dried for at least 24 hours and inspected for marine pests before use”, the following control measure / performance standards have been committed to for the project: • In-sea equipment
(specifically the AUV and seabed drilling system) will remain
Document No.: G7-NT-PLNX0000089 Jansz-Io Compression: Revision Date: 15 March 2018 JIC Geophysical and Geotechnical Survey Environment Plan Summary Revision: 1
© Chevron Australia Pty Ltd Public Page 15 Uncontrolled When Printed Printed Date: 19 March 2018
Date Stakeholder Objection or Claim Assessment of Merits Additional Actions dry-stored during transit
• In-sea equipment (specifically the AUV and seabed drilling system) will be inspected for biofouling before deployment
Fisheries requests that the presence of any suspected marine pest or disease be reported within 24 hours by email (mailto:[email protected]) or phone via the FishWatch 24 hour hotline on 1800 815 507. This includes any organism listed in the Western Australian Prevention List for Introduced Marine Pests (see: http://www.fish.wa.gov.au/Documents/biosecurity/epa_introduced_marine_pests.pdf), and any other non-endemic organism that demonstrates invasive characteristics.
Although not a specific objection or claim, there is merit in this request thus has been addressed in the EP accordingly.
Incident reporting regarding introduction or observation of an IMP is included in Section 6 of the EP.
06 October 2017
Hans Kemps – DPIRD WA
DPIRD responded to CAPL stating they had no additional objections or concerns.
No additional objections or claims were noted.
None identified.
19 July 2017
Mannie Shea – WAFIC
WAFIC requested: A clear map noting the site of the proposed activity in relation to the coast noting any regional identifiable points such as Barrow Island, major towns on the coast, distance from the coast (eg from Exmouth from Onslow from a Damper etc) Aa map overlay demonstrating how this activity overlaps commercial fisheries in this area Confirmation that CAPL will be contacting all licence holders in each fishery overlapping this activity
No objections or claims noted, but requests considered appropriate given that WAFIC is the peak industry body for commercial fisheries and aquaculture.
CAPL responded to WAFIC – 08 August 2017 Maps as requested were provided to WAFIC as well as confirmation that CAPL consulting with relevant fisheries.
25 August 2017
Mannie Shea – WAFIC
Noted that stakeholder fatigue is significant and consultation information needed to be adequate to enable commercial fishers, as relevant parties to these survey (s), to make a valued assessment of this proposed environment plan and to provide feedback
Although CAPL note WAFIC believed insufficient information had been provided, no specific objections or claims were identified.
CAPL responded to WAFIC – 14 September 2017 CAPL noted that in undertaking consultation, CAPL tried

Document No.: G7-NT-PLNX0000089 Jansz-Io Compression: Revision Date: 15 March 2018 JIC Geophysical and Geotechnical Survey Environment Plan Summary Revision: 1
© Chevron Australia Pty Ltd Public Page 16 Uncontrolled When Printed Printed Date: 19 March 2018
Date Stakeholder Objection or Claim Assessment of Merits Additional Actions to provide a balance between providing sufficient information and not overburdening stakeholders. CAPL advised that it is open to providing information to individual stakeholders based on their feedback.
Additional information regarding the activity was requested including confirmation: • on the number of surveys to be undertaken • on the survey timing • on the water depths in which the survey may occur.
As WAFIC is the peak industry body for commercial fisheries and aquaculture these objections and claims are considered to have merit.
Additional information from Section 2 with this information was provided. Specifically noting two surveys would be undertaken early Q1/Q2 2018 and Q4 2018/Q1 2019 in water depths ranging from 100 m to 1400 m.
Additional information regarding the Geophysical survey was requested including confirmation: • if the Geophysical survey was seismic or not • clarification regarding the line length Vs number of survey lines • if exclusion zones will be in place
As WAFIC is the peak industry body for commercial fisheries and aquaculture these objections and claims are considered to have merit.
CAPL provided additional information regarding the nature of geophysical surveys to show how different a geophysical survey is to a seismic survey. CAPL confirmed that the reference to 550-860 kilometres was not a straight line distance but the total length of the survey. CAPL confirmed no exclusion zones are planned.

Document No.: G7-NT-PLNX0000089 Jansz-Io Compression: Revision Date: 15 March 2018 JIC Geophysical and Geotechnical Survey Environment Plan Summary Revision: 1
© Chevron Australia Pty Ltd Public Page 17 Uncontrolled When Printed Printed Date: 19 March 2018
Date Stakeholder Objection or Claim Assessment of Merits Additional Actions
Additional information regarding the geotechnical survey was requested including confirmation: • if exclusion zones will be in place • How many surveys and when will these surveys take place • Further information as to how the geotechnical survey will affect
stakeholders.
As WAFIC is the peak industry body for commercial fisheries and aquaculture these objections and claims are considered to have merit.
CAPL confirmed no exclusion zones are planned. CAPL confirmed two surveys would be undertaken in total early Q1/Q2 2018 and Q4 2018/Q1 2019. CAPL clarified that geotechnical surveys sample the seafloor.
Additional clarification and information was sought regarding environmental hazards and control measures. Specifically, WAFIC requested additional information to support their understanding of how the activity may impact on commercial fishers. This information included: • The number of surveys • when the surveys are planned • if exclusion zones will be in place. In addition to this, WAFIC requested that cumulative impacts be addressed WAFIC noted that Notice to Mariners” is not a solution and did not consider it to be a control measure
The request for additional information regarding the survey parameters is appropriate as WAFIC is the peak industry body for commercial fisheries and aquaculture. CAPL understand that cumulative impacts of the activity should be undertaken if other activities are expected to occur in a similar area at the same time and subsequently this claim has merit. CAPL believes the Notice to Mariners provides a procedural
CAPL confirmed that the environmental aspects identified as having the potential to impact commercial fisheries were limited to Physical Presence of the survey vessel. In addition to this, CAPL confirmed that a single survey vessel would be present in the operational area during the survey times. CAPL also noted that no exclusion zones are planned to be in place for the survey. During consultation with other operators, no other potential activities were expected to occur concurrently thus the potential for cumulative

Document No.: G7-NT-PLNX0000089 Jansz-Io Compression: Revision Date: 15 March 2018 JIC Geophysical and Geotechnical Survey Environment Plan Summary Revision: 1
© Chevron Australia Pty Ltd Public Page 18 Uncontrolled When Printed Printed Date: 19 March 2018
Date Stakeholder Objection or Claim Assessment of Merits Additional Actions control measure to ensure navigational safety and, by extension, prevent impact on stakeholders during an activity and thus is a suitable control measure for managing impacts to commercial fisheries.
impacts has not been considered further. None identified
WAFIC requested that CAPL address how underwater noise impacts the commercial fishing sector and how CAPL plan to manage the potential impact. WAFIC asked that CAPL have regard to the recent science regarding seismic impacts to zooplankton (reference the recently published McAuley research) In addition, WAFIC requested that CAPL considers noise impacts on spawning fish and fish spawn and sought additional information regarding the level of sound and the impact on the commercial fishing sector
The request for additional information regarding the underwater noise impacts to commercial fisheries is relevant as as WAFIC are the peak industry body for commercial fisheries and aquaculture.
CAPL provided additional information (taken from Section 5.3). In summary CAPL noted that impacts were limited due to the sound levels generated from the survey and nature of the commercially targeted receptors.
08 August 2017
Woodside Burrup Pty Ltd
Woodside requested shape files of the proposed survey area and, requested once the project has NOPSEMA approval, an accurate schedule of activities and a communications plan be in place. If the survey is scheduled during any Woodside planned activities in these titles a detailed risk analysis and concurrent operations plan will be required.
Given that CAPL has identified interaction with other marine users as a potential risk, there is merit in the comment to CAPL, along with the requested information that include: Post EP approval, provision of An accurate schedule Communication plan Detailed risk assessment and simultaneous operations plan in the event survey is scheduled concurrently with Woodside planned activities.
Shapefiles of the survey boundary were provided to Woodside Burrup Pty Ltd. CAPL noted that ongoing communication requirements in (Table 1-4) of the EP.
19 September 2017
AMSA Requested that the survey vessel notify the Joint Rescue Coordination Centre (JRCC) through [email protected] (Phone: 1800 641 792 or
Requested control measure were deemed appropriate as AMSA is responsible, on behalf of the Commonwealth
CAPL noted triggers for ongoing consultation with both the JRCC and AHS in (Table 1-4) of

Document No.: G7-NT-PLNX0000089 Jansz-Io Compression: Revision Date: 15 March 2018 JIC Geophysical and Geotechnical Survey Environment Plan Summary Revision: 1
© Chevron Australia Pty Ltd Public Page 19 Uncontrolled When Printed Printed Date: 19 March 2018
Date Stakeholder Objection or Claim Assessment of Merits Additional Actions +61 2 6230 6811) for radio-navigation warnings 24-48 hours before operations commence. Additionally, the Australian Hydrographic Service must be contacted through [email protected] no less than four working weeks before operations commence for the promulgation of related Notices To Mariners (NTM). AMSA also noted that a chartered shipping fairway runs through the operational area and requested appropriate safety measured are put in place for the survey work.
Government of Australia, for the regulation and safety oversight of Australia's shipping fleet and management of Australia's international maritime obligations.
the EP. In addition to this, these control measures are included in Section 5.1 of the EP. CAPL has included safety control measures to prevent a vessel collision (in Section 5.7.5 of the EP). In addition to this, the chartered shipping fairway location is described in Section 3.1.2.1 of the EP.
20 July 2017
DPAW Requested the distance between planned operations and WA marine reserves, and an indication of noise emission levels as sound exposure levels or SEL with regard to recent studies regarding seismic activities.
Given DPaW are responsible for the management of state marine reserves the request for additional information was considered relevant.
CAPL responded to DPAW – 08 August 2017 Additional information regarding underwater sound exposures from Section 5.3 was provided along with requested information regarding distances to state marine reserves. No additional objections or claims were provided.
09 August 2017
DMIRS Requested additional information regarding Given DMIRS are the state regulator for the resource sector the information request was considered relevant.
CAPL responded to DMIRS – 04 October 2017

Document No.: G7-NT-PLNX0000089 Jansz-Io Compression: Revision Date: 15 March 2018 JIC Geophysical and Geotechnical Survey Environment Plan Summary Revision: 1
© Chevron Australia Pty Ltd Public Page 20 Uncontrolled When Printed Printed Date: 19 March 2018
Date Stakeholder Objection or Claim Assessment of Merits Additional Actions the location of the operational area (including coordinates) with respect to sensitivities (i.e. distance from management areas, Islands or WA coastline); The proposed timing and duration of the activity; A description of the receiving environment and in particular the zone of potential impact; Details of potential spill scenarios and management (particularly if relevant to state lands and waters); Commitment for incident reporting to DMIRS for any impacts that are potentially relevant to WA.
CAPL provided additional figures and shapefile of the operational area for DMIRS information. The duration and timing of the activity was provided in accordance with Section 2.0 of the EP. A broad description of the environment specific to the north west marine bioregion was provided noting that the only potential impact to state waters was a vessel collision which given the distance offshore, modelling predicted to result in maximum hydrocarbon volumes ashore in the order of 40 L. A summary of modelling inputs and outputs was provided (as per Section 5.7.5 of the EP). CAPL confirmed incidents that are potentially relevant to WA will be reported to DMIRS.

Document No.: G7-NT-PLNX0000089 Jansz-Io Compression: Revision Date: 15 March 2018 JIC Geophysical and Geotechnical Survey Environment Plan Summary Revision: 1
© Chevron Australia Pty Ltd Public Page 21 Uncontrolled When Printed Printed Date: 19 March 2018
Table 1-4: Summary of Notifications and Ongoing Consultation
Stakeholder Notification / Ongoing Consultation Requirement Timing
DPIRD WA Advance notification of activity implementation Four weeks prior to survey commencing
AHS Advanced notification of the activity for: Notice to Mariners
Four weeks before commencing activities
AMSA JRCC Advanced notification of the activity for: • AUSCOAST Warnings
24–48 hours before commencing activities
NOPSEMA Notifying start of an activity 10 days before commencing activities
NOPSEMA Notifying end of an activity 10 days after completing activities
Woodside Burrup Pty Ltd • An accurate schedule • Communication plan • Detailed risk assessment and simultaneous operations plan
in the event survey is scheduled
Post EP approval.
Document No.: G7-NT-PLNX0000089 Jansz-Io Compression: Revision Date: 15 March 2018 JIC Geophysical and Geotechnical Survey Environment Plan Summary Revision: 1
© Chevron Australia Pty Ltd Public Page 22 Uncontrolled When Printed Printed Date: 19 March 2018
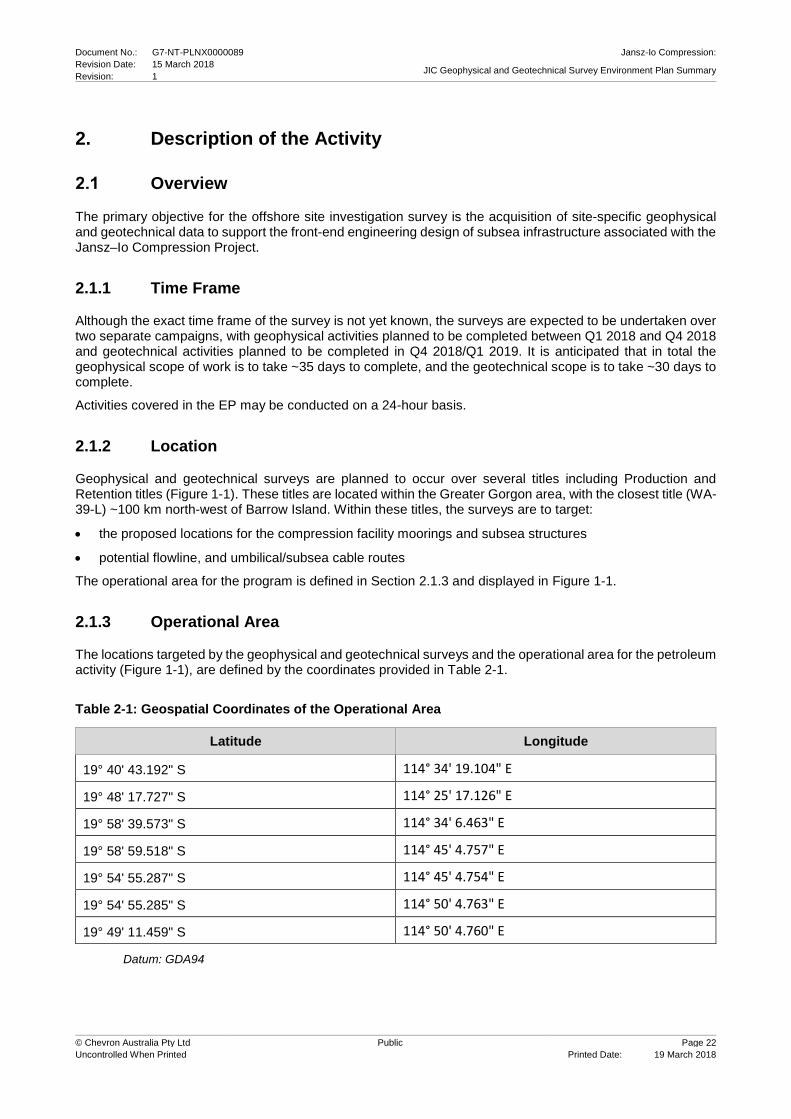
2. Description of the Activity
Overview
The primary objective for the offshore site investigation survey is the acquisition of site-specific geophysical and geotechnical data to support the front-end engineering design of subsea infrastructure associated with the Jansz–Io Compression Project.
2.1.1 Time Frame
Although the exact time frame of the survey is not yet known, the surveys are expected to be undertaken over two separate campaigns, with geophysical activities planned to be completed between Q1 2018 and Q4 2018 and geotechnical activities planned to be completed in Q4 2018/Q1 2019. It is anticipated that in total the geophysical scope of work is to take ~35 days to complete, and the geotechnical scope is to take ~30 days to complete.
Activities covered in the EP may be conducted on a 24-hour basis.
2.1.2 Location
Geophysical and geotechnical surveys are planned to occur over several titles including Production and Retention titles (Figure 1-1). These titles are located within the Greater Gorgon area, with the closest title (WA-39-L) ~100 km north-west of Barrow Island. Within these titles, the surveys are to target:
• the proposed locations for the compression facility moorings and subsea structures
• potential flowline, and umbilical/subsea cable routes
The operational area for the program is defined in Section 2.1.3 and displayed in Figure 1-1.
2.1.3 Operational Area
The locations targeted by the geophysical and geotechnical surveys and the operational area for the petroleum activity (Figure 1-1), are defined by the coordinates provided in Table 2-1.
Table 2-1: Geospatial Coordinates of the Operational Area
Latitude Longitude
19° 40' 43.192" S 114° 34' 19.104" E
19° 48' 17.727" S 114° 25' 17.126" E
19° 58' 39.573" S 114° 34' 6.463" E
19° 58' 59.518" S 114° 45' 4.757" E
19° 54' 55.287" S 114° 45' 4.754" E
19° 54' 55.285" S 114° 50' 4.763" E
19° 49' 11.459" S 114° 50' 4.760" E
Datum: GDA94
Document No.: G7-NT-PLNX0000089 Jansz-Io Compression: Revision Date: 15 March 2018 JIC Geophysical and Geotechnical Survey Environment Plan Summary Revision: 1
© Chevron Australia Pty Ltd Public Page 23 Uncontrolled When Printed Printed Date: 19 March 2018
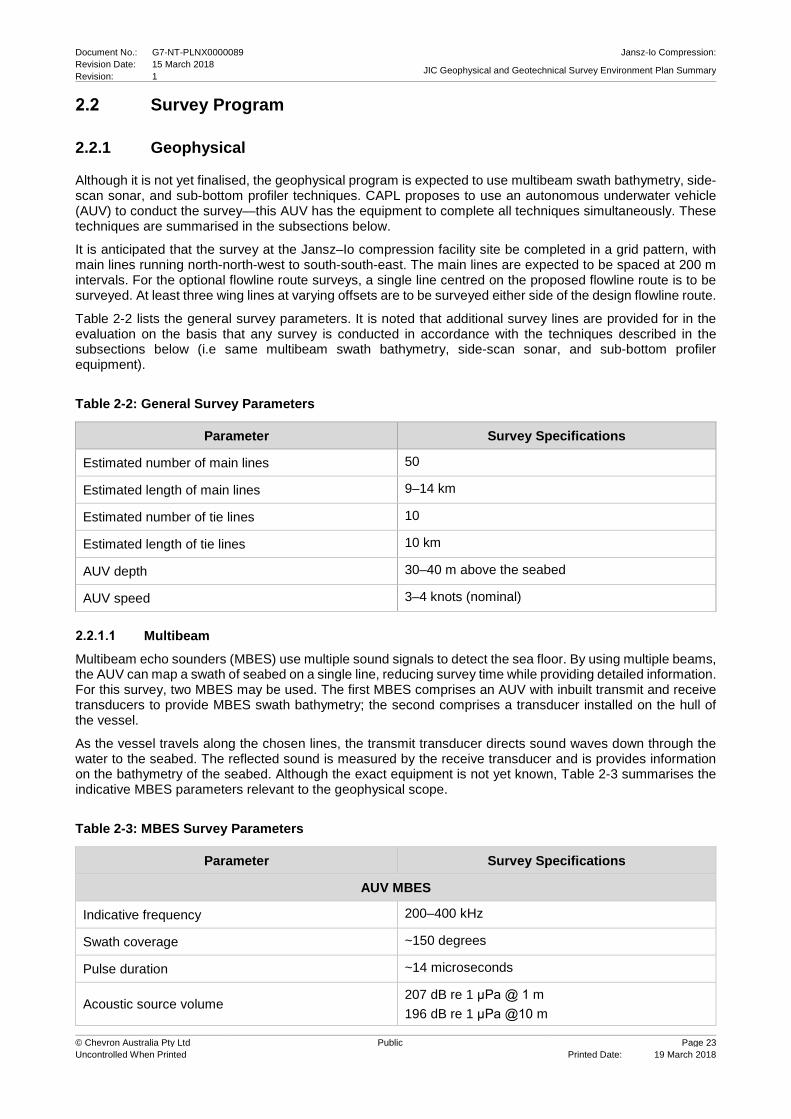
Survey Program
2.2.1 Geophysical
Although it is not yet finalised, the geophysical program is expected to use multibeam swath bathymetry, side-scan sonar, and sub-bottom profiler techniques. CAPL proposes to use an autonomous underwater vehicle (AUV) to conduct the survey—this AUV has the equipment to complete all techniques simultaneously. These techniques are summarised in the subsections below.
It is anticipated that the survey at the Jansz–Io compression facility site be completed in a grid pattern, with main lines running north-north-west to south-south-east. The main lines are expected to be spaced at 200 m intervals. For the optional flowline route surveys, a single line centred on the proposed flowline route is to be surveyed. At least three wing lines at varying offsets are to be surveyed either side of the design flowline route.
Table 2-2 lists the general survey parameters. It is noted that additional survey lines are provided for in the evaluation on the basis that any survey is conducted in accordance with the techniques described in the subsections below (i.e same multibeam swath bathymetry, side-scan sonar, and sub-bottom profiler equipment).
Table 2-2: General Survey Parameters
Parameter Survey Specifications
Estimated number of main lines 50
Estimated length of main lines 9–14 km
Estimated number of tie lines 10
Estimated length of tie lines 10 km
AUV depth 30–40 m above the seabed
AUV speed 3–4 knots (nominal)
Multibeam Multibeam echo sounders (MBES) use multiple sound signals to detect the sea floor. By using multiple beams, the AUV can map a swath of seabed on a single line, reducing survey time while providing detailed information. For this survey, two MBES may be used. The first MBES comprises an AUV with inbuilt transmit and receive transducers to provide MBES swath bathymetry; the second comprises a transducer installed on the hull of the vessel.
As the vessel travels along the chosen lines, the transmit transducer directs sound waves down through the water to the seabed. The reflected sound is measured by the receive transducer and is provides information on the bathymetry of the seabed. Although the exact equipment is not yet known, Table 2-3 summarises the indicative MBES parameters relevant to the geophysical scope.
Table 2-3: MBES Survey Parameters
Parameter Survey Specifications
AUV MBES
Indicative frequency 200–400 kHz
Swath coverage ~150 degrees
Pulse duration ~14 microseconds
Acoustic source volume 207 dB re 1 μPa @ 1 m 196 dB re 1 μPa @10 m

Document No.: G7-NT-PLNX0000089 Jansz-Io Compression: Revision Date: 15 March 2018 JIC Geophysical and Geotechnical Survey Environment Plan Summary Revision: 1
© Chevron Australia Pty Ltd Public Page 24 Uncontrolled When Printed Printed Date: 19 March 2018
Parameter Survey Specifications 180 dB re 1 μPa @ 45 m 168 dB re 1 μPa @ 100 m
Hull-mounted MBES
Indicative frequency 40–100 kHz
Swath coverage ~140 degrees
Pulse duration ~0.2 microseconds
Maximum number of soundings per ping 800
Acoustic source volume
208 dB re 1 μPa @ 1 m 199 dB re 1 μPa @10 m 180 dB re 1 μPa @ 120 m 182 dB re 1 μPa @ 100 m 108 dB re 1 μPa @ 1000 m
Source: Ref. 1
Side-scan Sonar Side-scan sonar uses high-frequency sound pulses that are reflected off the sea floor to create an image of morphology and differences in seabed texture. An AUV with inbuilt transmit and receive transducers is to execute side-scan sonar backscatter for this scope.
Higher resolution side-scan sonar units (or transducers) commonly use frequencies from 36 kHz to 900 kHz. Although the exact equipment is not yet known, Table 2-4 summarise the indicative side-scan sonar parameters relevant to the geophysical scope.
Table 2-4: Side-scan Sonar Survey Parameters
Parameter Survey Specifications
Indicative frequency 105–410 kHz
Indicative sound levels 216 dB re 1 μPa 210 dB re 1 μPa @ 1 m
Source: Ref. 2
Sub-bottom Profiler Acoustic sub-bottom profiling systems are used to determine the physical properties of the sea floor and to image and characterise geological information below the sea floor. Pinger and chirp type equipment is to be used for this program.
This equipment is low frequency, usually operating from 500 Hz to 24 kHz, and typically can penetrate to 30 m to 100 m with a vertical resolution of 0.3 m to 1 m. Although the exact equipment is not yet known, Table 2-5 summarises the indicative sub-bottom profiler parameters relevant to the geophysical scope.
Table 2-5: Sub-bottom Survey Parameters
Parameter Survey Specifications
Sub-bottom profiler frequency 1–16 kHz
Indicative sound levels 200 dB re 1 μPa @ 1 m
Source: Ref. 3

Document No.: G7-NT-PLNX0000089 Jansz-Io Compression: Revision Date: 15 March 2018 JIC Geophysical and Geotechnical Survey Environment Plan Summary Revision: 1
© Chevron Australia Pty Ltd Public Page 25 Uncontrolled When Printed Printed Date: 19 March 2018
2.2.2 Geotechnical
The specific vessel to complete the geotechnical scope under the EP is not yet known. Generally, geotechnical site investigations are performed from a specialised geotechnical vessel or a vessel of opportunity such as a drilling ship or supply vessel. For any of these vessels, seabed sampling equipment is deployed over the side via a special deployment structure, or through the ship’s moon pool. Once the equipment is placed upon the seabed, the test is performed and/or the sample is collected.
The equipment that is deployed to the sea floor for all sampling and testing techniques (except bore samples) comprises a box corer, piston corer, piezo cone penetrometer, and Cyclic T-bar equipment. The indicative footprint associated with each deployment of this equipment is expected to be ~2 m2. This equipment is expected to be deployed to all sites and at intermittent locations along flowline routes.
The geotechnical program comprises in situ testing and recovery of sediment samples at locations within the operational area. Types of in situ testing associated with this survey include piezo cone penetration test (PCPT) and Cyclic T-bar testing. Soil sampling techniques may include piston, box, and borehole sampling.
PCPT PCPT provides a detailed profile that describes soil characteristics and strengths. It involves pushing a probe into the seabed at a constant rate of penetration and continuously measuring resistance, friction, and water pressure. Since data are obtained continuously with depth, it can detect fine changes in stratigraphy. Piezo cone penetrometers are approximately 40 mm in diameter.
For this program, PCPT soundings are performed continuously until the targeted depths of 70 m below the seabed is reached.
Cyclic T-bar Testing T-bar, or ball penetrometer, is a full-flow penetrometer test designed to evaluate the shear strength (peak and remoulded) of soft sediments. The test involves pushing a short section of horizontal bar / ball into the sediments and measuring the resistance to penetration. The horizontal bar / ball is attached to a piezo cone penetrometer to measure the resistance to penetration. Deployment is similar to the PCPT whereby it is pushed to the required depth below the mudline. T-bar penetrometers are approximately 40 mm in diameter.
For this program, T-bar tests are performed until the targeted depths of 20 m below the seabed is reached.
Piston Sampling Technique Piston sampling involves penetrating the seabed with a steel sample tube to recover soil samples for geotechnical analysis. The leading edge of the sample tube is tapered to minimise sample and seabed disturbance. Piston samples are typically ~85 mm in diameter.
This technique is proposed to be used to collect samples up to 5 m below the seabed.
Box Sampling Technique Box sampling involves collecting surface layer seabed sediments in a box (dimensions ~0.5 m × 0.5 m × 0.5 m). The box is mounted on a frame, which is lowered to the sea floor with a self-releasing trigger mechanism that allows the box to penetrate the sea floor. The penetration is limited by a stopper to a depth of up to 1 m.
Borehole Sampling Technique Borehole sampling involves drilling through seabed sediments / weak rock with an open-centred drill bit.
For this program, either a dedicated drilling ship or sea floor drilling system is to be used for drilling, recovering soil samples and in situ testing.
If a sea floor drilling system is used, it will be positioned on the seabed with a guide base and connected by a control umbilical, which provides power and video to allow for real-time high-speed control. Deployment and recovery is done with the vessel crane or a dedicated launch and recovery system (LARS). The footprint of this unit on the sea floor is expected to be ~14 m2.
If a drilling ship is used, the footprint is anticipated to be limited to the footprint of the subsea drill-string stabilisation frame with no need for wet storage of additional sea floor equipment.

Document No.: G7-NT-PLNX0000089 Jansz-Io Compression: Revision Date: 15 March 2018 JIC Geophysical and Geotechnical Survey Environment Plan Summary Revision: 1
© Chevron Australia Pty Ltd Public Page 26 Uncontrolled When Printed Printed Date: 19 March 2018
During coring, sediment samples are collected via a dedicated rotary coring drill string or a drop-in core barrel that latches inside the drill string. Rotary core samples are typically ~44-85 mm in diameter. Samples from borehole techniques are proposed to be acquired up to 70 m below the seabed.
Coring will generate drilling cuttings; however, given the limited depth and drill bit size, the cuttings volume is expected to be minimal and is expected to settle around the sample location. To provide an indication as to the volume of cuttings potentially generated by these activities, each core will comprise a volume of 0.35 m3 (based upon an area of 0.005 m2*70 m), and any cuttings are expected to be significantly less than this as these cores are recovered to the survey vessel.
Drilling fluids will also support core sampling. Fluid composition is to be selected closer to the date of the geotechnical work scope, but may include water or synthetic based products which are subject to an environmental chemical assessment.
Survey Vessel and Support Operations
The vessel used to execute the geophysical and geotechnical surveys has not yet been confirmed. However, it is expected that the vessel is to be dynamically positioned (DP), which provides a stable platform to complete the surveys. Given the nature of activities described in the EP, the vessel is expected to be either slow moving (3–4 knots) during AUV operation, or stationary during AUV deployment / recovery and during soil sampling. Note: Because of the water depths associated with this program, anchoring will not be undertaken.
Due to the duration of these surveys, the survey vessel may need to be refuelled on-site, and require a crew change. Any crew change done by air is expected to be facilitated via CAPL’s Barrow Island Airport. Only helicopter operations within 500 m of the survey vessel are covered under the EP; helicopter transit activities are managed under existing arrangements.
In addition to the AUV, a remotely operated vehicle may be utilised to map the benthic environment of the survey corridor.

Document No.: G7-NT-PLNX0000089 Jansz-Io Compression: Revision Date: 15 March 2018 JIC Geophysical and Geotechnical Survey Environment Plan Summary Revision: 1
© Chevron Australia Pty Ltd Public Page 27 Uncontrolled When Printed Printed Date: 19 March 2018
3. Description of the Environment To meet the requirements of OPGGS(E)R, Division 2.3, Regulation 13(2), Description of the Environment, this Section describes the environment that may be affected (EMBA) relevant to the EP for the petroleum activity.
The potential extent of the environmental aspects and impacts arising from geophysical and geotechnical surveys (except a vessel collision event) is expected to be limited to the defined operational area (see Section 2.1.3). The EMBA in the event of a vessel collision was identified using impact thresholds from spill modelling undertaken for a vessel collision event.
To enable a systematic description of the environment and allow further consideration of consequence and sensitivity to impacts and risks arising from the petroleum activity and emergency conditions, the operational area and wider EMBA were overlaid on to geographic areas (referred to in the EP as impact assessment areas [IAAs]). Delineation of IAAs is based on government management plans, the ecological and social values of each area, and the presence of receptors, including the extent of marine protected areas.
Based upon the EMBA for this activity, only one IAA has the potential to be exposed to impacts and risks—the Offshore IAA. A detailed description of the Offshore IAAs is included in CAPL’s Description of the Environment document (Ref. 4).
The operational area associated with this petroleum activity is located within the Offshore IAA, and subsequently the description of the operational area environment (within the following sections) is a summary of the Offshore IAA as described in CAPL’s Description of the Environment document (Ref. 4). In addition to this, an updated Commonwealth Environment Protection and Biodiversity Conservation Act 1999 (EPBC Act) protected matters report has been completed for the operational area to inform protected matters that have the potential to be present in the operational area (Ref. 7).
Regional Overview
The Integrated Marine and Coastal Regionalisation of Australia (IMCRA) is an ecosystem-based classification of Australia’s marine and coastal environments that was developed by the Commonwealth Government as a regional framework for planning resources development and biodiversity protection (Ref. 5). The IMCRA divides Australia’s oceans into five Marine Regions with 41 provincial bioregions (biogeographical areas defined by similar ecological characteristics).
The operational area is located within the North-west Marine Region, which encompasses Commonwealth Waters from the WA /Northern Territory border, to the waters off Kalbarri in the south. The Marine Bioregional Plan for the North-west Marine Region (Ref. 6) aims to strengthen the operation of the EPBC Act in the region by improving the way the marine environment is managed and protected. This bioregional plan outlines the conservation values of the region, the associated pressures affecting those values, the priorities and strategies to address the pressures, and useful advice for industry planners looking to undertake activities in the region (Ref. 6). Information within this bioregional plan is referenced where relevant.
Table 3-1: Description of Provincial Bioregions
Bioregion Area Description
North-west Province Offshore waters between Exmouth and Port Hedland, occurring entirely on the continental slope. Water depths are predominantly between 1000 m and 3000 m (Ref. 6).
North-west Shelf Province
Offshore waters primarily on the continental shelf between North West Cape and Cape Bougainville, encompassing much of the area commonly known as the North West Shelf. Water depths range from 0 m to ~200 m (Ref. 6).
3.1.1 Marine Environment
Marine Habitats The depth of water associated with the operational area precludes the establishment of benthic primary producer habitat (i.e. macroalgae and seagrass).

Document No.: G7-NT-PLNX0000089 Jansz-Io Compression: Revision Date: 15 March 2018 JIC Geophysical and Geotechnical Survey Environment Plan Summary Revision: 1
© Chevron Australia Pty Ltd Public Page 28 Uncontrolled When Printed Printed Date: 19 March 2018
Benthic investigations for the Jansz Feed Gas Pipeline determined that deeper areas comprised soft sediments of varying grain size. Along the installation corridor, sediment grades relate to water depth, with sediments becoming finer and having increasing clay-sized particle content at increasing water depth (Ref. 69; Ref. 70).
The surveys noted harder substrates were identified where substrate was too steep for unconsolidated sediments such as sand, mud, and silt to settle.
Additional benthic surveys along the entire Gorgon and Jansz Feed Gas Pipeline routes (Ref. 74) determined the substrate was dominated by bare sand. Sand was the dominant substrate in 89% of the observations along the pipeline routes. Limestone pavement with a shallow sand veneer was the next most common substrate (8% of observations). Most towed video observations along the pipeline route in Commonwealth Waters were classified as unvegetated, in terms of the dominant ecological element present. Non-coral benthic macroinvertebrates were the most common biotic observed along the pipeline; however, coverage was considered to be sparse at 90% of the 147 locations where it was identified (Ref. 74).
The operational area is located within two Key Ecological Features (KEFs):
• Continental slope demersal fish communities
• Ancient Coastline at 125 m depth contour
An additional KEF is present within the EMBA:
• Exmouth Plateau
The value of these KEFs is that they provide hard substrate and subsequently habitat that is considered to result in increased species diversity and abundance. A description of the KEFs with the potential to be exposed is provided below.
Continental Slope Demersal Fish Communities
Demersal fish assemblages within the North-west Province, specifically the continental slope between North West Cape and the Montebello Trough, is characterised by high endemism and species diversity with more than 500 fish species (of which 76 species are considered to be endemic).
This KEF is considered valuable as it provides areas of hard substrate and therefore may provide sites for higher diversity and enhanced species richness relative to surrounding areas of predominantly soft sediment. It also may facilitate increased availability of nutrients in particular locations off the Pilbara coast by disrupting internal waves, thus facilitating enhanced vertical mixing of water layers. Enhanced productivity may attract opportunistic feeding by larger marine life including Humpback Whales, Whale Sharks, and large pelagic fish (Ref. 6).
Ancient Coastline at 125 m Depth Contour
The ancient coastline is a ledge of hard substrate on the seabed at 125 m water depth and is recognised as a KEF for its biodiversity values, including unique seabed features with ecological properties of regional significance. It is believed to be a possible navigation aid for whales, Whale Sharks, and other migratory pelagic species as they move through the region (Ref. 4).
Parts of the ancient coastline, particularly where it exists as a rocky escarpment, are thought to provide biologically important habitats in areas otherwise dominated by soft sediments. The topographic complexity of these escarpments may also facilitate vertical mixing of the water column, providing relatively nutrient-rich local environments (Ref. 6).
Exmouth Plateau
The Exmouth Plateau is a regionally and nationally unique deep-sea plateau in tropical waters.
It covers an area of approximately 50 000 km2 and consists of a generally rough and undulating surface at water depths of approximately 500 m to more than 5000 m. The plateau is thought to be dotted with numerous pinnacles. It is an important geomorphic feature that modifies the flow of deep waters, and has been identified as a site where internal waves are generated by internal tides. The plateau also receives settling detritus and other matter from the pelagic environment (Ref. 6).

Document No.: G7-NT-PLNX0000089 Jansz-Io Compression: Revision Date: 15 March 2018 JIC Geophysical and Geotechnical Survey Environment Plan Summary Revision: 1
© Chevron Australia Pty Ltd Public Page 29 Uncontrolled When Printed Printed Date: 19 March 2018
Marine Fauna
Marine Mammals
A search of the protected matters database (Ref. 7) indicated that several Threatened or Migratory marine mammals may be present within the operational area, including:
• Humpback Whale
• Blue (and Pygmy Blue) Whale
• Sei Whale
• Fin Whale
• Antarctic Minke Whale
• Bryde’s Whale
• Killer Whale
• Sperm Whale
• Spotted Bottlenose Dolphin.
As there are no known feeding, calving, and resting areas within the operational area, most of these species are expected to be transient. However, the operational area intersects the Blue Whale Migration Biologically Important Area (BIA), and is within 16 km from a Humpback Whale Migration BIA.
Blue Whales are expected to migrate north through the operational area during April to August and south from September to November. Satellite tagging has confirmed that the pygmy blue whale feeds off the Perth Canyon and heads north in March/April to potential breeding grounds in Indonesian waters by June (Ref. 93)
Humpback Whales migrate annually (June to October) between their feeding grounds in Antarctic waters and their calving grounds in Pilbara/Kimberley(Ref. 8). Northbound Humpback Whales tend to remain in, or within, 200 m water depth, while southbound whales tend to come closer to Barrow Island, generally between 50 m and 200 m water depth (Ref. 9).
Reptiles
A search of the protected matters database (Ref. 7) indicated five Threatened or Migratory species of marine turtles may be present within the operational area:
• Green Turtle
• Hawksbill Turtle
• Flatback Turtle
• Loggerhead Turtle
• Leatherback Turtle.
An additional species was identified as having the potential to be present within the EMBA:
• Short-nosed Seasnake
These species are all listed as Migratory under the EPBC Act, with Loggerhead and Leatherback Turtles also listed as Endangered. Some species of turtles may be found foraging throughout the water column all year round in the North West Shelf waters within the operational area (Ref. 12; Ref. 13; Ref. 14).
A BIA associated with the Flatback Turtle was identified to overlap the operational area. The Flatback Turtle BIA is associated with an internesting buffer, which is an area that generally surrounds important turtle nesting areas. During turtle internesting periods, turtles are known to be more sedentary (Ref. 15). However, studies indicate that during internesting periods, marine turtles (including Flatbacks) tend to travel within 5 km of the nesting coastline (Ref. 16). The operational area is located ~100 km distant from Barrow Island and the Montebello Islands. This area was identified as critical habitat under the Recovery Plan for Marine Turtles in Australia (Ref. 17). However, because the operational area is on the outer limit of this habitat, it is not expected that significant numbers of internesting marine turtles would be present in this area.

Document No.: G7-NT-PLNX0000089 Jansz-Io Compression: Revision Date: 15 March 2018 JIC Geophysical and Geotechnical Survey Environment Plan Summary Revision: 1
© Chevron Australia Pty Ltd Public Page 30 Uncontrolled When Printed Printed Date: 19 March 2018
A number of seasnake species were identified via the EPBC search as having the potential to be present in the operational area. However, Cogger (Ref. 98; Ref. 99) state that most seasnakes have shallow benthic feeding patterns and are rarely observed in water depths exceeding 30 m. As such, sea snakes are not expected to be common within the operational area or wider EMBA.
Fishes, including Sharks and Rays
A search of the protected matters database (Ref. 7) indicated several Threatened or Migratory fish, shark, and ray species may be present within the operational area, including:
• Grey Nurse Shark
• Great White Shark
• Green Sawfish
• Dwarf Sawfish
• Narrow Sawfish
• Whale Shark
• Shortfin Mako Shark
• Longfin Mako Shark
• Giant Manta Ray
• Reef Manta Ray.
The operational area overlaps a BIA for the Whale Shark (listed as Migratory). The Whale Shark BIA is associated with its foraging behaviours northward from Ningaloo along the 200 m isobath.
The operational area overlaps the continental slope demersal fish communities. Fish communities of the upper slope (225–500 m depth) and mid-slope (750–1000 m depth) display a high degree of endemism, supporting more than 508 fish species of which 76 species are endemic (Ref. 18). The high numbers of species are believed to be associated with areas of enhanced biological productivity because of the interaction between seasonal currents and sea floor topography. Spawning grounds and nursery areas for commercial and recreational fish species are not known to occur close to the operational area. The operational area overlaps the ancient coastline at the 125 m depth contour. This KEF comprises a unique sea floor feature that provides areas of enhanced biological productivity in the area.
A number of pipefish, pipehorse and seahorse species (solenostomid and syngnathids) were identified via the EPBC search as having the potential to be present in the operational area Ref. 7). However, almost all syngnathids live in nearshore and inner shelf habitats, usually in shallow, coastal waters, among seagrasses, mangroves, coral reefs, macroalgae-dominated reefs, and sand or rubble habitats (Ref. 100; Ref. 101; Ref. 102; Ref. 103). Although two species have been identified in the north-west marine region in deeper waters (winged seahorse [Hippocampus alatus] and the western pipehorse [Solegnathus sp.2] (Ref. 104), these species were not identified by the matters of NES search for the operational area. Consequently, it is expected that there is a lack of appropriate habitat within the operational area, and thus solenostomid and syngnathids are not expected to be common within the operational area.
Seabirds and Shorebirds
A search of the protected matters database (Ref. 7) indicated several species of Threatened or Migratory seabirds or shorebirds may be present within the operational area, including:
• Red Knot
• Curlew Sandpiper
• Southern Giant-petrel
• Eastern Curlew
• Australian Fairy Tern
• Common Noddy

Document No.: G7-NT-PLNX0000089 Jansz-Io Compression: Revision Date: 15 March 2018 JIC Geophysical and Geotechnical Survey Environment Plan Summary Revision: 1
© Chevron Australia Pty Ltd Public Page 31 Uncontrolled When Printed Printed Date: 19 March 2018
• Streaked Shearwater
• Common Sandpiper
• Sharp-tailed Sandpiper
• Pectoral Sandpiper
• Osprey
• Lesser Frigatebird.
An additional species was identified as having the potential to be present within the EMBA:
• Greater Frigatebird
The Red Knot and Southern Giant-petrel are listed as Endangered under the EPBC Act, and the Eastern Curlew and Curlew Sandpiper are listed Critically Endangered.
Although no BIAs were identified for these species, a single BIA associated with the Wedge-tailed Shearwater (listed as Migratory but not picked up in the protected matters search) was identified to overlap the operational area and as such has been included. This BIA is associated with its breeding / foraging behaviours and indicates that the species has a wide breeding and foraging distribution. As there is no suitable breeding habitat for this species within the operational area, it is expected that it only uses the area for foraging.
Shoreline Habitats No shoreline types occur within the operational area.
Air Quality Air quality in the operational area is largely at background levels due to its relative remoteness. The nearest pollutant sources are from CAPL’s Wheatstone Platform, which is associated with processing gas condensate produced from CAPL’s Wheatstone Asset.
3.1.2 Socioeconomic Environment
Commercial Shipping Based upon consultation with AMSA, a charted shipping fairway runs through the centre of the operational area with vessel traffic passing in a NE/SW direction. It is anticipated that heavy commercial vessels would be encountered in this. In addition to this, local and support vessels for the offshore petroleum industry are expected to be encountered within the operational area.
Commercial Fishing and Aquaculture Several State and Commonwealth fisheries intersect the operational area; however, the area is not noted to be of particular importance to any fisheries. Historic fishing effort in this area is low, and the operational area only occupies a small proportion of the total area of the fishery permits.
Detailed information regarding all commercial fisheries and aquaculture operations is provided in Sections 5.3 and 5.4 of the Description of the Environment document (Ref. 4).
State and Commonwealth fisheries that may intersect the operational area are listed inTable 3-2.
Table 3-2: State and Commercial Managed Fisheries
State Managed Fisheries Commonwealth Managed Fisheries
• Pilbara Line Fishery • Pilbara Trap Fishery • Onslow Prawn Managed Fisheries • Mackerel Managed Fishery • Pearl Oyster Managed Fishery • Pearl Aquaculture
• North West Slope Trawl Fishery • Southern Bluefin Tuna Fishery • Western Skipjack Tuna Fishery • Western Tuna and Billfish Fishery

Document No.: G7-NT-PLNX0000089 Jansz-Io Compression: Revision Date: 15 March 2018 JIC Geophysical and Geotechnical Survey Environment Plan Summary Revision: 1
© Chevron Australia Pty Ltd Public Page 32 Uncontrolled When Printed Printed Date: 19 March 2018
State Managed Fisheries Commonwealth Managed Fisheries
• Specimen Shell Managed Fishery • Marine Aquarium Fish Managed Fishery
Marine-based Tourism and Recreation
No significant marine-based tourism and recreation is known to occur in the operational area. This was supported via stakeholder consultation with no feedback on this activity provided.
• Australian Marine Parks
No Australian Marine Parks (formerly Commonwealth Marine Reserves as described in CAPL’s Description of the Environment document [Ref. 4] are present within the operational area.
A single Australian Marine Park is present within the EMBA. As detailed in CAPL’s Description of the Environment document (Ref. 4), Table 3-3 provides an overview of the values and sensitivities associated with the marine park.
Table 3-3: Montebello Australian Marine Park
Montebello AMP
• IUCN Category VI
• Important foraging areas: adjacent to important breeding areas for migratory seabirds for vulnerable and migratory Whale Sharks adjacent to important nesting sites for marine turtles.
• Includes part of the migratory pathway of the protected Humpback Whale. • The reserve includes shallow shelf environments (15 to 150 m deep) and
provides protection for shelf and slope habitats, as well as pinnacle and terrace sea floor features.
• Examples of the sea floor habitats and communities of the Northwest Shelf Province provincial bioregions as well as the Pilbara (offshore) mesoscale bioregion.
• One key ecological feature for the region is represented in this reserve—Ancient Coastline, a unique sea floor feature that provides areas of enhanced biological productivity.
3.1.3 Cultural Heritage
The WA Department for Planning, Lands and Heritage Register of Aboriginal Sites indicates that numerous Aboriginal cultural heritage sites occur within coastal areas of the WA mainland and islands, but no known sites or artefacts are listed within the operational area (Ref. 19).
Relevant European cultural heritage sites are listed in the National Heritage Lists, Register of National Estate World, Commonwealth Heritage Lists, and Places of Historic Significance to Australia.
According to these lists (as at May 2017), no known sites or artefacts exist within the operational area, and no known wrecks occur within the operational area according to the Australian National Shipwreck Database (Ref. 20).
3.1.4 Particular Values and Sensitivities
The particular values and sensitivities identified for the operational area are:
Marine Habitat:
• Continental slope demersal fish communities (KEF)
• Ancient coastline at 125 m depth contour (KEF)

Document No.: G7-NT-PLNX0000089 Jansz-Io Compression: Revision Date: 15 March 2018 JIC Geophysical and Geotechnical Survey Environment Plan Summary Revision: 1
© Chevron Australia Pty Ltd Public Page 33 Uncontrolled When Printed Printed Date: 19 March 2018
Marine Fauna (in addition to transient marine fauna):
• Whales
Humpback and Pygmy Blue (migration)
• Turtles
Flatback Turtle (internesting)
• Fishes including rays and sharks
Whale Shark (foraging)
Continental slope demersal fish communities (KEF)
Ancient coastline at 125 m depth contour (KEF)
• Seabirds and Shorebirds
Wedge-tailed shearwater (breeding / foraging)
Socioeconomic Environment:
• Commercial fisheries
Additional particular values and sensitivities specific to the EMBA are:
Marine Habitat:
• Exmouth Plataeu
Socioeconomic Environment:
• Montebello Australian Marine Park

Document No.: G7-NT-PLNX0000089 Jansz-Io Compression: Revision Date: 15 March 2018 JIC Geophysical and Geotechnical Survey Environment Plan Summary Revision: 1
© Chevron Australia Pty Ltd Public Page 34 Uncontrolled When Printed Printed Date: 19 March 2018
4. Environmental Risk Assessment Methodology In accordance with Regulation 13(5) of the OPGGS(E)R, this Section summarises the methodology used to identify and assess the environmental impacts and risks associated with the activities described in Section 2 of the EP.
The risk assessment for the EP was undertaken in accordance with the CAPL Health, Environment, and Safety (HES) Risk Management Process (Ref. 21) using Chevron Corporation’s Integrated Risk Prioritization Matrix (Figure 4-1). This approach generally aligns with the processes outlined in ISO 31000:2009 Risk Management – Principles and Guidelines (Ref. 22) and Handbook 203:2012 Managing Environment-Related Risk (Ref. 23).
The risk assessment process and evaluation involved numerous consultations and workshops with environmental, health, safety, commissioning, start-up, operations, maintenance, and engineering personnel. Risks considered and covered in the EP were identified and informed by:
• experience gained during previous offshore construction activities near the Jansz gas field
• expertise and experience of CAPL personnel
• stakeholder engagement (Section 1.4).
The impact and risk assessment process comprised these tasks:
• identifying and describing the petroleum activity
• identifying particular environmental values
• identifying relevant environmental aspects
• identifying relevant environmental hazards
• evaluating impacts and risk
consequence evaluation
control measure identification and ALARP evaluation
likelihood evaluation
quantifying the level of risk
• risk and impact acceptance
• environmental performance outcomes, standards, and measurement criteria.
RISK: The Health, Environment, Safety (HES) Risk Management Process (Ref. 21) defines risk as the combination of the potential consequences arising from a specified hazard together with the likelihood of the hazard actually resulting in an unwanted event.
After identifying the potential hazards, the potential consequences were assessed and evaluated. Consequence is defined using Chevron Corporation’s Integrated Risk Prioritization Matrix (Figure 4-1). The level of consequence is determined by the potential level of impact based on:
• the spatial scale or extent of potential hazards of the environmental aspect within the receiving environment
• the nature of the receiving environment (from Section 3) (within the spatial extent), including proximity to sensitive receptors, relative importance, and sensitivity or resilience to change
• the impact mechanisms (cause and effect) of the environmental hazard within the receiving environment (e.g. persistence, toxicity, mobility, bioaccumulation potential)
• the duration and frequency of potential effects and time for recovery
• the potential degree of change relative to the existing environment or to criteria of acceptability.

Document No.: G7-NT-PLNX0000089 Jansz-Io Compression: Revision Date: 15 March 2018 JIC Geophysical and Geotechnical Survey Environment Plan Summary Revision: 1
© Chevron Australia Pty Ltd Public Page 35 Uncontrolled When Printed Printed Date: 19 March 2018
Figure 4-1: Chevron Corporation’s Integrated Risk Prioritization Matrix

Document No.: G7-NT-PLNX0000089 Jansz-Io Compression: Revision Date: 15 March 2018 JIC Geophysical and Geotechnical Survey Environment Plan Summary Revision: 1
© Chevron Australia Pty Ltd Public Page 36 Uncontrolled When Printed Printed Date: 19 March 2018
4.1.1 Control Measures and ALARP
Control measures are identified depending on the assessment technique used to demonstrate that environmental impacts and risks are reduced to levels that are considered as low as reasonably practicable (ALARP) in accordance with the defined environmental performance outcomes.
ALARP Decision Context In alignment with NOPSEMA’s ALARP Guidance Note (Ref. 25), CAPL has adapted the approach developed by Oil and Gas UK (OGUK; Ref. 26) for use in an environmental context to determine the assessment technique required to demonstrate that potential impacts and risks are ALARP (Figure 4-2, from Ref. 25). Specifically, the framework considers impact severity and several guiding factors:
• activity type
• risk and uncertainty
• stakeholder influence.
A Type A decision is made if the risk is relatively well understood, the potential impacts are low, activities are well practised, and there is no significant stakeholder interest. Note: If good practice is not sufficiently well-defined, additional assessment may be required.
A Type B decision is made if there is greater uncertainty or complexity around the activity and/or risk, the potential impact is moderate, and the risk generates stakeholder concern. In this instance, established good practice is not considered sufficient, and further assessment is required to support the decision and ensure that the risk is ALARP.
A Type C decision will typically involve sufficient complexity, high potential impact, uncertainty, or stakeholder interest to require a precautionary approach. In this case, relevant good practice will still have to be met, additional assessment will be required, and the precautionary approach applied for those controls that only have a marginal cost benefit.
Figure 4-2: ALARP Decision Support Framework
Source: Ref. 25
Risk and Impact Acceptance Criteria
NOPSEMA provides guidance on demonstrating that impacts and risks will be of an acceptable level (Ref. 87). This guidance indicates that an ‘acceptable level’ is the level of impact or risk to the environment that may be considered broadly acceptable with regard to all relevant considerations including:

Document No.: G7-NT-PLNX0000089 Jansz-Io Compression: Revision Date: 15 March 2018 JIC Geophysical and Geotechnical Survey Environment Plan Summary Revision: 1
© Chevron Australia Pty Ltd Public Page 37 Uncontrolled When Printed Printed Date: 19 March 2018
• principles of ecologically sustainable development (ESD)
• legislative and other requirements (including laws, policies, standards, conventions)
• matters protected under Part 3 of the EPBC Act, consistent with relevant policies, guidelines, Threatened species recovery plans, plans of management, management principles etc.
• internal context (e.g. consistent with titleholder policy, culture, and company standards)
• external context (the existing environment and stakeholder expectations)
• defined level of acceptability.
These principles generally align with Chevron Corporations RiskMan2 procedure, which describe that a level of potential impact or risk is acceptable where:
• world-class performance can be achieved (as indicated by applying best applicable industry practices and standards that are consistent with titleholder policy, culture, and company standards)
• all practicable control measures have been identified to protect people and the environment (including those identified via consultation with relevant persons)
• all regulatory and statutory requirements are to be implemented (including an assessment of whether the activity is consistent with the principles of ESD outlined in section 3A of the EPBC Act; and the precautionary principle set out in section 391 of the EPBC Act)
• a determination that all reasonable risk reduction measures have been taken;
4.2.1 Summary of Acceptance Criteria
Table 4-1 outlines the criteria that CAPL have used to demonstrate that impacts and risks from each of the identified aspects are acceptable.
Table 4-1: Acceptability Criteria
Acceptability Test How They Have Been Applied
Principles of ESD Is there the potential to affect biological diversity and ecological integrity? (Consequence Level between Moderate [4] and Catastrophic [1]) Do activities have the potential to result in permanent/ irreversible; medium-large scale; moderate-high intensity environmental damage?
If yes: Is there significant scientific uncertainty associated with aspect?
If yes: Are there additional measures to prevent degradation of the environment from this aspect?
Relevant environmental legislation and other requirements
Confirm that the management of impacts and risks is consistent with relevant Australian environmental management laws and other regulatory and statutory requirements.
Internal context Confirm that all good practice control measures have been identified for this aspect through CAPL’s management systems and the management of impacts and risks is consistent with company policy, culture and standards
External context What objections and claims regarding this aspect have been made, and how have they been considered / addressed?
Defined acceptable level For environmental impacts arising from planned aspects / activities, is the consequence less than Severe (2) (i.e. is the Consequence ranked between 3 and 6)?? For potential environmental impacts and risks, is the risk level ranked lower than 4 (i.e. between 5 and 10)?

Document No.: G7-NT-PLNX0000089 Jansz-Io Compression: Revision Date: 15 March 2018 JIC Geophysical and Geotechnical Survey Environment Plan Summary Revision: 1
© Chevron Australia Pty Ltd Public Page 38 Uncontrolled When Printed Printed Date: 19 March 2018
5. Environmental Risk Assessment and Management Strategy – Petroleum Activity
To meet the requirements of the OPGGS(E)R, Regulation 13(5) and (6) Evaluation of environmental impacts and risks and Regulation 13(7) Environmental performance outcomes and standards, this Section evaluates the impacts and risks associated with the petroleum activity appropriate to the nature and scale of each impact and risk, and details the control measures that are used to reduce the risks to ALARP and an acceptable level. Additionally, Environmental Performance Outcomes, Environmental Performance Standards, and Measurement Criteria have also been developed and are described in the following sections.
Physical Presence (Marine Users and Marine Fauna)
Cause of Aspect
This activity was identified as having the potential to result in the physical interaction with marine fauna or other marine users within the operational area: • Survey vessel and support operations
Hazard
Physical interaction has the potential to result in: • injury or death of marine fauna; or • a disruption to commercial activities.
Potential Consequence Summary Ranking
Injury or death of marine fauna Surface-dwelling macrofauna are the species most at risk from this hazard and thus are the focus of this evaluation. As identified in Section 3.1.1.2, several whale species listed as threatened and/or migratory under the EPBC Act have the potential to occur within the operational area; internesting Flatback Turtles also have the potential to be present within the operational area. The Whale Shark was identified as a surface-dwelling species with a BIA that overlaps the operational area. Four BIAs overlap the operational area: • Blue Whale (migration) • Humpback Whale (migration) • Whale Shark (foraging) • Flatback Turtle (internesting). Limited data exists on other potential fauna such as turtles and Whale Sharks, possibly due to lack of collisions being noticed and lack of reporting; however, marks observed on animals show evidence of vessel strikes (Ref. 27). Although vessel strike can be fatal for individual turtles, it has not been shown to cause population-level declines (Ref. 17). Cetaceans were the focus of this evaluation, and were the representative case used to undertake a consequence evaluation. Cetaceans are naturally inquisitive marine mammals that are often attracted to offshore vessels and facilities. The reaction of whales to the approach of a vessel varies—some species remain motionless when close to a vessel, while others are known to be curious and often approach ships that have stopped or are slow moving; however, they usually do not approach, and sometimes avoid, faster moving ships (Ref. 28). Collisions between larger vessels with reduced manoeuvrability and large, slow-moving cetaceans occur more frequently where high vessel traffic and cetacean habitat occurs (Ref. 29). Laist et al. (Ref. 30) identifies that larger vessels with reduced manoeuvrability moving in excess of 10 knots may cause fatal or severe injuries to cetaceans, with the most severe injuries caused by vessels travelling faster than 14 knots. There were recorded instances of cetacean deaths in Australian waters (e.g. a Bryde’s Whale in Bass Strait in 1992) (Ref. 29), though the data indicate these deaths are more
Incidental (6)

Document No.: G7-NT-PLNX0000089 Jansz-Io Compression: Revision Date: 15 March 2018 JIC Geophysical and Geotechnical Survey Environment Plan Summary Revision: 1
© Chevron Australia Pty Ltd Public Page 39 Uncontrolled When Printed Printed Date: 19 March 2018
likely to be associated with container ships and fast ferries. The Australian National Marine Safety Committee reports that during 2009, there was one report of a vessel collision with an animal (species not defined) (Ref. 31). Mackay et al. (Ref. 32) report that four fatal and three non-fatal collisions with Southern Right Whales have been recorded in Australian waters between 1950 and 2006, with a further fatal and non-fatal collision reported between 2007 and 2014. The duration of exposure to physical presence is limited to the length of the geotechnical and geophysical campaigns, which, based on the scope and estimated time frames described in Section 2.1, is expected to be ~65 days split over two campaigns undertaken at separate times, at any of year. To complete the surveys, vessels will either be travelling at low speeds or stationary. Consequently, any fauna strike is expected to result in a recoverable injury, not death. If a fauna strike occurred and resulted in death, it is not expected to have a detrimental effect on the overall population, suggesting this event would result in a limited short-term effect (expected individual impacts) and not affect any populations.
A disruption to commercial activities As identified in Section 3, several commercial fisheries have licences that overlap the operational area associated with the EP, and a shipping fairway overlaps the operational area. Consultation with AMSA indicates a large number of vessels are likely to be encountered where activities occur near the shipping fairway, however based upon the nature of the activity the most credible impact to other marine users would be the minor deviation of commercial vessels around the survey vessel. As only a single vessel is required for these surveys and the requirement to deviate around this vessel (given the majority of interaction would be with commercial shipping vessels) is not expected to impact on the functions, interests or activities of other marine users (as confirmed from stakeholder consultation records) and thus is evaluated to result in an incidental (6) impact. CAPL was unable to confirm the specific level of commercial fishing effort in the region, however based upon the nature and scale of the proposed activity (being limited to a single vessel), along with annual fishing records, it was determined that the proposed activities are not expected to result in an impact to commercial operations (via loss of catches). Consequently, any impact is expected to result in short-term effects to commercial operations.
Incidental (6)
Decision Context
Summary of Control Measures Risk Level Summary
A • EPBC Regulations 2000 – Part 8 Division 8.1 interacting with cetaceans – Australian National Guidelines for Whale and Dolphin Watching (Ref. 84). Vessel Master Fauna interaction management actions
• Conservation Management Plan for the Blue Whale (Ref. 12) and the Conservation Advice for the Humpback Whale 2015–2020 (Ref. 11). Incident reporting
• Commonwealth Navigational Act 2012 Pre-start Notifications OPGGS(E) regulations Ongoing Consultation
Consequence Incidental (6)
Likelihood Unlikely (4)
Risk Level Low (9)
Light Emissions
Cause of Aspect

Document No.: G7-NT-PLNX0000089 Jansz-Io Compression: Revision Date: 15 March 2018 JIC Geophysical and Geotechnical Survey Environment Plan Summary Revision: 1
© Chevron Australia Pty Ltd Public Page 40 Uncontrolled When Printed Printed Date: 19 March 2018
This activity was identified as having the potential to result in the generation of light emissions: • Survey vessel and support operations (navigational and work lighting). Monitoring undertaken by Woodside (Ref. 33) indicates that light density (navigational lighting) attenuated to below 1.00 lux and 0.03 lux at distances of 300 m and 1.4 km, respectively, from a mobile offshore drilling unit (MODU). As lighting on board a MODU is mounted higher than lighting on vessels, the level of exposure is considered to provide a conservative indication of potential exposures. Light densities of 1.00 and 0.03 lux are comparable to natural light densities experienced during deep twilight and during a quarter moon. For this assessment, it is conservatively assumed that within a distance of 1.4 km, there is the potential for light emissions to attract marine species.
Hazard
A change in ambient light levels resulting in a localised light glow may impact receptors by: • acting as an attractant to light-sensitive species (e.g. seabirds / fish), in turn affecting predator–prey
dynamics.
Potential Consequence Summary Ranking
Acting as an attractant to light-sensitive species No evidence suggests that artificial light sources adversely affect the migratory, feeding, or breeding behaviours of cetaceans. Cetaceans predominantly use acoustic senses to monitor their environment rather than visual sources (Ref. 34), so light is not considered to be a significant factor in cetacean behaviour or survival. Light may attract many species of fish, reptiles, and seabirds. Within the operational area, the particular values and sensitivities with the potential to be exposed to this emission include: • Wedge-tailed Shearwater (breeding / foraging) • Flatback Turtle (internesting). Studies conducted between 1992 and 2002 in the North Sea confirmed that artificial light was the reason that birds were attracted to and accumulated around illuminated offshore infrastructure (Ref. 35) and that lighting can attract birds from large catchment areas (Ref. 36). Note: These studies indicate that migratory birds are attracted to lights on offshore platforms when travelling within a radius of 5 km from the light source and that outside this zone their migratory paths are unaffected (Ref. 37). As the operational area, at its closest, is 5 km from coastline habitats, only a small number of Threatened or Migratory listed seabird species would be expected to be present in this area. It is not expected that light acting as an attractant to a small number of individual seabirds would result in any impact to an individual or to the greater population. Pendoley (Ref. 110) discovered that in the absence of illumination from the moon, glow from tower flares may influence the orientation of turtles at close range (30–100 m). Given that light emissions from this activity are limited to navigational lighting, exposure is expected to be much less than that associated with flaring. Based on findings from Pendoley (Ref. 110) and Hick (Ref. 111), it is expected that light emissions from this activity would result in a very small exposure area, which for this evaluation have been conservatively set to be within 500 m of the Vessel. Lighting emissions from this activity are only expected to result in small exposures, and thus the number of marine turtles exposed would be limited. The Recovery Plan for Marine Turtles in Australia (Ref. 17) identifies light emissions as a key threat as it disrupts critical behaviours. However, this plan notes that critical behaviours are focused on nesting (near coast) as well as disrupting hatchling orientation and sea finding behaviours of hatchlings. Given the distance offshore and limited exposure associated with this activity (assuming 0.007% exposure to the BIA assuming 500 m exposure footprint [0.79 km2]; and a BIA area of 11,309 km2) this emission is not expected to affect critical behaviours discussed in the turtle recovery plan, and in the event individual internesting turtles were attracted, due to the distance offshore it is not expected that this would significantly alter sensitive behaviours that would lead to individual or greater population impacts. Based on the distance to critical nesting habitats, limited sensitivities, and expected outcome that the limited exposure will not result in any impacts at an individual or population level, no further evaluation of this aspect was undertaken.
N/A

Document No.: G7-NT-PLNX0000089 Jansz-Io Compression: Revision Date: 15 March 2018 JIC Geophysical and Geotechnical Survey Environment Plan Summary Revision: 1
© Chevron Australia Pty Ltd Public Page 41 Uncontrolled When Printed Printed Date: 19 March 2018
Underwater Sound
Cause of Aspect
These activities were identified as having the potential to result in the generation of underwater sound emissions: • Geophysical survey (Pulsed) • Survey vessel and support operations (vessel operations) • Survey vessel and support operations (helicopter operations). • Remotely Operated Vehicle Geophysical survey Geophysical surveying comprises three techniques—MBES, side-scan sonar, and sub-bottom profiling. Indicative frequencies and sound levels associated with these techniques are provided in Section 2.2.1. In summary, survey techniques are expected to emit various frequencies between 1 and 400 kHz, with maximum sound levels (from the AUV transducers) conservatively estimated between the source level ~210 dB re 1 μPa @ 1 m (peak-to-peak sound Pressure Level [SPL]) and 168 dB re 1 μPa @ 100 m SPL (Ref. 1). Support operations – Vessel operations Studies of underwater noise generated from propellers of support vessels when holding position indicate highest measured levels up to 182 dB re 1 μPa, with levels of 120 dB re 1 μPa SPL root mean square (rms) recorded at 3–4 km (Ref. 38). Support operations – Helicopter operations Sound emitted from helicopter operations is typically below 500 Hz (Ref. 39). The peak received level diminishes with increasing helicopter altitude, but the duration of audibility often increases with increasing altitude. Richardson et al. (Ref. 28) report that helicopter sound was audible in air for four minutes before it passed over underwater hydrophones, but detectable underwater for only 38 seconds at 3 m depth and 11 seconds at 18 m depth. Remotely Operated Vehicle Studies of underwater noise generated from a remotely operated vehicle indicate dominant acoustic frequency is between 70 Hz to 80 Hz with sound pressure level of 146 dB re 1 μPa at 1 m (Ref. 112).
Hazard
The generation of underwater sound has the potential to affect marine fauna through: • localised and temporary fauna disturbance that significantly impacts migration or other social
behaviours • auditory impairment, permanent threshold shift (PTS), mortality or physical damage. The particular values and sensitivities with the potential to be exposed to sound emissions include: • Blue Whale (migration) • Humpback Whale (migration) • Whale Shark (foraging) • Flatback Turtle (internesting) • Continental slope demersal fish communities (KEF).
Potential Consequence Summary Ranking
Auditory impairment, permanent threshold shift (PTS), mortality or physical damage – Pulsed Whales The criteria set by Southall et al. (Ref. 40) suggests that to cause an instantaneous injury to cetaceans (including porpoises) resulting in a permanent loss in hearing, the sound must exceed 230 dB re 1 µPa (peak-to-peak SPL). These levels are well above the peak sound levels expected to be generated by this activity and thus, are not discussed further. Turtles
Incidental (6)

Document No.: G7-NT-PLNX0000089 Jansz-Io Compression: Revision Date: 15 March 2018 JIC Geophysical and Geotechnical Survey Environment Plan Summary Revision: 1
© Chevron Australia Pty Ltd Public Page 42 Uncontrolled When Printed Printed Date: 19 March 2018
Frequencies associated with this survey will be outside the 200 to 400 Hz range that studies have determined as being the most sensitive frequencies for Green Turtles (Ref. 75; Ref. 76; Ref. 77; Ref. 78; Ref. 79; Ref. 80; Ref. 81; Ref. 82). Additionally, for auditory impairment or PTS to occur, turtles would need to be immediately adjacent (within metres) of the AUV; this is not expected to occur because turtles are expected to increase their swimming activity in response to an approaching sound levels where peak-to-peak SPL is above 166 dB re 1 μPa (Ref. 83) Consequently, it is not considered credible that auditory impairment to turtles could occur from this survey. Fish Popper et al. (Ref. 41) propose qualitative indicators of relative risk of effects indicating that peak-to-peak SPL (~207 dB re 1 μPa) has the potential to result in a recoverable injury in fish that have high or medium hearing sensitivity. Auditory impairment then is assumed to occur above this level. Although the survey has the potential to generate source levels in the order of 210 dB re 1 μPa @ 1 m, exposure to peak-to-peak SPL >207 dB re 1 μPa would be limited. For auditory impairment to occur, the fish would need to be immediately adjacent (within metres) of the AUV; this is not expected to occur because the continuous nature of the survey is expected to result in fish moving away from the source before exposure levels reach impact thresholds. Consequently, it is not considered credible that auditory impairment to fish could occur from this survey. Therefore this potential impact is not considered further. Plankton Findings from McCauley et. al. (Ref. 94) indicate that impacts from standard seismic programs were limited to within 973–1,119 m of the source with received levels 1.1–1.2 km range was 178 dB re 1 μPa peak-to-peak SPL. Noting that the frequencies generate d by seismic programs are significantly different (0-200 Hz) to those generated by transducers (40-100 kHz) and thus extrapolation from this study is difficult, a threshold of 178 dB re 1 μPa peak-to-peak SPL has been used to indicate potential impacts to plankton from the hull mounted transducer. It is expected that 168 dB re 1 μPa peak-to-peak SPL is reached within 100 m (Ref. 1). Consequently, for the basis of this conservative consequence evaluation, it is assumed that there is the potential for the hull mounted multibeam echo sounder to cause impacts to plankton within 100 m of the source. Based upon the understanding that: • natural mortality of plankton (including fish larvae) is quite high, in the order of 21.3% per
day (Ref. 95), • plankton distributions are patchy and not evenly distributed in the open ocean, and • plankton populations in open water environments are influenced by oceanic processes
and therefore expected to rapidly recover from any localised impacts, impacts are expected to be localised to within close proximity of the vessel and temporary in nature as they recover rapidly. Consequently, any impacts to plankton is expected to result in an Incidental (6) consequence. Invertebrates Various reviews and recent studies have been undertaken to understand the potential impacts from underwater sound to invertebrates. These studies offer varying thresholds and findings. Payne et al. (Ref. 96) identified no effects on righting time in lobster at 202 dB re 1 μPa (peak-to-peak SPL) whilst Day et al. (Ref. 129) observed impacts at 209 dB re 1 μPa (peak-to-peak SPL). In lieu of studies specific to the commercially targetted invertebrates associated with commercial fisheries identified in Table 3-2, the threshold 202 dB re 1 μPa (peak-to-peak SPL) has been used as the potential impact threshold for commercially targeted invertebrates. Based upon the nature of the geophysical survey (Table 2-3), it is expected that exposures will fall below 200 dB re 1 μPa (peak-to-peak SPL) within 10 m of the source (Ref. 1). As the AUV is travelling between 30-40 m above the seafloor, any impacts to benthic invertebrates (abalone) is not expected and hasn’t been considered further.

Document No.: G7-NT-PLNX0000089 Jansz-Io Compression: Revision Date: 15 March 2018 JIC Geophysical and Geotechnical Survey Environment Plan Summary Revision: 1
© Chevron Australia Pty Ltd Public Page 43 Uncontrolled When Printed Printed Date: 19 March 2018
To evaluate impacts to pelagic invertebrates (specifically prawns), it is assumed that there is the potential for the transducer to cause impacts to pelagic invertebrates within 10 m of the source. Based upon the understanding that pelagic prawn populations are patchy and not evenly distributed in the open ocean, impacts are expected to be localised to within close proximity of the vessel and as recovery is expected to be quick given multiple spawning cycles per year, any impact would be expected to be temporary or short-term. In addition to this, although fishing effort within the operational area was not confirmed during consultation with fishery licence owners, based upon the nature and scale of the proposed activity (being limited to a single vessel), along with annual fishing records, it was determined that the proposed activities are not expected to result in an impact to commercial operations (via loss of catches). As such, any impacts to pelagic invertebrates is expected to result in an Incidental (6) consequence.
Localised and temporary behavioural disturbance – Pulsed Whales The United States (US) National Marine Fisheries Service (NMFS) guidance for pulsed sound indicates disturbance to cetaceans is likely at 160 dB re 1 µPa rms (Ref. 31). Based on the sound levels expected to be generated from the AUV and subsequent rapid attenuation of sound waves, for any impact other than behavioural disturbances, cetaceans will need to be within 100 m of the AUV. Although there is the potential for a larger number of cetaceans to be present during migration periods (Blue Whales tend to pass along the shelf edge at depths between 500 m to 1000 m) exposure to sound levels above 160 dB re 1 µPa rms are not expected to affect migration behaviours because the survey is in open ocean with no apparent obstacles to prevent migration or cause additional stress to passing cetaceans. Thus, any potential disturbance would result in short-term effects to species. Turtles McCauley et al. (Ref. 83) reported that exposure to air gun shots caused Green and Loggerhead Turtles to display more erratic behaviours at 175 dB re 1 μPa rms, with turtles identified to increase their swimming activity at received sound levels of approximately 166 dB re 1 μPa rms. The operational area overlaps a BIA for Flatback Turtles displaying internesting behaviours; but it is at the outer limit of this area (identified as a buffer). Given noise emissions are not expected to exceed 168 dB re 1 μPa SPL outside of 100 m from the survey vessel (Ref. 1) exposure would only be expected to a small number of individuals (based upon exposure to 0.0002% of the BIA assuming 100m exposure footprint [0.031 km2]; and a BIA area of 11,309 km2). Thus, any potential disturbance would result in short-term effects to species. Fish There is a lack of observational data for impacts to fish from seismic sources. Popper et al. (Ref. 41) proposed qualitative indicators of the relative risk of effects, indicating that peak-to-peak SPL (~207 dB re 1 μPa) has the potential to result in a recoverable injury in fish that have high or medium hearing sensitivity. The sound levels that are expected to be produced by the AUV indicate potential for some localised and temporary disturbance. Recoverable injuries are considered a temporary disturbance; therefore, the resulting behavioural impacts are expected to be limited to an initial startle reaction before behaviours return to normal or result in fish moving away from the area (Ref. 42). Thus, any potential impacts are expected to be limited, with short-term effects to species.
Incidental (6)
Localised and temporary behavioural disturbance – Continuous Whales Using the US NMFS guidance for non-pulsed sound, such as vessel noise, a behavioural disturbance limit of 120 dB re 1 µPa rms is adopted. Richardson et al. (Ref. 28) and Southall et al.(Ref. 40) indicate that behavioural avoidance of baleen whales may onset from 140 to 160 dB re 1 μPa or possibly higher. McCauley (Ref. 38; Ref 43) indicates that continuous noise sources from vessel operations are expected to fall below 120 dB re 1 µPa within 4 km of the vessel.
Incidental (6)

Document No.: G7-NT-PLNX0000089 Jansz-Io Compression: Revision Date: 15 March 2018 JIC Geophysical and Geotechnical Survey Environment Plan Summary Revision: 1
© Chevron Australia Pty Ltd Public Page 44 Uncontrolled When Printed Printed Date: 19 March 2018
Hearing damage in marine mammals from shipping noise has not been widely reported (Ref. 44); however, sound exposure levels indicate behavioural disturbance is possible. Although larger numbers of cetaceans may be present within 4 km of the survey vessel during migration periods, the sparse open-water environment associated with the operational area indicates that any disturbance experienced is not expected to affect migration behaviours or result in further impacts. As the extent of potential impact (is out to 4 km from the survey vessel) there is the is the potential to exposure 0.015% and 0.002% of the blue whale and humpback whale migration BIA’s respectively (assuming 4 km exposure footprint [50 km2]; and a blue whale migration BIA area of 327,660 km2 and humpback whale migration BIA area of 1,935,306 km2). Thus, any potential disturbance would only result in short-term effects to species. Turtles McCauley et al. (Ref. 83) reported that exposure to air gun shots caused Green and Loggerhead Turtles to display more erratic behaviours at 175 dB re 1 μPa rms, with turtles identified to increase their swimming activity at received sound levels of approximately 166 dB re 1 μPa rms. Although pulsed sounds are expected to result in different impacts, in lieu of appropriate information for continuous sound emissions, CAPL has used 166 dB re 1 μPa rms as a conservative threshold to inform the evaluation for this hazard. Because noise levels generated from vessel operations have the potential to be ~182 dB re 1 μPa, it can be expected that continuous noise emissions have the potential to result in behavioural impacts. The operational area is on the outer limits of the Flatback turtle internesting BIA (60 km buffer of critical breeding habitat assciated with the motebello Islands and Barrow Islands), and as sound levels from vessel operations are known to be well below impact thresholds 4 km from the vessel (120 dB re 1 μPa recorded at 3–4 km; Ref. 38) approximately <0.4% of the BIA would be expected to be exposed (assuming 4 km exposure footprint [50.27 km2]; and a BIA area of 11,309 km2) to noise emissions above levels that would result in behavioural impacts. Thus, any potential disturbance would result in short-term effects to species. Fish Given a lack of observational data for impacts to fish from continuous sources, Popper et al. (Ref. 41) propose qualitative indicators of relative risk of effects indicating that peak-to-peak SPL (~207 dB re 1 μPa) has the potential to result in a recoverable injury in fish that have high or medium hearing sensitivity. Because recoverable injuries are considered a temporary disturbance, the resulting behavioural impacts are expected to be limited to an initial startle reaction before behaviours return to normal or result in fish moving away from the area (Ref. 42). Vessel thrusters were identified as having the highest continuous sound source for support operations (peak output measured at ~182 dB re 1 µPa); therefore, significant disturbance is not expected. Benthic surveys in the region indicate the seabed is expected to be dominated by soft sediment communities and thus is not expected to provide habitat suitable for supporting demersal fish communities. Thus, any disturbance is expected to be limited to pelagic species and would be temporary.
Decision Context
Summary of Control Measures Risk Level Summary
A • EPBC Regulations 2000 - Part 8 Division 8.1 interacting with cetaceans - Australian National Guidelines for Whale and Dolphin Watching (Ref. 84). Vessel Master Fauna interaction management actions
• International Association of Geophysical Contractors (IAGC): Mitigation Measures for Cetaceans during Geophysical Operations (Ref. 85), and EPBC Act Policy Statement 2.1 - Interaction between offshore seismic exploration and whales (Ref. 86) Vessel crew
Consequence Incidental (6)
Likelihood Remote (5)
Risk Level Low (10)

Document No.: G7-NT-PLNX0000089 Jansz-Io Compression: Revision Date: 15 March 2018 JIC Geophysical and Geotechnical Survey Environment Plan Summary Revision: 1
© Chevron Australia Pty Ltd Public Page 45 Uncontrolled When Printed Printed Date: 19 March 2018
Physical Presence – Seabed
Cause of Aspect
This activity was identified as having the potential to result in disturbance of the seabed: • Geotechnical survey (in situ testing and sampling)
Hazard
Seabed disturbance has the potential to impact on receptors, including benthic habitats and assemblages and demersal fish, through: • alteration of benthic habitat.
Potential Consequence Summary Ranking
Alteration of benthic habitat As described in Section 2.2.2, the indicative footprint associated with each deployment of benthic sampling equipment and borehole equipment expected to be ~2 m2 and 14 m2, respectively. There is the potential for a portion of this disturbance to be situated within a KEF: • Continental slope demersal fish communities • Ancient coastline at 125 m depth contour. Although these KEFs were identified as occurring within the operational area, benthic habitats with the potential to be impacted are expected to comprise soft sediment infauna communities, which are widespread and homogeneous in the region (as described in Section 3.1.1.1). However, because the specific geotechnical sampling locations have not been surveyed previously, there is the possibility that hard substrate may be encountered. If soft sediment communities are impacted, any damage would be limited to incidental temporary disturbance given the small extent of impact, limited use in the area, and similarity of surrounding habitat. When the potential disturbance footprint of each geotechnical sample (~14 m2) is considered against the size of the spatially defined sensitivities (Continental slope demersal fish communities ~33,182 km2; and Ancient coastline at 125 m depth contour ~ 16,189 km2), the potential disturbance is considered to be highly localised. If hard substrate is encountered, any impacts to benthic communities will still be localised due to the limited footprint; however, it is expected that recovery would take longer. Because there is the potential for localised long-term impact, the potential consequence is determined to be Minor (5).
Minor (5)
Decision Context
Summary of Control Measures Risk Level Summary
A • Geophysical data will identify areas of hard substrate and finalise borehole / sampling locations. Evaluate geophysical data before finalising
geotechnical locations
Consequence Minor (5)
Likelihood Unlikely (4)
Risk Level Low (8)
Atmospheric Emissions
Cause of Aspect
This activity was identified as having the potential to result in air emissions: • Survey vessel and support operations
Hazard
Generation of atmospheric emissions has the potential to result in:

Document No.: G7-NT-PLNX0000089 Jansz-Io Compression: Revision Date: 15 March 2018 JIC Geophysical and Geotechnical Survey Environment Plan Summary Revision: 1
© Chevron Australia Pty Ltd Public Page 46 Uncontrolled When Printed Printed Date: 19 March 2018
• chronic effects to sensitive receptors from localised and temporary decrease in air quality from diesel combustion
Potential Consequence Summary Ranking
Atmospheric emissions will be generated from the combustion of marine diesel oil in an offshore area for a period of ~65 days over two separate campaigns. As the operational area, at its closest, is 100 km from coastline habitats, only a small number of Threatened or Migratory listed seabird species would be expected to be present in this area, and no settlements or other offshore operations are expected to be exposed to any temporary incidental change in air quality. Based on the distance to sensitive habitats, limited sensitivities, and expected outcome that limited exposure will not result in any impacts, no further evaluation of this aspect was undertaken.
N/A
Planned Discharge
5.6.1 Planned Discharge – Drilling Fluids and Cuttings
Cause of Aspect
This activity has the potential to result in planned discharges of drilling cuttings and adhered drilling fluids: • Geotechnical survey (borehole sampling)
Hazard
A discharge of drilling cuttings and fluids has the potential to result in effects to marine fauna and habitat through: • increased turbidity at the seabed • smothering seabed habitat and altering seabed substrate • potential chemical toxicity in the sediment.
Potential Consequence Summary Ranking
Increased turbidity at the seabed The values and sensitivities with the potential to be exposed to increased turbidity at the seabed include: • Continental slope demersal fish communities (KEF). The environmental receptors with the potential to be exposed, and considered to be most sensitive to an increase in turbidity levels from this release, include epibenthic fauna or demersal fish associated with the continental slope demersal fish communities around the borehole sampling locations. During drilling, a localised area would be exposed to increased suspended sediments. However, CAPL has conducted a wide range of programs to monitor turbidity from various dredging activities considered to have significantly higher potential for impact than these activities, and concluded that even during these significant activities, plumes are highly localised and result in only short-term exposures (Ref. 45; Ref. 46; Ref. 47) with post-installation monitoring indicates no changes above natural variation (Ref. 47). Consequently, it is not expected that this activity would result in exposures that would result in an impact to identified receptors, and therefore, this aspect is not considered further.
N/A
Smothering and altering the seabed The values and sensitivities with the potential to be exposed to smothering and alteration of the seabed include: • Continental slope demersal fish communities (KEF) • Ancient coastline at 125 m depth contour (KEF).
Minor (5)

Document No.: G7-NT-PLNX0000089 Jansz-Io Compression: Revision Date: 15 March 2018 JIC Geophysical and Geotechnical Survey Environment Plan Summary Revision: 1
© Chevron Australia Pty Ltd Public Page 47 Uncontrolled When Printed Printed Date: 19 March 2018
Although these KEFs were identified as occurring within the operational area, benthic habitats with the potential to be impacted are expected to comprise soft sediment infauna communities, which are widespread and homogeneous in the region (as described in Section 3.1.1.1). However, because the specific geotechnical sampling locations have not been surveyed previously, there is the possibility that hard substrate may be encountered. Hinwood et al. (Ref. 48) explain that the main environmental disturbance from discharging drilling cuttings and fluids during offshore drilling is associated with smothering and burial of sessile benthic and epibenthic fauna. Any cuttings that are produced from this sampling technique will be minimal in volume. This is as a hollow drill bit is used to take a core sample (i.e. the entire bore is not displaced to the surrounding environment), and the diameter of the drill bit is ~85 mm, which is a relatively small physical footprint when compared to the size of the spatially defined sensitivities (Continental slope demersal fish communities ~33182 km2; and Ancient coastline at 125 m depth contour ~ 16189 km2). Thus, any potential smothering impacts are limited to an area highly localised to the borehole location. If hard substrate is encountered, any impacts to benthic communities will be localised but may take a longer time (when compared to soft sediment communities) to recover. Because there is the potential for localised long-term impact, the potential consequence was determined to be Minor (5).
Potential sediment chemical toxicity The values and sensitivities with the potential to be exposed to chemical toxicity from cuttings with adhered drilling fluids include: • Continental slope demersal fish communities (KEF) • Ancient coastline at 125 m depth contour (KEF). Although these KEFs were identified as having the potential to be exposed (as described in Section 3.1.1.1), benthic habitat is expected to comprise soft sediment infauna communities, which are widespread and homogeneous in the region, based on the benthic surveys undertaken within similar physical environments near the operational area. However, because the geotechnical sampling locations have not been surveyed previously, there is the possibility that hard substrate may be encountered. It is expected that drilling fluids with low toxicity would be used. The extent of any toxicity would be limited to an area highly localised around the bore hole locations, thus any exposure to benthic communities would be highly localised when compared to the size of the spatially defined sensitivities (Continental slope demersal fish communities ~33182 km2; and Ancient coastline at 125 m depth contour ~ 16189 km2)... Benthic infauna within soft sediment communities are not considered to be restricted to the operational area and are well represented in the wider region. However, if hard substrate is encountered, any impacts to benthic communities will be localised and recovery would be expected to take a longer. Because there is the potential for localised long-term impact, the potential consequence was determined to be Minor (5).
Minor (5)
Decision Context
Summary of Control Measures Risk Level Summary
A • CAPL's Australian Business Unit (ABU) Hazardous Materials Environmental Assessment Tool (Ref. 147) chemical selection process
Consequence Minor (5)
Likelihood Remote (5)
Risk Level Low (9)
5.6.2 Planned Discharge – Cooling and Brine water
Cause of Aspect
This activity has the potential to result in planned discharges of cooling and brine waters: • Survey vessel and support operations
Hazard

Document No.: G7-NT-PLNX0000089 Jansz-Io Compression: Revision Date: 15 March 2018 JIC Geophysical and Geotechnical Survey Environment Plan Summary Revision: 1
© Chevron Australia Pty Ltd Public Page 48 Uncontrolled When Printed Printed Date: 19 March 2018
Planned discharge of cooling and brine waters has the potential to result in effects to fauna through: • increased water temperature • increased water salinity • potential chemical toxicity in the water column.
Potential Consequence Summary Ranking
Increased temperature Modelling of continuous wastewater discharges (including cooling water) undertaken by Woodside for its Torosa South-1 drilling program in the Scott Reef complex found that discharge water temperature decreases quickly as it mixes with the receiving waters, with the discharge water temperature being less than 1° C above ambient within 100 m (horizontally) of the discharge point, and 10 m vertically (Ref. 33). Because the volumes of cooling water used for a MODU are expected to be larger than those used by a survey vessel, and given the water depths associated with Torosa South-1 are comparable to this program (and subsequent dilution and dispersion efficacy is expected to be similar) the modelling is considered to provide a suitable indication of the extent of exposure from this activity. The potential values and sensitivities with the potential to be exposed to this discharge include: • Blue Whale (migration) • Humpback Whale (migration) • Whale Shark (foraging) • Flatback Turtle (internesting). Marine mammals, fish, reptiles, and sharks passing through the area will be able to actively avoid entrainment in any heated plume (Ref. 49). Because marine mammals are not poikilothermic, they are less sensitive to slight changes in water temperature. Although temperature is important for regulating the metabolic process in both marine reptiles and sharks, the whale shark has considerable body mass which indicates it has sufficient thermal mas to tolerate the limited temperature increases should in the unlikely event it was exposed to cooling water discharges. High temperatures discharges can negatively impact the feeding behaviour of marine turtles (Ref. 105); however, no important foraging areas have been identified within the operational area and thus potential impacts are not expected. Increases in water temperature have been shown to induce marine turtle movement (Ref. 105) indicating that other than causing avoidance of the area, potential impacts are not expected to occur. Given the open nature of the receiving environment, the duration of the petroleum activity (geophysical scope ~35 days and geotechnical scope ~30 days), and the limited exposure to sensitive features, it was determined that a discharge of cooling water within the operational area was not expected to result in an impact to identified values and sensitivities.
N/A
Increased salinity Brine water will sink through the water column where it will be rapidly mixed with receiving waters, and dispersed by ocean currents. Therefore, any potential impacts are expected to be limited to the area surrounding the source of the discharge where concentrations are highest. This is confirmed by studies that indicate effects from increased salinity on planktonic communities in areas of high mixing and dispersion are generally limited to the point of discharge only (Ref. 50). The potential environmental receptors with the potential to be exposed to an increase in salinity include are transient marine fauna including whales, sharks, fish, and reptiles found in surface waters around the survey and support vessels. Changes in salinity can affect the ecophysiology of marine organisms. However, most marine species are able to tolerate short-term fluctuations in salinity of ~20% to 30% (Ref. 51). Pelagic species are mobile; at worst, it is expected that they would be subjected to slightly elevated salinity levels (~10–15% higher than seawater) for a very short time, which they are expected to be able to tolerate. A literature review on the effects of desalination plant brine concluded:
N/A

Document No.: G7-NT-PLNX0000089 Jansz-Io Compression: Revision Date: 15 March 2018 JIC Geophysical and Geotechnical Survey Environment Plan Summary Revision: 1
© Chevron Australia Pty Ltd Public Page 49 Uncontrolled When Printed Printed Date: 19 March 2018
• there is currently no information to suggest brine discharge has a negative effect on cetacean health (Ref. 106)
• that no studies have been undertaken into the impact of increased salinity on marine turtles (Ref. 107).
However, because shallower waters comprise less saline waters (Ref. 6), and as turtles are known to move between surface and seabed waters with no impacts, it is reasonable to consider that exposure to a temporary change in salinity from brine discharge is not expected to result in an impact. Given the open nature of the receiving environment, the intermittent nature of the described petroleum activity, and the lack of sensitive features that would result in sedentary behaviour, this aspect is not evaluated further.
Potential chemical toxicity Scale inhibitors and biocide used in the heat exchange and desalination process to avoid fouling of pipework are inherently safe at the low dosages used, because they are usually consumed in the inhibition process with little or no residual chemical concentration remaining upon discharge. The environmental receptors with the potential to be exposed to an increase in turbidity are transient marine fauna including whales, sharks, fish, and reptiles found in surface waters around the survey and support vessels. Larger pelagic species are mobile; at worst, it is expected they would be subjected to very low levels of chemicals for a very short time as they swim near the discharge plume. As transient species, they are not expected to experience any chronic or acute effects. Given the open nature of the receiving environment, the intermittent nature of the described petroleum activity, and the lack of sensitive features that would result in sedentary behaviour, this aspect is not evaluated further.
N/A
5.6.3 Planned Discharge – Ballast Water (and Biofouling)
Cause of Aspect
This activity has the potential to result in a planned discharge of ballast waters: • Survey vessel and support operations • Note: This activity also has the potential to result in biofouling and result in the same hazard. Therefore,
both biofouling and ballast water discharge are evaluated below.
Hazard
Planned discharge of ballast water or biofouling has the potential to result in the introduction of an invasive marine pest (IMP), which has the potential to destroy the ecology of marine habitats by outcompeting native species.
Potential Consequence Summary Ranking
Destruction of marine habitat ecology IMPs are likely to have little or no natural competition or predation, thus potentially outcompeting native species for food or space, preying on native species, or changing the nature of the environment. It is estimated that Australia has more than 250 established marine pests, and it is estimated that approximately one in six introduced marine species becomes pests (Ref. 52). The marine habitat values and sensitivities with the potential to be impacted by the introduction of an IMP include: • Continental slope demersal fish communities (KEF) • Ancient coastline at 125 m depth contour (KEF). Although these KEFs were identified as occurring within the operational area, benthic habitats with the potential to be impacted are expected to comprise soft sediment infauna communities, which are widespread and homogeneous in the region (as described in
Major (3)
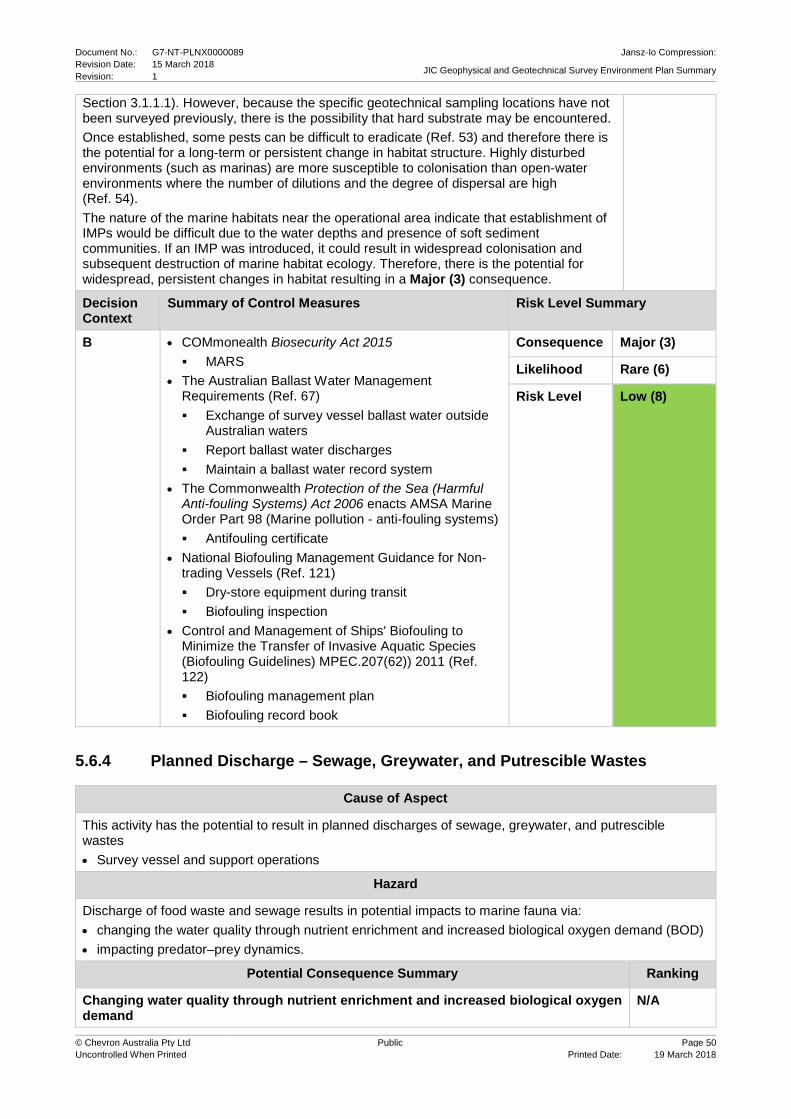
Document No.: G7-NT-PLNX0000089 Jansz-Io Compression: Revision Date: 15 March 2018 JIC Geophysical and Geotechnical Survey Environment Plan Summary Revision: 1
© Chevron Australia Pty Ltd Public Page 50 Uncontrolled When Printed Printed Date: 19 March 2018
Section 3.1.1.1). However, because the specific geotechnical sampling locations have not been surveyed previously, there is the possibility that hard substrate may be encountered. Once established, some pests can be difficult to eradicate (Ref. 53) and therefore there is the potential for a long-term or persistent change in habitat structure. Highly disturbed environments (such as marinas) are more susceptible to colonisation than open-water environments where the number of dilutions and the degree of dispersal are high (Ref. 54). The nature of the marine habitats near the operational area indicate that establishment of IMPs would be difficult due to the water depths and presence of soft sediment communities. If an IMP was introduced, it could result in widespread colonisation and subsequent destruction of marine habitat ecology. Therefore, there is the potential for widespread, persistent changes in habitat resulting in a Major (3) consequence.
Decision Context
Summary of Control Measures Risk Level Summary
B • COMmonealth Biosecurity Act 2015 MARS
• The Australian Ballast Water Management Requirements (Ref. 67) Exchange of survey vessel ballast water outside
Australian waters Report ballast water discharges Maintain a ballast water record system
• The Commonwealth Protection of the Sea (Harmful Anti-fouling Systems) Act 2006 enacts AMSA Marine Order Part 98 (Marine pollution - anti-fouling systems) Antifouling certificate
• National Biofouling Management Guidance for Non-trading Vessels (Ref. 121) Dry-store equipment during transit Biofouling inspection
• Control and Management of Ships' Biofouling to Minimize the Transfer of Invasive Aquatic Species (Biofouling Guidelines) MPEC.207(62)) 2011 (Ref. 122) Biofouling management plan Biofouling record book
Consequence Major (3)
Likelihood Rare (6)
Risk Level Low (8)
5.6.4 Planned Discharge – Sewage, Greywater, and Putrescible Wastes
Cause of Aspect
This activity has the potential to result in planned discharges of sewage, greywater, and putrescible wastes • Survey vessel and support operations
Hazard
Discharge of food waste and sewage results in potential impacts to marine fauna via: • changing the water quality through nutrient enrichment and increased biological oxygen demand (BOD) • impacting predator–prey dynamics.
Potential Consequence Summary Ranking
Changing water quality through nutrient enrichment and increased biological oxygen demand
N/A

Document No.: G7-NT-PLNX0000089 Jansz-Io Compression: Revision Date: 15 March 2018 JIC Geophysical and Geotechnical Survey Environment Plan Summary Revision: 1
© Chevron Australia Pty Ltd Public Page 51 Uncontrolled When Printed Printed Date: 19 March 2018
Monitoring of sewage discharges for another offshore project (Ref. 33) determined that a 10 m3 sewage discharge reduced to approximately 1% of its original concentration within 50 m of the discharge location. Further, monitoring at distances 50, 100, and 200 m downstream of the platform and at five different water depths confirmed that discharges were rapidly diluted and no elevations in water quality monitoring parameters (e.g. total nitrogen, total phosphorous, and selected metals) were recorded above background levels at any station. Because the volumes of sewage from a MODU are expected to be larger than those used by a survey vessel (due to the number of people on-board), and given the water depths associated with Torosa South-1 are comparable to this program (and subsequent dilution and dispersion efficacy is expected to be similar) the modelling is considered to provide a suitable indication of the extent of exposure from this activity. The values and sensitivities with the potential to be exposed to changes in surface water quality includes: • Blue Whale (migration) • Whale Shark (foraging) • Humpback Whale (migration) • Flatback Turtle (Internesting). Studies into the effects of nutrient enrichment from offshore sewage discharges indicate that the influence of nutrients in open marine areas is much less significant than that experienced in enclosed areas (Ref. 56) and suggest that zooplankton composition and distribution in areas associated with sewage dumping grounds are not affected. Regardless of receptor sensitivity to BOD, the BOD of treated effluent is not expected to lead to oxygen depletion of the receiving waters (Ref. 57). Due the rapid mixing and dispersion rates identified during modelling of sewage releases (Ref. 33), no values or sensitivities are expected to be impacted by this activity and consequently this aspect is not evaluated further.
Impacting predator–prey dynamics The overboard discharge of sewage and macerated food wastes creates a localised and temporary food source for scavenging marine fauna or seabirds, whose numbers may temporarily increase as a result. This in turn can increase the food source for predatory species. However, the rapid consumption of this food waste by scavenging fauna, and physical and microbial breakdown, ensures that the impacts of putrescible waste discharges are insignificant and temporary and all receptors that may potentially be in the water column are not impacted. The values and sensitivities with the potential to be affected by changes in predator–prey dynamics includes: • Whale Shark (foraging) • Wedge-tailed Shearwater (breeding / foraging) • continental slope demersal fish communities (KEF). Given the distance from shore, these incidental discharges are not expected to influence foraging behaviours of seabirds (specifically the Wedge-tailed Shearwater) and thus are not considered further. As described above, plankton communities are not affected by sewage discharges, and consequently impacts to Whale Shark foraging behaviours are not expected; these are not considered further. Although fish are likely to be attracted to these discharges, any attraction and consequent change to predator–prey dynamics is expected to be limited to close to the release and thus expected to result in localised impacts to species. Because it is not expected that any increased predation would result in more than a short-term localised impact on species, the consequence is considered Incidental (6)
Incidental (6)
Decision Context
Summary of Control Measures Risk Level Summary
A • AMSA Marine Order Part 96 (Sewage) Consequence Incidental (6)

Document No.: G7-NT-PLNX0000089 Jansz-Io Compression: Revision Date: 15 March 2018 JIC Geophysical and Geotechnical Survey Environment Plan Summary Revision: 1
© Chevron Australia Pty Ltd Public Page 52 Uncontrolled When Printed Printed Date: 19 March 2018
MARPOL sewage discharge conditions • AMSA Marine Order Part 95 (Marine pollution
prevention - garbage) Food waste macerated
• Industry good practice Planned maintenance system
Likelihood Remote (5)
Risk Level Low (10)
Accidental Release
5.7.1 Waste
Cause of Aspect
This activity has the potential to result in an unplanned release of waste to the environment: • Survey vessel and support operations Because waste is generated on board the survey and support vessels, inappropriate storage has the potential to result in release to the environment.
Hazard
The potential environmental impacts associated with the accidental release of waste are: • marine pollution resulting in injury and entanglement of marine fauna and seabirds.
Potential Consequence Summary Ranking
Injury and entanglement of marine fauna and seabirds If hazardous / non-hazardous waste is lost overboard, the extent of exposure is isolated to that waste. Fauna most at risk from marine pollution include marine reptiles and seabirds, through ingestion or entanglement. The ingestion or entanglement of marine fauna has the potential to limit feeding / foraging behaviours and may result in marine fauna deaths. Within the operational area, the particular values and sensitivities with the potential to be exposed to marine pollution include: • Wedge-tailed Shearwater (breeding / foraging) • Flatback Turtles (internesting). Given the restricted exposures and limited quantity of marine pollution expected from these survey programs, it is expected that any impacts from marine pollution would not have a detrimental effect on the overall population of turtle or seabird species, and only result in a localised impact to species, and thus a consequence level of Incidental (6).
Incidental (6)
Decision Context
Summary of Control Measures Risk Level Summary
A • AMSA Marine Order Part 95 (Marine pollution prevention - garbage) and Marine Order Part 94, (Packaged harmful substance) gives effect to MARPOL Annex V. Garbage / waste management plan Garbage record book
• American Petroleum Institute (API) Recommended Practice 14G (Ref. 123) Waste management training / induction
Consequence Incidental (6)
Likelihood Unlikely (4)
Risk Level Low (9)

Document No.: G7-NT-PLNX0000089 Jansz-Io Compression: Revision Date: 15 March 2018 JIC Geophysical and Geotechnical Survey Environment Plan Summary Revision: 1
© Chevron Australia Pty Ltd Public Page 53 Uncontrolled When Printed Printed Date: 19 March 2018
5.7.2 Single-point Failure
Cause of Aspect
Hydrocarbon spills from single-point failure typically occur during: • Survey vessel and support operations: failure or mechanical breakdown of equipment used to store or transfer hydrocarbons incorrect storage and/or absence of bunding around hydrocarbons human error.
Single-point failures (overboard) resulting in hydrocarbons reaching the environment may occur from minor hydrocarbon spills. Activities with the potential for single-point failures include: • inadequate hazardous waste management (loss of containment) • general servicing and routine operations. Various hazardous materials are likely to be on board the vessel during the surveys; however, the maximum credible volume associated with a single-point failure is estimated to be ~1 m3.
Hazard
A single-point failure has the potential to expose marine fauna to a reduction in water quality, resulting in acute or chronic toxicity.
Potential Consequence Summary Ranking
Reduction in water quality resulting in acute or chronic toxicity to marine fauna A loss of containment resulting in the release of <1 m3 (diesel or chemicals) to the marine environment was identified as the largest representative discharge for this grouping of spill and leak scenarios. Given the low potential volumes, a loss of containment would result in small surface exposures and minor entrainment in the water column. The values and sensitivities with the potential to be exposed to a reduction in water quality include: • Blue Whale (migration) • Whale Shark (foraging) • Flatback Turtle (internesting) • continental slope demersal fish communities (KEF) • ancient coastline at 125 m depth contour (KEF). The most sensitive receptors to this type of event are expected to be surface-dwelling species, including whales, turtles, and Whale Sharks. However, given the small volumes and transient nature of identified values and sensitivities, only individual fauna passing directly though the released substance would be expected to be temporarily affected, so any potential impact is localised. Therefore, the potential consequence is considered to result in localised and short-term impacts – Incidental (6).
Incidental (6)
Decision Context
Summary of Control Measures Risk Level Summary
A • MARPOL Annex I and AMSA's Marine Order Part 91 (Marine pollution prevention - oil) Shipboard Oil Pollution Emergency Plan SOPEP
• API Recommended Practice 14G (Ref. 123) Accidental release / waste management training /
induction
Consequence Incidental (6)
Likelihood Remote (5)
Risk Level Low (10)
5.7.3 Loss of Containment during Transfer
Cause of Aspect

Document No.: G7-NT-PLNX0000089 Jansz-Io Compression: Revision Date: 15 March 2018 JIC Geophysical and Geotechnical Survey Environment Plan Summary Revision: 1
© Chevron Australia Pty Ltd Public Page 54 Uncontrolled When Printed Printed Date: 19 March 2018
This activity has the potential to result in a loss of containment event: • Survey vessel and support operations (bunkering operations). Causes of spills overboard during transfer activities include: • hose or connection failure (due to equipment condition or failure of the vessel to keep station) • failure to align valves correctly during transfer to tanks. AMSA (Ref. 58) suggests the maximum credible spill volume from a refuelling incident with continuous supervision is approximately the transfer rate × 15 minutes. Assuming failure of dry-break couplings and an assumed transfer rate of 200 m3/h (based on previous operations), this equates to an instantaneous spill of ~50 m3.
Hazard
An accidental release of fuel has the potential to effect marine fauna through: • potential toxicity in the water column.
Potential Consequence Summary Ranking
Reduction in water quality resulting in acute or chronic toxicity to marine fauna A loss of 50 m3 of diesel upon release would be expected to result in changes to water quality in both surface waters and the pelagic environment. The environmental impacts associated with a larger loss of diesel fuel is considered in Section 5.7.5. The environmental impacts associated with an accidental release of 50 m3 of diesel will be less than that associated with a loss of diesel from a vessel collision, and thus is not evaluated further. Based on the evaluation undertaken in Section 5.7.5, the worst-case potential impact from a fuel spill is expected to result in widespread but short-term impacts to species; thus the consequence level was determined as Minor (5).
Minor (5)
Decision Context
Summary of Control Measures Risk Level Summary
A • Guidelines for Offshore Marine Operations (GOMO 0611-1401; Ref. 71) Bulk transfer process Hoses and connections Planned Maintenance System
• MARPOL Annex I and AMSA's Marine Order Part 91 (Marine pollution prevention - oil) SOPEP
Consequence Minor (5)
Likelihood Remote (5)
Risk Level Low (9)
5.7.4 Loss of Equipment
Cause of Aspect
This activity has the potential to result in lost equipment: • Geophysical survey (operation of the AUV)
Hazard
Loss of the AUV has the potential to effect marine fauna through: • leaching of AUV contents (which includes small volumes of hydraulics and from batteries)
Potential Consequence Summary Ranking
Reduction in water quality resulting in acute or chronic toxicity to marine fauna If the AUV is lost, it is expected that any contents would slowly leach over a prolonged time period (not an instantaneous release). Consequently, any exposure is expected to be limited and localised to an area immediately surrounding the AUV.
Incidental (6)
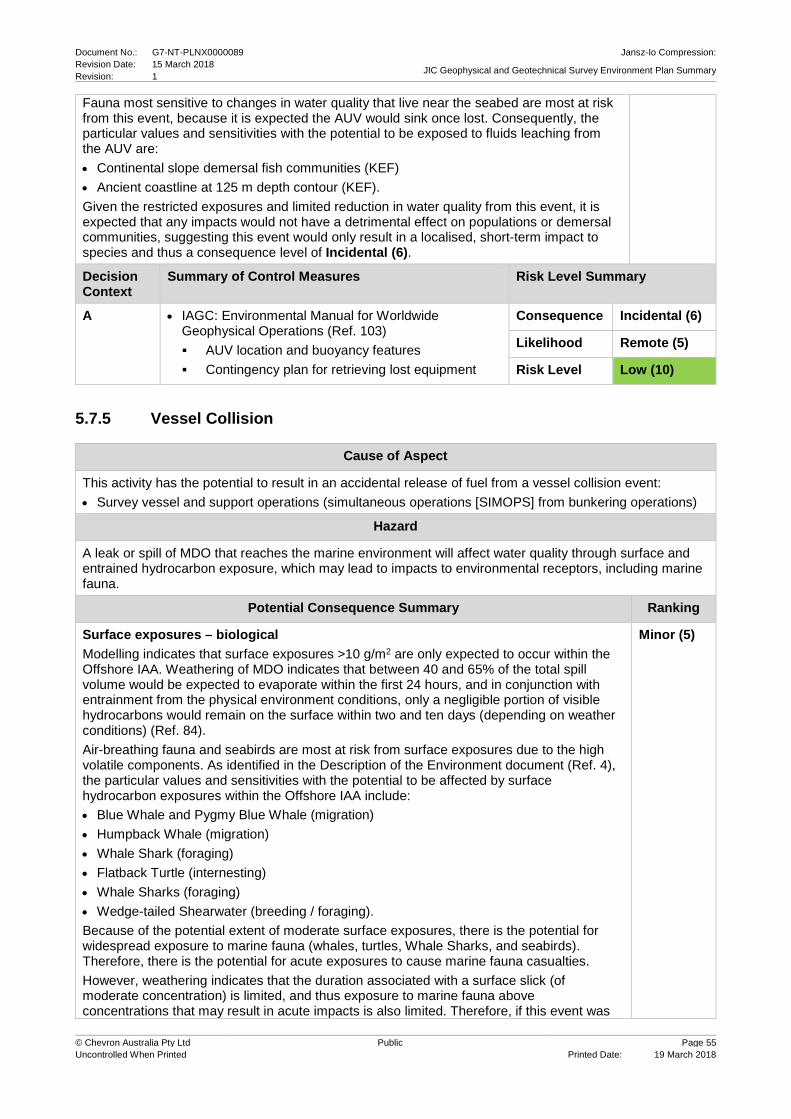
Document No.: G7-NT-PLNX0000089 Jansz-Io Compression: Revision Date: 15 March 2018 JIC Geophysical and Geotechnical Survey Environment Plan Summary Revision: 1
© Chevron Australia Pty Ltd Public Page 55 Uncontrolled When Printed Printed Date: 19 March 2018
Fauna most sensitive to changes in water quality that live near the seabed are most at risk from this event, because it is expected the AUV would sink once lost. Consequently, the particular values and sensitivities with the potential to be exposed to fluids leaching from the AUV are: • Continental slope demersal fish communities (KEF) • Ancient coastline at 125 m depth contour (KEF). Given the restricted exposures and limited reduction in water quality from this event, it is expected that any impacts would not have a detrimental effect on populations or demersal communities, suggesting this event would only result in a localised, short-term impact to species and thus a consequence level of Incidental (6).
Decision Context
Summary of Control Measures Risk Level Summary
A • IAGC: Environmental Manual for Worldwide Geophysical Operations (Ref. 103) AUV location and buoyancy features Contingency plan for retrieving lost equipment
Consequence Incidental (6)
Likelihood Remote (5)
Risk Level Low (10)
5.7.5 Vessel Collision
Cause of Aspect
This activity has the potential to result in an accidental release of fuel from a vessel collision event: • Survey vessel and support operations (simultaneous operations [SIMOPS] from bunkering operations)
Hazard
A leak or spill of MDO that reaches the marine environment will affect water quality through surface and entrained hydrocarbon exposure, which may lead to impacts to environmental receptors, including marine fauna.
Potential Consequence Summary Ranking
Surface exposures – biological Modelling indicates that surface exposures >10 g/m2 are only expected to occur within the Offshore IAA. Weathering of MDO indicates that between 40 and 65% of the total spill volume would be expected to evaporate within the first 24 hours, and in conjunction with entrainment from the physical environment conditions, only a negligible portion of visible hydrocarbons would remain on the surface within two and ten days (depending on weather conditions) (Ref. 84). Air-breathing fauna and seabirds are most at risk from surface exposures due to the high volatile components. As identified in the Description of the Environment document (Ref. 4), the particular values and sensitivities with the potential to be affected by surface hydrocarbon exposures within the Offshore IAA include: • Blue Whale and Pygmy Blue Whale (migration) • Humpback Whale (migration) • Whale Shark (foraging) • Flatback Turtle (internesting) • Whale Sharks (foraging) • Wedge-tailed Shearwater (breeding / foraging). Because of the potential extent of moderate surface exposures, there is the potential for widespread exposure to marine fauna (whales, turtles, Whale Sharks, and seabirds). Therefore, there is the potential for acute exposures to cause marine fauna casualties. However, weathering indicates that the duration associated with a surface slick (of moderate concentration) is limited, and thus exposure to marine fauna above concentrations that may result in acute impacts is also limited. Therefore, if this event was
Minor (5)
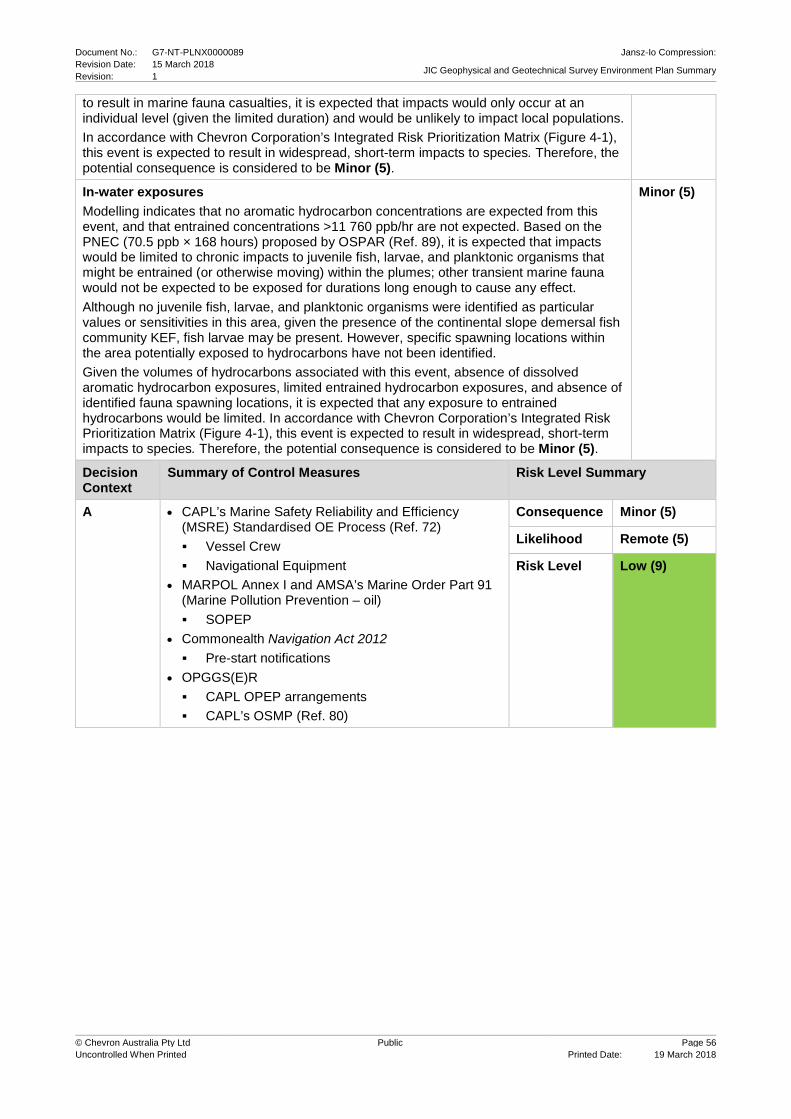
Document No.: G7-NT-PLNX0000089 Jansz-Io Compression: Revision Date: 15 March 2018 JIC Geophysical and Geotechnical Survey Environment Plan Summary Revision: 1
© Chevron Australia Pty Ltd Public Page 56 Uncontrolled When Printed Printed Date: 19 March 2018
to result in marine fauna casualties, it is expected that impacts would only occur at an individual level (given the limited duration) and would be unlikely to impact local populations. In accordance with Chevron Corporation’s Integrated Risk Prioritization Matrix (Figure 4-1), this event is expected to result in widespread, short-term impacts to species. Therefore, the potential consequence is considered to be Minor (5).
In-water exposures Modelling indicates that no aromatic hydrocarbon concentrations are expected from this event, and that entrained concentrations >11 760 ppb/hr are not expected. Based on the PNEC (70.5 ppb × 168 hours) proposed by OSPAR (Ref. 89), it is expected that impacts would be limited to chronic impacts to juvenile fish, larvae, and planktonic organisms that might be entrained (or otherwise moving) within the plumes; other transient marine fauna would not be expected to be exposed for durations long enough to cause any effect. Although no juvenile fish, larvae, and planktonic organisms were identified as particular values or sensitivities in this area, given the presence of the continental slope demersal fish community KEF, fish larvae may be present. However, specific spawning locations within the area potentially exposed to hydrocarbons have not been identified. Given the volumes of hydrocarbons associated with this event, absence of dissolved aromatic hydrocarbon exposures, limited entrained hydrocarbon exposures, and absence of identified fauna spawning locations, it is expected that any exposure to entrained hydrocarbons would be limited. In accordance with Chevron Corporation’s Integrated Risk Prioritization Matrix (Figure 4-1), this event is expected to result in widespread, short-term impacts to species. Therefore, the potential consequence is considered to be Minor (5).
Minor (5)
Decision Context
Summary of Control Measures Risk Level Summary
A • CAPL’s Marine Safety Reliability and Efficiency (MSRE) Standardised OE Process (Ref. 72) Vessel Crew Navigational Equipment
• MARPOL Annex I and AMSA’s Marine Order Part 91 (Marine Pollution Prevention – oil) SOPEP
• Commonealth Navigation Act 2012 Pre-start notifications
• OPGGS(E)R CAPL OPEP arrangements CAPL’s OSMP (Ref. 80)
Consequence Minor (5)
Likelihood Remote (5)
Risk Level Low (9)

Document No.: G7-NT-PLNX0000089 Jansz-Io Compression: Revision Date: 15 March 2018 JIC Geophysical and Geotechnical Survey Environment Plan Summary Revision: 1
© Chevron Australia Pty Ltd Public Page 57 Uncontrolled When Printed Printed Date: 19 March 2018
6. Implementation Strategy To meet the requirements of the OPGGS(E)R, Division 2.3, Regulation 14, Implementation strategy for the environment plan, this Section describes the implementation strategy, which identifies the systems, practices, and procedures used to ensure the environmental impacts and risks of the activities are continuously reduced to ALARP and the environmental performance outcomes and standards detailed in Section 5 of the EP are achieved.
Systems, Practices, and Procedures
CAPL’s operations are managed in accordance with the OEMS, which is a comprehensive management framework that supports the corporate commitment to protect the safety and health of people and the environment. This framework ensures a systematic approach to environmental management, with the environmental aspects of each project addressed from project conception, throughout project planning, and as an integral component of implementation, as shown in Figure 6-1.
Figure 6-1: CAPL OEMS Process Overview
Under the OEMS are 13 elements that enable implementation of CAPL’s activities in a manner that is consistent with its Operational Excellence Policy 530. Of the elements described under the OEMS, those relevant to the EP are detailed in Table 6-1. The following subsections summarise the key processes that help demonstrate how CAPL is effective in reducing environmental impacts and risks to ALARP and an acceptable level.
Under the OEMS, records (including compliance records to demonstrate environmental performance and compliance with the EP) will be retained in accordance with Regulation 27 of the OPGGS(E)R.
Table 6-1: OEMS Elements Relevant to this Activity
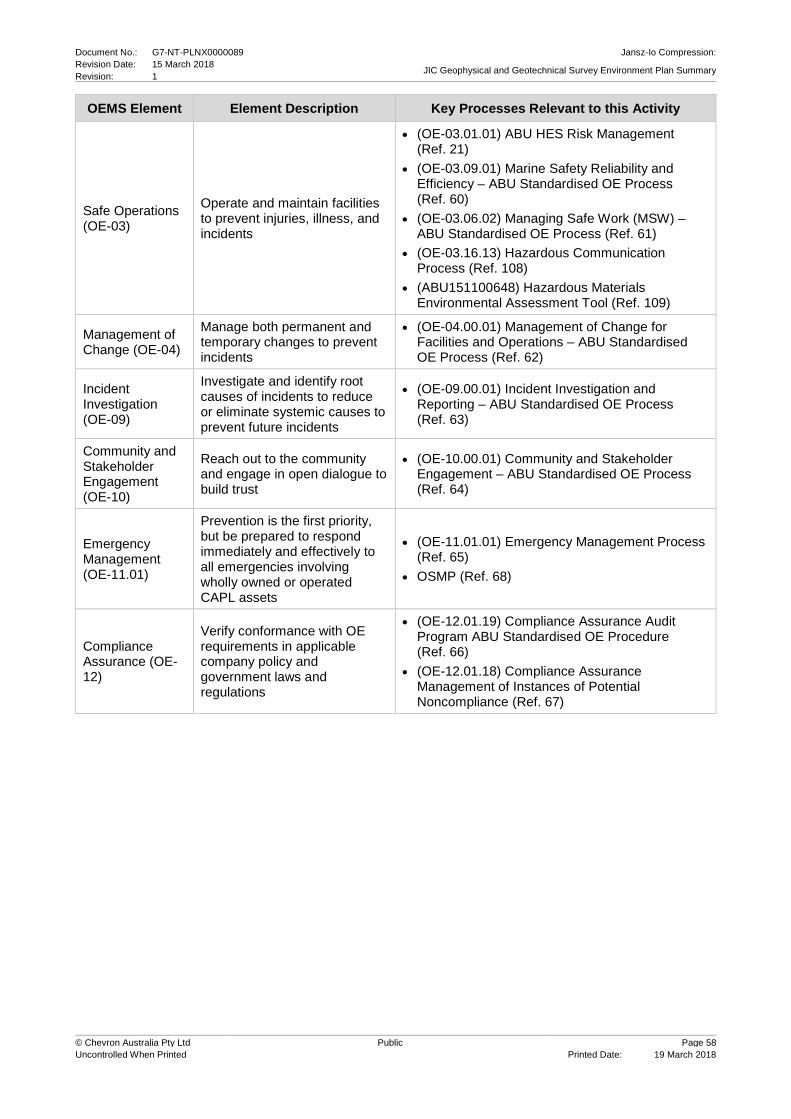
Document No.: G7-NT-PLNX0000089 Jansz-Io Compression: Revision Date: 15 March 2018 JIC Geophysical and Geotechnical Survey Environment Plan Summary Revision: 1
© Chevron Australia Pty Ltd Public Page 58 Uncontrolled When Printed Printed Date: 19 March 2018
OEMS Element Element Description Key Processes Relevant to this Activity
Safe Operations (OE-03)
Operate and maintain facilities to prevent injuries, illness, and incidents
• (OE-03.01.01) ABU HES Risk Management (Ref. 21)
• (OE-03.09.01) Marine Safety Reliability and Efficiency – ABU Standardised OE Process (Ref. 60)
• (OE-03.06.02) Managing Safe Work (MSW) – ABU Standardised OE Process (Ref. 61)
• (OE-03.16.13) Hazardous Communication Process (Ref. 108)
• (ABU151100648) Hazardous Materials Environmental Assessment Tool (Ref. 109)
Management of Change (OE-04)
Manage both permanent and temporary changes to prevent incidents
• (OE-04.00.01) Management of Change for Facilities and Operations – ABU Standardised OE Process (Ref. 62)
Incident Investigation (OE-09)
Investigate and identify root causes of incidents to reduce or eliminate systemic causes to prevent future incidents
• (OE-09.00.01) Incident Investigation and Reporting – ABU Standardised OE Process (Ref. 63)
Community and Stakeholder Engagement (OE-10)
Reach out to the community and engage in open dialogue to build trust
• (OE-10.00.01) Community and Stakeholder Engagement – ABU Standardised OE Process (Ref. 64)
Emergency Management (OE-11.01)
Prevention is the first priority, but be prepared to respond immediately and effectively to all emergencies involving wholly owned or operated CAPL assets
• (OE-11.01.01) Emergency Management Process (Ref. 65)
• OSMP (Ref. 68)
Compliance Assurance (OE-12)
Verify conformance with OE requirements in applicable company policy and government laws and regulations
• (OE-12.01.19) Compliance Assurance Audit Program ABU Standardised OE Procedure (Ref. 66)
• (OE-12.01.18) Compliance Assurance Management of Instances of Potential Noncompliance (Ref. 67)

Document No.: G7-NT-PLNX0000089 Jansz-Io Compression: Revision Date: 15 March 2018 JIC Geophysical and Geotechnical Survey Environment Plan Summary Revision: 1
© Chevron Australia Pty Ltd Public Page 59 Uncontrolled When Printed Printed Date: 19 March 2018
6.1.1 Management of Change (OE-04)
(OE-04.00.01) Management of Change for Facilities and Operations
The Management of Change for Facilities and Operations Process (Ref. 62) manages changes to facilities, operations, products, and the organisation so as to prevent incidents, support reliable and efficient operations, and keep unacceptable risks from being introduced into CAPL’s business.
In conjunction with the HES Risk Management Process, this process is followed to document and assess the impact of changes to activities described in Section 2. These changes will be addressed to determine if there is potential for any new or increased environmental impact or risk not already provided for in the EP. If these changes do not trigger relevant petroleum regulations, as detailed below, the EP will be revised and changes recorded in the EP without resubmission.
The EP must be resubmitted to NOPSEMA for acceptance/approval before:
• commencing any new activity, or significantly modifying, changing, or adding a new stage of an existing activity, not provided for in the EP
• changing the instrument holder for, or operator of, the activity
• a significant new environmental impact or risk, or significant increase in an existing environmental impact or risk, occurs that is not provided for in the EP
• a series of new environmental impacts or risks, or a series of increases in existing environmental impacts or risks, occur which, taken together, amount to the occurrence of a significant new environmental impact or risk, or a significant increase in an existing environmental impact or risk, not provided for in the EP.
6.1.2 Compliance Assurance (OE-12.01)
(OE-12.01.19) Compliance Assurance Audit Program ABU Standardised OE Procedure
The Compliance Assurance Audit Program ABU Standardised OE Procedure (Ref. 66) addresses the establishment of audit programs to verify the effectiveness of controls and the extent to which requirements are met by CAPL.
Routine audits and inspections of activities in the scope of the EP will be undertaken in accordance with the audit program/schedule, which will be regularly reviewed and updated to ensure effective verification of environmental compliance requirements. The audit program/schedule will include the time frames, location, and scope of the audits.
Typically, routine inspections will be worksite-based (such as HES inspections) and conducted regularly, with the frequency and scope determined by the risk profile of individual sites and activities. Audits will focus on in-field activities (such as site audits) and/or administrative processes (such as desktop audits of relevant information), and a single audit of this activity is planned (given its nature and scale).
Audit protocols and inspection checklists will be followed for all audits and inspections, and actions will be tracked until closure. Audit findings and corrective actions are recorded and tracked as described in Section 6.1.2.2.
Additionally, continual monitoring of HES legislation is conducted, including new or updated legislation, which can include plans of management (or similar) under the EPBC Act. Legislative changes are proactively assessed based on their nature and scale to ensure that potential business impacts are understood and effectively managed, and that HES permits and controls remain fit-for-purpose.
(OE-12.01.18) Compliance Assurance Management of Instances of Potential Non-Compliance
The Compliance Assurance Management of Instances of Potential Non-Compliance Procedure (Ref. 67) applies to instances where the requirements of the EP have not been met. This process is used if audit findings identify that activities in the scope of the EP are not being implemented in accordance with the risk and impact control measures stated in Section 5 of the EP.

Document No.: G7-NT-PLNX0000089 Jansz-Io Compression: Revision Date: 15 March 2018 JIC Geophysical and Geotechnical Survey Environment Plan Summary Revision: 1
© Chevron Australia Pty Ltd Public Page 60 Uncontrolled When Printed Printed Date: 19 March 2018
Audit findings and corrective actions are recorded and tracked in a CAPL compliance assurance database for timely closure of actions. Audit findings that identify a breach of an environmental performance outcome or environmental performance standard will be reported.
Any suggested changes to activities or control measures arising from audit findings or instances of potential non-compliance will be subject to a management of change in accordance with Section 6.1.1.
Emergency Management (OE-11)
(OE-11.01.01) Emergency Management Process
The Emergency Management Process provides organisational structures, management processes, and the tools necessary to respond to emergencies and to prevent or mitigate emergency and/or crisis situations; respond to incidents in a safe, rapid, and effective manner; and restore or resume affected operations of strategic importance.
6.3.1 Vessel Spills
AMSA is the Control Agency in Commonwealth Waters for all shipping (vessel) spills and spills that result from vessels undertaking offshore petroleum activities where the Commonwealth Navigation Act 1912 applies. As the Petroleum Titleholder, CAPL will conduct the first-strike response (e.g. aerial surveillance operations) until such time as AMSA or a nominated National Plan agency arrives to assume incident command. CAPL will continue to implement the monitoring, evaluation, and surveillance as deemed necessary by the Control Agency.
6.3.2 Monitoring, Evaluation and Surveillance
Oil spill monitoring, evaluation, and surveillance (MES) is important for anticipating resources at risk of exposure, directing response resources, and evaluating effectiveness. Accurate, timely, and ongoing information about a spill’s location, extent, and movement is critical to spill response decision-making and provides ground-truthing of spill trajectory modelling.
MES of an oil spill helps determine whether further action is required, and continually assesses the effectiveness of those spill response options.
MES tactics that may be used to evaluate the parameters and potential trajectory of the spill include one or more of the following:
• Fate and Weathering Modelling – uses computer modelling and computational techniques to estimate the weathering of an oil spill
• Trajectory Modelling– uses computer modelling and computational techniques to estimate the speed and direction of movement, weathering spread patterns, and impacts of an oil spill
• Tracking Buoy Deployment – uses a buoy deployed to the water surface to track the movement of an oil slick
• Visual Observation (from aircraft and/or vessels) – trained observers use standard references to characterise oil slicks as observed from aircraft or vessels. Visual observation is the most common surveillance and reconnaissance tactic
• Remote Sensing – uses remote sensing technologies to identify oil slicks.
CAPL has developed an implementation guide in which actions and responsibilities are described to guide response teams (Table 6-2). Depending on the nature and scale of the spill and the specific spill parameters, the IC may determine that some actions be varied, should not be undertaken, or that responsibilities be reassigned. Table 6-3 describes CAPL’s capability to undertake each of these response tactics.

Document No.: G7-NT-PLNX0000089 Jansz-Io Compression: Revision Date: 15 March 2018 JIC Geophysical and Geotechnical Survey Environment Plan Summary Revision: 1
© Chevron Australia Pty Ltd Public Page 61 Uncontrolled When Printed Printed Date: 19 March 2018
Table 6-2: Monitor, Evaluation, and Surveillance Implementation Guide
Who Actions (if relevant) Complete
ORT
Initiate surveillance of spill if advised to do so. □ Record relevant data (e.g. equipment mobilised, times, locations, Job Hazard Analyses used). □ Provide regular reports to the On-scence Commander and/or EMT IC (as required) regarding the appearance and behaviour of surface spill and weather (surface wind speed, direction, sea state, current speed and direction) and tidal conditions. □
EMT
Collate weather and tidal information from ORT and Bureau of Meteorology. □ Review OSMP (Ref. 68) to determine if initiation criteria for rapid assessments are triggered; direct personnel to undertake required assessments.
□ Where required, arrange for a tracking buoy to be delivered to aircraft or vessel for deployment when needed. Arrange for vessel and crew to deploy the tracking buoy.
□ Where required, mobilise vessel and/or aircraft and observers to the scene to carry out/assist with spill monitoring and surveillance activities. □ Determine the spill volume and estimate the size of the spill to water using approximate surface calculations: • Vessel Master spill volume estimates, and/or • aerial and marine surveillance data, where available (marine spills).
□
If necessary, conduct a Hydrocarbon Distribution, Fate, and Weathering Assessment to guide the response option selection process. This may include: • spill fates, weathering, and trajectory (for marine spills) modelling – conduct through subcontractor under existing contract (RPS –
Asia-Pacific Applied Science Associates [RPS-APASA]), under the existing contract (AMOSC/OSRL), or conduct through National Plan arrangements
• Automated Data Inquiry for Oil Spills (ADIOS) • satellite/optical imagery (conduct through OSRL or AMSA). Note: If using AMSA, complete, then email or fax the AMSA Oil Spill Trajectory Modelling (OSTM) request form, available from: http://www.amsa.gov.au/marine_environment_protection/national_plan/general_information/oil_spill_trajectory_model/Request.asp (confirm AMSA has received the OSTM request).
□

Document No.: G7-NT-PLNX0000089 Jansz-Io Compression: Revision Date: 15 March 2018 JIC Geophysical and Geotechnical Survey Environment Plan Summary Revision: 1
© Chevron Australia Pty Ltd Public Page 62 Uncontrolled When Printed Printed Date: 19 March 2018
Who Actions (if relevant) Complete
Activate Geographic Information Systems technicians to assist with developing maps, including resources-at-risk sensitivity maps. □ Review fate weathering and trajectory modelling and validate with field reports to predict spill trajectory. □ Use available MES and OSMP data to identify sensitive environmental and social receptors and protection prioritisation, and to conduct Operational Net Environmental Benefit Analysis to confirm the pre-identified response options and tactics are appropriate. □ Use the MES information collected to periodically reassess spill level, effectiveness of response, and Net Environmental Benefit Analysis, and modify the response strategy as required. □ Arrange for additional support, if required, through the following: • DoT (State Waters Hazard Management Agency [HMA] for Marine Transport Emergencies and Marine Oil Pollution); MEER Unit • AMOSC • OSRL • AMSA.
□
Table 6-3: Response Strategy Capability – Monitoring, Evaluation, and Surveillance
Response Activity CAPL Third-party Service Provider
Termination Criteria Capability Implementation Time Capability Implementation Time
Fate, Weathering, and Trajectory Modelling
Processes
• Automated Date Inquiry for Oil Spills
• Geohouse portal provides immediate spill trajectory modelling
• Contract activation guidance developed
• Modelling template developed
Initiate within 3 hours of EMT activation
• Contracted capability to provide trajectory modelling
5 hours (assumes 2 hours to conduct modelling once provider is activated)
Agreement has been reached with the jurisdictional authority relevant to the spill to terminate the response
Equipment

Document No.: G7-NT-PLNX0000089 Jansz-Io Compression: Revision Date: 15 March 2018 JIC Geophysical and Geotechnical Survey Environment Plan Summary Revision: 1
© Chevron Australia Pty Ltd Public Page 63 Uncontrolled When Printed Printed Date: 19 March 2018
Response Activity CAPL Third-party Service Provider
Termination Criteria Capability Implementation Time Capability Implementation Time
• Programs installed on EMT computers
• Maps and charts located within ECC
Initiate within 3 hours of EMT activation
• Contracted capability to provide trajectory modelling
N/A N/A
Personnel EMT members trained in use of: • Automated Date Inquiry for Oil
Spills • desktop vectoring • Geohouse
Initiate within 3 hours of EMT activation
• Contracted capability to provide trajectory modelling with RPS-APASA and AMOSC
5 hours (assumes 2 hours to conduct modelling once provider is activated)
N/A
Field Observation
Processes
• Contract activation guidance developed
• Aircraft mobilisation guidance developed
• Vessel mobilisation guidance developed
• Third-party contract for aircraft in place
• Third-party contracts for vessels in place
Initiate within 5 hours of EMT activation
• Contracted capability for aircraft with Bristow
• Contracted capability for vessels with marine providers such as Mermaid Marine, Bhagwan Marine, Go Marine, Maersk Supply Service, DOF Subsea, DOF Management, Toll Energy and Marine, and Jetwave Marine (at time of writing)
• OSRL field observation guide
Within 8 hours (based on helicopters on Barrow Island or Karratha) Within 24 hours (based on vessels from Dampier or offshore)
• Agreement has been reached with the jurisdictional authority relevant to the spill to terminate the response
• No visible signs of hydrocarbon in the water during daylight operations
• Aerial/vessel surveillance is no longer needed to support other operations
Equipment

Document No.: G7-NT-PLNX0000089 Jansz-Io Compression: Revision Date: 15 March 2018 JIC Geophysical and Geotechnical Survey Environment Plan Summary Revision: 1
© Chevron Australia Pty Ltd Public Page 64 Uncontrolled When Printed Printed Date: 19 March 2018
Response Activity CAPL Third-party Service Provider
Termination Criteria Capability Implementation Time Capability Implementation Time
• Aerial observer grab bag • 2 × tracking buoys on Barrow
Island • Vessels available at Barrow
Island
Initiate within 6.5 hours of EMT activation (tracking buoy deployment)
As above N/A N/A
Personnel • EMT members trained in
contract activation • 2 × personnel trained in aerial
surveillance
Initiate within 8 hours of EMT activation
• AMOSC Core Group • OSRL Responders • State/National Plan
Response Teams
24 hours

Document No.: G7-NT-PLNX0000089 Jansz-Io Compression: Revision Date: 15 March 2018 JIC Geophysical and Geotechnical Survey Environment Plan Summary Revision: 1
© Chevron Australia Pty Ltd Public Page 65 Uncontrolled When Printed Printed Date: 19 March 2018
6.3.3 Testing of spill response arrangements
Prior to commencing the Geophysical and Geotechnical Surveys, spill response arrangements will be tested (resulting in two separate tests). Given the nature and scale of this activity, testing will be limited to conducting a desktop / notification exercise which will confirm test objectives that the notification requirements are understood.
The outcomes of each test will be documented to assess the effectiveness of the exercise against its objectives and to record any lessons and actions. Any actions relevant to emergency preparedness for these surveys will be completed prior to commencing activities under the plan and applied to future tests under the plan.
Environment Plan Review
Revisions and/or resubmission of the EP to NOPSEMA will be undertaken in accordance with Regulation 17 of the OPGGS€R. The decision to revise or resubmit the EP will be made in accordance with CAPL’s OEMS, particularly Element 4 – Management of Change Process, as detailed in Section 6.1.1.
In addition to this, the oil spill response arrangements will be subject to review where learnings arise from the exercise completed under the EP, or any other exercise conducted by CAPL over the course of this activity where learnings are deemed relevant
The Description of Environment document (Ref. 5) will be reviewed annually to include any relevant changes to source documents, which may include State/Federal Management Plans, Recovery Plans, EPBC status or new published research. Any suggested changes to the description of environment or risk assessment arising from this review will be subject to a management of change in accordance with Section 6.1.1.

Document No.: G7-NT-PLNX0000089 Jansz-Io Compression: Revision Date: 15 March 2018 JIC Geophysical and Geotechnical Survey Environment Plan Summary Revision: 1
© Chevron Australia Pty Ltd Public Page 66 Uncontrolled When Printed Printed Date: 19 March 2018
7. Acronyms, Abbreviations, and Terms Table 7-1 defines the acronyms, abbreviations, and terms used in this document.
Table 7-1: Acronyms, Abbreviations, and Terms
Acronym/Abbreviation/ Term Definition
@ At
~ Approximately
°C Degrees Celsius
ABU Australian Business Unit
AHS Australasian Hydrographic Service
AIIMS Australasian Inter-service Incident Management System
ALARP As Low As Reasonably Practicable
AMOSC Australian Marine Oil Spill Response Centre
AMSA Australian Maritime Safety Authority
API American Petroleum Institute
APPEA Australian Petroleum Production and Exploration Association
AUV Autonomous Underwater Vehicle
BIA Biologically Important Area
BOD Biological Oxygen Demand
Cefas Centre for Environment, Fisheries and Aquaculture Science (UK)
CHARM Chemical Hazard and Risk Management
CAPL CAPL
CMT Crisis Management Team
Commonwealth Commonwealth of Australia
Commonwealth Waters Waters stretching from three to 300 nautical miles from the Australian coast
cP Centipoise
DAWR Commonwealth Department of Agriculture, Water and Resources
dB re 1 μPa Decibels re 1 micropascal
DotEE Commonwealth Department of the Environment and Energy
DP Dynamically Positioned
DPIRD Western Australian Department of Primary Industries and Regional Development (formerly Department of Agriculture and Food, Department of Fisheries, and Department of Regional Development and Lands) (from 1 Jul 2017)
EMBA Environment that May Be Affected
EMT Emergency Management Team

Document No.: G7-NT-PLNX0000089 Jansz-Io Compression: Revision Date: 15 March 2018 JIC Geophysical and Geotechnical Survey Environment Plan Summary Revision: 1
© Chevron Australia Pty Ltd Public Page 67 Uncontrolled When Printed Printed Date: 19 March 2018
Acronym/Abbreviation/ Term Definition
EP Environment Plan
EPBC Act Commonwealth Environment Protection and Biodiversity Conservation Act 1999
ESD Ecologically Sustainable Development
g/m2 Grams per square metre
GDA94 Geocentric Datum of Australia 1994
GOMO Guidelines for Offshore Marine Operations
Gorgon Project Gorgon Gas Development
h Hour
HES Health, Environment, and Safety
HMAP Hazardous Material Approval Procedure
Hz Hertz
IAA Impact Assessment Area
IAGC International Association of Geophysical Contractors
IC Incident Commander
ICS Incident Command System
IMCRA Integrated Marine and Coastal Regionalisation of Australia
IMP Invasive Marine Pest
ISO International Organization for Standardization
KEF Key Ecological Feature
kg Kilogram
kHz Kilohertz
km Kilometre
KUFPEC Kuwait Foreign Petroleum Exploration Company
L Litre
LARS Launch And Recovery System
LC50 Lethal Concentration 50 (concentration in water having 50% chance of causing death to aquatic life)
LNG Liquefied Natural Gas
lux SI unit of illuminance, equal to one lumen per square metre
m Metre
m2 Square metre
m3 Cubic metre
MARPOL 73/78 International Convention for the Prevention of Pollution from Ships
MARS Maritime Arrivals Reporting System

Document No.: G7-NT-PLNX0000089 Jansz-Io Compression: Revision Date: 15 March 2018 JIC Geophysical and Geotechnical Survey Environment Plan Summary Revision: 1
© Chevron Australia Pty Ltd Public Page 68 Uncontrolled When Printed Printed Date: 19 March 2018
Acronym/Abbreviation/ Term Definition
MBES Multibeam Echo Sounder
MDO Marine Diesel Oil
MES Monitoring, Evaluation and Surveillance
Migratory Species Species listed as migratory under section 209 of the EPBC Act.
MODU Mobile Offshore Drilling Unit
MSRE Marine Safety Reliability and Efficiency
MSW Managing Safe Work
N/A Not Applicable
NES Matters of National Environmental Significance
nm Nautical mile
NMFS National Marine Fisheries Service
NOPSEMA National Offshore Petroleum Safety and Environmental Management Authority
OCNS Offshore Chemical Notification Scheme
OE Operational Excellence
OEMS Operational Excellence Management System
OGUK Oil and Gas UK
OPGGS Act Commonwealth Offshore Petroleum and Greenhouse Gas Storage Act 2006
OPGGS(E)R Offshore Petroleum and Greenhouse Gas Storage (Environment) Regulations 2009
ORT On-site Response Team
OSMP Operational and Scientific Monitoring Plan
PCPT Piezo Cone Penetration Test
Pelagic Living at or near the surface of the ocean
PMS Planned Maintenance System
PNEC Predicted No-effect Concentration
ppb Concentration - Parts per billion
ppb/hr Dosage - Parts per billion per hour
PTS Permanent Threshold Shift
Q1, Q2, etc. Three-month quarter of a calendar year
RiskMan2 CAPL HES Risk Management Process
rms Root mean square
RPS APASA RPS – Asia-Pacific Applied Science Associates
SIMOPS Simultaneous Operations
SOPEP Shipboard Oil Pollution Emergency Plan

Document No.: G7-NT-PLNX0000089 Jansz-Io Compression: Revision Date: 15 March 2018 JIC Geophysical and Geotechnical Survey Environment Plan Summary Revision: 1
© Chevron Australia Pty Ltd Public Page 69 Uncontrolled When Printed Printed Date: 19 March 2018
Acronym/Abbreviation/ Term Definition
SPL Sound Pressure Level
STP Sewage Treatment Plant
TAPL Texaco Australia Pty Ltd
Threatened Species Species listed as extinct, extinct in the wild, critically endangered, endangered, vulnerable or conservation dependent under section 178 of the EPBC Act).
UK United Kingdom
US United States
WA Western Australia
WTR West Tryal Rocks

Document No.: G7-NT-PLNX0000089 Jansz-Io Compression: Revision Date: 15 March 2018 JIC Geophysical and Geotechnical Survey Environment Plan Summary Revision: 1
© Chevron Australia Pty Ltd Public Page 70 Uncontrolled When Printed Printed Date: 19 March 2018
8. References Ref. No. Document Document
No.
Hammerstad, E. 2005. EM Technical Note – Sound Levels from Kongsberg Multibeams. Available from: https://www.km.kongsberg.com/ks/web/nokbg0397.nsf/AllWeb/DE3B0D5A997BE98EC1257B58004502AB/$file/EM_technical_note_web_SoundLevelsFromKongsbergMultibeams.pdf?OpenElement
Scientific Committee of Antarctic Research. 2002. Impacts of Marine Acoustic Technology on the Antarctic Environment. Version 1.2. Geoscience Australia. Available from: http://www.geoscience.scar.org/geophysics/acoustics_1_2.pdf
Kongsberg. 2015. Manufacturer Specification – Hugin Autonomous Underwater Vehicle (AUV). Rev B. Available online at: https://www.km.kongsberg.com/ks/web/nokbg0397.nsf/AllWeb/76ABD1760DA9C064C1257B470029C7A5/$file/382309_hugin_product_specification.pdf?OpenElement Accessed 01 March 2017
CAPL. Description of the Environment. Perth, Western Australia. ABU140700357
Department of the Environment and Heritage. 2006. A Guide to the Integrated Marine and Coastal Regionalisation of Australia Version 4.0. Department of the Environment and Heritage, Canberra, Australian Capital Territory
Department of Sustainability, Environment, Water, Population and Communities. 2012. Marine bioregional plan for the North-west Marine Region prepared under the Environment Protection and Biodiversity Conservation Act 1999. Department of Sustainability, Environment, Water, Population and Communities. Available from: http://www.environment.gov.au/coasts/marineplans/north-west/pubs/north-westmarine-plan.pdf
Department of the Environment and Energy. 2017. Protected Matters Search Report for the Operational area.
CAPL. 2005. Draft Environmental Impact Statement/Environmental Review and Management Programme for the Proposed Gorgon Gas Development. CAPL, Perth, Western Australia.
Jenner, K.C.S., Jenner, M.N. and McCabe, K.A. 2001. Geographical and Temporal Movements of Humpback Whales in Western Australian Waters. APPEA Journal. pp749–765.
Threatened Species Scientific Committee. 2015. Approved Conservation Advice for Megaptera novaeangliae (humpback whale). Canberra: Department of the Environment. Available from: http://www.environment.gov.au/biodiversity/threatened/species/pubs/38-conservation-advice-10102015.pdf
Department of the Environment. 2015. Blue Whale Conservation Management Plan. Available from: http://www.environment.gov.au/biodiversity/threatened/publications/recovery/blue-whale-conservation-management-plan
Pendoley, K.L. 2005. Sea turtles and the environmental management of industrial activities in northwest Western Australia. Murdoch University, Western Australia.
Pendoley Environmental Pty Ltd. 2009. Wheatstone Project Marine Turtle Beach Survey, Onslow Mainland Area and Nearby Islands, 25 January – 6 February 2009. Report prepared for CAPL, Perth, Western Australia.
Department of the Environment. Species Profile and Threats Database. Available from: http://www.environment.gov.au/cgi-bin/sprat/public/sprat.pl [Accessed 04 February 2017]

Document No.: G7-NT-PLNX0000089 Jansz-Io Compression: Revision Date: 15 March 2018 JIC Geophysical and Geotechnical Survey Environment Plan Summary Revision: 1
© Chevron Australia Pty Ltd Public Page 71 Uncontrolled When Printed Printed Date: 19 March 2018
Ref. No. Document Document
No.
Hays, G.C., Luschi, P., Papi, F., del Seppia, C. and March, R. 1999. Changes in behaviour during the inter-nesting period and post-nesting migration for Ascension Island green turtles. Mar Ecol Prog Ser. Vol. 189: 263–273, 1999
Waayers, D.A., Smith, L.M. and Malseed, B.E. 2011. Inter-nesting distribution of green turtles (Chelonia mydas) and flatback turtles (Natator depressus) at the Lacepede Islands, Western Australia. Journal of the Royal Society of Western Australia. Vol. 94: 359–364, 2011
Environment Australia. 2003. Recovery Plan for Marine Turtles in Australia – July 2003. Canberra: Environment Australia. Available from: http://www.environment.gov.au/coasts/publications/turtle-recovery/index.html
Last, P., Lyne, V., Yearsley, G., Gledhill, D., Gomon, M., Rees, T. and White, W. 2005. Validation of national demersal fish datasets for the regionalisation of the Australian continental slope and outer shelf (>40 metres depth), Department of the Environment and Heritage and CSIRO Marine and Atmospheric Research, Hobart.
Department of Aboriginal Affairs. 2017. Aboriginal Site and Other Heritage Place Search. Available from: http://www.daa.wa.gov.au/en/Place-Search/ [Accessed 5 February 2017]
Department of the Environment and Energy. 2017. Australian National Shipwreck Database. Available from: https://dmzapp17p.ris.environment.gov.au/shipwreck/public/wreck/search.do;jsessionid=407B5FC9B4B65FAE835942D4097F6CDF. [Accessed 5 February 2017]
CAPL. Health, Environment, and Safety (HES) Risk Management Process. Perth, Western Australia.
OE-03.01.01
Standards Australia/Standards New Zealand. 2009. ISO 31000:2009 Risk Management – Principles and Guidelines. Sydney, Australia/Wellington, New Zealand.
Standards Australia/Standards New Zealand. 2012. Handbook 203:2012. Managing Environment-Related Risk. Sydney, Australia/Wellington, New Zealand.
CAPL. Environmental Stewardship Standardised Operational Excellence (OE) Process. Perth, Western Australia.
OE-07.01
National Offshore Petroleum Safety and Environmental Management Authority. 2015. ALARP Guidance Note. N-04300-GN0166 Revision 6 June 2015. Available from: https://www.nopsema.gov.au/assets/Guidance-notes/A138249.pdf
OGUK. 2014. Guidance on Risk Related Decision Making Issue 2 July 2014
Peel, D., Smith, J.N. and Childerhouse, S. 2016. Historical Data on Australian Whale Vessel Strikes. International Whaling Commission. SC/66b/HIM/05 Rev1.
Richardson, W.J., Greene, C.R., Malme, C.I and Thomson, D.H. 1995. Marine Mammals and Noise. Academic Press. San Diego. 576 p.
WDCS. 2006. Vessel Collisions and Cetaceans: What happens when they don’t miss the boat. Whale and Dolphin Society. United Kingdom.
Laist, D.W., Knowlton, A.R., Mead, J.G., Collet, A.S. and Podesta, M. 2001. Collisions between ships and whales. Marine Mammal Science, 17(1), 35–75.
National Marine Fisheries Service. 2013. Marine Mammals: Interim Sound Threshold Guidance (webpage). National Marine Fisheries Service, National Oceanic and Atmospheric Administration, U.S. Department of Commerce. Available from: http://www.westcoast.fisheries.noaa.gov/protected_species/marine_mammals/threshold_guidance.html

Document No.: G7-NT-PLNX0000089 Jansz-Io Compression: Revision Date: 15 March 2018 JIC Geophysical and Geotechnical Survey Environment Plan Summary Revision: 1
© Chevron Australia Pty Ltd Public Page 72 Uncontrolled When Printed Printed Date: 19 March 2018
Ref. No. Document Document
No.
Mackay, A.I., Bailluel, F. , Childerhouse, S., Donnelly, D., Harcourt, R., Parra, G.J. and Goldsworthy, S.D. 2015. Offshore migratory movement of southern right whales: addressing critical conservation and management needs. South Australian Research and Development Institute (Aquatic Sciences), Adelaide. SARDI Publication No. F2015/000526-1. SARDI Research Report Series No. 859. 40pp.
Woodside Energy Ltd. 2014. Browse FLNG Development, Draft Environmental Impact Statement. EPBC 2013/7079. November 2014. Woodside Energy, Perth WA.
Simmonds, M., Dolman, S. and Weilgart, L. 2004. Oceans of Noise. Whale and Dolphin Conservation Society, Wiltshire, United Kingdom.
Marquenie, J., Donners, M., Poot, H., Steckel, W. and de Wit, B. 2008. Adapting the spectral composition of artificial lighting to safeguard the environment. Petroleum and Chemical Industry Conference Europe -Electrical and Instrumentation Applications, pp 1–6.
Wiese, F.K., Montevecci, W.A., Davoren, G.K., Huettmann, F., Diamond, A.W. and Linke, J. 2001. Seabirds at risk around off shore oil platforms in the northwest Atlantic. Marine Pollution Bulletin. 42:1285–1290.
Shell. 2010. Prelude Floating LNG Project EIS Supplement-Response to Submissions
McCauley, R.D. 1998. Radiated underwater noise measured from the drilling rig ocean general, rig tenders Pacific Ariki and Pacific Frontier, fishing vessel Reef Venture and natural sources in the Timor Sea, Northern Australia. Prepared by Rob McCauley for Shell Australia.
Richardson W.J., Fraker, M.A., Wursig,B. and Wills, R.S. 1985. Behaviour of bowhead whales (Balaena mysticetus), summering in the Beaufort Sea: Reactions to industrial activities. Biological Conservation. 32. 195–230.
Southall, B.L., Bowles, A.E., Ellison, W.T., Finneran, J.J., Gentry, R.L., Greene Jr, C.R., Kastak, D., Ketten, D.R., Miller, J.H., Nachtigall, P.E., Richardson, W.J., Thomas, J.A. and Tyack, P.L. 2007. Marine Mammal Noise Exposure Criteria: Initial Scientific Recommendations. Aquatic Mammals, 33(4): 411–414.
Popper, A.N., Hawkins, A.D., Fay, R.R., Mann, D.A., Bartol, S., Carlson, T.J., Coombs, S., Ellison, W.T., Gentry, R.L. et al. 2014. Sound Exposure Guidelines for Fishes and Sea Turtles: A Technical Report prepared by ANSI-Accredited Standards Committee S3/SC1 and registered with ANSI. SpringerBriefs in Oceanography, Volume ASA S3/SC1.4 TR-2014. ASA Press. 87 pp.
Wardle, C.S., Carter, T.J., Urquhart, G.G., Johnstone, A.D.F., Ziolkowski, A., Hampson, G. Mackie, D. 2001. Effects of seismic air guns on marine fish. Continental Shelf Research 21 (2001) 1005–1027
McCauley, R.D. 2004. Underwater sea noise in the Otway Basin – drilling, seismic and blue whales. Report prepared by Centre for Marine Science and Technology, Curtin University, for Santos Ltd
OSPAR Commission. 2009. Overview of Impacts of Anthropogenic Underwater Sound in the Marine Environment. London. UK: OSPAR Commission.
CAPL. 2010. Chevron Wheatstone RT-1 Trials: Trench 2 & 4 – RT-1 Turbidity Measurements Field Report. CAPL, Perth, Western Australia.
SSS-1005-OP-RPT-035
CAPL. 2010b. Chevron Wheatstone RT-1 Trials: Trench 3 – RT-1 Turbidity Measurements Field Report. CAPL, Perth, Western Australia.
SSS-1005-OP-RPT-031

Document No.: G7-NT-PLNX0000089 Jansz-Io Compression: Revision Date: 15 March 2018 JIC Geophysical and Geotechnical Survey Environment Plan Summary Revision: 1
© Chevron Australia Pty Ltd Public Page 73 Uncontrolled When Printed Printed Date: 19 March 2018
Ref. No. Document Document
No.
CAPL. 2013. Gorgon Gas Development and Jansz Feed Gas Pipeline: Post-Development Coastal and Marine State and Environment Impact Report: Offshore Feed Gas Pipeline System and Marine Component of the Shore Crossing, Year 1: 2013. CAPL, Perth, Western Australia.
G1-NT-REPX0006072
Hinwood, J.B., Potts, A.E., Dennis, L.R., Carey, J.M., Houridis, H., Bell, R.J., Thomson, J.R., Boudreau, P. and Ayling, A.M. 1994. Drilling Activities. In: Environmental Implications of Offshore Oil and Gas Developments in Australia – the Findings of an Independent Scientific Review. Edited by Swan J.M., Neff J.M. and Young P.C. Australian Petroleum Exploration Association. Sydney
Langford, T.E.L. 1990. Ecological effects of thermal discharges, xi, 468p. Elsevier.
Azis, P., Al-Tisan, I., Daili, M., Green, T., Dalvi, A. and Javeed, M. Chlorophyll and plankton of the Gulf coastal waters of Saudi Arabia bordering a desalination plant Desalination, 154 (2003), pp. 291–302
Walker, D.I. and McComb, A.J. 1990. Salinity response of the seagrass Amphibolis antarctica (Labill.) Sonder et Aschers: an experimental validation of field results. Aquat Bot. 36:359–366.
Department of the Environment. 2015. The introduction of Marine Pests to the Australian Environment via Shipping. http://www.environment.gov.au/biodiversity/threatened/nominations/ineligible-ktp/introduction-marine-pests-via-shipping [Accessed 4 Jan 2017]
Hewitt, C.L., Martin, R.B., Sliwa, C., McEnnulty, F.R., Murphy, N.E., Jones, T. and Cooper, S. (eds) 2002. National introduced marine pest information system. Available online at: http://www.marinepests.gov.au/Pages/default.aspx [Accessed 4 April 2017]
Paulay, G. Kirkendale, L. Lambert, G. and Meyer, C. 2002. Anthropogenic biotic interchange in a coral reef ecosystem: A case study from Guam. Pacific Science 56(4): 403–422
Department of Agriculture and Water Resources. 2017. Australian Ballast Water Management Requirements. Available online at: http://www.agriculture.gov.au/biosecurity/avm/vessels/ballast/australian-ballast-water-management-requirements [Accessed October 22 2017]
McIntyre, A.D. and Johnson, R. 1975. Effects of nutrient enrichment from sewage in the sea. In: ALH Gameson, ed. Discharge of sewage from sea outfalls. New York: Pergamon Press. Pp. 131–141
Black, K.P., Brand, G.W., Grynberg, H., Gwyther, D., Hammond, L.S., Mourtikas, S., Richardson, B.J. and Wardrop, J.A. 1994. Production facilities. In: Environmental implications of offshore oil and gas development in Australia – the findings of an independent scientific review. Swan, J.M., Neff, J.M. and Young, P.C. (eds) Australian Petroleum Exploration Association. Sydney. Pp 209–407
Australian Maritime Safety Authority. 2015. Technical guideline for preparing contingency plans for marine and coastal Facilities. Australian Maritime Safety Authority, Canberra
(No author). 2013. Guidelines for Offshore Marine operations. Revision 0611-1401. Available online http://www.g-omo.info/wp-content/uploads/2016/06/201311-GOMOfinal.pdf [Accessed 14 May 2017]
CAPL. Marine Safety Reliability and Efficiency. ABU Standardised OE Process. Perth, Western Australia.
OE-03.09.01
CAPL. Managing Safe Work (MSW). ABU Standardised OE Process. Perth, Western Australia.
OE-03.06.02

Document No.: G7-NT-PLNX0000089 Jansz-Io Compression: Revision Date: 15 March 2018 JIC Geophysical and Geotechnical Survey Environment Plan Summary Revision: 1
© Chevron Australia Pty Ltd Public Page 74 Uncontrolled When Printed Printed Date: 19 March 2018
Ref. No. Document Document
No.
CAPL. Management of Change for Facilities and Operations. ABU Standardised OE Process. Perth, Western Australia.
OE-04.00.01
CAPL. Incident Investigation and Reporting. ABU Standardised OE Process. Perth, Western Australia.
OE-09.00.01
CAPL. Community and Stakeholder Engagement. ABU Standardised OE Process. Perth, Western Australia.
OE-10.00.01
CAPL. 2012. Emergency Management Process. Chevron Australia, Perth, Western Australia.
OE-11.01.01
CAPL. Compliance Assurance Audit Program. ABU Standardised OE Process. Perth, Western Australia.
OE-12.01.19
CAPL. Compliance Assurance Management of Instances of Potential Noncompliance. Perth, Western Australia.
OE-12.01.18
CAPL. Operation and Scientific Monitoring Plan – Environmental Monitoring in the Event of an Oil Spill to Marine Coastal Waters. Perth, Western Australia
ABU130700448
IRC Environment. 2005. Jansz Pipeline Benthic Fauna Survey. Unpublished report prepared for Mobil Exploration and Producing Australia Pty Ltd by IRC Environment, ENV-REP-04-228-003 Rev B, Perth, Western Australia.
Gorgon Upstream Facilities Team. 2009. Soil Data Summary at N1K Scarp Crossing. Gorgon Upstream Facilities Team, Perth, Western Australia.
G1-TE-Z-UGJ0-REP0003
Department of Environment, Water, Heritage and the Arts. 2005. Australian National Guidelines for Whale and Dolphin Watching. Available from: https://www.environment.gov.au/system/files/resources/fed9ff86-0571-43ff-bb18-32205fc6a62c/files/whale-watching-guidelines-2005.pdf [Accessed 01 June 2017]
International Association of Geophysical Contractors. 2013. Mitigation Measures for Cetaceans during Geophysical Operations. Available from: http://www.iagc.org/uploads/4/5/0/7/45074397/environmental_compliance_manual.pdf [Accessed 01 June 2017]
Department of Environment, Water, Heritage and the Arts. 2008. EPBC Act Policy Statement 2.1 – Interaction between offshore seismic exploration and whales. Available from: http://www.environment.gov.au/resource/epbc-act-policy-statement-21-interaction-between-offshore-seismic-exploration-and-whales [Accessed 01 June 2017]
RPS. 2009. Benthic Habitat Survey. Proposed Gorgon and Jansz Feed Gas Pipeline Routes and HDD Exit Points. Report prepared for CAPL, Perth, Western Australia.
Ridgway, S.H., E.G. Wever, J.G. McCormick, J. Palin, and J.H. Anderson. 1969. Hearing in the giant sea turtle, Chelonia mydas. Proceedings of the National Academy of Sciences 64(3): 884–890.
Bartol, S.M., Musick, J.A. and Lenhardt, M.L. 1999. Auditory evoked potentials of the loggerhead sea turtle (Caretta caretta). Copeia: 836–840.
Ketten, D.R. and Bartol, S.M. 2005. Functional measures of sea turtle hearing. ONR project final report. Document Number ONR Award Number N00014-02-1-0510. Office of Naval Research (US).
Bartol, S.M. and Ketten, D.R. 2006. Turtle and tuna hearing. In: Swimmer, Y. and R. Brill. Volume December 2006. NOAA Technical Memorandum NMFS-PIFSC-7. pp. 98–103. Available from: http://www.sefsc.noaa.gov/turtles/TM_NMFS_PIFSC_7_Swimmer_Brill.pdf#page=108.

Document No.: G7-NT-PLNX0000089 Jansz-Io Compression: Revision Date: 15 March 2018 JIC Geophysical and Geotechnical Survey Environment Plan Summary Revision: 1
© Chevron Australia Pty Ltd Public Page 75 Uncontrolled When Printed Printed Date: 19 March 2018
Ref. No. Document Document
No.
Yudhana, A., Sunardi, J.D., Abdullah, S. and Hassan, R.B.R. 2010. Turtle hearing capability based on ABR signal assessment. Telkomnika 8: 187–194.
Piniak, W.E., Mann, D.A., Eckert, S.A. and Harms, C.A. 2011. Amphibious hearing in sea turtles. In: Hawkins, T. and A.N. Popper (eds.). Proceedings of the 2nd International Conference on the Effects of Noise on Aquatic Life. August 15–20, 2010. Springer-Verlag. (In Press).
Lavender, A.L., Bartol, S.M. and SBartol, I.K. 2012. Hearing capabilities of loggerhead sea turtles (Caretta caretta) throughout ontogeny. In The Effects of Noise on Aquatic Life. Springer. 89–92. Available from: http://www.soundandmarinelife.org/research-categories/physical-and-physiological-effects-and-hearing/modelling-mysticete-baleen-whale-hearing.aspx.
Lavender, A.L., Bartol, S.M. and Bartol, I.K. 2014. Ontogenetic investigation of underwater hearing capabilities in loggerhead sea turtles (Caretta caretta) using a dual testing approach. Journal of Experimental Biology 217(14): 2580–2589. Available from: http://jeb.biologists.org/content/217/14/2580.abstract
McCauley, R.D., Fewtrell, J., Duncan, A.J., Jenner, C., Jenner, M.-N., Penrose, J.D., Prince, R.I.T., Adihyta, A., Murdoch, J., et al. 2000. Marine seismic surveys: A study of environmental implications. Australian Petroleum Production Exploration Association (APPEA) Journal 40: 692–708.
RPS APASA. 2013. Quantitative Oil Spill Modelling Study for WTR & WTR-5 Well Sites, Western Australia. Unpublished report, Prepared for CAPL, February 2013
National Offshore Petroleum Safety and Environmental Management Authority. 2017. Decision-Making Guideline – Criterion-10A(g) Consultation Requirements. Available from: https://www.nopsema.gov.au/assets/Corporate/Decision-making-guidelines-consultation-package-November-2016.pdf [Accessed 20 July 2017]
Australian Petroleum Production and Exploration Association. Stakeholder Consultation and Engagement Principles and Methodology – Draft
National Offshore Petroleum Safety and Environmental Management Authority. 2017. Environment Plan Decision Making Guideline (GL1721). Available online at: https://www.nopsema.gov.au/assets/Guidelines/A524696.pdf [Accessed 20 July 2017]
International Association of Geophysical Contractors. 2013. Environmental Manual for Worldwide Geophysical Operations. Available online at http://www.iagc.org/uploads/4/5/0/7/45074397/environmental_compliance_manual.pdf [Accessed 18 July 2017]
OSPAR. 2014. Establishment of a list of Predicted No Effect Concentrations (PNECs) for naturally occurring substances in produced water. OSPAR Commission. OSPAR Agreement: 2014–05
Commonwealth of Australia. 2008. National Biofouling Management Guidance for the Petroleum Production and Exploration Industry. Available online at: http://www.marinepests.gov.au/marine_pests/publications/Documents/Biofouling_guidance_petroleum.pdf [Accessed 18 July 2017]
International Maritime Organization. 2011. Control and Management of Ships’ Biofouling to Minimize the Transfer of Invasive Aquatic Species (Biofouling Guidelines) MPEC.207(62)). Available from: http://www.imo.org/en/OurWork/Environment/Biofouling/Pages/default.aspx [Accessed 20 May 2017]
API. 2007. Recommended Practice for Fire Prevention and Control on Fixed Open-Type Offshore Production Platforms. Recommended Practice 14G

Document No.: G7-NT-PLNX0000089 Jansz-Io Compression: Revision Date: 15 March 2018 JIC Geophysical and Geotechnical Survey Environment Plan Summary Revision: 1
© Chevron Australia Pty Ltd Public Page 76 Uncontrolled When Printed Printed Date: 19 March 2018
Ref. No. Document Document
No.
Double, M.C., V. Andrews-Goff, K.C.S. Jenner, M.-N. Jenner, S.M. Laverick, T.A. Branch & N.J. Gales. 2014. Migratory movements of pygmy blue whales (Balaenoptera musculus brevicauda) between Australia and Indonesia as revealed by satellite telemetry. PloS one. 9:e93578
McCauley, R.D., Day, R.D., Swadling, K.M., Fitzgibbon, Q.P., Watson, R.A. and Semmens, J.M. 2017. Widely used marine seismic survey air gun operations negatively impact zooplankton. Nature Ecology & Evolution 1, Article number: 0195 (2017). doi:10.1038/s41559-017-0195
Houde, E.D. and Zastrow, C.E. 1993. Ecosystem- and taxon-specific dynamic and energetics properties of larval fish assemblages. Bulletin of Marine Science 53 (2): 290-335.
Day, R.D.,McCauley, R.D., Fitzgibbon, Q.P., Semmens, J.M., 2016a. Seismic air gun exposure during early-stage embryonic development does not negatively affect spiny lobster Jasus edwardsii larvae (Decapoda: Palinuridae). Sci Rep 6, 22723.
Day, R.D., McCauley, R.M., Fitzgibbon, Q.P., Semmens, J.M., Institute for Marine and Antarctic Studies. 2016b. Assessing the impact of marine seismic surveys on southeast Australian scallop and lobster fisheries, University of Tasmania. Hobart. October CC BY 4.0
Cogger, H.G. 1975. Sea Snakes of Australia and New Guinea. In: W.A. Dunson (ed.). The Biology of Sea Snakes. University Park Press, Baltimore. pp. 59–139.
Cogger, H. 2000. Reptiles and amphibians of Australia. Reed Books, Sydney, Australia.
Dawson, C 1985, Indo–Pacific pipefishes (Red Sea to the Americas), Gulf Coast Research Laboratory, Ocean Springs, Mississippi.
Lourie, SA, Vincent, ACJ & Hall, HJ 1999, Seahorses: an identification guide to the world’s species and their conservation, Project Seahorse, London.
Lourie, SA, Foster, SJ, Cooper, EWT & Vincent, A 2004, A guide to the identification of seahorses, Project Seahorse and TRAFFIC North America, University of British Columbia and World Wildlife Fund.
Vincent, ACJ 1996, The international trade in seahorses, Traffic International, Cambridge.
Commonwealth of Australia. 2012. Species group report card – bony fishes. Available online at: < http://www.environment.gov.au/system/files/pages/1670366b-988b-4201-94a1-1f29175a4d65/files/north-west-report-card-bonyfishes.pdf> Accessed 08 August 2017.
Braun-McNeill, J., Sasso, C.R., Epperly, S.P. and Rivero, C. 2008. Feasibility of using sea surface temperature imagery to mitigate cheloniid sea turtle–fishery interactions off the coast of northeastern USA. Available online at :<http://www.int-res.com/articles/esr2008/5/n005p257.pdf> Accessed 01 September 2017
URS. 2008. Review of Literature on the effects of desalination plant brine discharge upon cetaceans. Western Australian Water Corporation.
Pendoley. 2007. The effects of the Petroleum Industry on Sea Turtles – A literature Review. Pendoley Environmental Pty Ltd. - Draft
Chevron Australia. 2015. Hazardous Communications Process. CAPL, Perth, Western Australia.

Document No.: G7-NT-PLNX0000089 Jansz-Io Compression: Revision Date: 15 March 2018 JIC Geophysical and Geotechnical Survey Environment Plan Summary Revision: 1
© Chevron Australia Pty Ltd Public Page 77 Uncontrolled When Printed Printed Date: 19 March 2018
Ref. No. Document Document
No.
Chevron Australia. 2015. ABU Hazardous Materials Environmental Assessment Tool. CAPL, Perth, Western Australia.
OE-03.16.13
Pendoley, K. 2000. The influence of gas flares on the orientation of green turtle hatchlings at Thevenard Island, Western Australia. Second ASEAN Symposium and Workshop on Sea Turtle biology and Conservation, Kota Kinabalu, Borneo, ASEAN Academic Press
Hick, P. 1995. Spectral measurements of illumination sources at Thevenard Island: a preliminary study of the probably effects of gas flares and production facility lights on Green Turtles; and a subsequent revisit to measure a range of gas-flow rates. CSIRO Remote Sensing of Mine Environment, Minesite Rehabilitation Research Program: 20pp.
Cai M., Sou I.M., Layman C., Bingham B. and Allen J. 2010. Characterization of the acoustic signature of a small remotely operated vehicle for detection. Proceedings of MTS/IEEE OCEANS 2010 Seattle 2010 pp. 1-7