Jian Helen Yang Charles River Development CSRA, … · Q3: How do all these measures ... -...
17
Jian Helen Yang Charles River Development CSRA, December 12, 2013
Transcript of Jian Helen Yang Charles River Development CSRA, … · Q3: How do all these measures ... -...
Jian Helen Yang
Charles River Development
CSRA, December 12, 2013

So, what is the state of systemic risk
Image: sodahead.com

Step 1: A Survey of Systemic Risk Analytics
Source: http://papers.ssrn.com/sol3/papers.cfm?abstract_id=2170926

Step 2: Noise as information for illiquidity
1. The data is one year old. 2. How to interpret the
numbers?
Source: http://www.mit.edu/~junpan/Noise_Measure.txt?version=1
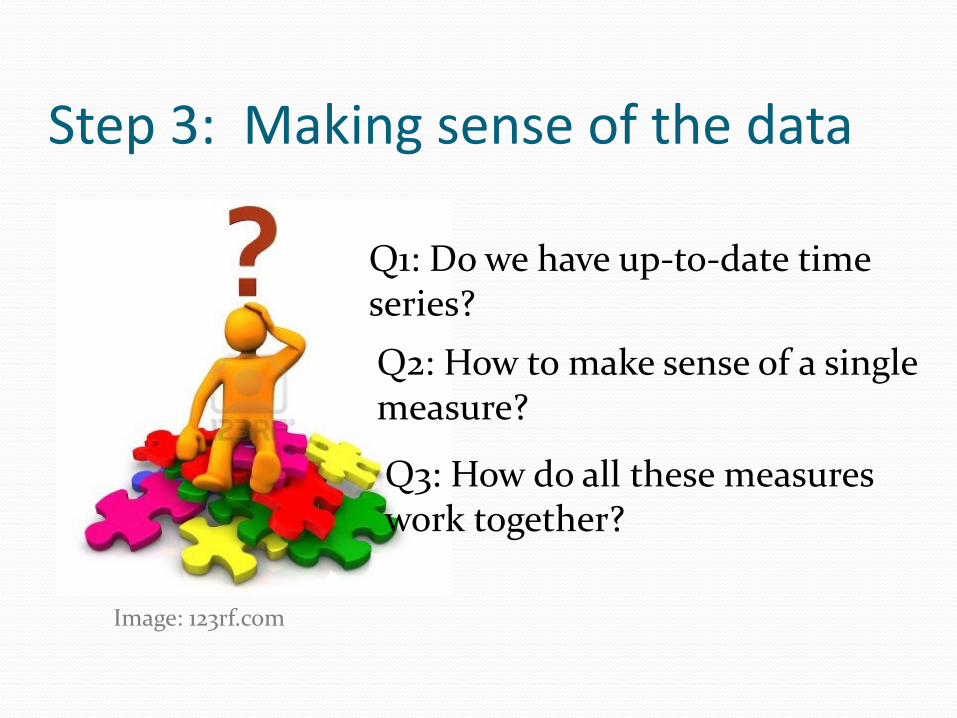
Step 3: Making sense of the data
Image: 123rf.com
Q1: Do we have up-to-date time series?
Q2: How to make sense of a single measure?
Q3: How do all these measures work together?

Topics for discussion
Life beyond publication
Develop a single indicator for systemic risk

Life after publication - Shiller’s investor confidence index
From original paper, 2000
http://icf.som.yale.edu/stock-market-confidence-indices-united-states
From Yale website, 2013
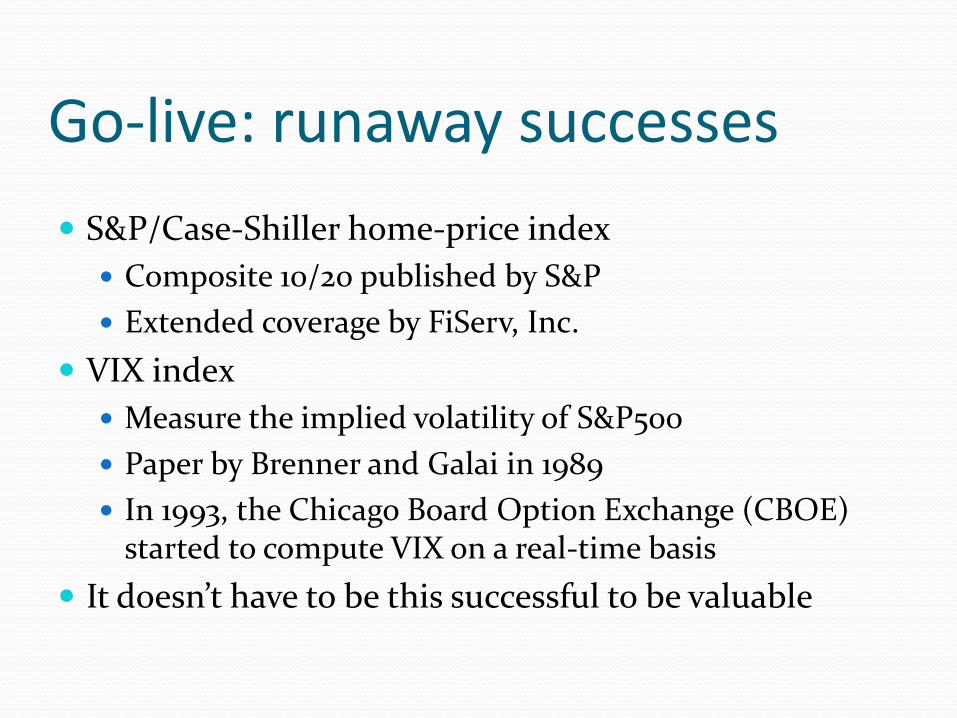
Go-live: runaway successes
S&P/Case-Shiller home-price index
Composite 10/20 published by S&P
Extended coverage by FiServ, Inc.
VIX index
Measure the implied volatility of S&P500
Paper by Brenner and Galai in 1989
In 1993, the Chicago Board Option Exchange (CBOE) started to compute VIX on a real-time basis
It doesn’t have to be this successful to be valuable

Challenges for publishing live time-series
Incentive is not strong
Costs of automation: data and algorithm
Data is the real challenge
Data collection can be a tremendous effort
Data access layer may be difficult to automate
Example: CRSP database not RDBMS?
Consolidate data from multi-sources can be a headache
How can we help?

A platform to publish live measures
Common infrastructure, self-managed content
Crowd-sourcing
This is a common paradigm
Wikipedia – its success and troubles http://en.wikipedia.org/wiki/Wikipedia:List_of_hoaxes_on_Wikipedia
Youtube
Amazon

YouTube: # of visits, # of likes
Note: the numbers are made-up for illustration only.
A quick way to evaluate research

Amazon: Reviews and reviews2
Another quick way to evaluate research
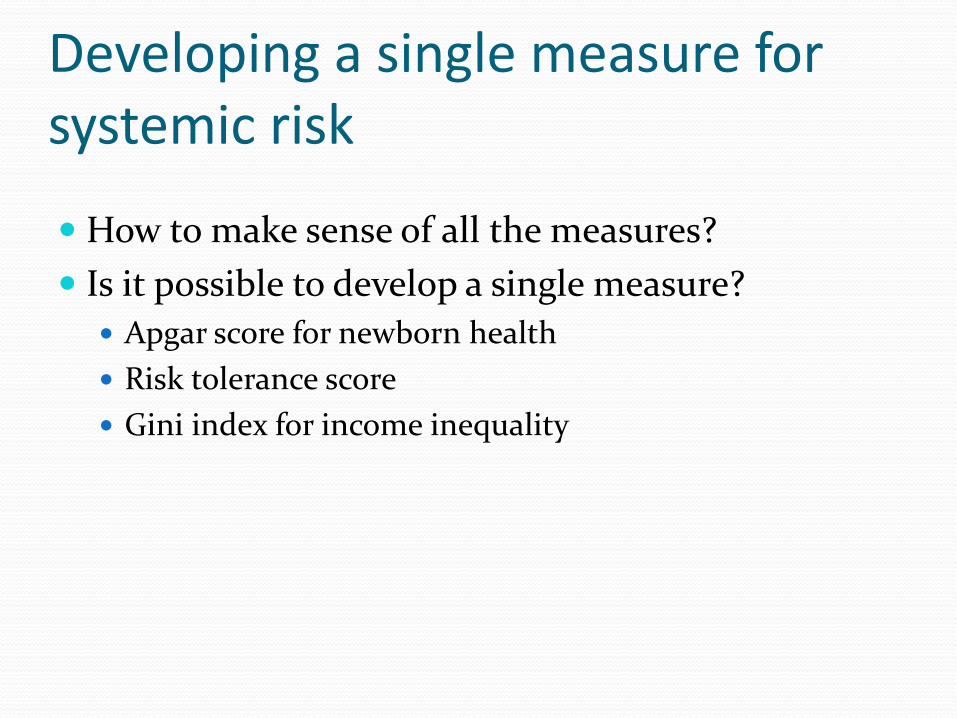
Developing a single measure for systemic risk
How to make sense of all the measures?
Is it possible to develop a single measure?
Apgar score for newborn health
Risk tolerance score
Gini index for income inequality

The Apgar score Devised in 1952 by Dr. Virginia Apgar.
Source: wikipedia.org

Gini index – income inequality
Rank Country GINI Index Date of information
1 Lesotho 63.2 1995 2 South Africa 63.1 2005
29 China 47.4 2012 41 United States 45.0 2007 52 Russia 41.7 2011
103 Canada 32.1 2005 136 Sweden 23.5 2005
Source: CIA website. https://www.cia.gov/library/publications/the-world-factbook/rankorder/2172rank.html

Proposal of a single measure for systemic risk
Pick n categories
Macroeconomic measures
Cross sectional measures
…
For each category, pick a few measures
For each measure, in the scale of 0-10, what is the score?
Add them up and rescale to 10

Thank you.