Jersey Central Power and Light Introduction Final...B. Company Background .....10 JCP&L History and...
70
Task Report – For Review Purposes Only i 7/6/2011 Jersey Central Power and Light Introduction June 2011
Transcript of Jersey Central Power and Light Introduction Final...B. Company Background .....10 JCP&L History and...

Task Report – For Review Purposes Only i
7/6/2011
Jersey Central Power and Light
Introduction
June 2011


Final Report i
6/20/2011
Table of Contents
I. INTRODUCTION ...................................................................................................................... 1
A. Summary of Recommendations ................................................................................................................... 2
Phase I – Review of Affiliate Transactions, Planning, Operations, & Maintenance Practices ........... 4
Phase II - Comprehensive Management Audit ......................................................................................... 5
B. Company Background ................................................................................................................................. 10
JCP&L History and Background ............................................................................................................... 10
FirstEnergy Corporation Background ...................................................................................................... 11
C. JCP&L 2005 to 2009 Annual Statistics ..................................................................................................... 12
Total Plant in Service ................................................................................................................................... 13
Operating Revenue ...................................................................................................................................... 14
Sales by Volume (Megawatt Hours (MWh)) ............................................................................................ 15
JCP&L Total Employees (End of Year) ................................................................................................... 17
Operating and Maintenance Expenses ..................................................................................................... 18
Performance Ratios ..................................................................................................................................... 19
II. REVIEW OF PROCUREMENT ACTIVITIES (ENPRO) ................................................... 21
A. Background & Perspective.......................................................................................................................... 21
JCP&L Capacity and Energy Sources ....................................................................................................... 21
Regulated Commodity Sourcing (RCS) Organization ............................................................................ 22
Basic Generation Service (BGS) Process ................................................................................................. 23
Yards Creek Pumping Station .................................................................................................................... 28
St. Lawrence/FDR Project ......................................................................................................................... 29
Non-Utility Generators (NUGs) ............................................................................................................... 30
B. Findings & Conclusions .............................................................................................................................. 35
C. Recommendations ........................................................................................................................................ 39
III. AFFILIATED RELATIONSHIPS AND AFFILIATE ALLOCATION METHODOGIES .................................................................................................................... 41
A. Affiliate Relationships .................................................................................................................................. 41
Background & Perspective ......................................................................................................................... 41

ii Final Report
6/20/2011
Table of Contents (continued)
Organizational Structure ....................................................................................................................... 41
Affiliate Transactions from/to JCP&L ............................................................................................... 43
Findings & Conclusions .............................................................................................................................. 50
Recommendations ....................................................................................................................................... 58
B. Cost Allocation Methodologies .................................................................................................................. 60
Background & Perspective ......................................................................................................................... 60
Findings & Conclusions .............................................................................................................................. 62
Recommendations ....................................................................................................................................... 74
C. Flight Operations ......................................................................................................................................... 75
Background & Perspective ......................................................................................................................... 75
Findings & Conclusions .............................................................................................................................. 77
Recommendations ....................................................................................................................................... 80
IV. MARKET CONDITIONS ...................................................................................................... 83
A. Background & Perspective ......................................................................................................................... 83
B. Findings & Conclusions .............................................................................................................................. 87
C. Recommendations ........................................................................................................................................ 89
V. REVIEW OF PRIOR AUDIT RECOMMENDATIONS ....................................................... 91
A. Background & Perspective ......................................................................................................................... 91
2003 Competitive Services Audit of JCP&L (Docket EA02020096) .................................................. 92
System Reliability Reviews .......................................................................................................................... 95
2004 Focused Audit of JCP&L’s Planning, Operations, and Maintenance Practices, Policies, and Procedures (Docket EX02120950)/Booth Report .............................................. 96
PJ Downes Associates’ Review ............................................................................................................ 96
Memorandum of Understanding (MOU) ........................................................................................... 97
Stipulation of Settlement (SOS) ......................................................................................................... 103
B. Findings & Conclusions ............................................................................................................................ 108
C. Recommendations ...................................................................................................................................... 109

Final Report iii
6/20/2011
Table of Contents (continued)
VI. REMEDIATION COSTS ......................................................................................................113
A. Background ................................................................................................................................................ 113
Status Reporting ........................................................................................................................................ 115
Internal .................................................................................................................................................. 115
External ................................................................................................................................................. 115
B. Findings & Conclusions ........................................................................................................................... 116
C. Recommendations ..................................................................................................................................... 120
VII. EXECUTIVE MANAGEMENT AND CORPORATE GOVERNANCE ........................ 123
A. Executive Management ............................................................................................................................ 123
Background & Perspective ...................................................................................................................... 123
Organizational Structure and Planning ............................................................................................ 123
Management and Administrative Communications and Controls ............................................... 127
Findings & Conclusions ........................................................................................................................... 128
Recommendations .................................................................................................................................... 129
B. Corporate Governance ............................................................................................................................. 130
Background & Perspective ...................................................................................................................... 130
Findings & Conclusions ........................................................................................................................... 135
Recommendations .................................................................................................................................... 142
C. Organization Structure ............................................................................................................................. 143
D. Human Resources ..................................................................................................................................... 143
Background & Perspective ...................................................................................................................... 143
Organization and Staffing .................................................................................................................. 143
HR Steering Committee ..................................................................................................................... 147
HR Technology .................................................................................................................................... 148
Performance Management ................................................................................................................. 149
Compensation and Benefits ............................................................................................................... 153
Recruiting and Staffing ....................................................................................................................... 156
Safety ..................................................................................................................................................... 157

iv Final Report
6/20/2011
Table of Contents (continued)
Data and Statistics ................................................................................................................................ 160
Employee Diversity .............................................................................................................................. 164
Data and Statistics ................................................................................................................................ 166
Findings & Conclusions ............................................................................................................................ 172
Recommendations ..................................................................................................................................... 180
E. Strategic Planning ....................................................................................................................................... 182
Background & Perspective ....................................................................................................................... 182
Findings & Conclusions ............................................................................................................................ 183
Recommendations ..................................................................................................................................... 184
F. External Relations ...................................................................................................................................... 185
Background & Perspective ....................................................................................................................... 185
Findings & Conclusions ............................................................................................................................ 189
Recommendations ..................................................................................................................................... 190
VIII. FINANCE AND ACCOUNTING .................................................................................... 193
A. Finance......................................................................................................................................................... 193
Background & Perspective ....................................................................................................................... 193
Overview................................................................................................................................................ 194
Financing and Debt Management ...................................................................................................... 195
Credit ...................................................................................................................................................... 196
Investments ........................................................................................................................................... 200
Pension and Other Post-Retirement Benefits (OPEB) Plans........................................................ 205
Tax Treatment ...................................................................................................................................... 206
Findings & Conclusions ............................................................................................................................ 207
Recommendations ..................................................................................................................................... 209
B. Cash Management ...................................................................................................................................... 210
Background & Perspective ....................................................................................................................... 210
Overview................................................................................................................................................ 210
Cash Management Methodologies ..................................................................................................... 211

Final Report v
6/20/2011
Table of Contents (continued)
Cash Receipts ....................................................................................................................................... 212
Cash Disbursements............................................................................................................................ 213
Banking ................................................................................................................................................. 215
Money Pool .......................................................................................................................................... 216
Financial Performance Measurements ............................................................................................. 219
Write-Offs............................................................................................................................................. 220
Cost of Capital ..................................................................................................................................... 221
Findings & Conclusions ........................................................................................................................... 222
Recommendations .................................................................................................................................... 224
C. Accounting and Property Records .......................................................................................................... 225
Background & Perspective ...................................................................................................................... 225
Overview ............................................................................................................................................... 225
Accounts Payable ................................................................................................................................. 228
Accounts Receivable ........................................................................................................................... 231
Payroll Functions ................................................................................................................................. 233
Budget Processes ................................................................................................................................. 235
Property Accounting ........................................................................................................................... 244
Internal Auditing.................................................................................................................................. 245
Findings & Conclusions ........................................................................................................................... 253
Recommendations .................................................................................................................................... 257
IX. ELECTRIC OPERATIONS ................................................................................................. 259
A. Transmission and Distribution ................................................................................................................ 259
Background & Perspective ...................................................................................................................... 259
Organizational Structure .......................................................................................................................... 264
JCP&L ................................................................................................................................................... 264
FirstEnergy Utilities ............................................................................................................................ 268
Performance Management ....................................................................................................................... 272
Asset Management .................................................................................................................................... 276

vi Final Report
6/20/2011
Table of Contents (continued)
Distribution Planning .......................................................................................................................... 276
Capital Management ............................................................................................................................ 276
Standards ............................................................................................................................................... 277
Operations and Maintenance .............................................................................................................. 278
Performance Measures ........................................................................................................................ 278
Support Applications ........................................................................................................................... 278
Planned Maintenance ........................................................................................................................... 280
FEU/JCP&L Storm Process .............................................................................................................. 282
O&M Support Applications ............................................................................................................... 287
Capital Program ......................................................................................................................................... 290
System Forecasting ............................................................................................................................... 290
Distribution Forecasting...................................................................................................................... 291
Capital Program Planning and Budgeting ......................................................................................... 292
Support Applications ........................................................................................................................... 294
Work Management System ....................................................................................................................... 298
Workforce ................................................................................................................................................... 300
Findings & Conclusions ............................................................................................................................ 302
Service Levels ........................................................................................................................................ 302
Costs ....................................................................................................................................................... 312
Management Processes ........................................................................................................................ 324
Support Applications ........................................................................................................................... 334
Recommendations ..................................................................................................................................... 338
B. Extensions and Upgrades .......................................................................................................................... 346
Background ................................................................................................................................................. 346
Findings & Conclusions ............................................................................................................................ 349
Recommendations ..................................................................................................................................... 365
C. Contractor Performance ........................................................................................................................... 366
Underground Locate Services .................................................................................................................. 366
Background ........................................................................................................................................... 366

Final Report vii
6/20/2011
Table of Contents (continued)
Findings & Conclusions ..................................................................................................................... 367
Recommendation ................................................................................................................................. 377
Installation of New and Replacement Lines and Services .................................................................. 377
Background........................................................................................................................................... 377
Findings & Conclusions ..................................................................................................................... 378
Recommendations ............................................................................................................................... 386
X. CUSTOMER SERVICE ......................................................................................................... 387
A. Background & Perspective....................................................................................................................... 387
Organization .............................................................................................................................................. 388
Performance Management ....................................................................................................................... 391
Residential Bill Changes ........................................................................................................................... 392
FEU Customer Services ........................................................................................................................... 394
Human Services Programs ................................................................................................................. 395
Regulatory Complaint Handling Process ......................................................................................... 396
Customer Support ..................................................................................................................................... 398
Non-Regulatory Complaint Handling Process ................................................................................ 398
Customer Contact Centers ...................................................................................................................... 399
Meter Reading............................................................................................................................................ 402
Credit and Collections .............................................................................................................................. 403
Meter Replacement Program ................................................................................................................... 404
IDER Direct Load Control Program ..................................................................................................... 405
Economic Development .......................................................................................................................... 406
B. Findings & Conclusions ........................................................................................................................... 407
Customer Satisfaction ............................................................................................................................... 408
Contact Center and Field Service ........................................................................................................... 411
Revenue Operations ................................................................................................................................. 419
Economic Development .......................................................................................................................... 430
C. Recommendations ..................................................................................................................................... 430

viii Final Report
6/20/2011
Table of Contents (continued)
XI. CLEAN ENERGY ................................................................................................................ 433
A. Background ................................................................................................................................................. 433
Program Funding ....................................................................................................................................... 434
Utility Managed and Administered Programs........................................................................................ 435
New Jersey Comfort Partners Program ............................................................................................ 435
CleanPower Choice Program ............................................................................................................. 436
B. Findings & Conclusions ............................................................................................................................ 437
C. Recommendations ...................................................................................................................................... 439
XII. SUPPORT SERVICES ........................................................................................................ 441
A. Risk Management ....................................................................................................................................... 441
Background & Perspective ....................................................................................................................... 441
Enterprise Risk Management – Integrated Framework.................................................................. 441
Organization and Staffing ................................................................................................................... 442
Corporate Risk ...................................................................................................................................... 444
Insurance ............................................................................................................................................... 445
Findings & Conclusions ............................................................................................................................ 448
Recommendations ..................................................................................................................................... 449
B. Legal Services .............................................................................................................................................. 451
Background & Perspective ....................................................................................................................... 451
Organization and Staffing ................................................................................................................... 451
Operating Expenses ............................................................................................................................. 459
Findings & Conclusions ............................................................................................................................ 462
Law ......................................................................................................................................................... 462
Claims ..................................................................................................................................................... 465
Recommendations ..................................................................................................................................... 467
C. Facilities and Property Management ....................................................................................................... 469
Background and Perspective .................................................................................................................... 469
Organization and Staffing ................................................................................................................... 469

Final Report ix
6/20/2011
Table of Contents (continued)
Budgeted and Actual expenses .......................................................................................................... 471
Major JCP&L facilities, changes, and reporting. ............................................................................. 472
Maintenance and Repair ..................................................................................................................... 473
Findings and Conclusions ........................................................................................................................ 474
Recommendations .................................................................................................................................... 475
D. Supply Chain .............................................................................................................................................. 476
Background & Perspective ...................................................................................................................... 476
FE Supply Chain .................................................................................................................................. 476
JCP&L Stores ....................................................................................................................................... 480
Findings & Conclusions ........................................................................................................................... 480
Recommendations .................................................................................................................................... 484
E. Fleet Management ..................................................................................................................................... 487
Background & Perspective ...................................................................................................................... 487
Findings & Conclusions ........................................................................................................................... 493
Recommendations .................................................................................................................................... 501
F. Information Technology........................................................................................................................... 503
Background & Perspective ...................................................................................................................... 503
Mission, Goals, and Objectives ......................................................................................................... 503
Organization and Staffing .................................................................................................................. 504
Other Processes and Systems ............................................................................................................ 512
Staffing Levels ...................................................................................................................................... 515
IT Configuration .................................................................................................................................. 515
Operating Expenses and Capital Expenditures .............................................................................. 515
Findings & Conclusions ........................................................................................................................... 518
Recommendations .................................................................................................................................... 529
G. Records Management ............................................................................................................................... 532
Background & Perspective ...................................................................................................................... 532
Organization and Staffing .................................................................................................................. 532
Other Major Processes and Systems ................................................................................................. 537

x Final Report
6/20/2011
Table of Contents (continued)
Findings & Conclusions ............................................................................................................................ 538
Recommendations ..................................................................................................................................... 539

Final Report xi
6/20/2011
Table of Exhibits
I. INTRODUCTION ...................................................................................................................... 1
Exhibit I-1 Summary of Priority Totals ........................................................................................................... 2
Exhibit I-2 JCP&L Key 2009 Financials as of December 31, 2009........................................................... 10
Exhibit I-3 FirstEnergy Key 2009 Financials as of December 31, 2009 ................................................... 12
Exhibit I-4 Total Plant in Service & Growth by Year 2005 to 2009 ......................................................... 13
Exhibit I-5 Total Operating Revenue 2005 to 2009..................................................................................... 14
Exhibit I-6 Sales by Volume (MWh) 2005 to 2009 ...................................................................................... 15
Exhibit I-7 MWh as Reported 2005 to 2009 ................................................................................................. 16
Exhibit I-8 JCP&L Employees (End of Year) 2005 to 2009 ...................................................................... 17
Exhibit I-9 Operating & Maintenance Expenses 2005 to 2009 ................................................................. 18
Exhibit I-10 Performance Ratios 2005 to 2009 ............................................................................................ 19
Exhibit I-13 Performance Ratios 2005 to 2009 (continued) ....................................................................... 20
II. REVIEW OF PROCUREMENT ACTIVITIES (ENPRO) .................................................. 21
Exhibit II-1 JCP&L BGS Demand and Energy Requirements 2005 to 2009 .......................... 22
Exhibit II-2 Regulated Commodity Sourcing Organization as of June 30, 2010 ..................... 22
Exhibit II-3 BGS Auction Process ................................................................................................. 24
Exhibit II-4 JCP&L BGS Results 2008 to 2010 ........................................................................... 26
Exhibit II-5 BGS Pricing Results–FP 2006 to 2010 .................................................................... 27
Exhibit II-6 BGS Pricing Results–CIEP 2007 to 2010 ................................................................ 27
Exhibit II-7 RS Rates Changes 2006 to 2010 ................................................................................ 28
Exhibit II-8 Capacity and Energy Perspective as of June 30, 2010 ........................................... 30
Exhibit II-9 JCP&L NUG Resources as of June 30, 2010 .......................................................... 32
Exhibit II-10 NUG MW Commitment as of June 30, 2010 ......................................................... 33
Exhibit II-11 NUG Costs 2006 to 2009 .......................................................................................... 34
Exhibit II-12 NUG Energy 2006 to 2009 ........................................................................................ 35
Exhibit II-13 NUG Payments and Revenue as of December 31, 2009 ...................................... 38
III. AFFILIATED RELATIONSHIPS AND AFFILIATE ALLOCATION METHODOGIES .................................................................................................................... 41
Exhibit III-1 FirstEnergy Organization as of June 30, 2010 ........................................................ 42
Exhibit III-2 Service Transactions from Affiliates to JCP&L 2005 to 2009 .............................. 43

xii Final Report
6/20/2011
Table of Exhibits (continued)
Exhibit III-3 Service Transactions from Affiliates to JCP&L by Company and by Billing Type 2005 to 2009 .......................................................................................... 44
Exhibit III-4 Service Transactions from JCP&L to Affiliates 2005 to 2009 ............................. 46
Exhibit III-5 Service Transactions from JCP&L to Affiliates by Company and by Billing Type 2005 to 2009 ....................................................................................................... 47
Exhibit III-6 Employee Transfers between JCP&L and Affiliates by Year 2005 to 2010 (Through August 31, 2010) ........................................................................................ 48
Exhibit III-7 FTS/Diamond Revenues Paid to JCP&L 2005 to 2009 ....................................... 53
Exhibit III-8 Yearly JCP&L Dividend Payments to FE 2005 to 2009 ....................................... 57
Exhibit III-9 Service Company Operating Expenses per Employee FE Compared to Other Utility Service Company Organizations 2008 ............................................. 63
Exhibit III-10 Service Company Operating Expenses per Customer FE Compared to Other Utility Service Company Organizations 2008 ............................................. 64
Exhibit III-11 SERVECO to JCP&L Charges Direct Charges versus Allocations 2005 to 2009 ................................................................................................................. 67
Exhibit III-12 Costs Charged Exclusively to FE Parent Company as of December 31, 2010 ..................................................................................................... 68
Exhibit III-13 CAM Rearrangement Recommendations Made by Business Analytics Group as of September 2010.................................................................................................. 71
Exhibit III-14 FirstEnergy Flight Operations Department as of December 31, 2010 ............... 76
Exhibit III-15 FirstEnergy Aircraft as of December 31, 2010 ....................................................... 76
Exhibit III-16 FirstEnergy Aircraft Utilization (Flight Hours) as of December 31, 2010 ........ 78
Exhibit III-17 Aircraft Costs 2007 to 2010 (September YTD) ...................................................... 79
Exhibit III-18 JCP&L Flight Operations Costs 2007 to 2010 (September YTD) ...................... 79
Exhibit III-19 JCP&L Flight Operations Costs Direct Versus Allocated Charges 2007 to 2010 ................................................................................................................. 80
IV. MARKET CONDITIONS ...................................................................................................... 83
Exhibit IV-1 FEU Supplier Services Organizational Structure as of July 8, 2010 .................... 84
Exhibit IV-2 Active JCP&L Territory Third-Party Suppliers as of September 28, 2010 ......... 86
Exhibit IV-3 Active Third-Party Suppliers in the FEU Territories in Ohio, Pennsylvania, and New Jersey as of August 31, 2010 ..................................................................... 87
Exhibit IV-4 FirstEnergy Shopping Statistics by State 2005 to 2010 ......................................... 88

Final Report xiii
6/20/2011
Table of Exhibits (continued)
Exhibit IV-5 2009 FEU States’ Shopping Customers and Load as of December 31, 2009 .... 89
V. REVIEW OF PRIOR AUDIT RECOMMENDATIONS ....................................................... 91
Exhibit V-1 Competitive Services Audit History 2002 to 2006 ................................................. 92
Exhibit V-2 Competitive Services Audit Report Recommendations as of June 30, 2010 Page 1 of 3 .................................................................................................................... 93
Exhibit V-2 Competitive Services Audit Report Recommendations as of June 30, 2010 Page 2 of 3 .................................................................................................................... 94
Exhibit V-2 Competitive Services Audit Report Recommendations as of June 30, 2010 Page 3 of 3 .................................................................................................................... 95
Exhibit V-3 System Reliability Audits History 2003 to 2004 ...................................................... 96
Exhibit V-4 Memorandum of Understanding Commitments as of December 31, 2008 Page 1 of 6 ................................................................................ 97
Exhibit V-4 Memorandum of Understanding Commitments as of December 31, 2008 Page 2 of 6 .................................................................................................................... 98
Exhibit V-4 Memorandum of Understanding Commitments as of December 31, 2008 Page 3 of 6 .................................................................................................................... 99
Exhibit V-4 Memorandum of Understanding Commitments as of December 31, 2008 Page 4 of 6 ................................................................................................................. 100
Exhibit V-4 Memorandum of Understanding Commitments as of December 31, 2008 Page 5 of 6 ................................................................................................................. 101
Exhibit V-4 Memorandum of Understanding Commitments as of December 31, 2008 Page 6 of 6 ................................................................................................................. 102
Exhibit V-5 Stipulation of Settlement Commitments as of December 31, 2008 Page 1 of 4 ................................................................................................................. 103
Exhibit V-5 Stipulation of Settlement Commitments as of December 31, 2008 Page 2 of 4 ................................................................................................................. 104
Exhibit V-5 Stipulation of Settlement Commitments as of December 31, 2008 Page 3 of 4 ................................................................................................................. 105
Exhibit V-5 Stipulation of Settlement Commitments as of December 31, 2008 Page 4 of 4 ................................................................................................................. 106
Exhibit V-6 Memo of Understanding & Stipulation of Settlement Implementation Table 2003 to 2010 ................................................................................................... 107
Exhibit V-7 Distribution Circuit Design Criteria ...................................................................... 109

xiv Final Report
6/20/2011
Table of Exhibits (continued)
Exhibit V-8 Circuit Diagram Legend ........................................................................................... 110
Exhibit V-9 13 kV Distribution Circuit ....................................................................................... 111
Exhibit V-10 34 kV Distribution Circuit ....................................................................................... 111
VI. REMEDIATION COSTS ...................................................................................................... 113
Exhibit VI-1 JCP&L Remediation Sites as of December 31, 2009 ........................................... 114
Exhibit VI-2 JCP&L Environmental Organization as of June 30, 2010 .................................. 115
Exhibit VI-3 Remediation Status as of April 30, 2010 ................................................................ 117
Exhibit VI-4 Total Remediation Cost Estimates - Past and Future 2005 to 2010 ................. 118
VII. EXECUTIVE MANAGEMENT AND CORPORATE GOVERNANCE ........................ 123
Exhibit VII-1 FirstEnergy Organization as of June 30, 2010 ...................................................... 124
Exhibit VII-2 FirstEnergy Utilities Organization as of June 30, 2010 ...................................... 125
Exhibit VII-3 Jersey Central Power & Light Organization as of June 30, 2010 ...................... 126
Exhibit VII-4 JCP&L Human Resources Organization as of July 31, 2010.............................. 145
Exhibit VII-5 FirstEnergy Human Resources Organization as of July 31, 2010 ...................... 147
Exhibit VII-6 Average Annual Training Spending (Actual) Per Employee 2005 to 2009 ..... 152
Exhibit VII-7 OSHA Incident Rate 2005 to 2010 ........................................................................ 161
Exhibit VII-8 FirstEnergy OSHA Incident Rate Compared to EEI Benchmarks 2005 to 2009 ............................................................................................................... 161
Exhibit VII-9 Lost-Time Rate 2005 to 2010 .................................................................................. 162
Exhibit VII-10 FirstEnergy Lost-Time Rate Compared to EEI Benchmarks 2005 to 2009 .... 162
Exhibit VII-11 DART Rate 2005 to 2010 ........................................................................................ 163
Exhibit VII-12 FirstEnergy DART Rate Compared to EEI Benchmarks 2005 to 2009 .......... 163
Exhibit VII-13 Motor Vehicle Incident Rate 2005 to 2010 ........................................................... 164
Exhibit VII-14 Diversity Composition of JCP&L Employees by EEO Category as of September 5, 2009 ..................................................................................................... 166
Exhibit VII-15 Workforce Utilization as of July 1, 2009 ................................................................ 168
Exhibit VII-16 Female and Minority Representation 2005 to 2009 ............................................. 169
Exhibit VII-17 External Employment Complaints and Court Filings 2005 to 2009 ................. 171
Exhibit VII-18 JCP&L Safety Statistics Compared to FE 2005 to 2009 ..................................... 174
Exhibit VII-19 Minority and Female Results for PSI 2006 to 2010 ............................................. 177

Final Report xv
6/20/2011
Table of Exhibits (continued)
Exhibit VII-20 IBEW SCU-3 Grievances 2005 to 2009 ............................................................... 179
Exhibit VII-21 External Relations Organization as of June 30, 2010 ......................................... 185
VIII. FINANCE AND ACCOUNTING .................................................................................... 193
Exhibit VIII-1 Finance Organizations as of June 30, 2010 .......................................................... 194
Exhibit VIII-2 JCP&L Long-Term Debt & Equity 2005 to 2009 ............................................... 195
Exhibit VIII-3 JCP&L Credit Ratings 2005 to 2009...................................................................... 197
Exhibit VIII-4 Equivalent Credit Ratings 2005 to 2009 ............................................................... 197
Exhibit VIII-5 Peer Comparison Average of Three Years 2007 to 2009 ................................... 199
Exhibit VIII-6 Nuclear Decommissioning Trusts as of December 31, 2009 ............................ 202
Exhibit VIII-7 NDT Eligible Investments as of December 31, 2009 ........................................ 204
Exhibit VIII-8 Pension and OPEB Investments as of December 31, 2009 .............................. 206
Exhibit VIII-9 Cash Management Organizations as of June 30, 2010 ....................................... 211
Exhibit VIII-10 Cash Management Flow Diagram as of June 30, 2010 ....................................... 213
Exhibit VIII-11 Payment Approval Levels as of December 31, 2009 .......................................... 214
Exhibit VIII-12 Cash and Cash Equivalents 2005 to 2009 ............................................................. 215
Exhibit VIII-13 Utility Money Pool Monthly Balances Outstanding January 31, 2008 to June 30, 2010 .............................................................................................. 218
Exhibit VIII-14 Financial Performance Measurements 2005 to 2009 .......................................... 219
Exhibit VIII-15 Net Write-Offs of Customer Accounts (Thousands of Dollars) 2005 to 2009 .............................................................................................................. 220
Exhibit VIII-16 Weighted Average Cost of Capital 2005 to 2009 ................................................. 221
Exhibit VIII-17 Long-Term Debt and Equity Percentages 2005 to 2009 .................................... 221
Exhibit VIII-18 Finance Organizations as of June 30, 2010 .......................................................... 227
Exhibit VIII-19 FE Invoice Processing Statistics as of June 30, 2010 .......................................... 230
Exhibit VIII-21 Typical Budget Schedule as of June 30, 2010 ....................................................... 237
Exhibit VIII-22 Budget and Forecast Process as of June 30, 2010 ............................................... 238
Exhibit VIII-23 JCP&L O&M Budget Variances 2005 to 2009 ($ Millions) ............................... 240
Exhibit VIII-24 Governing Approval Amounts as of June 30, 2010 ............................................ 241
Exhibit VIII-25 JCP&L Capital Expenditures’ Budget Variance 2005 to 2009 ($ Million) ....... 242
Exhibit VIII-26 Asset Values Not Unitized as of December 31, 2009 ......................................... 245
Exhibit VIII-27 Internal Audit Professional Certifications as of December 31, 2009 ............... 248
xvi Final Report
6/20/2011
Table of Exhibits (continued)
Exhibit VIII-28 Audit Reports Issued 2005 to 2009 ........................................................................ 251
Exhibit VIII-29 Performance Metrics Summary 2009 ..................................................................... 252
IX. ELECTRIC OPERATIONS ................................................................................................ 259
Exhibit IX-1 Jersey Central Power & Light New Jersey Service Territories as of July 2010 ................................................................................................................ 260
Exhibit IX-2 Typical Electric Supply System 2010 ...................................................................... 261
Exhibit IX-3 Typical Transmission Structures 2010 ................................................................... 261
Exhibit IX-4 Energy Flow Through a Typical Substation 2010 ................................................ 262
Exhibit IX-5 Major Components of a Typical Substation 2010 ................................................ 262
Exhibit IX-6 Typical Distribution Equipment 2010 ................................................................... 263
Exhibit IX-7 Jersey Central Power & Light T&D Organization as of June 30, 2010 ........... 264
Exhibit IX-8 Jersey Central Power & Light Engineering, Transmission, Distribution, and Claims Organization as of June 30, 2010 ....................................................... 265
Exhibit IX-9 Jersey Central Power & Light RDO and Substation Organization as of June 30, 2010 ......................................................................................................... 266
Exhibit IX-10 Jersey Central Power & Light Fleet, Stores, Facilities, Meter Services, and Forestry Organization as of June 30, 2010 ............................................................ 267
Exhibit IX-11 FirstEnergy Utilities’ T&D Organization as of June 30, 2010 ........................... 268
Exhibit IX-12 FirstEnergy Utilities’ Operations Organization as of June 30, 2010 ................. 269
Exhibit IX-13 FirstEnergy Utilities’ Support Organization as of June 30, 2010 ....................... 270
Exhibit IX-14 2010 FE Utilities’ KPI Goals January, 2010.......................................................... 273
Exhibit IX-15 Table of Contents from the 2009 JCP&L Annual System Performance Report June 2010 ....................................................................................................... 274
Exhibit IX-16 Example JCP&L Monthly Performance Report May 2010 ................................ 275
Exhibit IX-17 Information Technology Applications Used For Asset Management Activities July 2010 .................................................................................................... 279
Exhibit IX-18 Information Technology Applications Used For Asset Management Activities July 2010 .................................................................................................... 280
Exhibit IX-19 JCP&L Storm Categories July 2010 ........................................................................ 285
Exhibit IX-20 Major Storm Activity 2005 to 2009 as of December 31, 2009 ........................... 286
Exhibit IX-21 Operations and Maintenance Support Applications July 2010 .......................... 288
Exhibit IX-22 Operations and Maintenance Support Applications July 2010 .......................... 289

Final Report xvii
6/20/2011
Table of Exhibits (continued)
Exhibit IX-23 Operations and Maintenance Support Applications July 2010 .......................... 290
Exhibit IX-24 JCP&L Service Territory Statistics 2005 to 2009 ................................................. 291
Exhibit IX-25 Capital Program Support Applications July 2010 ................................................ 295
Exhibit IX-26 Capital Program Support Applications July 2010 ................................................ 296
Exhibit IX-27 Capital Program Support Applications July 2010 ................................................ 297
Exhibit IX-28 Capital Program Support Applications July 2010 ................................................ 298
Exhibit IX-29 Generic Work Management System 2010 ............................................................ 299
Exhibit IX-30 JCP&L Work Management System 2010 .............................................................. 300
Exhibit IX-31 Jersey Central Power & Light T&D Staffing Trends 2005 to 2009 .................. 301
Exhibit IX-32 Jersey Central Power & Light SAIFI 2005 to 2009 ............................................. 302
Exhibit IX-33 JCP&L Distribution, Substation, Sub-Transmission, and Transmission SAIFI 2005 to 2009 .................................................................................................. 303
Exhibit IX-34 JCP&L Power Quality (PQ) Complaints 2005 to 2009 ...................................... 303
Exhibit IX-35 Jersey Central Power & Light Neutral-to-Earth/Stray-Voltage Complaints 2005 to 2009 ........................................................................................ 304
Exhibit IX-36 JCP&L Adaptive Relaying 2005 to 2009 ............................................................... 304
Exhibit IX-37 Jersey Central Power & Light CAIDI and SAIDI 2005 to 2009 ...................... 305
Exhibit IX-38 Customers Experiencing Interruptions 2005 to 2009 ......................................... 306
Exhibit IX-39 Percent of Customers Experiencing Multiple Interruptions 2005 to 2009 ..... 307
Exhibit IX-40 Jersey Central Power & Light Transmission Outage Frequency (TOF) 2008 to 2009 .............................................................................................................. 308
Exhibit IX-41 JCP&L Estimated Time of Restoration (ETR) 2007 to 2009............................ 308
Exhibit IX-42 JCP&L Outage Causes 2005 to 2009 .................................................................... 309
Exhibit IX-43 Distribution Miles Trimmed Earlier and Later Than Four-Year Cycle 2009 .. 310
Exhibit IX-44 JCP&L Customer Hours of Outages by Equipment Causes 2009 ................... 311
Exhibit IX-45 Energy Losses Unaccounted For 2005 to 2009 ................................................... 312
Exhibit IX-46 Transmission Expense per Mile of Transmission 2005 to 2009 ....................... 313
Exhibit IX-47 Distribution Expense per Circuit Mile of Distribution 2005 to 2009 .............. 314
Exhibit IX-48 Net Utility Plant in Service per Customer 2005 to 2009 .................................... 315
Exhibit IX-49 Gross Additions to Utility Plant (Less Nuclear Fuel) 2005 to 2009 ................. 316
Exhibit IX-50 JCP&L T&D Capital Expenditures 2005 to 2009 ............................................... 317
Exhibit IX-51 Jersey Central Power & Light Capital Program 2007 to 2010 ........................... 318

xviii Final Report
6/20/2011
Table of Exhibits (continued)
Exhibit IX-52 JCP&L T&D Operations and Maintenance Expenses 2005 to 2009 ................ 319
Exhibit IX-53 Actual Variance from Estimated Project Costs 2007 to 2009 ............................ 320
Exhibit IX-54 Deviation of Actual from Scheduled Project Completion Dates 2007 to 2009 ............................................................................................................... 321
Exhibit IX-55 JCP&L 2010 Transmission Vegetation Management Award Evaluation as of December 31, 2010.......................................................................................... 323
Exhibit IX-56 Example JCP&L Schedule Adherence Report 2010 ............................................ 326
Exhibit IX-57 JCP&L Distribution Circuit and Pole Inspections 2005 to 2009 ....................... 328
Exhibit IX-58 JCP&L Transmission Aerial and Ground-Line Inspections 2005 to 2009 ....... 329
Exhibit IX-59 JCP&L Substation Inspections 2005 to 2009 ....................................................... 330
Exhibit IX-60 JCP&L High-Priority Repeating Circuits 2005 to 2009 ....................................... 331
Exhibit IX-61 JCP&L Staffing Trends 2005–2009 ........................................................................ 334
Exhibit IX-62 Jersey Central Power & Light T&D Applications July 2010 .............................. 335
Exhibit IX-63 JCP&L Radio Upgrade Initiative 2010 ................................................................... 336
Exhibit IX-64 Work Management Initiative Scope 2010 .............................................................. 336
Exhibit IX-65 Applications Integration Diagram for the Work Management Initiative 2010 ............................................................................................................ 337
Exhibit IX-66 Projected JCP&L Payback Period for the Work Management Initiative 2010 ............................................................................................................ 337
Exhibit IX-67 Distribution Circuit Design Criteria ....................................................................... 342
Exhibit IX-68 Circuit Diagram Legend ........................................................................................... 343
Exhibit IX-69 13 kV Distribution Circuit ....................................................................................... 344
Exhibit IX-70 34 kV Distribution Circuit ....................................................................................... 344
Exhibit IX-71 BPU Proposed Rules Governing Smart Growth Policy 2004 ............................ 346
Exhibit IX-72 BPU-Adopted Rules Governing Smart Growth Policy 2004 ............................. 347
Exhibit IX-73 BPU Secretary's Letter Addressing Court Case Concerning Growth Policy as of March 24, 2010 ................................................................................................. 348
Exhibit IX-74 JCP&L Employees Responsible for Application of the Smart Growth Rules as of July 2010 ............................................................................................................ 349
Exhibit IX-75 Jersey Central Power & Light Work Management Process July 2010 ............... 350
Exhibit IX-76 CREWS Smart Growth Requirements July 2010 ................................................. 351
Exhibit IX-77 CREWS Smart Growth Determination as of July 2010 ...................................... 352

Final Report xix
6/20/2011
Table of Exhibits (continued)
Exhibit IX-78 CREWS’ Smart Growth Billing for Designated Growth Areas as of July 2010 ............................................................................................................... 353
Exhibit IX-79 CREWS Smart Growth Billing for Designated Non-Growth Areas as of July 2010 ............................................................................................................... 354
Exhibit IX-80 CREWSDOC Smart Growth Contract Creation Procedures as of July 2010 ............................................................................................................... 355
Exhibit IX-81 CREWS Smart Growth Charge Category July 2010 ........................................... 356
Exhibit IX-82 State of New Jersey Economic Indicators 2003 to 2009 .................................... 358
Exhibit IX-83 Monthly CIAC + DEP Dollars Collected for New Extensions January 2004 to March 2010 ................................................................................................. 359
Exhibit IX-84 Annual CIAC + DEP Dollars Collected for Non-Growth and Growth New Extension Jobs January 2004 to March 2010 ............................................. 360
Exhibit IX-85 Annual Refundable Deposit Dollars Collected for New Extensions 2004 to 2009 .............................................................................................................. 361
Exhibit IX-86 Job Scope for New Extension Jobs 2003 to 2009 ............................................... 362
Exhibit IX-87 Monthly CIAC + DEP Dollars Collected for JCP&L Upgrade Jobs January 2004 to March 2010 ................................................................................................. 363
Exhibit IX-88 DEP as Percent of DEP + CIAC for Upgrade Jobs in Non-Growth and Growth Areas 2005 to 2009 ................................................................................... 364
Exhibit IX-89 Upgrade Job Scope for Growth and Non-Growth Areas 2005 to 2009 ......... 365
Exhibit IX-90 Table of Contents from BPU One-Call Damage Prevention System as of July 2010 ............................................................................................................... 367
Exhibit IX-91 JCP&L Underground Locates Organization as of July 2010 ............................. 368
Exhibit IX-92 JCP&L Underground Locates Process as of July 2010 ...................................... 369
Exhibit IX-93 General Conditions Section from JCP&L Specifications for Contract Locating as of December 31, 2008 ........................................................................ 370
Exhibit IX-94 JCP&L Underground Locates Activity January 2005 to April 2010 ................. 371
Exhibit IX-95 Jersey Central Power & Light Contract Cost per Underground Locate Ticket 2005 to 2009 .................................................................................................. 372
Exhibit IX-96 Jersey Central Power and Light Avoided Cost of Screened Locate Ticket 2005 to 2009 .............................................................................................................. 373
Exhibit IX-97 Example Daily Performance Metrics Used for JCP&L Locates Contractor as of July 2010 ........................................................................................................... 373

xx Final Report
6/20/2011
Table of Exhibits (continued)
Exhibit IX-98 Monthly Performance Metrics Used for JCP&L Locates Contractor as of October 2010 ............................................................................................................. 374
Exhibit IX-99 Percent of Total Locates Completed on Time January 2009 – April 2010 ...... 375
Exhibit IX-100 Jersey Central Power and Light Dig-in Claims 2004 to 2008 ............................. 376
Exhibit IX-101 Header from 2006 Audit of JCP&L Locates Contractor as of July 2010 ......... 377
Exhibit IX-102 Deliverables from FirstEnergy Team Formed to Develop Field Coordinator Reference Guide as of July 2010 ...................................................... 378
Exhibit IX-103 Organizations Responsible for Monitoring of JCP&L Contractor Performance as of July 2010 .................................................................................... 379
Exhibit IX-104 Criteria Used to Determine Whether Project Performed In-House or Via Contract as of July 2010 ........................................................................................... 380
Exhibit IX-105 Table of Contents from FirstEnergy Field Coordinator Reference Guide as of July 2010 ............................................................................................................ 381
Exhibit IX-106 Summary of Roles and Responsibilities of JCP&L / FE Field Coordinators as of July 2010........................................................................................................... 381
Exhibit IX-107 Application of Field Coordinator Methods to In-House Projects as of July 2010 ................................................................................................................ 382
Exhibit IX-108 Distribution, Transmission and Substation Contract Labor March, 2005 to December, 2009 ........................................................................................................ 382
Exhibit IX-109 Overview of JCP&L Project Monitoring as of July 2010 .................................... 383
Exhibit IX-110 Portion of Typical "Earned Value" Schedule as of July 2010............................. 384
Exhibit IX-111 Portion of Typical Primavera Schedule as of July 2010 ...................................... 384
Exhibit IX-112 Select Extract from Contractor Evaluation Form July 2010 .............................. 385
Exhibit IX-113 Rating Criteria Used for Contractor Evaluation Form as of July 2010 ............. 386
X. CUSTOMER SERVICE ......................................................................................................... 387
Exhibit X-1 Customer Numbers 2005 to 2009 .......................................................................... 387
Exhibit X-2 Sales by Volume by Customer Class 2005 to 2009 .............................................. 388
Exhibit X-3 Customer Service & Energy Efficiency Organization as of June 30, 2010 ...... 389
Exhibit X-4 JCP&L Recent Customer Service Organizational Changes August 29, 2010 .. 390
Exhibit X-5 JCP&L Customer Service Organization as of August 30, 2010 ......................... 390
Exhibit X-6 Sample CustomerFirst Scorecard as of April 30, 2010 ....................................... 391

Final Report xxi
6/20/2011
Table of Exhibits (continued)
Exhibit X-7 Typical Residential Service (RS Rate) Summer Bill Changes Non-Shopper at 952 kWh per Month 2005 to 2009 .................................................................... 392
Exhibit X-8 Typical Residential Service (RS Rate) Summer Bill Changes RS Summary 2005 to 2009 .............................................................................................................. 394
Exhibit X-9 Low-Income Assistance Program and Participation Rates 2005 to 2009 ........ 396
Exhibit X-10 Formal BPU Complaint Trends 2005 to 2009 ..................................................... 398
Exhibit X-11 Inbound and Outbound Call Volume 2005 to 2009 ........................................... 399
Exhibit X-12 Staffing – Contact Center/CSR Turnover Rates 2005 to 2009 ......................... 400
Exhibit X-13 Meter Replacement 2005 to 2009 .......................................................................... 405
Exhibit X-14 Economic Development 2005 to 2009 ................................................................. 407
Exhibit X-15 Customer Service Costs per Customer 2005 to 2009 ......................................... 408
Exhibit X-16 J.D. Power and Associates 2009 Electric Utility Residential Customer Satisfaction StudySM Customer Satisfaction Index Ranking – East Region: Large Segment ........................................................................................................... 409
Exhibit X-17 Complaints 2005 to 2009 ........................................................................................ 410
Exhibit X-18 Billing Disputes 2005 to 2009 ................................................................................. 411
Exhibit X-19 New Jersey Regulatory Customer Service Standards Reported 2005 to 2009 . 412
Exhibit X-20 Call Trends by Operating Company – ASA 2005 to 2009 ................................. 413
Exhibit X-21 Call Trends by Operating Company – AHT 2005 to 2009 ................................ 414
Exhibit X-22 Percent Calls Answered Trend 2005 to 2009 ....................................................... 415
Exhibit X-23 Call Volume/Self-Service Trends 2005 to 2009 .................................................. 416
Exhibit X-24 Service Call Trends 2005 to 2009........................................................................... 417
Exhibit X-25 Customer First Field Service Tracking Report – Overall Issue Resolution 2005 to 2009 .......................................................................................... 418
Exhibit X-26 2009 Monthly Service Calls Completed as of December 31, 2009 ................... 418
Exhibit X-27 Average Response Time by Service Request in Days & Total Requests 2005 to 2009 .............................................................................................................. 419
Exhibit X-28 Meters Not Read 2005 to 2009 .............................................................................. 420
Exhibit X-29 Meter-Reading Error Rate 2005 to 2009............................................................... 421
Exhibit X-30 Billing Exception Rates Trend 2005 to 2009 ....................................................... 422
Exhibit X-31 Theft of Service 2005 to 2009 ................................................................................ 423
Exhibit X-32 Mail vs. Electronic Volumes History 2005 to 2015 as of April 2010 ............... 424

xxii Final Report
6/20/2011
Table of Exhibits (continued)
Exhibit X-33 Net Write-Offs 2005 to 2009 .................................................................................. 425
Exhibit X-34 Accounts Receivable Aging 2005 to 2009 ............................................................. 426
Exhibit X-35 Customers in Arrears 2005 to 2009 ........................................................................ 427
Exhibit X-36 Customers Terminated for Non-Payment 2005 to 2009 .................................... 428
Exhibit X-37 Collection Agencies – Collected Year-to-Date 2006 to 2009 ............................. 429
Exhibit X-38 Customer Service Performance Levels Achieved Previously as of December 31, 2009 ................................................................................................... 430
XI. CLEAN ENERGY ................................................................................................................ 433
Exhibit XI-1 Comfort Partners Program Spending Levels as of April 21, 2010 .................... 438
Exhibit XI-2 Comfort Partners Program Spending Levels as of August 18, 2010 ................. 438
Exhibit XI-3 Comfort Partners Program Spending Levels Compared to Original as of December 31, 2010 ................................................................................................... 439
XII. SUPPORT SERVICES ........................................................................................................ 441
Exhibit XII-1 Risk Management and Claims Organization ......................................................... 443
Exhibit XII-2 Risk Management Expenses – Five Year............................................................... 444
Exhibit XII-3 Insurance Premium Expenses 2005 to 2009 ......................................................... 445
Exhibit XII-4 Total Claims for JCP&L 2005 to 2009 ................................................................... 447
Exhibit XII-5 JCP&L Claims against Other Parties 2005 to 2009.............................................. 447
Exhibit XII-6 SERVECO Legal Organization as of June 30, 2010 ............................................ 451
Exhibit XII-7 Use of External Counsel Firms by JCP&L as of June 30, 2010 ......................... 453
Exhibit XII-8 JCP&L Legal Cases 2005 to 2010 (Through July 6, 2010) .................................. 458
Exhibit XII-9 JCP&L Receivable Claims 2005 to 2010 (Through July 6, 2010)....................... 459
Exhibit XII-10 JCP&L Legal Expenses 2005 to 2009 .................................................................... 460
Exhibit XII-11 JCP&L Off-Budget Legal Expenses 2005 to 2009 .............................................. 461
Exhibit XII-12 2009 Legal Client Satisfaction Survey .................................................................... 463
Exhibit XII-13 2009 Outside Legal Firm Survey ............................................................................. 464
Exhibit XII-14 Real Estate and Facilities Organization 2006 to 2010 as of December 31, 2010 ................................................................................................... 470
Exhibit XII-15 JCP&L Facilities/Property Management Capital & O & M Expenses 2005 to 2009 ............................................................................................................... 471

Final Report xxiii
6/20/2011
Table of Exhibits (continued)
Exhibit XII-16 Facility Inventory (Owned and Leased) as of December 31, 2009 ................... 472
Exhibit XII-17 Supply Chain as of July 8, 2010 .............................................................................. 476
Exhibit XII-18 Procurement Authority Limits as of December 31, 2010 .................................. 479
Exhibit XII-19 Support Services as of July 8, 2010 ........................................................................ 480
Exhibit XII-20 JCP&L Inventory Metrics 2005 to 2009 ............................................................... 482
Exhibit XII-21 Supply Chain Utility Support Staffing 2005 to 2009 ........................................... 483
Exhibit XII-22 FEU Fleet Services as of December 31, 2009 ...................................................... 488
Exhibit XII-23 Operations Support Services as of December 31, 2009 ..................................... 489
Exhibit XII-24 JCP&L Fleet Services Employees by Classification 2005 to 2009 .................... 490
Exhibit XII-25 JCP&L Fleet Trends by Asset Class 2005 to 2009 .............................................. 490
Exhibit XII-26 FEU Asset Class Definitions as of December 31, 2009 ..................................... 491
Exhibit XII-27 Fleet Services O&M costs 2005 to 2009 ............................................................... 492
Exhibit XII-28 FEU Fleet Availability as of December 31, 2009 ................................................ 493
Exhibit XII-29 JCP&L Fleet Costs per Unit and per MRF 2005 to 2009 ................................. 494
Exhibit XII-30 Fleet Services Cost Component Trends 2005 to 2009 ....................................... 495
Exhibit XII-31 FE Vehicle Replacement Criteria as of December 31, 2009 .............................. 496
Exhibit XII-32 Average & Quantity as of July 2010 ...................................................................... 498
Exhibit XII-33 Vehicles with Fifty or Fewer Miles of Use as of December 31, 2009 .............. 499
Exhibit XII-34 Hours and Dollars Charged to Vehicle Breakdown in CREWS 2005 to 2009 .............................................................................................................. 500
Exhibit XII-35 VP Shared Services Administration & CIO Organization as of June 30, 2010 ............................................................................................................. 504
Exhibit XII-36 JCP&L Regional Field Operations Organization as of June 30, 2010 .............. 505
Exhibit XII-37 Energy Delivery & Financial Systems (Business Systems) Organization as of June 30, 2010 ................................................................................................... 508
Exhibit XII-39 JCP&L BCP Tests 2009 to 2010 ............................................................................ 512
Exhibit XII-40 IT Staffing Levels by Year 2005 to 2010 .............................................................. 515
Exhibit XII-41 IT Operating Expenses by Year 2005 to 2010 ..................................................... 516
Exhibit XII-42 IT Capital Expenditures by Year 2005 to 2010 ................................................... 517
Exhibit XII-43 % of IT Time by Type of Activity July 2009 to December 2009...................... 520
Exhibit XII-44 Key High-Level IT Performance Metrics 2005 to 2009 ..................................... 523

xxiv Final Report
6/20/2011
Table of Exhibits (continued)
Exhibit XII-45 SERVECO Records & Information Compliance Department as of June 30, 2010 .............................................................................................................. 532
Exhibit XII-46 Percentage of FE and JCP&L Organizational Units Using Records Management Program as of June 30, 2010 ............................................................ 538
Final Report xxv
6/20/2011
Table of Findings
II. REVIEW OF PROCUREMENT ACTIVITIES (ENPRO) ................................................... 21
Finding II-1 The only energy procured outside the BGS process is associated with the St. Lawrence/FDR project, non-utility generators (NUGs), and JCP&L’s portion of the Yards Creek Pumped Storage Station. ........................................... 35
Finding II-2 FirstEnergy (JCP&L) has developed a clear Commodity Risk Management Policy that guides energy procurement within all of FirstEnergy. ....................... 36
Finding II-3 The Regulated Commodity Sourcing unit is responsible for managing the risks associated with the Yards Creek Pumped Storage Station and the NUGs. .................................................................................................................... 37
Finding II-4 Two internal audits of various aspects of JCP&L’s energy procurement activities have been conducted by FE’s Internal Audit organization. ................. 37
Finding II-5 A significant number of dollars are associated with the remaining NUG contracts, although these will be expiring over the next five years. ..................... 37
Finding II-6 JCP&L has been reasonable in its management of the NUGs. ............................ 38
Finding II-7 The Yards Creek Pumping Station is appropriately managed by the JCP&L Commodity Resourcing organization. ...................................................................... 39
Finding II-8 JCP&L energy purchases have been appropriately allocated to customer classes. .......................................................................................................... 39
III. AFFILIATED RELATIONSHIPS AND AFFILIATE ALLOCATION METHODOGIES .................................................................................................................... 41
Finding III-1 FirstEnergy and JCP&L generally met compliance with competitive service statutes and sections of the New Jersey Administrative Code, with the exception of any Phase I findings identified in this report. .................................. 50
Finding III-2 All affiliate arrangements involving JCP&L do not have agreements currently in place.......................................................................................................... 51
Finding III-3 FirstEnergy does not routinely perform studies to determine the cost-competitiveness of corporate functions as compared to outsourcing these functions. ...................................................................................................................... 54
Finding III-4 Although the management of affiliate costs is appropriately located within various groups of the SERVECO financial management function, Sarbanes-Oxley tests in 2008 and 2009 indicated that no formal written process or procedures documentation exists regarding the allocation factor review process. ............................................................................................................. 55
Finding III-5 Employee transfers among JCP&L and its affiliates have generally netted to roughly zero in the last six years................................................................................ 56

xxvi Final Report
6/20/2011
Table of Findings (continued)
Finding III-6 Asset transfers in 2007 to 2010 were generally made to correct asset balances and reserves that had been incorrectly recorded on JCP&L’s books. ........................................................................................................... 56
Finding III-7 The JCP&L organization does not maintain a formal written dividend policy. ............................................................................................................ 56
Finding III-8 Recent comparisons of FERC Form 60 data indicate that SERVECO’s costs are in the middle of the pack with regard to companies submitting such data. ...................................................................................................................... 62
Finding III-9 A limited set of allocation factors has been established and is available for use by the SERVECO organization. ........................................................................ 65
Finding III-10 SERVECO relies upon a reasonable combination of direct charges and allocations for charging affiliates. .............................................................................. 67
Finding III-11 Some of SERVECO’s charges are not charged to FE subsidiaries but remain at the parent company. ............................................................................................... 68
Finding III-12 The Internal Audit organization does not routinely perform cost allocation audits. 69
Finding III-13 A recent review by SERVECO of its cost allocation manual found that several improvements were necessary, but most have not yet been completed. .................................................................................................................... 69
Finding III-14 Merger team activities are being charged to JCP&L. ............................................. 72
Finding III-15 The FE tax-sharing agreement is appropriate. ........................................................ 73
Finding III-16 FirstEnergy has a well-organized Flight Operations Department. ...................... 77
Finding III-17 The utilization of corporate aircraft has dropped significantly over the last three years. .................................................................................................................... 78
Finding III-18 JCP&L has incurred significant charges for flight operations, although JCP&L’s usage has decreased significantly. ............................................................. 78
Finding III-19 Policies and procedures governing the use of corporate aircraft do not specifically address the economic use of corporate aircraft. ................................. 80
IV. MARKET CONDITIONS ...................................................................................................... 83
Finding IV-1 JCP&L has more active third-party suppliers in its New Jersey territory than it does in its FEU Ohio and Pennsylvania operating company territories and that number has been increasing. .............................................................................. 87

Final Report xxvii
6/20/2011
Table of Findings (continued)
Finding IV-2 The number of JCP&L shopping customers has increased dramatically in recent years; however, the amount of shopping kilowatt hours has not increased as much. ....................................................................................................... 88
Finding IV-3 In 2009, JCP&L’s percentage of shopping customers was lower, but its percentage of shopping load was higher than it was in FEU’s Ohio and Pennsylvania territories. .............................................................................................. 89
V. REVIEW OF PRIOR AUDIT RECOMMENDATIONS ....................................................... 91
Finding V-1 JCP&L has implemented the recommendations contained within the Liberty Consulting competitive services audit report. ........................................ 108
Finding V-2 JCP&L has implemented the agreed-to recommendations arising out of the Booth Associates’ review......................................................................................... 108
Finding V-3 JCP&L has implemented the recommendations arising from the PJ Downes interim and final reports, although more could be done. ................... 108
VI. REMEDIATION COSTS ......................................................................................................113
Finding VI-1 JCP&L has created a separate organization that is responsible for managing remediation efforts. .................................................................................................. 116
Finding VI-2 Remediation cost estimates have been increasing. .............................................. 118
Finding VI-3 JCP&L’s management of the remediation programs is reasonable, although improvements are possible...................................................................................... 118
Finding VI-4 Remediation costs are being appropriately handled in JCP&L’s accounting systems. ................................................................................................. 119
Finding VI-5 No external audits of contractors have been performed by JCP&L’s external auditors or internal auditors. ................................................................................... 120
VII. EXECUTIVE MANAGEMENT AND CORPORATE GOVERNANCE ........................ 123
Finding VII-1 In general, the FE/JCP&L organization adequately supports ratepayer and corporate objectives, although there is no formal organizational review and evaluation process. ................................................................................................... 128
Finding VII-2 Administrative controls and procedures are adequate, and procedures are periodically reviewed and improved, if and as necessary.................................... 128

xxviii Final Report
6/20/2011
Table of Findings (continued)
Finding VII-3 The review, selection, and composition of the FirstEnergy and JCP&L Board of Directors are appropriate, although some policies should be updated. ................................................................................................................. 135
Finding VII-4 FirstEnergy has developed a thorough and substantive Code of Ethics. This code could be further communicated to vendors and contractors to assure understanding and alignment. ...................................................................... 137
Finding VII-5 Board compensation is proper and committees are appropriately structured, although committee rotation should be further investigated.............................. 139
Finding VII-6 The Audit Committee and Corporate Governance Committee properly perform their oversight roles for FirstEnergy and Jersey Central Power & Light, although the responsibility for oversight of risk management could be further clarified. ......................................................................................................... 140
Finding VII-7 The relationship between the Board of Directors and Internal Auditing is appropriate, although reporting relationships should be further clarified. ....... 140
Finding VII-8 The Board exerts proper control over external auditors; however, FirstEnergy has no plans to rebid outside audit services. ................................... 141
Finding VII-9 FirstEnergy and Jersey Central Power & Light have adequately complied with Sarbanes-Oxley/NYSE requirements and have established good internal controls, although outside counsel is not required to report wrongdoing up to the Board of Directors. ............................................................ 141
Finding VII-10 SERVECO and JCP&L’s HR roles are appropriately defined and serve the needs to JCP&L. ........................................................................................................ 172
Finding VII-11 JCP&L has a highly effective workforce planning process for replacing workers in key job categories. .................................................................................. 172
Finding VII-12 JCP&L workforce planning does not sufficiently address changes in work and workforce requirements in the future. ............................................................ 173
Finding VII-13 JCP&L’s employee and executive compensation is within acceptable market ranges. ............................................................................................................ 173
Finding VII-14 JCP&L’s employee benefits are comparable to benchmark utilities. ................. 174
Finding VII-15 JCP&L’s safety performance is below that of FE as a whole. ............................ 174
Finding VII-16 JCP&L had an employee fatality in 2009. .............................................................. 174
Finding VII-17 In most job categories, JCP&L’s workforce composition reflects the diversity of the New Jersey labor pool. .................................................................. 176
Finding VII-18 JCP&L has implemented an effective program for attracting and training young people for linemen and substation positions. ........................................... 176
Final Report xxix
6/20/2011
Table of Findings (continued)
Finding VII-19 JCP&L appears to place appropriate emphasis on hiring and promoting minorities, but it could do more to attract women. ............................................ 177
Finding VII-20 JCP&L’s affirmative action plan provides only a limited narrative describing JCP&L’s actions and plans for hiring and promoting women and minorities............................................................................................................ 178
Finding VII-21 The number of Union grievances increased significantly in 2008 and 2009. .. 179
Finding VII-22 JCP&L is improving labor relations. ..................................................................... 179
Finding VII-23 FE/JCP&L has a robust, substantive strategic planning process. .................... 183
Finding VII-24 External relations functions are adequately staffed with capable personnel, but there is no external relations strategy that incorporates and integrates all external relations functions. .................................................................................... 189
Finding VII-25 Public programs are well thought-out but could be expanded. ......................... 189
Finding VII-26 Interfaces with government and regulatory agencies are appropriate, although in some cases, reporting could be more robust. .................................. 190
VIII. FINANCE AND ACCOUNTING .................................................................................... 193
Finding VIII-1 JCP&L’s credit standing and financial performance have not been adversely affected by the financing and debt management practices of FirstEnergy and its affiliates. ........................................................................................................ 207
Finding VIII-2 Credit rating provisions in BGS contracts could impact JCP&L’s liquidity if JCP&L’s ratings were to go below investment grade. ......................................... 207
Finding VIII-3 The tax methodology applied to JCP&L is reasonable, and tax considerations have not played an inappropriate role in JCP&L’s investment decisions. .................................................................................................................... 208
Finding VIII-4 JCP&L’s pension plan is funded appropriately. ................................................... 208
Finding VIII-5 Cash management methodologies are efficient and adequately safeguard JCP&L’s assets. ......................................................................................................... 222
Finding VIII-6 FirstEnergy’s centralized money pool arrangement provides JCP&L with an effective method of managing cash resources on a short-term basis. ......... 222
Finding VIII-7 Approval for JCP&L’s participation in the Utility Money Pool expires at the end of 2011. ............................................................................................................... 222
Finding VIII-8 Cash disbursements are managed in an efficient, cost-effective manner. ........ 222
Finding VIII-9 JCP&L’s financial performance measurements reflect a general improvement in financial condition....................................................................... 223

xxx Final Report
6/20/2011
Table of Findings (continued)
Finding VIII-10 Write-offs did not have a material adverse effect on JCP&L. ............................ 223
Finding VIII-11 JCP&L’s increased cost of capital over the past five years has not negatively affected its financial condition. ............................................................. 223
Finding VIII-12 The accounts payable function is effective and efficient..................................... 253
Finding VIII-13 The process for receiving and securing accounts receivable operates in a safe and efficient manner. ........................................................................................ 253
Finding VIII-14 The payroll function is sufficiently independent and accountable, and payroll processing is achieved effectively and efficiently. ................................... 253
Finding VIII-15 The operating budget process is efficient and effective. ..................................... 253
Finding VIII-16 JCP&L and FirstEnergy Utilities use a different system than the rest of the organization to develop their capital budgets. ................................................ 254
Finding VIII-17 JCP&L’s work order procedures, corporate accounting manual, and property records are maintained in accordance with generally accepted accounting practices. ................................................................................................. 254
Finding VIII-18 JCP&L’s assets are not unitized in a timely manner. ........................................... 255
Finding VIII-19 The Internal Audit function is not independent from FE’s Finance organization. ............................................................................................................... 255
Finding VIII-20 There is adequate planning and coverage of audit activities based on risk management assessment techniques. ...................................................................... 256
Finding VIII-21 The Internal Audit resources appear adequate for the tasks covered. .............. 256
Finding VIII-22 FE’s fraud training program has not been offered to JCP&L employees. ....... 256
IX. ELECTRIC OPERATIONS ................................................................................................ 259
Finding IX-1 There is a generally positive trend in the System Average Interruption Frequency Index (SAIFI) reliability metric, and power quality complaints have decreased. .......................................................................................................... 302
Finding IX-2 There has been a generally positive trend in the Customer Average Interruption Duration Index (CAIDI) and SAIDI reliability metrics except for upticks in 2009. ................................................................................................... 305
Finding IX-3 JCP&L has made progress in reducing the number of customers experiencing multiple interruptions but does not include this important measurement in its monthly performance report. ................................................ 306

Final Report xxxi
6/20/2011
Table of Findings (continued)
Finding IX-4 JCP&L transmission reliability, as measured by transmission outage frequency, deteriorated from 2008 to 2009 overall but particularly on the 230, 345, and 500 kV circuits................................................................................. 307
Finding IX-5 The accuracy of the estimated time of restoration given to customers reporting an outage has improved from 53.5% in 2007 to 94.4% in 2009. ..... 308
Finding IX-6 Tree incidents are the largest cause of outages and this outage category had a large increase in 2009, possibly due to the deferral of trimming on circuits following inspection to the next standard four-year cycle. ................... 309
Finding IX-7 JCP&L has deferred distribution vegetation management where based on inspection, circuit conditions permitted trimming to be deferred. ................... 310
Finding IX-8 JCP&L is experimenting with a new approach to distribution vegetation management, with a large shift from O&M to capital spending. ...................... 310
Finding IX-9 Overhead primary conductor is the leading equipment cause of customer outages. ..................................................................................................... 311
Finding IX-10 JCP&L has reduced its unaccounted-for energy losses from 2005 to 2009. ... 312
Finding IX-11 Transmission O&M expense per mile of transmission steadily decreased from 2005 to 2009. ................................................................................................... 312
Finding IX-12 Distribution O&M expense per mile of distribution increased from 2005 to 2007 but then decreased in 2009 to a level below 2005. .................................... 313
Finding IX-13 Net utility plant in service per customer has been increasing. ........................... 314
Finding IX-14 T&D-related capital spending decreased from 2005 to 2009 and the reductions in capacity-system reinforcement and condition/reliability improvements may affect reliability in the future. ............................................... 316
Finding IX-15 For the years 2007 through 2009, JCP&L received and expended significantly less capital than requested. ................................................................ 317
Finding IX-16 JCP&L has significantly decreased its budgeted and actual T&D O&M expenditures in 2008 and 2009, which may adversely affect customer service and reliability in the future. ........................................................................ 319
Finding IX-17 Capital project estimate variances are significant. ................................................ 320
Finding IX-18 Capital project schedule performance deteriorated in 2009 from 2007 and 2008 levels. ............................................................................................... 320
Finding IX-19 JCP&L focuses capital project management more on cash flow and current year capital budget compliance than on traditional individual project budget and schedule achievement. ...................................................................................... 322

xxxii Final Report
6/20/2011
Table of Findings (continued)
Finding IX-20 JCP&L does not track the number and value of change orders by project or in total, which reduces its ability to manage and control projects. ............... 322
Finding IX-21 FirstEnergy Utilities does not always award JCP&L transmission corridor vegetation management contracts to the lowest bidder. ..................................... 322
Finding IX-22 FEU and JCP&L have an appropriate blend of centralization and decentralization in the Transmission and Distribution organization. ............... 324
Finding IX-23 FirstEnergy, FirstEnergy Utilities, and JCP&L have a highly developed performance management program. ...................................................................... 324
Finding IX-24 FEU and JCP&L have a rigorous capital program planning and budgeting process. ..................................................................................................... 324
Finding IX-25 JCP&L measures schedule adherence rather than actual vs. estimated hours of crew productivity. ................................................................................................. 325
Finding IX-26 FirstEnergy Utilities does not measure and report causes of crew downtime well. ........................................................................................................... 326
Finding IX-27 Asset management at FEU and JCP&L is well-developed and has achieved reductions in equipment-related failures. ............................................................... 327
Finding IX-28 JCP&L generally stays current with planned equipment maintenance.............. 327
Finding IX-29 Some high-priority circuits repeat as high-priority circuits in subsequent years after improvement programs have been completed. ................................. 331
Finding IX-30 Although tree incidents are a leading cause of outages, vegetation management is not organizationally grouped with the Engineering section and reports to a separate Director. ......................................................................... 332
Finding IX-31 JCP&L has a sound storm preparation and restoration process. ....................... 332
Finding IX-32 JCP&L uses industry-standard crew sizes. ............................................................ 332
Finding IX-33 FirstEnergy Utilities has current engineering and construction standards manuals. .................................................................................................... 333
Finding IX-34 T&D staffing levels at JCP&L are being maintained through the replacement of retiring workers but the economics of employee versus contractors have not been re-evaluated recently. ................................................. 333
Finding IX-35 FEU and JCP&L use an integrated suite of operations applications to fully support the T&D work process. ............................................................................. 334

Final Report xxxiii
6/20/2011
Table of Findings (continued)
Finding IX-36 JCP&L will have a more modern work management process after the completion of the Radio Upgrade Initiative in Quarter 4, 2011 and the implementation of the FEU/JCP&L Work Management Initiative between November 2011 and October 2012. ...................................................................... 335
Finding IX-37 JCP&L has made progress in implementing distribution automation to improve reliability, but it should consider doing more. ...................................... 338
Finding IX-38 Jersey Central Power & Light has incorporated smart growth policies into its day-to-day business processes. .......................................................................... 349
Finding IX-39 The implementation of smart growth policies in 2005 decreased the average monthly level of new extension work activity within Jersey Central Power & Light by 31.3% or $400,476. ................................................................................... 357
Finding IX-40 JCP&L complied with smart growth rules by collecting CIAC for the total cost of new extensions in designated non-growth areas. ................................... 359
Finding IX-41 Up to $13.5 million of the $20.9 million collected as CIAC for new extensions in non-growth areas between 2005 and 2009 might have been collected as refundable DEP if the jobs had been processed as though they were in growth areas. ............................................................................................... 360
Finding IX-42 The average annual scope of work for new extension jobs in growth areas has decreased 11.8% (7.5 Hrs/WR) and in non-growth areas 41.9% (20.2 Hrs/WR) since the implementation of smart growth rules. .............................. 361
Finding IX-43 The smart growth policy increased the level of upgrade activity within JCP&L after its implementation. ............................................................................ 362
Finding IX-44 Jersey Central Power & Light complied with smart growth rules for upgrades requested by customers. ......................................................................... 363
Finding IX-45 The scope of work for jobs completed by JCP&L to upgrade facilities to customers was similar between growth and non-growth areas and demonstrated comparable trends. .......................................................................... 364
Finding IX-46 FirstEnergy, including Jersey Central Power & Light, has centralized the responsibility for processing requests from excavators to mark underground facilities in all the service territories of its subsidiaries. .............. 367
Finding IX-47 Jersey Central Power & Light/FirstEnergy has a defined process for completing requests from excavators to mark the location of underground electrical facilities. ..................................................................................................... 369
Finding IX-48 Jersey Central Power & Light has written contract specifications for vendors providing FirstEnergy with underground locating services. ............... 369

xxxiv Final Report
6/20/2011
Table of Findings (continued)
Finding IX-49 The locates activity from New Jersey One Call for Jersey Central Power & Light peaked during 2006. ........................................................................................ 370
Finding IX-50 Jersey Central Power & Light's annual contract locate costs ranged from $9.78 to $11.65 per ticket over the last five years. ................................................ 371
Finding IX-51 The FirstEnergy / Jersey Central Power and Light ticket screening process has resulted in approximately $811,112 of avoided cost from 2005 through 2009. ............................................................................................................. 372
Finding IX-52 Jersey Central Power & Light/FirstEnergy monitors the performance of the locates contractor on both a daily and monthly basis. ......................................... 373
Finding IX-53 Jersey Central Power & Light completed 98.4% of 2009 location requests within three business days. ....................................................................................... 374
Finding IX-54 Jersey Central Power and Light has invoiced its underground locates contractor $630,923 for 271 dig-in claims during 2007, 2008 and 2009. .......... 375
Finding IX-55 Jersey Central Power & Light/FirstEnergy has not performed an audit of its locates contractor since 2006. ............................................................................ 376
Finding IX-56 Jersey Central Power & Light/FirstEnergy have specific organizations that are responsible for the oversight of contractor performance regarding the installation of transmission, substation, and distribution facilities..................... 378
Finding IX-57 Jersey Central Power & Light has a formalized process for determining whether a project is to be completed in-house or via contract labor. ............... 379
Finding IX-58 Jersey Central Power & Light / FirstEnergy has a defined process for the oversight of transmission, substation, and distribution construction contractors. ................................................................................................................. 380
Finding IX-59 Jersey Central Power & Light supervisors are expected to use the field coordinator process for transmission, distribution, and substation projects completed by in-house crews. ................................................................................. 381
Finding IX-60 Jersey Central Power and Light has reduced its distribution, transmission and substation contract labor work force, excluding tree trimming, from a yearly monthly average peak of 172 FTEs in 2005 to 9 FTEs in 2009. ............ 382
Finding IX-61 Jersey Central Power & Light has a formalized process to monitor the performance of contractors and in-house crews that are installing transmission, substation, and distribution facilities. ............................................. 383

Final Report xxxv
6/20/2011
Table of Findings (continued)
X. CUSTOMER SERVICE ......................................................................................................... 387
Finding X-1 Total customer service costs per customer have increased at a rate that is slightly below the inflation rate. ............................................................................. 407
Finding X-2 According to the J. D. Power and Associates 2009 survey, the JCP&L Customer Satisfaction Index ranking is slightly below the average of other large eastern utilities. ................................................................................................ 408
Finding X-3 After decreasing from 2005 to 2007, the number of annual complaints has increased by 23% since 2007. ................................................................................. 409
Finding X-4 Three different units handle complaints relevant to JCP&L. ............................ 411
Finding X-5 The regulatory customer service standards reported to the BPU—average speed of answer, average time to reach a CSR, and percentage of calls handled by a CSR—have all deteriorated in recent years. .................................. 411
Finding X-6 The FEU average speed of answer is slower and the average hold time is longer for NJ customers than the average experienced by Ohio and Pennsylvania customers. .......................................................................................... 412
Finding X-7 The percentage of calls answered by the Reading contact center and the contract contact center that serve JCP&L customers has declined and falls below that of the Ohio call center. ........................................................................ 414
Finding X-8 It appears that the NCO contract contact center may be a higher cost than the Reading contact center.Error! Reference source not found. ....................... 415
Finding X-9 FirstEnergy Utilities has steadily improved the percentage of calls handled by the integrated voice response system. .............................................................. 415
Finding X-10 The percentage of service calls completed on the day requested has declined over the last five years, and it dropped precipitously after the field service customer satisfaction survey was suspended. ....................................................... 416
Finding X-11 Field service order response time has improved from 2005 to 2009. .............. 419
Finding X-12 The rate of meters not read improved from 2005 through 2008, but reversed to a relatively high 9.7% in 2009. ........................................................... 419
Finding X-13 FirstEnergy Utility’s last examination of AMI in 2007 did not consider societal and customer benefits. ............................................................................... 420
Finding X-14 The meter-reading error rate has improved steadily since 2005. ....................... 421
Finding X-15 FirstEnergy Utilities and JCP&L have not completed a meter reading reroute since 1994. ................................................................................................... 421
Finding X-16 FirstEnergy Utilities has significantly reduced the billing exception rate. ........ 422
xxxvi Final Report
6/20/2011
Table of Findings (continued)
Finding X-17 The Rates Department has a strong influence on customer service and JCP&L’s financial success but it does not report to JCP&L. ............................. 422
Finding X-18 Theft-of-service activity has been increasing. ....................................................... 423
Finding X-19 FirstEnergy Utilities has made steady progress in increasing the percentage of electronic payments. ............................................................................................. 424
Finding X-20 Net write-offs for uncollectible accounts have steadily increased since 2006, and accounts receivable aging has deteriorated as well. ............................ 424
Finding X-21 As write-offs and slow payment have increased, the number of terminations for non-payment have also increased. .................................................................... 427
Finding X-22 The accounts and amounts submitted to collection agencies have increased over the last five years, but the percentage collected has decreased. ................. 428
Finding X-23 The New Jersey economic development function is more closely aligned with JCP&L functions than the FEU corporate-level functions. ...................... 430
XI. CLEAN ENERGY ................................................................................................................ 433
Finding XI-1 JCP&L is responsible for only a limited segment of the Clean Energy programs. .................................................................................................................... 437
Finding XI-2 The Comfort Partners Program and the CleanPower Choice Program were reduced as a result of the Governor’s issuance of Executive Order 14, although additional funding was later found. ........................................................ 437
Finding XI-3 JCP&L is appropriately managing its remaining responsibilities involving the Clean Energy programs. .................................................................................... 439
XII. SUPPORT SERVICES ........................................................................................................ 441
Finding XII-1 FirstEnergy/JCP&L has a robust risk management program, although the program can be better summarized and documented. ........................................ 448
Finding XII-2 The status and reporting relationship of CRO is appropriate. ........................... 449
Finding XII-3 Insurance processes and coverage are appropriate, although analyses should be periodically documented. .................................................................................... 449
Finding XII-4 The Legal Department’s performance objectives are vague and its key performance indicators (KPIs) in support of the Legal Department’s mission and objectives have not been fully developed. ....................................... 462

Final Report xxxvii
6/20/2011
Table of Findings (continued)
Finding XII-5 Unlike other FE states, JCP&L has relied extensively, for a long period of time, on one external counsel firm for its state regulatory work in New Jersey and pays significantly for that firm’s activities. ......................................... 464
Finding XII-6 No formal written policies or procedures documentation exists for the Claims groups in OH, PA, or NJ. .......................................................................... 465
Finding XII-7 The in-house system supporting the Claims function could not provide all the information requested by Schumaker & Company during this audit. ....... 465
Finding XII-8 No formal reporting to JCP&L’s senior management regarding claims is currently being provided. ........................................................................................ 466
Finding XII-9 FE/JCP&L Real Estate and facilities organization properly maintains its buildings and properties by using simple, straightforward methodologies for managing its repair and upgrade workloads. .................................................. 474
Finding XII-10 There are no formal facilities forecasting or planning methodologies or techniques in place. .................................................................................................. 474
Finding XII-11 The corporate FE Supply Chain organization has a good procurement performance measurement and management program. ..................................... 480
Finding XII-12 In 2009, the Supply Chain unit for Utilities had almost 100% compliance with the policies for terms and conditions, supplier diversity, use of the Playbook, and purchase order structure. ............................................................... 481
Finding XII-13 The Supply Chain organization is making progress in converting manual processes to electronic processes. .......................................................................... 481
Finding XII-14 There are generally appropriate inventory performance measures for the JCP&L central storerooms. ..................................................................................... 481
Finding XII-15 JCP&L’s total inventory has dropped dramatically from 2005 to 2009, but that reduction has not been fast enough to maintain the turn ratios because the volume of issues has also decreased dramatically. ........................................ 482
Finding XII-16 Although the fill rate is an important measurement for the central stores, it does not measure the impact of unavailable materials on the field crews. ...... 482
Finding XII-17 Supply Chain staffing for Utility Support has dropped from 16 in 2006 to 9 in 2009, raising a concern about the capacity for ongoing support of JCP&L and the other operating companies. ....................................................... 482
Finding XII-18 The Supply Chain organization participated in 22 benchmarking studies and related reports in 2005 and 2006 but has not since. ............................................ 483
Finding XII-19 The Supply Chain organization does not actively participate in standards committees. ............................................................................................................... 483

xxxviii Final Report
6/20/2011
Table of Findings (continued)
Finding XII-20 Despite a program to consolidate the three central storerooms in Ohio, there is currently no planned warehouse consolidation for JCP&L. ................. 483
Finding XII-21 There are limited programs for vendor restocking of work center storerooms, and FE has not outsourced much of the logistics and warehousing functions for JCP&L. ........................................................................ 484
Finding XII-22 FirstEnergy Utilities’ Fleet Services has developed an orderly and industry-typical set of policies and procedures for fleet management. ............................. 493
Finding XII-23 JCP&L fleet availability is better than the FEU opco average. .......................... 493
Finding XII-24 The recent fleet cost trend is favorable. ................................................................. 494
Finding XII-25 FirstEnergy Utilities and JCP&L do not follow their own vehicle replacement guidelines and the average fleet age is relatively old, which might result in excessive field-force work delays attributable to vehicle and equipment problems. ................................................................................................ 496
Finding XII-26 All fleet preventive maintenance is calendar based rather than the better practice of triggering preventive maintenance on a combination of mileage or engine hours of use and calendar time. ............................................................. 501
Finding XII-27 FirstEnergy Utilities does not track fuel usage by vehicle. .................................. 501
Finding XII-28 FirstEnergy has not conducted a full lease-versus-buy analysis for vehicles and equipment since 2004. ....................................................................................... 501
Finding XII-29 The FE IT organization, led by the CIO, reports up through the CFO organization at a lower level than in many organizations.................................... 518
Finding XII-30 The FE strategic planning process is improving but the plan does not specifically address the direction in which IT is going. ....................................... 518
Finding XII-31 The IT organization has amassed a large body of documentation associated with its policies and procedures. ............................................................................. 520
Finding XII-32 The IT organization has a very limited PMO in place. ........................................ 521
Finding XII-33 The FE IT organization does not sufficiently emphasize the certification of its staff. ................................................................................................................... 522
Finding XII-34 The key IT performance metrics currently in use are limited in nature and are not kept in a consolidated dashboard for reporting across the IT organization. ............................................................................................................... 523
Finding XII-35 IT controls have been incorporated into day-to-day activities. .......................... 524
Finding XII-36 No formal service level agreements exist between IT and JCP&L or other FE entities. ................................................................................................................. 525
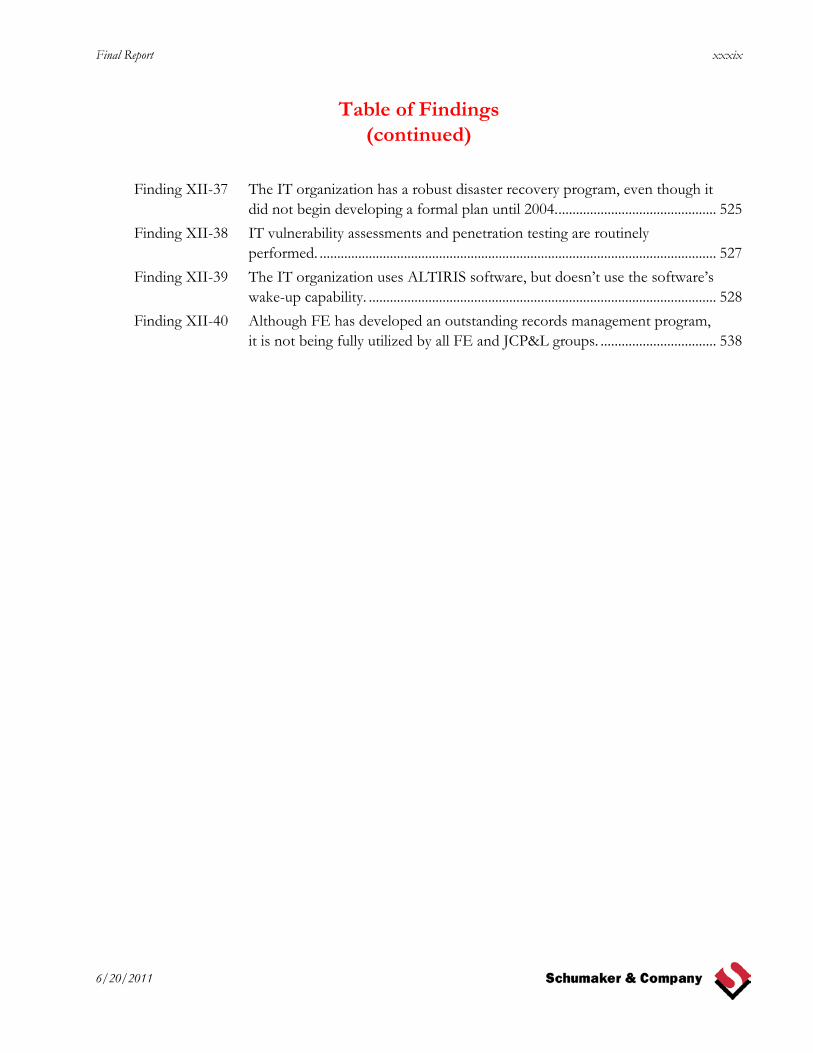
Final Report xxxix
6/20/2011
Table of Findings (continued)
Finding XII-37 The IT organization has a robust disaster recovery program, even though it did not begin developing a formal plan until 2004. ............................................. 525
Finding XII-38 IT vulnerability assessments and penetration testing are routinely performed. ................................................................................................................. 527
Finding XII-39 The IT organization uses ALTIRIS software, but doesn’t use the software’s wake-up capability. ................................................................................................... 528
Finding XII-40 Although FE has developed an outstanding records management program, it is not being fully utilized by all FE and JCP&L groups. ................................. 538

xl Final Report
6/20/2011
Table of Recommendations
II. REVIEW OF PROCUREMENT ACTIVITIES (ENPRO) ................................................... 21
III. AFFILIATED RELATIONSHIPS AND AFFILIATE ALLOCATION METHODOGIES .................................................................................................................... 41
Recommendation III-1 Establish affiliate agreements for all missing affiliate relationships, as appropriate, and provide them, as necessary, to the applicable state regulatory commissions for review and approval. (Refer to Finding III-2) ............................................................................................. 58
Recommendation III-2 Perform periodic studies to determine the cost-competitiveness of centralized functions, consistent with regulatory requirements, and develop plans to address the results of these studies. (Refer to Finding III-3) ............................................................................................. 58
Recommendation III-3 Develop documentation regarding SERVECO’s allocation factor review process. (Refer to Finding III-4) ............................................... 58
Recommendation III-4 Evaluate and implement formal accounting and human resources policies and procedures to address situations in which an employee might leave JCP&L to go to affiliates. (Refer to Finding III-5) ............................................................................................. 59
Recommendation III-5 Establish a formal written JCP&L dividend policy. (Refer to Finding III-7) ............................................................................................. 59
Recommendation III-6 Continually review and update, as appropriate, the number of allocation factors available to SERVECO for affiliate charges, which could reduce the reliance on general allocators. (Refer to Finding III-9 and Finding III-10) ........................................................... 74
Recommendation III-7 Routinely perform internal audits of affiliate relationships and associated transactions. (Refer to Finding III-12) ............................... 74
Recommendation III-8 Update the SERVECO CAM documentation. (Refer to Finding III-13) ........................................................................................... 75
Recommendation III-9 Avoid charging JCP&L ratepayers for merger team costs. (Refer to Finding III-14) ........................................................................................... 75
Recommendation III-10 Study the size of the aircraft fleet to increase overall utilization on the aircraft. (Refer to Finding III-17) .................................................... 80
Recommendation III-11 Analyze and modify, as appropriate, aircraft charging mechanisms so that entities such as JCP&L do not excessively pay for services not rendered. (Refer to Finding III-18) ................................................ 81

Final Report xli
6/20/2011
Table of Recommendations (continued)
Recommendation III-12 Modify policies and procedures regarding the use of corporate aircraft to provide economic guidelines on appropriate use. (Refer to Finding III-19) ...................................................................................... 81
Recommendation III-13 Perform a lease versus own analysis and submit it to the BPU Audit Division to justify the benefits and costs of maintaining an in-house FE flight operation showing various lease/own options. (Refer to Finding III-17, Finding III-18, and Finding III-19) ............ 81
IV. MARKET CONDITIONS ...................................................................................................... 83
V. REVIEW OF PRIOR AUDIT RECOMMENDATIONS ....................................................... 91
Recommendation V-1 Provide a report on the number of circuits that have implemented tie and recloser schemes during the past year as a part of the Annual System Performance Report. (Refer to Finding V-3) ........ 109
VI. REMEDIATION COSTS ......................................................................................................113
Recommendation VI-1 Institute a formal process to review the existing project management methodology for the remediation program to determine if there are ways to strengthen and improve it.. (Refer to Finding VI-3) ..................................................................................... 120
Recommendation VI-2 Investigate the provisions of the RAC minimum filing requirements via an electronic repository that is accessible by the BPU via the Internet. (Refer to Finding VI-3) ................................. 121
Recommendation VI-3 Perform periodic internal audits of external remediation contractors’ invoicing. (Refer to Finding VI-5) ................................ 121
VII. EXECUTIVE MANAGEMENT AND CORPORATE GOVERNANCE ........................ 123
Recommendation VII-1 Develop a periodic organizational review process. (Refer to Finding VII-1) ......................................................................................... 129
Recommendation VII-2 Regularly review and update corporate governance policies. (Refer to Finding VII-3) ........................................................................ 142
Recommendation VII-3 Periodically send out letters to all vendors and contractors informing them of FE’s Code of Conduct. (Refer to Finding VII-4) ......................................................................................... 142

xlii Final Report
6/20/2011
Table of Recommendations (continued)
Recommendation VII-4 More routinelyrotate directors through committees. (Refer to Finding VII-5) ......................................................................................... 142
Recommendation VII-5 Review and update the Audit Committee charter to specify that the Audit Committee is responsible for oversight of all risk management. (Refer to Finding VII-6) ................................................ 142
Recommendation VII-6 Update the Audit Committee charter to state that the Director of Internal Auditing functionally reports to the Audit Committee and uses FE for logistical support. (Refer to Finding VII-7) ........... 143
Recommendation VII-7 Periodically rebid external audit services. (Refer to Finding VII-8) ......................................................................................... 143
Recommendation VII-8 Require all outside counsel to report wrongdoing up through the Board, as is now required from outside counsel practicing before the SEC. (Refer to Finding VII-9) ........................................................ 143
Recommendation VII-9 Continue to strengthen employee safety programs. (Refer to Finding VII-15 and Finding VII-16) .................................................... 180
Recommendation VII-10 Develop a strategic workforce plan. (Refer to Finding VII-11 and Finding VII-12) ....................................................................................... 181
Recommendation VII-11 Strengthen efforts to attract women to managerial and technical jobs. (Refer to Finding VII-17, Finding VII-18, and Finding VII-19) ....................................................................................... 181
Recommendation VII-12 Strengthen the narrative in the affirmative action plan describing JCP&L’s actions and plans for hiring and promoting women and minorities. (Refer to Finding VII-20) .................................................. 181
Recommendation VII-13 Develop a comprehensive and integrated external relations/communications strategy. (Refer to Finding VII-24, Finding VII-25, and Finding VII-26) ................................................... 190
VIII. FINANCE AND ACCOUNTING .................................................................................... 193
Recommendation VIII-1 Explore the advisability of ring-fencing JCP&L’s operations from FE. (Refer to Finding VIII-2) .............................................................. 209
Recommendation VIII-2 Seek an extension of approval to participate in the Utility Money Pool. (Refer to Finding VIII-7) ............................................................. 224
Recommendation VIII-3 Study and evaluate combining FirstEnergy’s capital budget systems and databases. (Refer to Finding VIII-16) ........................... 257
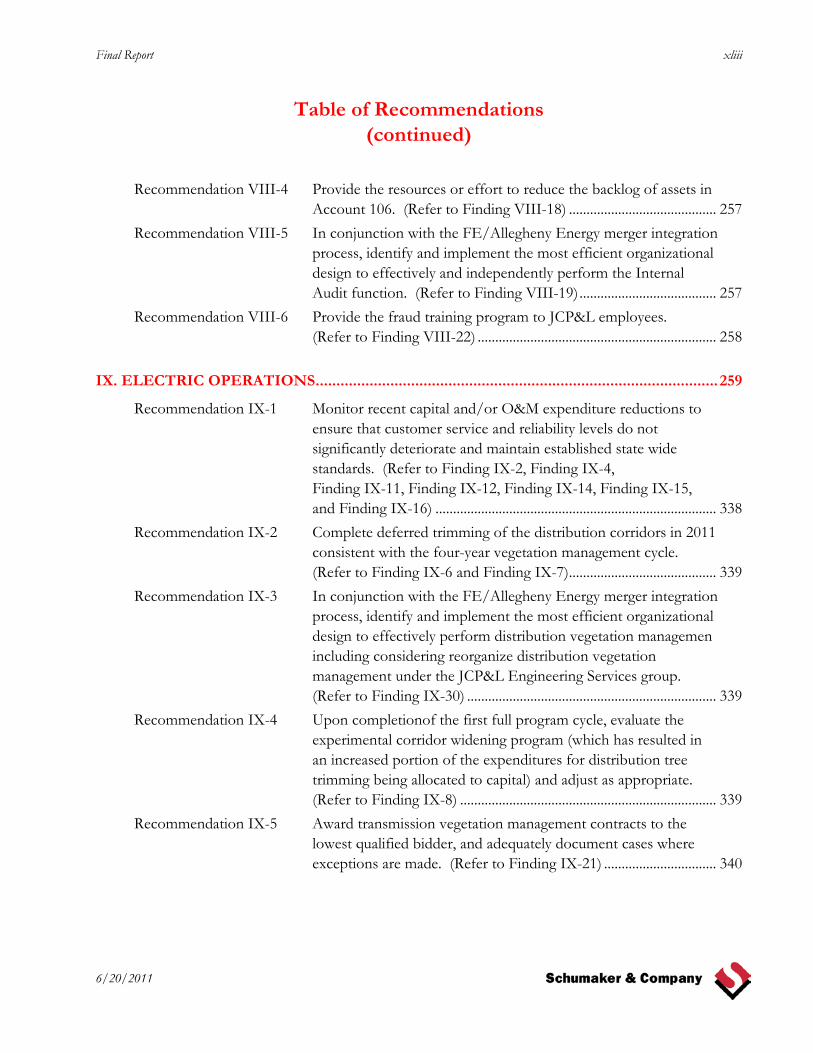
Final Report xliii
6/20/2011
Table of Recommendations (continued)
Recommendation VIII-4 Provide the resources or effort to reduce the backlog of assets in Account 106. (Refer to Finding VIII-18) .......................................... 257
Recommendation VIII-5 In conjunction with the FE/Allegheny Energy merger integration process, identify and implement the most efficient organizational design to effectively and independently perform the Internal Audit function. (Refer to Finding VIII-19) ....................................... 257
Recommendation VIII-6 Provide the fraud training program to JCP&L employees. (Refer to Finding VIII-22) .................................................................... 258
IX. ELECTRIC OPERATIONS ................................................................................................. 259
Recommendation IX-1 Monitor recent capital and/or O&M expenditure reductions to ensure that customer service and reliability levels do not significantly deteriorate and maintain established state wide standards. (Refer to Finding IX-2, Finding IX-4, Finding IX-11, Finding IX-12, Finding IX-14, Finding IX-15, and Finding IX-16) ................................................................................ 338
Recommendation IX-2 Complete deferred trimming of the distribution corridors in 2011 consistent with the four-year vegetation management cycle. (Refer to Finding IX-6 and Finding IX-7) .......................................... 339
Recommendation IX-3 In conjunction with the FE/Allegheny Energy merger integration process, identify and implement the most efficient organizational design to effectively perform distribution vegetation managemen including considering reorganize distribution vegetation management under the JCP&L Engineering Services group. (Refer to Finding IX-30) ....................................................................... 339
Recommendation IX-4 Upon completionof the first full program cycle, evaluate the experimental corridor widening program (which has resulted in an increased portion of the expenditures for distribution tree trimming being allocated to capital) and adjust as appropriate. (Refer to Finding IX-8) ......................................................................... 339
Recommendation IX-5 Award transmission vegetation management contracts to the lowest qualified bidder, and adequately document cases where exceptions are made. (Refer to Finding IX-21) ................................ 340

xliv Final Report
6/20/2011
Table of Recommendations (continued)
Recommendation IX-6 Revise capital program and project management to include a focus on managing individual projects according to their schedules and budgets. (Refer to Finding IX-17, Finding IX-18, and Finding IX-19) ......................................................................................... 340
Recommendation IX-7 Begin tracking and reporting the aggregate volume and value of change orders by project and by time period. (Refer to Finding IX-20) ......................................................................................... 340
Recommendation IX-8 Begin tracking and reporting actual versus estimated hours by work order and by time period. (Refer to Finding IX-25) ............... 340
Recommendation IX-9 Improve the delay reporting to reduce crew downtime and improve schedule adherence. (Refer to Finding IX-26) ................... 341
Recommendation IX-10 Modify the high-priority circuit program to include a focus on the number of repeat high-priority circuits. (Refer to Finding IX-29) ......................................................................................... 341
Recommendation IX-11 Re-evaluate the T&D employee and contractor labor allocation. (Refer to Finding IX-34) ........................................................................ 341
Recommendation IX-12 Include as a component of the analysis of the highest priority circuits the age, size, and type of overhead conductor to determine if these factors are the key contributors to the unreliability of a particular circuit and if conductor replacement would be cost-effective to address customer hours of outages on such circuits. (Refer to Finding IX-9) ........................................... 341
Recommendation IX-13 In conjunction with the high priority circuit program, consider adding CEMI measurements and targets to the internal reliability performance measures to enhance customer satisfaction and further improve reliability. (Refer to Finding IX-3) .......................... 342
Recommendation IX-14 JCP&L should provide documentation that its distribution planning criteria includes requirements consistent with the PJ Downes’ reports for tie and recloser schemes for new and substantially reconfigured circuits, which, over time, will allow for increasing levels of automation with respect to the Company’s response to outages. (Refer to Finding IX-37) .................................. 342
Recommendation IX-15 Determine the root cause(s) of the claims against JCP&L’s underground locates contractor and develop a plan to minimize the causes. (Refer to Finding IX-54) ................................................... 377

Final Report xlv
6/20/2011
Table of Recommendations (continued)
Recommendation IX-16 Perform periodic audits of the contractor(s) that are providing JCP&L with underground locates services. (Refer to Finding IX-55) ........................................................................................ 377
X. CUSTOMER SERVICE ......................................................................................................... 387
Recommendation X-1 Maintain or achieve customer service performance levels that result in overall customer satisfaction, making improvements where cost-effective. (Refer to Finding X-3, Finding X-5, Finding X-6, Finding X-7, and Finding X-10) ................................... 430
Recommendation X-2 In conjunction with the FE/ Allegheny Energy merger integration process, identify and implement the most efficient organizational design to effectively perform customer complaint management processes. (Refer to Finding X-4) ............................... 431
Recommendation X-3 In conjunction with the FE/Allegheny Energy merger integration process and then periodically thereafter, review and evaluate the use of call center resources, both internal and through contractors, in which these periodic reviews consider cost-effectiveness, as well as other relevant factors, including quality, experience, labor pool diversification, and disaster recovery. Changes resulting from these reviews should be incorporated over time, as necessary. (Refer to Finding X-8) ....................................................... 431
Recommendation X-4 Re-evaluate AMR, AMI, and communication devices for inside meters to reduce estimated meter reads and to lower meter- reading costs. (Refer to Finding X-12 and Finding X-13) .............. 431
Recommendation X-5 Complete the JCP&L meter reading rerouting process within six months. (Refer to Finding X-15) ......................................................... 432
Recommendation X-6 In conjuction with the FE/Allegheny Energy reorganization merger integration process, identify and implement the most efficient organizational design to effectively perform the economic development function, including New Jersey. (Refer to Finding X-23) ..................................................................................... 432

xlvi Final Report
6/20/2011
Table of Recommendations (continued)
XI. CLEAN ENERGY ................................................................................................................ 433
XII. SUPPORT SERVICES ........................................................................................................ 441
Recommendation XII-1 Conduct periodic, formal risk management studies. (Refer to Finding XII-1) ......................................................................................... 449
Recommendation XII-2 Conduct periodic, formal insurance studies. (Refer to Finding XII-3) ......................................................................................... 449
Recommendation XII-3 Strengthen Legal Department objectives and associated KPIs, including responding to survey results. (Refer to Finding XII-4) ......................................................................................... 467
Recommendation XII-4 Perform a cost/benefit analysis to determine whether state regulatory work should be performed primarily internally or externally in the future, and incorporate the development of RFPs into this decision-making process. (Refer to Finding XII-5) ......................................................................................... 467
Recommendation XII-5 Establish formal written Claims function documentation for all FE groups managing claims. (Refer to Finding XII-6) .................... 468
Recommendation XII-6 Perform an investigation and resulting cost/benefit analysis to see if FE’s claims system should be replaced. (Refer to Finding XII-7) ......................................................................................... 468
Recommendation XII-7 Begin providing formal reports to JCP&L senior management regarding claims and legal cases activities. (Refer to Finding XII-8) ......................................................................................... 468
Recommendation XII-8 Develop a Facilities Master Plan. (Refer to Finding XII-10) ............ 475
Recommendation XII-9 Improve JCP&L turnover rate to 2.1, the level already achieved in 2005. (Refer to Finding XII-15) ...................................................... 484
Recommendation XII-10 Improve the JCP&L central storeroom fill rate to 94%, the level already achieved by FEU/Ohio Edison. (Refer to Finding XII-15) ....................................................................................... 484
Recommendation XII-11 Measure the amount and cost of field crew lost time due to material availability (stock out) problems. (Refer to Finding XII-16) ....................................................................................... 484
Recommendation XII-12 Monitor the effect of FE Supply Chain staffing reductions on JCP&L and address adverse impacts as appropriate. (Refer to Finding XII-17) ....................................................................................... 485

Final Report xlvii
6/20/2011
Table of Recommendations (continued)
Recommendation XII-13 Resume Supply Chain participation in benchmarking programs by 2012. (Refer to Finding XII-18) .................................................... 485
Recommendation XII-14 Consider adding Supply Chain staff to standards committees. (Refer to Finding XII-19) ...................................................................... 485
Recommendation XII-15 Accelerate the consideration of consolidating the two JCP&L regional storerooms. (Refer to Finding XII-20) ............................... 485
Recommendation XII-16 Investigate the possibility of vendor resupply of JCP&L central and work center storerooms and/or additional outsourcing of logistics and warehousing functions. (Refer to Finding XII-21) .... 486
Recommendation XII-17 Reinstate JCP&L fleet replacements and catch up to both the FEU fleet replacement guidelines and the fleet replacement strategy within five years, if practicable and cost beneficial. (Refer to Finding XII-25) ...................................................................... 501
Recommendation XII-18 Accelerate the implementation of scheduling preventive maintenance through a combination of mileage or engine hours of use and elapsed calendar time, if feasible and cost beneficial. (Refer to Finding XII-26) ...................................................................... 502
Recommendation XII-19 Implement the tracking of fuel usage by vehicle and add fuel use efficiency to the evaluations of individual vehicle and class-of-equipment performance and cost, if feasible and cost beneficial. (Refer to Finding XII-27) ...................................................................... 502
Recommendation XII-20 Conduct a thorough lease-versus-buy analysis before resuming the acquisition of vehicles and equipment for JCP&L. (Refer to Finding XII-28) ...................................................................................... 502
Recommendation XII-21 In conjunction with the FE/Allegheny Energy merger integration process, and regularly thereafter, identify and implement the most efficient organizational design to effectively perform the IT function across FE. (Refer to Finding XII-29) .................................. 529
Recommendation XII-22 Incorporate technology direction into IT’s strategic planning process. (Refer to Finding XII-30) ...................................................... 529
Recommendation XII-23 Expand the PMO to take on additional responsibilities. (Refer to Finding XII-32) ...................................................................................... 529

xlviii Final Report
6/20/2011
Table of Recommendations (continued)
Recommendation XII-24 Expand FirstEnergy’s commitment to project management by incorporating all IT employees who are responsible for project delivery into a PMP certification program and closely monitor implementation of this program, whereby all appropriate staff achieve PMP certification to ensure timely progress is made. (Refer to Finding XII-33) ...................................................................... 530
Recommendation XII-25 Implement a relevant IT dashboard. (Refer to Finding XII-34) ...... 530
Recommendation XII-26 Expedite completion of SLAs with all major client groups. (Refer to Finding XII-36) ...................................................................... 531
Recommendation XII-27 Transition to the use of the remote management software’s wake-up capability. (Refer to Finding XII-39) .................................... 531
Recommendation XII-28 Take and enforce a more aggressive posture with regard to having departments follow FE’s records management program. (Refer to Finding XII-40) ....................................................................................... 539

Final Report 1
6/20/2011
I. Introduction
This chapter represents a summary introduction and results of the audit of the affiliated transactions between Jersey Central Power and Light Company (JCP&L) and its affiliates, and a comprehensive management audit of Jersey Central Power and Light Company completed by Schumaker & Company in 2011 on behalf of the New Jersey Board of Public Utilities (NJBPU). It includes a summary of recommendations and their respective priorities, JCP&L and FirstEnergy Corporation (FE) background information, and 2005 to 2009 annual statistics for JCP&L. The remaining report chapters contain a discussion of our findings, conclusions, and recommendations for each discrete area of review within the scope of the audit. They include:
♦ Phase I
- Chapter II – Energy Procurement and Purchasing - Chapter III – Affiliated Relationships and Affiliate Allocation Methodologies - Chapter IV – Market Conditions - Chapter V – Review of Prior Audit Recommendations - Chapter VI – Remediation Costs
♦ Phase II
- Chapter VII – Executive Management and Corporate Governance - Chapter VIII – Finance and Accounting - Chapter IX – Electric Operations - Chapter X – Customer Service - Chapter XI – Clean Energy - Chapter XII – Support Services
These chapters provide the detailed facts and analyses that support, and provide context for, the recommendations we have made. The findings and recommendations contained in this audit report are the findings and recommendations of the consultant only and are not necessarily agreed to by JCP&L or NJBPU.

2 Final Report
6/20/2011
A. Summary of Recommendations
To assist JCP&L management in developing implementation plans, each recommendation has been assigned a priority of “high,” “medium,” or “low” according to the following criteria:
♦ High – Designated recommendations are high priority because of their importance and urgency. These represent significant benefit potential, major improvements to service, or substantial improvements to methods or procedures.
♦ Medium – Designated recommendations are of medium priority. In some instances, the implementation of these recommendations is expected to provide moderate improvements in profitability of operations, or management methods and performance. In other instances, implementation may provide significant longer-term benefits which are less predictable.
♦ Low – Designated recommendations reflect a lower priority. In many instances, they should be studied further or implemented sometime during the next few years. Potential benefits are perceived to be either modest or difficult to measure.
Exhibit I-1 summarizes the priority totals for each audit phase.
Exhibit I-1 Summary of Priority Totals
High Medium Low
Phase I 7 6 4 Phase II 15 39 14
Total 22 45 18
In many recommendations, it is not possible or practical at this time to measure “quantitative” benefits. The benefits associated with these recommendations fall primarily into four categories:
♦ Reduction in actual costs of operations within a JCP&L area
♦ Increase in a revenue source within a JCP&L area
♦ Change in work flow processes used in the provision of services to JCP&L customers on a more effective or efficient basis
♦ Change in other processes resulting in good business practices being implemented
Particularly in instances where a new management practice or procedure is recommended (where one either did not exist or was not fully implemented), it may be difficult to estimate the actual benefit to be derived. It is believed, however, that the overall benefit will be improved effectiveness and efficiency of the specified JCP&L area. Additionally, qualitative benefits may occur that cannot be easily quantified.

Final Report 3
6/20/2011
They could include improved effectiveness and efficiency in operations, increased customer satisfaction, additional cost savings, increased revenues, etc. It should also be noted that, because it is not possible in all instances to estimate expected benefits prior to implementation, any implementation plan should include a reliable measurement tool to track benefits after implementation.
Quantifiable benefits (increased revenues or additional cost savings) have been provided in our report chapters where they could be estimated. This quantification is subject to some judgment and would require additional effort beyond the scope of this review to refine the estimates. The actual benefits from these recommendations are, therefore, subject to a degree of uncertainty. For other recommendations the benefits to be derived are of a more qualitative nature or, simply stated, the expectations of prudent management. Those areas where major quantifiable benefits have been identified in the report are described on the following pages.
As JCP&L will have varying ways to implement recommendations, Schumaker & Company did not estimate the impact of implementing audit recommendations on JCP&L’s expense. However, the short-term impact could be considerable. Additionally, implementation of recommendations often requires a phase-in period before benefits can be achieved.
The actual recommendation statements contained in the audit report are shown by phase and work plan area on the following pages. We have also indicated the recommendation number, page number in the report, priority, estimated time-frame to initiate implementation efforts, and estimated benefits following implementation. The details of each recommendation can be found in the individual chapters where the subject matter is evaluated.
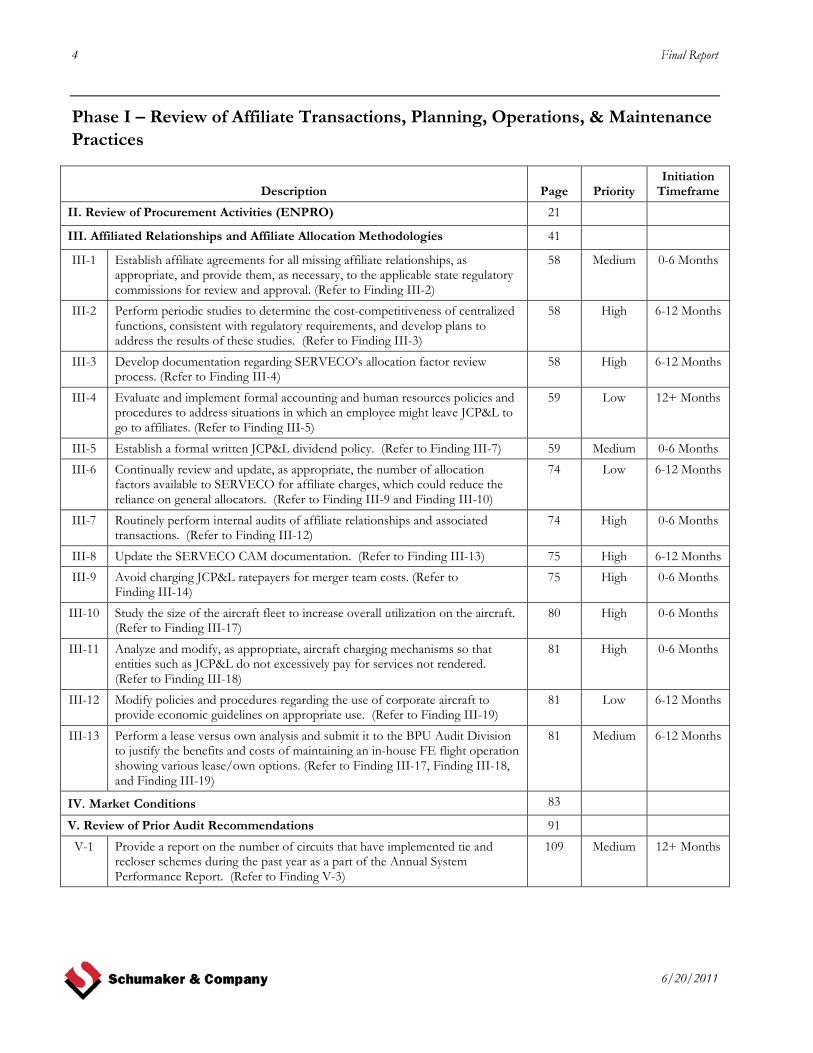
4 Final Report
6/20/2011
Phase I – Review of Affiliate Transactions, Planning, Operations, & Maintenance Practices
Description
Page
Priority
Initiation Timeframe
II. Review of Procurement Activities (ENPRO) 21 III. Affiliated Relationships and Affiliate Allocation Methodologies 41 III-1 Establish affiliate agreements for all missing affiliate relationships, as
appropriate, and provide them, as necessary, to the applicable state regulatory commissions for review and approval. (Refer to Finding III-2)
58 Medium 0-6 Months
III-2 Perform periodic studies to determine the cost-competitiveness of centralized functions, consistent with regulatory requirements, and develop plans to address the results of these studies. (Refer to Finding III-3)
58 High 6-12 Months
III-3 Develop documentation regarding SERVECO’s allocation factor review process. (Refer to Finding III-4)
58 High 6-12 Months
III-4 Evaluate and implement formal accounting and human resources policies and procedures to address situations in which an employee might leave JCP&L to go to affiliates. (Refer to Finding III-5)
59 Low 12+ Months
III-5 Establish a formal written JCP&L dividend policy. (Refer to Finding III-7) 59 Medium 0-6 Months
III-6 Continually review and update, as appropriate, the number of allocation factors available to SERVECO for affiliate charges, which could reduce the reliance on general allocators. (Refer to Finding III-9 and Finding III-10)
74 Low 6-12 Months
III-7 Routinely perform internal audits of affiliate relationships and associated transactions. (Refer to Finding III-12)
74 High 0-6 Months
III-8 Update the SERVECO CAM documentation. (Refer to Finding III-13) 75 High 6-12 Months
III-9 Avoid charging JCP&L ratepayers for merger team costs. (Refer to Finding III-14)
75 High 0-6 Months
III-10 Study the size of the aircraft fleet to increase overall utilization on the aircraft. (Refer to Finding III-17)
80 High 0-6 Months
III-11 Analyze and modify, as appropriate, aircraft charging mechanisms so that entities such as JCP&L do not excessively pay for services not rendered. (Refer to Finding III-18)
81 High 0-6 Months
III-12 Modify policies and procedures regarding the use of corporate aircraft to provide economic guidelines on appropriate use. (Refer to Finding III-19)
81 Low 6-12 Months
III-13 Perform a lease versus own analysis and submit it to the BPU Audit Division to justify the benefits and costs of maintaining an in-house FE flight operation showing various lease/own options. (Refer to Finding III-17, Finding III-18, and Finding III-19)
81 Medium 6-12 Months
IV. Market Conditions 83
V. Review of Prior Audit Recommendations 91
V-1 Provide a report on the number of circuits that have implemented tie and recloser schemes during the past year as a part of the Annual System Performance Report. (Refer to Finding V-3)
109 Medium 12+ Months

Final Report 5
6/20/2011
Description
Page
Priority
Initiation Timeframe
VI. Remediation Costs 113
VI-1 Institute a formal process to review the existing project management methodology for the remediation program to determine if there are ways to strengthen and improve it.. (Refer to Finding VI-3)
120 Medium 6-12 Months
VI-2 Investigate the provisions of the RAC minimum filing requirements via an electronic repository that is accessible by the BPU via the Internet. (Refer to Finding VI-3)
121 Low 0-6 Months
VI-3 Perform periodic internal audits of external remediation contractors’ invoicing. (Refer to Finding VI-5)
121 Medium 12+ Months
Phase II - Comprehensive Management Audit
Description
Page
Priority
Initiation Timeframe
VII. Executive Management & Corporate Governance 123
VII-1 Develop a periodic organizational review process. (Refer to Finding VII-1) 129 Medium 6-12 Months
VII-2 Regularly review and update corporate goverance policies. (Refer to Finding VII-4)
142 Medium 6-12 Months
VII-3 Periodically send out letters to all vendors and contractors informing them of FE’s Code of Conduct. (Refer to Finding VII-4)
142 Medium 0-6 Months
VII-4 More routinly rotate directors through committees (Refer to Finding VII-5) 142 Medium 12+ Months
VII-5 Review and update the Audit Committee charter to specify that the Audit Committee is responsible for oversight of all risk management. (Refer to Finding VII-6 )
142 Low 0-6 Months
VII-6 Update the Audit Committee charter to state that the Director of Internal Auditing functionally reports to the Audit Committee and uses FE for logistical support. (Refer to Finding VII-8)
143 Low 0-6 Months
VII-7 Periodically rebid external audit services. (Refer to Finding VII-8) 143 Medium 12+ Months
VII-8 Require all outside counsel to report wrongdoing up through the Board, as is now required from outside counsel practicing before the SEC. (Refer to Finding 0-7)
143 Low 0-6 Months
VII-9 Continue to strengthen employee safety programs. (Refer to Finding VII-15 and Finding VII-16)
180 High 12+ Months
VII-10 Develop a strategic workforce plan. (Refer to Finding VII-11 and Finding VII-12)
181 Medium 12+ Months
VII-11 Strengthen efforts to attract women to managerial and technical jobs. (Refer to Finding VII-17, Finding VII-18, and Finding VII-19)
181 High 12+ Months
VII-12 Strengthen the narrative in the affirmative action plan describing JCP&L’s actions and plans for hiring and promoting women and minorities. (Refer to Finding VII-20)
181 High 6-12 Months
VII-13 Develop a comprehensive and integrated external relations/communications strategy. (Refer to Finding VII-24, Finding VII-25, and Finding VII-26)
190 Medium 6-12 Months
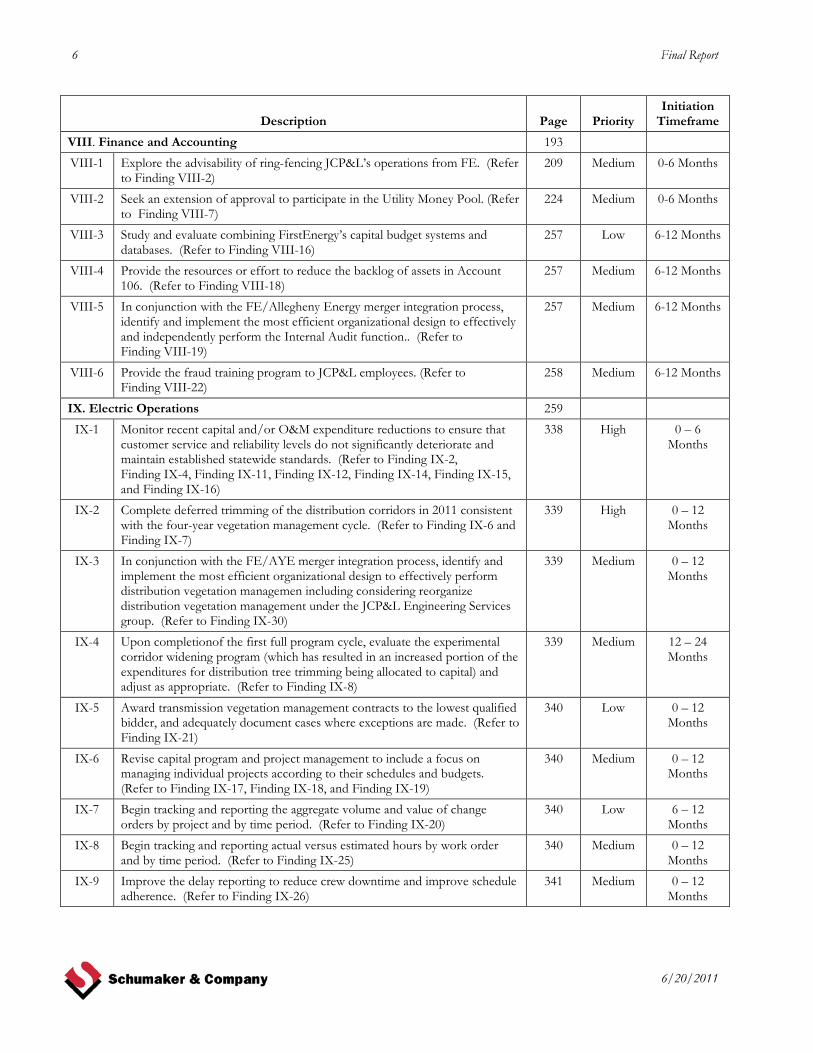
6 Final Report
6/20/2011
Description
Page
Priority
Initiation Timeframe
VIII. Finance and Accounting 193
VIII-1 Explore the advisability of ring-fencing JCP&L’s operations from FE. (Refer to Finding VIII-2)
209 Medium 0-6 Months
VIII-2 Seek an extension of approval to participate in the Utility Money Pool. (Refer to Finding VIII-7)
224 Medium 0-6 Months
VIII-3 Study and evaluate combining FirstEnergy’s capital budget systems and databases. (Refer to Finding VIII-16)
257 Low 6-12 Months
VIII-4 Provide the resources or effort to reduce the backlog of assets in Account 106. (Refer to Finding VIII-18)
257 Medium 6-12 Months
VIII-5 In conjunction with the FE/Allegheny Energy merger integration process, identify and implement the most efficient organizational design to effectively and independently perform the Internal Audit function.. (Refer to Finding VIII-19)
257 Medium 6-12 Months
VIII-6 Provide the fraud training program to JCP&L employees. (Refer to Finding VIII-22)
258 Medium 6-12 Months
IX. Electric Operations 259
IX-1 Monitor recent capital and/or O&M expenditure reductions to ensure that customer service and reliability levels do not significantly deteriorate and maintain established statewide standards. (Refer to Finding IX-2, Finding IX-4, Finding IX-11, Finding IX-12, Finding IX-14, Finding IX-15, and Finding IX-16)
338 High 0 – 6 Months
IX-2 Complete deferred trimming of the distribution corridors in 2011 consistent with the four-year vegetation management cycle. (Refer to Finding IX-6 and Finding IX-7)
339 High 0 – 12 Months
IX-3 In conjunction with the FE/AYE merger integration process, identify and implement the most efficient organizational design to effectively perform distribution vegetation managemen including considering reorganize distribution vegetation management under the JCP&L Engineering Services group. (Refer to Finding IX-30)
339 Medium 0 – 12 Months
IX-4 Upon completionof the first full program cycle, evaluate the experimental corridor widening program (which has resulted in an increased portion of the expenditures for distribution tree trimming being allocated to capital) and adjust as appropriate. (Refer to Finding IX-8)
339 Medium 12 – 24 Months
IX-5 Award transmission vegetation management contracts to the lowest qualified bidder, and adequately document cases where exceptions are made. (Refer to Finding IX-21)
340 Low 0 – 12 Months
IX-6 Revise capital program and project management to include a focus on managing individual projects according to their schedules and budgets. (Refer to Finding IX-17, Finding IX-18, and Finding IX-19)
340 Medium 0 – 12 Months
IX-7 Begin tracking and reporting the aggregate volume and value of change orders by project and by time period. (Refer to Finding IX-20)
340 Low 6 – 12 Months
IX-8 Begin tracking and reporting actual versus estimated hours by work order and by time period. (Refer to Finding IX-25)
340 Medium 0 – 12 Months
IX-9 Improve the delay reporting to reduce crew downtime and improve schedule adherence. (Refer to Finding IX-26)
341 Medium 0 – 12 Months
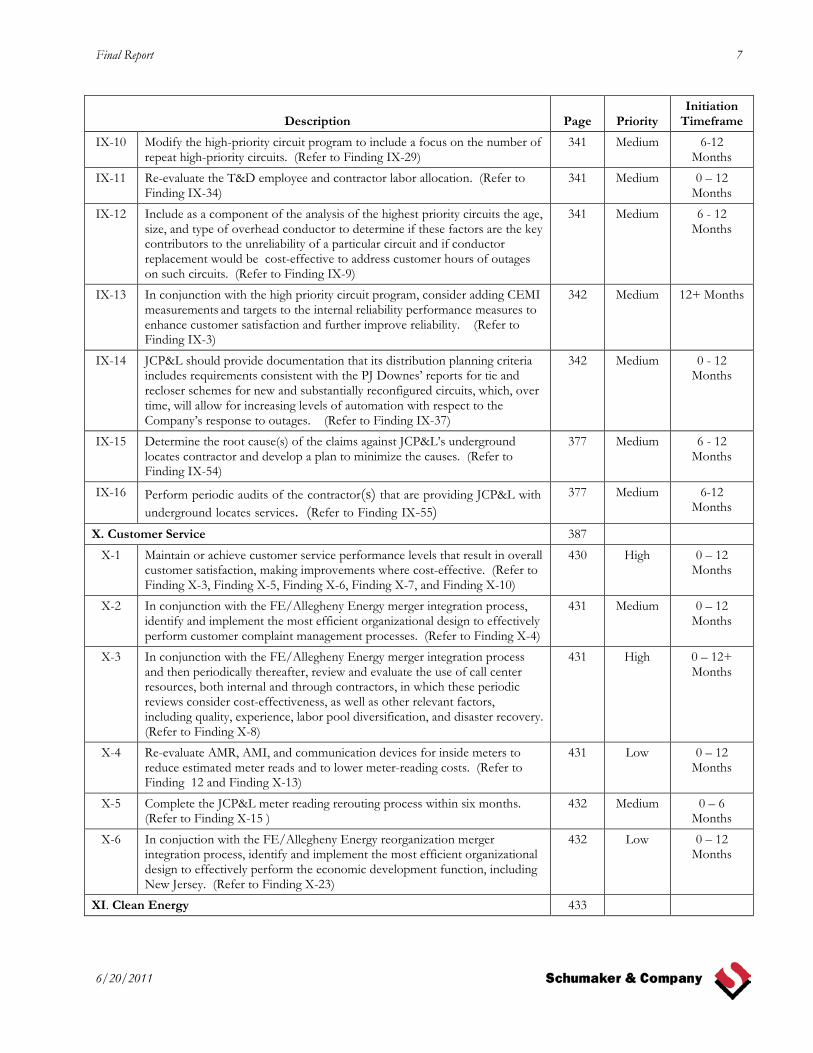
Final Report 7
6/20/2011
Description
Page
Priority
Initiation Timeframe
IX-10 Modify the high-priority circuit program to include a focus on the number of repeat high-priority circuits. (Refer to Finding IX-29)
341 Medium 6-12 Months
IX-11 Re-evaluate the T&D employee and contractor labor allocation. (Refer to Finding IX-34)
341 Medium 0 – 12 Months
IX-12 Include as a component of the analysis of the highest priority circuits the age, size, and type of overhead conductor to determine if these factors are the key contributors to the unreliability of a particular circuit and if conductor replacement would be cost-effective to address customer hours of outages on such circuits. (Refer to Finding IX-9)
341 Medium 6 - 12 Months
IX-13 In conjunction with the high priority circuit program, consider adding CEMI measurements and targets to the internal reliability performance measures to enhance customer satisfaction and further improve reliability. (Refer to Finding IX-3)
342 Medium 12+ Months
IX-14 JCP&L should provide documentation that its distribution planning criteria includes requirements consistent with the PJ Downes’ reports for tie and recloser schemes for new and substantially reconfigured circuits, which, over time, will allow for increasing levels of automation with respect to the Company’s response to outages. (Refer to Finding IX-37)
342 Medium 0 - 12 Months
IX-15 Determine the root cause(s) of the claims against JCP&L’s underground locates contractor and develop a plan to minimize the causes. (Refer to Finding IX-54)
377 Medium 6 - 12 Months
IX-16 Perform periodic audits of the contractor(s) that are providing JCP&L with underground locates services. (Refer to Finding IX-55)
377 Medium 6-12 Months
X. Customer Service 387
X-1 Maintain or achieve customer service performance levels that result in overall customer satisfaction, making improvements where cost-effective. (Refer to Finding X-3, Finding X-5, Finding X-6, Finding X-7, and Finding X-10)
430 High 0 – 12 Months
X-2 In conjunction with the FE/Allegheny Energy merger integration process, identify and implement the most efficient organizational design to effectively perform customer complaint management processes. (Refer to Finding X-4)
431 Medium 0 – 12 Months
X-3 In conjunction with the FE/Allegheny Energy merger integration process and then periodically thereafter, review and evaluate the use of call center resources, both internal and through contractors, in which these periodic reviews consider cost-effectiveness, as well as other relevant factors, including quality, experience, labor pool diversification, and disaster recovery. (Refer to Finding X-8)
431 High 0 – 12+ Months
X-4 Re-evaluate AMR, AMI, and communication devices for inside meters to reduce estimated meter reads and to lower meter-reading costs. (Refer to Finding 12 and Finding X-13)
431 Low 0 – 12 Months
X-5 Complete the JCP&L meter reading rerouting process within six months. (Refer to Finding X-15 )
432 Medium 0 – 6 Months
X-6 In conjuction with the FE/Allegheny Energy reorganization merger integration process, identify and implement the most efficient organizational design to effectively perform the economic development function, including New Jersey. (Refer to Finding X-23)
432 Low 0 – 12 Months
XI. Clean Energy 433

8 Final Report
6/20/2011
Description
Page
Priority
Initiation Timeframe
XII. Support Services 441
XII-1 Conduct periodic, formal risk management studies. (Refer to Finding XII-1) 449 Low 0-6 Months
XII-2 Conduct periodic, formal insurance studies. (Refer to Finding XII-3) 449 Low 0-6 Months
XII-3 Strengthen Legal Department objectives and associated KPIs, including responding to survey results. (Refer to Finding XII-4)
467 Medium 6-12 Months
XII-4 Perform a cost/benefit analysis to determine whether state regulatory work should be performed primarily internally or externally in the future, and incorporate the development of RFPs into this decision-making process. (Refer to Finding XII-5)
467 High 0-6 Months
XII-5 Establish formal written Claims function documentation for all FE groups managing claims. (Refer to Finding XII-6)
468 Medium 6-12 Months
XII-6 Perform an investigation and resulting cost/benefit analysis to see if FE’s claims system should be replaced. (Refer to Finding XII-7)
468 Medium 12+ Months
XII-7 Begin providing formal reports to JCP&L senior management regarding claims and legal cases activities. (Refer to Finding XII-8)
468 High 6-12 Months
XII-8 Develop a Facilities Master Plan. (Refer to Finding XII-10) 475 Medium 6-12 Months
XII-9 Improve JCP&L turnover rate to 2.1, the level already achieved in 2005. (Refer to Finding XII-15)
484 Medium 0 – 12 Months
XII-10 Improve the JCP&L central storeroom fill rate to 94%, the level already achieved by FEU/Ohio Edison. (Refer to Finding XII-15)
484 Medium 0 – 12 Months
XII-11 Measure the amount and cost of field crew lost time due to material availability (stock out) problems. (Refer to Finding XII-16)
484 Medium 0 – 12 Months
XII-12 Monitor the effect of FE Supply Chain staffing reductions on JCP&L and address adverse impacts as appropriate. (Refer to Finding XII-17)
485 Low 0 – 12 Months
XII-13 Resume Supply Chain participation in benchmarking programs by 2012. (Refer to Finding XII-18)
485 Low 0 – 24 Months
XII-14 Consider adding Supply Chain staff to standards committees. (Refer to Finding XII-19)
485 Low 0 – 12 Months
XII-15 Accelerate the consideration of consolidating the two JCP&L regional storerooms. (Refer to Finding XII-20)
485 Medium 0 – 12 Months
XII-16 Investigate the possibility of vendor resupply of JCP&L central and work center storerooms and/or additional outsourcing of logistics and warehousing functions. (Refer to Finding XII-21)
486 Medium 0 – 12 Months
XII-17 Reinstate JCP&L fleet replacements and catch up to both the FEU fleet replacement guidelines and the fleet replacement strategy within five years, if practicable and cost beneficial. (Refer to Finding XII-25)
501 Medium 0 – 12 Months
XII-18 Accelerate the implementation of scheduling preventive maintenance through a combination of mileage or engine hours of use and elapsed calendar time, if feasible and cost beneficial. (Refer to Finding XII-26)
502 Medium 0 – 12 Months
XII-19 Implement the tracking of fuel usage by vehicle and add fuel use efficiency to the evaluations of individual vehicle and class-of-equipment performance and cost, if feasible and cost beneficial. (Refer to Finding XII-27)
502 Low 0 – 12 Months
XII-20 Conduct a thorough lease-versus-buy analysis before resuming the acquisition of vehicles and equipment for JCP&L. (Refer to Finding XII-28)
502 High 0 – 6 Months

Final Report 9
6/20/2011
Description
Page
Priority
Initiation Timeframe
XII-21 In conjunction with the FE/Allegheny Energy merger integration process, and regularly thereafter, identify and implement the most efficient organizational design to effectively perform the IT function across FE. (Refer to Finding XII-29)
529 High 12+ Months
XII-22 Incorporate technology direction into IT’s strategic planning process. (Refer to Finding XII-30)
529 High 6-12 Months
XII-23 Expand the PMO to take on additional responsibilities. (Refer to Finding XII-32)
529 Medium 12+ Months
XII-24 Expand FirstEnergy’s commitment to project management by incorporating all IT employees who are responsible for project delivery into a PMP certification program and closely monitor implementation of this program, whereby all appropriate staff achieve PMP certification to ensure timely progress is made. (Refer to Finding XII-33)
530 Medium 12+ Months
XII-25 Implement a relevant IT dashboard. (Refer to Finding XII-34) 530 High 6-12 Months
XII-26 Expedite completion of SLAs with all major client groups. (Refer to Finding XII-36)
531 High 12+ Months
XII-27 Transition to the use of the remote management software’s wake-up capability. (Refer to Finding XII-39)
531 Medium 12+ Months
XII-28 Take and enforce a more aggressive posture with regard to having departments follow FE’s records management program. (Refer to Finding XII-40)
539 High 12+ Months

10 Final Report
6/20/2011
B. Company Background
JCP&L History and Background
JCP&L was organized under the laws of the state of New Jersey in 1925. It owns property and does business as an electric public utility in that state. JCP&L provides transmission and distribution services across 3,200 square miles of northern, western, and east central New Jersey. The area it serves has a population of approximately 2.6 million. JCP&L complies with the regulations, orders, policies, and practices prescribed by the U.S. Securities and Exchange Commission (SEC), (FERC), and the New Jersey Board of Public Utilities (NJBPU).
JCP&L is a FirstEnergy subsidiary that transmits/distributes electricity to about 2.6 million homes and businesses in 13 counties throughout central and northern New Jersey. JCP&L operates more than 19,770 miles of distribution lines. Its 2,160-mile transmission system is overseen by the regional transmission organization (RTO) PJM Interconnection. The utility also has power plant interests. Key 2009 financials for JCP&L are shown in Exhibit I-2.
Exhibit I-2 JCP&L Key 2009 Financials
as of December 31, 2009
Category Description
Company Type Electric Operating Subsidiary of FirstEnergy Fiscal Year End December 2009 Electric Operating Revenue $2.9 Billion 1-Year Sales Revenue Growth (–8.24%) 2009 Net Income $170,498,826 2009 Employees 1,432 2009 Bargaining Unit Employees 1,092 1-Year Employee Growth (–2.6%)
Source: JCP&L FERC Form 1

Final Report 11
6/20/2011
FirstEnergy Corporation Background
FirstEnergy Corporation was organized under the laws of the state of Ohio in 1996. It is a diversified energy company headquartered in Akron, Ohio. FirstEnergy’s principal business is the holding, directly or indirectly, of all of the outstanding common stock of its eight principal electric utility operating subsidiaries (i.e., Ohio Edison Company (OE), Cleveland Electric Illuminating Company (CEI), Toledo Edison Company (TE), Pennsylvania Power Company (Penn Power), American Transmission Systems, Inc. (ATSI), Jersey Central Power & Light Company (JCP&L), Metropolitan Edison Company (Met-Ed), and Pennsylvania Electric Company (Penelec)) and of its generating and marketing subsidiary, FirstEnergy Solutions (FES). Its subsidiaries and affiliates are involved in the generation, transmission, and distribution of electricity as well as energy management and other energy-related services.
FirstEnergy’s consolidated revenues are primarily derived from electric service provided by its utility operating subsidiaries and the revenues of its other principal subsidiary: FirstEnergy Solutions (FES). In addition, FirstEnergy holds all of the outstanding common stock of other direct subsidiaries, including FirstEnergy Properties, Inc.; FirstEnergy Ventures (FEV); FirstEnergy Nuclear Operating Company (FENOC); FELHC, Inc.; FirstEnergy Facilities Services Group, LLC; FirstEnergy Fiber Holdings Corp.; GPU Power, Inc.; GPU Nuclear, Inc.; MARBEL Energy Corporation; and FirstEnergy Service Company (FESC).
FirstEnergy’s combined service areas encompass approximately 36,100 square miles in Ohio, New Jersey, and Pennsylvania. The areas it serves have a combined population of approximately 11.3 million. Its seven electric utility operating companies comprise the nation’s fifth largest investor-owned electric system based on serving 4.5 million customers in Ohio, Pennsylvania, and New Jersey. Moreover, its generation subsidiaries own or operate nearly 14,000 megawatts of capacity.
As of December 31, 2009, FirstEnergy’s subsidiaries had a total of 13,379 employees located in the United States. Some key financials for FirstEnergy are shown in Exhibit I-3.

12 Final Report
6/20/2011
Exhibit I-3 FirstEnergy Key 2009 Financials
as of December 31, 2009
Category Description
Fiscal Year End December 2009 Basic Earnings $3.31 per share of common stock ($3.29 diluted) on net income of $990 million
and revenue of $12.97 billion 2008 Basic Earnings $4.41 per share of common stock ($4.38 diluted) on net income of $1.34 billion
and revenue of $13.63 billion. 2009 Consolidated Electric Sales (–9%) compared with 2008, related to economic and weather conditions and
changes in generation supply and pricing for the Ohio load 2009 Retail Market Sales (–8%) compared with the fourth quarter of 2008 2009 Wholesale Market Sales (–14%) compared with the fourth quarter of 2008 2009 Consolidated Generation Sales (–12%) compared with the fourth quarter of 2008 2009 Total Distribution Deliveries (–7%) compared to 2008 and (–3%) in the 4th quarter
Source: FE FERC Form 1
In addition to lower distribution and wholesale generation revenues, adjusted results for the full year and fourth quarter 2009 were impacted by higher purchased power costs, a reduction in transition cost recovery in Ohio, and higher pension costs. These factors were partially offset by lower operation and maintenance expenses, higher investment income, the impact of delivery service improvement riders in Ohio, and a lower effective income tax rate.
C. JCP&L 2005 to 2009 Annual Statistics
During the management audit, Schumaker & Company consultants developed a brief historical perspective on JCP&L by compiling a five-year history of some of the key financial and other statistics. This background and perspective was reviewed by all the consultants on the project at the beginning of the project to provide further understanding the current situation at JCP&L. This information is provided here to assist the reader in understanding some of the items discussed in the report. In developing this section, Schumaker & Company reviewed the Federal Energy Regulatory Commission (FERC) Form No. 1: Annual Report of Major Electric Utilities, Licensees, and Others for the years 2005 through 2009, along with other documents furnished by JCP&L. FERC publishes relevant information on financial and physical operations. Collected data include all line items from balance sheet, income statement, cash flows, plant in service, depreciation, depletion and amortization, taxes, salaries, operating revenue, sales, number of customers, operation and maintenance expenses, environmental facilities and expenses, and much more. The following annual statistics of JCP&L for the years 2005 through 2009 use FERC Form 1 as their major source of data.

Final Report 13
6/20/2011
Total Plant in Service
Total plant in service and growth by years are shown in Exhibit I-4. Total plant in service has increased by 6.7% over the last five years, as shown in Exhibit I-4. However, the rate of increase has been reduced from the 2005 to 2006 timeframe due to a decrease in capital spending.
Exhibit I-4 Total Plant in Service & Growth by Year
2005 to 2009
Source: FERC Form 1, p. 200
Plant in Service (classified)
Accum Prov for Depr, Amort, & Depl Total Plant in Service
2005 $3,601,463,980 $1,595,909,319 $2,005,554,6612006 $3,858,490,768 $1,623,350,351 $2,235,140,4172007 $4,031,577,591 $1,667,187,807 $2,364,389,7842008 $4,163,616,651 $1,701,480,718 $2,462,135,9332009 $4,367,670,955 $1,767,818,841 $2,599,852,114
$0$500,000,000
$1,000,000,000$1,500,000,000$2,000,000,000$2,500,000,000$3,000,000,000$3,500,000,000$4,000,000,000$4,500,000,000$5,000,000,000
Plant in Service
(classified)
Accum Prov for Depr, Amort, &
Depl
Total Plant in Service
Compound Growth/Loss 2005-2009 4.94% 2.59% 6.70%
0.00%
1.00%
2.00%
3.00%
4.00%
5.00%
6.00%
7.00%
8.00%
a t Se v ce
Percentage Growth by Year
2005 to 2006 11.4%2006 to 2007 5.8%2007 to 2008 4.1%2008 to 2009 5.6%
0.0%
2.0%
4.0%
6.0%
8.0%
10.0%
12.0%
14.0%
Dollar Growth by Year
2005 to 2006 $229,585,7562006 to 2007 $129,249,3672007 to 2008 $97,746,1492008 to 2009 $137,716,181
$0
$50,000,000
$100,000,000
$150,000,000
$200,000,000
$250,000,000

14 Final Report
6/20/2011
Operating Revenue
Operating revenues trends are shown in Exhibit I-5.
Exhibit I-5 Total Operating Revenue
2005 to 2009
Source: FERC Form 1 page 300
Operating revenues experienced a decrease in 2009 after having increased in each of the previous four years, as shown in Exhibit I-5. The sales for resale category are primarily associated with certain legacy costs involving non-utility generators.
Residential Small Commercial and Industrial
Large Commercial and Industrial
Public Street & Highway Lighting
Sales to Public Authorities Sales for Resale Provision for Rate
Refunds Other Revenues Total Operating Revenue
2005 $1,177,914,907 $888,037,168 $147,207,097 $20,509,615 -$30,411,611 $320,522,350 $0 $48,150,637 $2,571,930,1632006 $1,224,803,312 $979,221,075 $144,640,389 $21,484,479 -$41,109,408 $254,323,755 $0 $43,278,947 $2,626,642,5492007 $1,473,856,460 $1,181,665,888 $165,161,286 $23,703,738 -$58,447,443 $352,608,063 $0 $46,959,711 $3,185,507,7032008 $1,592,893,975 $1,225,595,852 $168,709,818 $24,863,878 -$50,467,165 $414,652,691 -$347,227 $45,990,911 $3,421,892,7332009 $1,551,717,994 $1,041,002,587 $145,591,172 $24,434,370 -$45,234,139 $182,328,210 $347,227 $47,372,368 $2,947,559,789
-$200,000,000$0
$200,000,000$400,000,000$600,000,000$800,000,000
$1,000,000,000$1,200,000,000$1,400,000,000$1,600,000,000$1,800,000,000$2,000,000,000$2,200,000,000$2,400,000,000$2,600,000,000$2,800,000,000$3,000,000,000$3,200,000,000$3,400,000,000$3,600,000,000
ResidentialSmall
Commercial and Industrial
Large Commercial
and Industrial
Public Street & Highway Lighting
Sales to Public Authorities Sales for Resale Provision for
Rate RefundsOther
Revenues
Total Operating Revenue
Compound Growth/Loss 2005-2009 7.13% 4.05% -0.28% 4.47% 10.43% -13.15% 0.00% -0.41% 3.47%
-15.00%
-10.00%
-5.00%
0.00%
5.00%
10.00%
15.00%

Final Report 15
6/20/2011
Sales by Volume (Megawatt Hours (MWh))
Sales by volumes are shown in Exhibit I-6.
Exhibit I-6 Sales by Volume (MWh)
2005 to 2009
Source: FERC Form 1 page 304
Overall sales have been decreasing in the last five years, with the large commercial and industrial customers showing the biggest decrease (–5.54%), as shown in Exhibit I-6. In that JCP&L is only a delivery company, these numbers do not reflect its energy sales. MWh as Reported is shown in Exhibit I-7.
Residential Small Commercial and Industrial
Large Commercial and Industrial
Public Street & Highway Lighting
Total Megawatt Hours Sold
2005 10,106,918 9,431,766 3,073,951 86,779 22,699,4142006 9,547,790 9,450,490 2,831,040 86,180 21,915,5002007 9,838,800 9,867,446 2,884,540 88,265 22,679,0512008 9,667,364 9,706,944 2,773,128 88,385 22,235,8212009 9,213,827 9,323,204 2,447,113 87,453 21,071,597
0
5,000,000
10,000,000
15,000,000
20,000,000
25,000,000
Residential
Small Commercial
and Industrial
Large Commercial
and Industrial
Public Street & Highway Lighting
Total Megawatt
Hours Sold
Compound Growth/Loss 2005-2009 -2.29% -0.29% -5.54% 0.19% -1.84%
-6.00%
-5.00%
-4.00%
-3.00%
-2.00%
-1.00%
0.00%
1.00%

16 Final Report
6/20/2011
Exhibit I-7 MWh as Reported
2005 to 2009
Source: FERC Form 1, p. 401a
Total MWh received and delivered have decreased in a similar manner, as shown in Exhibit I-7.
Total MWH Received
Energy Losses Unaccounted For
Total MWH Delivered
2005 24,669,380 1,465,445 24,669,380 2006 24,012,793 1,411,897 24,012,793 2007 24,907,868 1,959,196 24,907,868 2008 23,182,626 1,210,456 23,182,626 2009 19,470,669 987,993 19,470,669
0
5,000,000
10,000,000
15,000,000
20,000,000
25,000,000
30,000,000
Unaccounted For as Percent of Total Delivered
2005 5.9%2006 5.9%2007 7.9%2008 5.2%2009 5.1%Compound Growth/Loss
2005-2009 -3.86%
-6.0%-4.0%-2.0%0.0%2.0%4.0%6.0%8.0%
10.0%
Total MWH Received
Energy Losses Unaccounted For
Total MWH Delivered
Compound Growth/Loss 2005-2009 -5.74% -9.39% -5.74%
-10.00%
-9.00%
-8.00%
-7.00%
-6.00%
-5.00%
-4.00%
-3.00%
-2.00%
-1.00%
0.00%

Final Report 17
6/20/2011
JCP&L Total Employees (End of Year)
JCP&L’s employee counts for 2005 through 2009 have been obtained from FirstEnergy SEC 10-K annual reports. JCP&L had a one-year employee loss from 2008 to 2009 of 2.59%. This information is shown in Exhibit I-8.
Exhibit I-8 JCP&L Employees (End of Year)
2005 to 2009
Source: SEC.gov Archives/edgar/data 10-K Annual Reports
The total number of employees has remained flat over the last five years after peaking in 2007, as shown in Exhibit I-8.
CompoundGrowth/Loss
2005 2006 2007 2008 2009 2005-2009Total Employees at Year End 1,416 1,448 1,482 1,470 1,432 0.28%
1,380
1,400
1,420
1,440
1,460
1,480
1,500
2005 2006 2007 2008 2009

18 Final Report
6/20/2011
Operating and Maintenance Expenses
Trends in operating and maintenance expenses are shown in Exhibit I-9.
Exhibit I-9 Operating & Maintenance Expenses
2005 to 2009
Source: FERC Form 1, pp. 320-323
JCP&L has made some significant reductions in operations and maintenance expenses, specifically in 2009, as shown in Exhibit I-9. Total distribution expenses have been reduced the most at 10.45%.
Total Power Production Expenses
Total Transmission
Expenses
Total Regional Transmission &
Market Op Expns*
Total Distribution
Expenses
Total Customer Accounts Expenses
Total Cust. Service &
Information Expenses
Total Sales Expenses
Total Admin & General
Expenses
Total Electric Operating & Maintenance
Expenses
2005 $1,444,834,133 $30,594,886 $0 $118,096,604 $34,479,059 $89,771,676 $5 $87,650,224 $1,805,426,5872006 $1,530,536,017 $28,359,940 $72,721 $102,821,227 $35,665,278 $86,181,162 $0 $58,499,280 $1,842,135,6252007 $1,966,426,375 $28,723,653 $69,683 $115,500,526 $37,309,332 $85,130,769 $0 $50,319,434 $2,283,479,7722008 $2,210,998,842 $25,750,991 $39,684 $113,114,858 $38,592,092 $98,281,349 $0 $21,796,436 $2,508,574,2522009 $1,785,790,990 $25,249,534 $85,704 $75,945,317 $32,957,459 $104,874,573 $0 $67,070,622 $2,091,974,199
$0$220,000,000$440,000,000$660,000,000$880,000,000
$1,100,000,000$1,320,000,000$1,540,000,000$1,760,000,000$1,980,000,000$2,200,000,000$2,420,000,000$2,640,000,000
Total Power Production Expenses
Total Transmission
Expenses
Total Regional
Transmission & Market Op
Expns*
Total Distribution
Expenses
Total Customer Accounts Expenses
Total Cust. Service &
Information Expenses
Total Sales Expenses
Total Admin & General Expenses
Total Electric Operating & Maintenance
Expenses
Compound Growth/Loss 2005-2009 5.44% -4.69% 5.57% -10.45% -1.12% 3.96% 0.00% -6.47% 3.75%
-12.00%-10.00%-8.00%-6.00%-4.00%-2.00%0.00%2.00%4.00%6.00%8.00%
* Compound Growth/Loss is 2006-2009

Final Report 19
6/20/2011
Performance Ratios
For the time period spanning 2005–2009, the JCP&L compound growth rate in electric operating revenues was 3.47% and the average number of customers per month was 0.62%, whereas the compound growth rate in volume was –1.84%.
Exhibit I-10 Performance Ratios
2005 to 2009
Source: FERC Form 1
2005 2006 2007 2008 2009Total Power Production Expenses $1,444,834,133 $1,530,536,017 $1,966,426,375 $2,210,998,842 $1,785,790,990 5.44%Total Distribution Expenses $118,096,604 $102,821,227 $115,500,526 $113,114,858 $75,945,317 -10.45%Total Customer Service and Information Expenses $89,771,676 $86,181,162 $85,130,769 $98,281,349 $104,874,573 3.96%Total Customer Account Expenses $34,479,059 $35,665,278 $37,309,332 $38,592,092 $32,957,459 -1.12%Total Administrative & General Expenses $87,650,224 $58,499,280 $50,319,434 $21,796,436 $67,070,622 -6.47%Total Regional Transmission & Market Op Expns* $0 $72,721 $69,683 $39,684 $85,704 5.57%
Average Number of Customers per Month 1,067,246 1,077,948 1,085,244 1,089,980 1,093,885 0.62%Power Production Expenses per Thousand Customers $1,353,797 $1,419,861 $1,811,967 $2,028,477 $1,632,522 4.79%Distribution Expenses per Thousand Customers $110,655 $95,386 $106,428 $103,777 $69,427 -11.00%Customer Account, Services & Information Expenses per Thousand Customers $116,422 $113,036 $112,823 $125,574 $126,002 2.00%Administrative & General Expenses per Thousand Customers $82,127 $54,269 $46,367 $19,997 $61,314 -7.05%Regional Transmission & Mrk Op Expns Expenses per Thousand Customers* $0 $67 $64 $36 $78 5.06%
Total Operating Revenue $2,571,930,163 $2,626,642,549 $3,185,507,703 $3,421,892,733 $2,947,559,789 3.47%Operating Revenues (Residential, Commercial, & Industrial) $2,213,159,172 $2,348,664,776 $2,820,683,634 $2,987,199,645 $2,738,311,753 5.47%Power Production Expenses as Percent of Total Operating Revenue 56.18% 58.27% 61.73% 64.61% 60.59% 1.91%Distribution Expenses as Percent of Total Operating Revenue 4.59% 3.91% 3.63% 3.31% 2.58% -13.45%Customer Account, Services & Info Expenses as Percent of Total Operating Revenue 4.83% 4.64% 3.84% 4.00% 4.68% -0.81%Administrative & General Expenses as Percent of Total Operating Revenue 3.41% 2.23% 1.58% 0.64% 2.28% -9.61%Regional Transmission & Mrk Op Expns Expenses as Percent of Total Operating Revenue 0.00% 0.00% 0.00% 0.00% 0.00% N/A
Megawatt Hours Sold 22,699,414 21,915,500 22,679,051 22,235,821 21,071,597 -1.84%Power Production Expenses per MWH $63.65 $69.84 $86.71 $99.43 $84.75 7.42%Distribution Expenses per MWH $5.20 $4.69 $5.09 $5.09 $3.60 -8.77%Customer Account, Services & Information Expenses per MWH $5.47 $5.56 $5.40 $6.16 $6.54 4.55%Administrative & General Expenses per MWH $3.86 $2.67 $2.22 $0.98 $3.18 -4.72%Regional Transmission & Mrk Op Expns Expenses per MWH $0.00 $0.00 $0.00 $0.00 $0.00 N/A
* Compound Growth/Loss calculated for 2006-2009 only
Compound Growth/Loss
2005-2009
$0 $67 $64 $36 $78
$1,353,797$1,419,861
$1,811,967
$2,028,477
$1,632,522
$0
$500,000
$1,000,000
$1,500,000
$2,000,000
$2,500,000
$0
$20,000
$40,000
$60,000
$80,000
$100,000
$120,000
$140,000
2005 2006 2007 2008 2009
Performance Ratios per Thousand Customers
Distribution Expenses
Customer Account, Service & Info Expenses
Administrative & General Expenses
Sales Expenses
Power Production Expenses

20 Final Report
6/20/2011
Exhibit I-13 Performance Ratios
2005 to 2009 (continued)
0.00% 0.00% 0.00% 0.00% 0.00%
56.18%58.27%
61.73%64.61%
60.59%
0.00%
10.00%
20.00%
30.00%
40.00%
50.00%
60.00%
70.00%
0.00%
1.00%
2.00%
3.00%
4.00%
5.00%
6.00%
2005 2006 2007 2008 2009
Performance Ratios as Percent of Customer Class Revenue
Distribution Expenses
Customer Account, Services & Info Expenses
Administrative & General Expenses
Sales Expenses
Power Production Expenses
$0.00 $0.00 $0.00 $0.00 $0.00
$63.65$69.84
$86.71
$99.43
$84.75
$0.00
$20.00
$40.00
$60.00
$80.00
$100.00
$120.00
$0.00
$1.00
$2.00
$3.00
$4.00
$5.00
$6.00
$7.00
2005 2006 2007 2008 2009
Performance Ratios per MWH
Distribution Expenses
Customer Account, Services & Info Expenses
Administrative & General Expenses
Sales Expenses
Power Production Expenses