Jens Schulte-Bockum
16
The App Effect Jens Schulte-Bockum CEO Vodafone Netherlands VINT Symposium - 7 June 2011 .
-
Upload
theappeffect -
Category
Technology
-
view
2.038 -
download
4
description
Transcript of Jens Schulte-Bockum

The App Effect
Jens Schulte-BockumCEO Vodafone Netherlands
VINT Symposium - 7 June 2011.

=
Apps = Smartphones
6558
6776
83
72
3542
3324
17
28
0%
10%
20%
30%
40%
50%
60%
70%
80%
90%
100%
15-18 19-29 30-39 40-49 50-64 Market
Normal Smartphone
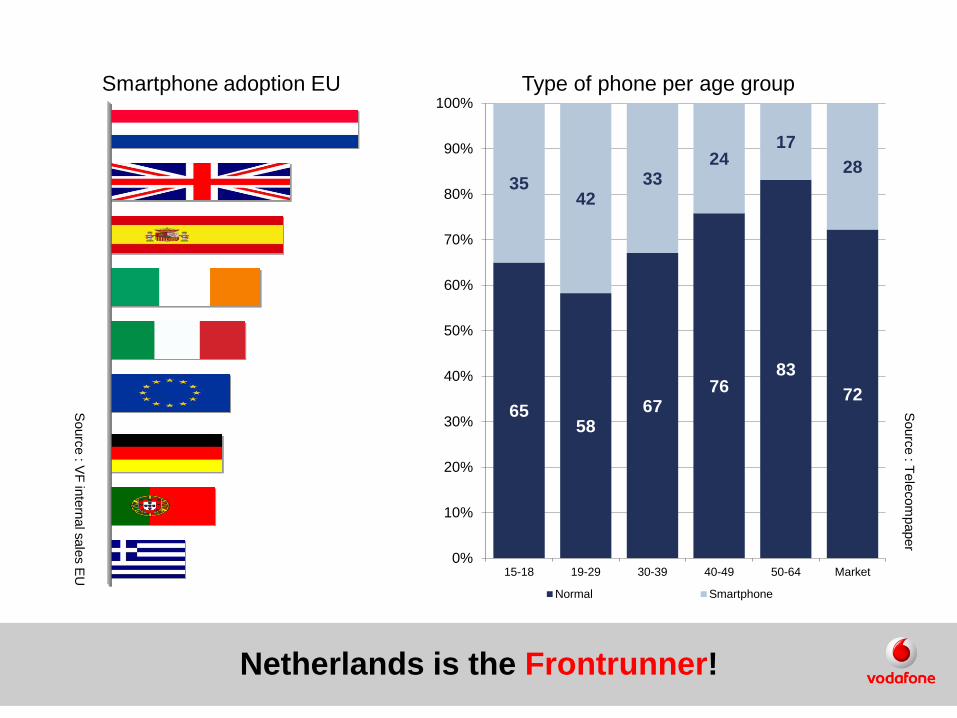
Share of type of mobile phone per age group (%). Source:TPCP
Sourc
e : T
ele
com
paper
Smartphone adoption EU Type of phone per age group
Sourc
e : V
F in
tern
al s
ale
s E
U
Netherlands is the Frontrunner!

250 TB
Source : Vodafone Network data
apr-09 jul-09 okt-09 jan-10 apr-10 jul-10 okt-10 jan-11
Other
M2M
HHBD
IOYM
MBB
To
tal n
etw
ork
Te
ra B
yte
s
Data growth from apps, mobile web and email

0
2
4
6
8
10
12
14
-13 -12 -11 -10 -9 -8 -7 -6 -5 -4 -3 -2 -1 0 1 2 3 4 5 6 7 8 9 10 11 12 13 14 15 16 17 18 19 20 21 22 23 24
Days since first iPhone use
Av
era
ge
Da
ily
MB
Us
ed
Old device
0,75 MB per day
iPhone
6 – 12 MB per day
Dail
y u
se
r M
B’s
Clear iPhone effect
Source : Vodafone Network data

Apps usage insights
.

Beginners
31%
Organizers
26%
Addicts
12%
Socializers
31%
Profiles of apps usersFour groups of users, based on different motives
Source:
9894
87
61
39 38
148
0
10
20
30
40
50
60
70
80
90
100
socializers addicts organizers beginners
Use more than once per day
Use 1 hour or more per day
Apps usage per profile:

The app effect Big impact on our life
10
3432
20
5
0
5
10
15
20
25
30
35
40
totally agree agree neutral disagree totally disagree
“Apps have changed my life”
“Because it makes my life easier…”
“It seems fun and entertaining”
“It’s new and I’m curious about what it does”
“Because it will make me more productive”
Needs / Motivations:
Connectivity
Entertainment
Productivity
Source:

79
71 7066
5550 49
40
28 26 25 24 23
17 16 1610 8 3
0
10
20
30
40
50
60
70
80
90
Favourite usage of apps Social media #1, followed by gaming, news, weather and navigation
Source :
Connectivity
Entertainment
Productivity

M Tu W Th F Sa Su
0%
1%
2%
3%
4%
5%
6%
7%
12am 2a
m4a
m6a
m8a
m
10am
12pm 2p
m4p
m6p
m8p
m
10pm
Total HTC
Thurs Apple
Sunday
0
1000
2000
3000
4000
5000
6000
7000
0
100000
200000
300000
400000
500000
600000
700000
M Tu W Th F Sa Su
Streaming
VOIP (RH axis)
0%
2%
4%
6%
8%
10%
12am 2am 4am 6am 8am 10am 12pm 2pm 4pm 6pm 8pm 10pm
EmailStreamingVOIP
IOYM General Traffic Distribution
IOYM Application Traffic Distribution
Data usage patterns from our network Per day of the week and per day
Source : Vodafone network data

Source : Vodafone network data
12h00
24h00
Daily usage pattern of social media apps

Future outlook
.
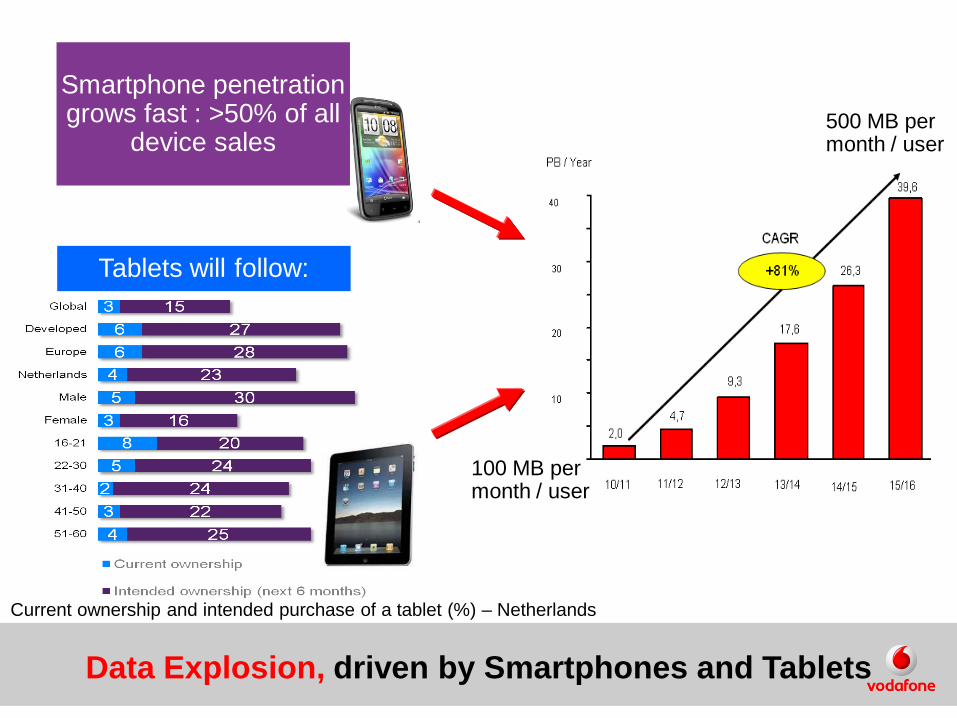
Data Explosion, driven by Smartphones and Tablets
Current ownership and intended purchase of a tablet (%) – Netherlands
Tablets will follow:
Smartphone penetration grows fast : >50% of all
device sales
100 MB per month / user
500 MB per month / user

Re-balance
Challenge from free communication Apps
Re-balance to profit from data growth
Grow new revenues
Challenging the way we do business We’re in transition to alternative business models

What are the ingredients for success?
Ensure best network (HSDPA+ / LTE)
Ensure seamless customer experience
Ensure key enablers: safety, payment, distribution