JENS GÖTZE YUANMING PAN2 MARION STEVENS-KALCEFF …E-Mail: [email protected] 49 50 . 3...
53
1 Revision 2 1 Origin and significance of the yellow cathodoluminescence (CL) of quartz 2 3 JENS GÖTZE 1, *, YUANMING PAN 2 , MARION STEVENS-KALCEFF 3 , ULF KEMPE 1 , 4 AND AXEL MÜLLER 4,5 5 6 1 TU Bergakademie Freiberg, Institute of Mineralogy, Brennhausgasse 14, 09596 Freiberg, Germany 7 2 University of Saskatchewan, Department of Geological Sciences, Saskatoon, SK S7N5E2, Canada 8 3 University of New South Wales, School of Physics and Electron Microscope Unit, Sydney, NSW 2052, Australia 9 4 Norges Geologiske Undersøkelse, Leiv Eirikssons vei 39, N-7040 Trondheim, Norway 10 5 Natural History Museum,Cromwell Road, London SW7 5BD, United Kingdom 11 12 13 ABSTRACT 14 15 The origin of yellow cathodoluminescence (CL) in quartz has been investigated by a 16 combination of CL microscopy and spectroscopy, electron paramagnetic resonance (EPR) 17 spectroscopy and spatially resolved trace-element analysis by laser ablation inductively coupled 18 plasma-mass spectrometry (LA ICP-MS). The study shows that the appearance of a ~570 nm 19 (2.17 eV) emission band can be attributed to high oxygen deficiency and local structural disorder 20 in quartz. A proposed luminescence center model implies self-trapped exciton (STE) emission 21 from localized amorphized regions in quartz. Although the high intensity emission at 570 nm is 22 in general consistent with high concentrations of E´ 1 defects detected by EPR spectroscopy, CL 23 studies with different electron beam parameters and annealing experiments up to 600 °C show a 24 temperature and irradiation dependence of the luminescence related defects excluding the role of 25
Transcript of JENS GÖTZE YUANMING PAN2 MARION STEVENS-KALCEFF …E-Mail: [email protected] 49 50 . 3...

1
Revision 2 1
Origin and significance of the yellow cathodoluminescence (CL) of quartz 2
3
JENS GÖTZE1,*, YUANMING PAN2, MARION STEVENS-KALCEFF3, ULF KEMPE1, 4
AND AXEL MÜLLER4,5 5
6
1TU Bergakademie Freiberg, Institute of Mineralogy, Brennhausgasse 14, 09596 Freiberg, Germany 7 2University of Saskatchewan, Department of Geological Sciences, Saskatoon, SK S7N5E2, Canada 8
3University of New South Wales, School of Physics and Electron Microscope Unit, Sydney, NSW 2052, Australia 9 4 Norges Geologiske Undersøkelse, Leiv Eirikssons vei 39, N-7040 Trondheim, Norway 10
5 Natural History Museum,Cromwell Road, London SW7 5BD, United Kingdom 11
12 13
ABSTRACT 14
15
The origin of yellow cathodoluminescence (CL) in quartz has been investigated by a 16
combination of CL microscopy and spectroscopy, electron paramagnetic resonance (EPR) 17
spectroscopy and spatially resolved trace-element analysis by laser ablation inductively coupled 18
plasma-mass spectrometry (LA ICP-MS). The study shows that the appearance of a ~570 nm 19
(2.17 eV) emission band can be attributed to high oxygen deficiency and local structural disorder 20
in quartz. A proposed luminescence center model implies self-trapped exciton (STE) emission 21
from localized amorphized regions in quartz. Although the high intensity emission at 570 nm is 22
in general consistent with high concentrations of E´1 defects detected by EPR spectroscopy, CL 23
studies with different electron beam parameters and annealing experiments up to 600 °C show a 24
temperature and irradiation dependence of the luminescence related defects excluding the role of 25

2
E’1 centers as direct luminescence activators for the 570 nm emission. The evaluation of 26
geochemical data shows that quartz with yellow CL occurs in low-temperature hydrothermal 27
environment (mostly <250 °C) and is related to fast crystallization in an environment with 28
oxygen deficiency. 29
30
31
32
33
Keywords: Cathodoluminescence (CL), yellow CL, quartz, electron paramagnetic resonance 34
(EPR), trace elements 35
36
37
38
39
40
41
42
43
44
45
___________________________________________________________________________ 46
* Present address: TU Bergakademie Freiberg, Institute of Mineralogy, Brennhausgasse 14, D-47
09596 Freiberg, Germany. E-Mail: [email protected] 48
49
50
3
INTRODUCTION 51
52
Quartz is one of the most abundant minerals in the Earth’s crust and therefore, knowledge 53
of its specific properties is indispensable for many mineralogical and geological investigations as 54
well as for its industrial use. The great interest in luminescence studies of quartz is due to the fact 55
that information not available by other analytical methods can be obtained. For instance, 56
cathodoluminescence (CL) can be used to reveal internal textures, growth zoning, secondary 57
alteration or different quartz generations which cannot be discerned by optical or electron 58
microscopy (e.g., Zinkernagel 1978; Ramseyer et al. 1988; Owen 1988; Ramseyer and Mullis 59
1990; Watt et al. 1997; Müller 2000; Götze et al. 2001a; Van den Kerkhof et al. 2004; Rusk et al. 60
2006, 2008; Krickl et al. 2008; Götze 2009; Müller et al. 2009, Jourdan et al. 2009a, b; Lehmann 61
et al. 2009). In addition, CL is an effective method for spatially resolved analysis of extrinsic or 62
intrinsic point defects in quartz by spectral measurements. The combination with electron 63
paramagnetic resonance (EPR) spectroscopy and spatially resolved trace-element analysis 64
provides information concerning the relation between different luminescence emission bands and 65
specific lattice defects in the quartz structure (e.g., Stevens-Kalceff and Phillips 1995; Müller 66
2000; Götze et al. 2001a; Van den Kerkhof et al. 2004; Götze et al. 2005; Stevens-Kalceff 2009; 67
Götze 2009; Götte and Ramseyer 2012). 68
The ideal structure of quartz is composed of SiO4 tetrahedra, where each Si atom is 69
surrounded by four oxygen atoms, and adjacent Si atoms are bridge-bonded through a single 70
oxygen atom (O3≡Si-O-Si≡O3). The CL emission of quartz is in general caused by a variety of 71
point defects including both substitutional trace elements and other lattice defects (see 72
compilation in Stevens-Kalceff 2009; Götze 2009). The defects associated with the different CL 73
emissions in quartz often reflect the specific physico-chemical conditions of crystal growth and 74
therefore, can be used as a signature for genetic conditions of mineral formation (e.g., Ramseyer 75

4
et al. 1988; Müller 2000; Götze et al. 2001a; Van den Kerkhof et al. 2004; Müller et al. 2009; 76
Götze 2009). 77
The most common CL emission bands in natural quartz are the 450 nm (2.75 eV) and 650 78
nm (1.91 eV) bands (Ramseyer et al. 1988; Götze et al. 2001a), and their nature is well known. 79
The emission observed at ~450 nm (2.7 eV) is associated with O-deficiency centers (ODC) in 80
quartz and is more or less identical in amorphous and crystalline SiO2 (Imai et al. 1988; Skuja 81
1994, 1998; Pacchioni and Ierano 1997). The 650 nm (1.9 eV) emission is attributed to the so-82
called non-bridging oxygen hole center (NBOHC), which can be formed from different precursor 83
defects (Stapelbroek et al. 1979; Siegel and Marrone, 1981; Stevens-Kalceff 2009). The common 84
occurrence of the luminescence emissions at 450 nm (2.75 eV) and 650 nm (1.91 eV) results in 85
bluish-violet CL colors, which are commonly detectable in quartz crystals from igneous, volcanic 86
and metamorphic rocks, as well as authigenic quartz from sedimentary environments. In quartz 87
from pegmatites, a characteristic transient emission around 500 nm (2.45 eV; bluish-green) is 88
observed (Götze et al. 2004, 2005), whereas a short-lived blue CL (emission band at 390 nm – 89
3.18 eV) is the typical feature of natural and synthetic hydrothermal quartz (Ramseyer and Mullis 90
1990; Perny et al. 1992; Götze et al. 2001a). Both emissions are related to alkali-compensated 91
trace-element centers in the quartz structure (Ramseyer and Mullis 1990; Perny et al. 1992; 92
Gorton et al. 1996; Götze et al. 2005). 93
A conspicuous feature is the occurrence of yellow luminescent quartz, which is restricted 94
to certain geological environments. In contrast to the luminescence behavior of quartz from 95
magmatic, metamorphic and sedimentary rocks, yellow CL (~580 nm) is uncommon and was up 96
to now detected exclusively in some natural hydrothermal quartz as well as cryptocrystalline 97
chalcedony and agate (Rink et al. 1993; Götze et al. 1999, 2001a). There are a few reports from 98
hydrothermal sulfide ore deposits (e.g., Moura et al. 2003; Drechsel et al. 2003; Ioannou et al. 99
2004) and hydrothermal gold deposits (e.g., Graupner et al. 2000; Takahashi et al. 2008; Gueye et 100

5
al. 2013), where the yellow luminescent quartz was mostly detected in late mineralization 101
sequences. In addition, quartz with yellow CL occurs in agate, silicified wood and hydrothermal 102
veins related to mineralization and alteration processes in volcanic rocks (Götze et al. 1999; 103
Götze and Rößler 2000; Möckel and Götze 2007), as well as hydrothermal biomineralization (e.g. 104
Müller et al. 2009). Sometimes, yellow luminescent quartz is associated with quartz showing 105
transient blue CL, which is characteristic for quartz crystallized from low temperature aqueous 106
solutions (compare Fig. 1a, k). 107
The observed relation of yellow luminescent quartz to specific physico-chemical 108
environments could make this conspicuous CL feature an important genetic indicator. However, 109
only a few suggestions concerning the origin of the yellow CL emission have been made up to 110
now. Ramseyer et al. (1988) assumed a connection between yellow CL in quartz and elevated 111
trace-element contents, and Müller (2000) concluded that the yellow CL in quartz may be 112
activated by Mn2+ ions. Luff and Townsend (1990) measured a 570 nm emission band in Ge-113
doped synthetic quartz crystals at low temperature (40 K), however, they were not able to 114
determine whether this emission can be definitively related to germanium. Other reports of 115
yellow luminescence in natural quartz (e.g., Rink et al. 1993, Götze et al. 1999, Götze 2009) 116
found an association with high concentrations of E’1 defects (electron defects related to an 117
oxygen vacancy). 118
The present study combines investigations by CL microscopy and spectroscopy with 119
investigations by EPR spectroscopy and locally-resolved trace element analyses to elucidate the 120
origin of yellow CL emission in quartz. The detailed characterization of defects involved in the 121
activation of the CL emission comprises annealing experiments of selected quartz samples to 122
determine the thermal stability and temperature dependent spectroscopic properties of the defect 123
centers. The investigation of geologically well-defined samples should prove the validity of 124
yellow luminescent quartz as an indicator for specific conditions of formation. 125

6
126
MATERIALS AND METHODS 127
128
Sample material 129
The sample material comprises quartz from different geological environments from 130
worldwide occurrences. We focused on sample material with knowledge available on the 131
geological background and data on the conditions of formation. The samples include quartz 132
associated with hydrothermal ore deposits, collo-/crustiform SiO2 from hydrothermal 133
mineralization, silicified wood and agates from altered volcanic rocks as well as hydrothermal 134
vein quartz. The specimens selected for the present study are compiled in Table 1. The estimated 135
temperatures of formation in Table 1 refer to fluid inclusion or oxygen isotope studies from the 136
cited publications. 137
One sample suite comprises quartz associated with different types of hydrothermal ore 138
mineralization. The first sample (HQF) originates from late-Variscan polymetallic veins of the 139
Freiberg district (Erzgebirge, Germany), which is situated within a metamorphic core complex 140
(Seifert 1999). Both quartz with short-lived blue CL and yellow CL occur in the hydrothermal 141
sulphide vein mineralization (Fig. 1a). Yellow CL is associated with primary quartz showing high 142
abundances of CO2-bearing fluid inclusions (Drechsel et al. 2003). 143
In the ~2.7 Ga Archean volcanogenic massive sulphide (VMS) mineralization of the 144
Abitibi Greenstone belt (Canada) quartz occurs associated with ore in stockwork, veins, and 145
interstitial fillings between lava pillows (Ioannou et al. 2003). Within the Noranda, Ben Nevis 146
and Matagami districts, short-lived yellow CL occurs in “late” secondary hydrothermal 147
generation of ore and stockwork quartz that crosscuts an earlier generation and infills the primary 148
breccia porosity (sample HQN - Fig. 1b). CL revealed colloform/crustiform textures suggesting 149
rapid silica precipitation, commonly associated with open space deposition (Ioannou et al. 2003). 150

7
In the giant Neves Corvo VMS deposit (Portugal), quartz with yellow CL is also 151
associated with sulfide mineralization and shows irregular textures and sometimes distinct sector 152
zoning (sample HQNC - Fig. 1c). Homogenization temperatures of more than 100 primary fluid 153
inclusions in quartz from the Neves Corve main thrust were measured between 142 °C and 238 154
°C (Moura et al. 2003). Details on the Neves Corvo geology are given in Sáez et al. (1996). 155
Yellow luminescent quartz was found in the giant Muruntau Au quartz vein deposit 156
(Uzbekistan), which lies in a sequence of flysch-like greenshist within the Central Kyzyl Kum 157
sub-zone of the Southern Tien-Shan (Kotov and Poritskaya 1992). Quartz with yellow CL was 158
detected in late secondary veinlets crosscutting the high-grade Au mineralized “central” quartz 159
veins (sample HQMu - Fig. 1d). Fluid inclusion studies indicate the formation from H2O-CO2 160
aqueous-carbonic fluids with low salinity and temperatures between 100 and 250 °C (Graupner et 161
al. 2000). 162
At the southern part of the Mátra Mts. (Hungary), in the neighborhood of Gyöngyöstarján, 163
variable cryptocrystalline silica varieties occur together with iron mineralization in fractures and 164
cavities of an andesite host rock (Czakó and Zelenka 1981). The genesis is related to the near 165
surface interaction of microbial activities with an inorganic hydrothermal vent system (Müller et 166
al. 2009). The fine-grained silica matrix, consisting of cryptocrystalline quartz with traces of 167
moganite and opal-CT, is characterized by bright yellow CL (sample CQMa - Fig. 1e). 168
Another sample suite includes quartz mineralization of different origin in altered volcanic 169
rocks. Several Permian volcanic events (288-298 Mio a) resulted in the formation of 170
hydrothermal veins, agates and silicified wood within layers of rhyolites, ignimbrites and tuffs in 171
the Erzgebirge basin, Germany (Schneider et al. 2005). For instance, quartz with yellow CL was 172
found in samples of silicified wood from Chemnitz, Germany (Götze and Rößler 2000). This type 173
of quartz was mostly detected in preserved cell structures, which were probably silicified via a 174
non-crystalline SiO2 precursor (sample SWCh - Fig. 1f). Yellow CL was also found in certain 175

8
agates from the acidic volcanic host rocks. The agates from St. Egidien (AStE), Hohenstein-176
Ernstthal (AHE) and Chemnitz (AChA), Germany occur in altered Permian ignimbrite and result 177
probably from late- to post-volcanic alteration processes (Möckel and Götze 2007). Both banded 178
cryptocrystalline chalcedony and macrocrystalline quartz exhibit the typical yellow CL (Fig. 179
1g/h). An agate sample from Gehlberg, Germany (sample AGeh) was incorporated into the 180
sample suite for comparison, because the genesis of this agate is very similar to the material from 181
the Erzgebirge basin. These agates formed in altered Permian volcanic rocks of the Thuringian 182
Forest, Germany (Holzhey 1993). Despite the very similar geological background and genetic 183
conditions of formation, chalcedony and quartz of these agates do not show the yellow CL. Fluid 184
inclusion and oxygen isotope studies indicate a temperature of formation around 100 °C 185
(Holzhey 1993). 186
Hydrothermally altered volcanic rocks from Chemnitz, Germany can also contain yellow 187
luminescent quartz as massive vein quartz with complicated internal textures (sample QChem - 188
Fig. 1i), sometimes showing alternating zones with transient blue and yellow CL (sample QCh - 189
Fig. 1k). 190
191
192
Analytical methods 193
Polished thin sections were prepared for microscopic and cathodoluminescence (CL) 194
investigations from all samples listed in Table 1. CL microscopy was carried out to document the 195
quartz samples and to find reliable areas for spectral CL analyses. As a result of the CL studies, 196
appropriate material for further analytical investigations was chosen. 197
Cathodoluminescence (CL) 198
CL measurements were performed on carbon-coated thin sections, first using a hot-199
cathode CL microscope HC1-LM (Neuser et al. 1995). The system was operated at 14 kV and 0.2 200

9
mA (~10 µA/mm2) with a defocused electron beam. Luminescence images were captured using a 201
Peltier cooled digital video-camera (OLYMPUS DP72). CL spectra in the wavelength range 370 202
to 920 nm were recorded with an Acton Research SP-2356 digital triple-grating spectrograph 203
with a Princeton Spec-10 CCD detector that was attached to the CL microscope by a silica-glass 204
fiber guide. CL spectra were measured under standardized conditions (wavelength calibration by 205
a Hg-halogen lamp, spot width 30 µm, measuring time 5 s). Irradiation experiments were 206
performed to document the behaviour of the quartz samples under electron bombardment. 207
Samples were irradiated for 10 minutes under constant conditions (14 kV, 0.2 mA) and spectra 208
were measured initially and after every 1 minute. 209
Spectral CL investigations over the spectral range 250-900 nm and monochromatic CL 210
imaging were carried out using a Schottky FESEM with Gatan XiCLone CL imaging and spectral 211
analysis system with a Peltier cooled Hamamatsu R943-02 high sensitivity photomultiplier 212
(Stevens-Kalceff 2013). The CL spectra were excited using a continuous electron beam (10keV, 213
45 nA, defocused, ~67 µA/mm2). In addition to the measurement of initial CL spectra, the spectra 214
as a function of irradiation exposure up to 1000 s were analyzed. 215
Electron paramagnetic resonance (EPR) 216
Aliquots of the quartz samples were separated for analyses by electron paramagnetic 217
resonance (EPR). The sample material was carefully crushed and hand-picked under a binocular 218
microscope. The separated fractions were treated with distilled water to remove adhering 219
particles and then air dried. The samples were measured first without pulverization. However, the 220
EPR analysis of clear quartz crystals before grinding provided powder-like spectra indicating the 221
presence of “micro-crystals”. Therefore, the measurement of single-crystal EPR spectra was not 222
possible and further measurements were made with ~200 mg of pulverized materials for each 223
sample. 224

10
The paramagnetic centers of quartz-powder samples were investigated by EPR 225
spectroscopy in the X-band using a Bruker EMX spectrometer operated with a microwave 226
frequency of ~9.63 GHz. Experimental conditions included modulation frequency of 100 kHz, 227
modulation amplitude of 0.1 mT, microwave powers from 0.02 to 20 mW to obtain optimal 228
conditions for different center types. The spectral resolution was ~0.146 mT for wide scans from 229
50 mT to 6500 mT and 0.024 mT for narrow scans from 300 mT to 350 mT. 230
Based on the results of CL and EPR analyses, three samples were pre-selected for further 231
trace-element studies. In addition to the polished thin sections, 200 µm thick sections of these 232
samples were prepared for laser ablation inductively coupled plasma mass spectrometry (LA-233
ICP-MS) measurements. 234
Trace elements 235
Concentrations of Li, Na, K, Rb, Ca, Sr, Mn, Zn, Fe, B, Al, Ga, Ge, Ti and P were 236
analysed by LA-ICP-MS on a double-focusing sector field mass spectrometer ELEMENT XR 237
from Thermo Instruments coupled with a NewWave 193-nm excimer laser probe (Flem and 238
Müller 2012). The laser had a pulse rate of 20 Hz, a speed of 15 µm s-1, a spot size of 50 µm, and 239
energy fluence of 5 to 7 mJ cm-2 on the sample surface. Raster ablation was applied on an area of 240
ca. 150 × 300 μm. The depth of ablation was ca. 50 µm. The carrier gas for transport of the 241
ablated material to the ICP-MS was He-Ar mixture. External calibration was performed using 242
three silicate glass reference materials produced by the National Institute of Standards and 243
Technology, USA (NIST SRM 610, 612 and 614). In addition, the NIST SRM 1830 soda-lime 244
float glass, the certified reference material BAM No.1 amorphous SiO2 glass from the Federal 245
Institute for Material Research and Testing in Germany and the Qz-Tu synthetic pure quartz 246
monocrystal provided by Andreas Kronz from the Geowissenschaftliches Zentrum Göttingen 247
(GZG), Germany, were used. Each measurement comprised 15 scans of each isotope, with a 248
measurement time varying from 0.15 s/scan for K in high resolution to 0.024 s/scan of, for 249

11
example, Li in low resolution. A linear regression model, including several measurements of the 250
different reference materials, was used to define the calibration curve for each element. For the 251
calculation of P concentrations, the procedure of Müller et al. (2008) was applied. Ten sequential 252
measurements on the Qz-Tu synthetic pure quartz monocrystal were used to estimate the limits of 253
detection (LOD - 3σ of 10 measurements). The analytical error ranges within 10% of the absolute 254
concentration of the element. 255
Annealing experiments 256
Isochronal annealing experiments of two selected quartz samples were carried out to 257
determine the thermal stability and temperature dependent spectroscopic properties of the defect 258
centers. For this, CL and EPR spectra were measured after isochronal annealing up to 600 °C and 259
subsequent cooling, and were compared with the untreated counterparts. Based on the results of 260
the first studies, the agate sample from St. Egidien (AStE) was selected for these investigations, 261
because it consists of both microcrystalline chalcedony and macro-crystalline quartz. In addition, 262
hydrothermal vein quartz from Chemnitz, Germany (QChem) was chosen. Both samples show 263
the typical yellow CL but differ in chemical composition, in particular in the contents of elements 264
which might be possible activators for CL (e.g., Al and Ge). 265
The annealing experiments were made in a Thermolyne muffle furnace under air 266
following the procedure of Pan and Hu (2009). Aliquot sample pieces were isothermally annealed 267
at 100, 150, 200, 250, 300, 400, 500, and 600 °C for 2 hours. One part of each sample was used 268
for optical microscope cathodoluminescence (OM-CL) studies of polished thin sections including 269
electron irradiation experiments, and the other part was used for SEM-CL and EPR 270
measurements. SEM-CL measurements were performed first without any preparation or coating 271
of the material using a JEOL JSM-7001F (20 kV, 2.64 nA, ca. 300 µm defocused electron beam, 272
measurement time 40s) to enable subsequent EPR studies on the identical material. 273
274

12
275
276
RESULTS 277
278
Cathodoluminescence (CL) 279
The comparison between polarized light and CL micrographs revealed that most of the 280
apparent homogeneous quartz crystals show a wide variety of internal textures under CL 281
including oscillatory zoning, sector zoning or skeletal growth (compare Fig. 1). 282
Spectral analysis of CL emissions was performed for quartz with more or less 283
homogeneous yellowish luminescent regions. Despite variations in intensity, all samples show a 284
broad CL emission band centered at ca. 580 nm causing the visible yellow CL (Figs. 2 and 3). 285
The yellow band at 580 nm in agate samples is dominant in macro-crystalline quartz and weaker 286
in chalcedony with an additional band at 650 nm (1.91 eV). Deconvolution of the broad yellow 287
CL emission band revealed that it consists of at least three overlapping emission bands (Fig. 2). 288
The fitting procedure shows a main luminescence emission band at 2.17 eV (570 nm – FWHM 289
0.38 eV/200 nm), a second band at 1.91 eV (650 nm – non-bridging oxygen hole center NBOHC) 290
and a weak and very broad band centered at 2.47 eV (probably consisting of more than one 291
band). Additional CL emissions with mostly low intensity could be detected in some of the 292
samples at 290 nm (4.27 eV), 380 nm (3.26 eV), 450 nm (2.69 eV), and 750 nm (1.65 eV). 293
The interaction with the electron beam resulted in significant changes of the CL emission 294
(Fig. 3), i.e. lower intensity and a shift of the band position to longer wavelength. These changes 295
are due to a variation in the intensity ratio of the main emission band at 570 nm (2.17 eV) and the 296
broad 650 nm (1.91 eV) band, which behave differently under the electron beam. Figure 3 297
illustrates a nearly exponential decrease of the intensity of the 570 nm (2.17 eV) CL emission 298
band. The 650 nm emission is very sensitive to electron irradiation. The increase of this emission 299

13
band during electron irradiation (especially in chalcedony) results from the transformation of 300
precursor centers into NBOHC under the electron beam. 301
Monochromatic CL imaging at different wavelengths was performed to get information 302
about the spatial distribution of the defect centers responsible for the different luminescence 303
emissions. The images in Figure 4 reveal similar spatial distribution of the defects responsible for 304
the 570 nm (2.17 eV) and 650 nm (1.91 eV) CL emission, respectively, whereas the spatial 305
distribution of those associated with the 290 (4.27 eV) and 380 nm (3.26 eV) emissions are 306
different. 307
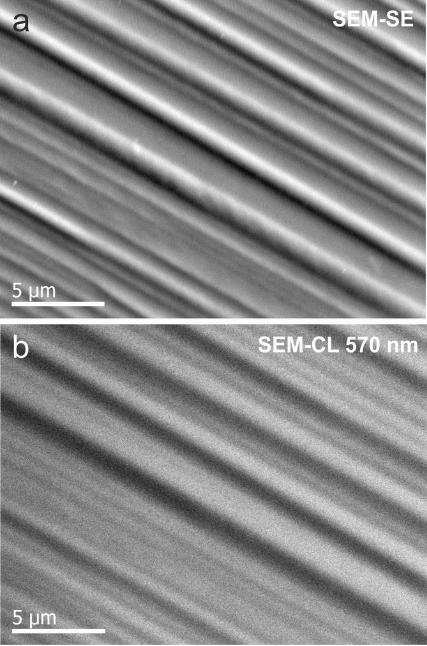
Another feature is visible when comparing the distribution pattern of the 570 nm (2.17 308
eV) CL emission with the surface morphology of the electron-irradiated sample surface (Fig. 5). 309
Secondary electron imaging (SEM topography image) of the sample surface of quartz (agate St. 310
Egidien) after prolonged electron irradiation reveals visible surface expansion indicating 311
amorphization of parts of the irradiated micro-volume (Fig. 5a). The monochromatic CL image of 312
the same area shows that the degree of enhanced expansion/amorphization approximately anti-313
correlates with the 570 nm (2.17 eV) emission (Fig. 5b). 314
315
Electron paramagnetic resonance (EPR) 316
Figure 6a shows the spectra of five selected samples in a wide scan measured at a 317
microwave power of 2 mW. The sample suite comprises the yellow luminescent hydrothermal 318
quartz from Chemnitz (QChem – Fig. 1i), bluish luminescent agate from Gehlberg (AGeh – not 319
shown in Fig. 1), hydrothermal quartz from Chemnitz with zones of blue and yellow CL (QCh – 320
Fig. 1k), and the yellow luminescent agates from St. Egidien (AStE – Fig. 1h) and Chemnitz 321
(AChA – not shown in Fig. 1). The EPR spectra contain a characteristic oxygen-vacancy electron 322
center E´1 (Mashkovtsev et al. 2013) and an orthorhombic Fe3+ center at the effective g value of 323
4.28 (Weil 1994; SivaRamaiah et al. 2011). 324

14
A closer look at the central magnetic region (Figs. 6b, 7) shows further multiple species of 325
silicon-vacancy hole centers (e.g., superoxide and ozonide radicals such as B, B´, C and C´ - 326
Botis et al. 2005; Pan et al. 2008, 2009) and an unknown center #3 with the effective g values of 327
2.008, 2.006 and 2.0045 (Mashkovtsev et al. 1978). The agate from St. Egidien (AStE) is 328
particularly interesting in that it contains abundant B/B´ and C/C´ centers, even more than quartz 329
samples from high-grade uranium deposits (compare Botis et al. 2005 and Pan and Hu 2009). 330
The effective g values of all detected signals are shown in the experimental spectrum in 331
Figure 7, which shows spectra of separated macro-crystalline quartz and chalcedony parts of the 332
agate from St. Egidien (AStE). The broad peak at g = 2.034 arises from superoxide centers (O2-) 333
B and B', while the signal at g = 2.017 belongs to several ozonide C (and C') radicals (O3- - Botis 334
et al. 2008; Nilges et al. 2008, 2009; Pan et al. 2008, 2009). The small signal at g = 2.021, which 335
has a microwave-power dependence different from hole centers but is similar to those of E' 336
centers, is most likely related to the g = 1.983 line and corresponds to a new E'/H center (g⁄⁄ = 337
2.0020 and g┴ = 2.010) with a proton hyperfine structure (A⁄⁄ = 6.4 mT and A┴ = 6.7 mT), which 338
has been observed from single-crystal EPR data (Mashkovtsev pers. comm. – see ticks in Fig. 339
6b). The weak signals at g = 1.997 and 1.994 belong to the Ge(B) and Ge E'1 centers 340
(Mashkovtsev et al. 2013). 341
The comparison of the EPR spectra of all investigated samples shows, that E´1 is the 342
dominant defect center but in varying concentrations (Fig. 6a). The yellow luminescent agates 343
from St. Egidien (AStE) and Chemnitz (AChA), as well as the hydrothermal vein quartz from 344
Chemnitz (QChem) are characterized by elevated concentrations of the E´1 center. In contrast, the 345
samples without the dominating yellow CL (agate from Gehlberg – AGeh and the hydrothermal 346
quartz QCh) contain a relatively smaller number of this oxygen-vacancy electron center. In 347
particular the macro-crystalline quartz in the agate from St. Egidien has much more abundant 348
oxygen-vacancy electron centers (by several orders of magnitude) than hydrothermal and 349

15
pegmatite quartz that were measured for comparison (e.g. from Minas Gerais, Brazil and 350
Sichuan, China), and also a higher abundance of the radiation induced defects at the effective g 351
value of 2.00 than the counterparts in chalcedony (Fig. 7). 352
In addition, the agate from Chemnitz (AChA) and the chalcedony part of the St. Egidien 353
sample (AStE) both show a spectrum with high intensities of silicon-vacancy hole centers (Figs. 354
6b, 7), whereas the number of these centers is lower in the macro-crystalline quartz part of AStE 355
as well as in samples AGeh and QChem. The hydrothermal quartz QCh is generally free of 356
silicon-vacancy hole centers. 357
358
Trace elements 359
Trace elements were analyzed in three selected samples in order to correlate CL, EPR 360
properties and impurity concentrations. A profile of 15 analyses crossing the chalcedony and 361
macro-crystalline quartz banding of the agate from St. Egidien (AStE - Fig. 8) was measured 362
using LA-ICP-MS. Likewise, the yellow luminescent hydrothermal quartz from Chemnitz 363
(QChem – compare Fig. 1i) and the agate from Gehlberg (AGeh) with blue CL were analyzed. 364
The results are compiled in Table 2. 365
The distribution of most trace elements is heterogeneous within the samples. Not only 366
significant differences between the macro-crystalline quartz and chalcedony parts in agate 367
samples exist, but also heterogeneities within both areas. In addition, most trace elements are 368
present in low concentrations, often below the limit of detection for LA-ICP-MS (e.g., Ti, Mn, Sr 369
– Table 2). Surprisingly, this is also true for most analytical spots for Al and Na (see Fig. 8). This 370
is in contrast to earlier investigations (e.g., Heaney and Davis 1995; Götze et al. 2001b), which 371
reported elevated concentrations of Al and Na in agates from different occurrences worldwide. 372
Higher element concentrations within the agate from St. Egidien (AStE) were only 373
detected for B, Ge and Fe. In the case of Fe, this may be due to numerous micro-inclusions of 374

16
hematite, which cause the reddish color of the chalcedony bands. However, the presence of Fe in 375
colorless, clear quartz indicates that at least some of the Fe must be incorporated in the structure. 376
This conclusion was supported by the EPR measurements (Fig. 6a) and the existence of a weak 377
750 nm CL emission, which is consistent with substitutional Fe3+ at Si sites (Weil 1994; 378
SivaRamaiah et al. 2011). 379
The high concentrations of B and Ge in the agate from St. Egidien (AStE) are remarkable 380
and exceed even the Clarke concentration. Interestingly, the concentrations of Ge are much 381
higher in the quartz than the chalcedony region. The contents of Ge within the yellow 382
luminescent quartz in the St. Egidien sample are almost two orders of magnitude higher than the 383
average Ge contents in quartz (Götze 2009). 384
Trace-element concentrations within the agate from Gehlberg (AGeh) and the 385
hydrothermal vein quartz from Chemnitz (QChem) show similar trends but also differ from 386
sample AStE (compare Table 2). The contents of B in the agate from Gehlberg are in the same 387
range as in the AStE sample, whereas Ge and Fe contents are much lower. In contrast, the 388
hydrothermal quartz from Chemnitz has elevated concentrations of Al and Na and comparably 389
low concentrations of Ge and B. 390
391
Annealing experiments 392
Agate (sample AStE) and hydrothermal quartz (sample QChem) were selected for 393
tempering experiments in order to test the influence of trace elements on the luminescence 394
emission. Both samples exhibit similar initial CL spectra with a dominant yellow emission band 395
at 570 nm (Fig. 9). During tempering, the two samples show slightly different behavior. The 396
intensity of the yellow CL emission at 570 nm (2.17 eV) decreases during heating up to 400 °C in 397
the macro-crystalline quartz of sample AStE, but shows a slight increase in the hydrothermal 398

17
quartz (sample QChem). However, these initial trends may be due to the heterogeneities of the 399
samples leading to locally varying intensities of the yellow emission band. 400
It is noteworthy that an additional blue band at ca. 450 nm (2.69 eV) is apparent above 401
300 °C in both samples (Fig. 9). The intensity of the 450 nm emission is much stronger in macro-402
crystalline quartz of sample AStE compared with the hydrothermal vein quartz QChem. This blue 403
emission is likely to be related to oxygen deficiency centers (ODC – Skuja 1998). After 404
annealing at 600 °C (above the phase transition temperature of 573 °C between α- and β-quartz) 405
the yellow band becomes dominant and very strong in both samples. Locally resolved spectral 406
CL measurements (OM-CL) from bright yellow and weakly luminescent regions within the 407
heterogeneous samples revealed that the blue 450 nm emission band is only visible from regions 408
with low CL intensity indicating a heterogeneous distribution of the different defect types related 409
to the 570 and 450 nm emission bands, respectively (Fig. 10). 410
Electron irradiation experiments on annealed quartz with irradiation times of up to 10 411
minutes revealed significant changes of the CL spectra. In general, the 570 nm (2.17 eV) 412
emission band decreases under the electron beam, whereas the 650 nm emission (1.91 eV) is 413
stable or slightly increases (Fig. 10). The changing intensity ratio results in an apparent shift of 414
the broad band to longer wavelengths as already observed in the untreated samples (compare Fig. 415
3) and causes a change from bright yellow to reddish brown CL (Fig. 10b). The general internal 416
CL textures like growth zoning remain visible in quartz. 417
In order to correlate the CL behaviour with possible changes in the defect structure in the 418
samples, the chalcedony and quartz parts of the agate from St. Egidien (AStE) (and their annealed 419
counterparts) have been analyzed by EPR at four different microwave powers. Those depicted in 420
Figure 11 were all measured at 0.2 mW to illustrate both silicon-vacancy and oxygen-vacancy 421
defects at the magnetic fields below and above 350 mT, respectively. Although the EPR spectra 422
of the quartz and agate parts (and their thermal behavior) are more or less similar in the oxygen-423

18
vacancy defects, chalcedony and macro-crystalline quartz differ markedly in the spectral range 424
relating to the silicon-vacancy hole centers in the magnetic field <350 mT. 425
Major changes occur in the EPR spectra after annealing between 300 and 400 °C (Figs. 426
11, 12). It is apparent that all defects are significantly reduced after annealing above 400 °C. The 427
silicon-vacancy hole centers were almost annealed out in both cases. 428
429
DISCUSSION 430
Trace elements 431
The results of the spectroscopic investigations show that the 570 nm (2.17 eV) band is the 432
dominant CL emission in yellow luminescent quartz (Fig. 2). Early reports of yellow 433
luminescence in natural quartz indicated an association with elevated contents of trace elements 434
(Ramseyer et al. 1988; Luff and Townsend 1990; Müller 2000). Therefore, trace elements have 435
been measured in quartz with yellow CL to provide evidence of possible correlations. However, 436
the results of the investigation show that there is no direct relation between the 570 nm (2.17 eV) 437
luminescence emission in quartz and relevant trace elements. One of the proposed elements (Mn 438
– Müller 2000) can be eliminated as an activator for the yellow luminescence emission in quartz, 439
since the analyzed concentrations are below the detection limit of LA-ICP-MS (Table 2) and no 440
Mn-centers were detected during EPR measurements. 441
Aluminum is a frequent impurity element in quartz and elevated concentrations were 442
measured in the present quartz samples (Table 2). However, spatially resolved analyses revealed 443
that the Al distribution is very heterogeneous. In particular, the Al contents below the detection 444
limit of the LA-ICP-MS (< 6 ppm) have been found in macro-crystalline quartz regions that show 445
bright yellow CL. Another argument against the possible role of Al as an activator for the 570 nm 446
(2.17 eV) emission is the well-known relation between the alkali (or hydrogen) compensated Al 447

19
defect center (O3≡Al-M+-O-Si≡O3) and the transient blue CL emission at ~390 nm (3.3 eV) 448
(Alonso et al., 1983; Luff and Townsend, 1990; Perny et al., 1992; Gorton et al., 1996). 449
Iron is another element that has been found in elevated concentrations in the investigated 450
quartz samples (Table 2). EPR measurements detected an orthorhombic Fe3+ center at the 451
effective g value of 4.28 (Fig. 6). This [FeO4/M+]0 defect is characterized by substitution of Fe3+ 452
for Si4+ with charge compensation by alkali ions or protons (Stegger and Lehmann 1989; Weil 453
1994). However, the macro-crystalline quartz and chalcedony samples investigated in the present 454
study do not show any correlation between chemically analyzed Fe contents, the amount of Fe3+ 455
centers measured by EPR and the signal intensity of the 570 nm (2.17 eV) CL emission. Studies 456
which suggest the Fe3+-activated CL emission in quartz are rare. Pott and McNicol (1971) 457
reported red luminescence at 705 nm in Fe-doped synthetic SiO2 and Stevens-Kalceff (2009) 458
related a CL emission at 750 nm to the activation by Fe3+. In summary, no conclusive relation 459
between substitutional iron and yellow CL emission in quartz was found. 460
The analysed Ge contents in the studied quartz samples are elevated and sometimes 461
remarkably high compared to average Ge contents of quartz which are in the 1 ppm level (Götze 462
et al. 2004). In macro-crystalline quartz of the agate from St. Egidien (sample AStE), Ge contents 463
up to 95 ppm were detected (Table 2). This sample exhibits a very intensive yellow 570 nm 464
emission (Fig. 8). Ge-related paramagnetic defects are also present in EPR spectra but are 465
subordinate relative to the E´1 center (Fig. 7). Two observations argue against Ge as an activator 466
of the yellow luminescence in quartz. First, quartz samples with moderate to low Ge 467
concentrations (e.g. hydrothermal vein quartz from Chemnitz - QChem) show intensive 570 nm 468
CL-emission, while conversely quartz with comparable Ge concentrations (agate from Gehlberg - 469
AGeh) exhibits no yellow CL. Second, CL spectra of Ge-implanted SiO2 at room temperature 470
have been reported to show a strong blue emission band at 410 nm (3.0 eV), which is therefore 471

20
not consistent with the observed yellow CL in quartz (Barfels 2001, Fitting et al. 2002). In 472
conclusion, the role of Ge as an activator of the yellow CL in quartz is unlikely. 473
474
E’1 defects 475
As trace elements can be excluded as activator for the yellow CL in quartz, other lattice 476
defects have to be taken into consideration. Previous reports of yellow luminescence in natural 477
quartz (e.g. Rink et al. 1993, Götze et al. 1999, Götze 2009) indicated an association with high 478
concentrations of E’1 defects. The present study confirms that high intensity yellow CL emission 479
is consistent with a high concentration of the E´1 defects documented from EPR measurements, 480
and a correlation of both relative intensities was observed. Quartz samples with high 481
concentrations of E’1 defects show high intensities of the 570 nm (2.17 eV) emission band (Fig. 482
6). In addition, the E'1 center appears to be somewhat more abundant in macro-crystalline quartz 483
compared to chalcedony (Fig. 7). This observation correlates very well with the higher intensity 484
of the yellow CL emission in the macro-crystalline quartz region of agates (compare Figs. 1h and 485
8). 486
Additional information about the nature of the defect centers and their relation to the CL 487
behavior was provided by the annealing experiments and observed changes under electron 488
irradiation. These studies are necessary, since in contrast to EPR, CL spectroscopy is unable to 489
detect E’1 defects directly because of the non-radiative decay (no luminescence activation) of the 490
center (Pacchioni and Ierano 1998). Therefore, we assume that the 570 nm (2.17 eV) CL 491
emission is not directly associated with the paramagnetic E’ centers, but their diamagnetic 492
precursors and/or associated defects are most likely responsible for the characteristic yellow CL. 493
Annealing of the quartz samples up to 600 °C results in a continuous decrease in the 494
concentration of E’1 centers with increasing temperature (Figs. 11, 12), whereas the yellow CL 495
remains (Figs. 9, 10). The EPR spectra show the most drastic changes (marked reduction in 496

21
intensity of the E´1 center) after annealing at 400/500 °C (compare Fig. 12). This correlates with 497
the appearance and a strong increase of the 450 nm luminescence band. The E’ centers are 498
annealed and transformed to energetically more favourable diamagnetic defects (e.g. oxygen 499
deficiency centers – Skuja 1998) responsible for the blue CL. This would explain the extreme 500
increase of the 450 nm CL-emission after annealing as the conversion of E´1 centers can be 501
related to the high temperature treatment. This is confirmed by the fact that the intensity of the 502
450 nm emission after tempering correlates with the relative amount of E’1 centers in the samples 503
at room temperature. The agate from St. Egidien (AStE) has a higher number of initial E’1 centers 504
and a stronger increase of the 450 nm emission during the annealing experiments compared to the 505
hydrothermal vein quartz from Chemnitz (QChem - compare Fig. 9). This model also explains 506
the absence of the 450 nm luminescence in the original samples. Although the quartz is highly 507
oxygen deficient, blue luminescence has not been observed, since E’ centers do not activate 508
luminescence. Only after annealing and conversion of E’ centers into luminescence-active oxygen 509
deficiency centers, does the characteristic 450 nm emission appear. 510
Self-trapped exciton (STE) 511
The experiments discussed above indicate that the yellow CL emission in quartz is not 512
directly related to the paramagnetic E’ centers detected by EPR measurements, but possibly to 513
their diamagnetic precursors or other defects related to these paramagnetic species. Additional 514
electron irradiation experiments showed that the yellow luminescence is modified by electron 515
bombardment. The sensitivity to the electron beam and the decay of luminescence-active centers 516
is demonstrated by a decrease of the 570 nm (2.17 eV) band intensity during continuous electron 517
irradiation (Fig. 3). Mathematical calculations of the decay kinetics of different luminescence 518
active defect centers in quartz caused by electron irradiation show an analogous behaviour with a 519
decreasing dose curve for the self-trapped exciton (STE) related CL in amorphous and crystalline 520
SiO2 (Barfels 2001). The characteristic broad band width of the STE related emission (0.38 521

22
eV/200 nm) is in accordance with the measured FWHM of the 570 nm band in the investigated 522
quartz samples. Accordingly, we conclude that the 570 nm (2.17 eV) emission is most likely to 523
be associated with the radiative recombination of self-trapped excitons (STE). 524
Self-trapped excitons (STE) in quartz can be produced by irradiation with an electron 525
beam (Fisher et al. 1990). Self-trapping occurs when the excited electron-hole pair (i.e. the 526
exciton) creates a localized distortion in the crystalline quartz lattice. A number of potential 527
candidates for exciton-defect-pairs for the SiO2 STE have been suggested and several forms may 528
co-exist (e.g. defect pairs with the E´1 center and interstitial oxygen or the E’1 center and 529
NBOHC – e.g. Stevens-Kalceff 2009). The high abundance of E´1 and NBOHC was confirmed 530
by EPR measurements. Furthermore, the 570 nm band is often accompanied by a 650 nm (1.91 531
eV) emission (NBOHC), and monochromatic CL studies indicated that defects associated with 532
the 570 and 650 nm emissions are approximately co-located (Fig. 4). 533
An observed expansion/amorphization of quartz under the electron beam approximately 534
anti-correlates with the 570 nm (2.17 eV) emission, as indicated by CL (Fig. 5). This observation 535
is consistent with the identification of the 570 nm emission as being associated with the self-536
trapped exciton (STE). The radiative recombination leads to the restoration of (i.e. radiative 537
relaxation to) the ideal SiO2 microstructure: The return of the SiO2 host lattice to its defect-free 538
structure is associated with enhanced CL emission. In contrast, non-radiative recombination of 539
the STE results in radiolytic processes (Hobbs and Pascucci 1980; Hosono et al. 1998), i.e. the 540
formation of stable defects due to the decay of electronic excitations (Tsai and Griscom 1991). In 541
case of quartz, radiolysis may cause local amorphization of the irradiated area (Stevens-Kalceff 542
and Phillips 1995, Stevens-Kalceff 2013), which is visible by surface expansion (Fig. 5). 543
Strong local disorder (including the grain boundaries of the microcrystals within the clear 544
quartz crystals) and/or local amorphization may explain the observed emission of the SiO2 STE 545
related luminescence. In general, the STE luminescence in quartz is assumed to be related to 546

23
higher energy emissions and only the STE luminescence in amorphous SiO2 shows yellow 547
luminescence (Stevens-Kalceff 2009). However, high defect concentration within quartz may 548
contribute to the local disorder within the quartz structure, resulting in slight distortions of bond 549
lengths or bond angles in the vicinity of defects (Stevens-Kalceff 2009). As a result there may be 550
amorphous-SiO2 STE contributions to the CL emission from microscopic regions with strongly 551
disordered local environment. Similar conclusions were reported by Fitting et al. (2002), who 552
observed yellow luminescence in the initial CL spectra of highly oxygen deficient silica (SiOX 553
with 1.5<x<1.8). These authors related the yellow luminescence to oxygen deficient centers in 554
the form of silicon fragments or small Si-rings in the SiO2 network. 555
Extremely high defect density has been demonstrated by EPR measurements. The studied 556
quartz samples differ from “normal” hydrothermal quartz both in the presence of complex hole 557
centers and much more abundant oxygen-vacancy electron centers (up to several orders of 558
magnitude, as in the agate from St. Egidien; Fig. 7). Structural disorder is also favoured by the 559
incorporation of Fe and OH-groups, which may result in quasi-amorphous regions within the 560
quartz structure (Graetsch et al. 1987, Rykart 1989). This highly disordered structure of yellow 561
luminescent quartz is not only visible in CL microscopy (Figs. 1 and 10) but also by other 562
microscopic techniques such as Nomarski differential interference contrast microscopy (Fig. 13). 563
Optically homogeneous quartz often shows skeletal growth, sector zoning and irregular internal 564
textures. Colloform textures and banded chalcedony are frequent in cryptocrystalline quartz 565
specimens. All these features point to a rapid crystallization under non-equilibrium conditions, 566
probably from a non-crystalline precursor. 567
In natural occurrences, it can be demonstrated that specific geological environments favor 568
the formation of defects responsible for the yellow CL in quartz. The evaluation of geochemical 569
data illustrates that quartz showing yellow CL occurs in low-temperature hydrothermal 570
environment (mostly <250 °C) and low-temperature alteration processes often accompanied by 571

24
CO2-rich fluids and low oxygen fugacity (compare Table 1). This type of quartz is often observed 572
in epithermal gold mineralization as well as sulfide ore deposits. In addition, agates forming 573
during the alteration of acidic volcanic rocks may show macro-crystalline quartz and chalcedony 574
with the characteristic 570 nm (2.17 eV) emission. 575
576
IMPLICATIONS 577
578
The origin of yellow CL in quartz has been investigated in different types of world-wide 579
quartz occurrences. Our study shows that the dominant 570 nm (2.17 eV) CL-emission in quartz 580
is related to defect centers associated with high oxygen deficiency and local structural disorder. In 581
addition, yellow CL is restricted to natural quartz/chalcedony exclusively originating from low-582
temperature hydrothermal environment and agates from altered acidic volcanic rocks. This close 583
relationship between the yellow emission and high concentrations of defect centres as well as the 584
specific geological environments lead to the conclusion that this luminescence can be related to 585
processes of fast crystallization (probably from a non-crystalline precursor) in an oxygen 586
deficient environment. The observations concerning appearance of quartz with yellow CL as well 587
as temperature estimations from other analytical methods (e.g. fluid inclusion studies) indicate 588
temperatures of formation mostly < 250 °C. Therefore, the appearance of yellow CL is an 589
important genetic indicator for these specific physico-chemical environments. 590
The combined EPR, CL and trace-element study shows that trace elements are unlikely to 591
be direct activators for the 570 nm (2.17 eV) CL emission in quartz, although their concentrations 592
in yellow luminescent quartz could be exceptionally high (e.g. Ge contents up to 95 ppm). 593
However, it cannot be ruled out that elevated incorporation of impurity ions causes local lattice 594
distortion. This finding is especially interesting with regard to correlations of trace-element 595

25
contents and CL intensities in panchromatic SEM-CL investigations. Our results evidence that 596
high-intensity CL can even appear in quartz with very low trace element contents. 597
598
Acknowledgement: We thank M. Drechsel (Freiberg, Germany), T. Graupner (Hannover, 599
Germany), S. Ioannou (Toronto, Canada), A. Moura (Porto, Portugal), M. Polgari (Budapest, 600
Hungary), and R. Rößler (Chemnitz, Germany) for the kind allocation of sample material. M. 601
Gaft (Tel Aviv, Israel), G. Geyer, M. Hengst, and M. Magnus (Freiberg, Germany) are gratefully 602
acknowledged for their help during the analytical work and with sample preparation, 603
respectively. The Australian Microscopy & Microanalysis Research Facility at UNSW is 604
acknowledged. 605
The Reviews of Boriana Mihailova, Alfons van den Kerkhof and an anonymous reviewer 606
significantly improved the quality of the paper. 607
608
609
610
611
612
613
614
615
616
617
618
619
620

26
REFERENCES CITED 621
622
Alonso, P.J., Halliburton, L.E., Kohnke, E.E., Bossoli, R.B. (1983) X-ray induced luminescence 623
in crystalline SiO2. Journal of Applied Physics, 54, 5369-5375. 624
Barfels, T. (2001) Kathodolumineszenz amorpher und kristalliner Modifikationen von SiO2 and 625
GeO2. PhD Rostock university, 168 pp. 626
Botis, S., Nokhrin, S.M., Pan, Y., Xu, Y., and Bonli, T. (2005) Natural radiation-induced damage 627
in quartz. I. Correlations between cathodoluminescence colors and paramagnetic defects. 628
Canadian Mineralogist, 43, 1565-1580. 629
Botis, S., Pan, Y., and Nokhrin, S.M. (2008) Natural radiation-induced damage in quartz. III. A 630
new radical in drusy quartz from the Atabasca Basin, Saskatchewan. The Canadian 631
Mineralogist, 46, 125-138. 632
Cressey, G., Henderson, C.M.B., and van der Laan, G. (1993) Use of L-edge X-ray absorption 633
spectroscopy to characterize multiple valence states of 3d transition metals; a new probe 634
for mineralogical and geochemical research. Physics and Chemistry of Minerals, 20, 111–635
119. 636
Czakó, T., and Zelenka, T. (1981) New data about the neotectonics of Mátra Mountains, 637
Northern Hungary. Advances in Space Research, 1, 289-298. 638
Di Benedetto, F., Innocenti, M., Tesi, S., Romanelli, M., D’Acapito, F., Fornaciai, G., 639
Montegrossi, G., and Pardi, L.A. (2010) A Fe K-edge XAS study of amethyst. Physics 640
and Chemistry of Minerals, 37, 283–289. 641
Drechsel, M., Seifert, Th., and Götze, J. (2003) Comparison of quartz-types from the polymetallic 642
sulfide veins of the Freiberg district based on cathodoluminescence investigations. In: 643
D.G. Eliopoulos et al., eds., Mineral Exploration and Sustainable Development. 644
Proceedings of the 7th biennial SGA meeting, p. 763-765, Millpress, Rotterdam. 645

27
Fisher, A.J., Hayes, W., and Stoneham, A.M. (1990) Structure of the self-trapped exciton in 646
quartz. Physical Review Letters, 64, 2667-2670. 647
Fitting, H.-J. Barfels, T., Trukhin, A.N., Schmidt, B., Gulans, A., von Czarnowski, A. (2002) 648
Cathodoluminescence of Ge+, Si+, and O+ implanted SiO2 layers and the role of mobile 649
oxygen in defect transformation. Journal of Non-Crystalline Solids, 303, 218-231. 650
Flem, B., and Müller, A. (2012) In situ analysis of trace elements in quartz using Laser ablation 651
inductively coupled plasma mass spectrometry. In: J. Götze and R. Möckel, eds., Quartz: 652
Deposits, Mineralogy and Analytics, p. 219-236, Springer Geology, Heidelberg, New 653
York, Dordrecht, London. 654
Gorton, N.T., Walker, G., and Burley, S.D. (1996) Experimental analysis of the composite blue 655
CL emission in quartz. Journal of Luminescence, 72-74, 669-671. 656
Götte, T., and Ramseyer, K. (2012) Trace element characteristics, luminescence properties and 657
real structure of quartz. In: J. Götze and R. Möckel, eds., Quartz: Deposits, Mineralogy 658
and Analytics, p. 265-285, Springer Geology, Heidelberg New York Dordrecht, London. 659
Götze, J. (2009) Chemistry, textures and physical properties of quartz – geological interpretation 660
and technical application. Mineralogical Magazine, 73, 645-671. 661
Götze, J., and Rößler, R. (2000) Kathodolumineszenz-Untersuchungen an Kieselhölzern - I. 662
Silifizierungen aus dem versteinerten Wald von Chemnitz (Perm, Deutschland). 663
Veröffentlichungen des Museums für Naturkunde Chemnitz, 23, 35-50. 664
Götze, J., Plötze, M., Fuchs, H., and Habermann, D. (1999) Defect structure and luminescence 665
behavior of agate – results of electron paramagnetic resonance (EPR) and CL studies. 666
Mineralogical Magazine, 63, 149-163. 667
Götze, J., Plötze, M., and Habermann, D. (2001a) Origin, spectral characteristics and practical 668
applications of the cathodoluminescence (CL) of quartz: a review. Mineralogy and 669
Petrology, 71, 225-250. 670

28
Götze, J., Tichomirowa, M., Fuchs, H., Pilot, J., Sharp, Z.D. (2001b) Geochemistry of agates: a 671
trace element and stable isotope study. Chemical Geology, 175, 523-541. 672
Götze, J., Plötze, M., Graupner, T., Hallbauer, D.K., and Bray, C. (2004) Trace element 673
incorporation into quartz: a combined study by ICP-MS, electron spin resonance, 674
cathodoluminescence, capillary ion analysis and gas chromatography. Geochimica et 675
Cosmochimica Acta, 68, 3741-3759. 676
Götze, J., Plötze, M., and Trautmann, T. (2005) Structure and luminescence characteristics of 677
quartz from pegmatites. American Mineralogist, 90, 13-21. 678
Graetsch, H., Flörke, O.W., and Miehe, G. (1987) Structural defects in microcrystalline silica. 679
Physics and Chemistry of Minerals, 14, 249-257. 680
Graupner, T., Götze, J., Kempe, U., and Wolf, D. (2000) Cathodoluminescence imaging as a tool 681
for characterization of quartz and trapped fluid inclusions in multistage deformed 682
mesothermal Au-quartz vein deposits: A case study from the giant Muruntau Au-ore 683
deposit (Uzbekistan). Mineralogical Magazine, 64, 1007-1016. 684
Gueye, M., Van den Kerkhof, A.M., Hein, U.F., Diene, M., Mücke, A., and Siegesmund, S. 685
(2013) Structural control, fluid inclusions and cathodoluminescence studies of Birimian 686
gold-bearing quartz vein systems in the Paleoproterozoic Mako Belt, Southwestern 687
Senegal. South African Journal of Geology, 116, 199-218. 688
Heaney, P. J., and Davis, A. M. (1995): Observation and origin of self-organized textures in 689
agates. Science, 269, 1562-1565. 690
Hobbs, L.W., and Pascucci, M.R. (1980) Radiolysis and defect structure in electron-irradiated α-691
quartz. Journal de Physique, 7, 237-242. 692
Holzhey, G. (1993) Occurrence and genesis of agates and paragenetic minerals in rhyolites from 693
Permian volcanic rocks of the Thuringian Forest (in German). PhD thesis, TU 694
Bergakademie Freiberg. 695

29
Hosono, H., Kawazoe, H., and Matsunami, N. (1998) Experimental evidence for Frenkel defect 696
formation in amorphous SiO2 by electronic excitation. Physical Review Letters, 80, 317-697
320. 698
Imai, H., Arai, K., Imagawa, H., Hosono, H., and Abe, Y. (1988) Two types of oxygen-deficient 699
centers in synthetic silica glass. Physical Reviews B, 38, 12772-12775. 700
Ioannou, S.E., Götze, J., Weiershäuser, L., Zubowski, S.M., and Spooner, E.T.C. (2003) 701
Cathodoluminescence characteristics of Archean VMS-related quartz: Noranda, Ben 702
Nevis, and Matagami districs, Abitibi Subprovince, Canada. G3 Online Publication, 5 (2), 703
doi:10.1029/2003GC000613. 704
Jourdan, A.-L., Vennemann, T.W., Mullis, J., Ramseyer, K., and Spiers, C.J. (2009a) Evidence of 705
growth and sector zoning in hydrothermal quartz from Alpine veins. European Journal of 706
Mineralogy, 21, 219-231. 707
Jourdan, A.-L., Vennemann, T.W., Mullis, J., and Ramseyer, K. (2009b) Oxygen isotope sector 708
zoning in natural hydrothermal quartz. Mineralogical Magazine, 73, 615-632. 709
Kotov, N.V., and Poritskaya, L.G. (1992) The Muruntau gold deposit: its geologic structure 710
metasomatic mineral associations and origin. International Geological Review, 34, 77-87. 711
Krickl, R., Nasdala, L., Götze, J., Grambole, D., Wirth, R. (2008) Alpha-irradiation effects in 712
SiO2. European Journal of Mineralogy, 20, 517-522. 713
Lehmann, K., Berger, A., Götte, T., Ramseyer, K., and Wiedenbeck, M. (2009) Growth related 714
zonations in authigenic and hydrothermal quartz characterized by SIMS-, EPMA-, SEM-715
CL- and SEM-CC-imaging. Mineralogical Magazine, 73, 633-643. 716
Luff, B.J., and Townsend, P.D. (1990) Cathodoluminescence of synthetic quartz. Journal of 717
Physics: Condensed Matter, 2, 8089-8097. 718
Mashkovtsev, R.I., Shcherbakova, M.Ya., and Solntsev, V.P. (1978) EPR of radiation hole 719
centers in α-quartz. Trudy Instituta Geologii I Geofyziki Akademii Nauk SSSR, Sib. Otd. 720

30
(Novosibirsk: Nauka), 385, 78-86 (in Russian). 721
Mashkovtsev, R.I., Li, Z., Mao, M., and Pan, Y. (2013) 73Ge, 17O and 29Si hyperfine interactions 722
of the Ge E`1 center in crystalline SiO2. Journal of Magnetic Resonance, 233, 7-16. 723
Möckel, R., and Götze, J. (2007) Achate aus sächsischen Vulkaniten des Erzgebirgischen 724
Beckens. Veröffentlichungen des Museums für Naturkunde Chemnitz, 30, 25-60. 725
Moura, A., Götze, J., and Borges, F.S. (2003) Preliminary results on the cathodoluminescence of 726
quartz from the huge Neves Corvo VMS deposit (Portugal). Boletín de la Sociedad 727
Española de Mineralogía, 26-A, 175-176. 728
Müller, A. (2000) Cathodoluminescence of defect structures in quartz with applications to the 729
study of granitic rocks. PhD thesis, University Göttingen, Göttingen, 229 p. 730
Müller, A., Wiedenbeck, M., Flem, B., and Schiellerup, H. (2008) Refinement of phosphorus 731
determination in quartz by LA-ICP-MS through defining new reference material values. 732
Geostandards and Geoanalytical Research, 32, 361-376. 733
Müller, A., Van den Kerkhof, A.M., Behr, H.-J., Kronz, A., and Koch-Müller, M. (2009) The 734
evolution of late-Hercynian granites and rhyolites documented by quartz – a review. Earth 735
and Environmental Science Transactions of the Royal Society of Edinburgh, 100, 185-204. 736
Müller, A., Polgári, M., Gucsik, A., Nagy, Sz., Veres, M., Pál-Molnár, E., Götze, J., Cserháti, C., 737
Németh, T., Hámor-Vidó, M. (2009) Cathodoluminescent features and Raman 738
spectroscopy of Miocene hydrothermal biomineralization embedded in cryptocrystalline 739
silica varieties, Central Europe, Hungary. In: A. Gucsik, editor, Micro-Raman 740
spectroscopy and luminescence studies in the earth and planetary sciences. AIP 741
Conference Proceedings 1163, p. 207-218, Melville, New York. 742
Neuser, R.D., Bruhn, F., Götze, J., Habermann, D., and Richter, D.K. (1995) 743
Kathodolumineszenz: Methodik und Anwendung. Zentralblatt für Geologie und 744
Paläontologie Teil I, H. 1/2, 287-306. 745

31
Nilges, M.J., Pan, Y., and Mashkovtsev, R.I. (2008) Radiation-induced defects in quartz. I. Single 746
–crystal W-band EPR study of an electron irradiated quartz. Physics and Chemistry of 747
Minerals, 35, 103-115. 748
Nilges, M.J., Pan, Y., and Mashkovtsev, R.I. (2009) Radiation-induced defects in quartz. III. 749
EPR, ENDOR and ESEEM characterization of a peroxy radical. Physics and Chemistry of 750
Minerals, 36, 63-71. 751
Owen, M.R. (1988) Radiation-damage halos in quartz. Geology, 16, 529-532. 752
Pacchioni, G., and Ierano, G. (1987) Computed optical absorption and photoluminescence spectra 753
of neutral oxygen vacancies in α-quartz. Physical Review Letters, 79, 753-756. 754
Pacchioni, G., and Ierano, G. (1998) Optical absorption and nonradiative decay mechanism of E’ 755
centre in silica. Physical Review Letters, 81, 377-380. 756
Pan, Y., and Hu, B. (2009) Radiation-induced defects in quartz. IV. Thermal properties and 757
implications. Physics and Chemistry of Minerals, 36, 421-430. 758
Pan, Y., Nilges, M.J., and Mashkovtsev, R.I. (2008) Radiation-induced defects in quartz. II. W-759
band single-crystal EPR study of natural citrine. Physics and Chemistry of Minerals, 35, 760
387-397. 761
Pan, Y., Nilges, M.J., and Mashkovtsev, R.I. (2009) Multifrequency single-crystal EPR 762
characterization and DFT modeling of new peroxy radicals in quartz. Mineralogical 763
Magazine, 73, 517-535. 764
Perny, B., Eberhardt, P., Ramseyer, K., and Mullis, J. (1992) Microdistribution of aluminium, 765
lithium and sodium in quartz: possible causes and correlation with short-lived 766
cathodoluminescence. American Mineralogist, 77, 534-544. 767
Pott, G.T., and McNicol, B.D. (1971) Spectroscopic study of the coordination and valence of Fe 768
and Mn ions in and on the surface of aluminas and silicas. Discussions of the Faraday 769
Society 52, 121-131. 770

32
Ramseyer, K., and Mullis, J. (1990) Factors influencing short-lived blue cathodoluminescence of 771
alpha quartz. American Mineralogist, 75, 791-800. 772
Ramseyer, K., Baumann, J., Matter, A., and Mullis, J. (1988) Cathodoluminescence colours of 773
alpha-quartz. Mineralogical Magazine, 52, 669-677. 774
Rink, W.J., Rendell, H., Marseglia, E.A., Luff, B.J., and Townsend, P.D. (1993) 775
Thermoluminescence spectra of igneous quartz and hydrothermal vein quartz. Physics and 776
Chemistry of Minerals, 20, 353-361. 777
Rusk, B.G., Reed, M.H., Dilles, J.H., and Kent, A.J.R. (2006) Intensity of quartz 778
cathodoluminescence and trace-element content in quartz from the porphyry copper 779
deposit at Butte, Montana. American Mineralogist, 91, 1300-1312. 780
Rusk, B.G., Lowers, H.A., and Reed, M.H. (2008) Trace elements in hydrothermal quartz: 781
Relationships to cathodoluminescent textures and insights into vein formation. Geology, 782
36, 547-550. 783
Rykart, R. (1989) Quarz-Monographie. Ott Verlag Thun, Switzerland, 462 pp. 784
Sáez, R., Almodóvar, G.R., and Pascual, E. (1996) Geological constraints on massive sulphide 785
genesis in the Iberian pyrite belt. Ore Geology Reviews, 11, 429-451. 786
Schneider, J.W., Hoth, K, Gaitzsch, B.C., Berger, H.-J., Steinborn, H., Walther, H., and Zeidler, 787
M.K. (2005) Carboniferous stratigraphy and development of the Erzgebirge Basin. East 788
Germany. Zeitschrift der deutschen Gesellschaft für Geowissenschaften, 156, 431-466. 789
Seifert, T. (1999) Relationship between late Variscan lamprophyres and hydrothermal vein 790
mineralization in the Erzgebirge. In: Stanley, C.J. et al., editors, Mineral deposits: Process 791
to Processing, p. 429-432, Balkema, Rotterdam. 792
Siegel, G.H., and Marrone, M.J. (1981) Photoluminescence in as-drawn and irradiated silica 793
optical fibers: An assessment of the role of non-bridging oxygen defect centres. Journal of 794
Non-Crystalline Solids, 45, 235-247. 795

33
SivaRamaiah, G., Lin, J.R., and Pan, Y. (2011) Electron paramagnetic resonance spectroscopy of 796
Fe3+ ions in amethyst: thermodynamic potentials and magnetic susceptibility. Physics and 797
Chemistry of Minerals, 38, 159-167. 798
Skuja, L. (1994) Direct singlet-to-triplet optical absorption and luminescence excitation band of 799
the twofold-coordinated silicon center in oxygen-deficient glass. Journal of non-800
crystalline solids, 167, 229-238. 801
Skuja, L. (1998) Optically active oxygen-deficiency-related centers in amorphous silicon dioxid. 802
Journal of Non-Crystalline Solids, 239, 16-48. 803
Smith, P., and Halls, C. (1993) Preliminary report on the Flintheia base-metal prospect, Nord-804
Trøndelag. Feltrapport of the Norges Geologiske Undersøkelse, Trondheim, Norway. 805
Stapelbroek, M., Griscom, D.L., Friebele, E.J., and Sigel Jr., G.H. (1979) Oxygen-associated 806
trapped-hole centers in high-purity fused silicas. Journal of Non-Crystalline Solids, 32, 807
313-326. 808
Stegger, P., and Lehmann, G. (1989) The structure of three centers of trivalent iron in alpha-809
quartz. Physics and Chemistry of Minerals, 16, 401-407. 810
Stevens-Kalceff, M.A. (2009) Cathodoluminescence microcharacterization of point defects in α-811
quartz. Mineralogical Magazine, 73, 585-606. 812
Stevens-Kalceff, M.A. (2013) Cathodoluminescence microanalysis of silica and amorphized 813
quartz. Mineralogy and Petrology, 107, 455-469. 814
Stevens-Kalceff, M.A., and Phillips, M.R. (1995) Cathodoluminescence microcharacterization of 815
the defect structure of quartz. Physical Reviews, B 52, 3122-3134. 816
Takahashi, R., Müller, A., Matsueda, H., Okrugin, V. M., Ono, S., van den Kerkhof, A.M., 817
Kronz, A., and Andreeva, E.D. (2008) Cathodoluminescence and trace element in quartz: 818
clues to metal precipitation mechanisms at the Asachinskoe gold deposit in Kamchatka. 819
In: Okada, H., Mawatari, S.F., Suzuki, N. and Gautam, P., editors, Origin and evolution of 820

34
natural diversity. Proceedings of the International Symposium "The origin and evolution 821
of the natural diversity", p. 175-184, Sapporo. 822
Tsai, T.E., and Griscom, D.L. (1991) Experimental evidence for excitonic mechanism of defect 823
generation in high-purity silica. Physical Review Letters, 67, 2517-2520. 824
Van den Kerkhof, A.M., Kronz, A., Simon, and K., Scherer, T. (2004) Fluid-controlled quartz 825
recovery in granulite as revealed by cathodoluminescence and trace-element analysis 826
(Bamble sector, Norway). Contributions to Mineralogy and Petrology, 146, 637-652. 827
Watt, G.R., Wright, P., Galloway, S., and McLean, C. (1997) Cathodoluminescence and trace 828
element zoning in quartz phenocrysts and xenocrysts. Geochimica et Cosmochimica Acta, 829
61, 4337-4348. 830
Weil, J.A. (1994) EPR of iron centers in silicon dioxide. Applied Magnetic Resonance, 6, 1-16. 831
Zinkernagel, U. (1978) Cathodoluminescence of quartz and its application to sandstone 832
petrology. Contributions to Sedimentology, 8, 1-69. 833
834
835
836
837
838
839
840
841
842
843
844
845

35
846 Tables 847 848 849 TABLE 1. Compilation of the quartz samples investigated in the present study showing 850
the location, type of mineralization and estimated temperatures of formation (Tf) 851 852 ___________________________________________________________________________ 853 Location Type Tf [°C] Reference 854 ___________________________________________________________________________ 855 856 Quartz associated with hydrothermal ore deposits 857 Freiberg, Germany HQF Hydrothermal vein 155-249°C Drechsel et al. (2003) 858 sulfide ore deposit primary qtz 859 860 Noranda, Ben Nevis, HQN Hydrothermal VMS 100-250°C Ioannou et al. (2004) 861 Matagami (Canada) sulfide ore deposit sec. qtz 862 863 Neves Corvo, HQNC Hydrothermal VMS 142-238°C Moura et al. (2003) 864 Portugal sulfide ore deposit 865 866 Muruntau, HQMu Hydrothermal 100-250°C Graupner et al. (2000) 867 Uzbekistan gold deposit sec. qtz 868 869 Collo-/crustiform quartz 870 Mátra Mountains, CQMa Hydrothermal iron 20-150°C Müller et al. (2009) 871 Hungary biomineralization 872 873 Silicified wood 874 Chemnitz, Germany SWCh Silicified wood < 200°C Götze & Rößler (2000) 875 in altered ignimbrite 876 877 Agate 878 St. Egidien, Germany AStE Agate 176-375°C Möckel & Götze (2007) 879 Hohenstein- in altered ignimbrite 880 Ernstthal, Germany AHE 881 Chemnitz, Germany AChA 882 883 Gehlberg, Germany AGeh Agate in altered rhyolite ca. 100°C Holzhey (1993) 884 885 Hydrothermal vein quartz 886 Chemnitz, Germany QCh Hydrothermal vein quartz - present study 887 QChem 888 889 ___________________________________________________________________________ 890 891 892 893 894

36
TABLE 2. Results of locally resolved trace-element analysis by LA-ICP-MS (in ppm) in the 895 agate from St. Egidien (AStE) and the hydrothermal vein quartz from Chemnitz, 896 (QChem) both showing yellow CL, as well as the agate from Gehlberg (AGeh) 897 without yellow CL emission; analytical points for QChem and AStE are indicated 898 in Figure 1i and Figure 8, respectively. 899
_____________________________________________________________________________ 900 Li Na K Rb Ca B Ga Al Ge Fe P 901 _____________________________________________________________________________ 902 AStE 903 A Chalcedony 0.30 - 1.2 - 53.3 < 1 0.18 - 0.5 1.9 - 904 B 0.30 - 149 0.97 - 25.8 0.98 162 21.2 66.9 2.2 905 C 0.35 - 60.2 0.31 - 45.6 0.22 < 6.0 13.2 55.4 - 906 D 0.59 - 60.7 0.33 - 35.7 0.12 - 20.4 61.9 - 907 E 0.49 - 55.1 0.43 - 41.0 0.11 - 28.9 47.8 - 908 F 0.39 - 51.9 0.33 9.4 29.2 0.17 < 6.0 36.3 47.7 - 909 G 0.49 37.9 89.2 0.58 9.7 28.7 0.38 103 31.6 154 - 910 ----------------------------------------------------------------------------------------------------------------- 911 H Quartz 0.47 - 33.0 0.24 - 19.2 0.12 - 68.9 12.8 - 912 I 0.59 - 32.0 0.15 - 8.0 0.14 - 26.8 18.7 - 913 J 0.51 - 37.4 0.44 - 31.3 0.12 - 93.6 14.5 - 914 K 0.86 - 49.2 0.32 - 23.5 0.04 - 53.5 12.4 - 915 L 0.89 - 61.8 0.50 - 33.4 0.16 - 94.9 11.3 5.5 916 ----------------------------------------------------------------------------------------------------------------- 917 M Chalcedony 1.89 67.4 168 1.50 58.3 33.3 0.81 329 22.2 48.2 - 918 N 1.66 101 162 1.86 62.4 34.2 0.71 366 16.4 46.9 - 919 ----------------------------------------------------------------------------------------------------------------- 920 O Quartz 0.98 77.4 41.1 0.45 - 36.0 0.07 - 77.4 11.5 - 921 _____________________________________________________________________________ 922 Sr < 0.1 ppm; Mn < 0.5 ppm; Zn < 0.7 ppm; Ti < 1.2 ppm; (-) = not detectable 923 924 925 QChem 926 A Chalcedony 97.5 712 460 3.70 254 4.0 0.61 4113 0.92 773 4.5 927 B Quartz 1.39 65.2 24.1 0.17 3.6 5.8 1.43 88.2 1.22 10.2 6.1 928 C 1.67 58.1 24.8 0.14 6.2 8.4 0.43 54.5 4.18 21.4 14.5 929 D 1.80 36.5 30.0 0.15 2.2 5.3 - 68.1 3.30 13.2 14.9 930 ______________________________________________________________________________ 931 Sr < 0.1 ppm; Mn < 0.6 ppm; Zn < 1.0 ppm; Ti not detectable; (-) = not detectable 932 933 934 AGeh 935 A Chalcedony 33.1 110 221 3.79 110 16.5 1.00 1803 5.65 53.8 6.1 936 B Quartz 1.51 9.1 9.5 0.17 4.7 36.4 1.11 9.9 6.48 <0.7 5.4 937 C 0.86 5.5 5.2 0.25 5.2 74.3 1.28 9.8 6.03 <0.7 8.6 938 D 0.81 9.7 6.1 0.16 1.9 26.0 1.00 9.9 5.65 <0.7 2.0 939 ______________________________________________________________________________ 940 Sr < 0.1 ppm; Mn < 0.6 ppm; Zn < 1.0 ppm; Ti not detectable; (-) = not detectable 941 942 943 944

37
Figure captions 945
946
Figure 1. Quartz samples with yellow CL investigated in the present study; a – Primary 947
quartz from the hydrothermal vein deposit of Freiberg, Germany (sample HQF); b 948
– Late secondary stockwork quartz from the VMS deposit Noranda, Canada 949
(HQN); c – Yellow luminescent quartz with distinct sector zoning from the 950
hydrothermal sulfide ore deposit of Neves Corvo, Portugal (HQNC); d – Yellow 951
luminescent quartz from late secondary veinlets of the hydrothermal gold deposit 952
of Muruntau, Uzbekistan (HQMu); e - Cryptocrystalline quartz with agate-like 953
structure from hydrothermal iron biomineralization of the Mátras Mountains, 954
Hungary (CQMa); f - Silicified wood from Chemnitz, Germany (SWCh); cell 955
structures are preserved by bright yellow luminescent quartz; g/h Polarized 956
light/CL micrograph pair of an agate sample from Chemnitz, Germany (AChA); 957
note that the quartz crystals appear completely homogeneous in polarized light, 958
only CL reveals complicated internal textures; i – Yellow luminescent 959
hydrothermal quartz (QChem) from altered Permian volcanic rocks from 960
Chemnitz, Germany; A-D mark the analytical spots for LA-ICP-MS analyses; k – 961
Hydrothermal quartz crystal from altered Permian volcanics from Chemnitz, 962
Germany (QCh); the quartz exhibits both transient blue CL as well as zones with 963
yellow CL. 964
965
FIGURE 2. Deconvolution of the initial broad CL emission band (see inset) of yellow 966
luminescent quartz from the Mátras Mountains, Hungary (sample CQMa - 967
compare Fig 1e); the fitting procedure shows at least three emission bands: the 968
main band at 2.17 eV (570 nm), a second band at 1.91 eV (650 nm – NBOHC) and 969

38
a weak and very broad band centered at 2.47 eV (probably consisting of more than 970
one band). 971
972
FIGURE 3. CL spectra initially and after 600 seconds of electron irradiation of hydrothermal 973
quartz from Chemnitz, Germany (sample QChem); the inset illustrates the 974
exponential decrease of luminescence intensity during electron bombardment. 975
976
FIGURE 4. Monochromatic CL micrographs of a selected sample area in an agate from St. 977
Egidien, Germany (sample AStE) with quartz and chalcedony; the comparison of 978
the images illustrates that the distribution of the defects responsible for the 570 nm 979
and 650 nm emission, respectively, is similar, whereas those causing the 290 and 980
380 nm emissions show different spatial distribution. 981
982
FIGURE 5. a – Secondary electron image (SEM topography image) of the sample surface of 983
quartz (agate St. Egidien – sample AStE) after extended electron irradiation; the 984
visible surface expansion indicates amorphization of the irradiated micro-volume; 985
b - CL image (570 nm monochromatic) of the same area showing that the degree 986
of expansion is strongly anti-correlated to the CL intensity. 987
988
FIGURE 6. Powder EPR spectra of samples AChA (agate Chemnitz Altendorf), AStE (agate 989
St. Egidien), QCh (hydrothermal vein quartz Chemnitz with blue/yellow CL), 990
AGeh (agate Gehlberg), and QChem (hydrothermal vein quartz Chemnitz with 991
yellow CL); a – wide scans measured at a microwave power of 2 mW, showing a 992
rhombic Fe3+ center as well as a pronounced E'1 center in all samples (except 993
QCh); b – the central magnetic region measured at a microwave power of 0.2 mW, 994

39
showing multiple species of silicon-vacancy hole centers (B/B′, C/C′ and #3) 995
centers. The ticks mark the E’/H center with a proton hyperfine splitting of ~6.5 996
mT. 997
998
FIGURE 7. Powder EPR spectra of separated quartz and chalcedony parts of the agate sample 999
from St. Egidien, Germany (AStE), measured at 0.02 mW; quartz shows a higher 1000
abundance of the E´1 center, whereas the silicon-vacancy hole center is more 1001
pronounced in chalcedony. The effective g values of all resolved signals in the 1002
quartz spectrum are labeled and discussed in the text. 1003
1004
FIGURE 8. Sample of agate from St. Egidien, Germany (AStE) with bands of chalcedony and 1005
quartz used for locally resolved trace-element analysis by ICP-MS; the dots mark 1006
the analytical points (compare results in Table 2); the inset on the left shows the 1007
CL properties of the sample area. 1008
1009
FIGURE 9. SEM-CL spectra on separated parts of quartz from sample AStE (a) and 1010
hydrothermal quartz QChem (b); spectra were taken on original sample pieces (20 1011
°C) and pieces after 2 h annealing at 100, 200, 300, 400, 500, and 600 °C; because 1012
of the different intensities, the spectra of the 500 and 600 °C annealed quartz in (a) 1013
are given within the inset. In both samples AStE and QChem the development of 1014
the blue CL band at 450 nm is clearly visible at temperatures above 300 °C. 1015
1016
FIGURE 10. OM-CL images and spectra, respectively of annealed (2h at 600 °C) sample 1017
QChem. 1018

40
a/b – CL image initially (a) and after 600s of electron irradiation (b); the visible 1019
CL turns from bright yellow to reddish-brown, although the principle internal 1020
textures are still visible after electron bombardment; c – comparison of CL spectra 1021
from a bright yellow region (1) and a dark luminescent region (2) within the 1022
heterogeneous sample; the blue 450 nm emission band is only visible in the dark 1023
part indicating a heterogeneous distribution of the different defect types related to 1024
the 570 and 450 nm emission bands; d – CL spectra initially and after 600s of 1025
electron irradiation (compare a/b); the inset shows the drastic decrease of the CL 1026
intensity of the 570 nm emission band. 1027
1028
FIGURE 11. Comparison of powder EPR spectra, measured at a microwave power of 0.2 mW, 1029
of – a – quartz and – b – chalcedony of sample AStE as a function of annealing 1030
temperature up to 600°C; note that an isotropic signal at g = 2.003 (marked by an 1031
arrow) is visible in chalcedony but absent in quartz after annealing to 600 °C . 1032
1033
FIGURE 12. Intensity variations of the E'1 center in quartz and chalcedony parts of sample 1034
AStE with annealing temperature. 1035
1036
FIGURE 13. Nomarski DIC micrograph of the interface chalcedony/quartz in sample AStE; 1037
skeletal growth and irregular internal textures of quartz point to rapid 1038
crystallization under non-equilibrium conditions, probably from a non-crystalline 1039
precursor. 1040