
Jenora D’Acosta - USC Dornsife · Jenora D’Acosta A Thesis Presented to the FACULTY OF THE USC...
77
FINDING FOOD DESERTS: A STUDY OF FOOD ACCESS MEASURES IN THE PHOENIX-MESA URBAN AREA by Jenora D’Acosta A Thesis Presented to the FACULTY OF THE USC GRADUATE SCHOOL UNIVERSITY OF SOUTHERN CALIFORNIA In Partial Fulfillment of the Requirements for the Degree MASTER OF SCIENCE (GEOGRAPHIC INFORMATION SCIENCE AND TECHNOLOGY) August 2015 Copyright 2015 Jenora D’Acosta
Transcript of Jenora D’Acosta - USC Dornsife · Jenora D’Acosta A Thesis Presented to the FACULTY OF THE USC...

FINDING FOOD DESERTS:
A STUDY OF FOOD ACCESS MEASURES IN THE PHOENIX-MESA URBAN AREA
by
Jenora D’Acosta
A Thesis Presented to the
FACULTY OF THE USC GRADUATE SCHOOL
UNIVERSITY OF SOUTHERN CALIFORNIA
In Partial Fulfillment of the
Requirements for the Degree
MASTER OF SCIENCE
(GEOGRAPHIC INFORMATION SCIENCE AND TECHNOLOGY)
August 2015
Copyright 2015 Jenora D’Acosta

ii
DEDICATION
Eighty-two percent of this thesis is dedicated to my parents, Carl and Cynthia, for all the usual
reasons and plenty of weird ones as well. I love you and thanks for loving me.
The remainder is dedicated to the rest of my village. Thanks for the overflowing love and
support.
iii
ACKNOWLEDGEMENTS
I would like to express the deepest appreciation to my committee chair, Dr. Warshawsky for his
continuous encouragement and for pulling me out of the thesis weeds many times during this
process. Thank you to my committee members for their support and feedback.
Isaac and Elias, Thank you boys for entertaining me during the study breaks.
I would also like to thank coffee.

iv
TABLE OF CONTENTS
DEDICATION ii
ACKNOWLEDGEMENTS iii
TABLE OF CONTENTS iv
LIST OF TABLES vi
LIST OF FIGURES vii
LIST OF ABBREVIATIONS viii
ABSTRACT ix
CHAPTER 1: INTRODUCTION 1
1.1 Food Insecurity 1
1.2 Food Deserts 3
1.3 Food Desert Definition Gaps 4
1.4 Objectives of This Study 5
CHAPTER 2: BACKGROUND AND LITERATURE REVIEW 7
2.1 Setting the Food Environment 8
2.2 Food Desert Geography 8
2.2.1 Defining Accessibility 8
2.2.2 Defining Distance Thresholds 9
2.2.3 Measuring Distances 9
2.3 Geographic Units 10
2.4 Socio-economic Variables 11
2.5 Measuring Food Access and Locating Food Deserts 11

v
CHAPTER 3: METHODOLOGY 19
3.1 Study Area and Scale of Analysis 19
3.2 Data and Sources 22
3.3 Food Desert Models 30
3.3.1 Method 1: Proximity 30
3.3.2 Method 2: Variety 31
3.3.3 Method 3: Competition 33
3.4 Limitations of This Study 34
CHAPTER 4: RESULTS 36
4.1 Method 1: Proximity 36
4.2 Method 2: Variety 39
4.3 Method 3: Competition 42
4.4 Review of the Findings 46
CHAPTER 5: DISCUSSION 49
5.1 Summary of Findings 49
5.2 Significance of findings 50
5.3 Study Limitations 51
5.5 Recommendations for Future Research 52
REFERENCES 61

vi
LIST OF TABLES
Table 1 Summary of Spatial Data 23
Table 2 Attributes of Areas Designated as Having Poor Food Access According to Three
Methods 46

vii
LIST OF FIGURES
Figure 1 Study Area: The Phoenix-Mesa Urban Area 21
Figure 2 Low Income Block Groups 25
Figure 3 Spatial Distribution of Supermarkets in the Study Area 27
Figure 4 Spatial Distribution of Fast Food Restaurants in the Study Area 28
Figure 5 Methodology Flowchart 30
Figure 6 Method 1: Proximity Methodology Flowchart 31
Figure 7 Method 2: Variety Methodology Flowchart 32
Figure 8 Method 3: Competition Methodology Flowchart 33
Figure 9 Neighborhood Areas within Walking Distance of Grocery Stores 37
Figure 10 Method 1: Food Deserts Based on Proximity to the Nearest Grocery Store 38
Figure 11 Method 2: Access Based on the Number of Grocery Stores within a 1 km
Walking Distance 40
Figure 12 Potential Food Deserts Classified by Both Methods 1 and 2 41
Figure 13 Method 3: Food Swamp Scores 43
Figure 14 Food Swamp Block Groups That Were Not Previously Identified by
Methods 1 and 2 45
viii
LIST OF ABBREVIATIONS
APHA American Public Health Association
CDC Centers for Disease Control and Prevention
DHHS Department of Health and Human Services
ERS Economic Research Service
FAO Food and Agriculture Organization
FMI Food Marketing Institute
GIS Geographic Information System
HFAI Healthy Food Availability Index
NAICS North American Industry Classification System
UA Urban Area
USDA United States Department of Agriculture

ix
ABSTRACT
Adequate access to healthy food is often considered a basic human right and ensuring that all
communities have equal access to healthy food options has emerged as a focus of environmental
justice activists and public policy in the United States. Increased attention and interest in
locating food deserts over the last decade has resulted in many attempts at identifying areas with
insufficient access to healthy foods. Many researchers and agencies have developed specific
measures of food access, but these measures and indicators have not been compared
methodically in terms of food desert locations identified or populations affected. This study
examines and compares how varying the definition of ‘food desert’ impacts the extent of food
desert geographies using three of the most common food desert methodologies centered around
proximity, variety and competition. The results illustrate that the areas of the Phoenix-Mesa
Urban Area that are classified as food desert differ depending on the methodology being used.
This study shows that anywhere from 6% - 80% of the 562 low income block groups in the
Phoenix-Mesa Urban Area can be designated as food deserts and the population residing in these
areas with poor access to healthy food is estimated to be anywhere from 25,000 to 233,000
residents. In spite of this wide range, the geographic overlap was high with all three
methodologies. The findings illustrate a need for clearer definitions regarding conceptual
differences when measuring food access.

1
CHAPTER 1: INTRODUCTION
Food is essential for sustaining human life, providing the nutrients and calories that deliver the
energy necessary for people to go about their day to day activities. Availability and access to
food that provides optimal nutrition is essential for the security of community food sources and
public health. This concept of food security is described by The Food and Agricultural
Organization (FAO) of the United Nations as existing “when all people, at all times, have
physical, social and economic access to sufficient, safe and nutritious food that meets their
dietary needs and food preferences for an active and healthy life” (Section 1, Food and
Agriculture Organization 1996). However, there is a growing body of research that show that
there are disparities in access to safe and nutritious food based on income, ethnicity and social
status.
1.1 Food Insecurity
In 2014, the United States Department of Agriculture’s Household Food Security Report stated
that an average of 14% of US households experienced food insecurity in 2013 which is
essentially unchanged from 15% of US households in 2012 (USDA-ERS 2014). A more
problematic statistic from the USDA website states that out of the US households with children,
20% experienced food insecurity in 2013. The most widely used measure of food deprivation in
the US is the definition from the USDA which describes food insecurity as not having consistent
access to adequate food because of lack of money or limited resources at points during the year
(USDA 2013).
The factors at the root of food insecurity such as access, availability and affordability are
also the factors that influence food choices (Azuma, et al. 2010), and studies have linked these
environmental factors to residents’ health risks, finding that obesity and other health risks are

2
more common among low income, predominantly African American or Latino communities than
in predominately White and Asian communities (Morland 2002). Diets that include fresh fruits,
vegetables and whole grains can reduce the risk of obesity and many diet-related diseases (Hsin-
Chia Hung 2004) and have been shown to be less accessible to residents who live in low income
communities where corner mini markets and liquor stores are more prevalent than grocery store
options. The variables that influence the connections between diet, health, socioeconomic status
and accessibility of healthy foods in communities are complex. Many research studies have
highlighted the relatively low levels of food access for many lower-income, minority populations
with limited financial resources and lack of mobility. Studies by Moreland et al (2006) and
Larson et al (2009) have concluded that high access to supermarkets and grocery stores and low
access to convenient stores have healthier diets and lower obesity levels. In addition, many
studies have shown that access to healthy food in the United States is unevenly distributed
throughout regions and that supermarkets and other fresh food stores are less likely to be located
in low-income and minority communities where convenience, fast-food and liquor stores are
more plentiful and accessible than grocery store options.
These inequalities in food access and health risks are indicators of an unsustainable food
system. The American Public Health Association defines a healthy and sustainable food system
as one that “provides healthy food to meet current food needs while maintaining healthy
ecosystems that can also provide food for generations to come with minimal negative impact to
the environment. It is humane and just, protecting farmers and other workers, consumers and
communities” (Policy 200712, APHA 2007). Creating and maintaining equal and easy access to
healthy food is vital to our shared health. The most common outlet for this food is the grocery

3
store as it provides the most consistent and reliable way to access a wide variety of nutritionally
dense and affordable food options.
1.2 Food Deserts
The notion of food deserts and the causes and consequences of limited access to food has
attracted the attention of researchers and food activists over the last three decades. Grocery store
gaps were first identified in the U.S. as low income, inner-city areas that were underserved by
grocery store outlets which had vacated these areas to migrate to the wealthier suburbs (Winne
2008). These studies, in turn, were then applied in the UK and Canada (Whelan, et al. 2002). In
the early 1990’s, residents of a public housing development in western Scotland began using the
term food deserts which was then incorporated into a report by the Policy Working Group for
the Government’s Low Income Project Team of the Nutrition Task Force in 1995 (Cummings
and Macintyre 2002). It was in this report that the food desert was first formally defined as an
urban area where residents could not afford to purchase food that was both healthy and
affordable (Beaumont et al, 1995). Application of the phrase ‘food desert’ was expanded to rural
areas in 2006 when Blanchard was exploring food access in rural Mississippi (2006). Today,
food deserts, food access, and food justice are concepts studied in communities all over the
world, amplifying the questions, variables, and procedures used for defining and refining
geographical locations to be labeled ‘food deserts.’
The overview of the research for this thesis has found an array of patterns, from very
obvious food deserts in some areas to uniform distribution of food sources in others, but the
variables and specifics of the actual definitions considered in each study have varied from author
to author. For example, Hendrickson et al. (2006) found urban areas that had less than 10 stores
and no stores with 20 or more employees and classified them as food deserts while Gallagher

4
(2008) defines food deserts as large areas that contain no mainstream grocery stores. Morton and
Blanchard (2007) considered whole counties where all residents lived further than ten miles to
the nearest grocery store, which included all of the rural areas in their study area, as food deserts
while the USDA (2013) uses the definition “a low income census tract where a substantial
number or proportion of residents has low access to a supermarket or large grocery store” (p. 1)
to map food deserts on the Food Access Research Atlas. Many other social scientists go beyond
these conventional definitions and include other socioeconomic, demographic, physical,
financial, educational and cultural factors in their analysis.
1.3 Food Desert Definition Gaps
The word ‘desert’ is a powerful mental image of an area that is lacking. The term food desert, at
its simplest, is an area where residents are lacking or do not have acceptable access to food
sources. When researchers investigate food deserts there is no standard definition or procedure
and the definitions, variables and methodologies that they use vary. This variation in definition
and approach creates inconsistency and ambiguity in the validity of their results, providing
outcomes that can lead to differing or even contradictory opinions about the extent of the food
desert problem and its actual location.
For example, the introduction to this field of research began in Britain in the 1990s, when
researchers tried to identify neighborhoods that had limited access to healthy food options
(Beaumont, et al. 1995). Ten years later, Reisig and Hobbiss (2000) stated “the term has
remained conceptual rather than being an operational term by which geographical areas can be
identified and indeed is proving hard to define given that the ease with which people access food
is a function of more than geography” (p. 137) and Levin (2011) also states that the concept of
5
the food desert is still vague, imprecise and open-ended in these studies. One more decade later,
there continues to be a lack of consensus for a definition for food deserts.
Most researchers agree on defining food deserts using the same general features. This list
of features includes: lack of healthy food, poor access to food, lack of local grocery stores, low
income residents, limited transportation options, underserved neighborhoods, and affordable
groceries. However, the problem arises when researchers move to define and delineate these
conceptual terms listed above to the quantitative definitions needed for scientific study. For
instance, how do you measure “lack of healthy food” in and what parameters should be taken
into consideration to measure “lack of healthy food” in a neighborhood? Rose et al (2009) points
out that depending on the definitions, researchers will arrive at different results in food desert
studies based on those definitions and the methodology used.
1.4 Objectives of This Study
The objective of this paper is to illustrate how the existence and extent of food deserts can
change depending on the specific definitions used when applied to the same geographic area.
Through review and re-creation of some of the contributions to food access literature, food
deserts will be identified in the Phoenix-Mesa Urban Area based on the major food desert
elements of proximity, density/variety and competition.
The remainder of this thesis is structured as follows. Chapter Two reviews the
characteristics of a food environment, summarizes the current body of research on food access
and food deserts, and examines the variables used to measure food access. Chapter Three
describes the study area, the data sources and collection process, and the three methodologies
that this thesis will use to compare food desert geographies. Chapter Four presents a detailed

6
outline of the three methodologies and an analysis of their results. Chapter Five reviews the
findings of this thesis and includes recommendations for future food desert research.

7
CHAPTER 2: BACKGROUND AND LITERATURE REVIEW
As presented in the first chapter, the increasingly popular terms of ‘food desert’ and ‘food
swamp’ are evocative metaphors used in discussions of food access and food security; however,
their meanings can change depending on the researcher and lack specific definitions.
Nevertheless, food deserts have been studied and used by many researchers in a variety of fields
such as public health, geography, social justice, urban planning and business as a tool for
identifying and quantifying food insecurity, as a factor in public health, and as an indicator of
sustainable food systems. These researchers have identified a number of measureable indicators
for locating food deserts which include acceptable travel distances, grocery store size and quality
of food (Wrigley, et al. 2002; Zenk, et al. 2005; Shaw 2006; Apparicio, Cloutier and Shearmur
2007; Group 2008; Kowalski-Jones, et al. 2009; McEntee and Agyeman 2010).
Depending on the indicator used and thresholds defined to model the food environment,
results can be inconsistent even when applied to the same study area. For example, Rose et al.
(2009) studied the census tracts in New Orleans and how expanding the supermarket data to
include convenience and drug stores that carried some fresh food changed the extent of the food
desert areas in the neighborhoods. The results showed that only one tract was always classified
as a food desert, located in the Lower Ninth Ward, and only one tract of the eight was never
classified as a food desert. Kowalesiki-Jones et al (2009) measured food deserts three ways by
using datasets sourced from different agencies and looking at different demographic variables in
Salt Lake County, Utah. Their findings also suggested that food deserts varied across
neighborhoods depending on the discrepancies in the datasets chosen and variables used. In
order to more clearly understand these inconsistencies, this chapter will discuss the most
common food desert methodologies and elements used in food desert research.

8
2.1 Setting the Food Environment
The food environment consists of places where a person might eat or have access to food; this
could include home, work, school, restaurants, grocery stores and farmer’s markets. These
places may not all be contained in the person’s neighborhood, however, researchers have shown
that people do tend to make food choices based on the food outlets available in their immediate
neighborhood (Furey, Strugnell and McIlveen 2001). Food desert studies select a study area
boundary and illustrate the food environment with data from business directories or databases to
classify food outlets in terms of whether or not there is adequate access to healthy and nutritious
food options (Kowalski-Jones, et al. 2009). Supermarkets and grocery stores are the most
reliable and recognizable way to supply healthy and nutritious food options in most communities
(although some studies use additional outlets such as convenience stores, farmers markets, ethnic
food stores and community gardens.
2.2 Food Desert Geography
Food accessibility is a measure of the ease of obtaining healthy food options in a given
neighborhood (Farley, et al. 2009). The majority of the time in food desert studies, this is
interpreted as the physical or accessibility of food stores that supply healthy food options and it
is these spatial factors such as location and distribution that have been frequently analyzed in
food desert studies (Wendt, et al. 2008).
2.2.1 Defining Accessibility
Researchers measure food accessibility by linking food sources to neighborhood residents in
some way (Rose, et al. 2009). Food desert studies generally use either proximity or density of
healthy food stores to define what is and what is not considered adequate access to healthy food
options in a study area. Numerous other studies such as the study by Apparicio (2007) and

9
Gallagher (2008), competition in the food environment has been included as well. The proximity
approach evaluates the distance to food sources by measuring distances. The density approach
quantifies or computes in some way the access or availability of food stores or travel times
within a food environment (Charreire et al., 2010).
2.2.2 Defining Distance Thresholds
The main focus in spatial and geographical food desert studies is generally on distance-based
measurements. The question that this poses is “What are reasonable walking and driving
distances to the food outlets?” Researchers have formulated and used many different time-based
distance measurements for walking, driving and public transportation methods. A 15 minute
walk is general assumed and accepted to be equal to 1000 meters with a walking speed of 4
kilometers per hour (VerPloeg, 2009). For drivability, researchers assumed a driving speed of 60
kilometers per hour and assume a reasonable access when driving is 15 kilometers (Ver Ploeg,
2009). However, some studies consider multiple thresholds of time and distance such as
Eisenburg and Silcott in 2010. Identifying thresholds for reasonable walking or driving distances
are important because that is what define the buffer size or boundaries around areas or the points
of food access such as grocery stores or farmers markets and the points of food stores or a
geographic unit that delineate what is acceptable food access and what is a food desert. For
example, the density or number of food stores within a buffer could be used to estimate a
household’s accessibility to food stores (Thornton et al., 2005).
2.2.3 Measuring Distances
Distances can be measure in three forms: Euclidean, Network or Manhattan. Manhattan distance
is based on a grid system and is almost never used in food desert research as there are few
perfect grid systems in urban environments (Zenk et al., 2005). Euclidean distance is ‘as the

10
crow flies’ or the straight line distance between two points of interest. A more realistic
representation of movement is Network distance which measures the distance between origin and
destination along streets and sidewalks or other transportation network usually using the shortest
path (Levinson and El-Geneidy, 2009). In the majority of food desert studies, researchers use
either Euclidean or Network distance buffers to measure a reasonable walking or driving
distance to food outlets (Thornton et al, 2011).
2.3 Geographic Units
Researchers have used a variety of geographical aggregation units to depict neighborhoods in
food desert studies depending on the size of their study area, the focus of their study and what
census data is available in their area. Most studies rely on census geographies or political
jurisdictions to define their neighborhood divisions. In the United States, researchers most often
use census tracts (Eisenburg and Silcott, 2010; Rose et al, 2009), block groups (e.g., Gordon et al
2010; Kowaleski-Jones et al, 2009; Russell and Heidkamp, 2011) and the smallest enumeration
unit that the US Census Bureau uses, the census block (Parsons, 2012). In UK studies, electoral
divisions, which are roughly equivalent to US census tracts, are most often used (Clarke et al,
2002; Guy and David, 2004). In Canadian studies, the census tract (Apparicio et al, 2007;
Larsen and Gilliland, 2007; Martin Prosperity Institute, 2010) or smaller divisions such as
enumeration area or dissemination area (e.g., Kershaw et al, 2010) have been used. Very few
studies have used city-defined or even resident defined neighborhoods and neighborhood
boundaries are seldom as simple as choosing an administrative unit (Smoyer-Tomic et al, 2006).
Examination of the appropriate neighborhood units is important for more useful and authentic
research and policy making.

11
2.4 Socio-economic Variables
Since access to healthy food is increasingly seen as an environmental justice issue, the
association between lack of food access and community member’s socioeconomic status has
been increasingly investigated. Poverty is a substantial barrier in accessing food in low-income
areas and it has been shown that smaller grocery stores located in urban areas are located in low-
income areas (Alwitt 1997, Hendrickson, Smith and Eikenberry 2006). Hendrickson, Smith and
Eikenberry (2006) found that stores are smaller, food prices are higher and food quality is poorer
in areas where poverty is the highest. Due to financial difficulties, residents in disadvantaged
neighborhoods may not be able to afford cars or other modes of transportation to easily access
food stores that are not in their neighborhood or farther away. Income, vehicle ownership,
education level, employment, ethnicity, age and other socioeconomic and demographic variables
are important factors that are frequently used in food access studies. Blanchard (2006) points out
that the socio-demographic characteristics of food deserts are important for developing specific
policy that alleviates the problems of the populations that are affected by food deserts.
2.5 Measuring Food Access and Locating Food Deserts
Putting the definition of a food desert into action and identifying the methods and data used to
characterize these areas vary drastically across studies (as discussed in Chapter 1) resulting in
diverse or contradictory findings on the extent of the problem and perhaps where the problem is
actually located. In order to better understand this variety in how researchers measure food
access and identify food deserts, a variety of food desert studies have been compared based on
their food desert variables such as spatial accessibility standards, data aggregation units and other
variables used (Appendix A).

12
A study by Clarke et al. in 2002 focused on food access in the urban areas of
Leeds/Bradford and Cardiff was measured using a 500-meter buffer zone around each grocery
store or supermarket to represent a reasonable walking distance for the residents. A deprivation
score was developed based on socioeconomic level and car ownership to define and locate the
disadvantaged areas of their study area. Their results indicated that there were six defined food
desert areas where residents had high deprivation scores and also lived outside of the grocery
store buffer zone service area.
In Madison, Wisconsin, Coombs et al. (2010) also looked at food deserts from a very
classical standpoint and located any neighborhoods that were beyond a one mile grocery store
buffer zone. The assumption was made that healthy and nutritious food options can only found
in grocery stores and any areas beyond the grocery store buffer zone, with no grocery stores
nearby, are food deserts. They also mentioned the importance of analyzing racial composition,
income level and vehicle ownership in food desert studies, although they did not outline any
thresholds for these variables.
Another study by Schlundt in 2010 created a score as a way of measuring and classifying
access in Nashville, Tennessee. A Food Desert Score was calculated as an index to identify
neighborhoods that may be considered food deserts by using the city planning department’s
business license database to identify the locations of major grocery stores. Schlundt then
buffered these grocery stores with a 0.5-mile buffer and calculated the distance from each
residential parcel to the nearest major grocery store and to the nearest bus stop. He used the
distances to score each census block. His Food Desert Score scale of -37 to 60 was calculated
and any parcel with a score of 20 or greater was considered to be a food desert which indicated
that four areas could be considered food deserts in the neighborhoods of North Nashville, South

13
Nashville, East Nashville and Edgehill. That same year, the Commercial Policy Review (2010)
also identified food deserts in these neighborhoods, but the results and spatial extents of the food
deserts varied slightly as they used a 1000-meter buffer zone around grocery stores and obtained
their grocery store locations from a different database.
Other studies looked at previously identified food desert areas in order to investigate the
concept and variables involved in food security. For example, Winter (2010) examined the
relationship between food deserts and food insecurity in Ontario, Canada by comparing the food
desert areas for the census years 1996, 2001, and 2006. Before identifying food deserts for each
year, she established an Accumulation Risk Factor (ARF) by considering select demographic and
socioeconomic characteristics of the enumeration and dissimilation areas, creating an index to
define potential food insecure communities. She created a buffer of 509 meters around fresh food
outlets and then analyzed whether the fresh food zone was easily accessible via public
transportation. Her findings showed that food deserts are more likely to be found in EAs and
DAs that score high in the ARF index and by comparing the three different time periods, she was
able to conclude that the total food desert area has, in fact, declined over time in these
communities.
Smoyer-Tomic et al. (2006) implemented a study covering 212 neighborhoods in
Edmonton, Alberta by calculating the spatial accessibility to grocery stores using both the
proximity (shortest path) and density (number of grocery stores within a 1000-meter network
buffer around the centroids of each postal zone). They identified food deserts as neighborhoods
where access to grocery stores falls in the lowest quartile of the study groups and also are
comprised of residents that belong to vulnerable demographic subgroups such as the top quartile

14
of low income, no car ownership, and elderly population. The results indicated that six suburban
neighborhoods in the Edmonton area were considered food deserts.
In an extensive and very often cited study by Apparicio et al in 2007, a similar
methodology was used that quantified food deserts in Montreal Canada by measuring the
geographical access based on distance to the nearest supermarket (proximity), the number of
supermarkets within a 1000-meter buffer (density), and competition based on food and prices.
They also developed a social deprivation index that would more clearly define food desert areas
when used alongside the three supermarket accessibility measurements. The results of this study
show that although access to supermarkets varied in each census tract, there are no food deserts
in Montreal.
In a 2008 study, Larsen and Gilliland measured healthy food accessibility in London,
Ontario for the years 1961 and 2005, based on network walking routes and public transportation
routes. Network Analyst in ArcMap was used to calculate proximity to the nearest grocery stores
using the shortest network path and also the density, or number, of grocery stores within 1000-
meters of each block centroid. A socioeconomic index at the census tract level was developed
and used when assessing the level of supermarket accessibility. They identified one food desert
in an east London neighborhood.
The Department of Urban Design and Planning at the University of Washington’s
College of Built Environments created a food system assessment and researched food access in
the Puget Sound region of Washington in 2011. The report was then used to create a Food
Policy Blueprint for the State which assisted in identifying and locating food desert areas as well
as providing information to policymakers and food system stakeholders that would guide future
policy development. The research team located census blocks that lacked grocery stores within a

15
half-mile network walking distance and lacked grocery stores within a network quarter-mile of
bus stops. They also took into consideration socioeconomic variables such as areas of low
income, areas with low vehicle ownership and locations of elderly populations. They found that
the urban core areas of the Puget Sound region have the greatest access to grocery stores while
the urban peripheries, or suburbs, have lower access and face greater challenges in accessing
healthy and nutritious foods.
Anthony and Lee (2010) had previously used a similar methodology as the Washington
Department of Urban Design and Planning, but had defined different spatial and socioeconomic
thresholds for a study in Los Angeles, California. A one-mile network buffer was created around
each grocery store as a “proxy of the service area”. They then identified food desert as any
census block groups that were located outside of these service areas that also had a normalized
poverty rate that was 1.5 standard deviations or greater of the overall poverty rates for the
population in the city. The results indicated that food deserts are more likely to be found in the
neighborhoods in Downtown and Southeast Los Angeles.
O’Dwyer and Coveney in 2006 compared the availability and accessibility of grocery
stores in Australia over four different Local Government Areas (LGAs). They created a 2.5-mile
network buffer around each area and used drive time to measure the accessibility of
supermarkets. They then defined food deserts as the areas in the top quartile of low income
residents that have no vehicle access without regard to the proximity of the residents’ homes to
the supermarkets. According to their findings, food deserts existed in some degree in the three
LGAs of Port Adelaide-Enfield, Playford and Onkaparinga.
In some studies researchers created unique ways to identify food deserts by taking into
consideration different combinations of store accessibility, socioeconomic and demographic

16
variables. Eisenburg and Silcott (2010) identified and mapped different stages of food deserts in
Franklin, Ohio by creating multiple network buffers of 0.25 mile, 0.5 mile, and 1 mile to
measure the walk-to-store service area and also considered drive times of 5 minutes, 10 minutes
and 20 minutes to evaluate the drive-time-to-store in their study area. The drive time to a
grocery store was scored for each census tract from one to three with 3 being the longest drive
time. Additional weight was given to any drive time over 20 minutes. Walk-to-store was scored
either a 1, 2, 5, or 7. Socioeconomic and demographic variables were evaluated and scored with
various scores given for level of household income, vehicle ownership rate and population
density. Food desert potential was classified as either Severe, Strong, High, or Moderate
depending on the resulting score for each census tract. Their findings concluded that although
there are many residents in Franklin County that live in close proximity to grocery stores that are
still vulnerable to food insecurity due to poverty, lack of car access and low population density.
While most studies analyze the presence or absence of grocery stores, a few also take into
consideration the presence of other food venues such as fast food locations or gas stations.
Gordon et al. (2010) developed a Food Desert Index based on access to grocery stores, gas
stations and bodegas that supply healthy food, and fast food restaurants for each block group in
New York City. These food access index components were measured, ranked and scored as low,
medium, and high to create a scale range of 3 (poor) to 9 (high) to describe the level of
accessibility to healthy and unhealthy food options for each block group. The relationship
between variables such as race and ethnicity and median income of the block groups were also
analyzed. The Food Desert Index and the demographic variables were combined to create a total
food desert score. They found a clear correlation between these variables and the lowest scores
were found in East and Central Harlem, and the North and Central Brooklyn neighborhoods

17
which were also the neighborhoods that were found to have the highest proportions of minority
residents and also the lowest median household incomes. The highest food desert scores were
found in the Upper East Side, which is a predominantly white, upper-income neighborhood.
Baltimore City’s Food Policy Initiative and the Johns Hopkins Center for a Livable
Future (2010) have also developed a food desert index by determining distance thresholds to
healthy food outlets as well as the quality and quantity of the food options themselves and also
include socioeconomic variables at the block group level for the City of Baltimore. The resulting
Healthy Food Availability Index (HFAI) assigns scores from 0 to 26 to each food store based on
the completion of a Nutrition Environment Measurement Survey (NEMS). A score of 8.8 or
greater means that the food outlet is an acceptable source of healthy food. A quarter mile buffer
was drawn around these acceptable sources. Block group household income at or below 185
percent of the federal poverty level, and where 40% of households do not have access to a
vehicle, that are located outside of these acceptable access buffer zones were identified as food
deserts. The mapped results visually show that food desert block groups are more likely to be
found in the inner city of Baltimore.
Mari Gallagher was the first publicize the term food swamp, a metaphor that is useful for
describing nutrition issues in some neighborhoods. The term refers to areas where high calorie
and nutritionally empty food sources, such as fast food outlets, outweigh healthier options (Rose
et al. 2009). The Mari Gallagher Research and Consulting Group has famously conducted food
swamp studies in Chicago and Detroit by calculating the average distance from fringe food
venues and the average distance to healthy food outlets to create a Food Swamp Score. This
Food Swamp Score shows areas that have an imbalance of healthy food options.

18
Understanding factors related to food deserts and improving access to healthy and
affordable food was the goal in all of these reviewed papers, however, each of these measures
was based on different definitions and methods for determining food access. Studies that have
been conducted over the same study area to compare and contrast the results of separate
methodologies and analyses in terms of the areas identified or the size of the population affected
have not been done. A systematic evaluation of these food access measures using the same data
and study area would demonstrate the differences, validity and accuracy of the results that come
from different study methodologies.

19
CHAPTER 3: METHODOLOGY
This chapter will review the chosen study area, the data sources used and the food desert
definitions being compared in this study. A food desert for this thesis will be generally
designated as an area of a city that is economically disadvantaged with relatively low access to
sources of healthy food, which is taken from Larsen and Gilliland’s 2008 food desert study in
London, Ontario and is a good top-level definition with which the majority of food desert studies
begin. In order to apply this definition and locate the parts of a study area that are food deserts,
most researchers choose to consider some combination of interconnected characteristics found in
their study area to compare to their defined accessibility measure. Apparicio et al (2007) chose
to identify accessibility measures based on proximity, variety and competition whereas most
food desert studies focus on characteristics that fall under only one of those measures. The food
environment needs to be characterized and measures of access are then created by connecting the
population to the food environment. Finally, acceptable standards or thresholds need to be set in
place in order to categorize an area as having low access to healthy food.
Section One describes the study area and scale of analysis for the methods used in this
thesis. Section Two describes the data sources needed to re-create the studies in the Phoenix-
Mesa Urban Area and Section Three is a step-by-step description of the methodology used to
calculate food deserts according to the previously described Food Desert Models. Section Four
discusses the limitations to this study.
3.1 Study Area and Scale of Analysis
This thesis uses the US Census designated Phoenix-Mesa Urbanized Area (Figure 1) which is
defined as a territory made up of 50,000 or more people and is comprised of “a densely settled
20
core of census tracts and/or census blocks that meet the minimum population density
requirements (Urban Area Criteria, United States Cenus Bureau 2010).” The scale of analysis
for this study will be at the block group level as it is most similar in size to natural neighborhood
boundaries, ranging from 600 to 3,000 people or 240 to 1,200 housing units. The block group
level is also the smallest unit for which population and other characteristics are provided due to
privacy concerns. Although most food desert studies reviewed for this thesis used units at the
census tract level, using the smaller block group will increase the precision with which food
deserts are located and also decrease the potential modifiable areal unit problem (MAUP). The
MAUP is a statistical bias which can occur during the spatial analysis of aggregated point data
where results differ when the same analysis is applied to the same data, but different aggregation
units are used. For example, a methodology using data aggregated by county will produce
results that will vary from the same methodology using data aggregated at the census tract level.
Using data aggregated to the block group level will increase the precision of locating areas that
have low access to healthy food sources. In order to implement changes, it is important to
examine the spatial distribution of food access at as fine a geographic scale as possible (Raja et
al. 2008). Phoenix is recognized to have food deserts by the USDA Food Access Research Atlas
and it is a discussion that enters the local political sphere, but there has been no fine grained food
desert study applied to this area.

21
ST84
ST238
ST88
ST347
ST74
ST51
ST87
£¤60
§̈¦17
§̈¦8
§̈¦10
Mar icopaMar icopa
PinalPinal
Gi laGi laYavapaiYavapai
AZ-101-LOOP EAZ-101-LOOP W
E U
S-60
I-10 E
I-10 W
W G
rand Ave
AZ-303-LOO P N
A Z-3
03-L
OO
P S
AZ-202-L
OOP WAZ-202-L OOP E
US-60 EUS-60 W
I-8 WI-8 E
AZ-8
7
S
AZ-87 NA
Z-5
1S
AZ
-51
N
I-17
S
I-1
7N
AZ
-10
1-L
OO
PS
AZ
-10
1-L
OO
P
N
SP
ow
er
Rd
E Bell Rd
W Northern Ave
E Shea Blvd
E McDowell Rd
W Camelback Rd
SE
lls
wo
rth
Rd
N P
ina
l A
ve
S 5
1s
t A
ve
C R-8
5
E Main St
WA
Z-84
S C
hu
ich
u R
d
A Z-387
E Riggs Rd
AZ
-30
3-L
OO
P
E H
unt H
wy
AZ-287
AZ
-347
S
W Buckeye Rd
AZ-74
AZ-87
N
Bush Hwy
N S
co
tts
da
le R
d
N C
ave C
reek R
d
N 5
1s
t A
ve
S 7
th A
ve
AZ
-58
7
W Bell Rd
Barry MGoldwater AirForce Range
Salt RiverPima-Maricopa
Indian Com
Gila RiverIndian
Reservation
Sonoran DesertSonoran Desert
NationalNational
MonumentMonument
ScottsdaleScottsdale
ApacheApache
JunctionJunction
ParadiseParadise
ValleyValley
ChandlerChandler
CasaCasa
GrandeGrande
San TanSan Tan
ValleyValley
FountainFountain
HillsHills
GoldGold
CanyonCanyon
SunSun
LakesLakes
TempeTempe
QueenQueen
CreekCreek
ValleyValley
FarmsFarms
GilbertGilbert
MaricopaMaricopa
NewNew
RiverRiver
Sun CitySun City
El MirageEl Mirage
Sun City WestSun City West
GoodyearGoodyear
GlendaleGlendale
AvondaleAvondale
MesaMesaPhoenixPhoenix
MÉXICO
MÉXICO
MÉ
XIC
OM
ÉX
ICOMMÉÉXXIICCOO
MÉXICO
MÉXICO
UNITED STATES
UNITED STATES
ARIZONAARIZONACALIFORNIACALIFORNIA
NEVADANEVADA
MesaMesa
TucsonTucson
MexicaliMexicali
Las VegasLas Vegas
PhoenixPhoenix
Phoenix-Mesa Urban Area
¯0 7.5 153.75 Miles
Figure 1 Study Area: The Phoenix-Mesa Urban Area
22
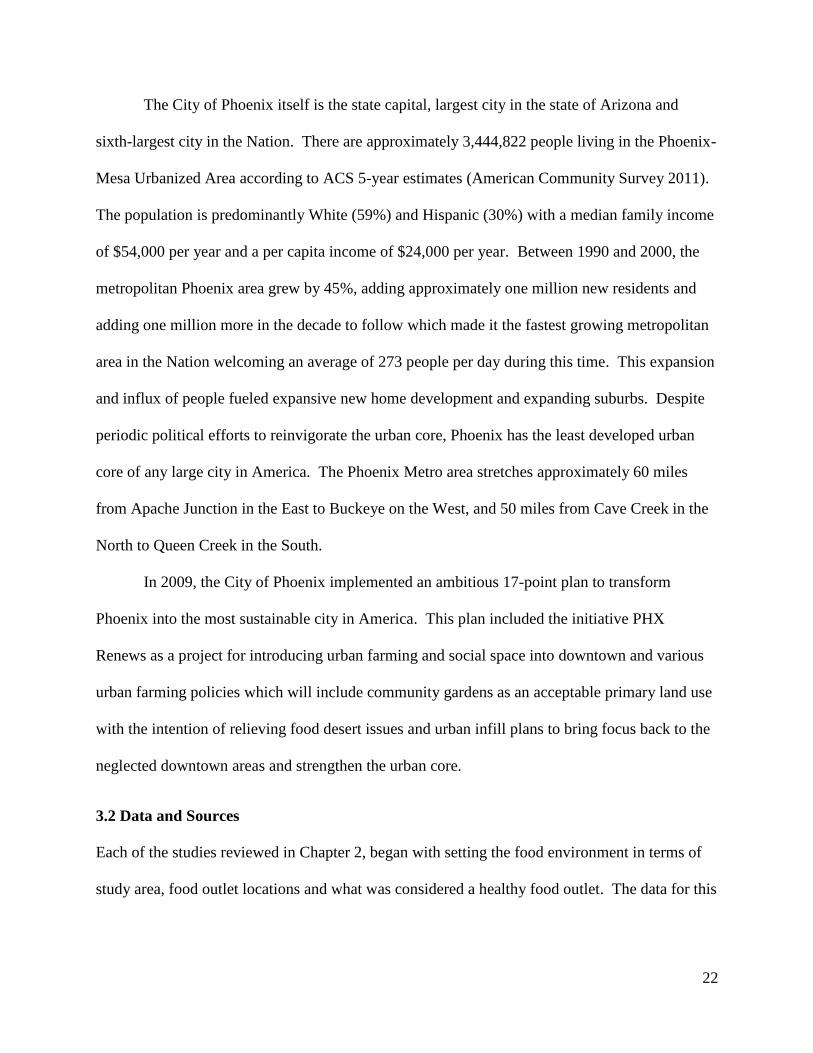
The City of Phoenix itself is the state capital, largest city in the state of Arizona and
sixth-largest city in the Nation. There are approximately 3,444,822 people living in the Phoenix-
Mesa Urbanized Area according to ACS 5-year estimates (American Community Survey 2011).
The population is predominantly White (59%) and Hispanic (30%) with a median family income
of $54,000 per year and a per capita income of $24,000 per year. Between 1990 and 2000, the
metropolitan Phoenix area grew by 45%, adding approximately one million new residents and
adding one million more in the decade to follow which made it the fastest growing metropolitan
area in the Nation welcoming an average of 273 people per day during this time. This expansion
and influx of people fueled expansive new home development and expanding suburbs. Despite
periodic political efforts to reinvigorate the urban core, Phoenix has the least developed urban
core of any large city in America. The Phoenix Metro area stretches approximately 60 miles
from Apache Junction in the East to Buckeye on the West, and 50 miles from Cave Creek in the
North to Queen Creek in the South.
In 2009, the City of Phoenix implemented an ambitious 17-point plan to transform
Phoenix into the most sustainable city in America. This plan included the initiative PHX
Renews as a project for introducing urban farming and social space into downtown and various
urban farming policies which will include community gardens as an acceptable primary land use
with the intention of relieving food desert issues and urban infill plans to bring focus back to the
neglected downtown areas and strengthen the urban core.
3.2 Data and Sources
Each of the studies reviewed in Chapter 2, began with setting the food environment in terms of
study area, food outlet locations and what was considered a healthy food outlet. The data for this

23
thesis was collected from the US Census Bureau and the business databases ReferenceUSA and
Dun and Bradstreet. A summary of these spatial datasets is provided in Table 1.
Table 1 Summary of Spatial Data
Dataset File type Data type
Details Source Temporal resolution of
the dataset
Grocery store
locations Shapefile
point feature
class
All grocery store locations with a SIC
code 5411 ReferenceUSA
Up to date through May 2014
Fast food locations
Shapefile point
feature class
All fast food locations with a DB code of Eating Places, Fast Food Restaurants
Dun & Bradstreet Up to date through May
2014
Census block
groups Shapefile
polygon feature
class
All block groups units within Arizona
US Census Bureau
Boundaries published 2010 and ACS
estimations valid through 2013
TIGER/line street
network files
Shapefile and .dbf
polyline feature
class
street network within Arizona
US Census Bureau Published January 12,
2014
Phoenix-Mesa Urban Area
Shapefile polygon feature
class Case study area US Census Bureau
Boundaries valid as of 2010
Census data was obtained from the US Census and American Community Survey
websites at Census.gov and included a shapefile of boundaries for all census block groups in
Arizona. Although using Census data at the tract level is the most often seen unit in food desert

24
studies, the block group is smaller, most similar to natural neighborhood boundaries, and allows
for a finer-grained analysis and pin pointing food deserts with a level of greater detail.
Characteristics included in the datasets are the total number of households in each block group,
total number of households living below the poverty line for each block group, neighborhood
population density, and median household income among others. The US Census Bureau
defines the term “low income” as living at 55% of the median income. The 2010 median
household income for Maricopa County was $53,596. 55% of this value is $29,477. Any block
group with a US Census determined median household income in 2010 less than or equal to this
calculated value or estimated as having 20% of the population living below the poverty level
based on the American Community Survey Table S1701: Poverty Status in the Past 12 Months
was selected as a low income block group for this analysis. Figure 2 below shows the 562 Low
income or Below Poverty Level block groups in the Phoenix-Mesa Urban Area. It can be seen
that the majority of these block groups are in the South Phoenix Area or are located close to State
Route 60 which runs diagonally through Phoenix. Approximately one quarter of the total block
groups located within the Phoenix-Mesa Urban Area are designated as low income or below
poverty level.

25
Figure 2 Low Income Block Groups
In order to locate food deserts in the Phoenix area, this study will use grocery stores as they are
the most common and reliable provider of healthy food as they consistently have greater
availability of healthy food options than other stores (Glanz 2007). The grocery stores used in
this analysis are all “full-service” meaning that they sell staple food items from all food groups
including meat, beans, bread, vegetables, fruits and dairy. Convenience stores and gas stations
tend to primarily carry processed foods and alcohol which do not meet the needs of the entire
community and dis-qualify them as viable healthy food outlets (Glanz 2007). While some

26
convenience stores and gas stations do carry some staple food items and fresh produce, the
availability of these items is highly variable depending on the store and is generally not very
affordable when available in convenience and gas stations (Chung 1999). Ethnic markets were
included in the grocery store list if they adhered to the full-service definition. Costco, Sam’s
Club and other member only food outlets were not included as access to these stores requires a
paid membership, which is a significant barrier to low income populations. Prospective healthy
food outlets and grocery store locations were obtained through ReferenceUSA, which compiles
business characteristics and addresses from telephone directories and public records
(ReferenceUSA 2014). The list of Maricopa County businesses with SIC code 5411, which is
the SIC code for grocery stores, originally included convenience stores and gas stations. To
refine the list, known convenience stores and any business described as convenience market were
deleted, such as Circle K, Arco or QuikMart. The rest of the stores were confirmed using
Google and telephone calls to determine if they were a convenience store or a grocery store. In
addition, all stores of grocery chains that had known closures in the last two years, such as
Basha’s and Fry’s, were called and eliminated from the list if the lines were disconnected.
The list of grocery store locations sourced from ReferenceUSA included a table with
each store’s latitude and longitude coordinates for the centroid of each stores building footprint
as well as an address for every store. These stores were geocoded using ArcMap 10.2.2 and
clipped to the Phoenix-Mesa Urban Area boundary. This eliminated any stores in the dataset that
did not fall within the boundaries of the study area. The stores were then re-projected from the
original Geographic Coordinate System to NAD 1983 HARN StatePlane Arizona Central FIPS
0202 which was necessary for the precise distance measurements needed for this analysis. The
spatial distribution of the final 288 grocery stores included in this analysis can be seen in Figure

27
3. It is common for some street intersections to have more than one grocery store in competition
and these location points may be stacked on the map at this scale.
Esri, HERE, DeLorme, MapmyIndia, © OpenStreetMap contributors, and the GIS
user community
³
0 7.5 153.75 Miles
Grocery Stores (288)
Study Block Groups
No data
Phoenix-Mesa UA Boundary
Figure 3 Spatial Distribution of Supermarkets in the Study Area
Fast food restaurants were sourced from Dun and Bradstreet which includes
classifications for all Eating Places and also sub-classifications of Sit Down Restaurants and Fast
Food Restaurants. The locations listed in the Fast Food Restaurants classification were refined,

28
clipped, geocoded and re-projected using the same process for grocery stores as described above.
The spatial distribution of the 648 fast food locations can be seen in Figure 4. Again, it is very
common for some street intersections to have multiple fast food locations due to competition and
zoning. These location points may be stacked on the map at this scale.
Esri, HERE, DeLorme, MapmyIndia, © OpenStreetMap contributors, and the GIS
user community
³
0 7.5 153.75 Miles
Fast Food Locations (648)
Study Block Groups
No data
Phoenix-Mesa UA Boundary
Figure 4 Spatial Distribution of Fast Food Restaurants in the Study Area
Another factor that needs to be clearly defined in a food desert study is access. This
study will define areas as having good access if they are within 0.62 miles (1 km) from a grocery
29
store. One kilometer is used to represent a maximum reasonable walking distance for an adult.
This distance is used in many of the reviewed food desert studies and highlighted in the USDA
Food Desert Report to Congress (Ver Ploeg 2009) as being the critical distance that is most often
implemented. While this walking distance is for the average population, it still may be more
than some people would be able or willing to walk, such as the elderly or handicapped
(Apparicio, Cloutier and Shearmur 2007) and could be seasonal as the average summer
temperature in Phoenix is over 100 degrees. This accessibility measure will be calculated using
Maricopa County Street Network data that has been sourced from the Arizona State University
GIS Repository and the Network Analyst extension in ArcMap 10.2.2. Network Analyst allows
for a more accurate measurement as it takes into consideration barriers and street routes which
allows for a more realistic measurement of travel.
Light rail as a form of transportation was not included in this study because access to
grocery stores is not a primary use of the light rail and there are very few grocery stores located
along the route or near the light rail stops. Only 10 stores are located within the 0.62 mile
walking distance of a light rail stop indicating that this was not an intended purpose of the light
rail. Access by car and bus will also be excluded from the scope of this study, although
consideration of those aspects would be interesting for a different study. In low income
populations, not everyone has regular access to automobiles and this study is focused on
including the entire community. Using a bus for transportation to and from the grocery store is
an option for low income households that do not have access to a vehicle and would be feasible
since 201 of the 288 bus stops the study area are within a 1 km walking distance of a food store,
but this access measure introduces additional decisions regarding total travel time that combines
walking to the bus that is beyond the scope of this study.
30
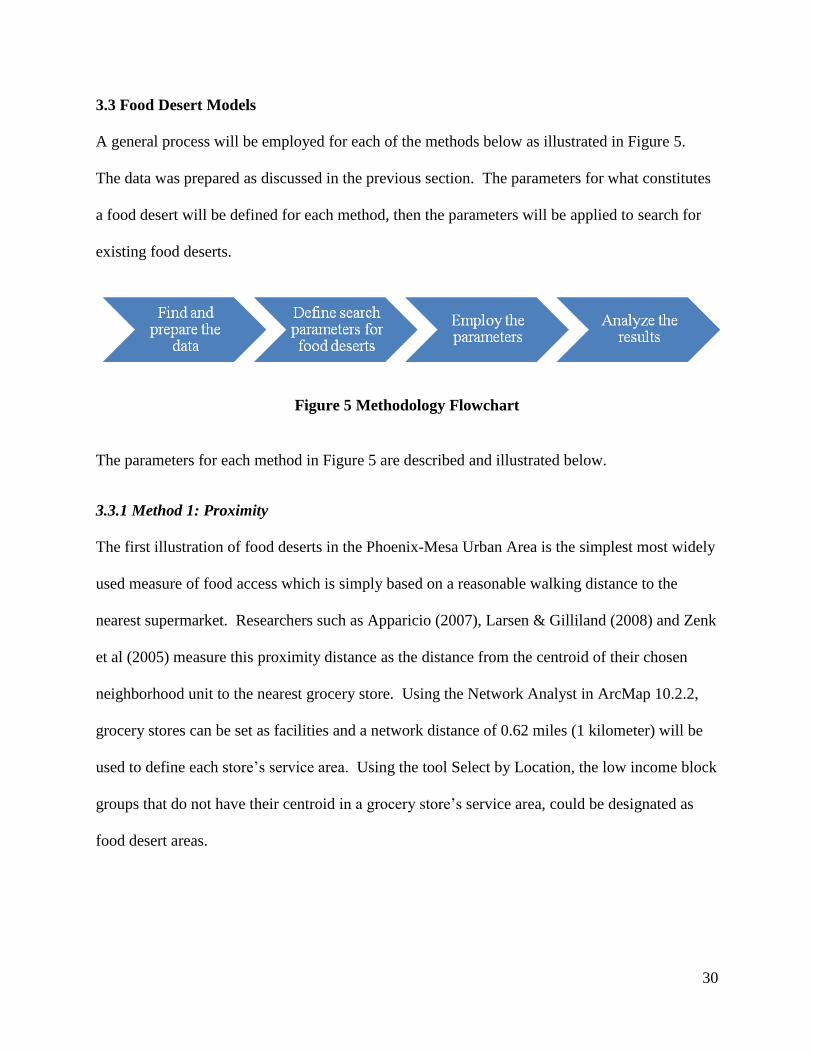
3.3 Food Desert Models
A general process will be employed for each of the methods below as illustrated in Figure 5.
The data was prepared as discussed in the previous section. The parameters for what constitutes
a food desert will be defined for each method, then the parameters will be applied to search for
existing food deserts.
Figure 5 Methodology Flowchart
The parameters for each method in Figure 5 are described and illustrated below.
3.3.1 Method 1: Proximity
The first illustration of food deserts in the Phoenix-Mesa Urban Area is the simplest most widely
used measure of food access which is simply based on a reasonable walking distance to the
nearest supermarket. Researchers such as Apparicio (2007), Larsen & Gilliland (2008) and Zenk
et al (2005) measure this proximity distance as the distance from the centroid of their chosen
neighborhood unit to the nearest grocery store. Using the Network Analyst in ArcMap 10.2.2,
grocery stores can be set as facilities and a network distance of 0.62 miles (1 kilometer) will be
used to define each store’s service area. Using the tool Select by Location, the low income block
groups that do not have their centroid in a grocery store’s service area, could be designated as
food desert areas.
31
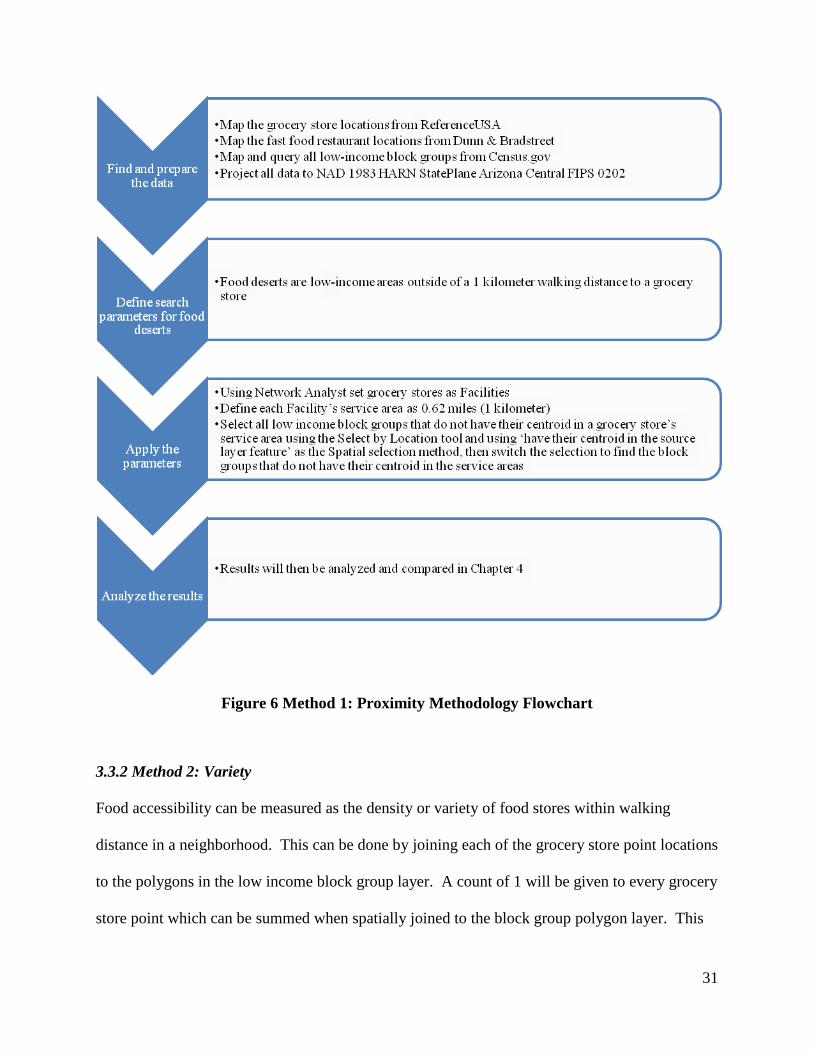
Figure 6 Method 1: Proximity Methodology Flowchart
3.3.2 Method 2: Variety
Food accessibility can be measured as the density or variety of food stores within walking
distance in a neighborhood. This can be done by joining each of the grocery store point locations
to the polygons in the low income block group layer. A count of 1 will be given to every grocery
store point which can be summed when spatially joined to the block group polygon layer. This

32
will create a sum of the grocery stores contained within each low income block group. The
classification scheme modelled after the research of Apparicio et al in 2007 can then be applied
by ranking the block groups as having Very High, High, Low or Very Low Access.
Figure 7 Method 2: Variety Methodology Flowchart

33
3.3.3 Method 3: Competition
A location where a resident has to look harder to find healthy foods over fast food or corner store
options can be considered a food swamp. This method measures competition by calculating the
distance from each block group centroid to the closest grocery store location and the distance
from each block group centroid to any fast food location using the Near tool in ArcMap 10.3.
The Near tool measures the distance between two features by calculating the shortest separation
between them. The grocery store to fringe food venue ratio can then be calculated within the
attribute table to create a food swamp score that can be used to describe healthy food
accessibility (Gallagher Group 2011).
Figure 8 Method 3: Competition Methodology Flowchart

34
3.4 Limitations of This Study
Even with the refinement of the list of grocery stores and fast food locations, there are potentially
more or less stores within the Phoenix-Mesa Urban Area as stores are constantly opening and
closing and updated records would take some time to populate through ReferenceUSA. It is also
complicated to predict where people are actually shopping due to options, preferences and other
variables that make people choose one store over another (Pearson, Russell, Campbell and
Barker, 2005). Discovering where people shop and why would require an extensive door to door
survey that is beyond the scope of this study. Another limitation is that roads were used to create
the walking network and may result in distances that may not be fully accurate as people may cut
across parking lots or corners.
Information regarding the geospatial accuracy of the grocery store and fast food locations
was not provided by either ReferenceUSA or Dun and Bradstreet. This accuracy will factor into
the results of this analysis because it involves calculating precise distances between locations
which are then compared to predefined boundaries and thresholds. For instance, the third
method, evaluating competition, will measure the distance from the census block group centroid
to the nearest grocery store and the nearest fast food location. A study comparing completeness
and the validity of geospatial accuracy of these information agencies by Liese, et al. (2010)
explored these particular differences. They found that geospatial accuracy varied depending on
the scale of the analysis and that more than 80% of locations provided by these information
agencies were geocoded to the correct US Census tract, but that only 29% (Dun and Bradstreet)
to 39% (ReferenceUSA) were correctly located within 100 meters of the actual location on the
ground. These measurement errors will impact the results of this analysis.

35
Glanz et al (Glanz, et al. 2005) & (K. Glanz 2009) identified two aspects of the food
environment including the “community nutritional environment” which they defined as the
number, type, location and accessibility of food outlets as well as the “consumer nutritional
environment” which is defined by what the consumers encounter in food outlets, such as price
and quality. This study does not account for any consumer nutritional environment.
36
CHAPTER 4: RESULTS
As discussed in previous chapters, three different food access definitions were calculated for the
US Census designated Phoenix-Mesa Urban Area which includes of a total of 2414 block
groups, 982 of which are considered Low-income or Below Poverty Level (Figure 2). The
widely recognized definition of a food desert as a disadvantaged area of a city with relatively
poor access to sources of healthy and affordable food options was used and measured three ways.
The data used in all three methods was prepared as discussed in Chapter 3. The grocery store
and fast food lists were scrubbed and checked for accuracy, then geocoded. The Census block
group data was loaded into ArcMap, projected and clipped to the Phoenix-Mesa Urban Area
study boundary. A query on the block group layer was set so that only the low income and
below poverty block groups were displayed and used for this analysis.
4.1 Method 1: Proximity
Food desert indicator Method 1 used the simplest and most widely used measure of food access
by just considering spatial accessibility and measuring the proximity of low income residents to a
grocery store. Using the Network Analyst extension in ArcMap 10.2.2 and the Maricopa County
Street Network data described in Chapter 3, grocery stores were set as Facilities and a network
distance of 0.62 miles was used to define each grocery store’s service area. The grocery store
service area across the study area can be seen in Figure 9. It can be seen that the majority of the
area within the Phoenix-Mesa Urban Area has limited walking access to grocery stores whether
or not the area is considered low income including a significant swath of land that is lacking in
grocery store service just south of Phoenix itself.

37
Figure 9 Neighborhood Areas within Walking Distance of Grocery Stores.
Using the Select by Location tool, the low income block groups that did not have their
centroid in the service area were selected and designated as food desert areas (Figure 10).

38
Figure 10 Method 1: Food Deserts Based on Proximity to the Nearest Grocery Store.
This method characterizes 80% of the low income block groups as food deserts. Since
this method indicated that the majority of the low-income block groups lack access, the same
cluster pattern of block groups in South Phoenix and along State Route 60 running diagonally
through Phoenix can be seen.
The proximity method is most notably used by the USDA ERS to locate food deserts and
focuses on areas that are simply low income and have low food access. An important limitation
39
of this method is that although network distances were used because they are a truer
representation of how people move through cities, accessibility is not the same as walkability.
Network distances do not take into consideration the presence or absence of sidewalks, safe
pedestrian street crossing or public security all of which could be significant barriers for food
access.
Although this thesis used the smaller block group level aggregation units, the MAUP was
not completely eliminated. It is possible that this method inflates the food desserts problem areas
because it does not account for larger area block groups whose centroids may not fall within the
buffer, but do have some area that falls within the grocery store service area.
4.2 Method 2: Variety
Method 2 measured food access as the variety of food store options within a neighborhood. A
new field called Count was added to the grocery store layer’s attribute table and Field calculator
was used to give every grocery store location a count of 1. The grocery store point locations
were then spatially joined to the block group polygon layer using Join Data based on spatial
location and the new Count field created a sum of the grocery store point counts within each low
income block group polygon.
The resulting attribute table revealed that there was no block group containing more than
five grocery stores within walking distance of the block group centroids, only one containing
exactly 5 and very few that contained 4 grocery stores. Because of this, a 4-tier classification
method adopted from Apparicio et al in 2007 can then be applied and a score of Very High
Access to Very Low Access was assigned to each block group (Figure 11) and symbolized in the
map below.

40
Figure 11 Method 2: Access Based on the Number of Grocery Stores within a 1 km
Walking Distance
Very High Access block groups contained 3+ grocery stores, High Access contained 2 grocery
stores, Low Access contained only 1 grocery store and Very Low Access contained no grocery
stores. This method classified 184 of the 562 low income block groups as having Low Access to
a grocery store, meaning that the block group only contained 1 grocery store and had no other
options. It also classified 275 block groups as having Very Low Access to grocery stores. This
leaves only 103 block groups that have acceptable access by this method’s criteria. It is
important to note that this method does not take into account any grocery stores that lie just

41
beyond the block group’s boundary. It is possible that residents that live towards the edges of
the block group boundaries have close access to grocery stores that fall within a neighboring
block group.
Method 2 identifies a large cluster of block groups in the South Phoenix area as having
Very Low Access to food stores. All 275 of the Very Low Access block groups were also
identified as food deserts in Method 1 as seen in Figure 12 below.
Figure 12 Potential Food Deserts Classified by Both Methods 1 and 2

42
4.3 Method 3: Competition
Method 3 identifies food swamps which are areas where a resident has to look harder for healthy
foods because cheaper, calorie dense, nutrient empty foods, such as fast food, are more
accessible. The Near tool in ArcMap was used to calculate the distance from each block group’s
centroid to the nearest grocery store location. This tool measures the distance between two
features by calculating the shortest separation between them. In this case, it calculated the
shortest distance between every block group’s centroid to the closest grocery store locations and
returned the distance to the nearest one in the output in the table. This distance was then copied
into a new field in the attribute table. The Near tool was used again to find the distance from
each centroid to the nearest fast food venues. A new field was added to the attribute table and
Field calculator was used to calculate the grocery store to fringe food ratio which creates a food
swamp score that can be used to describe healthy food accessibility. These scores were then
classified according to the methodology of the Mari Gallagher consulting group. Ratio scores up
to 1.3 were rated as Low meaning that a grocery is close and fringe food is more distant. Scores
between 1.4 and 2.0 were rated as Average and scores over 2.0 were classified as High, where
the fringe food is close and it takes longer to travel to the grocery store. The results of the Food
Swamp analysis can be seen in Figure 13.

43
Figure 13 Method 3: Food Swamp Scores.
This food swamp method classified only 35 block groups as having an Average Food
Swamp score when you consider fringe food options as competition and 37 as having a High
Food Swamp Score. Fifty-one of these food swamp block groups were also identified by both
Method 1 and Method 2, however it also classified 21 food deserts that were not picked up by
Method 1 or Method 2 (Figure 14). The majority of these Very High Food Swamp Scores are
seen along the highway where there are many truck stops for travelers heading out of town. It

44
makes sense that low-income block groups along the highways would have to travel farther for
grocery stores as there is a high presence of fast food for truckers and travelers.
This method takes into consideration competition and balance of healthy and unhealthy
food options. A Food Balance Score is created by calculating the average distance from a census
block centroid to any “mainstream food venue” (healthy grocery outlet) and dividing this by the
average distance to a “fringe food venue” (such as fast-food restaurant or unhealthy corner
store). The scores are then weighted by population density within each census block (Gallagher
Group, 2011). The benefit of this method is the ability to compare the saturation of good and
bad food options within a specified area.

45
Figure 14 Food Swamp Block Groups That Were Not Previously Identified by Methods 1
and 2

46
4.4 Review of the Findings
Marked differences were observed in which census block groups had poor food access with the
fewest number of block groups being identified by the Competition method, followed by the
Variety measure and lastly the Proximity measure. The comparison table (Table 2), shows that
according to the Competition method only 35 (6.2%) of the low income census block groups in
the study area were designated as food swamp areas compared to 184 (32.7%) according to the
Variety method. The Proximity method identified the majority of the low income block groups,
452, as a food desert areas.
Table 2 Attributes of Areas Designated as Having Poor Food Access According to Three
Methods
Proximity Variety Competition
Number of Block Groups 452 184 35
Total Low Income Block Groups (Percentage) 80% 33% 6%
Affected Population (Persons) 233,438 136,198 25,906
Minority Population (Percentage) 43% 41% 38%
Access to a supermarket based on proximity and variety is a problem for a large
percentage of low income block groups in the Phoenix-Mesa Urban Area. Results indicate that
residents are inhibited in their ability to access affordable nutritious food because they do not
live within walking distance of a grocery store and may not have access to reliable
transportation. This was shown both in Method 1 and Method 2. 80% of low income block
groups are located out of a grocery store’s service area in Method 1. According to the US
Census data this equates to approximately 233 thousand people in the Phoenix-Mesa Urban
Area.
Minority population percentage for each method was calculated by summing the minority
population data in the US Census Table P5 (US Census, 2010) for all block groups designated as

47
food deserts and calculating the percentage of the summed total population for each block group.
Populations considered minority include Black or African American, American Indian or Alaska
Native, Asian, Native Hawaiian or Other Pacific Islander, Some other race, More than one race,
Hispanic or Latino and Not Hispanic or Latino by race. The State of Arizona as a whole and the
Phoenix-Mesa Urban Area have minority percentages of 42% and 29% respectively. The
minority percentage in food desert areas for all three methods are higher than the urban area as a
whole, but are similar when looking at the whole state of Arizona.
Research has shown that easy access to all food, rather than specifically healthy foods
may be a more important factor in explaining obesity and health disparity among low-income
populations in that many studies find a correlation between limited food access and a lower
intake of nutritious foods. The Food Swamp method can quantify this with a Food Swamp
Score, however, in the Phoenix-Mesa Urban Area, it appears that block groups with low food
swamp scores are located along a well-travelled highway and low ratios would make sense given
the large amount of fast food locations catering to truckers and travelers in these areas.
In Method 1 (Proximity), all census block groups that fell outside of walking distance to a
supermarket considered food deserts, meaning that only supermarkets were perceived as being
the only sources of healthy and affordable food options. However, there is some research that
argues that by ignoring these alternative sources of healthy food such as farmers markets and
ethnic or specialty stores, food deserts areas are likely to be overestimated (Bodor et al, 2008;
Neckerman et al, 2009; VerPloeg, 2009).
Method 2 (Variety), measures food availability taking into consideration that people have
preferences and can make decisions about where they shop. Block groups that have no grocery
stores are considered very low access and block groups that contain only one option are still

48
considered low access. This method also does not take into consideration any other food outlet
options such as farmers markets and or smaller stores. Method 3 measures the availability of
both healthy and unhealthy foods and is focused on the ease of access to healthy foods.
Method 3 (Competition), also measures food availability and preferences as in Method 2,
but takes into consideration the whole food landscape. Even in neighborhoods with grocery
stores, the amount of fast food options can crowd out healthy food options. This is a main
concern for those with busy families that may grab the easiest option or those that lack nutrition
education. This is a problem because there are clear relationships between high access to fast
food and negative health outcomes such as obesity and diabetes (Moreland et al 2002).

49
CHAPTER 5: DISCUSSION
Food access and varying food desert definitions in the Phoenix-Mesa Urban Area were explored
using three different methodologies. The findings in this study showed that depending on the
definition of food desert, the results can change extensively within the study area. In order to
visualize where the inconsistencies were located, the results were mapped and analyzed.
According to Method 1, a very large portion of the study area and most of the low income block
groups included in this analysis were classified as food deserts. Food desert extent and location
decreased with Method 2 and almost disappeared when Method 3 was applied. The results from
these three different methodologies produced inconsistent results when it comes to finding areas
that lack access to and availability of food.
5.1 Summary of Findings
The review of food desert literature showed that there is wide variability and inconsistency in
definitions, variables or thresholds used for defining and locating food deserts. The results of
this analysis show a systematic comparison between the three different measures of food access
and highlight the similarities and differences between these measures.
This study replicated three measures of healthy food accessibility based on the same data
using the most common definitions of proximity, variety and competition. This approach
focused on the differences in results that can occur when different methods are used over the
same geographic area of the Phoenix-Mesa Urban Area and demonstrated some substantial
differences in coverage.
The simplest most widely used measure of food access is based on a reasonable walking
distance to the nearest supermarket. Grocery store service areas were calculated and intersected
with the centroids of low income block groups which designated 80% of the low income block

50
groups as potential food deserts. Because the only food sources included in this study were
grocery stores, this method may have overestimated the food desert extent if farmers markets,
ethnic food stores had been included.
The second method measured food access as the variety of food stores within a
neighborhood and assigned a classification of Very High Access, High Access, Low Access or
Very Low Access. The majority of the low income block groups fell into either the Low Access
or Very Low Access categories.
The third method takes into consideration how hard a resident has to look to find food
healthy or unhealthy. The Food swamp method measures competition by calculating the
distance to the nearest grocery store location and the distance to any fast food location to create a
ratio. The healthy food to fringe food ratio was then used to create a Food Swamp score based
on the research of the Mari Gallagher Group. This method only designated 35 block groups as
having significantly more difficulty getting to a grocery store. It also may indicate that in some
areas that have been indicated as having poor access through methods one and two, the low
income block groups have a hard time accessing any food. Residents need to travel equally far
to get to a healthy food or fringe food venue. This method may be better suited to denser urban
cores and may not produce significant results due to the sprawling nature of the Phoenix-Metro
Area.
5.2 Significance of findings
Research on locating food deserts, access to healthy food choices and environmental injustice
issues related to food security suggest that living in a food desert contributes to poor diet quality
and higher risk for serious diseases. Many food activists consider equal access to food a basic
human right and demand policy changes that will change the food environment for residents

51
living in food desert areas. This study has shown that there are in fact significant differences in
the locations and extent in food accessibility in the Phoenix-Mesa Urban Area.
The proximity method specifically targets low income populations that have low access
to food outlets and identified by far the most block groups out of the three methods. The variety
method may be the most natural as it takes into consideration choice and preference of where
residents may shop.
As food desert research evolves and food access policies in the United States progresses,
the governments and agencies involved need to understand how their food access definitions
impact the geographical extent of the problem. As this area of research continues to grow and
become a bigger focus, researchers may want to consider working towards the synchronization
of their various definitions.
5.3 Study Limitations
This study has several limitations beyond the limitations discussed in Chapter 3. The potential
access that was measured in all three methodologies identified grocery stores where residents
had the option to shop, without taking into consideration preferences or where residents actually
shop (VerPloeg, 2009) and also the assumption that residents would always choose the healthiest
option I distance allowed them to. Another limitation is that access to food stores was only
measured by walking and access to transportation was not considered as it was beyond the scope
of this study. Additionally, while thorough phone vetting was done in the data gathering phase,
an in-store survey was not. An analysis of shelf space holding healthy food options versus junk
options could be used to distinguish gas stations, convenience stores, and ethnic and specialty
stores as responsible providers of healthy food options to be included in the analysis. Another
factor that a survey could illustrate is any cost-based accessibility in low income areas.

52
There is also an assumption, in this thesis and any study that uses Census data, that the
land use within each block group is homogeneous, which is not always the case. The use of a
centroid point in these methods assumed an equal distribution of residential areas within the
block group. Geographic reality is that residential areas cluster with other residential areas. This
could potentially cause the population to be located in one corner of the block group which
would have an impact on realistic walking distances.
5.4 Opportunities for Future Research
In previous chapters, food desert definition variations were discussed and, in some cases, the
existence of food deserts was debated among scholars because of the different ways of defining
and measuring food deserts. Because of all of the factors involved in locating food deserts, some
researchers believe that a universal methodology will never be achieved that will produce
accurate and realistic results. In order to advance this research, this thesis compared the results
of the three most common methodologies applied to the same area and mapped the results so that
the inconsistencies could be analyzed. As awareness of how different variables link the food
environment, health and other environmental issues grows, policy makers will need a better
understanding of what causes food deserts in urban neighborhoods. By properly selecting and
analyzing food desert elements, analysts and decision makers can reduce errors and improve the
comparability of the results across studies which they can then use to make confident decisions
and solutions for their community’s problems.
5.5 Recommendations for Future Research
The majority of the research in this area has focused on quantitative approaches, but even
advanced mathematical formulations cannot quite capture such things as personal preferences,
decision making or education regarding health. Surveys of individuals and households or the
53
contents of food outlets would add qualitative angles to this problem including data on food
shopping behavior and decision making.
It would also be interesting to re-run all three of these methods taking into consideration
other outlets of healthy food such as farmers markets and specialty or ethnic grocery stores.
Both research by Rose et al (2009) and Short et al (2007) indicated that an area technically
cannot be defined as a food desert based only on the absence of grocery stores and supermarkets
when alternative sources of healthy and affordable food options are present in the given study
area. It would be interesting to see how large of an impact the addition of those locations would
make. Inclusion of those stores would at the very least provide food for the cultural preferences
of the Latino communities that are predominant in the South Phoenix and Chandler food desert
areas called out in this study.
In just about all food desert studies, household income and distance are assumed to be the
most significant barriers when it comes to healthy food options. A more extensive set of
variables and regression analysis would be interesting future research in order to measure food
access and identify food deserts and which variables actually contribute more to the problem.

54
Appendix A: Reviewed Food Desert Studies
Researcher (year)
Study Area Food Availability (Food Store Types)
Food Access Measure
Buffer Size
Buffer Shape
Data Aggregation Level
Socioeconomic & Demographic Variables
Findings
Anthony & Lee (2010)
Los Angeles, California
Supermarkets Proximity, Density
1600 m Network Census Block Group
Income Food deserts in Downtown area and Southeast Los Angeles.
Apparicio et al (2007)
Montreal, Quebec
Supermarkets Proximity, Density, Variety
1000 m Network Census Tract Block
Income, Lone-parent families, Unemployment, Education, Recent immigrants
No food deserts found in Montreal.
Austin et al (2005)
Chicago, Illinois
Fast food outlets, School locations
Proximity to schools, Density
400 and 800 m
Circular Census Tract Household income, percentage of commercial land, located in or out of downtown
Fast food locations are concentrated near schools.
Baltimore City's Food Policy & Johns Hopkins Center (2010)
Baltimore, Maryland
Supermarkets, Convenience Stores, Corner Stores
Proximity, Density
400 m Network Block Group Household income, Car ownership
Food desert located in inner-city area.
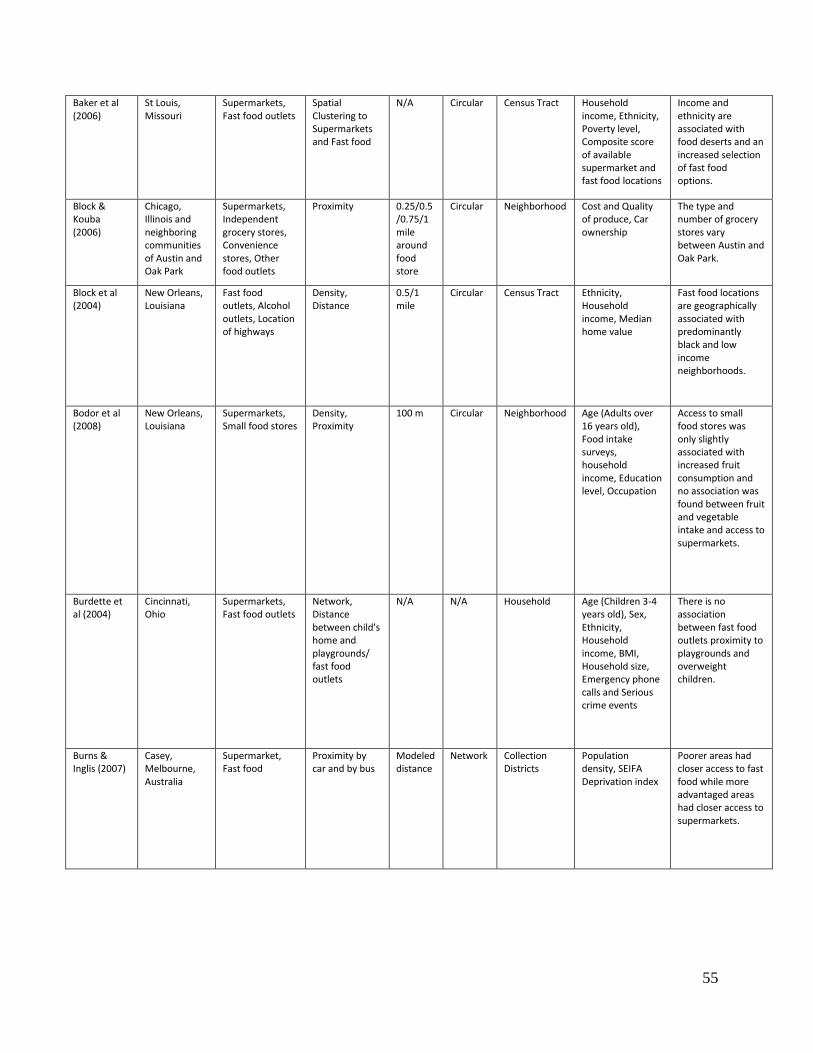
55
Baker et al (2006)
St Louis, Missouri
Supermarkets, Fast food outlets
Spatial Clustering to Supermarkets and Fast food
N/A Circular Census Tract Household income, Ethnicity, Poverty level, Composite score of available supermarket and fast food locations
Income and ethnicity are associated with food deserts and an increased selection of fast food options.
Block & Kouba (2006)
Chicago, Illinois and neighboring communities of Austin and Oak Park
Supermarkets, Independent grocery stores, Convenience stores, Other food outlets
Proximity 0.25/0.5/0.75/1 mile around food store
Circular Neighborhood Cost and Quality of produce, Car ownership
The type and number of grocery stores vary between Austin and Oak Park.
Block et al (2004)
New Orleans, Louisiana
Fast food outlets, Alcohol outlets, Location of highways
Density, Distance
0.5/1 mile
Circular Census Tract Ethnicity, Household income, Median home value
Fast food locations are geographically associated with predominantly black and low income neighborhoods.
Bodor et al (2008)
New Orleans, Louisiana
Supermarkets, Small food stores
Density, Proximity
100 m Circular Neighborhood Age (Adults over 16 years old), Food intake surveys, household income, Education level, Occupation
Access to small food stores was only slightly associated with increased fruit consumption and no association was found between fruit and vegetable intake and access to supermarkets.
Burdette et al (2004)
Cincinnati, Ohio
Supermarkets, Fast food outlets
Network, Distance between child's home and playgrounds/ fast food outlets
N/A N/A Household Age (Children 3-4 years old), Sex, Ethnicity, Household income, BMI, Household size, Emergency phone calls and Serious crime events
There is no association between fast food outlets proximity to playgrounds and overweight children.
Burns & Inglis (2007)
Casey, Melbourne, Australia
Supermarket, Fast food
Proximity by car and by bus
Modeled distance
Network Collection Districts
Population density, SEIFA Deprivation index
Poorer areas had closer access to fast food while more advantaged areas had closer access to supermarkets.
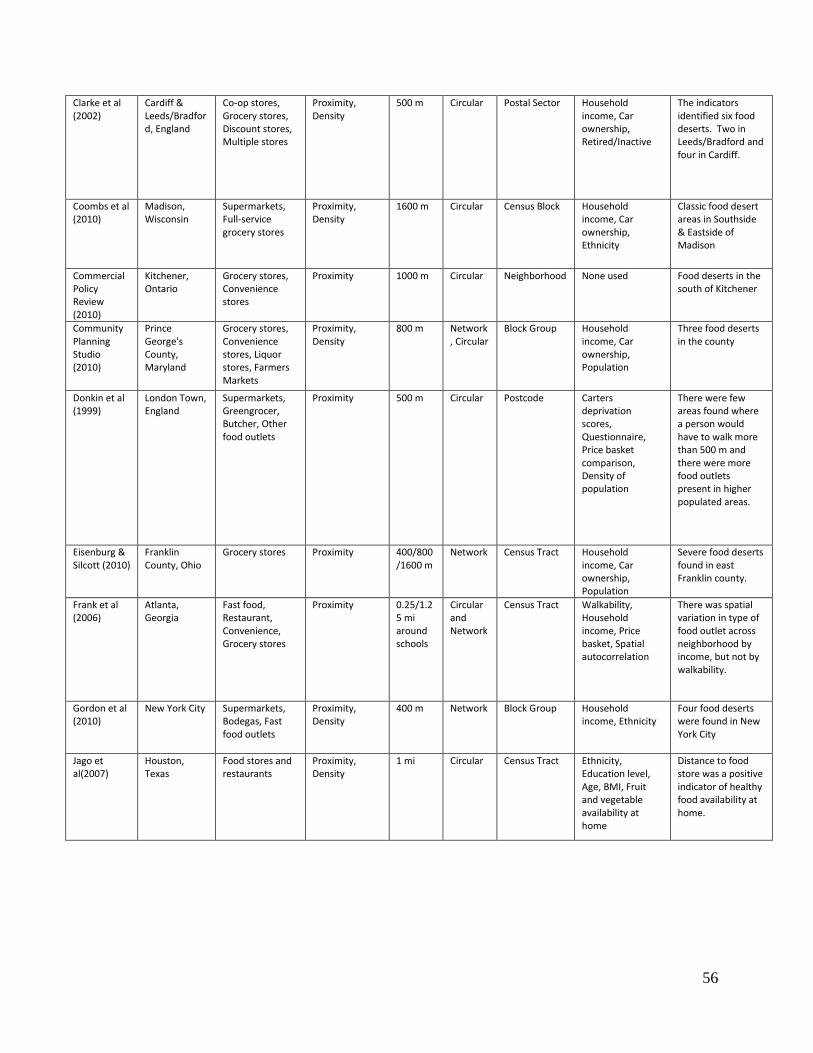
56
Clarke et al (2002)
Cardiff & Leeds/Bradford, England
Co-op stores, Grocery stores, Discount stores, Multiple stores
Proximity, Density
500 m Circular Postal Sector Household income, Car ownership, Retired/Inactive
The indicators identified six food deserts. Two in Leeds/Bradford and four in Cardiff.
Coombs et al (2010)
Madison, Wisconsin
Supermarkets, Full-service grocery stores
Proximity, Density
1600 m Circular Census Block Household income, Car ownership, Ethnicity
Classic food desert areas in Southside & Eastside of Madison
Commercial Policy Review (2010)
Kitchener, Ontario
Grocery stores, Convenience stores
Proximity 1000 m Circular Neighborhood None used Food deserts in the south of Kitchener
Community Planning Studio (2010)
Prince George's County, Maryland
Grocery stores, Convenience stores, Liquor stores, Farmers Markets
Proximity, Density
800 m Network, Circular
Block Group Household income, Car ownership, Population
Three food deserts in the county
Donkin et al (1999)
London Town, England
Supermarkets, Greengrocer, Butcher, Other food outlets
Proximity 500 m Circular Postcode Carters deprivation scores, Questionnaire, Price basket comparison, Density of population
There were few areas found where a person would have to walk more than 500 m and there were more food outlets present in higher populated areas.
Eisenburg & Silcott (2010)
Franklin County, Ohio
Grocery stores Proximity 400/800/1600 m
Network Census Tract Household income, Car ownership, Population
Severe food deserts found in east Franklin county.
Frank et al (2006)
Atlanta, Georgia
Fast food, Restaurant, Convenience, Grocery stores
Proximity 0.25/1.25 mi around schools
Circular and Network
Census Tract Walkability, Household income, Price basket, Spatial autocorrelation
There was spatial variation in type of food outlet across neighborhood by income, but not by walkability.
Gordon et al (2010)
New York City Supermarkets, Bodegas, Fast food outlets
Proximity, Density
400 m Network Block Group Household income, Ethnicity
Four food deserts were found in New York City
Jago et al(2007)
Houston, Texas
Food stores and restaurants
Proximity, Density
1 mi Circular Census Tract Ethnicity, Education level, Age, BMI, Fruit and vegetable availability at home
Distance to food store was a positive indicator of healthy food availability at home.
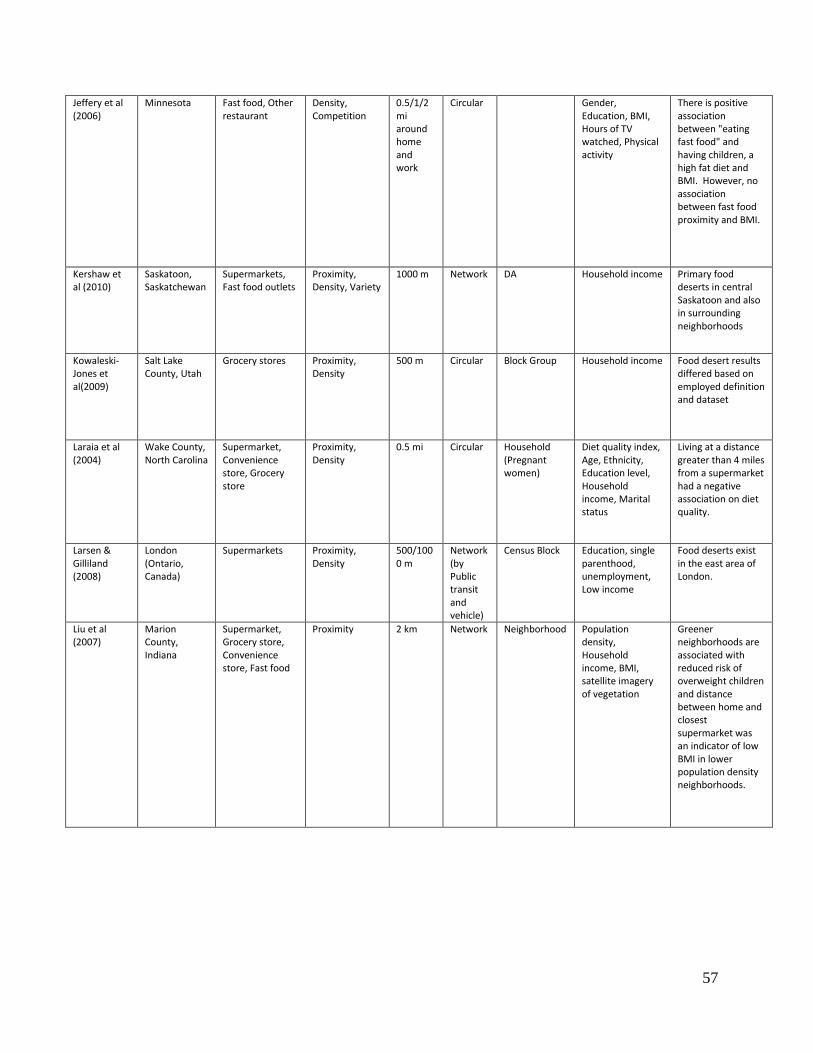
57
Jeffery et al (2006)
Minnesota Fast food, Other restaurant
Density, Competition
0.5/1/2 mi around home and work
Circular Gender, Education, BMI, Hours of TV watched, Physical activity
There is positive association between "eating fast food" and having children, a high fat diet and BMI. However, no association between fast food proximity and BMI.
Kershaw et al (2010)
Saskatoon, Saskatchewan
Supermarkets, Fast food outlets
Proximity, Density, Variety
1000 m Network DA Household income Primary food deserts in central Saskatoon and also in surrounding neighborhoods
Kowaleski-Jones et al(2009)
Salt Lake County, Utah
Grocery stores Proximity, Density
500 m Circular Block Group Household income Food desert results differed based on employed definition and dataset
Laraia et al (2004)
Wake County, North Carolina
Supermarket, Convenience store, Grocery store
Proximity, Density
0.5 mi Circular Household (Pregnant women)
Diet quality index, Age, Ethnicity, Education level, Household income, Marital status
Living at a distance greater than 4 miles from a supermarket had a negative association on diet quality.
Larsen & Gilliland (2008)
London (Ontario, Canada)
Supermarkets Proximity, Density
500/1000 m
Network (by Public transit and vehicle)
Census Block Education, single parenthood, unemployment, Low income
Food deserts exist in the east area of London.
Liu et al (2007)
Marion County, Indiana
Supermarket, Grocery store, Convenience store, Fast food
Proximity 2 km Network Neighborhood Population density, Household income, BMI, satellite imagery of vegetation
Greener neighborhoods are associated with reduced risk of overweight children and distance between home and closest supermarket was an indicator of low BMI in lower population density neighborhoods.

58
Moore et al (2008)
New York City, North Carolina and Maryland
Supermarket, Other smaller stores
Density 1 mi Kernel Density Method
Census Tract Perceived availability of healthy food, Dietary patterns survey, Age, Gender, Ethnicity, Household income, Population density
People with no close supermarkets were less likely to have a healthy diet and supermarket density is a positive indicator of perceived healthy food availability.
O'Dwyer & Coveney (2006)
Adelaide, Australia
Supermarkets Proximity, Density
2500 m Network Local Government Areas (LGA)
Car ownership, SEIFA
Many food deserts appear to exist within the LGAs depending on socio-economic differences.
Pearce et al (2006)
New Zealand Food outlet, health facilities
Proximity travel time
Network Census Meshblock
N/A There are variations in accessibility between neighborhoods.
Pearce et al (2007)
New Zealand Supermarket, fast food, Convenience store
Proximity, Competition
travel time
Network Census Meshblock
Socio-economic characteristics, Urban/rural status
Access to fast food is greater in more deprived neighborhoods and around more disadvantaged schools.
Pearce et al (2008)
New Zealand Supermarket, Convenience store
Proximity travel time
Network Census Meshblock
Meshblock variables, Survey
Little evidence found that poor access to food is associated with lower fruit and vegetable intake.
Rose et al (2009)
New Orleans Supermarkets, Fast food outlets
Proximity, Density
1000/2000 m
Network Census Tract Household income, Car ownership
Food desert rates range from 17% to 87 % based on the definition and factors used.
Russell & Heidkamp (2011)
New Haven, Connecticut
Supermarkets, Grocery stores
Proximity 400/800/1600 m
Network Block Group Household income, Car ownership, Poverty level
Sever food deserts found in east New Haven.
Schledt (2010)
Nashville, Tennessee
Grocery stores Proximity 500 m Circular Census Block Household income, Car ownership
Four food deserts found in study area.

59
Sharkey & Horel (2008)
Six different counties in rural Texas
Grocery store, Supermarket, Convenience store, Discount store
Proximity N/A network Deprivation index, Minority composition, Population density
Household There is better spatial access to food stores for neighborhoods with high socio-economic deprivation.
Smoyer-Tomic et al (2008)
Edmonton, Alberta
Supermarket, Fast food
Proximity 500/800 m
Circular around Block centroid, Network
Census Block Ethnicity, SES, Age, Family status, Housing tenure, Urbanization
Fast food outlet density was higher in low-income neighborhoods.
Smoyer-Tomic et al (2006)
Edmonton, Alberta
Supermarkets Proximity, Density
1000 m Network Postal Code Household income, Elderly people, Car ownership
Six food deserts identified in suburban areas
Ball et al (2008)
Geelong area, Melbourne, Australia
Supermarket, Greengrocer, Convenience store, Fast food, Restaurants
Proximity, Competition
800 m Network Household Survey, Socioeconomic and demographic variables
Children consumed more vegetables if they lived farther away from a supermarket or fast food outlet.
University of Washington (2011)
Puget Sound, Washington
Supermarkets Proximity 800 m Network Census Block Household income Food deserts in suburban areas except King county
Winkler et al (2006)
Brisbane, Australia
Supermarket, Greengrocers
Proximity 2.5 km Circular Census collection districts
IRSD, Hours of operation
It is unlikely that living in a socioeconomically disadvantaged area presents fewer opportunities to purchase fruits and vegetables in urban areas.
Widener et al (2012)
Buffalo, NY Grocery stores and mobile produce trucks
Competition N/A Spatial Optimization Model
Block groups There are many areas in Buffalo with low access to grocery stores that may be alleviated by mobile food trucks.

60
Zenk et al (2005)
Detroit, Michigan
Supermarket Proximity N/A Network (Manhattan)
Census Tract Population density, Residents below poverty, Spatial autocorrelation
The most impoverished neighborhoods with African American residents were further from the nearest supermarket than were the most impoverished white neighborhoods.
Zenk & Powell (2008)
The fifty US States and the twenty largest cities in the US.
Fast food, Convenience store
Density 0.5 mi Circular Census tract Ethnicity, Median income, Education level, Population density, Urbanization
Within 0.5 miles walking distance fast food and convenience stores were more available in the lowest income neighborhood and there were fewer food outlets in African American neighborhoods than white neighborhoods.
61
REFERENCES
American Community Survey. 2011. “TIGER/Line with Selected Demographic and Economic
Data.” Accessed September 2014. www.census.gov/geo/tiger/
American Public Health Association. 2007. Toward a healthy, sustainable food system. Policy
statement no. 200712, Washington, DC: American Public Health Association. Retrieved
April 2014. www.apha.org/policies-and-advocacy/public-health-policy-
statements/policy-database/2014/07/29/12/34/toward-a-healthy-sustainable-food-system.
Apparicio, P., M. Cloutier, and and R. Shearmur. 2007. The case of Montreal's missing food
deserts: Evaluation of accessibility to supermarkets. International Journal of Health
Geographics 6 (1): 4. doi:10.1186/1476-072X-6-4.
Azuma, Andrea Misako, Susan Gilliland, Mark Vallianatos, and Robert Gottlieb. 2010. Food
Access, Availability, and Affordability in Three Los Angeles Communities, Project
CAFE 2004-2006. Preventing Chronic Disease 7(2): A27. Accessed September 2013.
http://www.cdc.gov/pcd/issues/2010/mar/08_0232.htm
Ball, K., A. Timperio, and D. Crawford. 2008. Neighborhood socioeconomic inequalities is food
access and affordability. Health and Place, 15(2): 578-585.
doi:10.1016/j.healthplace.2008.09.010
Beaumont, J., T. Lang, S. Leather, and C. Mucklow. 1995. Report from the policy sub-group to
the Nutrition Task Force Low Income Project Team of the Department of Helath.
Committee Report, Radlett, Hertfordshire: Institute of Grocery Distribution.
Blanchard, T., and L. Morton 2007. Starved for Access: Life in Rural America's Food Deserts.
Rural Realities 1(4). Accessed April 2015. http://www.iatp.org/files/258_2_98043.pdf

62
Blanchard, T., and T. Lyson. 2006. “Access to Low Cost Groceries in Nonmetropolitan
Counties: Large Retailers and the Creation of Food Deserts.” In Measuring Rural
Diversity Conference Proceedings, November, pp. 21-22.
Block, J., R. Scribner, and K. DeSalvo. 2004. Fast food, race/ethnicity, and income: A
geographic analysis. American Journal of Preventative Medicine, 27:211-17.
Bodor, J., D. Rose, T. Farley, C. Swalm, and S. Scott. 2008. Neighborhood fruit and vegetable
availability and consumption: the role of small food stores in an urban environment.
Public Health Nutrition, 11(4): 413-420. doi: 10.1017/S1368980007000493
Burns, C., and A. Inglis. 2007. Measuring Food Access in Melbourne: Access to Healthy and
Fast Foods by Car, Bus, and Food in an Urban Municipality in Melbourne. Health Place,
13(4): 877-85.
Clarke, G., H. Eyre, and C. Guy. 2002. Deriving indicators of access to food retail provision
in British cities: Studies of Cardiff, Leeds and Bradford. Urban Studies, 39(11): 2041-
2060.
Cummins, Steven, and Sally Macintyre. 2002. "Food deserts - Evidence and assumption in health
policy making." British Medical Journal 325 (7361): 436-438. Accessed April 9, 2015.
http://www.ncbi.nlm.nih.gov/pmc/articles/PMC1123946/#B4.
Cummins, S., and S. Macintyre. 2002. A systematic study of an urban foodscape: The price and
availability of food in greater Glasgow. Urban Studies 39(11): 2115-2130.
Donkin, A., E. Dowler, S. Stevenson, and S. Turner. 1999. Mapping Access to Food in a
Deprived Area: The Development of Price and Availability Indices. Public Health
Nutrition 3: 31–38.

63
Economic Research Service (ERS). 2009. Access to Affordable and Nutritious Food - Measuring
and Understanding Food Deserts and Their Consequences. United States Department of
Agriculture. Report of Congress, Washington, DC: US Government Printing Office.
Accessed March 2013. http://www.ers.usda.gov/publications/ap-administrative-
publication/ap-036.aspx
Economic Research Service (ERS), U.S. Department of Agriculture (USDA). 2013. Food Access
Research Atlas. March 1. Accessed November 11, 2014. http://www.ers.usda.gov/data-
products/food-access-research-atlas.aspx.
Farley, T.A., J. Rice, J.N. Bodor, D.A. Cohen, R.N. Bluthenthal, and D. Rose. 2009. Measuring
the food environment: Shelf space of fruits, vegetables, and snack foods in stores.
Journal of Urban Health 96 (5): 672-682. doi:10.1007/s11524-009-9390-3.
Food and Agriculture Organization. 1996. "Rome Declaration on Food Security and World Food
Summit Plan of Action." November 1996. Accessed November 4, 2014.
http://www.fao.org/docrep/003/w3613e/w3613e00.htm
Furey, S., C. Strugnell, and H. McIlveen. 2001. An investigation of the potential existence of
"Food Deserts" in rural and urban areas of Northern Ireland. Agriculure and Human
Values 18: 447-457.
Glanz, K., J.F. Sallis, B.E. Saelens, and L.D. Frank. 2005. Healthy nutrition environments:
Concepts and measures. American Journal of Health Promotion 19 (5): 330-333.
doi:10.4278/0890-1171-19.5.330.
Glanz, Karen. 2009. Measuring food environments. American Journal of Preventative Medicine
36 (4): S93-S98. doi:10.1016/j.amepre.2009.01.010.

64
Gordon, C., M. Purciel-Hill, N. Ghai, L. Kaufman, R. Graham, and G. Van Wye. 2011.
Measuring food deserts in New York City's low-income neighborhoods. Health and
Place, 17(2), 696-700. doi:10.1016/j.healthplace.2010.12.012
Hendrickson, D., C Smith, and N Eikenberry. 2006. Fruit and vegetable access in four low-
income food deserts communities in Minnesota. Agriculture & Human Values 23: 371-
383.
Hobiss, V Reisig and A. 2000. Food deserts and how to tackle them: A study of one city's
approach. Health Education Journal 59 (2): 137-149. doi:10.1177/001789690005900203.
Hsin-Chia Hung, Kaumudi J. Joshipura, Rui Jiang, Frank B. Hu, David Hunter, Stephanie A.
Smith-Warner, Graham A. Coldiz, Bernard Rosner, Donna Spiegelman, Walter C.
Willett. 2004. Fruit and Vegetable Intake and Risk of Major Chronic Disease. Journal of
the National Cancer Institute 96 (21): 1577-1584. Accessed April 9, 2015.
http://lbe.uab.es/vm/sp/old/docs/fibra/3-jnci-fruit-veg-cancer-cv-usa-coh.pdf.
Jago, R. 2007. Distance to food stores & adolescent male fruit and vegetable consumption:
mediation effects. International Journal of Behavioral Nutrition and Physical Activity,
4(1): 35. doi: 10.1186/1479-5868-4-35
Jeffery, R., J. Baxter, M. McGuire, and J. Linde. 2006. Are Fast Food
Restaurants an Environmental Risk Factor for Obesity? International
Journal of Behavioral Nutrition and Physical Activity, 3:2 doi:10.1186/1479-5868-3-2
Kowalski-Jones, L., J.X. Fan, I. Yamada, C. Zick, K. Smith, and B. Brown. 2009. "Alternative
Measures of Food Deserts: Fruitful Options or Empy Cupboards?" Paper prepared for he
National Poverty Conerence on access to affordale foods, University of Utah. Accessed

65
November 2014, 2014. http://www.npc.umich.edu/news/events/food-access/kowaleski-
jones_et_al.pdf.
Laraia, B., A. Siega-Riz, J. Kaufman and S. Jones. 2004. Proximity of supermarkets is positively
associated with diet quality index for pregnancy. Preventive Medicine 39(5): 869-875
Larson, N., M. Story and M. Nelson. 2009. Neighborhood environments: Disparities in
access to healthy foods in the U.S. American Journal of Preventative Medicine. 36(1):
74-91.
Larsen, K., and J. Gilliland. 2009. A farmers’ market in a food desert: evaluating impacts on the
price and availability of food. Health and Place, 15: 1158-1162.
Levin, Margalit. 2011. "Towards a greater understanding of food access in Melbourne." Paper
presented at the State of Australian Cities. Melbourne, VIC. Accessed September 2013.
http://soac.fbe.unsw.edu.au/2011/papers/SOAC2011_0213_final.pdf
Liese, A., N. Colabianchi, A. Lamichhane, T. Barnes, J. Hibbert, D. Porter, M. Nichols and A.
Lawson. 2010. Validation of 3 Food Outlet Databases: Completeness and Geospatial
Accuracy in Rural and Urban Food Environments. American Journal of Epidemiology,
172(11): 1324-1333. Doi: 10.1093/aje/kwg292
Liu, G., J. Wilson, R. Qi, and J. Ying. 2008. Green neighborhoods, food retail and
childhood overweight: differences by population density. American Journal of Health
Promotion, 21(4): 317-325.
Mari Gallagher Research and Consulting Group. 2008. "Food Desert and Food Balance Indicator
Fact Sheet." Accessed March 9, 2013.
http://www.marigallagher.com/site_media/dynamic/project_files/FdDesFdBalFactSheet
MG_.pdf.

66
McEntee, J., and J. Agyeman. 2010. Towards the development o a GIS mehod for identiying rual
food deserts: Geographic access in Vermont, USA. Applied Geography 30 (1): 165-176.
doi:10.1016/j.apgeog.2009.05.004.
Moore, L., and A. Roux. 2006. Associations of Neighborhood Characteristics With the
Location and Type of Food Stores. American Journal of Public Health, 96(2), 325-331.
Morland, Kimberly, Steve Wing, Ana Diez Roux, and Charles Poole. 2002. Neighborood
Characteristics Associated with the Location of Food Stores and Food Service Places.
American Journal of Prevenative Medicine 22 (1): 23-29. doi:10.1016/S0749-
3797(01)00403-2.
Morland, Kimberly, Ana Diez Roux and Steve Wing. 2006. Supermarkets, other food stores and
obesity: The atherosclerosis risk in communities study. American journal of Preventative
Medicine, 30(4): 333-339.
O'Dwyer L., and J. Coveney. 2006. Scoping supermarket availability and accessibility by socio-
economic status in Adelaide. Health Promotion Journal Australia, 7(3):240–246.
Pearce, J., T. Blakely, K. Witten, and P. Bartie. 2007. Neighborhood deprivation access to fast
food retailing: A national study. American Journal of Preventative Medicine, 32(5):
375-382.
Rose, D., N. Bodor, C. Swalm, J. Rice, T. Farley, and P. Hutchinson. 2009. "Deserts in New
Orleans? Illutations of urban food access and implications for policy." Paper prepared for
University of Michigan National Poverty Center and the USDA Economic Research
Service. Accessed November 11, 2014. http://www.npc.umich.edu/news/events/food-
access/rose_et_al.pdf

67
Heidkamp, C.P. & Russell, S.E. (2011). Food desertification: The loss of a major supermarket in
New Haven, Connecticut. Applied Geography, 31(4), 1197-1209. doi:
10.1016/j.apgeog.2011.01.010
Schlundt, D. (2010). Selection of Food Deserts for Nashville’s Communities Putting Prevention
to Work. Retrieved from
http://www.healthynashville.org/javascript/htmleditor/uploads/CPPWFoodDeserts.pdf.
Accessed April 2014.
Sharkey, J., and S. Horel. 2008. Neighborhood socioeconomic deprivation and minority
composition are associated with better potential spatial access to the ground-truthed food
environment in a large rural area. The Journal of Nutrition, 138(3): 620-627.
Shaw, Hillary 2006. Food Deserts: Towards the Development of Classification. Geograiska
Annaler: Series B, Human Geography 88 (2): 231-247. doi: 10.1111/j.0435-
3684.2006.00217.x.
Smoyer-Tomic, K., Spence, J. & Amrhein, C. (2006). Food deserts in the Prairies? Supermarket
accessibility and neighborhood need in Edmonton, Canada. The Professional
Geographer, 58(3): 307–326.
United States Census Bureau. 2010. www.census.gov. Accessed January 20, 2015.
http://www.census.gov/geo/ua/ua_list_ua.xls.
United States Cenus Bureau. 2010. www. census.gov Accessed January 30, 2015.
https://www.census.gov/geo/reference/ua/urban-rural-2010.html.
United States Department of Agriculture. 2013. "Food Insecurity and Food Environments in
America." usda.gov. Accessed November 4, 2014.
http://www.usda.gov/wps/portal/usda/usdahome.

68
United States Department of Agriculture -Environmental Research Service. 2014.
"www.ers.usda.gov." Food Security Status of U.S. Households in 2013. September 3.
Accessed November 4, 2014. http://www.ers.usda.gov/topics/food-nutrition-
assistance/food-security-in-the-us/key-statistics-graphics.aspx#householdtype.
Ver Ploeg, Michele. 2009. Access to Affordable and Nutritious Food - Measuring and
Understanding Food Deserts and Their Consequences. Report to Congress, USDA.
Accessed October 2013. http://www.ers.usda.gov/Publications/AP/AP036/.
Whelan, A., N. Wrigley, D. Warm, and E. Cannings. 2002. Life in a 'food desert'. Urban Studies
39 (11): 2083-2100. doi:10.1080/0042098022000011371.
Winne, Mark. 2008. Closing the Food Gap: Resetting the Table in the Land of Plenty. Boston,
Massachusetts: Beacon Press.
Winkler, E., Turrell, G., & Patterson, C., (2006) Does living in a disadvantaged area mean fewer
opportunities to purchase fresh fruits and vegetables in the area? Health and Place, 12:
306-319.
Wrigley, Neil, Daniel Warm, Barrie Margetts, and Amanda Whelan. 2002. Assessing the Impact
of Improved Retail Access on Diet in a 'Food Desert': A Preliminary Report. Urban
Studies 39 (11): 2061-2082.
Zenk, S.N., A.J. Schultz, B.A. Israel, S.A. James, S. Bao, and M.L. Wilson. 2005. Neighbrhood
racial composition, neighborhood poverty, and the spatial accessibility of supermarkets in
metropolitan Detroit." American Journal of Public Health 95 (4): 660-667.
Zenk, S., and L. Powell. 2008. US secondary schools and food outlets. Health and Place, 14:
336-346.


![Courses taught at USC - USC Dana and David Dornsife ...dornsife.usc.edu/.../DOC/Faculty/SLL/vita_1003690.docx · Web viewThe Word Made Self] ... Narratives of Gulag Survivors (Bloomington:](https://static.fdocuments.in/doc/165x107/5a78bc107f8b9aa17b8bc31b/courses-taught-at-usc-usc-dana-and-david-dornsife-viewthe-word-made-self.jpg)


