Jennifer C. Li Foundation for Environmental Security & Sustainability/ George Mason University...
34
Jennifer C. Li Foundation for Environmental Security & Sustainability/ George Mason University September 18, 2008 Sustainable Growth, Resource Productivity, and Sustainable Industrial Policy – Recent Findings, New Approaches for Strategies and Policies WI and EIIW Colloquium in Wuppertal CHINA & INDIA’S RESOURCE NEEDS and RELATED IMPACTS on AFRICA
-
date post
19-Dec-2015 -
Category
Documents
-
view
213 -
download
0
Transcript of Jennifer C. Li Foundation for Environmental Security & Sustainability/ George Mason University...

Jennifer C. LiFoundation for Environmental Security & Sustainability/
George Mason University
September 18, 2008
Sustainable Growth, Resource Productivity, and Sustainable Industrial Policy – Recent Findings, New Approaches for
Strategies and PoliciesWI and EIIW Colloquium in Wuppertal
CHINA & INDIA’S RESOURCE NEEDS
and RELATED IMPACTS on AFRICA

Presentation outline
• China and India’s economic performance, energy, emissions and energy policy emphases
• Implications on the environment and international energy security
• Implications for Africa’s development
• Outlook

Economic performance, past and projected
Source: International Energy Agency 2007

China and India’s contribution to global growth
0.0%
1.0%
2.0%
3.0%
4.0%
5.0%
6.0%
7.0%
8.0%
9.0%
2001
2002
2003
2004
2005
2006
2007
2008
2009
2010
2011
2012
2013
Others
India
China
Source: Authors’ own calculation based on IMF World Economic Outlook Database, Sept. ‘08
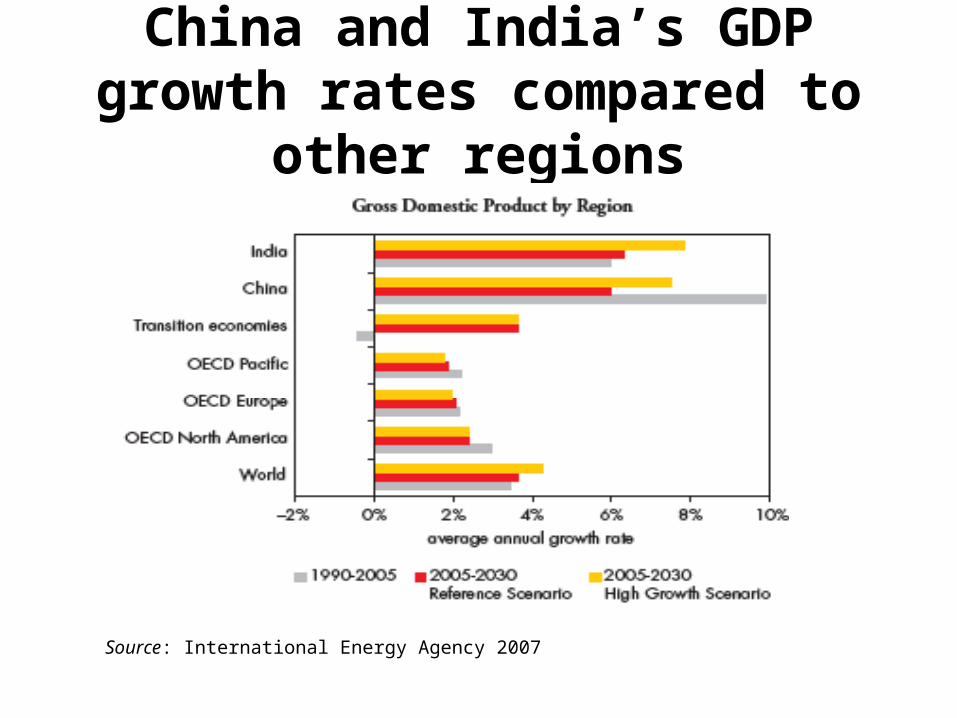
China and India’s GDP growth rates compared to other regions
Source: International Energy Agency 2007

Source: International Energy Agency 2007
Chart 4: World Primary Energy Demand by Region in 2005
(% of world's total)
0%5%
10%15%20%25%30%
North
Amer
ica
Euro
pe
Paci
fic
Tran
sitio
nec
onom
ies
Russ
ia
Chin
a
Indi
a
Oth
er A
sia M
E
Afric
a
Latin
Amer
ica

China and India’s energy needs relative to ROW
• China and India together account for nearly half of the entire growth in world energy demand between 2005 and 2030
• China and India’s combined share of global primary energy demand growing at phenomenal rate – but still less than 30% by 2030
• In 2007 China overtook the United States to become the world’s largest emitter of energy-related carbon dioxide and, by 2015, India will be the third largest emitter
• By around 2010, China will overtake the United States to become the world’s largest consumer of energy. In 2030, India will be the third largest oil importer in the world
• Over the period to 2030, China will install more new electricity generating capacity than exists in the United States today
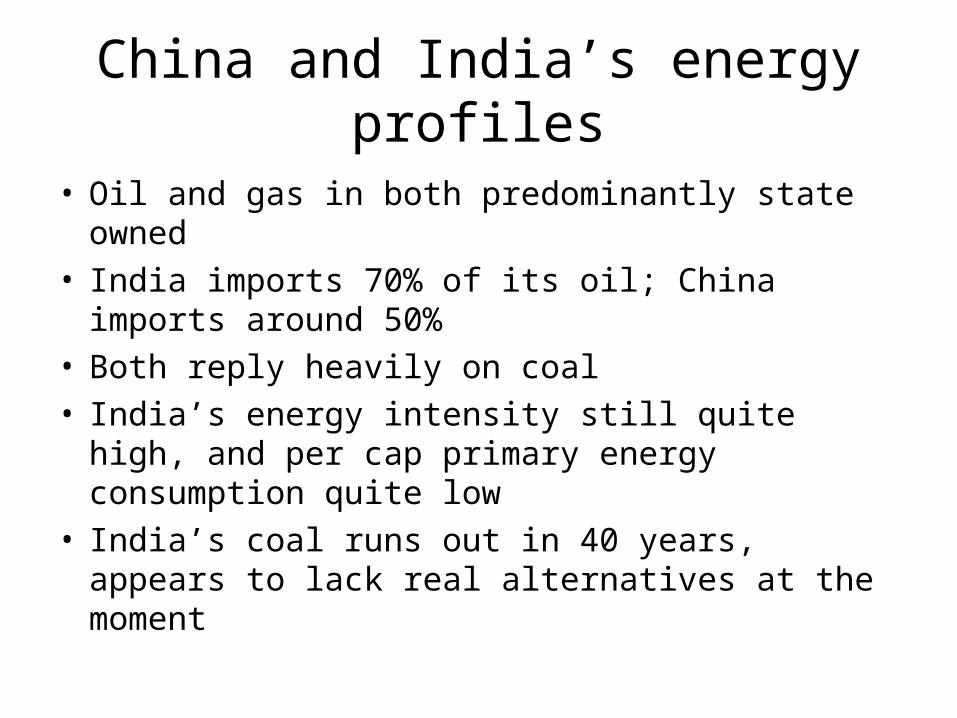
China and India’s energy profiles
• Oil and gas in both predominantly state owned • India imports 70% of its oil; China imports
around 50%• Both reply heavily on coal• India’s energy intensity still quite high, and per
cap primary energy consumption quite low• India’s coal runs out in 40 years, appears to lack
real alternatives at the moment

China and India’s energy mixes, 2005
Total Primary Energy Demand in China, 2005
Oil, 18.8%
Gas, 2.4%
Nuclear, 0.8%
Hydro, 2.0%
Biomass and waste, 13.0%
Other renewables,
0.2%
Coal, 62.8%
Total Primary Energy Demand in India, 2005
Coal, 38.7%
Oil, 24.0%
Hydro, 1.7%
Nuclear, 0.9%
Gas, 5.4%
Other renewables,
0.2%
Biomass and waste, 29.4%
Source: World Energy Outlook 2007
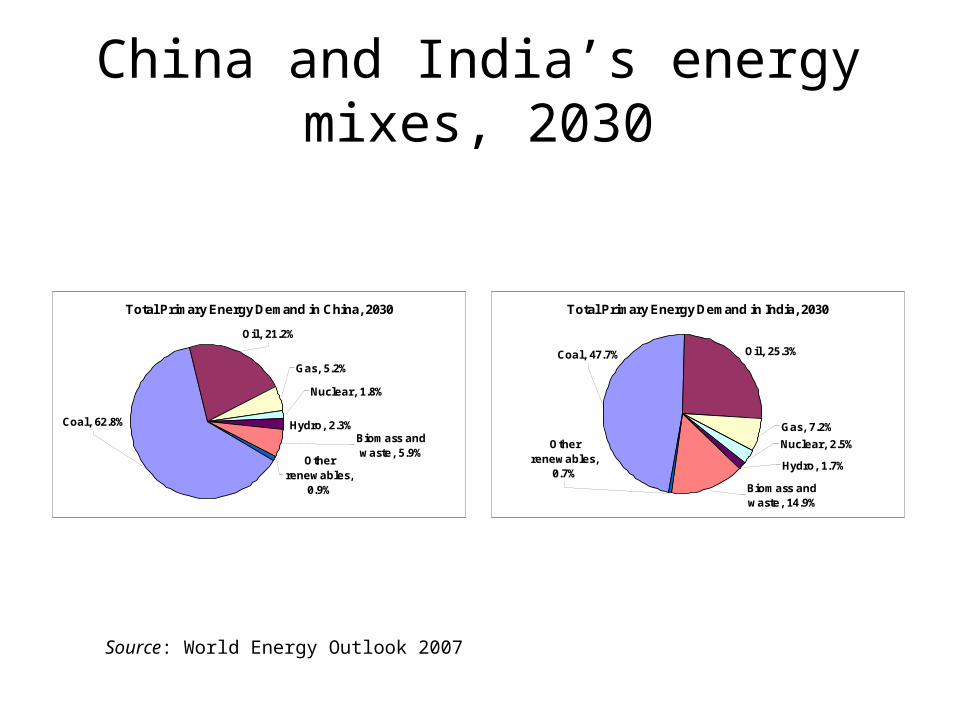
China and India’s energy mixes, 2030
Total Primary Energy Demand in China, 2030
Nuclear, 1.8%
Gas, 5.2%
Oil, 21.2%
Hydro, 2.3%Coal, 62.8%
Biomass and waste, 5.9%
Other renewables,
0.9%
Total Primary Energy Demand in India, 2030
Oil, 25.3%Coal, 47.7%
Other renewables,
0.7%Biomass and waste, 14.9%
Gas, 7.2%
Nuclear, 2.5%
Hydro, 1.7%
Source: World Energy Outlook 2007

Source: International Energy Agency 2007

Source: International Energy Agency 2007

Energy Policy of C&I
• Similarities– Focus on supply side– Continuous domestic E&P, great investment energy
infrastructure needed (large gap in India)– Acquisition of equity stakes in overseas oil exploration
and development assets – Strategic oil reserves
• Domestic political economy around energy: C&I– Chinese government and NOCs (greater friction at
home, more cooperation abroad)– “Cluster of policies” lacking strategy in India’s case
(more lacking of clear energy alternatives)

Global environmental implications
Carbon Dioxide Emissions from Energy Activites, 2004
U.S.22%
India1%
FSU9%
Japan5%
China17%
Rest of World29%
Europe 17%
Natural Gas
Oil
Coal
Source: EIA International Energy Annual
Total Emmissions China: 4.7 billion metric tons World: 27 billion metric tons

Global environmental implications in 2015, Reference & HG Scenarios
Carbon Dioxide Emissions from the Consumption of Energy, High Growth Scenario, 2015
Rest of World24%U.S.
18%
India6%
FSU5%
OECD Pacific6%
Europe13% China
28%
Carbon Dioxide Emissions from Energy Activities, 2015
FSU5%
India5%
U.S.19%
China26%
Europe13%
Rest of World 25%
OECD Pacific 7%
Source: EIA International Energy Annual

Global environmental implications in 2030, Reference & HG Scenarios
Carbon Dioxide Emissions from the Consumption of Energy, 2030
OECD Pacific6%
Europe11%
FSU5%India8%
China28%
Rest of World 26%
U.S.17%
Carbon Dioxide Emissions from the Consumption of Energy, High Growth Scenario, 2030
Rest of World25%U.S.
15%
India9%
FSU5%
OECD Pacific5%
Europe10% China
31%
Source: 2007 World Energy Outlook
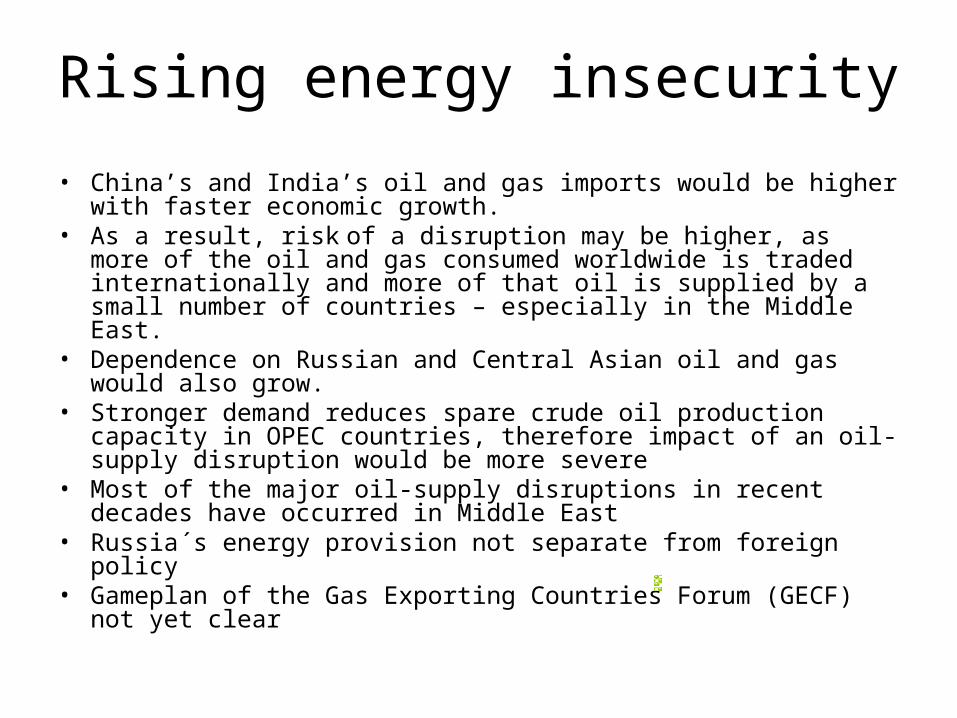
Rising energy insecurity
• China’s and India’s oil and gas imports would be higher with faster economic growth.
• As a result, risk of a disruption may be higher, as more of the oil and gas consumed worldwide is traded internationally and more of that oil is supplied by a small number of countries – especially in the Middle East.
• Dependence on Russian and Central Asian oil and gas would also grow.
• Stronger demand reduces spare crude oil production capacity in OPEC countries, therefore impact of an oil-supply disruption would be more severe
• Most of the major oil-supply disruptions in recent decades have occurred in Middle East
• Russia´s energy provision not separate from foreign policy• Gameplan of the Gas Exporting Countries Forum (GECF) not yet
clear

Source: 2007 World Energy Outlook

C& I’s global acquisition of oil
• C&I seeking exclusive access to oil & gas– Achievable or not debatable – oil an international
commodity, although gas is less so– Chinese NOCs’ incentive incompatibility problems– Silver lining: investment in international energy
infrastructure, may actually improve global energy security by bring to market oil other wise not have been developed
– Real risk not so much commercial competition for scare hydrocarbon resources, but that upstream developments get caught up in broader foreign policy issues

Implications for Africa’s development
• C&I’s (Asian Drivers) engagement with Africa– Combination of Altruism, Mutual Benefit, and Strategic or Political Interests– Aid (tied, both C&I)– Trade and Investment
• Trade With China: from deficit to surplus• Trade with India: from surplus to deficit• So far, Investment mostly in extractives• Infrastructure corridor, China
– Plans and projects to promote African industry, China• Special Economic Zones • Voluntary Export Limits• Elimination of trade barriers• Debt relief
• Kinds of impacts– Trade: competing and complementary– FDI: competing and complementary
• Example of manufacturing• A few specific cases

Rising Africa's merchandize trade with China and India
Source: UNCTAD Trade Structure by Origin and Destination
0
5
10
15
20
25
30
1990 1995 2000 2005 2006Cu
rren
t U
S D
olla
rs in
Bill
ion
s
Import from China Export to China Import from India Export to India

Commodity price on the rise, but volatile
-40%
-20%
0%
20%
40%
60%
80%
100%
2001 2002 2003 2004 2005 2006 2007 2008
yoy
% c
han
ge
Petroleum,spot (US$/barrel) Copper (US $/MT)
Cotton (US cents/pound) Iron Ore (US cents/DMTU)
Source: IMF International Financial Statistics
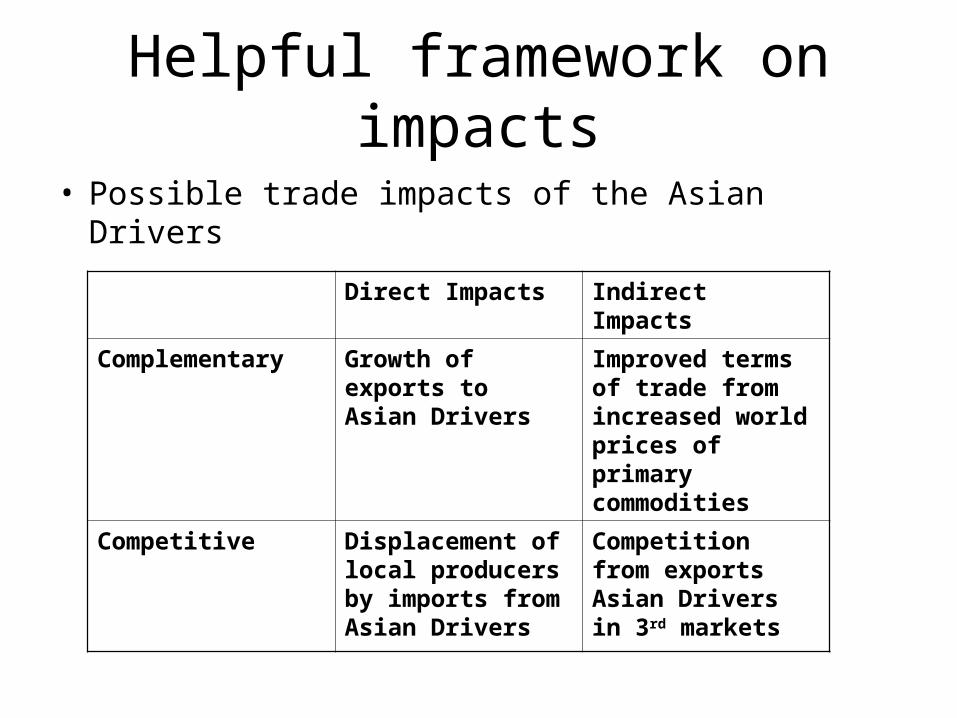
Helpful framework on impacts
• Possible trade impacts of the Asian Drivers
Direct Impacts Indirect Impacts
Complementary Growth of exports to Asian Drivers
Improved terms of trade from increased world prices of primary commodities
Competitive Displacement of local producers by imports from Asian Drivers
Competition from exports Asian Drivers in 3rd markets
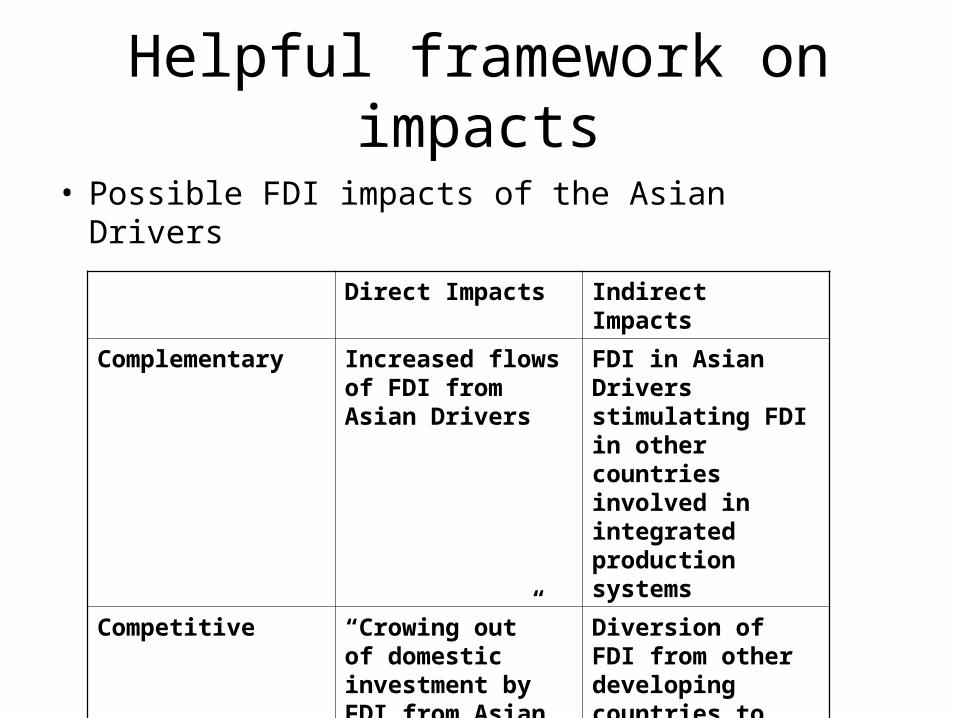
Helpful framework on impacts
• Possible FDI impacts of the Asian Drivers
Direct Impacts Indirect Impacts
Complementary Increased flows of FDI from Asian Drivers
FDI in Asian Drivers stimulating FDI in other countries involved in integrated production systems
Competitive “Crowing out” of domestic investment by FDI from Asian Drivers
Diversion of FDI from other developing countries to Asian Drivers
Angola, Sudan, Nigeria
• Important exporters to China or India
• Impact has been mainly through growth of exports

Ghana, Ethiopia, Kenya, Uganda, Tanzania
• Most affected by China and India‘s imports
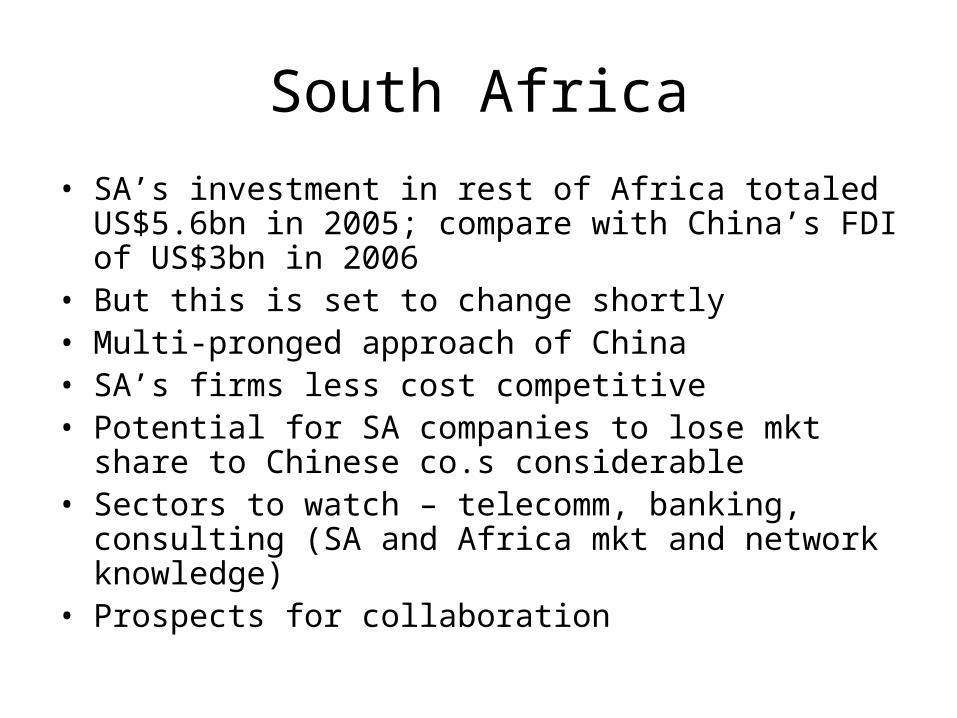
South Africa
• SA’s investment in rest of Africa totaled US$5.6bn in 2005; compare with China’s FDI of US$3bn in 2006
• But this is set to change shortly• Multi-pronged approach of China• SA’s firms less cost competitive• Potential for SA companies to lose mkt share to Chinese
co.s considerable• Sectors to watch – telecomm, banking, consulting (SA
and Africa mkt and network knowledge)• Prospects for collaboration
Risks for Africa
• Difficult to see positive future for manufacturing in Africa unless SSA can insulate infant industries from global competition combined with greater intra-regional trade
• Labor intensive sectors in SSA, if developed, also face competition particularly from China
Looking ahead: China, India, & Africa
• Greater role of and terms set by African institutions (eg., AU, NEPAD, regional economic blocs)
• NOCs and smaller private Chinese firms more independent of Chinese state agendas
• Economic (context specific sectoral, trade unions, class*, racial, and cultural impacts) and sociological investigation of impacts
• South-North-South cooperation and growing multi-lateral engagement (South-South, and South-international financing institutions)

Conclusion
• Collective Action needed to address global energy security challenges, environmental challenges, and sustainable development challenges particularly in Africa
• Opening with respect to South-North-South and South-South cooperation in seeking sustainable development of Africa

Thank you!
Vielen Dank Zou!

China and India’s net oil imports
Net Oil Imports of China and India
-1.0
-0.5
0.0
0.5
1.0
1.5
2.0
2.5
3.0
3.5
4.0
1990 1991 1992 1993 1994 1995 1996 1997 1998 1999 2000 2001 2002 2003 2004 2005 2006
Year
Mil
lio
n B
arre
ls P
er D
ay China's Net Imports
India's Net Imports
*2006 is Jan-Aug only
Source: EIA International Petroleum
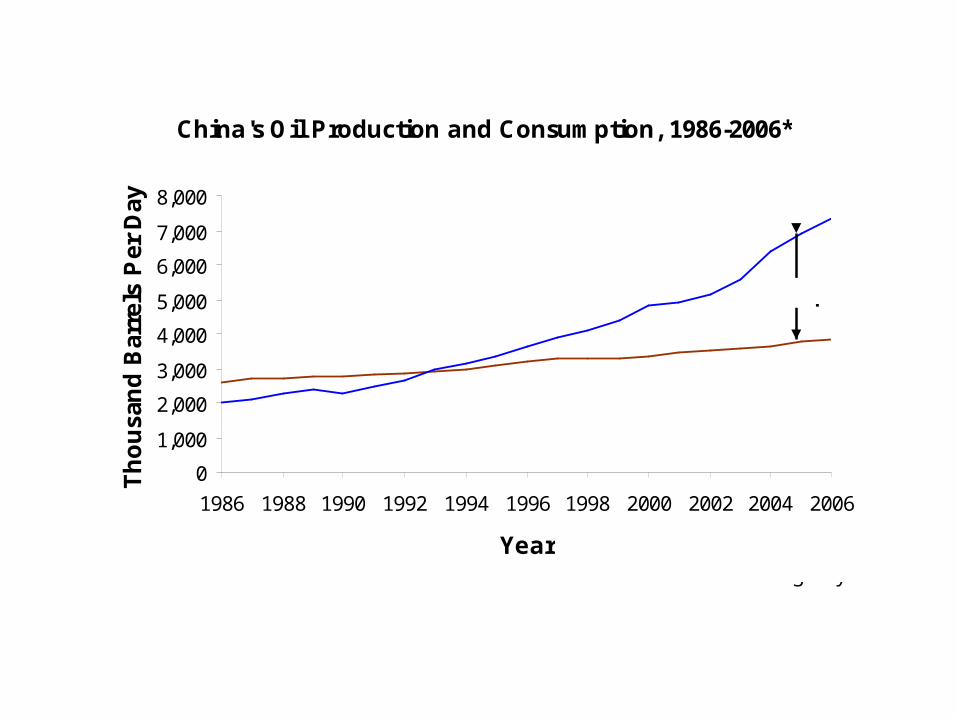
China's Oil Production and Consumption, 1986-2006*
0
1,000
2,000
3,000
4,000
5,000
6,000
7,000
8,000
1986 1988 1990 1992 1994 1996 1998 2000 2002 2004 2006
Year
Th
ou
san
d B
arre
ls P
er D
ay
Source: EIA International Petroleum
Consumption
Production
Net Imports
*2006 is Jan-Aug only

India's Oil Production and Consumption, 1990-2006*
0
500
1,000
1,500
2,000
2,500
3,000
1990 1992 1994 1996 1998 2000 2002 2004 2006
Year
Th
ou
san
d B
arre
ls P
er D
ay
Consumption
Production
Net Imports
Source: EIA International Energy Annual 2004 ; Short-Term Energy Outlook (Jan. 2007)
*2006 is estimate