Jeffrey K. MacKie-Mason · In recent years there have been many new theoretical treatments of...
40
NBER WOEXING PAPER SERIES DO TAXES AFFECT CORPORATE FINANCING DECISIONS? Jeffrey K. MacKie-Mason Working Paper No. 2632 NATIONAL BUREAU OF ECONOMIC RESEARCH 1050 Massachusetts Avenue Cambridge, MA 02138 June 1988 This research is part of NEERs research program in Taxation. Any opinions expressed are those of the author not those of the National Bureau of Economic Research.
Transcript of Jeffrey K. MacKie-Mason · In recent years there have been many new theoretical treatments of...

NBER WOEXING PAPER SERIES
DO TAXES AFFECT CORPORATE FINANCING DECISIONS?
Jeffrey K. MacKie-Mason
Working Paper No. 2632
NATIONAL BUREAU OF ECONOMIC RESEARCH1050 Massachusetts Avenue
Cambridge, MA 02138June 1988
This research is part of NEERs research program in Taxation. Any opinionsexpressed are those of the author not those of the National Bureau ofEconomic Research.

NEER Working Paper #2632June 1988
DO TAXES AFFECT CORPORATE FINANCING DECISIONS?
AB
A new empirical method and data set are used to study the effects of tax
policy on corporate financing choices. Clear evidence emerges that non-debt
tax shields "crowd out" interest deductibility, thus decreasing the desir-
ability of debt issues at the margin. Previous studies which failed to find
tax effects examined debt-equity ratios rather than individual, well-speci-
fied financing choices. This paper also demonstrates the importance of con-
trolling for confounding effects which other papers ignored. Results on
other (asymmetric information) effects on financing decisions are also
presented.
Jeffrey K. l4acKie-MasonDepartment of Economics
University of MichiganAnn Arbor, MI 48109

Do Taxes Affect Corporate Financing Decisions? -
Jeffrey K. MacKie-Mason
1. INTRODUCTION
Nearly everyone believes taxes must be important to financing decisions, but no substantial support
has ever been found in empirical analyses. Myers (1984] wrote that "I know of no study clearly
demonstrating that a firm's tax status has predictable, material effects on its debt policy. I think the
wait for such a study will be protracted" (p.588). A similar conclusion is reached by Poterba [1986].
Recent studies which fail to find plausible or significant tax effects include Ang and Peterson (1986],
Long and Malitz (1985], Bradley, .Jarrell and Kim [1984], Marsh (1982], and Williamson 11981].'
This paper disentangles several confounding interactions to provide clear and robust evidence of
substantial tax effects. The probability that a firm will issue debt to raise new funds decreases as
the expected value of interest deductibility declines.
The paper uses a different empirical method and data set from previous studies. I study the
observable, incremental financing choices made by firms; previous researchers look as a firm's debt-
equity ratio. The leverage ratio approach is subject to simultaneous equations bias, misspecification
of the choice model, and dynamic misspecification. The incremental choice approach overcomes
most of these problems.
I construct a sample of financing decisions from a data source not previously utilized to study
capital structure decisions: new public-issue security registrations with the SEC. The sample con-
stains 1418 observations from 1977—1984, covering new registrations for 613 different firms. The
large size of the data set and the focus on well-defined individual decisiosn allows me to control for
many more factors than has been possible in previous studies.
The results provide some of the first clear evidence that tax policy does significantly affect
financing decisions. The higher are a firm's non-debt tax shields (e.g., investment tax credits, tax
loss carryforwards), the less likely it is to issue debt at the margin, because expected tax shield
I would like to thank Alan Auerbach, Rob Geriner, Roger Gordon, Jerry ilausman. Paul Healy, Jeff Muon,Myron Scholes, Greg Niehaus, Bob Pindydc, Jim Poterba, Jay Ritter, Nejat.Scyhun, Glen Sueyoshi, and seminaraudiences at MIT, Michigan and NBER for helpful comments and advice. Donna Lawson and Sue Majewski providedsuperb research assistance, With support from a Rackham Research Grant. The first version of this paper wasprepared with ñnancial support from the Alfred P. Sloan Foundation.
One exception is Bartholdy, Fisher and Mints (1987], which does not ftnd convincing non-debt tax shield effects,but uses variation in Canadian corporate tax rates to identify significant interest deductititity effects.
1

"crowding out" towers the value of interest deductibility. Evidence is provided which indicates that
previous studies may have failed to confirm the tax shield effect because they did not control for
confounding effects.
The next section describes the main themes of tax-related and other theories of financing de-
cisions. Section 3 discusses the empirical method, and contrasts it with prior research. Section 4
presents the empirical analysis. This begins with a description of the testable implications of theory
and the data employed, followed by the results, specification and robustness tests, prediction tests,
and calculations of the economic magnitudes of the results. Sample selection and data construction
details are provided in an appendix.
2. GENERAL HYPOTHESES
In recent years there have been many new theoretical treatments of capital structure decisions.
I first summarize tax.based theories of financing decisions, and present testable implications. In
order to test the tax stories, however, it is necessary to control for any other behavioral effects
which may interact or be correlated with the tax effects. Other theories are presented in Section
2.2.
2.2 Taxes and Financing
Taxes are hypothesized to enter a firm's leverage decision calculus.2 An optimal leverage theory
describes supply and demand functions for debt in a competitive capital market which clears in
equilibrium. The benefits and costs of outstanding debt determine the firm's debt supply function;
the benefits and costs of holding debt determine the market demand. The firm's optimal debt level
is determined as the market-clearing equilibrium quantity. Taxes may provide benefits or costs for
both suppliers and demanders of finandal instruments.
Miller [1977) inspired the most recent theories of optimal leverage by setting the firm's debt-
level decision in an equilibrium supply and demand framework to investigate the effects of taxes.
Letting the personal tax rate on equity be zero, individuals will be indifferent between holding debt
and equity if r = rd(l — r4, where the subscripts (d,e) distinguish between the risk-adjusted
returns to equity and debt, and t,4 is the personal tax rate on debt.3 In terms of bond prices,
Pd = , personal taxes imply a downward sloping demand curve; to induce investors to hold larger
2 use the tenn leverage" because ol its common see is the literature. With more than two securities, an optimalcapital structure Is a set of optimal security/assets ratio..
The results go through as long as the personal tax rate on debt is greater than that on equally.
2

quantities of bonds, price must fall because marginal investors will be those with increasingly high
tax rates on the return to debt (see Figure 1).
On the supply side the tax deductibility of interest payments, but not payments to equity,
subsidizes corporate borrowi g Payments to security holders cost either r or — where
is the corporate tax rate. Indifference between selling bonds ad issuing equity requires Pd =
P(1 — i-s). If all firms face the same corporate tax rate, the supply curve for bonds is perfectly
horizontal (curve SM in Figure 1). As with Modigliani and Miller's (1958) Proposition I, leverage is
irrelevant to firm value, although in aggregate an optimal debt-equity ratio exists for the economy,
determined by bond market equilibrium.
More recent papers have discussed other tax-related supply-side costs of borrowing. Interest
deductibility has current value only if the firm is paying positive taxes. In an uncertain world, the
higher are other tax shields, the greater is the probability that the firm will find itself in a non-tax
status; hence the lower the expected value of the interest deduction (DeAngelo and Masulis (1980];
Ross (1985]).
In general, the marginal tax rate on interest deductions may be decreasing in the level of debt
outstanding: r = r(B), r < 0, where B represents bonds outstanding. The margin between
borrowing and issuing equity is determined by r = r [1 — rc(B)]4 The resulting supply curve is
given by d = P [1 — r0(B)]. The supply price of debt is increasing in the debt level of the firm,
so the firm in general has an optimal interior leverage ratio.
The supply curve slopes upward since leverage increases the expected after-tax cost of borrowing
(r,(B) < 0). One implication of the model is that the firm's propensity to issue debt (rather than
equity) will increase as its marginal tax rate increases. However, statutory marginal tax rates
on U.S. corporations have varied little in the modern economy, and effective marginal tax rates
are nearly impossible to measure without access to confidential corporate tax returns.5 Another
implication is that the higher are a firm's available non-debt tax shields, the less likely it will be
to issue debt. This prediction will be tested in the empirical analysis using a number of different
publicly available measures of expected tax shield capacity.
The leverage theory also predicts that the firm's optimal debt ratio depends on the location of
the market demand curve for bonds. If arbitrage ensures that a single risk-adjusted interest rate
The notation is heuristic; I am ignoring, for instance, the proper treatment ofmathematical expectation whenfunctions are nonlinear in the stochastic variables.
Bartholdy, Fisher and Minta (lflT) test this implication for arms in Canada, where statutory tax rates havefluctuated.
3

is offered, then each firm faces the same market (risk-adjusted) demand curve. However, different
shareholder clienteles may form based on the dividend payout rate, since variation in personal tax
rates affects the desirability of receiving equity returns in the form of dividends rather than capital
gains. Desired debt-ratios may vary with clientele, ii high-tax-rate investors prefer to borrow on
their own account to obtain interest deductions at their personal tax rate, rather than the lower
corporate tax rate (Auerbach (1983]; Auerbach and King 11985]). Estimated clientele tax rates are
used to test this hypothesis.
To summarize, the testable implications are that variations in the expected tax deductibility of
a marginal dollar of interest will negatively affect the issuance of debt, as will the personal tax rate
on the marginal purchaser of the firm's equity.
2.2 Other Factors
Costs of Leverage. Non-tax leverage-related costs of borrowing may enter the firms debt supply
decision. In order to consistently estimate the effect of taxes on financing, other explanatory
variables must be controlled for in the statistical analysis. A conclusion reached below is that
ignoring such controls may be one reason that prior research has not uncovered substantial tax
effects.
I will refer to all non-tax related costs of leverage as costs of financial distress. Extending the
supply curve analysis above, equilibrium requires r = rd(1 — i-(B)] +i4B), where A(B) representsfinancial distress costs, and ai > 0. The supply curve is then d = P5(1 — r(B)) x r,—A(D) (see
supply curve S in Figure 1).
Traditionally, real wealth costs of bankruptcy have been seen as a deterrent to firms seeking high
debt ratios.6 Further, if financial decisions reflect the concerns of management as well as owners
then the costs of bankruptcy as perceived by the financial decisionmaker may be quite high.7
Many other conflicts between managers and shareholders (known as principal-agent problems)
have dominated the recent literature on financing decisions. If increasing debt raises increases the
probability of costly interest conflicts occurring, then rational investors will discount the value of
that debt, thereby raising the costs of borrowing to the firm.
6 See, e.g., Miller ad Modigliani (1963J. Recent evidence suggests that expected bankruptcy costs may be signif-icant (Altman (1964j).
Managemest costs at baakruptq may be higher due Se fixed human capital investment. See, e.g., Donaldson(1969,1964j, for the view that fisancial dedsioi. prbjarily reflect self-interested managerial objectives.
4

Myers [19771 and MacKie-Mason [1986a] examine a conflict over investment decisions which
outstanding debt may induce. Management will commit new resources to a project only if the
expected return is sufficient to pay off the outstanding debt liabilities, as well as earn an acceptable
return on the new investment costs, if the alternative is low-cost default. Since the first-best
is to go ahead if the expected payoffs are sufficient to earn a return on the incremental costs,
underinvestment results, which raises the equilibrium cost of borrowing.
Jensen and Meckling (1976] suggest that firms with high debt levels and limited liability will
have an incentive to take on excessively risky projects. Risky projects with limited liability offer
a call option to shareholders: high payoffs in good states, zero payoff in bad states. Taking on
a risky project when debt is high can transfer wealth from bondholders to shareholders. Other
costs of financial distress associated with borrowing include contracting, bonding and monitoring
costs necessary to ameliorate both operating and investment decision agency problems (Jensen and
Meckling [1976]); and unfavorable terms of trade with customers, workers and suppliers due to
distorted liquidation incentives (Titman (1984])?
Financing Hierarchy. A fundamentally different view of financing decisions holds that firms
have hierarchical preferences over marginal sources of funds, and only choose sources low on the
hierarchy when they face credit constraints for preferred sources. This "pecking order" theory
predicts that firms always prefer to use internal funds as the marginal source of finance; if that
is not possible, they employ debt; and only if debt is unavailable do they issue new shares. The
hierarchy story needs two elements: conditions which lead firms to have hierarchical preferences,
and reasons why preferred sources are sometimes unavailable, since we see all types of financing.
A general empirical investigation should allow for the possibility that some firms are at corner
solutions for optimal marginal financing decisions.
Hierarchical preferences typically arise in signaling models. Leland and Pyle [1977] suggested a
similarity between the market for new shares and the "lemons" model of used car sates. If managers
- seek to maximize the wealth of current shareholders when managers have private information about
future firm value, then stock will be issued only when there is "bad news"; i.e., when managers
believe the market will overprice the issue, transferring wealth from new to old shareholders. In
equilibrium, investors believe that an equity issue is a signal of bad news, which lowers the price
of equity. Myers and Majluf (1984] present a model in which debt issues are always preferred
Another supply curve eflect may be the cost of controlling managers' use of "free cash flows." Jensen [1986] -
argued managers may use uncommitted funds to further their own objectives, and thus that firms with free cash aremore likely to issue debt than equity, because interest repayment restricts the managers' discretion over the uses ofcash.
5

to equity because of the hidden information problem; Bagnoli and Rhanna [1987] generalize the
Myers-Majluf model to include borrowing costs (such as costs of financial distress) so that equity
issues are sometimes preferred.9
Several recent theoretical models have predicted credit rationing, which could explain why
firms sometimes issue equity if they always prefer debt. The basic result emerges for debt when an
increase in the interest rate decreases the expected return on a loan which can happen, for instance,
when firms know more about the riskiness of their future investments than do banks (Stiglitz and
Weiss [1981)). Gale and ilellwig 11985] and Williamson [1987] obtain credit rationing in models
with unobserved cx post information and monitoring costs rather than cx ante hiddeninformation.
At present, there seem to be few implications of credit-rationing models which are testable in a
study of individual firm security offerings. I control for suspected factors, but do not try to confirm
or reject specific hierarchy predictions.'°-
3. Method
The tests for the effects of tax policy on financing are carried out in a general analysis of the firm's
capital structure changes. This section discusses problems with the usual approach to capital
structure decisions, and describes the alternative method employed in this paper.
3.1 Analyzing Debt-Equity Ratios
Most empirical studies assume that the firm's capital structure is in equilibrium, and estimate
the determinants of the debt/assets ratio." There are at least two difficulties with the empirical
implementation of this approach: first, the firm's optimal capital structure policy is only part of
the simultaneous system of firm decision-making functions. Second, the decision problem has a
dynamic structure. I shall discuss these problems and then describe the incremental choice analysis
which I employ as an alternative to analyzing debt/assets ratios.
The simultaneity of uses and financing decisions is potentially important.'2 Nearly all of the
Constantinides and Crundy [1986) stody the role of share repurchase. as a signaiing device.
Part of the difficulty in observing clear indications of credit rationing is that the empirical analys is limited toa homogeneous clan. of security offering.: pubtk issues. Credit rationing models emphasize internal Venus externalfinancing, and provide less plausible explanations for observing equity rather than debt in pubhc issues.
Studies which adopt this approach Indude Auerbach (1985]; Bartholdy, Fisher and Mintz 11987); Bradley, Jarrelland Kim [19*4); Long and Malits (1985]; Ang and Peterson (1986]; and Williamson [1981).
12 See, e.g., Scholes and W01fr05 (1987]. The point ii illustrated by Asquith, Brunner and Mullins (1987), who findthat the share pnce effect of takeonr announcsnts varies with the type of financing.
6

hypotheses described above imply that financial and investment decisions are joint. A firm's op-
timal leverage ratio should depend on whether it is growing or declining, and on the details of
its investment and operating decisions. Rowever, the disaggregated and simultaneous investment,
operating and financing decisions of a firm are difficult to model theoretically, and almost no in-
vestment or operating data is available at the level of detail required to empirically analyze the
effects of different uses policies on financial policy.
The dynamic structure of the firm's optimization problem also poses difficulties for an analysis
of financing decisions. Capital structure changes are lumpy, and relatively infrequent, rather than
daily, as continuous response to stock price changes, inflation, and other unexpected economic events
would require. Measuring the current debt/assets ratio will typically yield an out-of-equilibrium
ratio, not the desired optimum.'3 Nor can measurement errors be assumed to average out: if credit
was rationed when firms wanted to raise new debt financing, observed debt/assets ratios will be
systematically below optimal, and estimates of leverage determinants will be biased.
An alternative approach to the dynamic problem has been to estimate the determinants of long-
run debt levels, measured as several-year averages.'4 But, if the hierarchy model is sometimes the
correct description of optimal financial decisions, then the firm's debt ratio will be nonstationary
and path-dependent. Two firms which appear identical to the econometrician will likely have, and
should have, quite different debt ratios depending on their characteristics and market expectations
at the particular times when they actually raised new finance.'5
As another criticism of debt/assets ratio studies, Gordon [1985] points out that researchers
invariably seek to control for scale differences across firms by measuring explanatory variables as
ratios, usually with respect to a measure of assets. Thus, assets appear both in the dependent
(debt-asset ratio) and the explanatory variables, leading to coefficient estimates which are biased
and inconsistent.
To my knowledge, only Auerbacb (1985] has explidtly modeled an adjustment process, by arbitrarily imposingthe Koyck, or geometric lag structure.
14 See, e.g., Bradley, JarreH and Kim [1984).
15Myers (1954) suggests that path-dependency is an important reason why the It3 of debt/assets ratio studies is
usually quite low. Evolution in the simultaneous determinants of investment and financing in an optimal leveragemodel would also yield non-stationarity.
7

Incremental Choice Approach
I adopt an approach which ameliorates some of the problems discussed above, although they
cannot be solved entirely. I look at a set ofactual, observable individual decisions that firms make:
the choice between debt and equity, conditional on the firm raising new capital with a public issue.16
The analysis yields consistent (conditional) estimates of the choice between equity and debt.
This approach has two advantages in reducing the bias from ignoring the simultaneity of financial
and investment decisions. First, investment policy is partially controlled by restricting the sample
to homogeneous decisions; namely, only new public issues. This should reduce variation in uses
policy by focusing on instances in which the firm is taking on new investments and expanding its
asset base.
Second. investment policy is further controlled by investigating only the choice between types of
securities, rather than the amount of the change in security supplies.1 This should lead to clearer,
more powerful results by asking a more narrowly defined question: if a firm has already decided to
raise new funds from the public, will it issue stock or bonds?
Having observations only on a subset of financing options—ui:.. public debt and equity—raises
interesting econometric issues. To obtain from this data consistent, unconditional estimates of
the determinants of the probability of a public debt issue relative to an equity issue, financial
decision making must be a nested process. One possibility is illustrated in Figure 2. First the firm
determines whether to increase, decrease or leave unchanged its total available funds. If funds are
to be increased, then the choice between private sources and public is made. lithe firm decides to
go public, then it decides whether to issue bonds or shares. In this scheme. estimating the public
debt-equity choice in isolation is appropriate.t8 The nested model assumes weak substitutability
between alternatives on different branches; e.g., that public debt and equity are more substitutable
than are, say, public stock issues and bank debt.
The nested decision-making model may not be appropriate (or the true nesting may not iso-
late public issues in their own branch). In that case, unconditional consistent estimates of the
16 A few other papers use a similar statistical approach. Marsh [1982] uses older, British data, and ignores any taxeffects. Taub [1975], Baxter and Crau(1970], and Martin and Scott (1974] are primarily classification studies; theytest essentially none of the modern capital structure hypotheses.
With tumpinees in security issues, a major expanSn decision may lead to a big change in the debt/assets ratio,even if the optimal ratio hasn't changed.
McFadden (1981] discuses the utility theory naderlying a nested preference model of this sort. Terminal branchesof the tree, such as the pubEc issue branch of Figure 2. can be consistently estimated with standard discrete choicemethods, such as the probit techniqueemployed below.
8

probability of a public debt (or equity) issue require specification and estimation of the full set of
simultaneous financing choices (including retained earnings, bank debt, etc.). However, conditional
on a firm issuing either debt or equity, the approach with a limited choice menu still yields consis-
tent results for the relative (among the observed choices) issue probability. Suppose the financing
choice is in fact made between public debt and equity, and bank debt, simultaneously with the in-
vestment policy- The system of simultaneous supply equations for the three sources of finance can
be transformed to a reduced form for the choice of debt or equity conditional on going public. The
reduced form works because the random utility model implies that, if the firm does issue publicly,
a necessary and sufficient condition for optimality is that its chosen instrument, say debt, yield a
higher value of the objective function than the other public alternative, equity.
By focusing on the incremental choices made by firms, problems of specifying the structure of
the dynamic adjustment process are also avoided. We are interested in the direction of change, and
need not know how far away the firm is from any target. Further, the incremental choice approach
yields a test of the optimal capital structure hypothesis against the hierarchy story, essentially by
looking for mean reversion in debt/asset ratios.
4. EMPIRICAL ANALYSIS
4.1 Data
A sample of 1418 observations on new, seasoned security offerings was collected from the SEC
Registered Offerings Statistics tape. Table 2 reports issue statistics for the universe of all primary
public offerings'9 and the sample used in most of the econometric analysis. Based on the number of
debt and equity issues, and the amount of money raised, the sample seems reasonably representative.
Details on sample selection and variable construction are given in the appendix.
Convertible and straight debt are classified as debt; preferred, convertible preferred and common
stock are classified as equity. Although a multinomial analysis for the several different security types
might be preferable, not enough data are available. In the sample, 98% of the observations are
either straight debt or common stock; no other type accounts for even 1% of the sample.
Taxes. The primary hypothesis to be tested is whether variations in non-debt tax shields
affect the firm's choice to finance with debt or equity, by lowering the expected value of taxable
interest deductions. A number of variables relevant to this hypothesis are available for firms in our
19 The universe includes initial public offering, and unit offerings (e.g., simultaneous offerings of more than onesecurity type), which are exciudel from the estimation sample.
9

sample?° Data were collected from the COMPUSTAT tapes, with missing values filled in where
possible from Moody's Industrial Manual and individual corporate 10-K reports.
The primary non-debt tax shield variables are investment tax credits (ITC), research and de-
velopment (R&D), and advertising. The latter two are tax shields because they are immediately
expensed for tax purposes, but represent investments in assets which yield value over several years.
I also use the firm's book tax loss carryforwards, which have the same effect as shields in lowering
expected interest deductions.2'
Various measures of depreciation are available, but measurement problems are severe. Book
depreciation has no relation to depreciation deductions actually claimed in a given tax year, or
expected over the next few years (when crowding out of new interest deductions is possible). An
alternative measure is deferred taxes, which represent differences between actual tax payments and
book tax liability due to timing differences.22
I am able to calculate the actual cash flow of taxes paid during a year from balance sheet entries.
This is not the same as the firm's actual tax liability during the year; early and late payments,
differences between fiscal and tax years, adjustments for loss carrybacks and so forth can completely
undo the relationship. A clientele tax rate (the implicit rate on the marginal purchaser of a firm's
equity) is estimated from ex-dividend day stock price behavior Following Auerbach [1983].
Other Factors. Controls for asymmetric information (moral hazard and signaling) effects
are employed in the analysis. I briefly describe these variables here; details are provided in the
appendix. In nearly every case, the variables were chosen to conform with empirical studies of
capital structure decisions which emphasized asymmetric information hypotheses.23
Moral hazard hypotheses emphasize the divergence between the interests of managers and own-
ers (or others) when a finn is near financial distress or bankruptcy. I consider a number of indicators
of the likelihood of bankruptcy, including the firm's systematic and unsystematic operating risk
(unlevered "beta" and "sigma"), and two different measures of the volatility of accounting earnings
(VEARNA and VEARNB).
20 Unfortunately, nearly all of them axe "book" measures; that is, they are the numbers reported on the accountingbooks, rather than component, of actual tax liability. Careful attempts, such as in Auerbach (1985]. to convertaccounting numbers to actual cash flows do not seem to have succeeded in adding much explanatory power todebt/asset ratio analyses. See also the discussion of tax loss carryforwards in the appendix.
21 Tax variables were scaled by net sales, to measure a fraction of shielded revenue.
22 A major portion of deferred taxes is usually due to accelerated depreciation deductions, although many timingdifferences contribute, not all of whith are tax shields.
23 See, e.g., the studies cited in note 0, and also Marsh [1982].
10

Financial analysts look at a number of accounting ratios when they evaluate a firm's prospects.
As another indicator of financial distress, I constructed Altman's [1968] ZPItOB predictor of
bankruptcy. Altman's multiple discriminant function correctly classified 94% of the firms that
went bankrupt in the next year, and 97% of those that did not. Since nearly every finance text-
book presents ZPROB as a predictor of bankruptcy likelihood, this may be a good measure of the
type of information managers use when evaluating the expected financial distress costs of security
issues.24
The exercise of future growth opportunities and investment options are decisions which are dif-
ficult to fully control through specification in contracts between investors and managers. Following
Myers [1977], the costs of moral hazard are expected to be related to the fraction of firm value
which is accounted for by intangible, discretionary opportunities. The fraction of a firm's net book
assets accounted for by net plant and equipment (FPLANT) is a (negative) indicator of discre-
tionary opportunities.25 Long and Malitz [1985], and Bradley, .Jarrell and Kim [1984] suggest that
expenditures on advertising and on research and development are indicators of intangible growth
opportunities.26
To test Jensen's [1986] free-cash-flow hypothesis, I construct a cash-flow deficit variable first
defined by Auerbach 119851, which represents cash deficit after committedexpenditures. Potential
ownership dilution is measured by dividing the value of an issue by the market value of equity. Own.
ership dilution may exacerbate moral hazard problems through reduction in shareholder monitoring
(the free-rider problem).27
The "hierarchy" theory of financing decisions, in contrast to "optimal leverage" theories, asserts
that the firm has no optimal leverage ration, and thus predicts that desired marginal sources of
funds are independent of the firm's actual debt-assets ratio. To test the strong version of this
hypothesis, the current and long-run debt/assets ratios are entered separately and differenced.
24 See, e.g.. Brealey and Myers (1984], p. 646. The Function is retested in Altman, Haldeman and Narayanan[1977].
25 Myers [1977] suggests that managers may rely on book assets and tiabilities when making financial decisionsbecause book value is a better measure of fixed, or nondcretionary value. Market values include the value ofdiscretionary uses of assets.
26 Note that we cannot distinguish between tax and moral hazard stories with these variables.
27 This variable may be endogenous, to the extent that investment decisions and financing decisions are simul-taneous. Existing empirical evidence does not convincingly demonstrate the extent to which choice of financinginstrument affects the proportionate size of an issue. I estimate both with and without the variable because itprovide. substantial explanasory power without seeming to affect other coefficients dramatically.
11

The strength of hierarchical financing preferences may depend on how costly the differences
between managers' and investors information can be in different situations. One suggestedmeasure
for the potential cost of asymmetric information is the standard deviation of first differences in
accounting earnings, VEARNA (MacKie-Mason [1986b]; Dierkens [1986]). This is the forecast
error for earnings prediction by investors if (as the accounting literature has found)28 earnings
follow a random walk.29
It is also possible that the dilution variable is an indicator of signaling costs, since greater dilution
provides a greater opportunity for transferring wealth from new investors to current shareholders.
The resulting stock price drop may be larger. Further, to the extent that managers' compensation
is tied to stock prices (through stock options and other incentive schemes) there may be strong
motivation to avoid large price drops. This story might explain why stock issues are more frequent.
but smaller in value than debt issues (see Table 2).
Other Controls. Industry dummy variables are entered to control for various fixed effects
which might be present. One such effect might be inter-industry variation in the degree of hidden
information. I also estimate year dummies to capture any unobserved system.wide effects, such as
changes in tax policy or other general economic conditions, and enter net assets to control for any
size effects.
The predicted effects of the explanatory variables under the major hypotheses are summarized
in Table . Sample descriptive statistics are reported in Table 3.
Two further notes about the data are in order. First (except when indicated in Section 5)1 used
data from the year prior to the year in which a new issue was registered, to avoid problems with
endogeneity.3° Second, the theories predict that the net benefits of choosing a particular security
type arise from expectations about the future.31 1 use observed values as the information set on
which expectations are based; I consider the use of more historical data in Section 5.3.
28 See Healy and Pelapu [1986) and Waits and Zimmerman [1986), ch. 6 for summaries of the relevant studies.
29 Note thai VEARNA is also a control for volatility under the financial distress hypothesis.
301 estimated sonic versions of the model using contemporaneous data, with expected results: clearly endogenousvariables dominated, with other variables moving substantially closer to zero and becoming insignificant.
31 For instance, the valueof f.j(we interest deductices on a new debt issue depend primarily on future tar shields.See, however, Altshuler and AuerbaA [1986] for time-dependence due to loss and credit carryforwards.
12

4.2 Econometric Model
Conditional on the firm raising new funds from the public, a necessary and sufficient condition is
that it choose to issue the security which contributes the most to the decisionmaker's objective
function. Let the increment to the value function from alternative i, I E {debt,equity), be
V =x/31 + c
£
where z1 is a K-vector of choice characteristics and firm attributes, $, a K-vector of parameters
to be estimated, and c a C-vector of unobservable disturbances following a multivariate normal
distribution, where C is the number of choices available.
The firm's choice, i, is observed, but not the realization of the incremental value of the choice,
V1.. Let
51, ifV=max{Vi,V2}—
101 otherwise.
The econometric problem is to estimate the /3 given N observations of debt or equity issues and
the characteristics vector (yj,zj). The probability model is
Pr(y = 1Iz)=Pr(h > V2)
= Pr(c2 — ci c z'j3)
where x a — 12, and the parameter vector 0 is assumed to be identical across choices. Using the
properties of the multivariate normal, define c a £2 — 1V(O, a2), where a2 = oj + oj + 2a12.
Then, for observations n = 1,..
1 1 f(\2 fz'/3Pr(yi = 1Iz)=j ,1_—exp —c;) dc=$
I obtain estimates, j, by maximizing the log of the likelihood function for the sample?2
32 Since the likelihood function is globally concave, the estimates of are unique, if bounded.
13

4.3 Results.
The main results are presented in Table 4. Column I includes most of the tax variables and
controls described above. Column 2 excludes a few variables which had no explanatory power, but
adds 16 industry dummy variables (the estimated dummy coefficients are reported in Table 5).
Taxes. The central hypothesis is that by crowding out interest deductions, tax shields discour-
age debt. Tax loss carryforwards (TLCF) and investment tax credits claimed (ITC) are the tax
shield measures which appear to contain the most information for financing choices. It has been
typical in previous (leverage ratio) studies for the coefficient on various tax shields to be positive,
contrary to expectations.33 Other authors have suggested that since high 1TC occurs when a firm
makes large investments in equipment, the result may indicate an increase in the firm's debt capac-
ity when tangible, easily re-sold capital is a large fraction of firm assets, consistent with the moral
hazard hypothesis.
An innovation in this paper is the attempt to disentangle the two roles of ITC—as an indicator
of tax shields, and of tangible assets—so that we may determine the effect of tax policy after
controlling for firm characteristics. Since tax shield effect is to crowd out interest tax deductions,
the effect of tax shields should be greater the more likely it is that the firm will a zero-tax status. I
interact an indicator of financial distress to obtain the desired effect: ITC alone will be correlated
with the level of tangible capital equipment (regardless of expected tax status), while ITC interacted
with a financial distress indicator will measure the potential for "crowding out" of tax savings.
I use ZPItOB as an indicator of financial distress. The results in column 1 include ZPROB
individually, and interacted with ITC and VEARNA.34 The coefficients on ITC are striking, and
as predicted: ITC by itself is positive and significant, as the moral hazard hypothesis suggests, but
ITC/ZPROB is negative and significant, as predicted by the tax shields story.
Tax loss carryforward (TLCF) also has a negative and significant coefficient, indicating a de-
creased likelihood of debt issue when interest deductions may not be usable.35
The clientele tax rate has no significant effect, consistent with Auerbach's [19851 results. I also
estimated specifications (not presented here) with book depreciation, deferred taxes, and taxes
paid, as well as these terms interacted both with ZPROB, and with VEARNB (one of the earnings
See, for example, Bradley, JazrelJ and Kim (1984); Anerbach [1985]. and Ang and Peterson [1986).
A low ZPROB indicates a high probability of bankruptcy. To ease interpretation, lose its inverse.
See the appendix for discusion of problen,s with ting the flCF variable in COMPUSTAT for studying taxpolicy effects.
14

variance measures, and another potential indicator of financial distress). These variables, all of
which are measured with substantial error relative to the desired definitions, always have the
predicted signs, but enter insignificantly, and without important effects on the other estimated
coefficients. Thus, they do not contradict the role of taxes, but offer no more than weak support
for the hypothesis.
Column 2 contains the coefficients when the industry dummies are included. This specification
controls for industry-specific effects, which could have been correlated with the various tax vari-
ables, leading to spurious results. However, the magnitudes of the TLCF and ITC coefficients are
statistically unchanged, and the estimates for the ITC variables are still quite precise.
The results in Table 4 provide some of the first clear empirical evidence that taxes affect financing
decisions at the margin. Previous studies have not only been unable to demonstrate a negative
effect of tax shields on debt financing, but have in fact estimated unexplained, significant positive
effects. Table 6 presents evidence that the absence of controls for confounding effects in previous
work may explain the difference between those results and mine.
Table 6 presents a specification identical to column 1 in Table 4, except that the interactions
with the financial distress indicator (ZPROB) are omitted. The coefficient on ETC is now positive
but insignificant, and the coefficient on TLCF is smaller and less significant. The importance
of separating the two roles of ITC is dramatically clear from comparing the results of the two
specifications.
The fact that TLCF has explanatory in my analysis when it has not elsewhere may be due to
two factors. First, current TLCF may not be very important if a firm is trying to attain a long-run
debt/asset ratio, as is presumed by most other stories; the tax shield effect may be transitory.
Second, in other specifications (not reported here) I have found that the significance of TLCF is
sensitive to the inclusion of the stock price change variable. TLCF as a tax shield is likely to be
confounded by its role as an indicator of poor firm performance (Bagnoli and Khanna [1987) suggest
that market timing may encourage debt when performance is poor). .XP incorporates the market
valuation of the firm's performance during the year; what remains in TLCF is a measure of future
crowding out of interest deductions.
To summarize, when firms are relatively likely to be in a no-tax status, high tax shields are
associated with a strong and significant decrease in the probability that a firm will choose to issue
debt. The plausible and significant results obtained, where others have failed, may follow from
controlling for more confounding effects; in particular, the correlation of ETC with tangible capital
which diminishes the costs of moral hazard, and the correlation of TLCF with firm performance.
15

Other tax variables appear to be measured with too much error to obtain statistically significant
estimates of their effects.
Other Factors. The numerous controls used in the analysis provide information on the impor-
tance of other theories of corporate financing preferences. I summarize some of the main findings
from Table 4 here; a more detailed discussion can be found in MacKie-Mason (1986bJ.
A number of risk measures control for the proposition that greater risk of financial distress
discourages debt issuance, usually associated with the role of bankruptcy and other financialdistress
costs. However, the tax shield hypothesis makes the same prediction (given a level of non-debt tax
shields, interest deductibility is expected to be worth less, the more likely is the firm to enter
zero-tax status).
"Beta" and "sigma", the estimates of systematic and firm-specific risk from the market model
regressions, both have the predicted negative sign but no explanatory power. The coefficients on
both earnings variance measures (VEARNA and VEARNB) have the predicted sign and are quite
precisely estimated. Collectively, these estimates are consistent with both the moral hazard and
tax hypotheses.
The strongly significant and positive coefficient on the firm's tangible capital intensity (FPLANT)
appears to be strong evidence supporting Myers's (19771 conjecture that debt issuance is supported
by "bonding" (against moral hazard) in the form of tangible assets. (This result also supports the
interpretation of ITC as an indicator of tangible assets, emphasizing the importance of controlling
with ZPROB.)
No evidence emerges on Jensen's (1986] "free cash flow" hypothesis; the coefficient is imprecisely
estimated. Advertising and R&D both enter significantly with a positive sign. These results are
contrary to both the tax and moral hazard predictions?6 A different interpretation for R&D is
conjectured below.
The current debt/assets ratio has a small, but not very significant effect. On the other hand,
the change in leverage (measured as the current ratio minus the ten-year mean) enters with a
strongly significant negative coefficient. This evidence of mean reversion suggests that firms have
some tendency to aim for optimal long-run leverage ratios, rejecting the strong hierarchy claim that
incremental choices will ignore the leverage ratio.
Long and Malita (1985] and Bradley, JaneIl and Kim (1984J obtained negative signs in their debt/assets ratiostudies. However, their papers estimate sparse regreussions, tocusing on the moral hazard hypothesis. The evidenceabove on the importance of taxes, and of controlling for confounding effects, throws doubt on the validity of theirresults.
16

Other indicators for a financing hierarchy provide mixed evidence. VEARNA was suggested
as a (positive) indicator of information asymmetries; it has a negative coefficient, however. The
positive coefficient on VEARNA/ZFROB indicates that when the probability of financial distress
is especially high (low ZPROB and volatile earnings), the firm issues debt; neither moral hazard
nor signaling stories provide an obvious explanation for this result.
Another possible indicator of an asymmetric information-induced financing hierarchy is the
positive coefficient on R&D: the more research a firm does, the greater the opportunities for a
divergence between insider and outsider information. The evidence is strengthened when industry
dummies are added; however the interpretation is an a post rationalization, and the coefficient is
somewhat unstable in other specifications.
The importAnt ownership dilution effect may be due in part to the signaling problem, as well as
to the value of control, if big issues lead to unusually large drops in stock price. An issue value effect
on stock price drops has been previously rejected by Marsh [1979] and Hess and Frost [1982], but
was supported by Asquith and Mullins's [1986] study of announcement date (rather than issue date)
price effects. The estimated sign on dilution is consistent with this notion, but cannot distinguish
between the signaling and moral hazard hypotheses.
The same market timing phenomenon as found by other researchers is supported by the analysis:
firms are more likely to issue equity when their stock price is up (P < 0 and very significant).37
Summary Statistics and Specification Analysis. The summary goodness-of-fit statisticsfor the model are quite good for a discrete choice analysis of the behavior of many diverse firms
over several years. The p2 statistic indicates the percentage of the minimum possible likelihood
value we are able to explain with the model, and thus is analogous to the R2 measure from a
minimum-distance estimator. p2 involves a correction for degrees of freedom (based on the Akaike
Information Criterion), analogous to A2. The M-p2 statistic indicates the percentage of likelihood
explained by variables other than the constant. A naive forecast of debt.equity issues would predict
based on the observed mean (24% debt issues); column 1 is able to improve the likelihood value by
35% relative to this naive mode1?
See, e.g.. Marsh (1982], Taggart (19773, Asquith and Mullins (1986].
The statistics are calculated as: = 1— where 1(b) is the value of the likelihood function at theestimated parameter vector, and 1(0) is the value ii no parameters are estimated; 2 = — {(I(b) — K]/l(O)}, where
K is the number of parameters estimated; and M-p2 = 1 — {l(b)/:(c)}, where l(c) is thelikelihood value if just aconstant is estimated. The latter measure was suggested by McFadden (19741; for a discusáon of the first two, seeBen-Akiva and Lerman (19851.
17

Another summary measure is the ability of the model to correctly classify the observed choices
in the sample. The nttmates in column 1 correctly predict 74% of the debt issues, and 90% of
the equity issues in the sample, with an overall prediction rate of 86%. By contrast, Marsh [1982]
and Martin and Scott (1974] obtain a 75% correct prediction rate. Marsh calculates a pseudo-R2
statistic of 0.37; the same statistic for column 1 is 0.48?
A likelihood ratio x statistic for the four exclusions between column 1 and 2 (without including
the industry dummies) is 2.8, which fails to reject the exclusions at even the 35% level.40 A xh
likelihood ratio statistic for the industry dummies is 41.4, which rejects exclusion at the 0.001 level,
based on column 2 with and without the industry dummies."
As a test of the specification of the model, suppose that optimal security choice depends on
the entire history of the firm's characteristics and market conditions. For example, the firm should
be choosing its new security based on its expectations of the future; managers may use more than
one year of data to form expectations. Alternatively, alter reaching an optimal leverage ratio, the
characteristics determining the optimum may change, so the value of issuing a particular security
type may depend on first differences of the explanatory variables.
The results are in Table 7. I suppose that managers and investors look at two years of data
when forming supply and demand decisions for securities. Within this specification we can test for
more parsimonious models, such as the model in Table 4, or a model which restricts the coefficients
so that first differences in the explanatory variables, rather than levels, are relevant.
Column 1 of Table 7 repeats the specification of Table 442 Column 2 repeats the analysis using
data for the previous two years; column 3 estimates the model with first differences. (Lags are
indicated in parentheses.)
Using a likelihood ratio test, the x statistic for the original model against the expanded spec-
ification in column 2 is 10.0; we cannot reject the zero restrictions on the second lags at even the
25% level. The xs statistic for the first-differences specification is 67.0, so we can reject this version
well below the 1% level. The more parsimonious specification with one year of data does not cost a
statistically significant degree of explanatory power, while the first-differences specification is easily
rejected.
The R2 is defined as {i —exp (f(I(c) — '(I)])) / {i — exp (4'(c))}.40 The results for column 2 without industry dummies can be found in Maclcie-Mason (1986bJ.
41 The log likelihood without indu.ITJ dummies was -513.0.
42 The sample size Is smaller due to mining data for variable in other columns.
18

Two interesting specific results emerge in Table 7. First, the first difference in net assets has
substantial explanatory power in the model (see columns 2 and 3), i.e., a growing firm is more
likely to issue debt. A growing firm may have a greater potential for insiders to obtain information
about the firm's prospects that outsiders do not have. These firms might face larger signaling costs
for new equity issues, and thus exhibit more hierarchical financing preferences.
The substantial significance increase and the negative sign on the first-differenced cash flow
deficit coefficient is also suggestive (column 3). A decrease in the deficit appears to increase the
probability of debt issue. This accords with Jensen's [19861 free cash flow hypothesis: firms with
an increase in discretionary cash, should issue debt to commit themselves not to use the money on
managerial perks, etc.
Prediction. As a further test of robustness, I constructed predictions for a small hold-out sam-
ple. "Unit offerings"—registrations for offerings which combined more than one type of security—
were exctuded from the estimation sample. There were 61 total securities issued in 35 unit bundles
which met the other sample selection criteria. Prediction results for these issues are in Table 8.
Using the cutoff which minimized the sum of Type I and Type II error in the estimation
sample (0.37), I assigned predicted probabilities to debt or equity (using the Table 4, column 2
coefficients). This yielded 89% correct predictions, which is actually better than the in-sample
classification (86%). The hold-out sample is small, but this result is quite encouraging because the
hold-out sample is more difficult to naively classify than the estimation sample (the debt-equity
split is much closer to 50—50).
Many of the unit offerings were bundles of more than one debt type, so the theoretical model
which predicts that firms will choose debt or equity may not be inappropriate for the units. However,
many unit issues combine debt and equity. Because of this, I also combined units mt igle"pseudo-securities", with the choice between debt and equity measured as the debt fraction of the
total issue value. The Spearman rank correlation coefficient between the debt-fraction variable and
the predicted probability of issuing debt (for the 35 unit offerings) was 0.42, indicating that the
model does a good job of predicting the "strength" of the debt preferences, as welt as the specific
outcome.
Economic Importance of Results. Table 9 presents "standardized derivatives" for the major
explanatory variables, based on column 1 of Table 4. The standardized derivative measures the
percentage change in the probability of firms choosing debt, given a one standard deviation change
in an explanatory variable, evaluated at the sample means of the data. Thus, the results can be
19

viewed as predictions of the change in the percentage of issues that would be debt if there was a
shift in one of the variables, which is one way to measure the economic magnitude of the results.
Taken individuafly, the tax shield effects are as economically important as any others except
for the ownership dilution effect, and the second earnings variance measure. For instance, a one-
standard.deviation increase in ITC/ZPROB is predicted to lower the percentage of debt issues
by over 13 points (from about 24% of issues to 11%). Thus, the increase in corporate tax shields
during the early 1980's (e.g., ACtS, safe-harbor leasing, R&D tax credits, etc.) may in part explain
the dramatic decline in the proportion of debt issues (see Table 2). Similarly, the recent (1986)
reduction in tax shields (abolishing the ITC and slowing depreciation) may have the opposite effect,
although the decrease in the corporate tax rate also makes interest deductibility less valuable. Also,
general equilibrium effects must also be considered, as our results demonstrate: decreasing the ITC
may reduce the purchase of tangible assets, which will tend to reduce firms' debt capacities.
5. CONCLUSION
It is not surprising that no single story can explain all corporate financing decisions. Even
restricting the decisions to new public issues, the evidence above clearly demonstrates that managers
are concerned with a number of costs and benefits of their security choice. However,the results
provide some of the first clear evidence that tax policy does significantly affect financing decisions.
The analysis succeeds by controlling for confounding effects ignored in previous studies. However,
tax effects seem important primarily for firms approaching a state of financial distress (positive loss
carryforwards, or high tax shields when the bankruptcy predictor is high).
Another contribution of the paper is to adopt the incremental choice approach, which appears
to be more statistically powerful than the usual debt/assets ratio analysis. Studying the numerouse
specific financing decisions made by mangers enables us to test a rich specification, and control
for confounding effects that previous studies have left unresolved. Nonetheless, the complexity of
the financing choice problem suggests that to better understand the determinants of financing, it
would be wise to look for narrower, more carefully controlled "experiments".
20

6. REFERENCES
Altman, E. I. (1968) "Financial Ratios, Discriminant Analysis, and the Prediction of CorporateBankruptcy," Journal of Finance, 23, 589—609.
Altman, E. I. (1984) "A Further Empirical Investigation of the Bankruptcy Cost Question," Journalof Finance, 39, 1067—1089.
Altman, E. I., ft. C. Haldeman, and P. Narayanan (1977) "ZETA Analysis: An New Model toIdentify Bankruptcy Risk of Corporations," Journal of Banking and Finance, 1, 29—54.
Altshuler, ft. and A. J. Auerbach (1986) "The Significance of Tax Law Asymmetries: An EmpiricalInvestigation," Working paper, University of Pennsylvania.
Ang, 3. S. and D. a. Peterson (1986) "Optimal Debt Versus Debt Capacity: A Disequilibrium Modelof Corporate Debt Behavior," in Research in Finance, vol. 6, ed. Chen, A. %V.. Greenwich,CT: JAI Press.
Asquith, P., ft. F. Bruner, and D W. Mullias (1987) "Merger Returns and the Form of Financing,"Harvard Business School Working Paper.
Asquith, P. and D. \V. Mullins (1986) ""Equity Issues and Offering Dilution"," Journal of FinancialEconomics, 15, 61—89.
Auerbach, A. J. (1983) "Stockholder Tax Rates and Firm Attributes," Journal of Public Economics,21, 107—27.
Auerbach, A. 3. (1985) "Real Determinants of Corporate Leverage," in Corporate Capital Structuresin the United States, ed. Friedman, B. M.. Chicago: University ol Chicago Press.
Auerbach, A. 3-and 3. M. Poterba(1986) "Tax Loss Carryforwards and Corporate Tax Incentives,"Working paper, Dept. of Economics, MIT.
Auerbach, A. 3. and M. A. King (1985) "Taxation, Portfolio Choice and Debt Equity Ratios: AGeneral Equilibrium Model," Quarterly Journal of Economics, 98, 587—609.
Bagnoli, M. and N. Khanna (1987) "Equilibrium with Debt and Equity Financing of New Projects:Why More Equity Financing Occurs When Stock Prices are High," Working Paper, Dept. ofEconomics, University of Michigan.
Bartholdy, I., C. Fisher, and .1. Mintz (1985) "Some Theory of Taxation and Financial Policy withApplication to Canadian Corporate Data," Paper presented at the Econometric Society FifthWorld Congress, Cambridge, MA, August 17—24, 1985.
Baxter, N. D. and 3. G. Cragg (1970) "Corporate Choice Among Long-Term Financing Instru-ments," Review of Economics and Statistics, 52, 225—35.
Ben-Akiva, M. and S. ft. Lerman (1985) Discrete Choice Analysis: Theory and Application toTravel Demand. Cambridge, MA: MIT Press.
Bradley, M., C. A. Jarrell, and E. H. Kim (1984) "On the Existence of an Optimal Capital Structure:Theory and Evidence," Journal of Finance, 39, 857—878.
Brealey, ft. and S. C. Myers (1984) Principles of Corporate Finance. New York: McGraw-Hill.
Constantinides, C. M. and B. Grundy (1986) "Optimal Investment with Stock Repurchase andFinancing as Signals," Working paper, University of Chicago.
DeAngelo, H. and ft. W. Masulis (1980) "Optimal Capital Structure Under Corporate and PersonalTaxation," Journal of Financial &onomics, 8, 3—29.
21

Dierkens, N. (1986) "Equity Issues and Asymmetric Information." Draft, Sloan School of Manage-ment, MIT.
Donaldson, C. (1969) Strategy for Financial Mobility. Boston, MA: Harvard Business School.
Donaldson, G. (1984) Managing Corporate Wealth: The Opemtion of A Comprehensive FinancialGoals System. New York: Praeger.
Gale, D. and M. Hellwig (1985) "Incentive-Compatible Debt Contracts: The One-Period Problem,"Review of Economic Studies, 52, 647—64.
Gordon, ft. (1985) "Comment," in Corporate Capital Structures in the United States, ed. Friedman,B. M.. Chicago: University of Chicago Press.
Healy, P. M. and IC. Palepu (1986) "Corporate Financial Decisions and Future Earnings Perfor-mance: The Case of Initiating Dividends," Preliminary draft, Sloan School of Management,MIT.
Hess, A. C. and P. A. Frost (1982) "Tests for Price Effects of New Issues of Seasoned Securities,"Journal of Finance, 36, 11—25.
Jensen, M. C. (1986) "Agency Costs of Free Cash Flow, Corporate Finance, and Talceovers,"American Economic Review, 76, 323—329.
Jensen, M. C- and \V. H. Meckling (1976) "Theory of the Firm: Managerial Behavior, AgencyCosts and Ownership Structure," Journal of Financial Economics. 3. 305—60.
Leland, H. E. and D. H. Pyle (1977) "Informational Asymmetries, Financial Structure and FinancialIntermediation," Journal of Finance, 32, 371—387.
Long, M. S. and I. B. Malitz (1985) "Investment Patterns and Financial Leverage," in CorporateCapital Structures in the United States, ed. Friedman, B. M.. Chicago: University of ChicagoPress.
MacKie-Mason, J. K. (1986a) "Long-Term Contracts and Sequential Economic Decisions," Chapter2, unpublished Ph.D. dissertation, Dept. of Economics, MIT.
MacKie-Mason, 3. K. (1986b) "Taxes, Information and Corporate Financing Decisions," Chapter3, unpublished Ph.D. dissertation, Dept. of Economics, MIT.
Marsh, P. ft. (1979) "Equity Rights Issues and the Efficiency of the U.K. Stock Market," Journalof Finance, 34, 839—62.
Marsh, P. ft. (1982) "The Choice Between Equity and Debt: An Empirical Study," Journal ofFinance, 37, 121—144.
Martin, 3. D. and D. F. Scott (1974) "A Discriminant Analysis of the Corporate Debt-EquityDecision," Financial Management, Winter, 71—79.
McFadden, D. (1974) "Conditional Logit Analysis of Qualitative Choice Behavior," in Frontiers inEconometrics, ed. Zarembka, P.. New York: Academic Press.
McFadden, D. (1981) "Econometric Models of Probabilistic Choice," in Stn.zctur& Analysis ofDiscrete Data with Econometric Applications, ed. Manski, C. F. and I). McFadden. Cambridge,MA: MIT Press. -
Miller, M. H. (1977) "Debt and Taxes," Journalof Finance, 32, 261—275.
Miller, M. H. and Modigliani, F. (1963) "Corporate Income Taxes and the Cost of Capital: ACorrection," American Economic Review, 53, 433—43.
Miller, M. II. and M. Scholes (1982) "Dividends and Taxes: Some Empirical Evidence," Journal ofPolitical Economy, 90, 1118—1141.
22

Modigliani, F. and M. H. Miller (1958) "The Cost of Capital. Corporation Finance, and the Theoryof Investment," American Economic Review, 48, 261—97.
Myers, S. C. (1977) "Determinants of Corporate Borrowing," Journal of Financial Economics, 5,147—175.
Myers, S. C. (1984) "The Capital Structure Puzzle," Journal of Finance, 39, 572—592.
Myers, S. C. and N. S. MajIuf (1984) "Corporate Financing and Investment Deciiions When Firmshave Information that Investors Do Not Have," Journal of Financial Economics, 13, 187—221.
Poterba, 3. M. (1986) "Taxation and Corporate Capital Structure," Comments prepared for the IVJohn Deutsch Roundtable of Economic Policy, The Impact of Taxation on Business Activity,Ottawa, November 11—13, 1985.
Ross, S. A. (1985) "Debt and Taxes and Uncertainty," Journal of Finance, 40, 637—656.Scholes, M. S. and M. A. Wolfson (1987) "Issues in the Theory of Optimal Capital Structure," in
Frontiers of Modern Finance, ed. Bhattacharya, S. and C. Constantinides. : Rowman andLittlefield.
Stiglitz, 3. E. and A. Weiss (1981) "Credit Rationing in Markets with Imperfect Information,"American Economic Review, 71, 393—410.
Taggart, R. (1977) "A Model of Corporate Financing Decisions," Journal of Finance. 32, 1467—84.
Taub, A. (1975) "The Determinants of the Firm's Capital Structure," Review of Economics andStatistics, 57, 410—416.
Titman, 5. (1984) "The Effect of Capital Structure on a Firm's Liquidation Decision," Journal ofFinancial Economics, 13, 137—152.
Watts, ft. L. and 3. L. Zimmerman (1986) Positive Accounting Theory. Englewood Cliffs, NJ:Prentice-Hall.
Williamson, 5. (1981) "The Moral Hazard Theory of Corporate Financial Structure: An EmpiricalTest," Unpublished Ph.D. dissertation, Sloan School of Management, MIT.
Williamson, S. D. (1987) "Costly Monitoring, Loan Contracts, and Equilibrium Credit Rationing,"Quarterly Journal of Economics, 102, 135—146.
23

TABLE 1
Summary of Hypothesized Effects
(Change in Probability of Choosing Debt)
VariableFinancial Distress
Tax Hypothesis Signaling(Moral_Hazard)
Tax loss carryforwardsInvestment tax credit
Deprec., Deferred taxes
Taxes paid +Clientele tax rate
Research & Development +Advertising
Unlevered "Beta"
Unlevered "Sigma"Earnings variance, Type A +
Earnings variance, Type BFraction assets in plant +
(Free) Cash flow +Dilution + +
Debt/Assets 0
Current D/A - Long-run D/A 0
Change in stock price
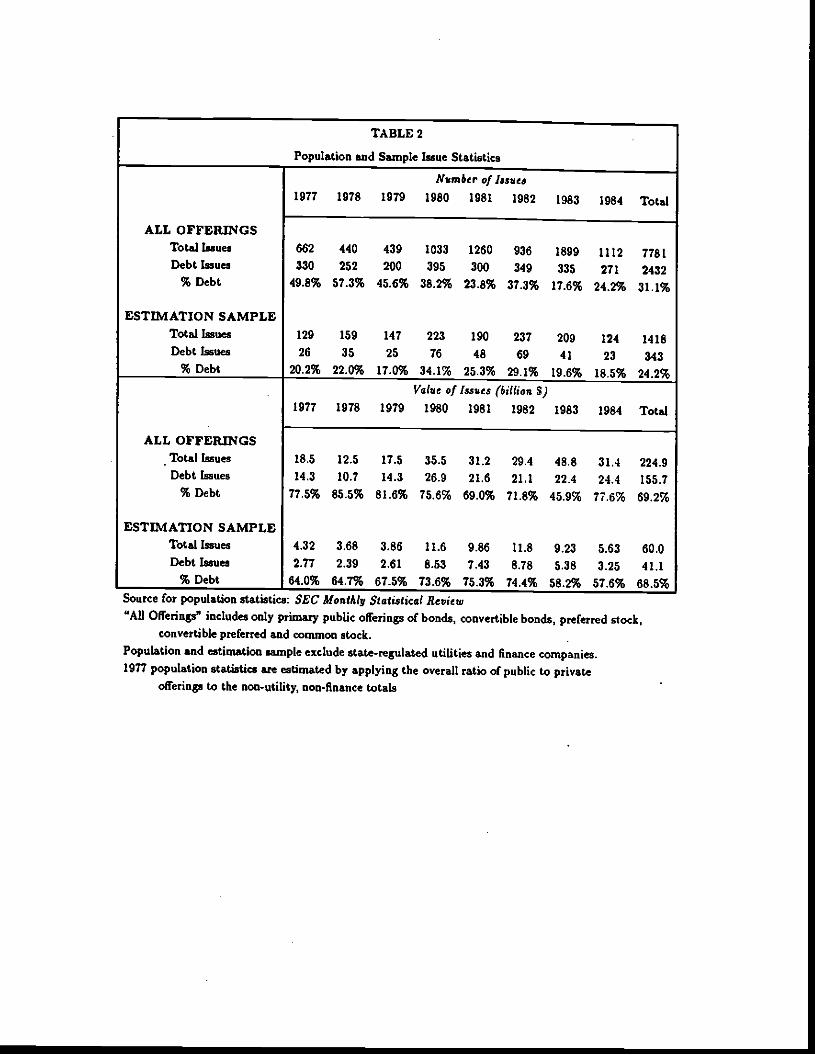
TABLE 2
_________________________ Population and Sample Issue Statistics
Nvmôer of Issue,1977 1978 1979 1980 1981 1982 1983 1984 Total
ALL OFFERINGSTotal Issues 662 440 439 1033 1260 936 1899 1112 7781Debt Issues 330 252 200 395 300 349 335 271 2432% Debt 49.8% 57.3% 45.6% 38.2% 23.8% 37.3% 17.6% 24.2% 31.1%
ESTIMATION SAMPLETotal Issues 129 159 147 223 190 237 209 124 1418Debtlssues 26 35 25 76 48 69 41 23 343
% Debt 20.2% 22.0% 17.0% 34.1% 25.3% 29.1% 19.6% 18.5% 24.2%Value of Issues (billion S)
1977 1978 1979 1980 1981 1982 1983 1984 Total
ALL OFFERINGSTotal Issues 18.5 12.5 17.5 35.5 31.2 29.4 48.8 31.4 224.9
Debt Issues 14.3 10.7 14.3 26.9 21.6 21.1 22.4 24.4 155.7% Debt 77.5% 85.5% 81.6% 75.6% 69.0% 71.8% 45.9% 77.6% 69.2%
ESTIMATION SAMPLETotal Issues 4.32 3.68 3.86 11.6 9.86 11.8 9.23 5.63 60.0Debt Issues 2.77 2.39 2.61 8.53 7.43 8.78 5.38 3.25 41.1
% Debt 64.0% 64.7% 67.5% 73.6% 75.3% 74.4% 58.2% 57.6% 68.5%Source for population statistics: SEC Monthly Statistical Revigw
"All Offerings" includes only primary public offerings of bonds, convertible bonds, preferred stock,convertible preferred and common stock.
Population and estimation sample exclude state-regulated utilities and finance companies.1977 population statistics are estimated by applying the overall ratio of public to private
offerings to the non-utility, non-finance totals

TABLE 3
Descriptive Statistics
(1418 observations)
Variable Mean Std. Dev.
Debt/Equity Choice 0.242 0.183
Tax loss carryforwards 0.0 140 0.123
Investment tax credits 0.00494 0.00618
ITC / ZPROB 0.00274 0.00574
Depreciation 0.0430 0.0471
Deferred taxes* 0.00945 0.0196Current taxes paid* 0.0321 0.036U
Clientele tax rate 0.347 2.07
Research & development 0.0158 0.226
Advertising 0:0142 0.0244Unlevered "beta" 0.560 0.417
Unlevered "sigma" 0.0160 0.0407
Earnings variance, Type A 0.0447 0.0435
VEARNA / ZPROB 0.0204 0.0265
Earnings variance, Type B 0.551 2.37Fraction plant 0.508 0.2121 / ZPROB 0.451 0.274Cash flow 0.103 0.0776
Cash flow deficit -0.0359 0.0684Current debt/assets 0.229 0.131
Current D/A — Long-run D/A 0.00220 0.0902Relative issue size 0.183 0.456
Change in stock price 0.127 0.468Net Assets 0.0924 0.309
Regulated firm 0.0451 0.208
Variables are reported as scaled in the analysis. See Appendix for details.Indicates statistics based on 1409 observations.

TABLE 4
Determinants of Debt-Equity Choice
(Choice = 1 if debt, 0 if eqtity)Variable (1) (2)Constant -1.69 -2.04
(4.99) (4.20)
Tax Loss -2.73 -2.50Carryforwards (2.03) (1.62)
Investment 15.3 72.4Tax Credit (2.72) (2.58)
ITC/ZPROB -106.7 -104
(2.60) (2.45)
Clientele -0.0190Tax Rate (0.583)
Research and 4.35 9.92
Development (1.63) (2.78)
Advertising 5.36 7.23
(2.76) (2.91)
Beta -0.196
(1.073)
Sigma -2.40
(1.18)
Earnings Variance -10.6 -13.4
(Type A) (2.58) (3.61)
VEARNA/ZPROB 18.4 21.0
(2.98) (4.00)
Earnings Variance -0.825 -0.743
(Type B) (4.21) (3.57)
flactiouof assets 1.90 1.87in plant & equip (6.00) (5.00)
Continsed

TABLE 4
Contined
Variable (1) (2)"Cash Deficit 0.338 -0.0415
(0.268) (0.0321)
i/ZPROB 0.00281
(0.00618)
Debt/Assets -1.07 -0.851
(2.06) (1.52)
A Debt/Assets -1.52 -1.62
(2.13) (2.11)
Relative Size 3.80 3.74
(Ownership Dilution) (22.3) (19.8)
A Stock Price .0.487 -0.447
(3.87) (3.52)
Net Assets 0.683 0.493
(8.58) (5.23)
Regulated -0.905 -1.77
(3.74) (2.56)
1978 -0.354 -0.341
1979 -0.431 -0.399
1980 0.113 0.179
1981 -0.00113 -0.00489
1982 -0.192 -0.141
1983 -0.470" -0.448"1984 -0.525" -0.486
InC -511.6 -492.3
M-p2 0.348 0.373
p2 0.480 0.499
p 0.451 0.459
% Right Debt 73.2% 69.1%
% Right Equity 90.1% 91.1%
% Right Total 86.0% 85.8%
1418 observations. Asymptotic t-statistics in parentheses.Indicates year dummy significant at 10% level..° Indicates year dummy significant at 5% level." This speciflcation included 16 industry dummy variables. See Table 5.

TABLE S
Industry Dummy Variable.
SIC Coverage Obs. Description Coefficient1000—1299 18 Mining 0.260
(0.437)
1300-4399 59 Oil & gas production -0.0461
(0.112)
2000-2199 91 Food, beverages & tobacco 0.167
(0.401)
2200—2399 15 Apparel 0.707
(0.963)
2600—2799 86 Paper, publishing 0.0578
(0.145)
2800-2899 16.4 Chemicals -0.259
(0.62 7)
2900-2999 48 Petroleum refining, paving 0.794
(1.88)
3000-3299 36 Rubber, plastics, leather, -0.00296
glass, cement, ceramics (0.00578)
3300—3499 79 Iron, steel, metalworking 0.512
(1.20)
3500-3599 76 Industrial machinery 0.0298
(0.0170)
3600—3699 177 Electronics, elec. machinery -0.175
(0.411)
3700-3799 60 Transportation machinery 0.565
(1.27)
3800—3899 97 Measurement devices .0.555
(1.24)
4800—4899 45 Telephones 1.26
(2.06)
5000-5999 151 Wholesale & retail 0.264
(0.655)
7000—8999 142 Hotels, services, misc. -0.0205
_________________________________________________________ (0.0530)Results are from specification reported in Table 4. column 6.Public utilities (SIC 4900—4999) and Financial k Real Estate services (SIC 6000-6999)are excluded from the estimation sample (1017 and 268 observations, respecthely.)

1418 observations. Asymptotic t-statistia in parentheses.
• Indicates year dummy significant at 10% level.
indicates year dummy significant at 5% level.
TABLES
Tax Effects Without interaction.
(Ckoicc = I J dehi, 0 ii eqsitp)
Variable Variable
Constant
Tax LossCanylorwanls
invatmeitTax Credit
rtC/ZPROB
-1.78
(6.09)
-1.94
(1.83)
4.95
(0.560)
Cash Deficit 1.49
(1.96)
1/ZPROB
Debt/Assets -0.932
(2.04)
A Debt/Assets -1.88
(2.80)
Relative Size
(Ownership Dilution)
3.65
(21.4)
A Stock Price -0.483
(3.92)
Net Assets 0.648
(8.20)
Regulated -1.00
(4.43)
1978197919801981
198219831984
-0.314-0.4390.1360.0353
-0.164-0.438-0.461
ClienteleTax Rate
-0.00739
(0.227)
Research and
Development
5.12
(1.96)
Advertising 5.44
(2.87)
Beta -0.188
(1.01)
Sigma -2.06
(0.975)
Earnings Variance
(Type A)
-1.31
(0.877)
VEARNA/ZPROB
Earnings Variance
(Type 8)-0.720
(3.35)
Fraction of assetsin plant & equip
2.05
(6.59)
'slidM-p2
% Rigbt Debt% }tight Equity
!½! Total
-522.00.3350.4690.44 4
72.0%89.3%85.1%

TABLE?
Specification Analysis or Debt-Equity Choice
(CP.oice = debt, C ii eqtity)Variable Lag 1 Lags I and 2 First DifferencesConstant -1.70 -1.73 -0.799
(6.10) (6.1?) (3.75)Tax Las -3.05 -1.54
Carryforwards (1) (2.15) (0.708)
Tax Loss -1.24Canyforwards (2) (0.640)
Tax Los. 0.724Carryforwards (D) (0.134)
investment 68.3 69.5Tax Credit (1) (2.65) (1.92)
investment -12.2Tax Credit (2) (0.367)
InvestmentTax Credit (D) (1.28)
ITC(l)/ZFROB(1) -101 -91.0
(2.67) (1.89)
ITC(2)/ZPROB(2) -2.34
(0.0615)
ITC(D)/ZPROB(D) -34.3
(0.9 76)
Research and 1.94 11.2
Development(1) (0.688) (0.825)
Research and -9.08
Development(2) (0.643)
Research and 0.507Development(D) (0.0405)
Advertising(1) 4.98 0.252
(2.47) (0.0185)
Advertis'mg(2) 4.55
(0327)
Advenising(D) -2.04
(0.154)
Earning, Variance -13.3 -12.9 -10.5(Type A)(1) (3.22) (2.97) (2.84)
VEARPJA(1)/ZFROB(1) 16.8 15.9 12.6
(2.88) (2.39) (2.17)
Earnings Variance -0.689 -0.723 -0.825
(Type B)(1) (3.13) (3-21) (4.31)
Fraction of assets 1.92 2.85in plant & equip(1) (6.10) (2.511
Fraction of assets -0.85.)in plant & equip(2) (0.777)
Fraction of assets 2.32in plant & equip(D) (2.19)
Con lined

TABLE?
Conlinted
Vasiable (1) (2) (3)Cash Deftcit(l) 0.165 -0.937
(0.132) (0.620)
Cash Deficit(2) 1.06
(0.866)
Cash Deficit(D) -1.44
(1.57)
a Debt/Assets -1.18 -1.42 -2.25
(1.74) (2.00) (3.76)
Current Debt/Assets .1.02 -1.00 -0.0938
(2.14) (2.01) (0.221)
Relative Size 3.69 372 3.38
(OwnershipConcentration) (21.9) (21.6) (22.4)
a Stock Price -0.485 -0.446 -0.529
(3.83) (3.46) (4.15)
Net AssetsU) 0.624 7.91
(7.59) (3.34)
Net Assets(2) .749(3.09)
Net Assets(D) 14.3
(7.58)
Regulated -0.828 .0.770 -0.418
(3.42) (3.09) (1.92)
1978 -0.366 .0331 .0.3271979 -0.388 -0.365 -0.331
1980 0.0898 0.1159 0.170
1981 0.0153 0.0223 0.174
1982 -0.152 .0.127 0.0198
1983 .0.403 .0.38r -0.2101984 -0.437 -0.446 -0.336
In £ -502.3 .497.3 -530.8
0.339 0.345 0.301
p2 0.460 0.465 0.429
0.439 0.431 0.403
% Right Debt 75.0% 71.2%
% Right Equity 89.3% 91.4% 87.9%% Right Totaj 85.7% 86.4% 83.4%
1341 observations. Asymptotic t-statistia in parentheses.•
Indicates year dummy significant at io% level.Indicates year dummy significant at s% level.

TABLES
Predictions For Hold-Out Sample
of "Unit" Offering Registrations
Individual Security Predictions(N = 61. Actual no. debt = 40. Prediction cutoff = 9.37)
% Right PredictionsDebt 85%
Equity 95%
Total 89%
Combined Security Predictions(N = 35. See text for deflnüions)
Debt fraction of issue value Actual PredictedMean 0.859 0.800
Standard deviation 0.275 0.351
Spearman rank correlation cod. 0.407

Variable Coefficient
(Table 4, Cot I)Standardized Derivative
(In percent)
Asymptotic t-statistia in parentheses.The standardized derivative is calculated as the change in the mean probability of issuing debtgiven a one standard deviation change in the variable (2 is mean of x matrix).a (t'p)std. deny. fort3 = [
ør,
TABLE 9
Standardized Marginal Effects
(Choice = j / debt, 0 if eqrsitp)
Tax LossC arty forwards
InvestmentTax Credit
ITC/ZPROB
Research and
Development
Advertising
Earnings Variance(Type A)
VEARNA/ZPROB
Earnings Variance(Type B)
Fraction of assetsin plant & equip
Current Debt/Assets
A Debt/Assets
Relative issue Size
A Stock Price
Net Assets
-2.73
(2.03)
75.3
(2.72)
-107
(2.60)
4.35
(1.62)
5.36
(2.76)
-10.6
(2.58)
18.4
(2.98)
-0.825
(4.21)
1.90
(6.00)
-1,07
(2.06)
-1.52
(2.13)
3.80
(22.3)
-0.487
(3.87)
0.683
(8.58)
-7.60
10.5
-13.8
2.22
2.95
-10.4
11.1
-44.2
9.11
-3.14
-3.10
39.1
-5.15
4.77
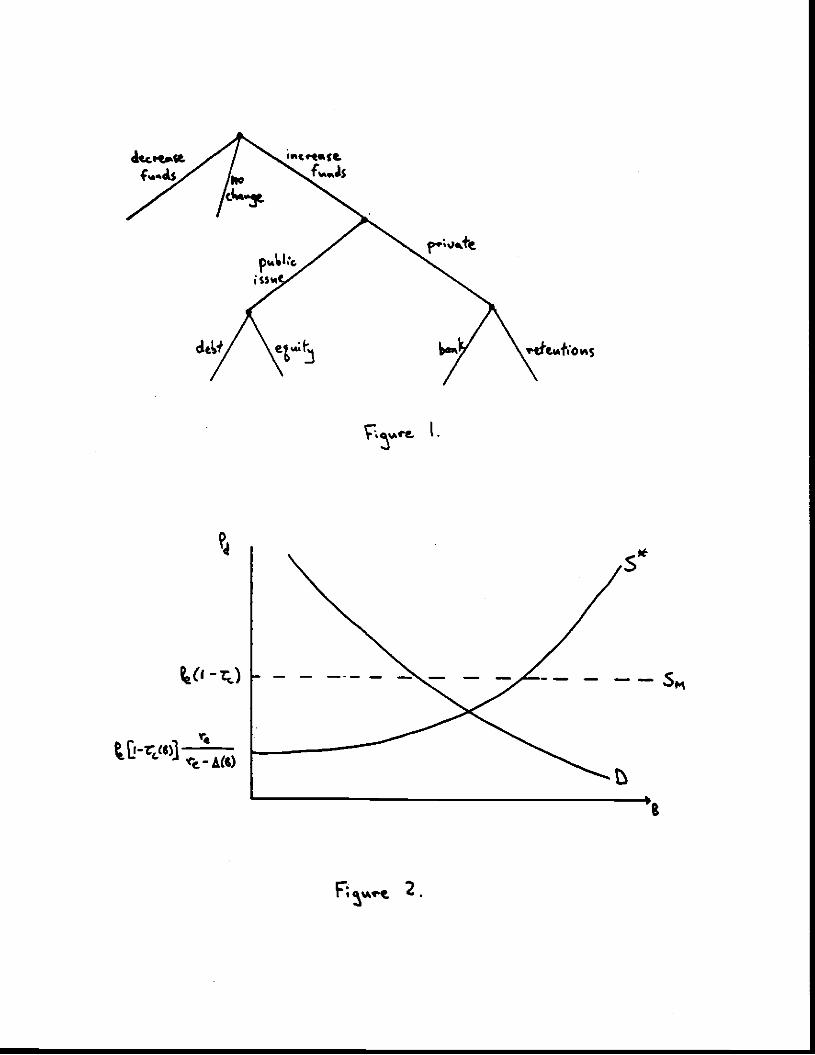
tO-c)
2.
flttatCo ii;
—c eta St
I.
5*
B

APPENDIX
Data Definitions
For each Attn in the sample, we estimated a variant of the "market model" for stock price returns. The
model has been previously estimated by Auerbach (1983], based on theoretical work by Auerbach and King
119851 and Brennan [1970]. We estimated
= o + a1d1 + 03yn1 + a3r1 A-i
where g is the 1-day capital gain in stock price, d1 the dividend yield on date t (calculated on ex-dividend
days), in5 the 1-day return on the equally-weighted index of all NYSE and AMEX stocks, and r1 the returnon government T-bills during the week containing day 1. Daily data were obtained from the CRSP tapes.Use of daily data avoid, confounding of tax effects with the information effects associatedwith dividendannouncements; Miller and Scholes 119821 critici2e earlier work for using monthly dividend returns. There is
no reason to believe that the coefficients on (Al) will be unvarying for a givenfirm over time; since manyfirms appear more than once in the sample, we estimated (A.1) on the most recent three years of dailydatapreceding the filing date of the registration statement for each registration in the sample.
The model is a standard CAPM except that it assumes individual investors have differing marginal taxrates. If taxes on dividends were zero, then the stock price should change one-for-one with dividend payoutson ex-days, so n would be -I. The estimated &i is thus an estimate of an aggregated marginal tax rate(a = — 1) for the clientele of investors holding the firm's stock. The estimated & is analogous to theusual "beta" of a market model regression. Details of the estimates can be found in MacKie-Mason [1986bj.
In addition to "beta" and the clientele tax rate, we use the standard errors of regression ("sigma") as anindicator of firm-specific, diversifiable risk.
The COMPUSTAT tape provides financial statement data on several thousand large or otherwise "im-portant" firms. All dollar-denominated variables were deflated to constant (1982) dollars, using the GNPdeflator for gross private domestic investment. The definitions in the paper follow the COMPUSTAT defi-nitions, unless otherwise noted.
We use book values of firm assets and liabilities. Auerbach [1985] and others attempt to approximatemarket values, but the results have usually indicated that book debt is just as appropriate as a determinantof financial decisions. Myers [1977, 1984] suggests that managers may rely on book measures because bookvalue represents the fixed, or sunk value of firm assets. Market values include the value of intangible assetsand future discretionary investments, which are predicted to reduce the firm's debt capacity.
We list below the definitions of variables used in the analysis.
Afarke( valve of equity = shares outstanding x stock price (as of 12/31)
Tar toss carnjforward = book tax loss carryforward / market value of equity.1
Investmeni tar credit = investment tax credits / net sales.
ZPROB: Altman's [1968) ZPROB included the ratio of market equity to book debt. We have excluded thatterm since we are studying precisely capital structure, and enter the debt ratio directly into the analysis.
ZPR.OB = EBIT+ 1.0
sales + 14retained earnings + 12working capitaltotal assets total assets total assets total assets
where EBIT is earnings before interest and taxes.
Research and development = R&D /net sales. If R&D is missing, the variable is coded as zero. A specificationtest indicated no significant bias from this recoding.
We scale by market equity because TLCF is ill-behaved when scaled by net sales; TLCI' is generally high when sale. are low,distorting the attempt to get a scale-free measure.

Advertising = advertising expenditures I net sales. Recoding was done as for R&D.
EBJDT = earnings before interest, depreciation and taxes.
Earnings variance, Type 4 = standard deviation of (EBJDT1 — EB!DT1), divided by the mean of totalassets, for 10 years prior to registration (at least six years if data are missing).
Earnings variance, Type B = standard deviation of [(EBIDT — EB!DTg_i)/IEBIDT,..iI), for 10 yearsprior to registration (at least six years if data axe missing).
Fraction of assets in plant & eQsipntent = (plant — accumulated depreciation) I (total assets — currentliabilities).
Cash deficit = (capital expenditures + average dividends - (cash flow + capital expenditures x [total debt/netassets])) / net sales, where average dividends is the mean of total dividend payments over the previous 10years, See Auerbach [1985].
Currrn debt/assets ratio = book long-term debt / total assets.
Debt/assets = current debt/assets ratio — (mean of debt/assets ratio over previous 10 years).
Dilution = issue value / market value of equity.
stock price = (end-of-year price in year previous to registration) — (end-of-year price two years previously).
Net assets = total assets — current payables.
Tares paid = (current payables two years ago) + (provision for income taxes one year ago) — (currentdeferred taxes one year ago) — (current payables one year ago).
Auerbach and Poterba [1986] suggest that the TLCF' variable in COMPUSTAT may be inappropriate forstudying US. tax policy, in part because book TLCF may include foreign carryforwards which are notapplicable to US. taxable income- They created a revised data series on TLCF for the years 1981—1984;we followed their approach to revise the data for the other years in our sample. We re-estimated column4 utilizing the revisions, with the resulting coefficient on TLCF negative but insignificant. We replacedTLCF wherever possible with revised data, and included a dummy variable to check for bias from splicingthe two series. There appear to be problems in the construction of the revised data, since the revisionrequires searching the footnotes of a firm's 10-K. Correct TLCF data is unavailable for most observations,because firms are not required to report true tax TLCF. Also, the mean for TLCF actually rose (despitethe expectation that foreign carryforwards were biasing book TLCF upwards), and the standard error grewsubstantially. We use book TLCF, acknowledging that it is an imperfect, but apparently informative measureof one tax shield.
Sample Selection
The initial source of data was the Registered Offerings Statistics (ROS) tape from the SEC. This file containsfinancial and other information reported for all public security registrations. The tape contained 68,316registered offerings covering 1970—1984. Because this data source is not well-known, we describe our sampleselection procedure in some detail.
Issues were dropped if (1) the issuing firm is not on the COMPUSTAT tape; (2) the registration is for aninitial public offering; (3) the registration is for a noncash transaction; (4) the issuing firm was not listed onthe NYSE or AMEX; (5) the security was registered before January 1, 1977; (6) the security was not one ofstraight debt, convertible debt, prefnred stock convertible preferred, or common stock.

Some of these restrictions are necessary to obtain stock market information and data on firm characteristics.
Initial offerings were dropped because historical firm data are unavailable, and the IPO decision is likelyto be fundamentally different from ongoing financing decisions. Noncash offerings are mostly exchanges,conversions and other transaction types which are not obviously intended to raise new capital. Only thelive major security types were retained because most of the theory is concerned only with broad distinctionsamong contingent claims. Pre-1977 issues were deleted because the SEC did not collect information on some
relevant variables during 1970—1976.
Registrations by foreign firms, registrations with warrants to purchasers (0.1% of the subsample), and regis-trations for rights offerings (0.6%) were also dropped. The final selection dropped gas and electric utilities,financial services, and real estate firms, and firms for which required data was missing.2 We dropped theselected industries because their capital market interactions are known to be quite different than other firms,due to regulation or the financial nature of the business.
2 An extensive hand search of Moody's lndmtrjal Manual and individual 10K reports recovered enough missing data to keepabout 200 observations at the sample.