
Jefferson Road Improvements Traffic Analysis State Project...
203
Jefferson Road Improvements Traffic Analysis State Project U320-601-0.00 03 Final Report Prepared for: TRC Engineers, Inc. and West Virginia Department of Transportation, Division of Highways Prepared by: Stantec Consulting Services Inc. August 2015
Transcript of Jefferson Road Improvements Traffic Analysis State Project...

Jefferson Road Improvements Traffic Analysis State Project U320-601-0.00 03
Final Report
Prepared for: TRC Engineers, Inc. and West Virginia Department of Transportation, Division of Highways
Prepared by: Stantec Consulting Services Inc.
August 2015
JEFFERSON ROAD IMPROVEMENTS TRAFFIC ANALYSIS STATE PROJECT U320-601-0.00 03
Table of Contents
EXECUTIVE SUMMARY ............................................................................................................... I
1.0 INTRODUCTION ............................................................................................................. 1 1.1 PREVIOUS STUDIES ............................................................................................................. 1 1.2 OBJECTIVES ........................................................................................................................ 1
2.0 DATA COLLECTION ....................................................................................................... 3 2.1 INTERSECTION TURNING MOVEMENT COUNTS .............................................................. 3 2.2 TRAIN CROSSING DATA .................................................................................................... 4
3.0 DESIGN ALTERNATIVES .................................................................................................. 4
5.0 ANALYSES AND RESULTS ............................................................................................... 6 5.1 CAPACITY ANALYSIS ......................................................................................................... 6
Capacity Analysis Conclusions ....................................................................................... 9 5.2 TRAFFIC SIMULATION....................................................................................................... 10
Average Travel Times ..................................................................................................... 11 Average Intersection Delay .......................................................................................... 13 Maximum Queues .......................................................................................................... 14
6.0 DESIGN CRITERIA ........................................................................................................ 15
7.0 SUMMARY .................................................................................................................... 16
LIST OF TABLES Table 1. Train Crossing Summary (minutes:seconds) ............................................................... 4 Table 2. Intersection Level-of-Service Thresholds ..................................................................... 7 Table 3. A.M. Peak Control Delay and Level of Service for Signalized Intersections .......... 7 Table 4. A.M. Peak Control Delay and Level of Service for Unsignalized
Intersections .................................................................................................................... 8 Table 5. P.M. Peak Control Delay and Level of Service for Signalized Intersections .......... 9 Table 6. P.M. Peak Control Delay and Level of Service for Unsignalized
Intersections .................................................................................................................... 9 Table 7. A.M. Peak Route Segment Average Travel Times ................................................... 13 Table 8. P.M. Peak Route Segment Average Travel Times ................................................... 13 Table 9. A.M. Peak Average Intersection Delay .................................................................... 13 Table 10. P.M. Peak Average Intersection Delay ................................................................... 14 Table 11. A.M. Peak Maximum Vehicle Queues .................................................................... 15 Table 12. P.M. Peak Maximum Vehicle Queues .................................................................... 15
LIST OF FIGURES Figure 1. Initial Study Area ........................................................................................................... 2 Figure 2. Jefferson Road Design Alternatives ........................................................................... 5

JEFFERSON ROAD IMPROVEMENTS TRAFFIC ANALYSIS STATE PROJECT U320-601-0.00 03
Figure 3. New or Modified Traffic Signals - Alternative 5 ......................................................... 8 Figure 4. Travel Time Route Segments ..................................................................................... 12
LIST OF APPENDICES
TRAIN CROSSING DATA ............................................................................ A.1 APPENDIX A
INTERSECTION LANE GROUP DELAYS AND LEVELS OF SERVICE .............. B.4 APPENDIX B
HIGHWAY CAPACITY SOFTWARE ANALYSIS RESULTS .............................. C.5 APPENDIX C
TRAFFIC SIMULATION MODEL CALIBRATION ........................................... D.6 APPENDIX D

JEFFERSON ROAD IMPROVEMENTS TRAFFIC ANALYSIS STATE PROJECT U320-601-0.00 03
Executive Summary
Jefferson Road (WV 601) provides an important connection between Interstate 64 and US 119 in South Charleston, West Virginia. Interstate 64 and US 119 (also referred to as Corridor G) are heavily traveled major routes that connect the Charleston area with Kentucky to the west. Additionally, US 119 has become a major retail corridor, placing an additional demand for connectivity with Interstate 64.
Two previous studies have been conducted that have involved the identification and evaluation of preliminary alternatives. This study is part of the next phase of the project development process for the preferred improvement to Jefferson Road from MacCorkle Avenue (US 60) to US 119 at Oakhurst Drive. The previous study incorporated the planned extension of RHL Boulevard from its current terminus at the South Charleston Ice Center to Jefferson Road near Kramer Street.
After conducting the evaluations and receiving public input, Alternatives 1 and 5 were advanced as preferred alternatives for which further analysis would be performed. In summary:
• Alternative 1 re-aligns the Jefferson Road/Kanawha Turnpike intersection to form a single, four-legged intersection. The CSX Railroad crossing over Jefferson Road remains just north of Kanawha Turnpike, but the discontinuity of Jefferson Road at Kanawha Turnpike is eliminated. For the sake of traffic analyses, two variations of the Alternative 1 scenario were considered: 1) with the extension of RHL Boulevard and its intersection with Jefferson Road south of Kanawha Turnpike; and 2) without the extension of RHL Boulevard.
• Alternative 5 provides a grade separation of Jefferson Road over Kanawha Turnpike, eliminating the existing “jogged” intersection. Access from Jefferson Road to Kanawha Turnpike is provided by a small connector road.
A combination of tools was used to evaluate anticipated traffic impacts associated with Alternatives 1 and 5. Methods prescribed in the 2010 Highway Capacity Manual (HCM) were used to perform capacity analyses of both signalized and key unsignalized intersections, from which average control delay and level of service were determined. As was done in the preceding analysis, traffic simulation software was used to simulate and quantify anticipated traffic conditions for the entire Jefferson Road corridor; specifically, average travel speeds, intersection approach queue lengths, and signalized intersection delays. The simulation software also was used to model the impacts of train crossings on corridor traffic conditions, which the HCM methods cannot do.
i
JEFFERSON ROAD IMPROVEMENTS TRAFFIC ANALYSIS STATE PROJECT U320-601-0.00 03
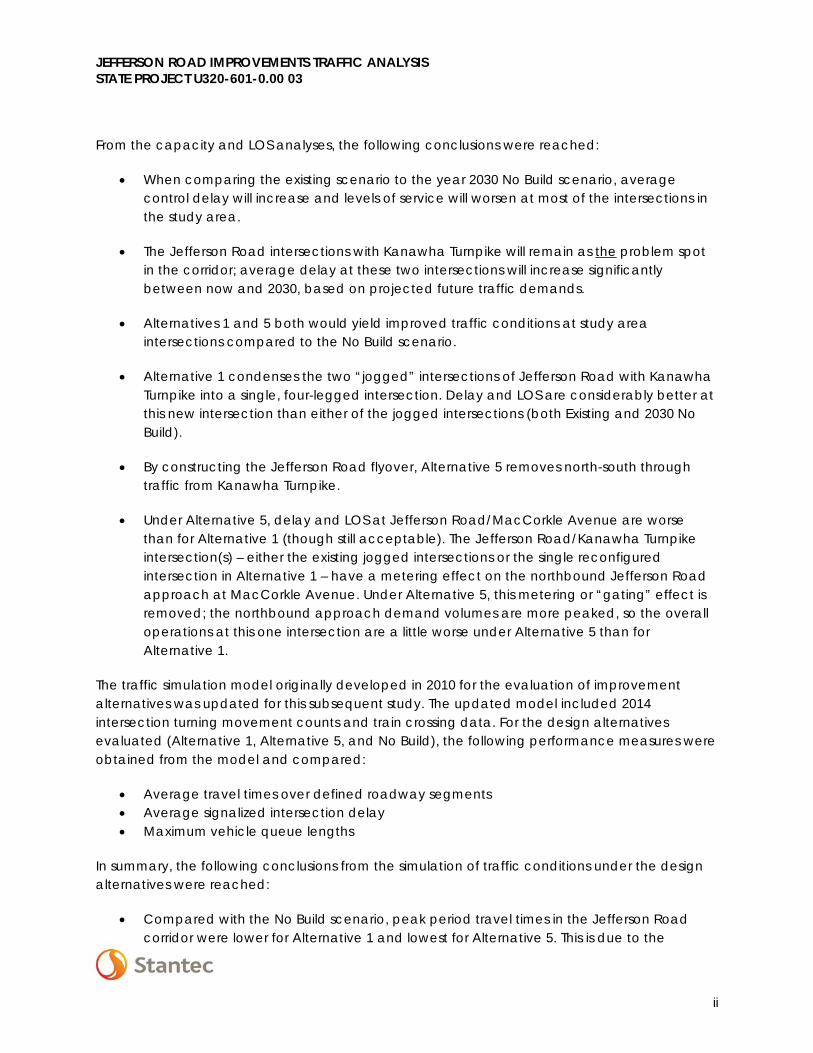
From the capacity and LOS analyses, the following conclusions were reached:
• When comparing the existing scenario to the year 2030 No Build scenario, average control delay will increase and levels of service will worsen at most of the intersections in the study area.
• The Jefferson Road intersections with Kanawha Turnpike will remain as the problem spot in the corridor; average delay at these two intersections will increase significantly between now and 2030, based on projected future traffic demands.
• Alternatives 1 and 5 both would yield improved traffic conditions at study area intersections compared to the No Build scenario.
• Alternative 1 condenses the two “jogged” intersections of Jefferson Road with Kanawha Turnpike into a single, four-legged intersection. Delay and LOS are considerably better at this new intersection than either of the jogged intersections (both Existing and 2030 No Build).
• By constructing the Jefferson Road flyover, Alternative 5 removes north-south through traffic from Kanawha Turnpike.
• Under Alternative 5, delay and LOS at Jefferson Road/MacCorkle Avenue are worse than for Alternative 1 (though still acceptable). The Jefferson Road/Kanawha Turnpike intersection(s) – either the existing jogged intersections or the single reconfigured intersection in Alternative 1 – have a metering effect on the northbound Jefferson Road approach at MacCorkle Avenue. Under Alternative 5, this metering or “gating” effect is removed; the northbound approach demand volumes are more peaked, so the overall operations at this one intersection are a little worse under Alternative 5 than for Alternative 1.
The traffic simulation model originally developed in 2010 for the evaluation of improvement alternatives was updated for this subsequent study. The updated model included 2014 intersection turning movement counts and train crossing data. For the design alternatives evaluated (Alternative 1, Alternative 5, and No Build), the following performance measures were obtained from the model and compared:
• Average travel times over defined roadway segments • Average signalized intersection delay • Maximum vehicle queue lengths
In summary, the following conclusions from the simulation of traffic conditions under the design alternatives were reached:
• Compared with the No Build scenario, peak period travel times in the Jefferson Road corridor were lower for Alternative 1 and lowest for Alternative 5. This is due to the
ii

JEFFERSON ROAD IMPROVEMENTS TRAFFIC ANALYSIS STATE PROJECT U320-601-0.00 03
simplification of the Jefferson Road/Kanawha Turnpike offset or “jogged” intersection in Alternative 1 or the elimination of this intersection in Alternative 5. Travel times are especially reduced for the north-south Jefferson Road trip and for the westbound Kanawha Turnpike-to-southbound Jefferson Road trip.
• Though computed differently, results from the comparison of signalized intersection delays from the simulation model are similar to the results achieved in the capacity and LOS analysis. Simplification of the Jefferson Road/Kanawha Turnpike intersection under Alternative 1 produces lower, acceptable delays when compared to the No Build, including those times when there are one or two train crossings during the peak period. For Alternative 5, the delays are significantly lower than for the No Build or Alternative 1, as this intersection would handle much less traffic.
• Most of the queueing problems that currently exist would be eliminated with either Alternative 1 or Alternative 5. Even the queue length on northbound Jefferson Road at MacCorkle Avenue would be reduced, as the widening of Jefferson Road would provide more queue storage.
Widening Jefferson Road would have little discernable impact on MacCorkle Avenue. Congestion at the current Jefferson Road/Kanawha Turnpike intersection does have a metering effect on the northbound Jefferson Road approach at MacCorkle Avenue; this metering effect would be reduced under Alternative 1 or eliminated under Alternative 5, which means that there would be a greater traffic “surge” on this approach leg during peak periods and the intersection might actually perform a little worse under Alternative 5. However, the overall effects of Alterative 5 on traffic flow along MacCorkle Boulevard would be negligible.
Construction of the RHL Boulevard Extension and its intersection with Jefferson Road would not adversely impact traffic conditions along Jefferson Road if Jefferson Road is widened to four lanes all the way from MacCorkle Avenue to US 119. Constructing the RHL Boulevard Extension actually improves traffic conditions at the US 119 interchange with Jefferson Road by diverting some of the northbound traffic away from this location.
iii

JEFFERSON ROAD IMPROVEMENTS TRAFFIC ANALYSIS STATE PROJECT U320-601-0.00 03
1.0 INTRODUCTION
Jefferson Road (WV 601) provides an important connection between Interstate 64 and US 119 in South Charleston, West Virginia. Interstate 64 and US 119 (also referred to as Corridor G) are heavily traveled major routes that connect the Charleston area with Kentucky to the west. Additionally, US 119 has become a major retail corridor, placing an additional demand for connectivity with Interstate 64.
Jefferson Road is functionally classified as an Urban Minor Arterial and currently is identified as a Congested Corridor in the Regional Intergovernmental Council’s 2040 Long Range Transportation Plan. Without improvement, congestion will become increasingly worse, particularly with anticipated future growth in the US 119 corridor.
1.1 PREVIOUS STUDIES
Two previous studies have been conducted that have involved the identification and evaluation of preliminary alternatives. In 2004, the West Virginia Department of Transportation, Division of Highways (WVDOH) conducted a study of potential alternatives for improving Jefferson Road. This included the intersection with Kanawha Turnpike, which in its current configuration consists of a pair of offset intersections. Six alternatives were evaluated from the engineering and cost perspective. No operational analyses of these alternatives were performed as part of the initial study.
In 2010, a subsequent study was initiated for the purpose of conducting more detailed analyses of alternatives. Those analyses included traffic operational analyses. The results of those analyses were documented in the Jefferson Road Traffic Simulation Study Final Report, which was submitted in January 2013. The Jefferson Road Traffic Simulation Study, Addendum to the Final Report: Alternatives 5 and 6, was submitted in March 2013. Among the alternatives studied, two were selected (Alternative 1 and Alterative 5) for further evaluation, upon which the selection of a preferred alternative could be made.
1.2 OBJECTIVES
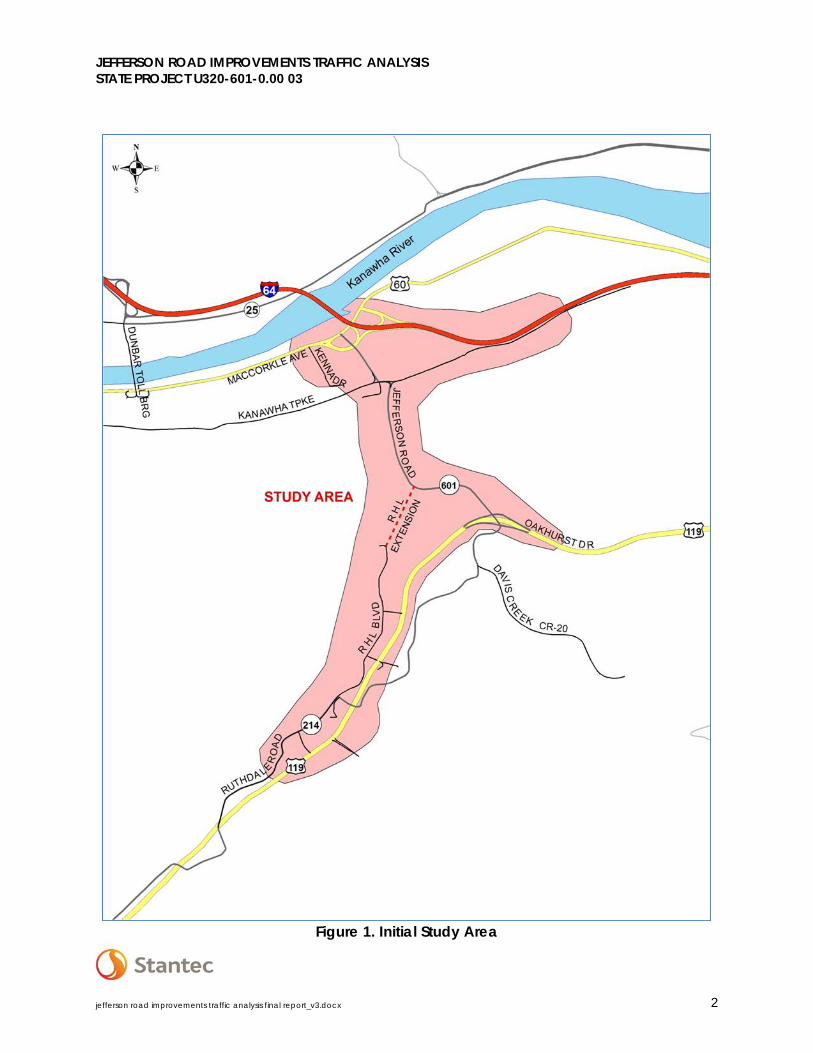
This study is part of the next phase of the project development process for the preferred improvement to Jefferson Road from MacCorkle Avenue (US 60) to US 119 at Oakhurst Drive. A map of the original study area is shown in Figure 1. The previous study incorporated the planned extension of RHL Boulevard from its current terminus at the South Charleston Ice Center to Jefferson Road near Kramer Street. This analysis examines both the inclusion and exclusion of the RHL Boulevard Extension with Alternative 1; for Alternative 5, it was assumed that the RHL Boulevard Extension would be completed. Alternative 1 was evaluated with and without RHL Boulevard Extension because it was initially considered as an interim step to Alternative 5.
jefferson road improvements traffic analysis final report_v3.docx 1
JEFFERSON ROAD IMPROVEMENTS TRAFFIC ANALYSIS STATE PROJECT U320-601-0.00 03
Figure 1. Initial Study Area
jefferson road improvements traffic analysis final report_v3.docx 2

JEFFERSON ROAD IMPROVEMENTS TRAFFIC ANALYSIS STATE PROJECT U320-601-0.00 03
The objectives of the Jefferson Road Improvements Traffic Analysis were to:
• Update information in the traffic simulation models developed for the previous study, including information regarding train crossings of Jefferson Road near Kanawha Turnpike;
• Update the assessment of current traffic conditions and projected traffic conditions associated with Alternatives 1 and 5 using these simulation models;
• Perform intersection capacity and Level-of-Service (LOS) analyses of Alternatives 1 and 5 based on methods prescribed in the 2010 Highway Capacity Manual; and
• Develop related design criteria – specifically, intersection approach geometry – for Alternatives 1 and 5.
2.0 DATA COLLECTION
2.1 INTERSECTION TURNING MOVEMENT COUNTS
Peak hour intersection turning movement counts had been collected for the previous study, but it was determined that new counts should be collected for this next phase of study to ensure that the more current traffic demand and travel patterns were being reflected. Turning movement counts were collected in October 2014 at the following locations:
1. MacCorkle Avenue at Kenna Drive 2. MacCorkle Avenue at I-64 eastbound ramps 3. MacCorkle Avenue at Jefferson Road (WV 601) 4. MacCorkle Avenue at I-64 westbound ramps 5. Jefferson Road at Bob Evans Restaurant access 6. Jefferson Road at McDonald’s Restaurant access 7. Jefferson Road at South Charleston Community Center north access 8. Jefferson Road at South Charleston Community Center south access 9. Jefferson Road at Washington Street 10. Jefferson Road at Pennsylvania Avenue 11. Jefferson Road at Kanawha Turnpike/Mathias Lane 12. Jefferson Road at Kanawha Turnpike 13. Jefferson Road at Kramer Street 14. Jefferson Road at US 119 southbound ramps 15. Jefferson Road at US 119 northbound ramps/Oakhurst Drive
jefferson road improvements traffic analysis final report_v3.docx 3
JEFFERSON ROAD IMPROVEMENTS TRAFFIC ANALYSIS STATE PROJECT U320-601-0.00 03
2.2 TRAIN CROSSING DATA
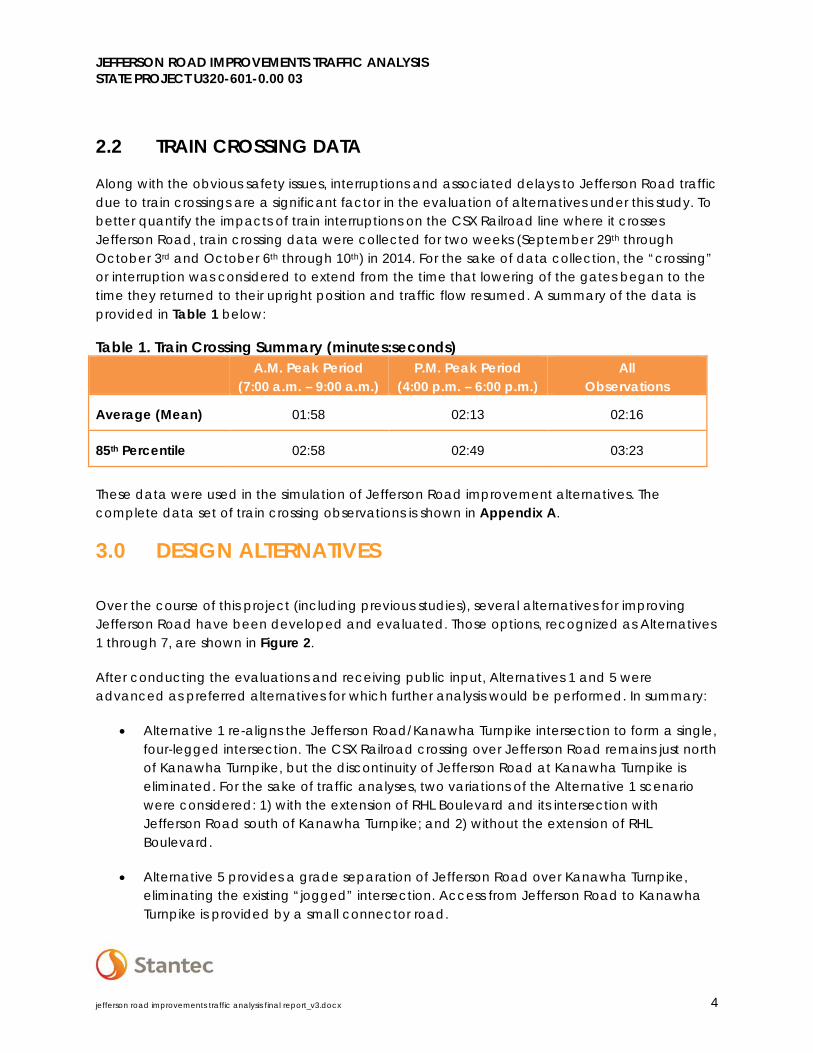
Along with the obvious safety issues, interruptions and associated delays to Jefferson Road traffic due to train crossings are a significant factor in the evaluation of alternatives under this study. To better quantify the impacts of train interruptions on the CSX Railroad line where it crosses Jefferson Road, train crossing data were collected for two weeks (September 29th through October 3rd and October 6th through 10th) in 2014. For the sake of data collection, the “crossing” or interruption was considered to extend from the time that lowering of the gates began to the time they returned to their upright position and traffic flow resumed. A summary of the data is provided in Table 1 below:
Table 1. Train Crossing Summary (minutes:seconds) A.M. Peak Period
(7:00 a.m. – 9:00 a.m.) P.M. Peak Period
(4:00 p.m. – 6:00 p.m.) All
Observations
Average (Mean) 01:58 02:13 02:16
85th Percentile 02:58 02:49 03:23
These data were used in the simulation of Jefferson Road improvement alternatives. The complete data set of train crossing observations is shown in Appendix A.
3.0 DESIGN ALTERNATIVES
Over the course of this project (including previous studies), several alternatives for improving Jefferson Road have been developed and evaluated. Those options, recognized as Alternatives 1 through 7, are shown in Figure 2.
After conducting the evaluations and receiving public input, Alternatives 1 and 5 were advanced as preferred alternatives for which further analysis would be performed. In summary:
• Alternative 1 re-aligns the Jefferson Road/Kanawha Turnpike intersection to form a single, four-legged intersection. The CSX Railroad crossing over Jefferson Road remains just north of Kanawha Turnpike, but the discontinuity of Jefferson Road at Kanawha Turnpike is eliminated. For the sake of traffic analyses, two variations of the Alternative 1 scenario were considered: 1) with the extension of RHL Boulevard and its intersection with Jefferson Road south of Kanawha Turnpike; and 2) without the extension of RHL Boulevard.
• Alternative 5 provides a grade separation of Jefferson Road over Kanawha Turnpike, eliminating the existing “jogged” intersection. Access from Jefferson Road to Kanawha Turnpike is provided by a small connector road.
jefferson road improvements traffic analysis final report_v3.docx 4

JEFFERSON ROAD IMPROVEMENTS TRAFFIC ANALYSIS STATE PROJECT U320-601-0.00 03
Figure 2. Jefferson Road Design Alternatives
jefferson road improvements traffic analysis final report_v3.docx 5
JEFFERSON ROAD IMPROVEMENTS TRAFFIC ANALYSIS STATE PROJECT U320-601-0.00 03
5.0 ANALYSES AND RESULTS
A combination of tools was used to evaluate anticipated traffic impacts associated with Alternatives 1 and 5. Methods prescribed in the 2010 Highway Capacity Manual (HCM) were used to perform capacity analyses of both signalized and key unsignalized intersections, from which average control delay and level of service were determined. As was done in the preceding analysis, TransModeler® traffic simulation software by Caliper© Corporation was used to simulate and quantify anticipated traffic conditions for the entire Jefferson Road corridor; specifically, average travel speeds, intersection approach queue lengths, and signalized intersection delays. The simulation software also was used to model the impacts of train crossings on corridor traffic conditions, which the HCM methods cannot do.
Traffic analyses were conducted for representative weekday A.M. and P.M. peak hours; the peak 60 minutes typically occur sometime between 7:00 a.m. and 9:00 a.m. on weekday mornings and between 4:00 p.m. and 6:00 p.m. in the evenings.
For A.M. and P.M. peak hours, the following alternative scenarios were evaluated:
• Existing conditions (based on 2014 traffic demand data)
• Future No Build (Year 2030)
• Alternative 1 (Year 2030) with and without construction of the RHL Boulevard Extension
• Alternative 5 (Year 2030) with construction of the RHL Boulevard Extension
Year 2030 demand volume forecasts were developed during the previous comprehensive study of alternatives. The forecasts were developed using the Charleston Regional Intergovernmental Council (RIC) travel demand model. Growth rates were developed by comparing base year and year 2030 RIC model traffic projections; the growth rates were applied to traffic volumes from the base year traffic simulation model that was developed for the previous study. The year 2030 volumes included traffic associated with the new Kanawha Valley Technical Community College campus located at the West Virginia Regional Technology Park on Kanawha Turnpike east of Jefferson Road.
5.1 CAPACITY ANALYSIS
Capacity and level-of-service analyses were performed for at-grade intersections – signalized and unsignalized – according to methods in the 2010 Highway Capacity Manual. For these intersections, average control delay was computed and corresponding levels of service were determined. Control delay is defined in the HCM as the delay associated with vehicles slowing in advance of an intersection, the time spent stopped on an intersection approach, the time spent as vehicles move up in the queue, and the time needed for vehicles to accelerate to their desired speed.
jefferson road improvements traffic analysis final report_v3.docx 6

JEFFERSON ROAD IMPROVEMENTS TRAFFIC ANALYSIS STATE PROJECT U320-601-0.00 03
Level-of-service thresholds for signalized and unsignalized intersections are shown in Table 2. According to the HCM, LOS criteria for unsignalized intersections are different from the criteria for signalized intersections primarily because traveler perceptions differ between these two intersection types. The expectation is that a signalized intersection is designed to carry higher traffic volumes and therefore will experience higher delay than unsignalized intersections.
Table 2. Intersection Level-of-Service Thresholds
Signalized UnsignalizedA < 10 < 10B > 10 - 20 > 10 - 15C > 20 - 35 > 15 - 25D > 35 - 55 > 25 - 35E > 55 - 80 > 35 - 50F > 80 > 50
Source: 2010 Highway Capacity Manual
Control Delay (sec/veh)LOS
For signalized intersections in the study area, average control delay and levels of service for the A.M. peak period are provided in Table 3. The Access Road and Connector Road associated with Alternative 5 are shown in Figure 3. The new Access Road was assumed to be the existing Jefferson Road section that would remain and provide local accesses to the State Police facility and other properties that it currently serves. The intersection of the Access Road with Jefferson Road was assumed to be located between Washington Street and the I-64 eastbound loop ramps.
Table 3. A.M. Peak Control Delay and Level of Service for Signalized Intersections Delay LOS Delay LOS Delay LOS Delay LOS Delay LOS
MacCorkle Avenue at:Kenna Drive 2.7 A 4.5 A 4.3 A 3.9 A 3.9 A
I-64 EB 8.7 A 9.6 A 8.1 A 5.8 A 8.4 AWV 601 ( Jefferson Road) 21.6 C 25.3 C 11.8 B 11.7 B 16.6 B
I-64 WB 38.5 D 29.0 C 27.6 C 25.5 C 23.3 CWV 601 (Jefferson Road) at:
Access Road 5.0 A
Kanawha Turnpike/Mathias Lane 99.8 F 154.1 F 33.3 C 33.0 CKanawha Turnpike 109.1 F 102.6 F 24.4 C
Connector Road 24.0 CRHL Boulevard 6.5 A 7.4 AOakhurst Drive 44.1 D 46.1 D 39.0 D 46.7 D 44.1 D
Alt 1 No RHL Alt 5Intersection
Existing No Build Alt 1 RHL
Similarly, A.M. peak period average control delay and levels of service for unsignalized intersections are shown in Table 4. It should be noted that the performance measures in Table 4 are for the STOP-controlled minor street approach for these locations, each of which is a T-intersection.
jefferson road improvements traffic analysis final report_v3.docx 7

JEFFERSON ROAD IMPROVEMENTS TRAFFIC ANALYSIS STATE PROJECT U320-601-0.00 03
Figure 3. New or Modified Traffic Signals - Alternative 5
Table 4. A.M. Peak Control Delay and Level of Service for Unsignalized Intersections Delay LOS Delay LOS Delay LOS Delay LOS Delay LOS
WV 601 (Jefferson Road) at:Bob Evans Access 15.8 C 17.7 C 17.5 C 17.5 C 18.0 C
McDonalds Access 15.5 C 16.7 C 17.5 C 17.5 C 17.7 CSouth Charleston Community
Center North Access 21.2 C 27.8 D 24.1 C 23.7 C 10.8 BSouth Charleston Community
Center South Access 15.0 B 33.1 D 14.7 B 14.4 BWashington Street 14.9 B 15.8 C 10.6 B 10.3 B
Pennslyvania Avenue 12.3 B 12.7 B 10.8 B 10.4 B 12.6 BKramer Street 23.2 C 43.2 E 25.0 C 30.7 D 11.0 B
US 119 Southbound 16.7 C 19.7 C 15.2 C 19.5 C 16.2 C
Alt 1 RHL
* Control delay on the minor approach
Alt 1 No RHL Alt 5Intersection
Existing No Build
For signalized intersections in the study area, average control delay and levels of service for the P.M. peak period are provided in Table 5. P.M. peak period average control delay and levels of service for unsignalized intersections are shown in Table 6.
Summary tables of control delay and Level of Service by lane group for each intersection approach are located in Appendix B. Output reports from the individual HCS analyses are located in Appendix C.
jefferson road improvements traffic analysis final report_v3.docx 8

JEFFERSON ROAD IMPROVEMENTS TRAFFIC ANALYSIS STATE PROJECT U320-601-0.00 03
Table 5. P.M. Peak Control Delay and Level of Service for Signalized Intersections Delay LOS Delay LOS Delay LOS Delay LOS Delay LOS
MacCorkle Avenue at:Kenna Drive 4.9 A 4.8 A 7.3 A 7.3 A 4.7 A
I-64 EB 5.1 A 8.1 A 6.8 A 6.8 A 6.2 AWV 601 ( Jefferson Road) 49.2 D 80.3 F 18.1 B 18.3 C 20.8 C
I-64 WB 48.2 D 53.2 D 50.8 D 50.8 D 52.4 DWV 601 (Jefferson Road) at:
Access Road 8.9 A
Kanawha Turnpike/Mathias Lane 60.9 E 174.2 F 42.8 D 49.8 D 29.4 CKanawha Turnpike 55.1 E 169.0 F
Connector Road 21.8 CRHL Boulevard 17.8 B 16.0 BOakhurst Drive 44.2 D 69.7 E 35.2 D 89.2 F 43.8 D
IntersectionNo Build Alt 1 RHL Alt 1 No RHL Alt 5 Existing
Table 6. P.M. Peak Control Delay and Level of Service for Unsignalized Intersections
Delay LOS Delay LOS Delay LOS Delay LOS Delay LOSWV 601 (Jefferson Road) at:
Bob Evans Access 19.8 C 36.5 E 19.3 C 19.3 C 35.2 EMcDonalds Access 20.4 C 34.5 D 19.2 C 19.2 C 22.2 C
South Charleston Community Center North Access 16.8 C 53.8 F 18.4 C 18.4 C 11.9 B
South Charleston Community Center South Access 12.5 B 18.1 C 12.7 B 11.6 B
Washington Street 15.8 C 14.5 B 12.2 B 12.2 BPennslyvania Avenue 13.1 B 18.8 C 14.7 B 15.0 C 15.3 C
Kramer Street 94.4 F 132.9 F 52.1 F 70.7 F 12.9 BUS 119 Southbound 24.3 C 98.6 F 148.3 F 148.3 F 31.4 D
Alt 5Intersection
Existing No Build Alt 1 RHL Alt 1 No RHL
* Control delay on the minor approach
Capacity Analysis Conclusions
From the capacity and LOS analyses, the following conclusions can be drawn:
• When comparing the existing scenario to the year 2030 No Build scenario, average control delay will increase and levels of service will worsen at most of the intersections in the study area.
• The Jefferson Road intersections with Kanawha Turnpike will remain as the problem spot in the corridor; average delay at these two intersections will increase significantly between now and 2030, based on projected future traffic demands.
• Alternatives 1 and 5 both would yield improved traffic conditions at study area intersections compared to the No Build scenario.
• Alternative 1 condenses the two “jogged” intersections of Jefferson Road with Kanawha Turnpike into a single, four-legged intersection (which is labeled as the “Kanawha Turnpike/Mathias Lane” intersection with Jefferson Road in Tables 3 and 5). Delay and LOS are considerably better at this new intersection than either of the jogged intersections (both Existing and 2030 No Build).
jefferson road improvements traffic analysis final report_v3.docx 9
JEFFERSON ROAD IMPROVEMENTS TRAFFIC ANALYSIS STATE PROJECT U320-601-0.00 03
• The HCM methodology is not capable of analyzing conditions when a train crossing interrupts traffic flow on Jefferson Road. All of the results presented in Tables 3 through 6 are for “no train crossing” scenarios.
• By constructing the Jefferson Road flyover, Alternative 5 removes north-south through traffic from Kanawha Turnpike. Currently (and for the 2030 No Build scenario), north-south traffic follows a left-then-right movement through the Kanawha Turnpike intersections. Under Alternative 1, this trip pattern is simplified to a through movement at a single intersection. Under Alternative 5, north-south traffic passes over Kanawha Turnpike; the residual traffic passing through the Kanawha Turnpike intersection with the connector to Jefferson Road is either east-west through traffic or “turning” traffic between Jefferson Road and Kanawha Turnpike.
• Under Alternative 5, delay and LOS at Jefferson Road/MacCorkle Avenue are worse than for Alternative 1 (though still acceptable). The Jefferson Road/Kanawha Turnpike intersection(s) – either the existing jogged intersections or the single reconfigured intersection in Alternative 1 – have a metering effect on the northbound Jefferson Road approach at MacCorkle Avenue. Under Alternative 5, this metering or “gating” effect is removed; the northbound approach demand volumes are more peaked, so the overall operations at this one intersection are a little worse under Alternative 5 than for Alternative 1.
• Construction of the RHL Boulevard Extension and its intersection with Jefferson Road would not adversely impact traffic conditions along Jefferson Road if Jefferson Road is widened to four lanes all the way from MacCorkle Avenue to US 119. Constructing the RHL Boulevard Extension actually improves traffic conditions at the US 119 interchange with Jefferson Road by diverting some of the northbound traffic away from this location.
• Especially during the year 2030 P.M. peak, LOS E or F on STOP-controlled, minor street approaches to Jefferson Road could be experienced, primarily due to heavy traffic volumes along Jefferson Road. While not desirable, this is less significant when compared to the movement of traffic along Jefferson Road. This condition, which should be confined to the P.M. peak, will be worse if Jefferson Road is not widened.
5.2 TRAFFIC SIMULATION
A microscopic computer traffic simulation model was developed for the initial evaluation of alternatives for Jefferson Road improvements. This initial work was performed from 2011 to 2013. A discussion of the calibration of the base year model is provided in Appendix D. Simulations were run for the A.M. peak hour (7:00 to 8:00) and P.M. peak hour (5:00 to 6:00) for a 2010 base year and 2030 forecast year. Performance measures obtained from the model and used for evaluation/comparison of alternatives included:
jefferson road improvements traffic analysis final report_v3.docx 10

JEFFERSON ROAD IMPROVEMENTS TRAFFIC ANALYSIS STATE PROJECT U320-601-0.00 03
• Average travel times over defined roadway segments • Average signalized intersection delay • Maximum vehicle queue lengths
The simulation software is beneficial to the analysis in that it can model the impacts of train crossings during peak periods, something that the HCM methodology can’t do.
For this phase of the project development process, the earlier traffic simulation model was updated and recalibrated. The updated model included recently collected intersection turning movement counts and train crossing data.
As was shown in Table 1, for the two-week period during which the data were collected, the average interruption to traffic due to train crossings was just under two minutes (01:58) during the A.M. peak and a little over two minutes (02:13) during the P.M. peak. There was a little more variability in the duration of crossing for the morning peak than the afternoon peak – the 85th-peercentile observations were 02:58 (compared to the average of 01:58) and 02:49 (compared to the average of 02:13), respectively.
Upon examination of the train crossing data, it was observed that there were sometimes two crossings during the peak period, while at other times there was only one. On a few days there was no crossing activity during the morning peak period, but there was always at least one crossing during the afternoon peak.
To quantify and compare the impacts of simulated train crossings, models were run and each alternative was evaluated for three scenarios:
• No train crossings during the 60-minute simulation period • One train crossing of average duration for the simulation period • Two train crossings of average duration for the simulation period
The simulation models indicated that traffic queues returned to normal conditions within two to three subsequent cycles following an interruption due to train crossing.
Average Travel Times
Consistent with the previous alternatives evaluation, average travel times were predicted and compared among alternatives for key traffic patterns within the study area network:
1. The Jefferson Road through movement (both northbound and southbound) between MacCorkle Avenue and US 119;
2. The section of Jefferson Road and Kanawha Turnpike to the east that accommodates travel between the West Virginia Regional Technology Park and US 119; and
3. Kanawha Turnpike passing through the intersection with Jefferson Road.
jefferson road improvements traffic analysis final report_v3.docx 11

JEFFERSON ROAD IMPROVEMENTS TRAFFIC ANALYSIS STATE PROJECT U320-601-0.00 03
4. MacCorkle Avenue (both eastbound and westbound) from Kenna Drive through the I-64 interchange.
A map of the network with these segments highlighted is shown as Figure 4. Summaries of the comparison of average travel times among the alternatives are shown in Table 7 for the A.M. peak and in Table 8 for the P.M. peak.
Figure 4. Travel Time Route Segments
jefferson road improvements traffic analysis final report_v3.docx 12

JEFFERSON ROAD IMPROVEMENTS TRAFFIC ANALYSIS STATE PROJECT U320-601-0.00 03
Table 7. A.M. Peak Route Segment Average Travel Times 2030 Alt 5
No Train 1 Train 2 Trains No Train 1 Train 2 Trains No Train 1 Train 2 Trains No Train 1 Train 2 Trains No TrainMacCorkle WB 0.9 0.9 0.9 1.0 1.0 1.0 0.9 0.9 0.9 0.9 0.9 0.9 0.9MacCorkle EB 1.1 1.1 1.1 1.1 1.1 1.1 1.2 1.2 1.2 1.2 1.2 1.2 1.0Jefferson NB 3.6 3.6 3.9 7.9 7.6 6.6 3.3 3.4 7.7 3.7 3.2 3.8 2.6Jefferson SB 3.3 3.3 3.5 6.8 6.7 6.1 2.8 2.9 2.9 2.8 2.8 2.8 2.7Kanawha Turnpike WB 1.9 1.9 2.0 2.1 2.1 2.2 1.7 1.7 1.8 1.7 1.8 1.8 1.3Kanawha Turnpike EB 2.2 2.1 2.1 2.2 2.2 2.2 1.7 1.8 1.9 1.8 1.8 2.0 1.4WB Kanawha -> SB Jefferson 3.0 3.0 3.3 4.2 4.3 5.3 3.8 3.6 3.9 3.4 3.5 4.3 2.5NB Jefferson - EB Kanawha 2.7 2.7 2.7 6.2 5.9 4.7 2.6 2.8 3.0 2.6 2.6 3.1 2.6
2030 Alt 1 2030 Alt 1 - No RHLAM Peak HourAverage Travel Times (min)
Existing 2030 No Build
Table 8. P.M. Peak Route Segment Average Travel Times 2030 Alt 5
No Train 1 Train 2 Trains No Train 1 Train 2 Trains No Train 1 Train 2 Trains No Train 1 Train 2 Trains No TrainMacCorkle WB 1.3 1.2 1.3 1.5 1.5 1.4 1.2 1.2 1.2 1.2 1.2 1.2 1.2MacCorkle EB 1.4 1.4 1.4 1.2 1.2 1.2 1.4 1.4 1.4 1.4 1.4 1.4 1.3Jefferson NB 4.4 5.1 5.6 6.4 5.8 5.9 3.5 3.6 3.8 3.3 3.4 3.5 2.9Jefferson SB 4.3 4.3 4.7 6.3 6.8 7.1 3.2 3.3 3.4 2.9 3.0 3.2 2.8Kanawha Turnpike WB 2.1 2.2 2.3 3.9 4.3 4.6 1.9 2.1 2.1 1.9 2.1 2.1 1.2Kanawha Turnpike EB 2.0 2.0 2.0 2.6 2.5 2.5 1.8 1.8 1.8 1.8 1.8 1.8 1.5WB Kanawha -> SB Jefferson 4.1 5.0 5.3 10.1 10.6 11.2 4.2 4.3 4.1 3.7 3.9 3.7 2.5NB Jefferson - EB Kanawha 2.9 3.2 3.5 4.5 4.1 4.0 2.8 2.8 2.9 2.6 2.7 2.7 2.7
2030 Alt 1 2030 Alt 1 - No RHLPM Peak HourAverage Travel Times (min)
2030 No BuildExisting
Average Intersection Delay
Average signalized intersection delays (in seconds per vehicle) also were obtained from the simulation model for study area intersections. The TransModeler software defines intersection delay as the delay experienced approaching and executing the movement through the intersection – either straight or turning - averaged over all vehicles approaching or making that movement during the analysis period. Intersection delay from the simulation is similar to the control delay computed by the Highway Capacity Manual methodology, but technically it is computed differently. Thus, comparing results from the HCS vs. simulation will not give the exact same results, though they should be in general agreement.
The simulation software can quantify the impacts of train crossings on intersection delay; namely, the two Kanawha Turnpike intersections with Jefferson Road. As with the travel times, the simulation models were used to compare delay impacts for zero, one and two simulated train crossings during the A.M. and P.M. peak period for the various design alternatives. Summaries of the comparison of average intersection delays among the alternatives are shown in Table 9 for the A.M. peak and in Table 10 for the P.M. peak.
Table 9. A.M. Peak Average Intersection Delay 2030Alt 5
No Train 1 Train 2 Trains No Train 1 Train 2 Trains No Train 1 Train 2 Trains No Train 1 Train 2 Trains No TrainJefferson/MacCorkle 28.1 27.9 28.2 20.1 19.2 20.2 14.3 14.3 14.4 13.9 14.1 14.4 10.7Jefferson/Access 3.8SB Jefferson/Kanawha/Mathias 25.0 32.2 34.6 60.2 57.6 64.5 40.6 45.0 64.3 34.4 38.6 55.8NB Jefferson/Kanawha 35.6 36.8 38.5 95.2 92.3 82.8Kanawha/Connector 22.1Jefferson/Connector 16.1Jefferson/RHL 9.5 9.5 9.9 9.8Jefferson/Oakhurst 28.4 29.1 28.2 29.8 29.8 30.2 28.2 27.9 28.0 29.6 29.9 29.9 27.8
AM Peak HourAverage Intersection Delay (sec/veh)
2030 Alt 1 - No RHL2030 Alt 12030 No BuildExisting
jefferson road improvements traffic analysis final report_v3.docx 13

JEFFERSON ROAD IMPROVEMENTS TRAFFIC ANALYSIS STATE PROJECT U320-601-0.00 03
Table 10. P.M. Peak Average Intersection Delay 2030Alt 5
No Train 1 Train 2 Trains No Train 1 Train 2 Trains No Train 1 Train 2 Trains No Train 1 Train 2 Trains No TrainJefferson/MacCorkle 31.7 31.3 32.2 25.8 26.2 25.5 12.6 12.5 12.5 12.2 12.1 12.3 10.7Jefferson/Access 5.5SB Jefferson/Kanawha/Mathias 35.8 32.2 40.6 63.2 68.8 71.1 57.1 64.6 66.7 46.8 53.2 56.1NB Jefferson/Kanawha 61.3 81.8 92.6 138.2 140.2 145.6Kanawha/Connector 20.9Jefferson/Connector 16.7Jefferson/RHL 24.9 23.1 23.1 15.1Jefferson/Oakhurst 30.7 30.7 31.5 39.3 39.4 36.6 31.1 30.1 31.3 37.0 37.1 36.6 31.7
PM Peak HourAverage Intersection Delay (sec/veh)
Existing 2030 Alt 1 2030 Alt 1 - No RHL2030 No Build
The intersection delay results support the following conclusions:
• Alternative 1 results in lower delays for a single Jefferson Road/Kanawha Turnpike intersection than for either of the “jogged” intersections (when comparing the 2030 “No Build” scenario with Alternative 1 (with or without the construction of the RHL Boulevard Extension).
• Alternative 5 eliminates the Jefferson Road/Kanawha Turnpike intersection(s); the Kanawha Turnpike/Jefferson Road Connector intersection would accommodate residual turning traffic between Jefferson Road and Kanawha Turnpike and would operate with minimal average delay.
• Alternative 1 goes a long way toward improving peak hour congestion at Jefferson Road and Kanawha Turnpike, even where there are two train crossings during the peak hour. Alternative 5 goes even further, virtually eliminating the intersection of these two roads except for the local connector road.
Maximum Queues
Maximum queue lengths from the model simulation runs were recorded for each approach of the key intersections under analysis along Jefferson Road. Those approaches are:
• Northbound Jefferson Road at MacCorkle Avenue • Southbound Jefferson Road at Kanawha Turnpike • Northbound Jefferson Road at Kanawha Turnpike • Westbound Kanawha Turnpike at Jefferson Road • Eastbound Kanawha Turnpike at Jefferson Road • Northbound Connector at Kanawha Turnpike (Alternative 5 only) • Eastbound Kanawha Turnpike at Connector (Alternative 5 only) • Westbound Kanawha Turnpike at Connector (Alternative 5 only) • Northbound Jefferson Road at Connector (Alternative 5 only) • Southbound Jefferson Road at Connector (Alternative 5 only) • Eastbound Jefferson Road Connector at Jefferson Road (Alternative 5 only) • Southbound Jefferson Road at RHL Boulevard Extension • Northbound Jefferson Road at RHL Boulevard Extension • RHL Boulevard Extension at Jefferson Road
jefferson road improvements traffic analysis final report_v3.docx 14
JEFFERSON ROAD IMPROVEMENTS TRAFFIC ANALYSIS STATE PROJECT U320-601-0.00 03
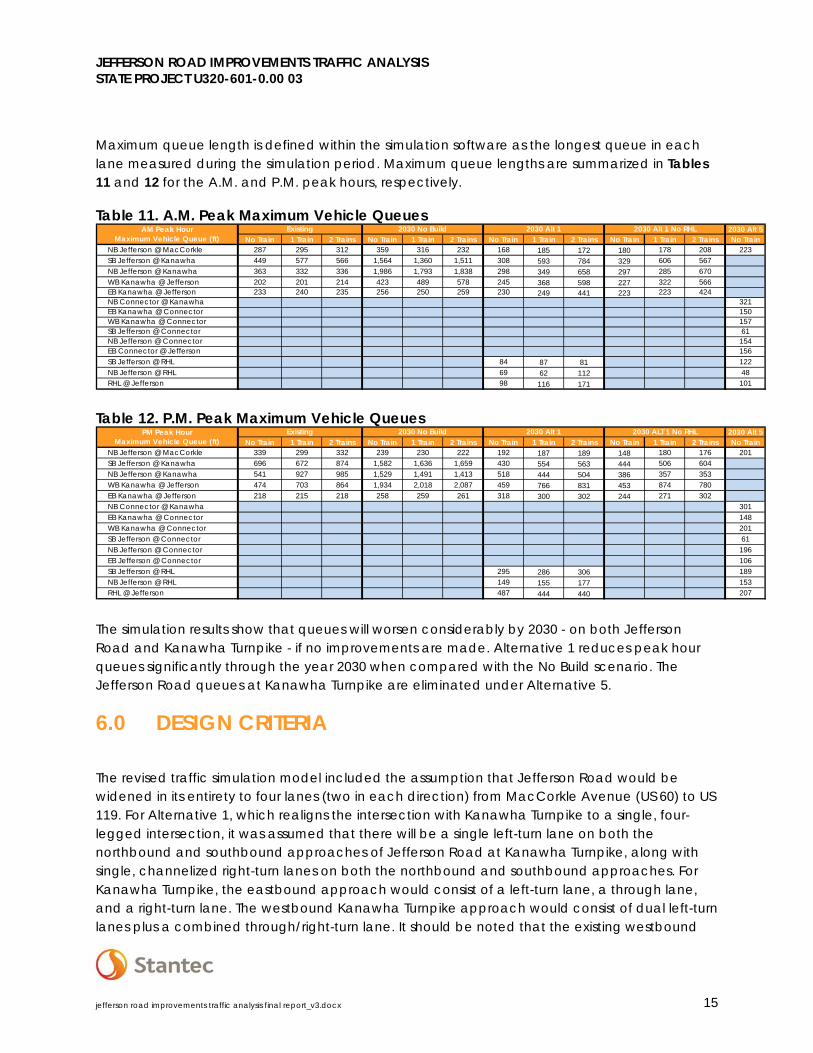
Maximum queue length is defined within the simulation software as the longest queue in each lane measured during the simulation period. Maximum queue lengths are summarized in Tables 11 and 12 for the A.M. and P.M. peak hours, respectively.
Table 11. A.M. Peak Maximum Vehicle Queues 2030 Alt 5
No Train 1 Train 2 Trains No Train 1 Train 2 Trains No Train 1 Train 2 Trains No Train 1 Train 2 Trains No TrainNB Jefferson @ MacCorkle 287 295 312 359 316 232 168 185 172 180 178 208 223SB Jefferson @ Kanawha 449 577 566 1,564 1,360 1,511 308 593 784 329 606 567NB Jefferson @ Kanawha 363 332 336 1,986 1,793 1,838 298 349 658 297 285 670WB Kanawha @ Jefferson 202 201 214 423 489 578 245 368 598 227 322 566EB Kanawha @ Jefferson 233 240 235 256 250 259 230 249 441 223 223 424NB Connector @ Kanawha 321EB Kanawha @ Connector 150WB Kanawha @ Connector 157SB Jefferson @ Connector 61NB Jefferson @ Connector 154EB Connector @ Jefferson 156SB Jefferson @ RHL 84 87 81 122NB Jefferson @ RHL 69 62 112 48RHL @ Jefferson 98 116 171 101
AM Peak HourMaximum Vehicle Queue (ft)
Existing 2030 Alt 12030 No Build 2030 Alt 1 No RHL
Table 12. P.M. Peak Maximum Vehicle Queues
2030 Alt 5No Train 1 Train 2 Trains No Train 1 Train 2 Trains No Train 1 Train 2 Trains No Train 1 Train 2 Trains No Train
NB Jefferson @ MacCorkle 339 299 332 239 230 222 192 187 189 148 180 176 201SB Jefferson @ Kanawha 696 672 874 1,582 1,636 1,659 430 554 563 444 506 604NB Jefferson @ Kanawha 541 927 985 1,529 1,491 1,413 518 444 504 386 357 353WB Kanawha @ Jefferson 474 703 864 1,934 2,018 2,087 459 766 831 453 874 780EB Kanawha @ Jefferson 218 215 218 258 259 261 318 300 302 244 271 302NB Connector @ Kanawha 301EB Kanawha @ Connector 148WB Kanawha @ Connector 201SB Jefferson @ Connector 61NB Jefferson @ Connector 196EB Jefferson @ Connector 106SB Jefferson @ RHL 295 286 306 189NB Jefferson @ RHL 149 155 177 153RHL @ Jefferson 487 444 440 207
PM Peak HourMaximum Vehicle Queue (ft)
2030 No BuildExisting 2030 Alt 1 2030 ALT 1 No RHL
The simulation results show that queues will worsen considerably by 2030 - on both Jefferson Road and Kanawha Turnpike - if no improvements are made. Alternative 1 reduces peak hour queues significantly through the year 2030 when compared with the No Build scenario. The Jefferson Road queues at Kanawha Turnpike are eliminated under Alternative 5.
6.0 DESIGN CRITERIA
The revised traffic simulation model included the assumption that Jefferson Road would be widened in its entirety to four lanes (two in each direction) from MacCorkle Avenue (US 60) to US 119. For Alternative 1, which realigns the intersection with Kanawha Turnpike to a single, four-legged intersection, it was assumed that there will be a single left-turn lane on both the northbound and southbound approaches of Jefferson Road at Kanawha Turnpike, along with single, channelized right-turn lanes on both the northbound and southbound approaches. For Kanawha Turnpike, the eastbound approach would consist of a left-turn lane, a through lane, and a right-turn lane. The westbound Kanawha Turnpike approach would consist of dual left-turn lanes plus a combined through/right-turn lane. It should be noted that the existing westbound
jefferson road improvements traffic analysis final report_v3.docx 15
JEFFERSON ROAD IMPROVEMENTS TRAFFIC ANALYSIS STATE PROJECT U320-601-0.00 03
Kanawha Turnpike approach contains only a single left-turn lane; due to the heavy westbound-to-southbound left-turn movement, dual left-turn lanes are recommended for the reconstructed intersection under Alternative 1.
The extension to RHL Boulevard was assumed to be constructed as a two-lane facility – one lane in each direction – that would intersect with Jefferson Road near Kramer Street. This was assumed to be a signalized intersection in the analyses. The Jefferson Road approaches would consist of two through lanes each in the northbound and southbound directions, plus a northbound left-turn lane and a southbound right-turn lane. RHL Boulevard would widen to two lanes at its approach to Jefferson Road – one left-turn lane and one-right-turn lane.
The intersection of the northbound US 119 exit at Jefferson Road/Oakhurst Drive currently consists of a single lane that widens to a left-turn lane and a right-turn lane at the intersection. This assumption was carried through the analyses. For the presumed “worst case” scenario (year 2030 traffic demand without the construction of the RHL Boulevard Extension), the simulation model predicted the maximum queue on the exit ramp to be 600 – 700 feet during peak periods. While significant, the simulation indicated that exiting traffic would be contained within the off ramp and should not spill back into the northbound through lanes of US 119. If the RHL Boulevard Extension is constructed, queues would be less, as some of the northbound traffic would divert to the RHL Boulevard Extension, bypassing the US 119/Jefferson Road interchange.
7.0 SUMMARY
In summary, this study has demonstrated that peak period traffic conditions along Jefferson Road will continue to worsen if no improvements are made. This is due to heavy travel along Jefferson Road as it connects major regional routes – Interstate 64 and US 60 (MacCorkle Avenue) to the north and US 119 (“Corridor G”) to the south. Future travel demands are projected to increase with increased development to the south of Jefferson Road.
At the core of the problem is the intersection of Jefferson Road with Kanawha Turnpike. Currently this exists as a pair of offset or “jogged” intersections; north-south through traffic on Jefferson Road must make a left-then-right movement at Kanawha Turnpike to continue this trip pattern. Exacerbating this condition is an active CSX Railroad crossing Jefferson Road just to the north of Kanawha Turnpike. One or two train crossings during peak traffic periods are a common event, which contributes to the congestion at this location.
Alternative 1 realigns Jefferson Road and Kanawha Turnpike into a single, four-legged intersection. This option improves traffic congestion considerably, at least for now. The analyses showed that Alternative 1 should be sufficient to handle peak period travel in the corridor until year 2030, even with the current level of train crossing activity.
Alternative 5 provides a grade separation of Jefferson Road and Kanawha Turnpike, with the junction between the two provided via a local connector road. This option eliminates the
jefferson road improvements traffic analysis final report_v3.docx 16

JEFFERSON ROAD IMPROVEMENTS TRAFFIC ANALYSIS STATE PROJECT U320-601-0.00 03
congestion at Jefferson Road/Kanawha Turnpike; it also provides an added safety benefit by eliminating the at-grade railroad crossing for Jefferson Road. Alternative 5 should offer adequate peak period levels of service beyond the year 2030.
Both Alternatives 1 and 5 were assumed to be widened to four lanes from MacCorkle Avenue all the way to US 119. Alternative 1 was analyzed with and without the planned extension of RHL Boulevard to intersect with Jefferson Road near Kramer Street. This project was assumed to be in place for Alternative 5. The analyses demonstrated that construction of RHL Boulevard Extension will improve traffic congestion at US 119/Oakhurst Drive (the south side of the Jefferson Road interchange) by diverting some of the traffic away from this location.
jefferson road improvements traffic analysis final report_v3.docx 17

APPENDICES

JEFFERSON ROAD IMPROVEMENTS TRAFFIC ANALYSIS STATE PROJECT U320-601-0.00 03
TRAIN CROSSING DATA Appendix A
Table A 1. Train Crossing Data Summary
Date Gate Down Time Gate Up Time Duration
(hrs:min:sec) Crossing Direction
10/01/14 (Wed) 12:13:27 AM 12:17:02 AM 0:03:35 E→W 10/03/14 (Fri) 7:04:28 AM 7:07:37 AM 0:03:09 W→E 10/07/14 (Tue) 7:10:12 AM 7:12:25 AM 0:02:13 E→W 10/02/14 (Thu) 7:26:26 AM 7:30:13 AM 0:03:47 E→W 10/02/14 (Thu) 7:35:19 AM 7:36:05 AM 0:00:46 E→W 10/01/14 (Wed) 7:37:18 AM 7:40:13 AM 0:02:55 E→W 10/09/14 (Thu) 7:46:04 AM 7:46:37 AM 0:00:33 E→W 09/30/14 (Tue) 7:49:59 AM 7:52:17 AM 0:02:18 W→E 10/03/14 (Fri) 8:05:40 AM 8:08:06 AM 0:02:26 E→W 10/01/14 (Wed) 8:07:26 AM 8:07:57 AM 0:00:31 W→E 10/08/14 (Wed) 8:12:26 AM 8:15:08 AM 0:02:42 W→E 10/03/14 (Fri) 8:17:27 AM 8:19:17 AM 0:01:50 E→W 10/09/14 (Thu) 8:37:30 AM 8:39:21 AM 0:01:51 E→W 10/08/14 (Wed) 8:40:26 AM 8:40:57 AM 0:00:31 W→E 10/10/14 (Fri) 9:13:17 AM 9:13:45 AM 0:00:28 W→E 10/09/14 (Thu) 9:22:15 AM 9:22:44 AM 0:00:29 W→E 10/08/14 (Wed) 9:50:10 AM 9:50:42 AM 0:00:32 E→W 10/03/14 (Fri) 9:58:38 AM 9:59:00 AM 0:00:22 E→W 10/10/14 (Fri) 10:09:43 AM 10:10:16 AM 0:00:33 E→W 10/08/14 (Wed) 10:16:04 AM 10:16:29 AM 0:00:25 W→E 10/08/14 (Wed) 10:25:55 AM 10:26:19 AM 0:00:24 W→E 10/03/14 (Fri) 10:34:29 AM 10:36:02 AM 0:01:33 W→E 10/10/14 (Fri) 10:44:38 AM 10:46:22 AM 0:01:44 W→E 10/08/14 (Wed) 10:45:13 AM 10:46:53 AM 0:01:40 W→E 10/02/14 (Thu) 10:59:03 AM 11:01:41 AM 0:02:38 E→W 10/03/14 (Fri) 11:17:20 AM 11:17:51 AM 0:00:31 W→E 10/03/14 (Fri) 11:24:50 AM 11:25:23 AM 0:00:33 W→E 10/01/14 (Wed) 11:46:21 AM 11:48:27 AM 0:02:06 W→E 10/09/14 (Thu) 11:51:44 AM 11:55:01 AM 0:03:17 W→E 09/29/14 (Mon) 12:07:33 PM 12:11:48 PM 0:04:15 E→W 10/08/14 (Wed) 12:28:44 PM 12:32:21 PM 0:03:37 E→W 09/30/14 (Tue) 12:40:54 PM 12:42:49 PM 0:01:55 W→E 10/08/14 (Wed) 12:42:35 PM 12:44:45 PM 0:02:10 E→W 10/03/14 (Fri) 1:00:16 PM 1:03:55 PM 0:03:39 W→E
A.1

JEFFERSON ROAD IMPROVEMENTS TRAFFIC ANALYSIS STATE PROJECT U320-601-0.00 03
Date Gate Down Time Gate Up Time Duration
(hrs:min:sec) Crossing Direction
10/03/14 (Fri) 1:17:35 PM 1:18:16 PM 0:00:41 W→E 10/08/14 (Wed) 1:28:26 PM 1:32:19 PM 0:03:53 W→E 10/01/14 (Wed) 1:45:31 PM 1:47:46 PM 0:02:15 W→E 10/02/14 (Thu) 1:45:48 PM 1:47:22 PM 0:01:34 W→E 10/09/14 (Thu) 1:50:20 PM 1:52:42 PM 0:02:22 W→E 10/07/14 (Tue) 1:58:28 PM 2:00:02 PM 0:01:34 W→E 10/02/14 (Thu) 2:00:35 PM 2:03:28 PM 0:02:53 E→W 09/29/14 (Mon) 2:05:40 PM 2:08:30 PM 0:02:50 W→E 10/02/14 (Thu) 2:05:49 PM 2:08:27 PM 0:02:38 W→E 10/01/14 (Wed) 2:14:11 PM 2:16:36 PM 0:02:25 W→E 10/02/14 (Thu) 2:19:37 PM 2:23:24 PM 0:03:47 W→E 10/07/14 (Tue) 2:24:10 PM 2:29:20 PM 0:05:10 W→E 09/30/14 (Tue) 2:27:13 PM 2:29:46 PM 0:02:33 W→E 10/08/14 (Wed) 2:34:28 PM 2:37:36 PM 0:03:08 W→E 10/02/14 (Thu) 2:58:30 PM 3:05:46 PM 0:07:16 W→E 10/03/14 (Fri) 3:04:26 PM 3:05:52 PM 0:01:26 E→W 10/09/14 (Thu) 3:21:53 PM 3:24:59 PM 0:03:06 E→W 09/29/14 (Mon) 3:28:26 PM 3:32:47 PM 0:04:21 E→W 10/03/14 (Fri) 3:33:56 PM 3:37:51 PM 0:03:55 E→W 10/01/14 (Wed) 3:34:22 PM 3:36:26 PM 0:02:04 E→W 10/10/14 (Fri) 3:34:49 PM 3:38:05 PM 0:03:16 W→E 09/29/14 (Mon) 3:39:23 PM 3:41:50 PM 0:02:27 E→W 10/03/14 (Fri) 3:56:03 PM 3:58:10 PM 0:02:07 E→W 10/03/14 (Fri) 4:04:32 PM 4:06:44 PM 0:02:12 E→W 10/09/14 (Thu) 4:05:15 PM 4:06:00 PM 0:00:45 W→E 10/10/14 (Fri) 4:15:43 PM 4:18:34 PM 0:02:51 E→W 10/02/14 (Thu) 4:21:14 PM 4:24:33 PM 0:03:19 E→W 09/30/14 (Tue) 4:41:49 PM 4:44:33 PM 0:02:44 E→W 10/08/14 (Wed) 4:45:38 PM 4:47:10 PM 0:01:32 W→E 10/13/14 (Mon) 4:51:38 PM 4:53:52 PM 0:02:14 W→E 10/03/14 (Fri) 4:52:20 PM 4:52:55 PM 0:00:35 E→W 10/09/14 (Thu) 5:13:45 PM 5:16:16 PM 0:02:31 E→W 10/07/14 (Tue) 5:15:08 PM 5:17:33 PM 0:02:25 E→W 09/30/14 (Tue) 5:22:33 PM 5:25:16 PM 0:02:43 E→W 10/02/14 (Thu) 5:41:14 PM 5:43:51 PM 0:02:37 E→W 09/29/14 (Mon) 5:45:07 PM 5:46:10 PM 0:01:03 E→W 10/09/14 (Thu) 5:53:44 PM 5:56:13 PM 0:02:29 E→W
A.2

JEFFERSON ROAD IMPROVEMENTS TRAFFIC ANALYSIS STATE PROJECT U320-601-0.00 03
Date Gate Down Time Gate Up Time Duration
(hrs:min:sec) Crossing Direction
10/01/14 (Wed) 5:55:43 PM 5:59:06 PM 0:03:23 W→E 10/02/14 (Thu) 6:00:54 PM 6:03:02 PM 0:02:08 E→W 09/30/14 (Tue) 6:19:13 PM 6:21:58 PM 0:02:45 W→E 10/02/14 (Thu) 6:20:09 PM 6:22:22 PM 0:02:13 W→E
A.3
JEFFERSON ROAD IMPROVEMENTS TRAFFIC ANALYSIS STATE PROJECT U320-601-0.00 03
INTERSECTION LANE GROUP DELAYS AND LEVELS Appendix BOF SERVICE
B.4

Jefferson Road WideningHighway Capacity Analysis - A.M. Peak
EBL EBT EBR+T WBL WBT WBR SBR EBL EBT EBR+T WBL WBT WBR SBR EBL EBT EBR+T WBL WBT WBR SBR EBL EBT EBR+T WBL WBT WBR SBR EBL EBT EBR+T WBL WBT WBR SBRLane Delay (s/veh) 76.3 0.5 1.1 74.9 2.8 1.9 73.1 0.6 1.2 74.4 4.2 2.4 73.1 0.6 1.2 72.1 4.2 2.4 73.1 0.4 72.1 4.2 2.4 74.8 0.6 1.2 72.4 3.5 2.1
LOS E A A E A A E A A E A A E A A E A A E A E A A E A A E A AApproach Delay (s/veh)/LOS
Intersection Delay (s/veh)/LOS
EBL EBT EBR WBL WBT WBR NBR SBL SBT SBR EBL EBT EBR WBL WBT WBR NBR SBL SBT SBR EBL EBT EBR WBL WBT WBR NBR SBL SBT SBR EBL EBT EBR WBL WBT WBR NBR SBL SBT SBR EBL EBT EBR WBL WBT WBR NBR SBL SBT SBR
Lane Delay (s/veh) 8.2 10.2 1.4 9.2 13.0 1.8 7.1 18.7 1.9 3.8 4.8 1.9 7.5 20.3 2.4LOS A B A A B A A B A A A A A C A
Approach Delay (s/veh)/LOS
Intersection Delay (s/veh)/LOS
EBL EBT EBR WBL WBT WBR+T NBL SBL+T EBL EBT EBR WBL WBT WBR+T NBL SBR EBL EBT EBR WBL WBT WBR+T NBL NBT NBR SBR+T EBL EBT EBR WBL WBT WBR+T NBL NBT NBR SBR+T EBL EBT EBR WBL WBT WBR+T NBL NBT NBR SBL
Lane Delay (s/veh) 7.0 6.5 8.4 7.6 13.5 13.3 54.0 71.8 13.3 12.0 17.8 16.6 20.6 20.5 52.8 65.7 8.4 6.0 8.8 8.7 13.0 12.9 71.4 61.7 66.2 8.4 6.6 8.6 8.6 12.1 12.1 70.6 62.0 66.2 6.3 14.7 17.6 11.2 9.5 9.5 72.4 62.9 71.9LOS A A A A B B D E B B B B C C D E A A A A B B E E E A A A A B B E E E A B B B A A E E E
Approach Delay (s/veh)/LOS
Intersection Delay (s/veh)/LOS
EBL EBT EBR WBL WBT WBR NBL NBL+T NBR SBL SBT SBR EBL EBT EBR WBL WBT WBR NBR SBL SBT SBR EBL EBT EBR WBL WBT WBR NBR SBL SBT SBR EBL EBT EBR WBL WBT WBR NBR SBL SBT SBR EBL EBT EBR WBL WBT WBR NBR SBL SBT SBR
Lane Delay (s/veh) 14.0 5.8 12.4 0.6 178.1 50.1 14.2 7.1 10.9 0.8 9.8 8.7 16.4 0.8 6.1 5.6 7.3 0.8 7.0 6.1 14.9 0.8LOS B A B A F D B A B A A A B A A A A A A A B A
Approach Delay (s/veh)/LOS
Intersection Delay (s/veh)/LOS
EBL EBT EBR WBL WBT WBR NBL NBT NBR SBL SBT SBR EBL EBT EBR WBL WBT WBR NBL NBT NBR SBL SBT SBR EBL EBT EBR WBL WBT WBR NBL NBT NBR SBL SBT SBR EBL EBT EBR WBL WBT WBR NBL NBT NBR SBL SBT SBR NBL NBT NBR+T SBL SBT SBR+T
Lane Delay (s/veh) 3.9 4.8 4.8 44.9 2.9 2.9LOS A A A D A A
Approach Delay (s/veh)/LOS
Intersection Delay (s/veh)/LOS
EBL WBR SBL SBT+L SBR EBL WBR SBL SBT+L SBR EBL EBT EBR WBL NBL NBT NBR SBL SBT SBR EBL EBT EBR WBL NBL NBT NBR SBL SBT SBR EBL EBT EBR WBL WBT WBR NBR SBL SBT SBR
Lane Delay (s/veh) 7.5 11.2 316.0 42.1 7.8 9.1 478.1 42.3 57.9 46.4 44.5 52.0 18.9 28.4 28.8 18.1 25.7 57.9 46.6 42.7 52.0 18.9 28.4 28.1 18.0 25.6 18.0 27.6 10.4LOS A B F D A A F D E D D D B C C B C E D D D B C C B C B C B
Approach Delay (s/veh)/LOS
Intersection Delay (s/veh)/LOS
EBL EBT EBR WBL WBT WBR NBR SBL SBT SBR EBL EBT EBR WBL WBT WBR NBR SBL SBT SBR EBL EBT EBR WBL WBT WBR NBL NBT NBR SBL SBT SBR EBL EBT EBR WBL WBT WBR NBL NBT NBR SBL SBT SBR EBL EBT EBR WBL WBT WBR NBL NBT NBR SBL SBT SBR
Lane Delay (s/veh) 26.7 17.4 23.8 1.1 44.7 26.5 16.3 43.8 3.3 37.9LOS C B C A D C B D A D
Approach Delay (s/veh)/LOS
Intersection Delay (s/veh)/LOS
EBL EBT EBR WBL WBT WBR NBL NBT NBR SBL SBT SBR EBL EBT EBR WBL WBT WBR NBL NBT NBR SBL SBT SBR EBL EBT EBR WBL WBT WBR NBL NBT NBR SBL SBT SBR EBL EBT EBR WBL WBT WBR NBL NBT NBR SBL SBT SBR EBL EBT EBR WBL WBT WBR NBL NBT NBR SBL SBT SBRLane Delay (s/veh) 42.0 35.8 3.6 13.6 20.9
LOS D D A B CApproach Delay (s/veh)/LOS
Intersection Delay (s/veh)/LOS
EBL EBT EBR WBL WBT WBR NBL NBT NBR SBL SBT SBR EBL EBT EBR WBL WBT WBR NBL NBT NBR SBL SBT SBR EBL EBT EBR WBL WBT WBR NBL NBT NBR SBL SBT SBR EBL EBT EBR WBL WBT WBR NBL NBT NBR SBL SBT SBR EBL EBT EBR WBL WBT WBR NBL NBT NBR SBL SBT SBRLane Delay (s/veh) 32.5 26.8 4.3 3.4 3.6 2.6 44.2 32.7 3.3 2.7 6.8 5.0
LOS C C A A A A D C A A A AApproach Delay (s/veh)/LOS
Intersection Delay (s/veh)/LOS
EBL EBT EBR WBL WBT WBR NBL NBT NBR SBL SBT SBR EBL EBT EBR WBL WBT WBR NBL NBT NBR SBL SBT SBR EBL EBT EBR WBL WBT WBR NBL NBT NBR SBL SBT SBR EBL EBT EBR WBL WBT WBR NBL NBT NBR SBL SBT SBR EBL EBT EBR WBL WBT WBR NBL NBT NBR SBL SBT SBRLane Delay (s/veh) 55.1 27.4 20.5 19.6 56.8 10.8 56.3 22.1 25.6 23.6 56.9 14.2 51.4 31.4 16.7 15.4 56.8 8.1 57.2 22.5 26.1 24.0 57.0 14.6 55.1 27.4 20.5 19.6 56.8 10.8
LOS E C C B E B E C C C E B D C B B E A E C C C E B E C C B E BApproach Delay (s/veh)/LOS
Intersection Delay (s/veh)/LOS
25.5/C
4.4/A
5.0/A
33.5C
SBT+R
73.6E
NBL+T
130.5F
71.9/E 73.0/E
16.6/B
2030 ALT 5 AM
6.8/A 2.0/A 130.5/F
15.6/B 9.7/A
NBL+T
4.8/A
EBL+T+R
2030 ALT 1 RHL AM
46.9/D 23.7/C 20.6/C
33.3/C
WBT+R
43.5D
NBL+T
65.9/E70.8/E 65.9/E
11.8/B
2030 ALT 1 RHL AM
9.6/A 2.4/A 141.1/F
25.3/C
2030 No Build AM
12.7/B 1.8/A 156.7/F
WBT+R
43.7D
70.1/E
33.0/C
2030 ALT 1 NO RHL AM
7.3/A 11.7/B
SBL+T64.5
E
SBL+T
65.8E
F141.1
F
11.7/B
65.2E
5.8/A
2030 ALT 1 NO RHL AM
NBL+T NBL+T
141.1
SBL+T
4.5/A
2030 No Build AM
9.2/A 2.2/A 79.8/E
27.6/C
46.2/D
SBL+T
65.2E
A
NBL+T+R
74.3E
9.6/A
2030 No Build AM
14.0/B
WBL+T
20.0/C 97.8/F 65.6/E
6.5/A 7.4/A
Jefferson Rd & RHL Blvd
2030 No Build AM 2030 ALT 1 RHL AM 2030 ALT 1 NO RHL AM
Jefferson Rd & Connector Rd
2030 No Build AM 2030 ALT 1 RHL AM 2030 ALT 1 NO RHL AM
44.1/D
Intersection2014 Existing AM 2030 No Build AM 2030 ALT 1 RHL AM 2030 ALT 1 NO RHL AM 2030 ALT 5 AM
Jefferson Rd & Access Rd
2030 ALT 5 AM
54.7/D
Intersection2014 Existing AM
20.2/C 42.0/D
2030 ALT 5 AM
42.0/D 24.8/C 18.6/B
24.0/C
2030 ALT 5 AM
43.9/D 2.7/A 6.8/A
54.0D
WBL+T+R
47.7D
46.7/D
2030 ALT 1 NO RHL AM
45.8/D 47.0/D 23.4/C 20.5/C
2030 ALT 1 NO RHL AM
56.4/E 25.6/C 41.1/D
2030 ALT 5 AM
1.1/A 5.6/A 67.5/E 64.6/E
3.9/A
2030 ALT 5 AM
7.5/A 3.1/A 75.5/E
NBL+T+R67.5
E
SBL+T64.6
E
NBL+T
75.5E
8.4/A
2030 ALT 5 AM
2030 ALT 1 NO RHL AM
6.1/A 1.5/A 141.1/F
24.4/C
2030 ALT 5 AM
23.3/C
2030 ALT 5 AM
18.0/B 20.7/C 33.5/C
54.0/D 47.7/D
39.0/D
2030 ALT 1 RHL AM
50.8/D 16.4/B 38.2/D
32.5/C 3.4/A 3.6/A
2030 ALT 1 RHL AM
2030 ALT 1 NO RHL AM
0.9/A 6.1/A 67.5/E 64.6/E
3.9/A
2030 ALT 1 NO RHL AM
3.8/A 2.0/A 77.5/E
SBL+T64.6
E
NBL+T+R67.5
E
77.5E
NBL+T
46.1/D
29.0/C
2030 No Build AM
6.0/A 9.7/A 74.3/E 473.4/F
303.4F
8.1/A
2030 ALT 1 RHL AM
7.0/A 12.4/B
102.6/F
2030 No Build AM
55.6/E 25.1/C 40.7/D
2030 ALT 1 RHL AM
1.3/A 6.1/A 67.3/E 64.7/E
4.3/A
2030 ALT 1 RHL AM
7.1/A 2.3/A 77.5/E
NBL+T+R67.3
E
SBL+T64.7
E
NBL+T
77.5E
154.1/F
2030 No Build AM
22.9/C 19.2/B 278.8/F
2030 No Build AM
1.3/A 6.2/A 67.5/E 64.5/E
NBL+T+R67.5
E
NBL+T
79.8E
NBT+R
120.0F
NBL+T
156.7F
EBT+R
6.0
Intersection2014 Existing AM
Jefferson Rd & Oakhurst Dr 54.7/D 20.2/C 42.0/D
44.1/D
Jefferson Rd & Kanawha Tke 23.2/C 7.6/A 303/F
109.1/F
Intersection2014 Existing AM
341.5F
Intersection2014 Existing AM
Intersection2014 Existing AM
MacCorkle Ave & Jefferson Rd 7.1/A 12.7/B 117.1/F 56.6/E
21.6/C
Intersection2014 Existing AM
NBT+R
139.3F
SBR
49.3D
NBL+T
MacCorkle Ave & I-64 EB 8.2/A 1.7/A 71.8/E
8.7/A
2.7/A
MacCorkle Ave & Kenna Dr
Intersection2014 Existing AM
0.9/A 4.1/A
Intersection
NBL+T+R67.4
E
NBL+T
71.8E
SBL+T66.3
E67.4/E 66.3/E
2014 Existing AM
MacCorkle Ave & I-64 WB 13.0/B 2.6/A 152.8/F
38.5/D
Intersection2014 Existing AM
Jefferson Rd & Kanawha
Tke/Mathias Ln 6.9/A 10.5/B 67.8/E 314.9/F
99.8/F
EBT+R
6.8A
NBL+T+R
67.8E
WBL+T
10.0A

Jefferson Road WideningHighway Capacity Analysis - P.M. Peak
EBL EBT EBR+T WBL WBT WBR SBR EBL EBT EBR+T WBL WBT WBR SBR EBL EBT EBR+T WBL WBT WBR SBR EBL EBT EBR+T WBL WBT WBR SBR EBL EBT EBR+T WBL WBT WBR SBRLane Delay (s/veh) 62.6 0.3 0.5 61.6 5.1 2.1 54.3 61.2 0.5 0.9 61.7 5.3 1.8 62.1 1.4 2.0 63.6 7.7 2.3 52.2 62.1 1.4 1.9 63.6 7.7 2.3 52.2 62.1 0.5 0.9 61.3 5.6 1.8
LOS E A A E A A D E A A E A A E A A E A A D E A A E A A D E A A E A AApproach Delay (s/veh)/LOS
Intersection Delay (s/veh)/LOS
EBL EBT EBR WBL WBT WBR NBR SBL SBT SBR EBL EBT EBR WBL WBT WBR NBR SBL SBT SBR EBL EBT EBR WBL WBT WBR NBR SBL SBT SBR EBL EBT EBR WBL WBT WBR NBR SBL SBT SBR EBL EBT EBR WBL WBT WBR NBR SBL SBT SBR
Lane Delay (s/veh) 5.4 3.5 3.6 7.2 6.1 7.6 6.1 4.9 4.9 6.1 4.9 4.9 5.0 3.9 5.7LOS A A A A A A A A A A A A A A A
Approach Delay (s/veh)/LOS
Intersection Delay (s/veh)/LOS
EBL EBT EBR WBL WBT WBR+T NBL SBL EBL EBT EBR WBL WBT WBR+T NBL SBL EBL EBT EBR WBL WBT WBR+T NBL NBT NBR SBT+R EBL EBT EBR WBL WBT WBR+T NBL NBT NBR SBT+R EBL EBT EBR WBL WBT WBR+T NBL NBT NBR SBL
Lane Delay (s/veh) 14.8 6.3 7.3 7.7 14.5 14.5 47.8 165.6 58.6 17.2 124.1 61.5 56.4 56.9 41.8 53.5 22.5 8.1 17.4 8.8 17.0 17.2 57.8 49.4 59.0 21.5 8.1 18.9 8.9 16.7 16.7 59.6 51.2 60.5 17.9 14.8 29.1 9.2 15.0 15.0 58.5 50.2 54.8LOS B A A A B B D F E B F E F F D D C A B A B B E D E C A B A B B E D E B B C A B B E D D
Approach Delay (s/veh)/LOS
Intersection Delay (s/veh)/LOS
EBL EBT EBR WBL WBT WBR NBR SBL SBT SBR EBL EBT EBR WBL WBT WBR NBR SBL SBT SBR EBL EBT EBR WBL WBT WBR NBR SBL SBT SBR EBL EBT EBR WBL WBT WBR NBR SBL SBT SBR EBL EBT EBR WBL WBT WBR NBR SBL SBT SBR
Lane Delay (s/veh) 26.2 22.2 17.1 11.0 24.1 20.4 17.3 13.5 14.1 16.0 15.4 13.8 14.0 16.0 15.4 13.8 16.7 18.7 16.3 13.0LOS C C B B C C B B B B B B B B B B B B B B
Approach Delay (s/veh)/LOS
Intersection Delay (s/veh)/LOS
EBL EBT EBR WBL WBT WBR NBL NBT NBR SBL SBT SBR EBL EBT EBR WBL WBT WBR NBL NBT NBR SBL SBT SBR EBL EBT EBR WBL WBT WBR NBL NBT NBR SBL SBT SBR EBL EBT EBR WBL WBT WBR NBL NBT NBR SBL SBT SBR NBL NBT NBR+T SBL SBT SBR+T
Lane Delay (s/veh) 4.8 6.1 6.1 52.1 3.3 3.3LOS A A A D A A
Approach Delay (s/veh)/LOS
Intersection Delay (s/veh)/LOS
EBL WBL WBT WBR SBL SBT+L SBR EBL WBL WBT WBR SBL SBT+L SBR EBL EBT EBR WBL NBL NBT NBR SBL SBT SBR EBL WBL NBL NBT NBR SBL SBT SBR EBL EBT EBR WBL WBT WBR NBR SBL SBT SBR
Lane Delay (s/veh) 7.1 9.8 237.1 42.5 15.6 11.2 508.6 42.7 60.4 38.4 36.5 51.1 34.5 44.0 43.9 29.0 45.0 60.4 51.1 46.4 54.1 51.9 34.7 57.8 29.1 26.7 13.1LOS A A F D B B F D E D D D C D D C D E D D D D C E C C B
Approach Delay (s/veh)/LOS
Intersection Delay (s/veh)/LOS
EBL EBT EBR WBL WBT WBR NBR SBL SBT SBR EBL EBT EBR WBL WBT WBR NBR SBL SBT SBR EBL EBT EBR WBL WBT WBR NBL NBT NBR SBL SBT SBR EBL EBT EBR WBL WBT WBR NBL NBT NBR SBL SBT SBR EBL EBT EBR WBL WBT WBR NBL NBT NBR SBL SBT SBR
Lane Delay (s/veh) 24.5 22.0 25.5 3.7 36.9 25.2 18.0 64.2 3.6 39.2LOS C C C A D C B E A D
Approach Delay (s/veh)/LOS
Intersection Delay (s/veh)/LOS
EBL EBT EBR WBL WBT WBR NBL NBT NBR SBL SBT SBR EBL EBT EBR WBL WBT WBR NBL NBT NBR SBL SBT SBR EBL EBT EBR WBL WBT WBR NBL NBT NBR SBL SBT SBR EBL EBT EBR WBL WBT WBR NBL NBT NBR SBL SBT SBR EBL EBT EBR WBL WBT WBR NBL NBT NBR SBL SBT SBRLane Delay (s/veh) 43.8 36.2 3.2 15.8 17.6
LOS D D A B BApproach Delay (s/veh)/LOS
Intersection Delay (s/veh)/LOS
EBL EBT EBR WBL WBT WBR NBL NBT NBR SBL SBT SBR EBL EBT EBR WBL WBT WBR NBL NBT NBR SBL SBT SBR EBL EBT EBR WBL WBT WBR NBL NBT NBR SBL SBT SBR EBL EBT EBR WBL WBT WBR NBL NBT NBR SBL SBT SBR EBL EBT EBR WBL WBT WBR NBL NBT NBR SBL SBT SBRLane Delay (s/veh) 46.2 32.6 15.4 9.9 11.2 9.4 46.1 26.0 14.1 8.7 9.9 8.0
LOS D C B A B A D C B A A AApproach Delay (s/veh)/LOS
Intersection Delay (s/veh)/LOS
EBL EBT EBR WBL WBT WBR NBL NBT NBR SBL SBT SBR EBL EBT EBR WBL WBT WBR NBL NBT NBR SBL SBT SBR EBL EBT EBR WBL WBT WBR NBL NBT NBR SBL SBT SBR EBL EBT EBR WBL WBT WBR NBL NBT NBR SBL SBT SBR EBL EBT EBR WBL WBT WBR NBL NBT NBR SBL SBT SBRLane Delay (s/veh) 55.5 22.2 24.3 23.0 57.5 15.3 93.8 17.7 31.7 29.3 76.1 21.6 51.4 31.6 18.6 17.0 55.1 9.7 128.8 17.9 31.7 28.6 72.8 21.8 56.2 22.2 26.7 24.5 59.1 16.3
LOS E C C C E B F B C C E C D C B B E A F B C C E C E C C C E BApproach Delay (s/veh)/LOS
Intersection Delay (s/veh)/LOS
SBT+R
59.3E
4.7/A
1.0/A
NBL+T
EBL+T+R
59.0E
WBL+T+R
52.7D
2030 ALT 5 PM
52.7/D 6.1/A 7.1/A
8.9/A
59.0/E
2030 ALT 5 PM
13.5/B 179.3/F
2030 ALT 5 PM
14.7/B
NBL+T+R
NBL+T
66.5E
2030 ALT 5 PM
6.9/A 55.9/E 56.9/E
SBL+T56.9
E
SBL+T
54.9D
NBL+T
171.6F
EBT+R
67.5E
WBT+R
35.8D
2030 ALT 1 NO RHL PM
2030 ALT 1 NO RHL PM
2030 ALT 1 NO RHL PM
50.8/D
SBL+T53.0
D
NBL+T
62.3E
2030 ALT 1 NO RHL PM7.3/A
1.9/A 10.0/A 53.8/D 52.9/D
NBL+T+R53.8
D55.8
E52.9/D
7.3/A
NBL+T+R53.8
DD1.9/A 10.0/B 53.8/D
SBL+T
53.3E
NBL+T
62.3E
2030 ALT 1 RHL PM
2030 ALT 1 RHL PM
2030 ALT 1 RHL PM
2030 ALT 1 RHL PM
2030 ALT 1 RHL PM
50.8/D
2030 ALT 1 NO RHL PM 2030 ALT 5 PM
26.3/C 34.1/C
NBL+T
171.6F
WBT+R
50.1D
2030 ALT 1 RHL PM
2030 ALT 1 RHL PM
NBL+T
179.3F
49.8D
2030 ALT 1 RHL PM 2030 ALT 1 NO RHL PM 2030 ALT 5 PM
8.9/A 9.6/A
2030 ALT 1 RHL PM 2030 ALT 1 NO RHL PM 2030 ALT 5 PM
35.2/D 89.2/F 43.8/D
27.5/C 123.7/F 31.2/C 39.7/D 54.5/D50.3/D 18.3/B
17.8/B 16.0/B
10.8/B 43.2/D
Jefferson Rd & Oakhurst Dr 54.2/D 24.0/C 33.8/C 91.0/F
Intersection2014 Existing PM 2030 No Build PM
44.2/D 69.7/E
31.2/C 42.0/D
Intersection2014 Existing PM 2030 No Build PM
Jefferson Rd & Connector Rd
44.9/D 10.1/BJefferson Rd &
RHL Blvd
Intersection2014 Existing PM 2030 No Build PM
Jefferson Rd & Kanawha Tke
21.8/C
43.8/D 23.1/C 16.7/B
55.1/E 169.0/F
27.9/C 450.8/F23.0/C 10.9/B 167.5/F 22.1/C
Intersection2014 Existing PM 2030 No Build PM
NBL+T
177.6F
NBL+T
504.6F
2030 ALT 1 NO RHL PM 2030 ALT 5 PM
20.2/C 49.8/D
60.9/F 172.4/F 42.8/D 49.8/D 29.4/C
38.1/D 67.1/E 42.0/D 50.7/D 47.8/D 29.1/C13.2/B 472.4/F 492.4/F 39.0/D 50.5/D 40.2/D
Jefferson Rd & Kanawha
Tke/Mathias Ln 4.1/A 9.7/A 70.7/E 231.3/F 8.1/A
Intersection2014 Existing PM 2030 No Build PM
EBT+R
3.9A
NBL+T+R
70.7E
EBT+R
7.7A
NBL+T+R
472.4F
Jefferson Rd & Access Rd
Intersection2014 Existing PM 2030 No Build PM
52.4/D
14.8/B 14.0/B 171.6/F 17.4/B14.9/B 14.0/B 171.6/FMacCorkle Ave &
I-64 WB 24.8/C 12.1/B 157.2/F 22.6/C
Intersection2014 Existing PM 2030 No Build PM
NBL+T
157.2F
NBL+T
187.1F
48.2/D 53.2/D
14.0/B 187.1/F
58.0/E 57.6/E
49.2/D 80.3/F 18.1/B 18.3/B 20.8/C
57.2/E 13.5/B 16.3/B 59.1/E 58.7/E 21.5/C56.9/E 191.6/F 57.0/E 12.7/B 16.7/B 57.3/EMacCorkle Ave &
Jefferson Rd 7.0/A 13.9/B 218.9/F 95.4/F 70.0/E
Intersection2014 Existing PM 2030 No Build PM
NBT+R
281.0F
SBT+R
38.3D
NBT+R
254.8F
SBT+R
58.7E
2030 ALT 1 NO RHL PM 2030 ALT 5 PM
5.7/A 66.5/E
5.1/A 8.1/A 6.8/A 6.8/A 6.2/A
6.1/A 4.9/A 62.3/E 5.0/A7.6/A 57.4/E 6.1/A 4.9/A 62.3/E
2030 ALT 1 RHL PM 2030 ALT 1 NO RHL PM 2030 ALT 5 PM
MacCorkle Ave & I-64 EB 5.4/A 3.6/A 55.3/E 7.2/A
Intersection2014 Existing PM 2030 No Build PM
NBL+T
55.3E
NBL+T
57.4E
SBL+T SBL+T53.0
MacCorkle Ave & Kenna Dr 0.8/A 6.5/A
4.9/A 4.8/A
6.8/A 56.0/E 55.8/E55.1/E 54.8/D 1.1/A
Intersection2014 Existing PM 2030 No Build PM
NBL+T+R55.1
E
SBL+T54.9
D
NBL+T+R56.0
E
JEFFERSON ROAD IMPROVEMENTS TRAFFIC ANALYSIS STATE PROJECT U320-601-0.00 03
HIGHWAY CAPACITY SOFTWARE ANALYSIS Appendix CRESULTS
C.5

Existing AM Peak Unsignalized

TWO-WAY STOP CONTROL SUMMARY
General Information Site Information Analyst ASELLS Agency/Co. STANTEC Date Performed 11/25/2014 Analysis Time Period Existing AM
IntersectionJurisdictionAnalysis Year 2014
Project Description East/West Street: Bob Evans entrance North/South Street: Jefferson Road Intersection Orientation: North-South Study Period (hrs): 0.25
Vehicle Volumes and Adjustments Major Street Northbound Southbound Movement 1 2 3 4 5 6
L T R L T RVolume (veh/h) 5 417 631 22 Peak-Hour Factor, PHF 0.45 0.87 1.00 1.00 0.86 0.63 Hourly Flow Rate, HFR (veh/h)
11 479 0 0 733 34
Percent Heavy Vehicles 2 -- -- 0 -- -- Median Type Undivided RT Channelized 0 0 Lanes 0 2 0 0 2 0 Configuration LT T T TR Upstream Signal 1 0 Minor Street Eastbound Westbound Movement 7 8 9 10 11 12
L T R L T RVolume (veh/h) 8 6 Peak-Hour Factor, PHF 0.90 1.00 0.69 1.00 1.00 1.00 Hourly Flow Rate, HFR (veh/h) 8 0 8 0 0 0
Percent Heavy Vehicles 2 0 2 0 0 0 Percent Grade (%) 0 0 Flared Approach N N Storage 0 0 RT Channelized 0 0 Lanes 1 0 1 0 0 0 Configuration L R Delay, Queue Length, and Level of ServiceApproach Northbound Southbound Westbound Eastbound
Movement 1 4 7 8 9 10 11 12
Lane Configuration LT L R v (veh/h) 11 8 8 C (m) (veh/h) 841 233 661 v/c 0.01 0.03 0.01 95% queue length 0.04 0.11 0.04 Control Delay (s/veh) 9.3 21.0 10.5 LOS A C B Approach Delay (s/veh) -- -- 15.8 Approach LOS -- -- C
Copyright © 2010 University of Florida, All Rights Reserved HCS+TM Version 5.6 Generated: 7/30/2015 2:53 PM
Page 1 of 1Two-Way Stop Control
7/30/2015file://C:\Users\asells\AppData\Local\Temp\u2k1720.tmp

TWO-WAY STOP CONTROL SUMMARY
General Information Site Information Analyst ASELLS Agency/Co. STANTEC Date Performed 11/25/2014 Analysis Time Period
IntersectionJurisdictionAnalysis Year 2014
Project Description East/West Street: McDonalds entrance North/South Street: Jefferson Road Intersection Orientation: North-South Study Period (hrs): 0.25
Vehicle Volumes and Adjustments Major Street Northbound Southbound Movement 1 2 3 4 5 6
L T R L T RVolume (veh/h) 30 414 553 82 Peak-Hour Factor, PHF 0.83 0.87 1.00 1.00 0.88 0.83 Hourly Flow Rate, HFR (veh/h)
36 475 0 0 628 98
Percent Heavy Vehicles 2 -- -- 0 -- -- Median Type Undivided RT Channelized 0 0 Lanes 0 2 0 0 2 0 Configuration LT T T TR Upstream Signal 0 0 Minor Street Eastbound Westbound Movement 7 8 9 10 11 12
L T R L T RVolume (veh/h) 2 1 Peak-Hour Factor, PHF 0.50 1.00 0.25 1.00 1.00 1.00 Hourly Flow Rate, HFR (veh/h) 4 0 4 0 0 0
Percent Heavy Vehicles 2 0 2 0 0 0 Percent Grade (%) 0 0 Flared Approach N N Storage 0 0 RT Channelized 0 0 Lanes 1 0 1 0 0 0 Configuration L R Delay, Queue Length, and Level of ServiceApproach Northbound Southbound Westbound Eastbound
Movement 1 4 7 8 9 10 11 12
Lane Configuration LT L R v (veh/h) 36 4 4 C (m) (veh/h) 871 234 678 v/c 0.04 0.02 0.01 95% queue length 0.13 0.05 0.02 Control Delay (s/veh) 9.3 20.7 10.3 LOS A C B Approach Delay (s/veh) -- -- 15.5 Approach LOS -- -- C
Copyright © 2010 University of Florida, All Rights Reserved HCS+TM Version 5.6 Generated: 4/16/2015 2:39 PM
Page 1 of 1Two-Way Stop Control
4/16/2015file://C:\Users\asells\AppData\Local\Temp\u2k28BB.tmp

TWO-WAY STOP CONTROL SUMMARY
General Information Site Information Analyst ASELLS Agency/Co. STANTEC Date Performed 11/25/2014 Analysis Time Period Existing AM
IntersectionJurisdictionAnalysis Year 2014
Project Description East/West Street: Community Center - North North/South Street: Jefferson Road Intersection Orientation: North-South Study Period (hrs): 0.25
Vehicle Volumes and Adjustments Major Street Northbound Southbound Movement 1 2 3 4 5 6
L T R L T RVolume (veh/h) 6 369 522 22 Peak-Hour Factor, PHF 0.50 0.77 1.00 1.00 0.82 0.47 Hourly Flow Rate, HFR (veh/h)
12 479 0 0 636 46
Percent Heavy Vehicles 2 -- -- 0 -- -- Median Type Undivided RT Channelized 0 0 Lanes 0 1 0 0 2 0 Configuration LT T TR Upstream Signal 0 0 Minor Street Eastbound Westbound Movement 7 8 9 10 11 12
L T R L T RVolume (veh/h) 6 0 4 Peak-Hour Factor, PHF 0.46 1.00 0.58 1.00 1.00 1.00 Hourly Flow Rate, HFR (veh/h) 13 0 6 0 0 0
Percent Heavy Vehicles 2 0 2 0 0 0 Percent Grade (%) 0 0 Flared Approach N N Storage 0 0 RT Channelized 0 0 Lanes 0 1 0 0 0 0 Configuration LTR Delay, Queue Length, and Level of ServiceApproach Northbound Southbound Westbound Eastbound
Movement 1 4 7 8 9 10 11 12
Lane Configuration LT LTR v (veh/h) 12 19 C (m) (veh/h) 905 241 v/c 0.01 0.08 95% queue length 0.04 0.25 Control Delay (s/veh) 9.0 21.2 LOS A C Approach Delay (s/veh) -- -- 21.2 Approach LOS -- -- C
Copyright © 2010 University of Florida, All Rights Reserved HCS+TM Version 5.6 Generated: 4/16/2015 2:40 PM
Page 1 of 1Two-Way Stop Control
4/16/2015file://C:\Users\asells\AppData\Local\Temp\u2kCFB4.tmp

TWO-WAY STOP CONTROL SUMMARY
General Information Site Information Analyst ASELLS Agency/Co. STANTEC Date Performed 11/25/2014 Analysis Time Period Existing AM
Intersection Jurisdiction Analysis Year 2014
Project Description East/West Street: Community Center - South North/South Street: Jefferson Road Intersection Orientation: North-South Study Period (hrs): 0.25
Vehicle Volumes and Adjustments Major Street Northbound Southbound Movement 1 2 3 4 5 6 L T R L T RVolume (veh/h) 12 398 583 1 Peak-Hour Factor, PHF 0.67 0.81 1.00 1.00 0.91 0.25 Hourly Flow Rate, HFR (veh/h)
17 491 0 0 640 4
Percent Heavy Vehicles 2 -- -- 0 -- -- Median Type Undivided RT Channelized 0 0 Lanes 0 1 0 0 2 0 Configuration LT T TR Upstream Signal 0 0 Minor Street Eastbound Westbound Movement 7 8 9 10 11 12
L T R L T RVolume (veh/h) 2 0 10 Peak-Hour Factor, PHF 0.33 1.00 0.71 1.00 1.00 1.00 Hourly Flow Rate, HFR (veh/h) 6 0 14 0 0 0
Percent Heavy Vehicles 2 0 2 0 0 0 Percent Grade (%) 0 0 Flared Approach N N Storage 0 0 RT Channelized 0 0 Lanes 0 1 0 0 0 0 Configuration LTR Delay, Queue Length, and Level of ServiceApproach Northbound Southbound Westbound Eastbound
Movement 1 4 7 8 9 10 11 12
Lane Configuration LT LTR v (veh/h) 17 20 C (m) (veh/h) 935 381 v/c 0.02 0.05 95% queue length 0.06 0.17 Control Delay (s/veh) 8.9 15.0 LOS A B Approach Delay (s/veh) -- -- 15.0 Approach LOS -- -- B
Copyright © 2010 University of Florida, All Rights Reserved HCS+TM Version 5.6 Generated: 4/16/2015 2:40 PM
Page 1 of 1Two-Way Stop Control
4/16/2015file://C:\Users\asells\AppData\Local\Temp\u2k41C7.tmp

TWO-WAY STOP CONTROL SUMMARY
General Information Site Information Analyst A SELLS Agency/Co. STANTEC Date Performed 11/25/2014 Analysis Time Period Existing AM
IntersectionJurisdictionAnalysis Year 2014
Project Description East/West Street: Washington Street North/South Street: Jefferson Road Intersection Orientation: North-South Study Period (hrs): 0.25
Vehicle Volumes and Adjustments Major Street Northbound Southbound Movement 1 2 3 4 5 6
L T R L T RVolume (veh/h) 382 6 11 576 Peak-Hour Factor, PHF 1.00 0.80 0.92 0.69 0.91 1.00 Hourly Flow Rate, HFR (veh/h)
0 477 6 15 632 0
Percent Heavy Vehicles 0 -- -- 2 -- -- Median Type Undivided RT Channelized 0 0 Lanes 0 1 0 0 2 0 Configuration TR LT T Upstream Signal 0 0 Minor Street Eastbound Westbound Movement 7 8 9 10 11 12
L T R L T RVolume (veh/h) 15 0 22 Peak-Hour Factor, PHF 1.00 1.00 1.00 0.73 1.00 0.85 Hourly Flow Rate, HFR (veh/h) 0 0 0 20 0 25
Percent Heavy Vehicles 0 0 0 2 0 2 Percent Grade (%) 0 0 Flared Approach N N Storage 0 0 RT Channelized 0 0 Lanes 0 0 0 0 1 0 Configuration LTR Delay, Queue Length, and Level of ServiceApproach Northbound Southbound Westbound Eastbound
Movement 1 4 7 8 9 10 11 12
Lane Configuration LT LTR v (veh/h) 15 45 C (m) (veh/h) 1064 410 v/c 0.01 0.11 95% queue length 0.04 0.37 Control Delay (s/veh) 8.4 14.9 LOS A B Approach Delay (s/veh) -- -- 14.9 Approach LOS -- -- B
Copyright © 2010 University of Florida, All Rights Reserved HCS+TM Version 5.6 Generated: 4/16/2015 2:45 PM
Page 1 of 1Two-Way Stop Control
4/16/2015file://C:\Users\asells\AppData\Local\Temp\u2k41A8.tmp

TWO-WAY STOP CONTROL SUMMARY
General Information Site Information Analyst A SELLS Agency/Co. STANTEC Date Performed 11/25/2014 Analysis Time Period Existing AM
Intersection Jurisdiction Analysis Year 2014
Project Description East/West Street: Pennslyvania Street North/South Street: Jefferson Road Intersection Orientation: North-South Study Period (hrs): 0.25
Vehicle Volumes and Adjustments Major Street Northbound Southbound Movement 1 2 3 4 5 6 L T R L T RVolume (veh/h) 401 2 1 570 Peak-Hour Factor, PHF 1.00 0.83 1.00 0.50 0.97 1.00 Hourly Flow Rate, HFR (veh/h)
0 483 2 2 587 0
Percent Heavy Vehicles 0 -- -- 2 -- -- Median Type Undivided RT Channelized 0 0 Lanes 0 1 0 0 2 0 Configuration TR LT T Upstream Signal 0 1 Minor Street Eastbound Westbound Movement 7 8 9 10 11 12
L T R L T RVolume (veh/h) 3 0 7 Peak-Hour Factor, PHF 1.00 1.00 1.00 1.00 1.00 0.65 Hourly Flow Rate, HFR (veh/h) 0 0 0 3 0 10
Percent Heavy Vehicles 0 0 0 2 0 2 Percent Grade (%) 0 0 Flared Approach N N Storage 0 0 RT Channelized 0 0 Lanes 0 0 0 0 1 0 Configuration LTR Delay, Queue Length, and Level of ServiceApproach Northbound Southbound Westbound Eastbound
Movement 1 4 7 8 9 10 11 12
Lane Configuration LT LTR v (veh/h) 2 13 C (m) (veh/h) 1074 508 v/c 0.00 0.03 95% queue length 0.01 0.08 Control Delay (s/veh) 8.4 12.3 LOS A B Approach Delay (s/veh) -- -- 12.3 Approach LOS -- -- B
Copyright © 2010 University of Florida, All Rights Reserved HCS+TM Version 5.6 Generated: 8/4/2015 9:05 AM
Page 1 of 1Two-Way Stop Control
8/4/2015file://C:\Users\asells\AppData\Local\Temp\u2k47F9.tmp

TWO-WAY STOP CONTROL SUMMARY
General Information Site Information Analyst A SELLS Agency/Co.Date Performed 12/3/2014 Analysis Time Period Existing AM Peak
IntersectionJurisdictionAnalysis Year 2014
Project Description East/West Street: Kramer Street North/South Street: Jefferson Road Intersection Orientation: North-South Study Period (hrs): 0.25
Vehicle Volumes and Adjustments Major Street Northbound Southbound Movement 1 2 3 4 5 6
L T R L T RVolume (veh/h) 1 687 578 2 Peak-Hour Factor, PHF 0.50 0.85 1.00 1.00 0.94 0.75 Hourly Flow Rate, HFR (veh/h)
2 808 0 0 614 2
Percent Heavy Vehicles 6 -- -- 0 -- -- Median Type Undivided RT Channelized 0 0 Lanes 0 1 0 0 1 0 Configuration LT TR Upstream Signal 1 0 Minor Street Eastbound Westbound Movement 7 8 9 10 11 12
L T R L T RVolume (veh/h) 2 0 2 Peak-Hour Factor, PHF 0.75 1.00 0.33 0.80 1.00 0.85 Hourly Flow Rate, HFR (veh/h) 2 0 6 0 0 0
Percent Heavy Vehicles 100 0 100 3 0 0 Percent Grade (%) 0 0 Flared Approach N N Storage 0 0 RT Channelized 0 0 Lanes 0 1 0 0 0 0 Configuration LTR Delay, Queue Length, and Level of ServiceApproach Northbound Southbound Westbound Eastbound
Movement 1 4 7 8 9 10 11 12
Lane Configuration LT LTR v (veh/h) 2 8 C (m) (veh/h) 945 206 v/c 0.00 0.04 95% queue length 0.01 0.12 Control Delay (s/veh) 8.8 23.2 LOS A C Approach Delay (s/veh) -- -- 23.2 Approach LOS -- -- C
Copyright © 2010 University of Florida, All Rights Reserved HCS+TM Version 5.6 Generated: 7/31/2015 10:11 AM
Page 1 of 1Two-Way Stop Control
7/31/2015file://C:\Users\asells\AppData\Local\Temp\u2kEA2.tmp

TWO-WAY STOP CONTROL SUMMARY
General Information Site Information Analyst A SELLS Agency/Co.Date Performed 12/3/2014 Analysis Time Period Existing AM Peak
IntersectionJurisdictionAnalysis Year 2014
Project Description East/West Street: US 119 North/South Street: Jefferson Road Intersection Orientation: North-South Study Period (hrs): 0.25
Vehicle Volumes and Adjustments Major Street Northbound Southbound Movement 1 2 3 4 5 6
L T R L T RVolume (veh/h) 565 0 165 Peak-Hour Factor, PHF 0.60 0.89 1.00 1.00 0.83 1.00 Hourly Flow Rate, HFR (veh/h)
0 634 0 0 198 0
Percent Heavy Vehicles 4 -- -- 0 -- -- Median Type Undivided RT Channelized 0 0 Lanes 0 1 1 0 1 0 Configuration T R T Upstream Signal 0 1 Minor Street Eastbound Westbound Movement 7 8 9 10 11 12
L T R L T RVolume (veh/h) 25 137 Peak-Hour Factor, PHF 1.00 1.00 1.00 0.69 1.00 0.78 Hourly Flow Rate, HFR (veh/h) 0 0 0 36 0 175
Percent Heavy Vehicles 0 0 0 5 0 0 Percent Grade (%) 0 0 Flared Approach N N Storage 0 0 RT Channelized 0 0 Lanes 0 0 0 1 0 1 Configuration L R Delay, Queue Length, and Level of ServiceApproach Northbound Southbound Westbound Eastbound
Movement 1 4 7 8 9 10 11 12
Lane Configuration L R v (veh/h) 36 175 C (m) (veh/h) 338 483 v/c 0.11 0.36 95% queue length 0.35 1.64 Control Delay (s/veh) 16.9 16.6 LOS C C Approach Delay (s/veh) -- -- 16.7 Approach LOS -- -- C
Copyright © 2010 University of Florida, All Rights Reserved HCS+TM Version 5.6 Generated: 7/30/2015 3:00 PM
Page 1 of 1Two-Way Stop Control
7/30/2015file://C:\Users\asells\AppData\Local\Temp\u2k6FCB.tmp
Existing AM Peak Signalized

HCS 2010 Signalized Intersection Results Summary
General Information Intersection Information
Agency Duration, h 0.25
Analyst A SELLS Analysis Date Jul 22, 2015 Area Type Other
Jurisdiction Time Period Existing AM PHF 0.87
Urban Street MacCorkle Avenue Analysis Year 2014 Analysis Period 1> 7:30
Intersection MacCorkle Av & Kenna Dr File Name Existing AM - MacCorkle RTOR.xus
Project Description Existing AM_60 minute
Demand Information EB WB NB SB
Approach Movement L T R L T R L T R L T R
Demand ( v ), veh/h 5 1766 9 14 740 10 9 1 42 7 0 0
Signal Information
GreenYellowRed
1.7 3.1 120.8 9.4 0.0 0.03.0 0.0 4.0 4.0 0.0 0.01.0 0.0 2.0 1.0 0.0 0.0
1 2 3
5 6 7 8
Cycle, s 150.0 Reference Phase 2
Offset, s 0 Reference Point End
Uncoordinated No Simult. Gap E/W On
Force Mode Fixed Simult. Gap N/S On
Timer Results EBL EBT WBL WBT NBL NBT SBL SBT
Assigned Phase 1 6 5 2 4 8
Case Number 2.0 4.0 2.0 3.0 8.0 7.0
Phase Duration, s 5.7 126.8 8.8 129.9 14.4 14.4
Change Period, (Y+Rc), s 4.0 6.0 5.0 6.0 5.0 5.0
Max Allow Headway (MAH), s 3.1 0.0 3.1 0.0 3.3 3.3
Queue Clearance Time (gs), s 2.5 3.3 4.5 2.8
Green Extension Time (ge), s 0.0 0.0 0.0 0.0 0.0 0.0
Phase Call Probability 0.21 0.47 0.78 0.78
Max Out Probability 0.00 0.00 0.00 0.00
Movement Group Results EB WB NB SB
Approach Movement L T R L T R L T R L T R
Assigned Movement 1 6 16 5 2 12 7 4 14 3 8 18
Adjusted Flow Rate (v), veh/h 6 1361 679 15 816 11 29 8 0
Adjusted Saturation Flow Rate (s), veh/h/ln 1727 1814 1809 1727 1693 1537 1544 1389 1537
Queue Service Time (gs), s 0.5 0.0 0.0 1.3 7.3 0.2 0.0 0.0 0.0
Cycle Queue Clearance Time (gc), s 0.5 0.0 0.0 1.3 7.3 0.2 2.5 0.8 0.0
Green Ratio (g/C) 0.01 0.81 0.81 0.03 0.83 0.83 0.06 0.06 0.06
Capacity (c), veh/h 20 2921 1457 44 2797 1269 130 135 96
Volume-to-Capacity Ratio (X) 0.293 0.466 0.466 0.353 0.292 0.009 0.222 0.060 0.000
Available Capacity (ca), veh/h 203 2921 1457 191 2797 1269 205 205 174
Back of Queue (Q), veh/ln (95th percentile) 0.4 0.4 0.8 1.1 3.4 0.1 1.9 0.5 0.0
Queue Storage Ratio (RQ) (95th percentile) 0.05 0.00 0.00 0.00 0.00 0.01 0.00 0.00 0.00
Uniform Delay (d1), s/veh 73.3 0.0 0.0 73.2 2.6 1.9 67.1 66.3 0.0
Incremental Delay (d2), s/veh 3.0 0.5 1.1 1.7 0.3 0.0 0.3 0.1 0.0
Initial Queue Delay (d3), s/veh 0.0 0.0 0.0 0.0 0.0 0.0 0.0 0.0 0.0
Control Delay (d), s/veh 76.3 0.5 1.1 74.9 2.8 1.9 67.4 66.3 0.0
Level of Service (LOS) E A A E A A E E
Approach Delay, s/veh / LOS 0.9 A 4.1 A 67.4 E 66.3 E
Intersection Delay, s/veh / LOS 2.7 A
Multimodal Results EB WB NB SB
Pedestrian LOS Score / LOS 2.1 B 2.2 B 3.3 C 3.0 C
Bicycle LOS Score / LOS 1.6 A 1.2 A 0.5 A 0.5 A
Copyright © 2015 University of Florida, All Rights Reserved. HCS 2010™ Streets Version 6.70 Generated: 7/21/2015 4:34:57 PM

HCS 2010 Signalized Intersection Results Summary
General Information Intersection Information
Agency Duration, h 0.25
Analyst A SELLS Analysis Date Jul 22, 2015 Area Type Other
Jurisdiction Time Period Existing AM PHF 0.92
Urban Street MacCorkle Avenue Analysis Year 2014 Analysis Period 1> 7:30
Intersection MacCorkle Ave & I-64 EB File Name Existing AM - MacCorkle RTOR.xus
Project Description Existing AM_60 minute
Demand Information EB WB NB SB
Approach Movement L T R L T R L T R L T R
Demand ( v ), veh/h 1035 27 661 93 0
Signal Information
GreenYellowRed
5.7 117.4 11.8 0.0 0.0 0.04.0 4.0 4.0 0.0 0.0 0.01.0 1.0 1.0 0.0 0.0 0.0
1 2 3
5 6 7 8
Cycle, s 150.0 Reference Phase 2
Offset, s 0 Reference Point End
Uncoordinated No Simult. Gap E/W On
Force Mode Fixed Simult. Gap N/S On
Timer Results EBL EBT WBL WBT NBL NBT SBL SBT
Assigned Phase 6 5 2 4
Case Number 8.3 1.0 4.0 12.0
Phase Duration, s 122.4 10.7 133.2 16.8
Change Period, (Y+Rc), s 5.0 5.0 5.0 5.0
Max Allow Headway (MAH), s 0.0 3.1 0.0 3.1
Queue Clearance Time (gs), s 2.5 11.1
Green Extension Time (ge), s 0.0 0.0 0.0 0.1
Phase Call Probability 0.72 0.99
Max Out Probability 0.00 0.00
Movement Group Results EB WB NB SB
Approach Movement L T R L T R L T R L T R
Assigned Movement 6 5 2 7 4
Adjusted Flow Rate (v), veh/h 2086 30 741 101
Adjusted Saturation Flow Rate (s), veh/h/ln 1727 1678 1677 1631
Queue Service Time (gs), s 42.3 0.5 3.9 9.1
Cycle Queue Clearance Time (gc), s 42.3 0.5 3.9 9.1
Green Ratio (g/C) 0.78 0.83 0.85 0.08
Capacity (c), veh/h 2704 208 2867 129
Volume-to-Capacity Ratio (X) 0.772 0.145 0.258 0.786
Available Capacity (ca), veh/h 2704 347 2867 218
Back of Queue (Q), veh/ln (95th percentile) 15.7 0.6 1.4 7.1
Queue Storage Ratio (RQ) (95th percentile) 0.00 0.12 0.00 0.00
Uniform Delay (d1), s/veh 6.2 10.1 1.2 67.8
Incremental Delay (d2), s/veh 2.0 0.1 0.2 4.0
Initial Queue Delay (d3), s/veh 0.0 0.0 0.0 0.0
Control Delay (d), s/veh 8.2 10.2 1.4 71.8
Level of Service (LOS) A B A E
Approach Delay, s/veh / LOS 8.2 A 1.7 A 71.8 E 0.0
Intersection Delay, s/veh / LOS 8.7 A
Multimodal Results EB WB NB SB
Pedestrian LOS Score / LOS 2.0 B 1.8 A 2.9 C 2.8 C
Bicycle LOS Score / LOS 1.4 A 1.1 A 0.7 A
Copyright © 2015 University of Florida, All Rights Reserved. HCS 2010™ Streets Version 6.70 Generated: 7/21/2015 4:34:57 PM
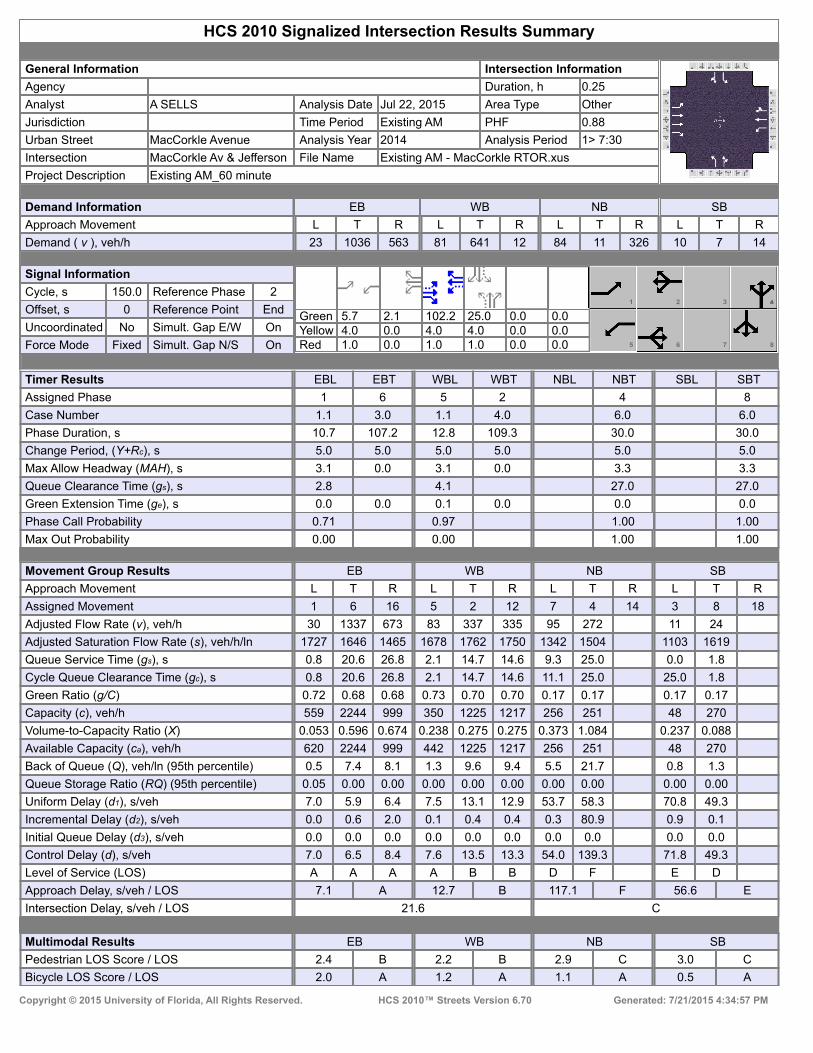
HCS 2010 Signalized Intersection Results Summary
General Information Intersection Information
Agency Duration, h 0.25
Analyst A SELLS Analysis Date Jul 22, 2015 Area Type Other
Jurisdiction Time Period Existing AM PHF 0.88
Urban Street MacCorkle Avenue Analysis Year 2014 Analysis Period 1> 7:30
Intersection MacCorkle Av & Jefferson File Name Existing AM - MacCorkle RTOR.xus
Project Description Existing AM_60 minute
Demand Information EB WB NB SB
Approach Movement L T R L T R L T R L T R
Demand ( v ), veh/h 23 1036 563 81 641 12 84 11 326 10 7 14
Signal Information
GreenYellowRed
5.7 2.1 102.2 25.0 0.0 0.04.0 0.0 4.0 4.0 0.0 0.01.0 0.0 1.0 1.0 0.0 0.0
1 2 3
5 6 7 8
Cycle, s 150.0 Reference Phase 2
Offset, s 0 Reference Point End
Uncoordinated No Simult. Gap E/W On
Force Mode Fixed Simult. Gap N/S On
Timer Results EBL EBT WBL WBT NBL NBT SBL SBT
Assigned Phase 1 6 5 2 4 8
Case Number 1.1 3.0 1.1 4.0 6.0 6.0
Phase Duration, s 10.7 107.2 12.8 109.3 30.0 30.0
Change Period, (Y+Rc), s 5.0 5.0 5.0 5.0 5.0 5.0
Max Allow Headway (MAH), s 3.1 0.0 3.1 0.0 3.3 3.3
Queue Clearance Time (gs), s 2.8 4.1 27.0 27.0
Green Extension Time (ge), s 0.0 0.0 0.1 0.0 0.0 0.0
Phase Call Probability 0.71 0.97 1.00 1.00
Max Out Probability 0.00 0.00 1.00 1.00
Movement Group Results EB WB NB SB
Approach Movement L T R L T R L T R L T R
Assigned Movement 1 6 16 5 2 12 7 4 14 3 8 18
Adjusted Flow Rate (v), veh/h 30 1337 673 83 337 335 95 272 11 24
Adjusted Saturation Flow Rate (s), veh/h/ln 1727 1646 1465 1678 1762 1750 1342 1504 1103 1619
Queue Service Time (gs), s 0.8 20.6 26.8 2.1 14.7 14.6 9.3 25.0 0.0 1.8
Cycle Queue Clearance Time (gc), s 0.8 20.6 26.8 2.1 14.7 14.6 11.1 25.0 25.0 1.8
Green Ratio (g/C) 0.72 0.68 0.68 0.73 0.70 0.70 0.17 0.17 0.17 0.17
Capacity (c), veh/h 559 2244 999 350 1225 1217 256 251 48 270
Volume-to-Capacity Ratio (X) 0.053 0.596 0.674 0.238 0.275 0.275 0.373 1.084 0.237 0.088
Available Capacity (ca), veh/h 620 2244 999 442 1225 1217 256 251 48 270
Back of Queue (Q), veh/ln (95th percentile) 0.5 7.4 8.1 1.3 9.6 9.4 5.5 21.7 0.8 1.3
Queue Storage Ratio (RQ) (95th percentile) 0.05 0.00 0.00 0.00 0.00 0.00 0.00 0.00 0.00 0.00
Uniform Delay (d1), s/veh 7.0 5.9 6.4 7.5 13.1 12.9 53.7 58.3 70.8 49.3
Incremental Delay (d2), s/veh 0.0 0.6 2.0 0.1 0.4 0.4 0.3 80.9 0.9 0.1
Initial Queue Delay (d3), s/veh 0.0 0.0 0.0 0.0 0.0 0.0 0.0 0.0 0.0 0.0
Control Delay (d), s/veh 7.0 6.5 8.4 7.6 13.5 13.3 54.0 139.3 71.8 49.3
Level of Service (LOS) A A A A B B D F E D
Approach Delay, s/veh / LOS 7.1 A 12.7 B 117.1 F 56.6 E
Intersection Delay, s/veh / LOS 21.6 C
Multimodal Results EB WB NB SB
Pedestrian LOS Score / LOS 2.4 B 2.2 B 2.9 C 3.0 C
Bicycle LOS Score / LOS 2.0 A 1.2 A 1.1 A 0.5 A
Copyright © 2015 University of Florida, All Rights Reserved. HCS 2010™ Streets Version 6.70 Generated: 7/21/2015 4:34:57 PM
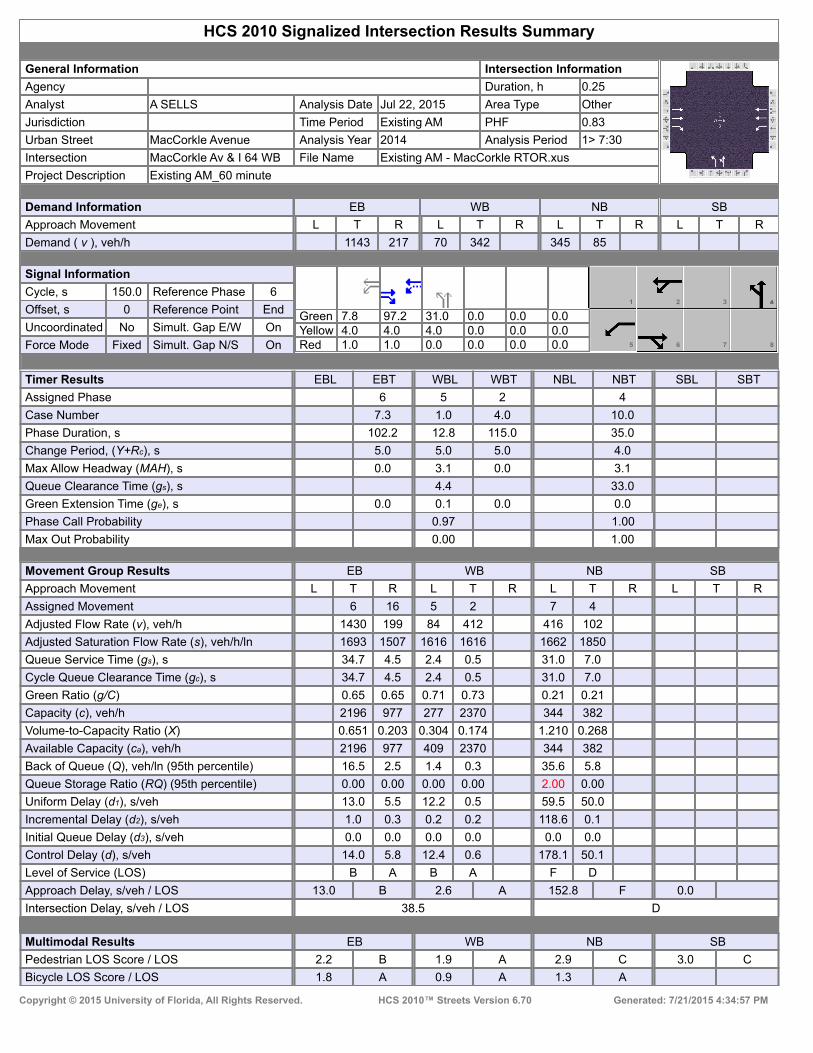
HCS 2010 Signalized Intersection Results Summary
General Information Intersection Information
Agency Duration, h 0.25
Analyst A SELLS Analysis Date Jul 22, 2015 Area Type Other
Jurisdiction Time Period Existing AM PHF 0.83
Urban Street MacCorkle Avenue Analysis Year 2014 Analysis Period 1> 7:30
Intersection MacCorkle Av & I 64 WB File Name Existing AM - MacCorkle RTOR.xus
Project Description Existing AM_60 minute
Demand Information EB WB NB SB
Approach Movement L T R L T R L T R L T R
Demand ( v ), veh/h 1143 217 70 342 345 85
Signal Information
GreenYellowRed
7.8 97.2 31.0 0.0 0.0 0.04.0 4.0 4.0 0.0 0.0 0.01.0 1.0 0.0 0.0 0.0 0.0
1 2 3
5 6 7 8
Cycle, s 150.0 Reference Phase 6
Offset, s 0 Reference Point End
Uncoordinated No Simult. Gap E/W On
Force Mode Fixed Simult. Gap N/S On
Timer Results EBL EBT WBL WBT NBL NBT SBL SBT
Assigned Phase 6 5 2 4
Case Number 7.3 1.0 4.0 10.0
Phase Duration, s 102.2 12.8 115.0 35.0
Change Period, (Y+Rc), s 5.0 5.0 5.0 4.0
Max Allow Headway (MAH), s 0.0 3.1 0.0 3.1
Queue Clearance Time (gs), s 4.4 33.0
Green Extension Time (ge), s 0.0 0.1 0.0 0.0
Phase Call Probability 0.97 1.00
Max Out Probability 0.00 1.00
Movement Group Results EB WB NB SB
Approach Movement L T R L T R L T R L T R
Assigned Movement 6 16 5 2 7 4
Adjusted Flow Rate (v), veh/h 1430 199 84 412 416 102
Adjusted Saturation Flow Rate (s), veh/h/ln 1693 1507 1616 1616 1662 1850
Queue Service Time (gs), s 34.7 4.5 2.4 0.5 31.0 7.0
Cycle Queue Clearance Time (gc), s 34.7 4.5 2.4 0.5 31.0 7.0
Green Ratio (g/C) 0.65 0.65 0.71 0.73 0.21 0.21
Capacity (c), veh/h 2196 977 277 2370 344 382
Volume-to-Capacity Ratio (X) 0.651 0.203 0.304 0.174 1.210 0.268
Available Capacity (ca), veh/h 2196 977 409 2370 344 382
Back of Queue (Q), veh/ln (95th percentile) 16.5 2.5 1.4 0.3 35.6 5.8
Queue Storage Ratio (RQ) (95th percentile) 0.00 0.00 0.00 0.00 2.00 0.00
Uniform Delay (d1), s/veh 13.0 5.5 12.2 0.5 59.5 50.0
Incremental Delay (d2), s/veh 1.0 0.3 0.2 0.2 118.6 0.1
Initial Queue Delay (d3), s/veh 0.0 0.0 0.0 0.0 0.0 0.0
Control Delay (d), s/veh 14.0 5.8 12.4 0.6 178.1 50.1
Level of Service (LOS) B A B A F D
Approach Delay, s/veh / LOS 13.0 B 2.6 A 152.8 F 0.0
Intersection Delay, s/veh / LOS 38.5 D
Multimodal Results EB WB NB SB
Pedestrian LOS Score / LOS 2.2 B 1.9 A 2.9 C 3.0 C
Bicycle LOS Score / LOS 1.8 A 0.9 A 1.3 A
Copyright © 2015 University of Florida, All Rights Reserved. HCS 2010™ Streets Version 6.70 Generated: 7/21/2015 4:34:57 PM

HCS 2010 Signalized Intersection Results Summary
General Information Intersection Information
Agency Duration, h 0.25
Analyst A SELLS Analysis Date Jul 22, 2015 Area Type Other
Jurisdiction Time Period Existing AM PHF 0.91
Urban Street Jefferson Road Analysis Year 2014 Analysis Period 1> 7:30
Intersection Jefferson & Mathias /Ka… File Name Existing AM - Kanawha.xus
Project Description
Demand Information EB WB NB SB
Approach Movement L T R L T R L T R L T R
Demand ( v ), veh/h 38 513 2 6 475 390 2 10 41 521 2
Signal Information
GreenYellowRed
85.0 29.0 8.0 0.0 0.0 0.04.0 4.0 3.0 0.0 0.0 0.01.0 1.0 1.0 0.0 0.0 0.0
1 2 3 4
5 6 7
Cycle, s 136.0 Reference Phase 2
Offset, s 0 Reference Point End
Uncoordinated No Simult. Gap E/W On
Force Mode Fixed Simult. Gap N/S On
Timer Results EBL EBT WBL WBT NBL NBT SBL SBT
Assigned Phase 6 2 8 4
Case Number 6.0 7.0 12.0 10.0
Phase Duration, s 90.0 90.0 12.0 34.0
Change Period, (Y+Rc), s 5.0 5.0 4.0 5.0
Max Allow Headway (MAH), s 0.0 0.0 3.2 3.1
Queue Clearance Time (gs), s 6.5 31.0
Green Extension Time (ge), s 0.0 0.0 0.0 0.0
Phase Call Probability 1.00 1.00
Max Out Probability 1.00 1.00
Movement Group Results EB WB NB SB
Approach Movement L T R L T R L T R L T R
Assigned Movement 1 6 16 5 2 12 3 8 18 7 4
Adjusted Flow Rate (v), veh/h 42 566 410 323 54 573 2
Adjusted Saturation Flow Rate (s), veh/h/ln 976 1812 1807 1537 1594 1727 1814
Queue Service Time (gs), s 1.3 12.1 0.0 12.1 4.5 29.0 0.1
Cycle Queue Clearance Time (gc), s 13.9 12.1 12.1 12.1 4.5 29.0 0.1
Green Ratio (g/C) 0.62 0.62 0.62 0.62 0.06 0.21 0.21
Capacity (c), veh/h 576 1133 1156 961 94 368 387
Volume-to-Capacity Ratio (X) 0.072 0.500 0.355 0.337 0.574 1.554 0.006
Available Capacity (ca), veh/h 576 1133 1156 961 94 368 387
Back of Queue (Q), veh/ln (95th percentile) 0.6 6.6 7.7 7.1 3.5 60.1 0.1
Queue Storage Ratio (RQ) (95th percentile) 0.06 0.00 0.00 0.00 0.00 0.00 0.00
Uniform Delay (d1), s/veh 7.2 5.3 9.2 10.3 62.3 53.5 42.1
Incremental Delay (d2), s/veh 0.2 1.6 0.8 0.9 5.5 262.5 0.0
Initial Queue Delay (d3), s/veh 0.0 0.0 0.0 0.0 0.0 0.0 0.0
Control Delay (d), s/veh 7.5 6.8 10.0 11.2 67.8 316.0 42.1
Level of Service (LOS) A A A B E F D
Approach Delay, s/veh / LOS 6.9 A 10.5 B 67.8 E 314.9 F
Intersection Delay, s/veh / LOS 99.8 F
Multimodal Results EB WB NB SB
Pedestrian LOS Score / LOS 2.1 B 2.2 B 2.3 B 2.3 B
Bicycle LOS Score / LOS 1.5 A 2.0 B 0.6 A 1.4 A
Copyright © 2015 University of Florida, All Rights Reserved. HCS 2010™ Streets Version 6.70 Generated: 7/27/2015 11:27:57 AM
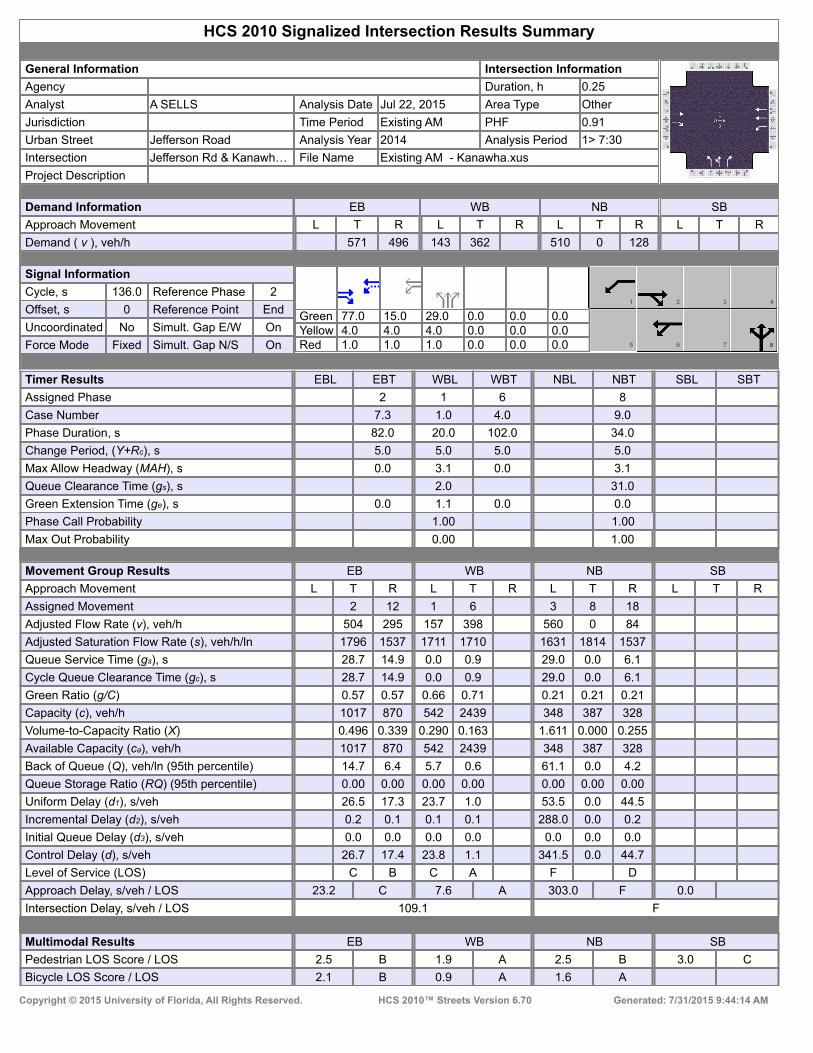
HCS 2010 Signalized Intersection Results Summary
General Information Intersection Information
Agency Duration, h 0.25
Analyst A SELLS Analysis Date Jul 22, 2015 Area Type Other
Jurisdiction Time Period Existing AM PHF 0.91
Urban Street Jefferson Road Analysis Year 2014 Analysis Period 1> 7:30
Intersection Jefferson Rd & Kanawh… File Name Existing AM - Kanawha.xus
Project Description
Demand Information EB WB NB SB
Approach Movement L T R L T R L T R L T R
Demand ( v ), veh/h 571 496 143 362 510 0 128
Signal Information
GreenYellowRed
77.0 15.0 29.0 0.0 0.0 0.04.0 4.0 4.0 0.0 0.0 0.01.0 1.0 1.0 0.0 0.0 0.0
1 2 3 4
5 6 7
Cycle, s 136.0 Reference Phase 2
Offset, s 0 Reference Point End
Uncoordinated No Simult. Gap E/W On
Force Mode Fixed Simult. Gap N/S On
Timer Results EBL EBT WBL WBT NBL NBT SBL SBT
Assigned Phase 2 1 6 8
Case Number 7.3 1.0 4.0 9.0
Phase Duration, s 82.0 20.0 102.0 34.0
Change Period, (Y+Rc), s 5.0 5.0 5.0 5.0
Max Allow Headway (MAH), s 0.0 3.1 0.0 3.1
Queue Clearance Time (gs), s 2.0 31.0
Green Extension Time (ge), s 0.0 1.1 0.0 0.0
Phase Call Probability 1.00 1.00
Max Out Probability 0.00 1.00
Movement Group Results EB WB NB SB
Approach Movement L T R L T R L T R L T R
Assigned Movement 2 12 1 6 3 8 18
Adjusted Flow Rate (v), veh/h 504 295 157 398 560 0 84
Adjusted Saturation Flow Rate (s), veh/h/ln 1796 1537 1711 1710 1631 1814 1537
Queue Service Time (gs), s 28.7 14.9 0.0 0.9 29.0 0.0 6.1
Cycle Queue Clearance Time (gc), s 28.7 14.9 0.0 0.9 29.0 0.0 6.1
Green Ratio (g/C) 0.57 0.57 0.66 0.71 0.21 0.21 0.21
Capacity (c), veh/h 1017 870 542 2439 348 387 328
Volume-to-Capacity Ratio (X) 0.496 0.339 0.290 0.163 1.611 0.000 0.255
Available Capacity (ca), veh/h 1017 870 542 2439 348 387 328
Back of Queue (Q), veh/ln (95th percentile) 14.7 6.4 5.7 0.6 61.1 0.0 4.2
Queue Storage Ratio (RQ) (95th percentile) 0.00 0.00 0.00 0.00 0.00 0.00 0.00
Uniform Delay (d1), s/veh 26.5 17.3 23.7 1.0 53.5 0.0 44.5
Incremental Delay (d2), s/veh 0.2 0.1 0.1 0.1 288.0 0.0 0.2
Initial Queue Delay (d3), s/veh 0.0 0.0 0.0 0.0 0.0 0.0 0.0
Control Delay (d), s/veh 26.7 17.4 23.8 1.1 341.5 0.0 44.7
Level of Service (LOS) C B C A F D
Approach Delay, s/veh / LOS 23.2 C 7.6 A 303.0 F 0.0
Intersection Delay, s/veh / LOS 109.1 F
Multimodal Results EB WB NB SB
Pedestrian LOS Score / LOS 2.5 B 1.9 A 2.5 B 3.0 C
Bicycle LOS Score / LOS 2.1 B 0.9 A 1.6 A
Copyright © 2015 University of Florida, All Rights Reserved. HCS 2010™ Streets Version 6.70 Generated: 7/31/2015 9:44:14 AM
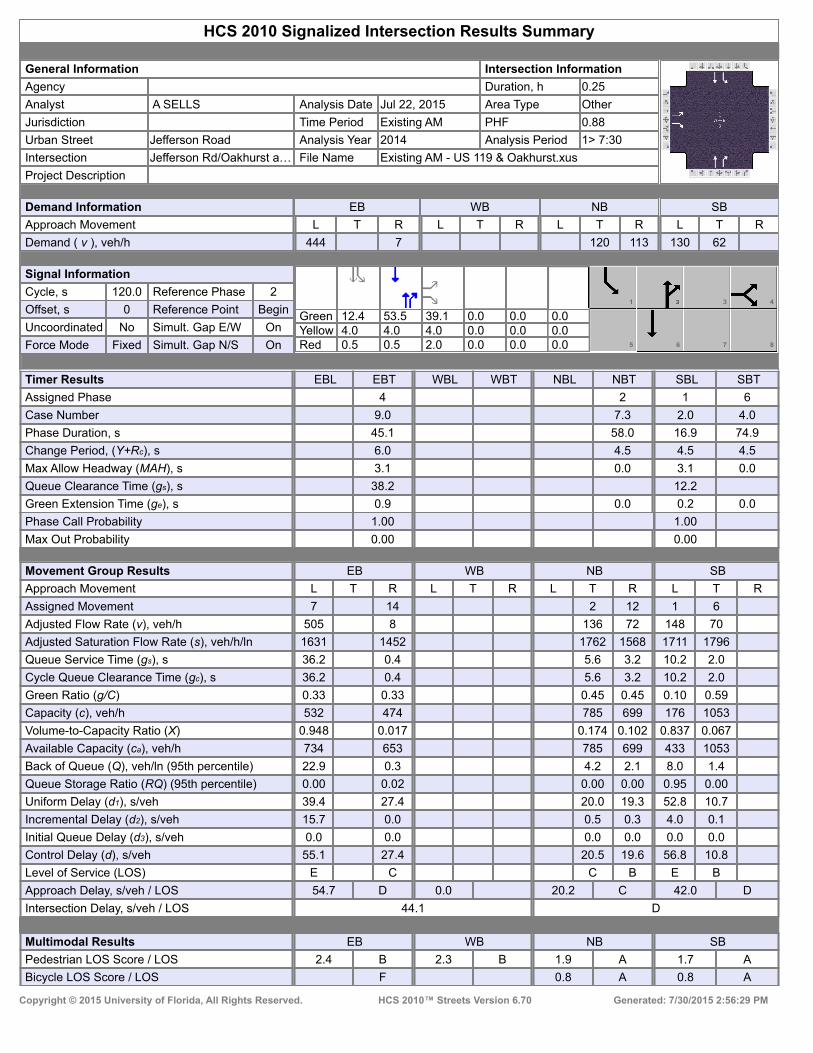
HCS 2010 Signalized Intersection Results Summary
General Information Intersection Information
Agency Duration, h 0.25
Analyst A SELLS Analysis Date Jul 22, 2015 Area Type Other
Jurisdiction Time Period Existing AM PHF 0.88
Urban Street Jefferson Road Analysis Year 2014 Analysis Period 1> 7:30
Intersection Jefferson Rd/Oakhurst a… File Name Existing AM - US 119 & Oakhurst.xus
Project Description
Demand Information EB WB NB SB
Approach Movement L T R L T R L T R L T R
Demand ( v ), veh/h 444 7 120 113 130 62
Signal Information
GreenYellowRed
12.4 53.5 39.1 0.0 0.0 0.04.0 4.0 4.0 0.0 0.0 0.00.5 0.5 2.0 0.0 0.0 0.0
1 3 4
5 6 7 8
Cycle, s 120.0 Reference Phase 2
Offset, s 0 Reference Point Begin
Uncoordinated No Simult. Gap E/W On
Force Mode Fixed Simult. Gap N/S On
Timer Results EBL EBT WBL WBT NBL NBT SBL SBT
Assigned Phase 4 2 1 6
Case Number 9.0 7.3 2.0 4.0
Phase Duration, s 45.1 58.0 16.9 74.9
Change Period, (Y+Rc), s 6.0 4.5 4.5 4.5
Max Allow Headway (MAH), s 3.1 0.0 3.1 0.0
Queue Clearance Time (gs), s 38.2 12.2
Green Extension Time (ge), s 0.9 0.0 0.2 0.0
Phase Call Probability 1.00 1.00
Max Out Probability 0.00 0.00
Movement Group Results EB WB NB SB
Approach Movement L T R L T R L T R L T R
Assigned Movement 7 14 2 12 1 6
Adjusted Flow Rate (v), veh/h 505 8 136 72 148 70
Adjusted Saturation Flow Rate (s), veh/h/ln 1631 1452 1762 1568 1711 1796
Queue Service Time (gs), s 36.2 0.4 5.6 3.2 10.2 2.0
Cycle Queue Clearance Time (gc), s 36.2 0.4 5.6 3.2 10.2 2.0
Green Ratio (g/C) 0.33 0.33 0.45 0.45 0.10 0.59
Capacity (c), veh/h 532 474 785 699 176 1053
Volume-to-Capacity Ratio (X) 0.948 0.017 0.174 0.102 0.837 0.067
Available Capacity (ca), veh/h 734 653 785 699 433 1053
Back of Queue (Q), veh/ln (95th percentile) 22.9 0.3 4.2 2.1 8.0 1.4
Queue Storage Ratio (RQ) (95th percentile) 0.00 0.02 0.00 0.00 0.95 0.00
Uniform Delay (d1), s/veh 39.4 27.4 20.0 19.3 52.8 10.7
Incremental Delay (d2), s/veh 15.7 0.0 0.5 0.3 4.0 0.1
Initial Queue Delay (d3), s/veh 0.0 0.0 0.0 0.0 0.0 0.0
Control Delay (d), s/veh 55.1 27.4 20.5 19.6 56.8 10.8
Level of Service (LOS) E C C B E B
Approach Delay, s/veh / LOS 54.7 D 0.0 20.2 C 42.0 D
Intersection Delay, s/veh / LOS 44.1 D
Multimodal Results EB WB NB SB
Pedestrian LOS Score / LOS 2.4 B 2.3 B 1.9 A 1.7 A
Bicycle LOS Score / LOS F 0.8 A 0.8 A
Copyright © 2015 University of Florida, All Rights Reserved. HCS 2010™ Streets Version 6.70 Generated: 7/30/2015 2:56:29 PM

Existing PM Peak Unsignalized

TWO-WAY STOP CONTROL SUMMARY
General Information Site Information Analyst ASELLS Agency/Co. STANTEC Date Performed 11/25/2014 Analysis Time Period Existing PM
IntersectionJurisdictionAnalysis Year 2014
Project Description East/West Street: Bob Evans entrance North/South Street: Jefferson Road Intersection Orientation: North-South Study Period (hrs): 0.25
Vehicle Volumes and Adjustments Major Street Northbound Southbound Movement 1 2 3 4 5 6
L T R L T RVolume (veh/h) 10 575 579 43 Peak-Hour Factor, PHF 0.95 0.96 1.00 1.00 0.90 0.69 Hourly Flow Rate, HFR (veh/h)
10 598 0 0 643 62
Percent Heavy Vehicles 2 -- -- 0 -- -- Median Type Undivided RT Channelized 0 0 Lanes 0 2 0 0 2 0 Configuration LT T T TR Upstream Signal 1 0 Minor Street Eastbound Westbound Movement 7 8 9 10 11 12
L T R L T RVolume (veh/h) 19 21 Peak-Hour Factor, PHF 0.32 1.00 0.88 1.00 1.00 1.00 Hourly Flow Rate, HFR (veh/h) 59 0 23 0 0 0
Percent Heavy Vehicles 2 0 2 0 0 0 Percent Grade (%) 0 0 Flared Approach N N Storage 0 0 RT Channelized 0 0 Lanes 1 0 1 0 0 0 Configuration L R Delay, Queue Length, and Level of ServiceApproach Northbound Southbound Westbound Eastbound
Movement 1 4 7 8 9 10 11 12
Lane Configuration LT L R v (veh/h) 10 59 23 C (m) (veh/h) 885 253 684 v/c 0.01 0.23 0.03 95% queue length 0.03 0.88 0.10 Control Delay (s/veh) 9.1 23.5 10.4 LOS A C B Approach Delay (s/veh) -- -- 19.8 Approach LOS -- -- C
Copyright © 2010 University of Florida, All Rights Reserved HCS+TM Version 5.6 Generated: 4/16/2015 2:53 PM
Page 1 of 1Two-Way Stop Control
4/16/2015file://C:\Users\asells\AppData\Local\Temp\u2kDA1F.tmp

TWO-WAY STOP CONTROL SUMMARY
General Information Site Information Analyst ASELLS Agency/Co. STANTEC Date Performed 11/25/2014 Analysis Time Period Existing PM
Intersection Jurisdiction Analysis Year 2014
Project Description East/West Street: McDonalds entrance North/South Street: Jefferson Road Intersection Orientation: North-South Study Period (hrs): 0.25
Vehicle Volumes and Adjustments Major Street Northbound Southbound Movement 1 2 3 4 5 6 L T R L T RVolume (veh/h) 16 586 556 33 Peak-Hour Factor, PHF 0.78 0.94 1.00 1.00 0.89 0.87 Hourly Flow Rate, HFR (veh/h)
20 623 0 0 624 37
Percent Heavy Vehicles 2 -- -- 0 -- -- Median Type Undivided RT Channelized 0 0 Lanes 0 2 0 0 2 0 Configuration LT T T TR Upstream Signal 0 0 Minor Street Eastbound Westbound Movement 7 8 9 10 11 12
L T R L T RVolume (veh/h) 1 0 Peak-Hour Factor, PHF 1.00 1.00 1.00 1.00 1.00 1.00 Hourly Flow Rate, HFR (veh/h) 1 0 0 0 0 0
Percent Heavy Vehicles 2 0 2 0 0 0 Percent Grade (%) 0 0 Flared Approach N N Storage 0 0 RT Channelized 0 0 Lanes 1 0 1 0 0 0 Configuration L R Delay, Queue Length, and Level of ServiceApproach Northbound Southbound Westbound Eastbound
Movement 1 4 7 8 9 10 11 12
Lane Configuration LT L R v (veh/h) 20 1 0 C (m) (veh/h) 919 235 704 v/c 0.02 0.00 0.00 95% queue length 0.07 0.01 0.00 Control Delay (s/veh) 9.0 20.4 10.1 LOS A C B Approach Delay (s/veh) -- -- 20.4 Approach LOS -- -- C
Copyright © 2010 University of Florida, All Rights Reserved HCS+TM Version 5.6 Generated: 4/16/2015 2:54 PM
Page 1 of 1Two-Way Stop Control
4/16/2015file://C:\Users\asells\AppData\Local\Temp\u2kFCAD.tmp

TWO-WAY STOP CONTROL SUMMARY
General Information Site Information Analyst ASELLS Agency/Co. STANTEC Date Performed 11/25/2014 Analysis Time Period Existing PM
Intersection Jurisdiction Analysis Year 2014
Project Description East/West Street: Community Center - North North/South Street: Jefferson Road Intersection Orientation: North-South Study Period (hrs): 0.25
Vehicle Volumes and Adjustments Major Street Northbound Southbound Movement 1 2 3 4 5 6 L T R L T RVolume (veh/h) 10 581 584 33 Peak-Hour Factor, PHF 0.83 0.98 1.00 1.00 0.98 0.75 Hourly Flow Rate, HFR (veh/h)
12 592 0 0 595 44
Percent Heavy Vehicles 2 -- -- 0 -- -- Median Type Undivided RT Channelized 0 0 Lanes 0 1 0 0 2 0 Configuration LT T TR Upstream Signal 0 0 Minor Street Eastbound Westbound Movement 7 8 9 10 11 12
L T R L T RVolume (veh/h) 7 0 10 Peak-Hour Factor, PHF 0.88 1.00 0.79 1.00 1.00 1.00 Hourly Flow Rate, HFR (veh/h) 7 0 12 0 0 0
Percent Heavy Vehicles 2 0 2 0 0 0 Percent Grade (%) 0 0 Flared Approach N N Storage 0 0 RT Channelized 0 0 Lanes 0 1 0 0 0 0 Configuration LTR Delay, Queue Length, and Level of ServiceApproach Northbound Southbound Westbound Eastbound
Movement 1 4 7 8 9 10 11 12
Lane Configuration LT LTR v (veh/h) 12 19 C (m) (veh/h) 939 324 v/c 0.01 0.06 95% queue length 0.04 0.19 Control Delay (s/veh) 8.9 16.8 LOS A C Approach Delay (s/veh) -- -- 16.8 Approach LOS -- -- C
Copyright © 2010 University of Florida, All Rights Reserved HCS+TM Version 5.6 Generated: 4/16/2015 2:53 PM
Page 1 of 1Two-Way Stop Control
4/16/2015file://C:\Users\asells\AppData\Local\Temp\u2k68F6.tmp

TWO-WAY STOP CONTROL SUMMARY
General Information Site Information Analyst ASELLS Agency/Co. STANTEC Date Performed 11/25/2014 Analysis Time Period Existing PM
Intersection Jurisdiction Analysis Year 2014
Project Description East/West Street: Community Center - South North/South Street: Jefferson Road Intersection Orientation: North-South Study Period (hrs): 0.25
Vehicle Volumes and Adjustments Major Street Northbound Southbound Movement 1 2 3 4 5 6 L T R L T RVolume (veh/h) 11 581 566 1 Peak-Hour Factor, PHF 0.79 0.96 1.00 1.00 0.92 0.25 Hourly Flow Rate, HFR (veh/h)
13 605 0 0 615 4
Percent Heavy Vehicles 2 -- -- 0 -- -- Median Type Undivided RT Channelized 0 0 Lanes 0 1 0 0 2 0 Configuration LT T TR Upstream Signal 0 0 Minor Street Eastbound Westbound Movement 7 8 9 10 11 12
L T R L T RVolume (veh/h) 3 0 22 Peak-Hour Factor, PHF 0.63 1.00 0.72 1.00 1.00 1.00 Hourly Flow Rate, HFR (veh/h) 4 0 30 0 0 0
Percent Heavy Vehicles 2 0 2 0 0 0 Percent Grade (%) 0 0 Flared Approach N N Storage 0 0 RT Channelized 0 0 Lanes 0 1 0 0 0 0 Configuration LTR Delay, Queue Length, and Level of ServiceApproach Northbound Southbound Westbound Eastbound
Movement 1 4 7 8 9 10 11 12
Lane Configuration LT LTR v (veh/h) 13 34 C (m) (veh/h) 955 517 v/c 0.01 0.07 95% queue length 0.04 0.21 Control Delay (s/veh) 8.8 12.5 LOS A B Approach Delay (s/veh) -- -- 12.5 Approach LOS -- -- B
Copyright © 2010 University of Florida, All Rights Reserved HCS+TM Version 5.6 Generated: 4/16/2015 2:51 PM
Page 1 of 1Two-Way Stop Control
4/16/2015file://C:\Users\asells\AppData\Local\Temp\u2k4956.tmp

TWO-WAY STOP CONTROL SUMMARY
General Information Site Information Analyst A SELLS Agency/Co. STANTEC Date Performed 11/25/2014 Analysis Time Period Existing PM
Intersection Jurisdiction Analysis Year 2014
Project Description East/West Street: Washington Street North/South Street: Jefferson Road Intersection Orientation: North-South Study Period (hrs): 0.25
Vehicle Volumes and Adjustments Major Street Northbound Southbound Movement 1 2 3 4 5 6 L T R L T RVolume (veh/h) 549 13 21 551 Peak-Hour Factor, PHF 1.00 0.94 0.89 0.88 0.91 1.00 Hourly Flow Rate, HFR (veh/h)
0 584 14 23 605 0
Percent Heavy Vehicles 0 -- -- 2 -- -- Median Type Undivided RT Channelized 0 0 Lanes 0 1 0 0 2 0 Configuration TR LT T Upstream Signal 0 0 Minor Street Eastbound Westbound Movement 7 8 9 10 11 12
L T R L T RVolume (veh/h) 10 0 27 Peak-Hour Factor, PHF 1.00 1.00 1.00 0.63 1.00 0.88 Hourly Flow Rate, HFR (veh/h) 0 0 0 15 0 30
Percent Heavy Vehicles 0 0 0 2 0 2 Percent Grade (%) 0 0 Flared Approach N N Storage 0 0 RT Channelized 0 0 Lanes 0 0 0 0 1 0 Configuration LTR Delay, Queue Length, and Level of ServiceApproach Northbound Southbound Westbound Eastbound
Movement 1 4 7 8 9 10 11 12
Lane Configuration LT LTR v (veh/h) 23 45 C (m) (veh/h) 968 378 v/c 0.02 0.12 95% queue length 0.07 0.40 Control Delay (s/veh) 8.8 15.8 LOS A C Approach Delay (s/veh) -- -- 15.8 Approach LOS -- -- C
Copyright © 2010 University of Florida, All Rights Reserved HCS+TM Version 5.6 Generated: 4/16/2015 2:56 PM
Page 1 of 1Two-Way Stop Control
4/16/2015file://C:\Users\asells\AppData\Local\Temp\u2kA9FB.tmp

TWO-WAY STOP CONTROL SUMMARY
General Information Site Information Analyst A SELLS Agency/Co. STANTEC Date Performed 11/25/2014 Analysis Time Period Existing PM
Intersection Jurisdiction Analysis Year 2014
Project Description East/West Street: Pennslyvania Avenue North/South Street: Jefferson Road Intersection Orientation: North-South Study Period (hrs): 0.25
Vehicle Volumes and Adjustments Major Street Northbound Southbound Movement 1 2 3 4 5 6 L T R L T RVolume (veh/h) 544 10 4 559 Peak-Hour Factor, PHF 1.00 0.94 0.59 1.00 0.89 1.00 Hourly Flow Rate, HFR (veh/h)
0 578 16 4 628 0
Percent Heavy Vehicles 0 -- -- 2 -- -- Median Type Undivided RT Channelized 0 0 Lanes 0 1 0 0 2 0 Configuration TR LT T Upstream Signal 1 0 Minor Street Eastbound Westbound Movement 7 8 9 10 11 12
L T R L T RVolume (veh/h) 3 0 3 Peak-Hour Factor, PHF 1.00 1.00 1.00 0.42 1.00 0.30 Hourly Flow Rate, HFR (veh/h) 0 0 0 7 0 9
Percent Heavy Vehicles 0 0 0 2 0 2 Percent Grade (%) 0 0 Flared Approach N N Storage 0 0 RT Channelized 0 0 Lanes 0 0 0 0 1 0 Configuration LTR Delay, Queue Length, and Level of ServiceApproach Northbound Southbound Westbound Eastbound
Movement 1 4 7 8 9 10 11 12
Lane Configuration LT LTR v (veh/h) 4 16 C (m) (veh/h) 950 463 v/c 0.00 0.03 95% queue length 0.01 0.11 Control Delay (s/veh) 8.8 13.1 LOS A B Approach Delay (s/veh) -- -- 13.1 Approach LOS -- -- B
Copyright © 2010 University of Florida, All Rights Reserved HCS+TM Version 5.6 Generated: 4/16/2015 2:55 PM
Page 1 of 1Two-Way Stop Control
4/16/2015file://C:\Users\asells\AppData\Local\Temp\u2k683B.tmp

TWO-WAY STOP CONTROL SUMMARY
General Information Site Information Analyst A SELLS Agency/Co. Date Performed 12/3/2014 Analysis Time Period Existing PM Peak
Intersection Jurisdiction Analysis Year 2014
Project Description East/West Street: Kramer Street North/South Street: Jefferson Road Intersection Orientation: North-South Study Period (hrs): 0.25
Vehicle Volumes and Adjustments Major Street Northbound Southbound Movement 1 2 3 4 5 6 L T R L T RVolume (veh/h) 0 738 1058 1 Peak-Hour Factor, PHF 1.00 0.89 1.00 1.00 0.94 0.25 Hourly Flow Rate, HFR (veh/h)
0 829 0 0 1125 4
Percent Heavy Vehicles 3 -- -- 0 -- -- Median Type Undivided RT Channelized 0 0 Lanes 0 1 0 0 1 0 Configuration LT TR Upstream Signal 1 0 Minor Street Eastbound Westbound Movement 7 8 9 10 11 12
L T R L T RVolume (veh/h) 2 0 2 Peak-Hour Factor, PHF 0.33 1.00 1.00 0.80 1.00 0.85 Hourly Flow Rate, HFR (veh/h) 6 0 2 0 0 0
Percent Heavy Vehicles 100 0 100 3 0 0 Percent Grade (%) 0 0 Flared Approach N N Storage 0 0 RT Channelized 0 0 Lanes 0 1 0 0 0 0 Configuration LTR Delay, Queue Length, and Level of ServiceApproach Northbound Southbound Westbound Eastbound
Movement 1 4 7 8 9 10 11 12
Lane Configuration LT LTR v (veh/h) 0 8 C (m) (veh/h) 615 48 v/c 0.00 0.17 95% queue length 0.00 0.54 Control Delay (s/veh) 10.9 94.4 LOS B F Approach Delay (s/veh) -- -- 94.4 Approach LOS -- -- F
Copyright © 2010 University of Florida, All Rights Reserved HCS+TM Version 5.6 Generated: 7/31/2015 10:14 AM
Page 1 of 1Two-Way Stop Control
7/31/2015file://C:\Users\asells\AppData\Local\Temp\u2kE10E.tmp

TWO-WAY STOP CONTROL SUMMARY
General Information Site Information Analyst A SELLS Agency/Co.Date Performed 7/22/15 Analysis Time Period Existing PM Peak
IntersectionJurisdictionAnalysis Year 2014
Project Description East/West Street: US 119 North/South Street: Jefferson Road Intersection Orientation: North-South Study Period (hrs): 0.25
Vehicle Volumes and Adjustments Major Street Northbound Southbound Movement 1 2 3 4 5 6
L T R L T RVolume (veh/h) 25 665 245 Peak-Hour Factor, PHF 0.74 0.82 1.00 1.00 0.91 1.00 Hourly Flow Rate, HFR (veh/h)
33 810 0 0 269 0
Percent Heavy Vehicles 3 -- -- 0 -- -- Median Type Undivided RT Channelized 0 0 Lanes 1 1 0 0 1 0 Configuration L T T Upstream Signal 0 1 Minor Street Eastbound Westbound Movement 7 8 9 10 11 12
L T R L T RVolume (veh/h) 61 97 Peak-Hour Factor, PHF 1.00 1.00 1.00 0.80 1.00 0.85 Hourly Flow Rate, HFR (veh/h) 0 0 0 76 0 114
Percent Heavy Vehicles 0 0 0 3 0 0 Percent Grade (%) 0 0 Flared Approach N N Storage 0 0 RT Channelized 0 0 Lanes 0 0 0 1 0 1 Configuration L R Delay, Queue Length, and Level of ServiceApproach Northbound Southbound Westbound Eastbound
Movement 1 4 7 8 9 10 11 12
Lane Configuration L L R v (veh/h) 33 76 114 C (m) (veh/h) 1308 202 383 v/c 0.03 0.38 0.30 95% queue length 0.08 1.64 1.23 Control Delay (s/veh) 7.8 33.2 18.3 LOS A D C Approach Delay (s/veh) -- -- 24.3 Approach LOS -- -- C
Copyright © 2010 University of Florida, All Rights Reserved HCS+TM Version 5.6 Generated: 7/27/2015 12:16 PM
Page 1 of 1Two-Way Stop Control
7/27/2015file://C:\Users\asells\AppData\Local\Temp\u2k6700.tmp

Existing PM Peak Signalized
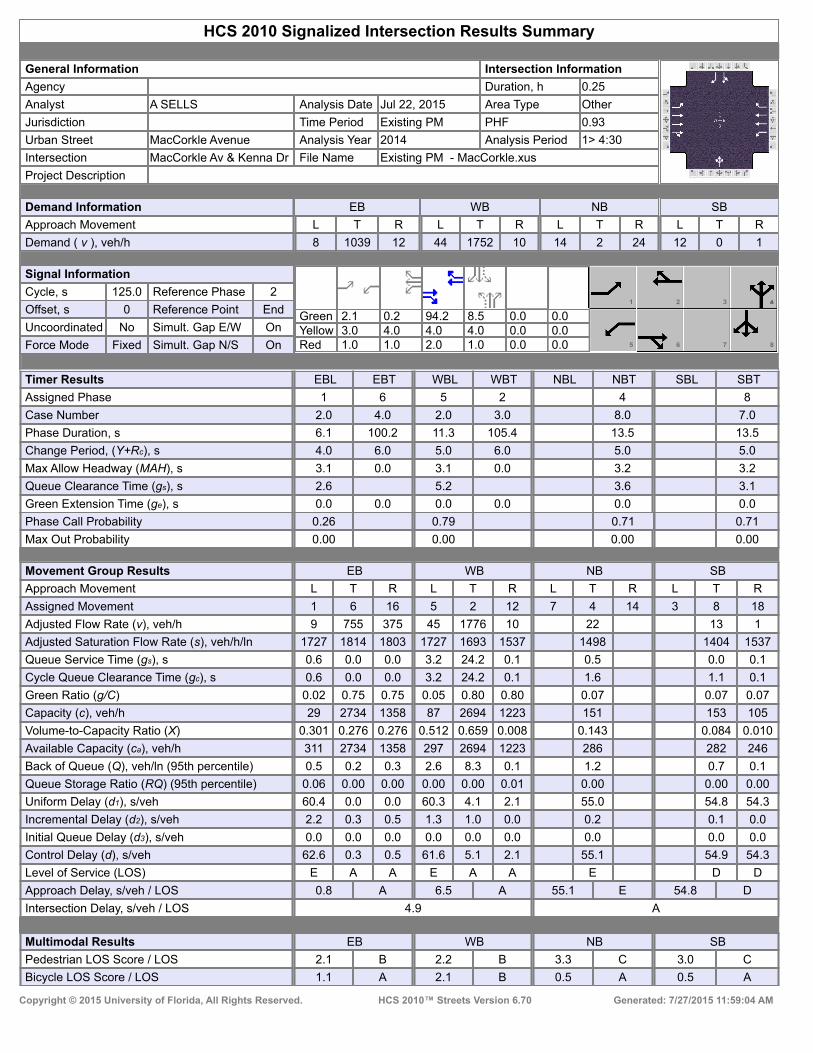
HCS 2010 Signalized Intersection Results Summary
General Information Intersection Information
Agency Duration, h 0.25
Analyst A SELLS Analysis Date Jul 22, 2015 Area Type Other
Jurisdiction Time Period Existing PM PHF 0.93
Urban Street MacCorkle Avenue Analysis Year 2014 Analysis Period 1> 4:30
Intersection MacCorkle Av & Kenna Dr File Name Existing PM - MacCorkle.xus
Project Description
Demand Information EB WB NB SB
Approach Movement L T R L T R L T R L T R
Demand ( v ), veh/h 8 1039 12 44 1752 10 14 2 24 12 0 1
Signal Information
GreenYellowRed
2.1 0.2 94.2 8.5 0.0 0.03.0 4.0 4.0 4.0 0.0 0.01.0 1.0 2.0 1.0 0.0 0.0
1 2 3
5 6 7 8
Cycle, s 125.0 Reference Phase 2
Offset, s 0 Reference Point End
Uncoordinated No Simult. Gap E/W On
Force Mode Fixed Simult. Gap N/S On
Timer Results EBL EBT WBL WBT NBL NBT SBL SBT
Assigned Phase 1 6 5 2 4 8
Case Number 2.0 4.0 2.0 3.0 8.0 7.0
Phase Duration, s 6.1 100.2 11.3 105.4 13.5 13.5
Change Period, (Y+Rc), s 4.0 6.0 5.0 6.0 5.0 5.0
Max Allow Headway (MAH), s 3.1 0.0 3.1 0.0 3.2 3.2
Queue Clearance Time (gs), s 2.6 5.2 3.6 3.1
Green Extension Time (ge), s 0.0 0.0 0.0 0.0 0.0 0.0
Phase Call Probability 0.26 0.79 0.71 0.71
Max Out Probability 0.00 0.00 0.00 0.00
Movement Group Results EB WB NB SB
Approach Movement L T R L T R L T R L T R
Assigned Movement 1 6 16 5 2 12 7 4 14 3 8 18
Adjusted Flow Rate (v), veh/h 9 755 375 45 1776 10 22 13 1
Adjusted Saturation Flow Rate (s), veh/h/ln 1727 1814 1803 1727 1693 1537 1498 1404 1537
Queue Service Time (gs), s 0.6 0.0 0.0 3.2 24.2 0.1 0.5 0.0 0.1
Cycle Queue Clearance Time (gc), s 0.6 0.0 0.0 3.2 24.2 0.1 1.6 1.1 0.1
Green Ratio (g/C) 0.02 0.75 0.75 0.05 0.80 0.80 0.07 0.07 0.07
Capacity (c), veh/h 29 2734 1358 87 2694 1223 151 153 105
Volume-to-Capacity Ratio (X) 0.301 0.276 0.276 0.512 0.659 0.008 0.143 0.084 0.010
Available Capacity (ca), veh/h 311 2734 1358 297 2694 1223 286 282 246
Back of Queue (Q), veh/ln (95th percentile) 0.5 0.2 0.3 2.6 8.3 0.1 1.2 0.7 0.1
Queue Storage Ratio (RQ) (95th percentile) 0.06 0.00 0.00 0.00 0.00 0.01 0.00 0.00 0.00
Uniform Delay (d1), s/veh 60.4 0.0 0.0 60.3 4.1 2.1 55.0 54.8 54.3
Incremental Delay (d2), s/veh 2.2 0.3 0.5 1.3 1.0 0.0 0.2 0.1 0.0
Initial Queue Delay (d3), s/veh 0.0 0.0 0.0 0.0 0.0 0.0 0.0 0.0 0.0
Control Delay (d), s/veh 62.6 0.3 0.5 61.6 5.1 2.1 55.1 54.9 54.3
Level of Service (LOS) E A A E A A E D D
Approach Delay, s/veh / LOS 0.8 A 6.5 A 55.1 E 54.8 D
Intersection Delay, s/veh / LOS 4.9 A
Multimodal Results EB WB NB SB
Pedestrian LOS Score / LOS 2.1 B 2.2 B 3.3 C 3.0 C
Bicycle LOS Score / LOS 1.1 A 2.1 B 0.5 A 0.5 A
Copyright © 2015 University of Florida, All Rights Reserved. HCS 2010™ Streets Version 6.70 Generated: 7/27/2015 11:59:04 AM

HCS 2010 Signalized Intersection Results Summary
General Information Intersection Information
Agency Duration, h 0.25
Analyst A SELLS Analysis Date Jul 22, 2015 Area Type Other
Jurisdiction Time Period Existing PM PHF 0.93
Urban Street MacCorkle Avenue Analysis Year 2014 Analysis Period 1> 4:30
Intersection MacCorkle Av & I-64 EB File Name Existing PM - MacCorkle.xus
Project Description
Demand Information EB WB NB SB
Approach Movement L T R L T R L T R L T R
Demand ( v ), veh/h 633 56 1562 42 0
Signal Information
GreenYellowRed
7.1 93.4 9.5 0.0 0.0 0.04.0 4.0 4.0 0.0 0.0 0.01.0 1.0 1.0 0.0 0.0 0.0
1 2 3
5 6 7 8
Cycle, s 125.0 Reference Phase 2
Offset, s 0 Reference Point End
Uncoordinated No Simult. Gap E/W On
Force Mode Fixed Simult. Gap N/S On
Timer Results EBL EBT WBL WBT NBL NBT SBL SBT
Assigned Phase 6 5 2 4
Case Number 8.3 1.0 4.0 12.0
Phase Duration, s 98.4 12.1 110.5 14.5
Change Period, (Y+Rc), s 5.0 5.0 5.0 5.0
Max Allow Headway (MAH), s 0.0 3.1 0.0 3.1
Queue Clearance Time (gs), s 2.9 5.0
Green Extension Time (ge), s 0.0 0.1 0.0 0.0
Phase Call Probability 0.89 0.79
Max Out Probability 0.00 0.00
Movement Group Results EB WB NB SB
Approach Movement L T R L T R L T R L T R
Assigned Movement 6 5 2 7 4
Adjusted Flow Rate (v), veh/h 1156 64 1785 45
Adjusted Saturation Flow Rate (s), veh/h/ln 1710 1678 1677 1762
Queue Service Time (gs), s 14.0 0.9 21.1 3.0
Cycle Queue Clearance Time (gc), s 14.0 0.9 21.1 3.0
Green Ratio (g/C) 0.75 0.82 0.84 0.08
Capacity (c), veh/h 2554 452 2831 134
Volume-to-Capacity Ratio (X) 0.453 0.142 0.631 0.337
Available Capacity (ca), veh/h 2554 631 2831 282
Back of Queue (Q), veh/ln (95th percentile) 7.0 0.4 6.2 2.4
Queue Storage Ratio (RQ) (95th percentile) 0.00 0.07 0.00 0.00
Uniform Delay (d1), s/veh 4.9 3.4 3.0 54.8
Incremental Delay (d2), s/veh 0.6 0.0 0.7 0.5
Initial Queue Delay (d3), s/veh 0.0 0.0 0.0 0.0
Control Delay (d), s/veh 5.4 3.5 3.6 55.3
Level of Service (LOS) A A A E
Approach Delay, s/veh / LOS 5.4 A 3.6 A 55.3 E 0.0
Intersection Delay, s/veh / LOS 5.1 A
Multimodal Results EB WB NB SB
Pedestrian LOS Score / LOS 2.0 B 1.8 A 2.9 C 2.8 C
Bicycle LOS Score / LOS 1.0 A 1.9 A 0.6 A
Copyright © 2015 University of Florida, All Rights Reserved. HCS 2010™ Streets Version 6.70 Generated: 7/27/2015 11:59:04 AM
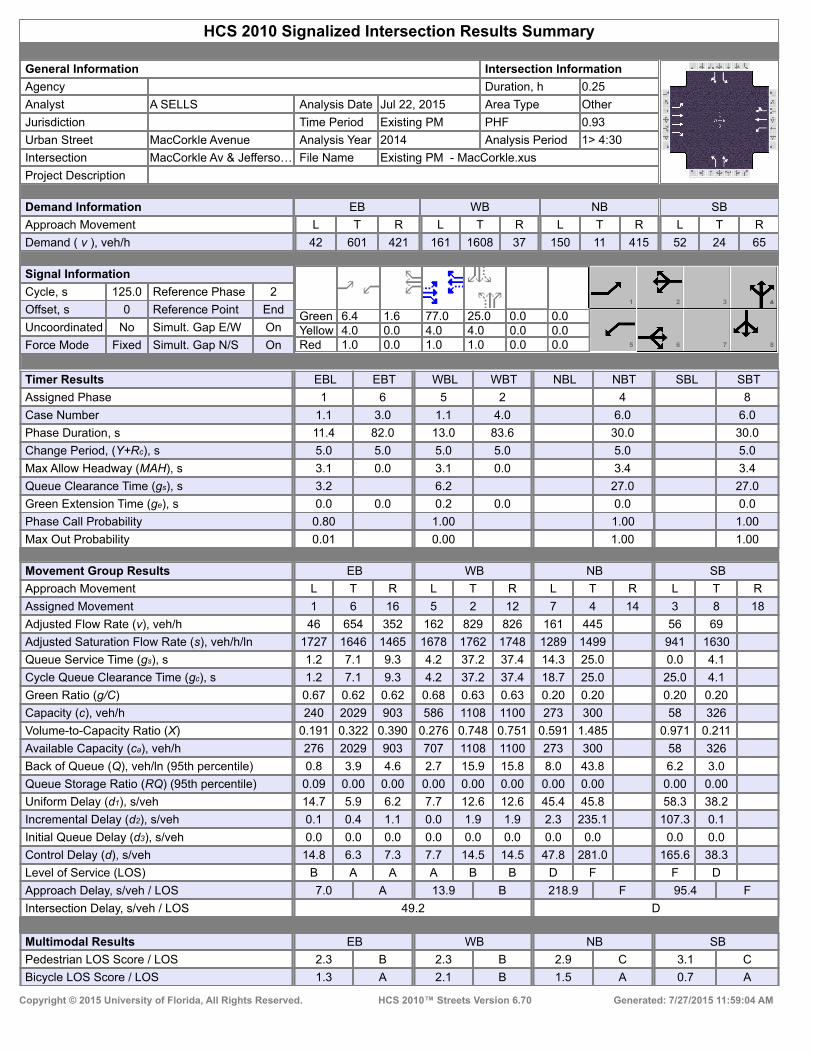
HCS 2010 Signalized Intersection Results Summary
General Information Intersection Information
Agency Duration, h 0.25
Analyst A SELLS Analysis Date Jul 22, 2015 Area Type Other
Jurisdiction Time Period Existing PM PHF 0.93
Urban Street MacCorkle Avenue Analysis Year 2014 Analysis Period 1> 4:30
Intersection MacCorkle Av & Jefferso… File Name Existing PM - MacCorkle.xus
Project Description
Demand Information EB WB NB SB
Approach Movement L T R L T R L T R L T R
Demand ( v ), veh/h 42 601 421 161 1608 37 150 11 415 52 24 65
Signal Information
GreenYellowRed
6.4 1.6 77.0 25.0 0.0 0.04.0 0.0 4.0 4.0 0.0 0.01.0 0.0 1.0 1.0 0.0 0.0
1 2 3
5 6 7 8
Cycle, s 125.0 Reference Phase 2
Offset, s 0 Reference Point End
Uncoordinated No Simult. Gap E/W On
Force Mode Fixed Simult. Gap N/S On
Timer Results EBL EBT WBL WBT NBL NBT SBL SBT
Assigned Phase 1 6 5 2 4 8
Case Number 1.1 3.0 1.1 4.0 6.0 6.0
Phase Duration, s 11.4 82.0 13.0 83.6 30.0 30.0
Change Period, (Y+Rc), s 5.0 5.0 5.0 5.0 5.0 5.0
Max Allow Headway (MAH), s 3.1 0.0 3.1 0.0 3.4 3.4
Queue Clearance Time (gs), s 3.2 6.2 27.0 27.0
Green Extension Time (ge), s 0.0 0.0 0.2 0.0 0.0 0.0
Phase Call Probability 0.80 1.00 1.00 1.00
Max Out Probability 0.01 0.00 1.00 1.00
Movement Group Results EB WB NB SB
Approach Movement L T R L T R L T R L T R
Assigned Movement 1 6 16 5 2 12 7 4 14 3 8 18
Adjusted Flow Rate (v), veh/h 46 654 352 162 829 826 161 445 56 69
Adjusted Saturation Flow Rate (s), veh/h/ln 1727 1646 1465 1678 1762 1748 1289 1499 941 1630
Queue Service Time (gs), s 1.2 7.1 9.3 4.2 37.2 37.4 14.3 25.0 0.0 4.1
Cycle Queue Clearance Time (gc), s 1.2 7.1 9.3 4.2 37.2 37.4 18.7 25.0 25.0 4.1
Green Ratio (g/C) 0.67 0.62 0.62 0.68 0.63 0.63 0.20 0.20 0.20 0.20
Capacity (c), veh/h 240 2029 903 586 1108 1100 273 300 58 326
Volume-to-Capacity Ratio (X) 0.191 0.322 0.390 0.276 0.748 0.751 0.591 1.485 0.971 0.211
Available Capacity (ca), veh/h 276 2029 903 707 1108 1100 273 300 58 326
Back of Queue (Q), veh/ln (95th percentile) 0.8 3.9 4.6 2.7 15.9 15.8 8.0 43.8 6.2 3.0
Queue Storage Ratio (RQ) (95th percentile) 0.09 0.00 0.00 0.00 0.00 0.00 0.00 0.00 0.00 0.00
Uniform Delay (d1), s/veh 14.7 5.9 6.2 7.7 12.6 12.6 45.4 45.8 58.3 38.2
Incremental Delay (d2), s/veh 0.1 0.4 1.1 0.0 1.9 1.9 2.3 235.1 107.3 0.1
Initial Queue Delay (d3), s/veh 0.0 0.0 0.0 0.0 0.0 0.0 0.0 0.0 0.0 0.0
Control Delay (d), s/veh 14.8 6.3 7.3 7.7 14.5 14.5 47.8 281.0 165.6 38.3
Level of Service (LOS) B A A A B B D F F D
Approach Delay, s/veh / LOS 7.0 A 13.9 B 218.9 F 95.4 F
Intersection Delay, s/veh / LOS 49.2 D
Multimodal Results EB WB NB SB
Pedestrian LOS Score / LOS 2.3 B 2.3 B 2.9 C 3.1 C
Bicycle LOS Score / LOS 1.3 A 2.1 B 1.5 A 0.7 A
Copyright © 2015 University of Florida, All Rights Reserved. HCS 2010™ Streets Version 6.70 Generated: 7/27/2015 11:59:04 AM

HCS 2010 Signalized Intersection Results Summary
General Information Intersection Information
Agency Duration, h 0.25
Analyst A SELLS Analysis Date Jul 22, 2015 Area Type Other
Jurisdiction Time Period Existing PM PHF 0.93
Urban Street MacCorkle Avenue Analysis Year 2014 Analysis Period 1> 4:30
Intersection MacCorkle Ave & I-64 WB File Name Existing PM - MacCorkle.xus
Project Description
Demand Information EB WB NB SB
Approach Movement L T R L T R L T R L T R
Demand ( v ), veh/h 652 427 248 1156 655 0
Signal Information
GreenYellowRed
13.4 52.6 44.0 0.0 0.0 0.04.0 4.0 4.0 0.0 0.0 0.01.0 1.0 1.0 0.0 0.0 0.0
1 2 3
5 6 7 8
Cycle, s 125.0 Reference Phase 2
Offset, s 0 Reference Point End
Uncoordinated No Simult. Gap E/W On
Force Mode Fixed Simult. Gap N/S On
Timer Results EBL EBT WBL WBT NBL NBT SBL SBT
Assigned Phase 6 5 2 4
Case Number 7.3 1.0 4.0 10.0
Phase Duration, s 57.6 18.4 76.0 49.0
Change Period, (Y+Rc), s 5.0 5.0 5.0 5.0
Max Allow Headway (MAH), s 0.0 3.1 0.0 3.1
Queue Clearance Time (gs), s 13.0 46.0
Green Extension Time (ge), s 0.0 0.4 0.0 0.0
Phase Call Probability 1.00 1.00
Max Out Probability 0.00 1.00
Movement Group Results EB WB NB SB
Approach Movement L T R L T R L T R L T R
Assigned Movement 6 16 5 2 7 4
Adjusted Flow Rate (v), veh/h 608 342 267 1243 704 0
Adjusted Saturation Flow Rate (s), veh/h/ln 1727 1537 1678 1677 1631 1850
Queue Service Time (gs), s 15.6 17.9 11.0 22.2 44.0 0.0
Cycle Queue Clearance Time (gc), s 15.6 17.9 11.0 22.2 44.0 0.0
Green Ratio (g/C) 0.42 0.42 0.54 0.57 0.35 0.35
Capacity (c), veh/h 1453 647 470 1905 574 651
Volume-to-Capacity Ratio (X) 0.418 0.529 0.567 0.652 1.226 0.000
Available Capacity (ca), veh/h 1453 647 626 1905 574 651
Back of Queue (Q), veh/ln (95th percentile) 9.3 8.7 6.9 9.5 51.6 0.0
Queue Storage Ratio (RQ) (95th percentile) 0.00 0.00 0.00 0.00 0.00 0.00
Uniform Delay (d1), s/veh 25.8 20.7 16.6 9.2 40.5 0.0
Incremental Delay (d2), s/veh 0.5 1.6 0.4 1.8 116.7 0.0
Initial Queue Delay (d3), s/veh 0.0 0.0 0.0 0.0 0.0 0.0
Control Delay (d), s/veh 26.2 22.2 17.1 11.0 157.2 0.0
Level of Service (LOS) C C B B F
Approach Delay, s/veh / LOS 24.8 C 12.1 B 157.2 F 0.0
Intersection Delay, s/veh / LOS 48.2 D
Multimodal Results EB WB NB SB
Pedestrian LOS Score / LOS 2.3 B 1.9 A 2.9 C 3.0 C
Bicycle LOS Score / LOS 1.4 A 1.7 A 1.6 A
Copyright © 2015 University of Florida, All Rights Reserved. HCS 2010™ Streets Version 6.70 Generated: 7/27/2015 11:59:04 AM

HCS 2010 Signalized Intersection Results Summary
General Information Intersection Information
Agency Duration, h 0.25
Analyst A SELLS Analysis Date Jul 22, 2015 Area Type Other
Jurisdiction Time Period Existing PM PHF 0.97
Urban Street Jefferson Road Analysis Year 2014 Analysis Period 1> 4:30
Intersection Mathias Lane/Kanawha … File Name Existing PM - Kanawha.xus
Project Description
Demand Information EB WB NB SB
Approach Movement L T R L T R L T R L T R
Demand ( v ), veh/h 30 511 10 0 670 520 1 7 8 490 15
Signal Information
GreenYellowRed
91.2 29.0 1.8 0.0 0.0 0.04.0 4.0 3.0 0.0 0.0 0.01.0 1.0 1.0 0.0 0.0 0.0
1 2 3 4
5 6 7
Cycle, s 136.0 Reference Phase 2
Offset, s 0 Reference Point End
Uncoordinated No Simult. Gap E/W On
Force Mode Fixed Simult. Gap N/S On
Timer Results EBL EBT WBL WBT NBL NBT SBL SBT
Assigned Phase 6 2 8 4
Case Number 6.0 7.0 12.0 10.0
Phase Duration, s 96.2 96.2 5.8 34.0
Change Period, (Y+Rc), s 5.0 5.0 4.0 5.0
Max Allow Headway (MAH), s 0.0 0.0 3.0 3.1
Queue Clearance Time (gs), s 2.7 31.0
Green Extension Time (ge), s 0.0 0.0 0.0 0.0
Phase Call Probability 0.30 1.00
Max Out Probability 0.00 1.00
Movement Group Results EB WB NB SB
Approach Movement L T R L T R L T R L T R
Assigned Movement 1 6 16 5 2 12 3 8 18 7 4
Adjusted Flow Rate (v), veh/h 31 537 0 480 9 505 15
Adjusted Saturation Flow Rate (s), veh/h/ln 796 1807 0 1537 1769 1727 1814
Queue Service Time (gs), s 0.9 7.1 0.0 18.0 0.7 29.0 0.9
Cycle Queue Clearance Time (gc), s 22.0 7.1 0.0 18.0 0.7 29.0 0.9
Green Ratio (g/C) 0.67 0.67 0.67 0.01 0.21 0.21
Capacity (c), veh/h 468 1212 1031 23 368 387
Volume-to-Capacity Ratio (X) 0.066 0.443 0.000 0.465 0.402 1.371 0.040
Available Capacity (ca), veh/h 468 1212 1031 104 368 387
Back of Queue (Q), veh/ln (95th percentile) 0.5 3.8 0.0 8.4 0.6 46.9 0.7
Queue Storage Ratio (RQ) (95th percentile) 0.05 0.00 0.00 0.00 0.00 0.00 0.00
Uniform Delay (d1), s/veh 6.8 2.7 8.9 66.6 53.5 42.5
Incremental Delay (d2), s/veh 0.3 1.2 0.0 0.9 4.1 183.6 0.0
Initial Queue Delay (d3), s/veh 0.0 0.0 0.0 0.0 0.0 0.0 0.0
Control Delay (d), s/veh 7.1 3.9 9.8 70.7 237.1 42.5
Level of Service (LOS) A A A E F D
Approach Delay, s/veh / LOS 4.1 A 9.7 A 70.7 E 231.3 F
Intersection Delay, s/veh / LOS 60.9 E
Multimodal Results EB WB NB SB
Pedestrian LOS Score / LOS 2.1 B 2.2 B 2.3 B 2.3 B
Bicycle LOS Score / LOS 1.4 A 2.5 B 0.5 A 1.3 A
Copyright © 2015 University of Florida, All Rights Reserved. HCS 2010™ Streets Version 6.70 Generated: 7/27/2015 12:09:04 PM

HCS 2010 Signalized Intersection Results Summary
General Information Intersection Information
Agency Duration, h 0.25
Analyst A SELLS Analysis Date Jul 22, 2015 Area Type Other
Jurisdiction Time Period Existing PM PHF 0.97
Urban Street Jefferson Road Analysis Year 2014 Analysis Period 1> 4:30
Intersection Kanawha Turnpike File Name Existing PM - Kanawha.xus
Project Description
Demand Information EB WB NB SB
Approach Movement L T R L T R L T R L T R
Demand ( v ), veh/h 329 684 320 644 541 0 116
Signal Information
GreenYellowRed
77.0 6.7 37.3 0.0 0.0 0.04.0 4.0 4.0 0.0 0.0 0.01.0 1.0 1.0 0.0 0.0 0.0
1 2 3 4
5 6 7
Cycle, s 136.0 Reference Phase 2
Offset, s 0 Reference Point End
Uncoordinated No Simult. Gap E/W On
Force Mode Fixed Simult. Gap N/S On
Timer Results EBL EBT WBL WBT NBL NBT SBL SBT
Assigned Phase 2 1 6 8
Case Number 7.3 1.0 4.0 9.0
Phase Duration, s 82.0 11.7 93.7 42.3
Change Period, (Y+Rc), s 5.0 5.0 5.0 5.0
Max Allow Headway (MAH), s 0.0 3.1 0.0 3.1
Queue Clearance Time (gs), s 2.0 39.3
Green Extension Time (ge), s 0.0 0.7 0.0 0.0
Phase Call Probability 1.00 1.00
Max Out Probability 0.02 1.00
Movement Group Results EB WB NB SB
Approach Movement L T R L T R L T R L T R
Assigned Movement 2 12 1 6 3 8 18
Adjusted Flow Rate (v), veh/h 285 455 330 664 558 0 43
Adjusted Saturation Flow Rate (s), veh/h/ln 1796 1537 1711 1710 1631 1814 1537
Queue Service Time (gs), s 15.6 27.1 0.0 4.7 37.3 0.0 2.9
Cycle Queue Clearance Time (gc), s 15.6 27.1 0.0 4.7 37.3 0.0 2.9
Green Ratio (g/C) 0.57 0.57 0.60 0.65 0.27 0.27 0.27
Capacity (c), veh/h 1017 870 609 2230 448 498 422
Volume-to-Capacity Ratio (X) 0.280 0.522 0.542 0.298 1.246 0.000 0.103
Available Capacity (ca), veh/h 1017 870 714 2230 448 498 422
Back of Queue (Q), veh/ln (95th percentile) 9.7 13.9 12.0 2.6 45.2 0.0 1.9
Queue Storage Ratio (RQ) (95th percentile) 0.00 0.00 0.00 0.00 0.00 0.00 0.00
Uniform Delay (d1), s/veh 24.2 21.3 25.2 3.4 49.3 0.0 36.8
Incremental Delay (d2), s/veh 0.2 0.7 0.3 0.3 128.3 0.0 0.0
Initial Queue Delay (d3), s/veh 0.0 0.0 0.0 0.0 0.0 0.0 0.0
Control Delay (d), s/veh 24.5 22.0 25.5 3.7 177.6 0.0 36.9
Level of Service (LOS) C C C A F D
Approach Delay, s/veh / LOS 23.0 C 10.9 B 167.5 F 0.0
Intersection Delay, s/veh / LOS 55.1 E
Multimodal Results EB WB NB SB
Pedestrian LOS Score / LOS 2.6 B 1.9 A 2.5 B 3.0 C
Bicycle LOS Score / LOS 1.9 A 1.3 A 1.5 A
Copyright © 2015 University of Florida, All Rights Reserved. HCS 2010™ Streets Version 6.70 Generated: 7/31/2015 10:12:22 AM

HCS 2010 Signalized Intersection Results Summary
General Information Intersection Information
Agency Duration, h 0.25
Analyst A SELLS Analysis Date Jul 22, 2015 Area Type Other
Jurisdiction Time Period Existing PM PHF 0.92
Urban Street Jefferson Road Analysis Year 2014 Analysis Period 1> 4:30
Intersection Jefferson Rd & Oakhurs… File Name Existing PM - US 119 & Oakhurst.xus
Project Description
Demand Information EB WB NB SB
Approach Movement L T R L T R L T R L T R
Demand ( v ), veh/h 595 26 115 63 128 165
Signal Information
GreenYellowRed
11.6 47.1 47.7 0.0 0.0 0.04.0 4.0 4.0 0.0 0.0 0.00.5 0.5 0.5 0.0 0.0 0.0
1 3 4
5 6 7 8
Cycle, s 120.0 Reference Phase 2
Offset, s 0 Reference Point Begin
Uncoordinated No Simult. Gap E/W On
Force Mode Fixed Simult. Gap N/S On
Timer Results EBL EBT WBL WBT NBL NBT SBL SBT
Assigned Phase 4 2 1 6
Case Number 9.0 7.3 2.0 4.0
Phase Duration, s 52.2 51.6 16.1 67.8
Change Period, (Y+Rc), s 4.5 4.5 4.5 4.5
Max Allow Headway (MAH), s 3.1 0.0 3.1 0.0
Queue Clearance Time (gs), s 46.6 11.6
Green Extension Time (ge), s 1.1 0.0 0.2 0.0
Phase Call Probability 1.00 0.99
Max Out Probability 0.07 0.00
Movement Group Results EB WB NB SB
Approach Movement L T R L T R L T R L T R
Assigned Movement 7 14 2 12 1 6
Adjusted Flow Rate (v), veh/h 647 26 125 45 139 179
Adjusted Saturation Flow Rate (s), veh/h/ln 1694 1507 1796 1568 1711 1796
Queue Service Time (gs), s 44.6 1.3 5.5 2.1 9.6 6.3
Cycle Queue Clearance Time (gc), s 44.6 1.3 5.5 2.1 9.6 6.3
Green Ratio (g/C) 0.40 0.40 0.39 0.39 0.10 0.53
Capacity (c), veh/h 674 600 705 616 166 947
Volume-to-Capacity Ratio (X) 0.960 0.044 0.177 0.072 0.838 0.189
Available Capacity (ca), veh/h 784 697 705 616 332 947
Back of Queue (Q), veh/ln (95th percentile) 28.9 0.8 4.3 1.5 7.6 4.7
Queue Storage Ratio (RQ) (95th percentile) 0.00 0.05 0.00 0.00 0.91 0.00
Uniform Delay (d1), s/veh 35.2 22.1 23.8 22.8 53.3 14.9
Incremental Delay (d2), s/veh 20.3 0.0 0.5 0.2 4.3 0.4
Initial Queue Delay (d3), s/veh 0.0 0.0 0.0 0.0 0.0 0.0
Control Delay (d), s/veh 55.5 22.2 24.3 23.0 57.5 15.3
Level of Service (LOS) E C C C E B
Approach Delay, s/veh / LOS 54.2 D 0.0 24.0 C 33.8 C
Intersection Delay, s/veh / LOS 44.2 D
Multimodal Results EB WB NB SB
Pedestrian LOS Score / LOS 2.4 B 2.3 B 1.9 A 1.7 A
Bicycle LOS Score / LOS F 0.8 A 1.0 A
Copyright © 2015 University of Florida, All Rights Reserved. HCS 2010™ Streets Version 6.70 Generated: 7/27/2015 12:14:18 PM

No Build AM Peak Unsignalized

TWO-WAY STOP CONTROL SUMMARY
General Information Site Information Analyst ASELLS Agency/Co. STANTEC Date Performed 11/25/2014 Analysis Time Period No Build AM
Intersection Jurisdiction Analysis Year 2030
Project Description East/West Street: Bob Evans entrance North/South Street: Jefferson Road Intersection Orientation: North-South Study Period (hrs): 0.25
Vehicle Volumes and Adjustments Major Street Northbound Southbound Movement 1 2 3 4 5 6 L T R L T RVolume (veh/h) 5 445 776 25 Peak-Hour Factor, PHF 0.45 0.87 1.00 1.00 0.86 0.63 Hourly Flow Rate, HFR (veh/h)
11 511 0 0 902 39
Percent Heavy Vehicles 2 -- -- 0 -- -- Median Type Undivided RT Channelized 0 0 Lanes 0 2 0 0 2 0 Configuration LT T T TR Upstream Signal 1 0 Minor Street Eastbound Westbound Movement 7 8 9 10 11 12
L T R L T RVolume (veh/h) 10 10 Peak-Hour Factor, PHF 0.90 1.00 0.69 1.00 1.00 1.00 Hourly Flow Rate, HFR (veh/h) 11 0 14 0 0 0
Percent Heavy Vehicles 2 0 2 0 0 0 Percent Grade (%) 0 0 Flared Approach N N Storage 0 0 RT Channelized 0 0 Lanes 1 0 1 0 0 0 Configuration L R Delay, Queue Length, and Level of ServiceApproach Northbound Southbound Westbound Eastbound
Movement 1 4 7 8 9 10 11 12
Lane Configuration LT L R v (veh/h) 11 11 14 C (m) (veh/h) 723 184 590 v/c 0.02 0.06 0.02 95% queue length 0.05 0.19 0.07 Control Delay (s/veh) 10.1 25.8 11.2 LOS B D B Approach Delay (s/veh) -- -- 17.7 Approach LOS -- -- C
Copyright © 2010 University of Florida, All Rights Reserved HCS+TM Version 5.6 Generated: 4/16/2015 3:05 PM
Page 1 of 1Two-Way Stop Control
4/16/2015file://C:\Users\asells\AppData\Local\Temp\u2kEE5B.tmp

TWO-WAY STOP CONTROL SUMMARY
General Information Site Information Analyst ASELLS Agency/Co. STANTEC Date Performed 12/3/14 Analysis Time Period No Build AM
Intersection Jurisdiction Analysis Year 2030
Project Description East/West Street: McDonalds entrance North/South Street: Jefferson Road Intersection Orientation: North-South Study Period (hrs): 0.25
Vehicle Volumes and Adjustments Major Street Northbound Southbound Movement 1 2 3 4 5 6 L T R L T RVolume (veh/h) 30 445 776 5 Peak-Hour Factor, PHF 0.83 0.87 1.00 1.00 0.88 0.83 Hourly Flow Rate, HFR (veh/h)
36 511 0 0 881 6
Percent Heavy Vehicles 2 -- -- 0 -- -- Median Type Undivided RT Channelized 0 0 Lanes 0 2 0 0 2 0 Configuration LT T T TR Upstream Signal 0 0 Minor Street Eastbound Westbound Movement 7 8 9 10 11 12
L T R L T RVolume (veh/h) 5 5 Peak-Hour Factor, PHF 0.50 1.00 0.25 1.00 1.00 1.00 Hourly Flow Rate, HFR (veh/h) 10 0 20 0 0 0
Percent Heavy Vehicles 2 0 2 0 0 0 Percent Grade (%) 0 0 Flared Approach N N Storage 0 0 RT Channelized 0 0 Lanes 1 0 1 0 0 0 Configuration L R Delay, Queue Length, and Level of ServiceApproach Northbound Southbound Westbound Eastbound
Movement 1 4 7 8 9 10 11 12
Lane Configuration LT L R v (veh/h) 36 10 20 C (m) (veh/h) 757 167 611 v/c 0.05 0.06 0.03 95% queue length 0.15 0.19 0.10 Control Delay (s/veh) 10.0 27.9 11.1 LOS A D B Approach Delay (s/veh) -- -- 16.7 Approach LOS -- -- C
Copyright © 2010 University of Florida, All Rights Reserved HCS+TM Version 5.6 Generated: 4/16/2015 3:06 PM
Page 1 of 1Two-Way Stop Control
4/16/2015file://C:\Users\asells\AppData\Local\Temp\u2kD87B.tmp

TWO-WAY STOP CONTROL SUMMARY
General Information Site Information Analyst ASELLS Agency/Co. STANTEC Date Performed 11/25/2014 Analysis Time Period No Build AM
Intersection Jurisdiction Analysis Year 2030
Project Description East/West Street: Community Center - North North/South Street: Jefferson Road Intersection Orientation: North-South Study Period (hrs): 0.25
Vehicle Volumes and Adjustments Major Street Northbound Southbound Movement 1 2 3 4 5 6 L T R L T RVolume (veh/h) 6 442 776 22 Peak-Hour Factor, PHF 0.50 0.77 1.00 1.00 0.82 0.47 Hourly Flow Rate, HFR (veh/h)
12 574 0 0 946 46
Percent Heavy Vehicles 2 -- -- 0 -- -- Median Type Undivided RT Channelized 0 0 Lanes 0 1 0 0 2 0 Configuration LT T TR Upstream Signal 0 0 Minor Street Eastbound Westbound Movement 7 8 9 10 11 12
L T R L T RVolume (veh/h) 3 0 4 Peak-Hour Factor, PHF 0.46 1.00 0.58 1.00 1.00 1.00 Hourly Flow Rate, HFR (veh/h) 6 0 6 0 0 0
Percent Heavy Vehicles 2 0 2 0 0 0 Percent Grade (%) 0 0 Flared Approach N N Storage 0 0 RT Channelized 0 0 Lanes 0 1 0 0 0 0 Configuration LTR Delay, Queue Length, and Level of ServiceApproach Northbound Southbound Westbound Eastbound
Movement 1 4 7 8 9 10 11 12
Lane Configuration LT LTR v (veh/h) 12 12 C (m) (veh/h) 691 170 v/c 0.02 0.07 95% queue length 0.05 0.23 Control Delay (s/veh) 10.3 27.8 LOS B D Approach Delay (s/veh) -- -- 27.8 Approach LOS -- -- D
Copyright © 2010 University of Florida, All Rights Reserved HCS+TM Version 5.6 Generated: 4/16/2015 3:05 PM
Page 1 of 1Two-Way Stop Control
4/16/2015file://C:\Users\asells\AppData\Local\Temp\u2k301B.tmp

TWO-WAY STOP CONTROL SUMMARY
General Information Site Information Analyst ASELLS Agency/Co. STANTEC Date Performed 11/25/2014 Analysis Time Period No Build AM
Intersection Jurisdiction Analysis Year 2030
Project Description East/West Street: Community Center - South North/South Street: Jefferson Road Intersection Orientation: North-South Study Period (hrs): 0.25
Vehicle Volumes and Adjustments Major Street Northbound Southbound Movement 1 2 3 4 5 6 L T R L T RVolume (veh/h) 0 435 764 12 Peak-Hour Factor, PHF 1.00 0.81 1.00 1.00 0.91 0.25 Hourly Flow Rate, HFR (veh/h)
0 537 0 0 839 48
Percent Heavy Vehicles 2 -- -- 0 -- -- Median Type Undivided RT Channelized 0 0 Lanes 0 1 0 0 2 0 Configuration LT T TR Upstream Signal 0 0 Minor Street Eastbound Westbound Movement 7 8 9 10 11 12
L T R L T RVolume (veh/h) 7 0 4 Peak-Hour Factor, PHF 0.33 1.00 0.71 1.00 1.00 1.00 Hourly Flow Rate, HFR (veh/h) 21 0 5 0 0 0
Percent Heavy Vehicles 2 0 2 0 0 0 Percent Grade (%) 0 0 Flared Approach N N Storage 0 0 RT Channelized 0 0 Lanes 0 1 0 0 0 0 Configuration LTR Delay, Queue Length, and Level of ServiceApproach Northbound Southbound Westbound Eastbound
Movement 1 4 7 8 9 10 11 12
Lane Configuration LT LTR v (veh/h) 0 26 C (m) (veh/h) 757 154 v/c 0.00 0.17 95% queue length 0.00 0.59 Control Delay (s/veh) 9.8 33.1 LOS A D Approach Delay (s/veh) -- -- 33.1 Approach LOS -- -- D
Copyright © 2010 University of Florida, All Rights Reserved HCS+TM Version 5.6 Generated: 4/16/2015 3:02 PM
Page 1 of 1Two-Way Stop Control
4/16/2015file://C:\Users\asells\AppData\Local\Temp\u2kD178.tmp

TWO-WAY STOP CONTROL SUMMARY
General Information Site Information Analyst A SELLS Agency/Co. STANTEC Date Performed 11/25/2014 Analysis Time Period No Build AM
Intersection Jurisdiction Analysis Year 2030
Project Description East/West Street: Washington Street North/South Street: Jefferson Road Intersection Orientation: North-South Study Period (hrs): 0.25
Vehicle Volumes and Adjustments Major Street Northbound Southbound Movement 1 2 3 4 5 6 L T R L T RVolume (veh/h) 433 2 3 765 Peak-Hour Factor, PHF 1.00 0.80 0.92 0.69 0.91 1.00 Hourly Flow Rate, HFR (veh/h)
0 541 2 4 840 0
Percent Heavy Vehicles 0 -- -- 2 -- -- Median Type Undivided RT Channelized 0 0 Lanes 0 1 0 0 2 0 Configuration TR LT T Upstream Signal 0 0 Minor Street Eastbound Westbound Movement 7 8 9 10 11 12
L T R L T RVolume (veh/h) 2 0 2 Peak-Hour Factor, PHF 1.00 1.00 1.00 0.73 1.00 0.85 Hourly Flow Rate, HFR (veh/h) 0 0 0 2 0 2
Percent Heavy Vehicles 0 0 0 2 0 2 Percent Grade (%) 0 0 Flared Approach N N Storage 0 0 RT Channelized 0 0 Lanes 0 0 0 0 1 0 Configuration LTR Delay, Queue Length, and Level of ServiceApproach Northbound Southbound Westbound Eastbound
Movement 1 4 7 8 9 10 11 12
Lane Configuration LT LTR v (veh/h) 4 4 C (m) (veh/h) 1010 336 v/c 0.00 0.01 95% queue length 0.01 0.04 Control Delay (s/veh) 8.6 15.8 LOS A C Approach Delay (s/veh) -- -- 15.8 Approach LOS -- -- C
Copyright © 2010 University of Florida, All Rights Reserved HCS+TM Version 5.6 Generated: 4/16/2015 3:08 PM
Page 1 of 1Two-Way Stop Control
4/16/2015file://C:\Users\asells\AppData\Local\Temp\u2k4D1D.tmp

TWO-WAY STOP CONTROL SUMMARY
General Information Site Information Analyst A SELLS Agency/Co. STANTEC Date Performed 11/25/2014 Analysis Time Period No Build PM
Intersection Jurisdiction Analysis Year 2030
Project Description East/West Street: Pennslyvania Avenue North/South Street: Jefferson Road Intersection Orientation: North-South Study Period (hrs): 0.25
Vehicle Volumes and Adjustments Major Street Northbound Southbound Movement 1 2 3 4 5 6 L T R L T RVolume (veh/h) 421 1 8 645 Peak-Hour Factor, PHF 1.00 0.83 1.00 0.50 0.97 1.00 Hourly Flow Rate, HFR (veh/h)
0 507 1 16 664 0
Percent Heavy Vehicles 0 -- -- 2 -- -- Median Type Undivided RT Channelized 0 0 Lanes 0 1 0 0 2 0 Configuration TR LT T Upstream Signal 0 1 Minor Street Eastbound Westbound Movement 7 8 9 10 11 12
L T R L T RVolume (veh/h) 6 0 14 Peak-Hour Factor, PHF 1.00 1.00 1.00 1.00 1.00 0.65 Hourly Flow Rate, HFR (veh/h) 0 0 0 6 0 21
Percent Heavy Vehicles 0 0 0 2 0 2 Percent Grade (%) 0 0 Flared Approach N N Storage 0 0 RT Channelized 0 0 Lanes 0 0 0 0 1 0 Configuration LTR Delay, Queue Length, and Level of ServiceApproach Northbound Southbound Westbound Eastbound
Movement 1 4 7 8 9 10 11 12
Lane Configuration LT LTR v (veh/h) 16 27 C (m) (veh/h) 1053 497 v/c 0.02 0.05 95% queue length 0.05 0.17 Control Delay (s/veh) 8.5 12.7 LOS A B Approach Delay (s/veh) -- -- 12.7 Approach LOS -- -- B
Copyright © 2010 University of Florida, All Rights Reserved HCS+TM Version 5.6 Generated: 4/16/2015 3:07 PM
Page 1 of 1Two-Way Stop Control
4/16/2015file://C:\Users\asells\AppData\Local\Temp\u2k431F.tmp

TWO-WAY STOP CONTROL SUMMARY
General Information Site Information Analyst A SELLS Agency/Co. Date Performed 12/3/2014 Analysis Time Period No Build AM
Intersection Jurisdiction Analysis Year 2030
Project Description East/West Street: Kramer Street North/South Street: Jefferson Road Intersection Orientation: North-South Study Period (hrs): 0.25
Vehicle Volumes and Adjustments Major Street Northbound Southbound Movement 1 2 3 4 5 6 L T R L T RVolume (veh/h) 5 797 796 5 Peak-Hour Factor, PHF 0.50 0.85 1.00 1.00 0.94 0.75 Hourly Flow Rate, HFR (veh/h)
10 937 0 0 846 6
Percent Heavy Vehicles 6 -- -- 0 -- -- Median Type Undivided RT Channelized 0 0 Lanes 0 1 0 0 1 0 Configuration LT TR Upstream Signal 1 0 Minor Street Eastbound Westbound Movement 7 8 9 10 11 12
L T R L T RVolume (veh/h) 5 0 5 Peak-Hour Factor, PHF 0.75 1.00 0.33 0.80 1.00 0.85 Hourly Flow Rate, HFR (veh/h) 6 0 15 0 0 0
Percent Heavy Vehicles 100 0 100 3 0 0 Percent Grade (%) 0 0 Flared Approach N N Storage 0 0 RT Channelized 0 0 Lanes 0 1 0 0 0 0 Configuration LTR Delay, Queue Length, and Level of ServiceApproach Northbound Southbound Westbound Eastbound
Movement 1 4 7 8 9 10 11 12
Lane Configuration LT LTR v (veh/h) 10 21 C (m) (veh/h) 770 115 v/c 0.01 0.18 95% queue length 0.04 0.64 Control Delay (s/veh) 9.7 43.2 LOS A E Approach Delay (s/veh) -- -- 43.2 Approach LOS -- -- E
Copyright © 2010 University of Florida, All Rights Reserved HCS+TM Version 5.6 Generated: 7/31/2015 10:58 AM
Page 1 of 1Two-Way Stop Control
7/31/2015file://C:\Users\asells\AppData\Local\Temp\u2kEDEA.tmp
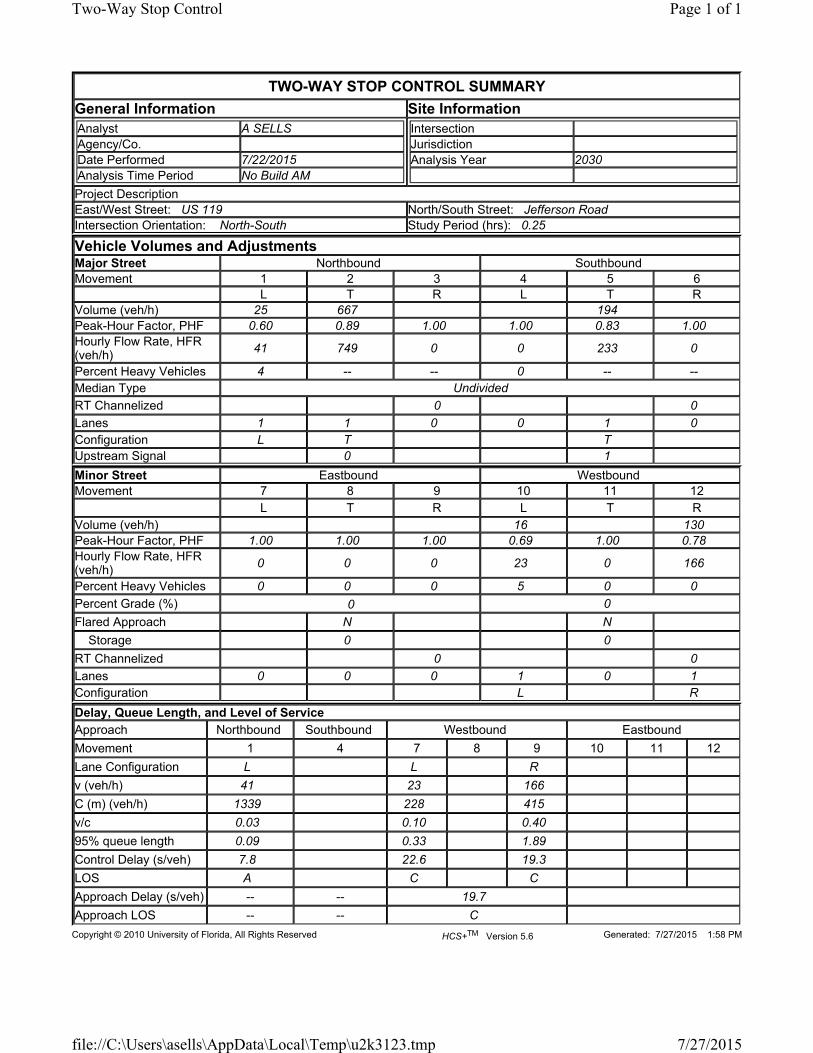
TWO-WAY STOP CONTROL SUMMARY
General Information Site Information Analyst A SELLS Agency/Co.Date Performed 7/22/2015 Analysis Time Period No Build AM
IntersectionJurisdictionAnalysis Year 2030
Project Description East/West Street: US 119 North/South Street: Jefferson Road Intersection Orientation: North-South Study Period (hrs): 0.25
Vehicle Volumes and Adjustments Major Street Northbound Southbound Movement 1 2 3 4 5 6
L T R L T RVolume (veh/h) 25 667 194 Peak-Hour Factor, PHF 0.60 0.89 1.00 1.00 0.83 1.00 Hourly Flow Rate, HFR (veh/h)
41 749 0 0 233 0
Percent Heavy Vehicles 4 -- -- 0 -- -- Median Type Undivided RT Channelized 0 0 Lanes 1 1 0 0 1 0 Configuration L T T Upstream Signal 0 1 Minor Street Eastbound Westbound Movement 7 8 9 10 11 12
L T R L T RVolume (veh/h) 16 130 Peak-Hour Factor, PHF 1.00 1.00 1.00 0.69 1.00 0.78 Hourly Flow Rate, HFR (veh/h) 0 0 0 23 0 166
Percent Heavy Vehicles 0 0 0 5 0 0 Percent Grade (%) 0 0 Flared Approach N N Storage 0 0 RT Channelized 0 0 Lanes 0 0 0 1 0 1 Configuration L R Delay, Queue Length, and Level of ServiceApproach Northbound Southbound Westbound Eastbound
Movement 1 4 7 8 9 10 11 12
Lane Configuration L L R v (veh/h) 41 23 166 C (m) (veh/h) 1339 228 415 v/c 0.03 0.10 0.40 95% queue length 0.09 0.33 1.89 Control Delay (s/veh) 7.8 22.6 19.3 LOS A C C Approach Delay (s/veh) -- -- 19.7 Approach LOS -- -- C
Copyright © 2010 University of Florida, All Rights Reserved HCS+TM Version 5.6 Generated: 7/27/2015 1:58 PM
Page 1 of 1Two-Way Stop Control
7/27/2015file://C:\Users\asells\AppData\Local\Temp\u2k3123.tmp

No Build AM Peak Signalized

HCS 2010 Signalized Intersection Results Summary
General Information Intersection Information
Agency Duration, h 0.25
Analyst A SELLS Analysis Date Jul 22, 2015 Area Type Other
Jurisdiction Time Period No Build AM PHF 0.91
Urban Street MacCorkle Avenue Analysis Year 2030 Analysis Period 1> 7:30
Intersection MacCorkle Ave & Kenna … File Name No Build AM - MacCorkle.xus
Project Description
Demand Information EB WB NB SB
Approach Movement L T R L T R L T R L T R
Demand ( v ), veh/h 14 1841 9 30 1016 15 9 5 71 7 0 0
Signal Information
GreenYellowRed
3.8 3.1 116.7 11.4 0.0 0.03.0 0.0 4.0 4.0 0.0 0.01.0 0.0 2.0 1.0 0.0 0.0
1 2 3
5 6 7 8
Cycle, s 150.0 Reference Phase 2
Offset, s 0 Reference Point End
Uncoordinated No Simult. Gap E/W On
Force Mode Fixed Simult. Gap N/S On
Timer Results EBL EBT WBL WBT NBL NBT SBL SBT
Assigned Phase 1 6 5 2 4 8
Case Number 2.0 4.0 2.0 3.0 8.0 7.0
Phase Duration, s 7.8 122.7 10.9 125.8 16.4 16.4
Change Period, (Y+Rc), s 4.0 6.0 5.0 6.0 5.0 5.0
Max Allow Headway (MAH), s 3.1 0.0 3.1 0.0 3.4 3.4
Queue Clearance Time (gs), s 3.3 4.8 7.8 2.9
Green Extension Time (ge), s 0.0 0.0 0.0 0.0 0.1 0.1
Phase Call Probability 0.47 0.74 0.95 0.95
Max Out Probability 0.00 0.00 0.00 0.00
Movement Group Results EB WB NB SB
Approach Movement L T R L T R L T R L T R
Assigned Movement 1 6 16 5 2 12 7 4 14 3 8 18
Adjusted Flow Rate (v), veh/h 15 1355 676 32 1083 16 64 8 0
Adjusted Saturation Flow Rate (s), veh/h/ln 1727 1814 1810 1727 1693 1537 1562 1262 1537
Queue Service Time (gs), s 1.3 0.0 0.0 2.8 12.6 0.2 0.8 0.0 0.0
Cycle Queue Clearance Time (gc), s 1.3 0.0 0.0 2.8 12.6 0.2 5.8 0.9 0.0
Green Ratio (g/C) 0.03 0.78 0.78 0.04 0.80 0.80 0.08 0.08 0.08
Capacity (c), veh/h 44 2823 1408 68 2706 1228 146 144 117
Volume-to-Capacity Ratio (X) 0.353 0.480 0.480 0.472 0.400 0.013 0.436 0.053 0.000
Available Capacity (ca), veh/h 180 2823 1408 168 2706 1228 204 194 174
Back of Queue (Q), veh/ln (95th percentile) 1.1 0.4 0.8 2.3 6.3 0.1 4.3 0.5 0.0
Queue Storage Ratio (RQ) (95th percentile) 0.13 0.00 0.00 0.00 0.00 0.02 0.00 0.00 0.00
Uniform Delay (d1), s/veh 71.3 0.0 0.0 72.7 3.8 2.4 66.7 64.5 0.0
Incremental Delay (d2), s/veh 1.8 0.6 1.2 1.7 0.4 0.0 0.8 0.1 0.0
Initial Queue Delay (d3), s/veh 0.0 0.0 0.0 0.0 0.0 0.0 0.0 0.0 0.0
Control Delay (d), s/veh 73.1 0.6 1.2 74.4 4.2 2.4 67.5 64.5 0.0
Level of Service (LOS) E A A E A A E E
Approach Delay, s/veh / LOS 1.3 A 6.2 A 67.5 E 64.5 E
Intersection Delay, s/veh / LOS 4.5 A
Multimodal Results EB WB NB SB
Pedestrian LOS Score / LOS 2.1 B 2.2 B 3.3 C 3.0 C
Bicycle LOS Score / LOS 1.6 A 1.4 A 0.6 A 0.5 A
Copyright © 2015 University of Florida, All Rights Reserved. HCS 2010™ Streets Version 6.70 Generated: 7/30/2015 4:10:10 PM

HCS 2010 Signalized Intersection Results Summary
General Information Intersection Information
Agency Duration, h 0.25
Analyst A SELLS Analysis Date Jul 22, 2015 Area Type Other
Jurisdiction Time Period No Build AM PHF 0.91
Urban Street MacCorkle Avenue Analysis Year 2030 Analysis Period 1> 7:30
Intersection MacCorkle Ave & I-64 EB File Name No Build AM - MacCorkle.xus
Project Description
Demand Information EB WB NB SB
Approach Movement L T R L T R L T R L T R
Demand ( v ), veh/h 1104 40 956 111 0
Signal Information
GreenYellowRed
6.6 115.3 13.1 0.0 0.0 0.04.0 4.0 4.0 0.0 0.0 0.01.0 1.0 1.0 0.0 0.0 0.0
1 2 3
5 6 7 8
Cycle, s 150.0 Reference Phase 2
Offset, s 0 Reference Point End
Uncoordinated No Simult. Gap E/W On
Force Mode Fixed Simult. Gap N/S On
Timer Results EBL EBT WBL WBT NBL NBT SBL SBT
Assigned Phase 6 5 2 4
Case Number 8.3 1.0 4.0 12.0
Phase Duration, s 120.3 11.6 131.9 18.1
Change Period, (Y+Rc), s 5.0 5.0 5.0 5.0
Max Allow Headway (MAH), s 0.0 3.1 0.0 3.1
Queue Clearance Time (gs), s 2.7 13.1
Green Extension Time (ge), s 0.0 0.0 0.0 0.1
Phase Call Probability 0.83 0.99
Max Out Probability 0.00 0.01
Movement Group Results EB WB NB SB
Approach Movement L T R L T R L T R L T R
Assigned Movement 6 5 2 7 4
Adjusted Flow Rate (v), veh/h 2109 42 1009 122
Adjusted Saturation Flow Rate (s), veh/h/ln 1727 1678 1677 1631
Queue Service Time (gs), s 46.2 0.7 6.6 11.1
Cycle Queue Clearance Time (gc), s 46.2 0.7 6.6 11.1
Green Ratio (g/C) 0.77 0.83 0.85 0.09
Capacity (c), veh/h 2654 208 2839 142
Volume-to-Capacity Ratio (X) 0.794 0.203 0.356 0.858
Available Capacity (ca), veh/h 2654 323 2839 218
Back of Queue (Q), veh/ln (95th percentile) 17.3 1.0 2.5 8.8
Queue Storage Ratio (RQ) (95th percentile) 0.00 0.20 0.00 0.00
Uniform Delay (d1), s/veh 7.0 12.8 1.5 67.5
Incremental Delay (d2), s/veh 2.2 0.2 0.3 12.3
Initial Queue Delay (d3), s/veh 0.0 0.0 0.0 0.0
Control Delay (d), s/veh 9.2 13.0 1.8 79.8
Level of Service (LOS) A B A E
Approach Delay, s/veh / LOS 9.2 A 2.2 A 79.8 E 0.0
Intersection Delay, s/veh / LOS 9.6 A
Multimodal Results EB WB NB SB
Pedestrian LOS Score / LOS 2.0 B 1.8 A 2.9 C 2.8 C
Bicycle LOS Score / LOS 1.5 A 1.4 A 0.7 A
Copyright © 2015 University of Florida, All Rights Reserved. HCS 2010™ Streets Version 6.70 Generated: 7/30/2015 4:10:10 PM

HCS 2010 Signalized Intersection Results Summary
General Information Intersection Information
Agency Duration, h 0.25
Analyst A SELLS Analysis Date Jul 22, 2015 Area Type Other
Jurisdiction Time Period No Build AM PHF 0.91
Urban Street MacCorkle Avenue Analysis Year 2030 Analysis Period 1> 7:30
Intersection MacCorkle Ave & Jeffers… File Name No Build AM - MacCorkle.xus
Project Description
Demand Information EB WB NB SB
Approach Movement L T R L T R L T R L T R
Demand ( v ), veh/h 21 1107 634 137 869 5 115 9 321 15 5 12
Signal Information
GreenYellowRed
5.2 2.8 87.8 25.0 9.2 0.04.0 0.0 4.0 4.0 4.0 0.01.0 0.0 1.0 1.0 1.0 0.0
1 2 3
5 6 7 8
Cycle, s 150.0 Reference Phase 2
Offset, s 0 Reference Point End
Uncoordinated No Simult. Gap E/W On
Force Mode Fixed Simult. Gap N/S On
Timer Results EBL EBT WBL WBT NBL NBT SBL SBT
Assigned Phase 1 6 5 2 4 8
Case Number 1.1 3.0 1.1 4.0 10.0 10.0
Phase Duration, s 10.2 92.8 13.0 95.6 30.0 14.2
Change Period, (Y+Rc), s 5.0 5.0 5.0 5.0 5.0 5.0
Max Allow Headway (MAH), s 3.1 0.0 3.1 0.0 3.2 3.3
Queue Clearance Time (gs), s 2.9 7.0 27.0 3.6
Green Extension Time (ge), s 0.0 0.0 0.2 0.0 0.0 0.0
Phase Call Probability 0.65 1.00 1.00 0.77
Max Out Probability 0.00 0.00 1.00 0.00
Movement Group Results EB WB NB SB
Approach Movement L T R L T R L T R L T R
Assigned Movement 1 6 16 5 2 12 7 4 14 3 8 18
Adjusted Flow Rate (v), veh/h 25 1327 711 144 459 458 126 255 16 19
Adjusted Saturation Flow Rate (s), veh/h/ln 1727 1646 1465 1678 1762 1758 1678 1502 1762 1609
Queue Service Time (gs), s 0.9 30.2 46.9 5.0 23.9 23.8 9.8 25.0 1.3 1.6
Cycle Queue Clearance Time (gc), s 0.9 30.2 46.9 5.0 23.9 23.8 9.8 25.0 1.3 1.6
Green Ratio (g/C) 0.62 0.59 0.59 0.64 0.60 0.60 0.17 0.17 0.06 0.06
Capacity (c), veh/h 369 1927 858 291 1064 1062 280 250 108 99
Volume-to-Capacity Ratio (X) 0.068 0.689 0.829 0.495 0.432 0.432 0.452 1.018 0.152 0.189
Available Capacity (ca), veh/h 618 1927 858 557 1064 1062 280 250 294 268
Back of Queue (Q), veh/ln (95th percentile) 0.6 11.3 16.1 3.5 14.9 14.8 7.2 19.4 1.1 1.2
Queue Storage Ratio (RQ) (95th percentile) 0.07 0.00 0.00 0.00 0.00 0.00 0.00 0.00 0.00 0.00
Uniform Delay (d1), s/veh 13.2 10.9 12.9 16.2 19.6 19.6 52.4 58.3 65.2 65.4
Incremental Delay (d2), s/veh 0.0 1.0 4.9 0.4 1.0 1.0 0.4 61.7 0.2 0.3
Initial Queue Delay (d3), s/veh 0.0 0.0 0.0 0.0 0.0 0.0 0.0 0.0 0.0 0.0
Control Delay (d), s/veh 13.3 12.0 17.8 16.6 20.6 20.5 52.8 120.0 65.4 65.7
Level of Service (LOS) B B B B C C D F E E
Approach Delay, s/veh / LOS 14.0 B 20.0 C 97.8 F 65.6 E
Intersection Delay, s/veh / LOS 25.3 C
Multimodal Results EB WB NB SB
Pedestrian LOS Score / LOS 2.4 B 2.3 B 2.9 C 3.1 C
Bicycle LOS Score / LOS 2.0 B 1.4 A 1.1 A 0.5 A
Copyright © 2015 University of Florida, All Rights Reserved. HCS 2010™ Streets Version 6.70 Generated: 7/30/2015 4:10:10 PM
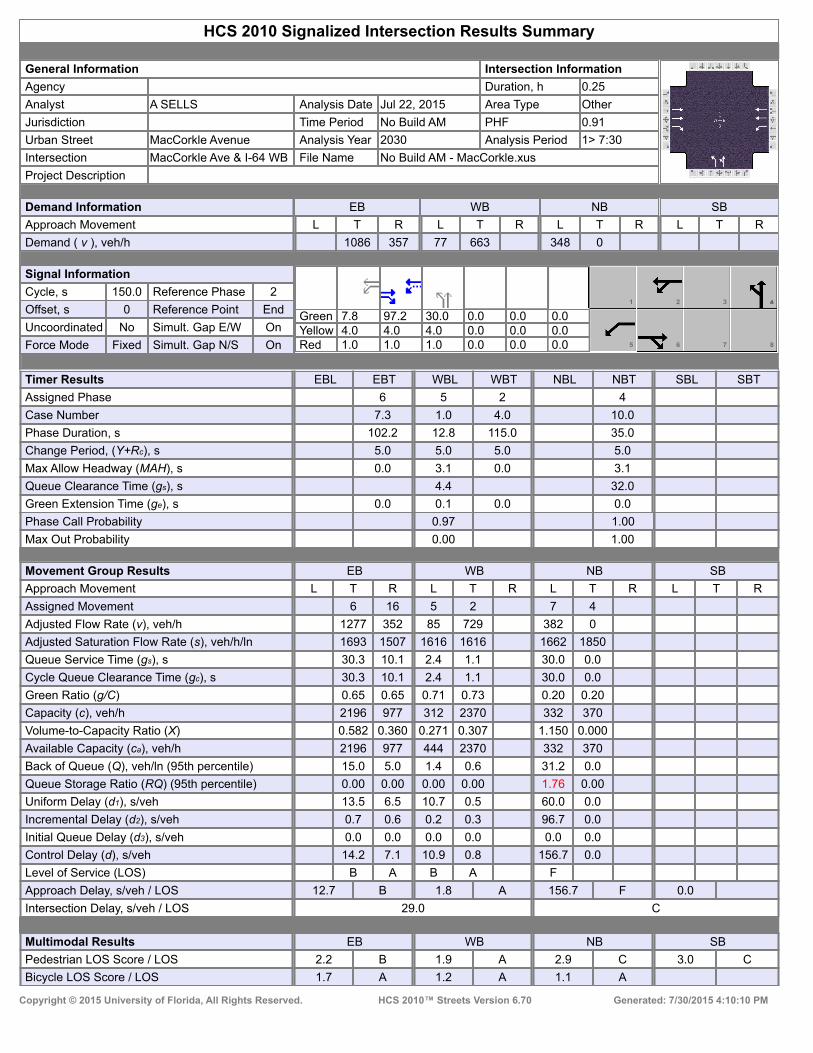
HCS 2010 Signalized Intersection Results Summary
General Information Intersection Information
Agency Duration, h 0.25
Analyst A SELLS Analysis Date Jul 22, 2015 Area Type Other
Jurisdiction Time Period No Build AM PHF 0.91
Urban Street MacCorkle Avenue Analysis Year 2030 Analysis Period 1> 7:30
Intersection MacCorkle Ave & I-64 WB File Name No Build AM - MacCorkle.xus
Project Description
Demand Information EB WB NB SB
Approach Movement L T R L T R L T R L T R
Demand ( v ), veh/h 1086 357 77 663 348 0
Signal Information
GreenYellowRed
7.8 97.2 30.0 0.0 0.0 0.04.0 4.0 4.0 0.0 0.0 0.01.0 1.0 1.0 0.0 0.0 0.0
1 2 3
5 6 7 8
Cycle, s 150.0 Reference Phase 2
Offset, s 0 Reference Point End
Uncoordinated No Simult. Gap E/W On
Force Mode Fixed Simult. Gap N/S On
Timer Results EBL EBT WBL WBT NBL NBT SBL SBT
Assigned Phase 6 5 2 4
Case Number 7.3 1.0 4.0 10.0
Phase Duration, s 102.2 12.8 115.0 35.0
Change Period, (Y+Rc), s 5.0 5.0 5.0 5.0
Max Allow Headway (MAH), s 0.0 3.1 0.0 3.1
Queue Clearance Time (gs), s 4.4 32.0
Green Extension Time (ge), s 0.0 0.1 0.0 0.0
Phase Call Probability 0.97 1.00
Max Out Probability 0.00 1.00
Movement Group Results EB WB NB SB
Approach Movement L T R L T R L T R L T R
Assigned Movement 6 16 5 2 7 4
Adjusted Flow Rate (v), veh/h 1277 352 85 729 382 0
Adjusted Saturation Flow Rate (s), veh/h/ln 1693 1507 1616 1616 1662 1850
Queue Service Time (gs), s 30.3 10.1 2.4 1.1 30.0 0.0
Cycle Queue Clearance Time (gc), s 30.3 10.1 2.4 1.1 30.0 0.0
Green Ratio (g/C) 0.65 0.65 0.71 0.73 0.20 0.20
Capacity (c), veh/h 2196 977 312 2370 332 370
Volume-to-Capacity Ratio (X) 0.582 0.360 0.271 0.307 1.150 0.000
Available Capacity (ca), veh/h 2196 977 444 2370 332 370
Back of Queue (Q), veh/ln (95th percentile) 15.0 5.0 1.4 0.6 31.2 0.0
Queue Storage Ratio (RQ) (95th percentile) 0.00 0.00 0.00 0.00 1.76 0.00
Uniform Delay (d1), s/veh 13.5 6.5 10.7 0.5 60.0 0.0
Incremental Delay (d2), s/veh 0.7 0.6 0.2 0.3 96.7 0.0
Initial Queue Delay (d3), s/veh 0.0 0.0 0.0 0.0 0.0 0.0
Control Delay (d), s/veh 14.2 7.1 10.9 0.8 156.7 0.0
Level of Service (LOS) B A B A F
Approach Delay, s/veh / LOS 12.7 B 1.8 A 156.7 F 0.0
Intersection Delay, s/veh / LOS 29.0 C
Multimodal Results EB WB NB SB
Pedestrian LOS Score / LOS 2.2 B 1.9 A 2.9 C 3.0 C
Bicycle LOS Score / LOS 1.7 A 1.2 A 1.1 A
Copyright © 2015 University of Florida, All Rights Reserved. HCS 2010™ Streets Version 6.70 Generated: 7/30/2015 4:10:10 PM

HCS 2010 Signalized Intersection Results Summary
General Information Intersection Information
Agency Duration, h 0.25
Analyst A SELLS Analysis Date Jul 22, 2015 Area Type Other
Jurisdiction Time Period No Build AM PHF 0.91
Urban Street Jefferson Road Analysis Year 2030 Analysis Period 1> 7:30
Intersection Jefferson Rd & Mathias Ln File Name No Build AM - Kanawha.xus
Project Description
Demand Information EB WB NB SB
Approach Movement L T R L T R L T R L T R
Demand ( v ), veh/h 25 582 2 0 629 391 2 6 38 644 7
Signal Information
GreenYellowRed
88.0 29.0 5.0 0.0 0.0 0.04.0 4.0 3.0 0.0 0.0 0.01.0 1.0 1.0 0.0 0.0 0.0
1 2 3 4
5 6 7
Cycle, s 136.0 Reference Phase 2
Offset, s 0 Reference Point End
Uncoordinated No Simult. Gap E/W On
Force Mode Fixed Simult. Gap N/S On
Timer Results EBL EBT WBL WBT NBL NBT SBL SBT
Assigned Phase 6 2 8 4
Case Number 6.0 7.0 12.0 10.0
Phase Duration, s 93.0 93.0 9.0 34.0
Change Period, (Y+Rc), s 5.0 5.0 4.0 5.0
Max Allow Headway (MAH), s 0.0 0.0 3.3 3.1
Queue Clearance Time (gs), s 5.9 31.0
Green Extension Time (ge), s 0.0 0.0 0.0 0.0
Phase Call Probability 0.83 1.00
Max Out Probability 1.00 1.00
Movement Group Results EB WB NB SB
Approach Movement L T R L T R L T R L T R
Assigned Movement 1 6 16 5 2 12 3 8 18 7 4
Adjusted Flow Rate (v), veh/h 27 642 0 328 46 708 8
Adjusted Saturation Flow Rate (s), veh/h/ln 860 1813 0 1537 1580 1727 1814
Queue Service Time (gs), s 0.9 12.5 0.0 11.5 3.9 29.0 0.5
Cycle Queue Clearance Time (gc), s 19.6 12.5 0.0 11.5 3.9 29.0 0.5
Green Ratio (g/C) 0.65 0.65 0.65 0.04 0.21 0.21
Capacity (c), veh/h 495 1174 995 58 368 387
Volume-to-Capacity Ratio (X) 0.056 0.547 0.000 0.329 0.803 1.921 0.020
Available Capacity (ca), veh/h 495 1174 995 93 368 387
Back of Queue (Q), veh/ln (95th percentile) 0.4 6.3 0.0 4.4 3.1 87.1 0.4
Queue Storage Ratio (RQ) (95th percentile) 0.04 0.00 0.00 0.00 0.00 0.00 0.00
Uniform Delay (d1), s/veh 7.6 4.1 9.0 65.0 53.5 42.3
Incremental Delay (d2), s/veh 0.2 1.8 0.0 0.1 9.2 424.6 0.0
Initial Queue Delay (d3), s/veh 0.0 0.0 0.0 0.0 0.0 0.0 0.0
Control Delay (d), s/veh 7.8 6.0 9.1 74.3 478.1 42.3
Level of Service (LOS) A A A E F D
Approach Delay, s/veh / LOS 6.0 A 9.7 A 74.3 E 473.4 F
Intersection Delay, s/veh / LOS 154.1 F
Multimodal Results EB WB NB SB
Pedestrian LOS Score / LOS 2.1 B 2.2 B 2.3 B 2.3 B
Bicycle LOS Score / LOS 1.6 A 2.3 B 0.6 A 1.7 A
Copyright © 2015 University of Florida, All Rights Reserved. HCS 2010™ Streets Version 6.70 Generated: 7/27/2015 1:35:39 PM

HCS 2010 Signalized Intersection Results Summary
General Information Intersection Information
Agency Duration, h 0.25
Analyst A SELLS Analysis Date Jul 22, 2015 Area Type Other
Jurisdiction Time Period No Build AM PHF 0.91
Urban Street Jefferson Road Analysis Year 2030 Analysis Period 1> 7:30
Intersection Jefferson Rd & Kanawh… File Name No Build AM - Kanawha.xus
Project Description
Demand Information EB WB NB SB
Approach Movement L T R L T R L T R L T R
Demand ( v ), veh/h 727 537 259 401 619 0 171
Signal Information
GreenYellowRed
77.0 7.1 36.8 0.0 0.0 0.04.0 4.0 4.0 0.0 0.0 0.01.0 1.0 1.0 0.0 0.0 0.0
1 2 3 4
5 6 7
Cycle, s 136.0 Reference Phase 2
Offset, s 0 Reference Point End
Uncoordinated No Simult. Gap E/W On
Force Mode Fixed Simult. Gap N/S On
Timer Results EBL EBT WBL WBT NBL NBT SBL SBT
Assigned Phase 2 1 6 8
Case Number 7.3 1.0 4.0 9.0
Phase Duration, s 82.0 12.1 94.2 41.8
Change Period, (Y+Rc), s 5.0 5.0 5.0 5.0
Max Allow Headway (MAH), s 0.0 3.1 0.0 3.1
Queue Clearance Time (gs), s 2.0 38.8
Green Extension Time (ge), s 0.0 0.6 0.0 0.0
Phase Call Probability 1.00 1.00
Max Out Probability 0.01 1.00
Movement Group Results EB WB NB SB
Approach Movement L T R L T R L T R L T R
Assigned Movement 2 12 1 6 3 8 18
Adjusted Flow Rate (v), veh/h 580 318 285 441 680 0 69
Adjusted Saturation Flow Rate (s), veh/h/ln 1796 1537 1711 1710 1631 1814 1537
Queue Service Time (gs), s 33.2 15.5 0.0 2.7 36.8 0.0 4.7
Cycle Queue Clearance Time (gc), s 33.2 15.5 0.0 2.7 36.8 0.0 4.7
Green Ratio (g/C) 0.57 0.57 0.60 0.66 0.27 0.27 0.27
Capacity (c), veh/h 1017 870 396 2242 442 491 416
Volume-to-Capacity Ratio (X) 0.570 0.366 0.718 0.197 1.539 0.000 0.166
Available Capacity (ca), veh/h 1017 870 495 2242 442 491 416
Back of Queue (Q), veh/ln (95th percentile) 16.6 6.4 14.0 1.6 70.2 0.0 3.2
Queue Storage Ratio (RQ) (95th percentile) 0.00 0.00 0.00 0.00 0.00 0.00 0.00
Uniform Delay (d1), s/veh 26.3 16.2 41.3 3.1 49.6 0.0 37.9
Incremental Delay (d2), s/veh 0.2 0.1 2.5 0.2 253.8 0.0 0.1
Initial Queue Delay (d3), s/veh 0.0 0.0 0.0 0.0 0.0 0.0 0.0
Control Delay (d), s/veh 26.5 16.3 43.8 3.3 303.3 0.0 37.9
Level of Service (LOS) C B D A F D
Approach Delay, s/veh / LOS 22.9 C 19.2 B 278.8 F 0.0
Intersection Delay, s/veh / LOS 102.6 F
Multimodal Results EB WB NB SB
Pedestrian LOS Score / LOS 2.6 B 1.9 A 2.5 B 3.0 C
Bicycle LOS Score / LOS 2.5 B 1.1 A 1.7 A
Copyright © 2015 University of Florida, All Rights Reserved. HCS 2010™ Streets Version 6.70 Generated: 7/31/2015 10:57:35 AM

HCS 2010 Signalized Intersection Results Summary
General Information Intersection Information
Agency Duration, h 0.25
Analyst A SELLS Analysis Date Jul 22, 2015 Area Type Other
Jurisdiction Time Period No Build AM PHF 0.88
Urban Street Jefferson Road Analysis Year 2030 Analysis Period 1> 7:30
Intersection Jefferson Rd & Oakhurs… File Name No Build AM - US 119 & Oakhurst.xus
Project Description
Demand Information EB WB NB SB
Approach Movement L T R L T R L T R L T R
Demand ( v ), veh/h 546 10 146 101 130 80
Signal Information
GreenYellowRed
12.3 46.6 47.5 0.0 0.0 0.04.0 4.0 4.0 0.0 0.0 0.00.5 0.5 0.5 0.0 0.0 0.0
1 3 4
5 6 7 8
Cycle, s 120.0 Reference Phase 2
Offset, s 0 Reference Point Begin
Uncoordinated No Simult. Gap E/W On
Force Mode Fixed Simult. Gap N/S On
Timer Results EBL EBT WBL WBT NBL NBT SBL SBT
Assigned Phase 4 2 1 6
Case Number 9.0 7.3 2.0 4.0
Phase Duration, s 52.0 51.1 16.8 68.0
Change Period, (Y+Rc), s 4.5 4.5 4.5 4.5
Max Allow Headway (MAH), s 3.1 0.0 3.1 0.0
Queue Clearance Time (gs), s 46.5 12.2
Green Extension Time (ge), s 1.0 0.0 0.2 0.0
Phase Call Probability 1.00 1.00
Max Out Probability 0.05 0.00
Movement Group Results EB WB NB SB
Approach Movement L T R L T R L T R L T R
Assigned Movement 7 14 2 12 1 6
Adjusted Flow Rate (v), veh/h 620 11 166 58 148 91
Adjusted Saturation Flow Rate (s), veh/h/ln 1631 1452 1762 1568 1711 1796
Queue Service Time (gs), s 44.5 0.6 7.6 2.8 10.2 3.0
Cycle Queue Clearance Time (gc), s 44.5 0.6 7.6 2.8 10.2 3.0
Green Ratio (g/C) 0.40 0.40 0.39 0.39 0.10 0.53
Capacity (c), veh/h 646 575 685 609 176 950
Volume-to-Capacity Ratio (X) 0.960 0.020 0.242 0.095 0.840 0.096
Available Capacity (ca), veh/h 755 671 685 609 335 950
Back of Queue (Q), veh/ln (95th percentile) 28.0 0.3 5.9 1.9 8.0 2.2
Queue Storage Ratio (RQ) (95th percentile) 0.00 0.02 0.00 0.00 0.95 0.00
Uniform Delay (d1), s/veh 35.3 22.1 24.8 23.3 52.9 14.0
Incremental Delay (d2), s/veh 20.9 0.0 0.8 0.3 4.1 0.2
Initial Queue Delay (d3), s/veh 0.0 0.0 0.0 0.0 0.0 0.0
Control Delay (d), s/veh 56.3 22.1 25.6 23.6 56.9 14.2
Level of Service (LOS) E C C C E B
Approach Delay, s/veh / LOS 55.6 E 0.0 25.1 C 40.7 D
Intersection Delay, s/veh / LOS 46.1 D
Multimodal Results EB WB NB SB
Pedestrian LOS Score / LOS 2.4 B 2.3 B 1.9 A 1.7 A
Bicycle LOS Score / LOS F 0.9 A 0.9 A
Copyright © 2015 University of Florida, All Rights Reserved. HCS 2010™ Streets Version 6.70 Generated: 7/27/2015 2:23:51 PM

No Build PM Peak Unsignalized

TWO-WAY STOP CONTROL SUMMARY
General Information Site Information Analyst ASELLS Agency/Co. STANTEC Date Performed 12/3/14 Analysis Time Period No Build PM
IntersectionJurisdictionAnalysis Year
Project Description East/West Street: Bob Evans entrance North/South Street: Jefferson Road Intersection Orientation: North-South Study Period (hrs): 0.25
Vehicle Volumes and Adjustments Major Street Northbound Southbound Movement 1 2 3 4 5 6
L T R L T RVolume (veh/h) 10 650 870 45 Peak-Hour Factor, PHF 0.95 0.96 1.00 1.00 0.90 0.69 Hourly Flow Rate, HFR (veh/h)
10 677 0 0 966 65
Percent Heavy Vehicles 2 -- -- 0 -- -- Median Type Undivided RT Channelized 0 0 Lanes 0 2 0 0 2 0 Configuration LT T T TR Upstream Signal 1 0 Minor Street Eastbound Westbound Movement 7 8 9 10 11 12
L T R L T RVolume (veh/h) 20 25 Peak-Hour Factor, PHF 0.32 1.00 0.88 1.00 1.00 1.00 Hourly Flow Rate, HFR (veh/h) 62 0 28 0 0 0
Percent Heavy Vehicles 2 0 2 0 0 0 Percent Grade (%) 0 0 Flared Approach N N Storage 0 0 RT Channelized 0 0 Lanes 1 0 1 0 0 0 Configuration L R Delay, Queue Length, and Level of ServiceApproach Northbound Southbound Westbound Eastbound
Movement 1 4 7 8 9 10 11 12
Lane Configuration LT L R v (veh/h) 10 62 28 C (m) (veh/h) 666 144 555 v/c 0.02 0.43 0.05 95% queue length 0.05 1.91 0.16 Control Delay (s/veh) 10.5 47.7 11.8 LOS B E B Approach Delay (s/veh) -- -- 36.5 Approach LOS -- -- E
Copyright © 2010 University of Florida, All Rights Reserved HCS+TM Version 5.6 Generated: 4/16/2015 3:19 PM
Page 1 of 1Two-Way Stop Control
4/16/2015file://C:\Users\asells\AppData\Local\Temp\u2kCB4.tmp

TWO-WAY STOP CONTROL SUMMARY
General Information Site Information Analyst ASELLS Agency/Co. STANTEC Date Performed 12/3/14 Analysis Time Period No Build PM
Intersection Jurisdiction Analysis Year 2030
Project Description East/West Street: McDonalds entrance North/South Street: Jefferson Road Intersection Orientation: North-South Study Period (hrs): 0.25
Vehicle Volumes and Adjustments Major Street Northbound Southbound Movement 1 2 3 4 5 6 L T R L T RVolume (veh/h) 20 650 870 35 Peak-Hour Factor, PHF 0.78 0.94 1.00 1.00 0.89 0.87 Hourly Flow Rate, HFR (veh/h)
25 691 0 0 977 40
Percent Heavy Vehicles 2 -- -- 0 -- -- Median Type Undivided RT Channelized 0 0 Lanes 0 2 0 0 2 0 Configuration LT T T TR Upstream Signal 0 0 Minor Street Eastbound Westbound Movement 7 8 9 10 11 12
L T R L T RVolume (veh/h) 5 0 Peak-Hour Factor, PHF 1.00 1.00 1.00 1.00 1.00 1.00 Hourly Flow Rate, HFR (veh/h) 5 0 0 0 0 0
Percent Heavy Vehicles 2 0 2 0 0 0 Percent Grade (%) 0 0 Flared Approach N N Storage 0 0 RT Channelized 0 0 Lanes 1 0 1 0 0 0 Configuration L R Delay, Queue Length, and Level of ServiceApproach Northbound Southbound Westbound Eastbound
Movement 1 4 7 8 9 10 11 12
Lane Configuration LT L R v (veh/h) 25 5 0 C (m) (veh/h) 674 127 559 v/c 0.04 0.04 0.00 95% queue length 0.12 0.12 0.00 Control Delay (s/veh) 10.5 34.5 11.4 LOS B D B Approach Delay (s/veh) -- -- 34.5 Approach LOS -- -- D
Copyright © 2010 University of Florida, All Rights Reserved HCS+TM Version 5.6 Generated: 4/16/2015 3:20 PM
Page 1 of 1Two-Way Stop Control
4/16/2015file://C:\Users\asells\AppData\Local\Temp\u2k29F4.tmp

TWO-WAY STOP CONTROL SUMMARY
General Information Site Information Analyst ASELLS Agency/Co. STANTEC Date Performed 12/3/14 Analysis Time Period No Build PM
Intersection Jurisdiction Analysis Year 2030
Project Description East/West Street: Community Center - North North/South Street: Jefferson Road Intersection Orientation: North-South Study Period (hrs): 0.25
Vehicle Volumes and Adjustments Major Street Northbound Southbound Movement 1 2 3 4 5 6 L T R L T RVolume (veh/h) 10 607 801 69 Peak-Hour Factor, PHF 0.83 0.98 1.00 1.00 0.98 0.75 Hourly Flow Rate, HFR (veh/h)
12 619 0 0 817 92
Percent Heavy Vehicles 2 -- -- 0 -- -- Median Type Undivided RT Channelized 0 0 Lanes 0 1 0 0 2 0 Configuration LT T TR Upstream Signal 0 0 Minor Street Eastbound Westbound Movement 7 8 9 10 11 12
L T R L T RVolume (veh/h) 43 0 10 Peak-Hour Factor, PHF 0.88 1.00 0.79 1.00 1.00 1.00 Hourly Flow Rate, HFR (veh/h) 48 0 12 0 0 0
Percent Heavy Vehicles 2 0 2 0 0 0 Percent Grade (%) 0 0 Flared Approach N N Storage 0 0 RT Channelized 0 0 Lanes 0 1 0 0 0 0 Configuration LTR Delay, Queue Length, and Level of ServiceApproach Northbound Southbound Westbound Eastbound
Movement 1 4 7 8 9 10 11 12
Lane Configuration LT LTR v (veh/h) 12 60 C (m) (veh/h) 743 131 v/c 0.02 0.46 95% queue length 0.05 2.06 Control Delay (s/veh) 9.9 53.8 LOS A F Approach Delay (s/veh) -- -- 53.8 Approach LOS -- -- F
Copyright © 2010 University of Florida, All Rights Reserved HCS+TM Version 5.6 Generated: 4/16/2015 3:17 PM
Page 1 of 1Two-Way Stop Control
4/16/2015file://C:\Users\asells\AppData\Local\Temp\u2kF695.tmp
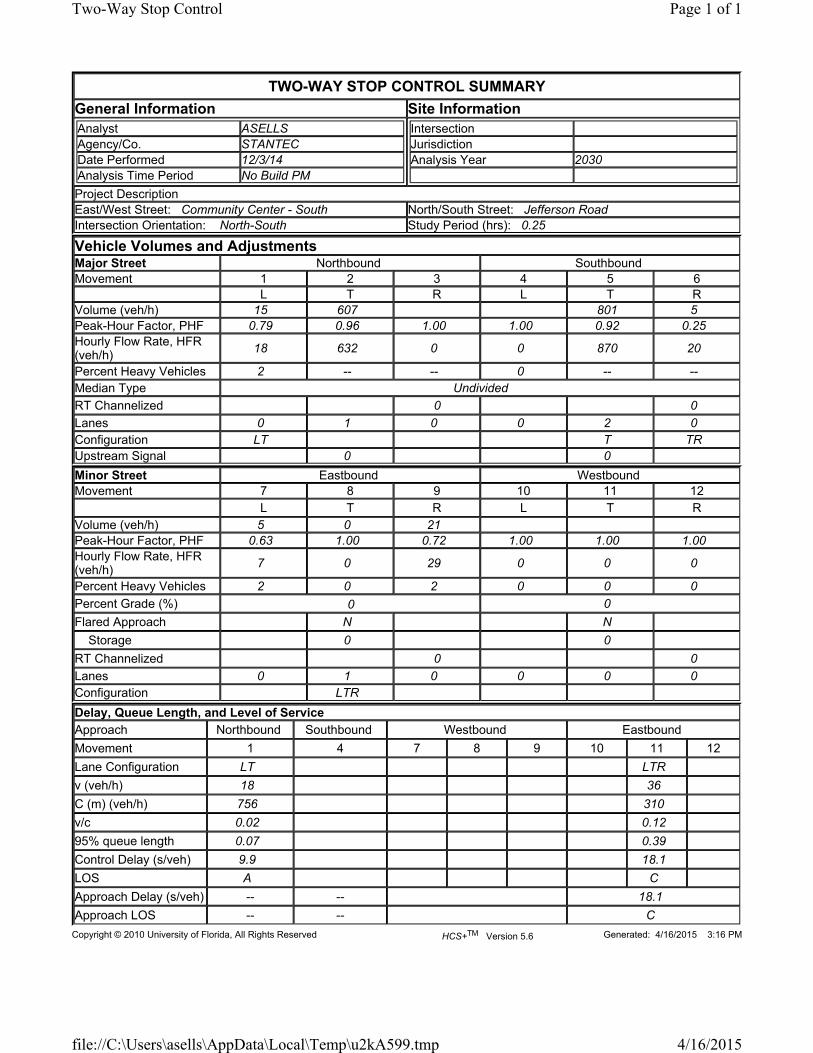
TWO-WAY STOP CONTROL SUMMARY
General Information Site Information Analyst ASELLS Agency/Co. STANTEC Date Performed 12/3/14 Analysis Time Period No Build PM
Intersection Jurisdiction Analysis Year 2030
Project Description East/West Street: Community Center - South North/South Street: Jefferson Road Intersection Orientation: North-South Study Period (hrs): 0.25
Vehicle Volumes and Adjustments Major Street Northbound Southbound Movement 1 2 3 4 5 6 L T R L T RVolume (veh/h) 15 607 801 5 Peak-Hour Factor, PHF 0.79 0.96 1.00 1.00 0.92 0.25 Hourly Flow Rate, HFR (veh/h)
18 632 0 0 870 20
Percent Heavy Vehicles 2 -- -- 0 -- -- Median Type Undivided RT Channelized 0 0 Lanes 0 1 0 0 2 0 Configuration LT T TR Upstream Signal 0 0 Minor Street Eastbound Westbound Movement 7 8 9 10 11 12
L T R L T RVolume (veh/h) 5 0 21 Peak-Hour Factor, PHF 0.63 1.00 0.72 1.00 1.00 1.00 Hourly Flow Rate, HFR (veh/h) 7 0 29 0 0 0
Percent Heavy Vehicles 2 0 2 0 0 0 Percent Grade (%) 0 0 Flared Approach N N Storage 0 0 RT Channelized 0 0 Lanes 0 1 0 0 0 0 Configuration LTR Delay, Queue Length, and Level of ServiceApproach Northbound Southbound Westbound Eastbound
Movement 1 4 7 8 9 10 11 12
Lane Configuration LT LTR v (veh/h) 18 36 C (m) (veh/h) 756 310 v/c 0.02 0.12 95% queue length 0.07 0.39 Control Delay (s/veh) 9.9 18.1 LOS A C Approach Delay (s/veh) -- -- 18.1 Approach LOS -- -- C
Copyright © 2010 University of Florida, All Rights Reserved HCS+TM Version 5.6 Generated: 4/16/2015 3:16 PM
Page 1 of 1Two-Way Stop Control
4/16/2015file://C:\Users\asells\AppData\Local\Temp\u2kA599.tmp

TWO-WAY STOP CONTROL SUMMARY
General Information Site Information Analyst A SELLS Agency/Co. STANTEC Date Performed 12/3/14 Analysis Time Period No Build PM
Intersection Jurisdiction Analysis Year 2030
Project Description East/West Street: Washington Street North/South Street: Jefferson Road Intersection Orientation: North-South Study Period (hrs): 0.25
Vehicle Volumes and Adjustments Major Street Northbound Southbound Movement 1 2 3 4 5 6 L T R L T RVolume (veh/h) 607 13 21 0 Peak-Hour Factor, PHF 1.00 0.94 0.89 0.88 0.91 1.00 Hourly Flow Rate, HFR (veh/h)
0 645 14 23 0 0
Percent Heavy Vehicles 0 -- -- 2 -- -- Median Type Undivided RT Channelized 0 0 Lanes 0 1 0 0 2 0 Configuration TR LT T Upstream Signal 0 0 Minor Street Eastbound Westbound Movement 7 8 9 10 11 12
L T R L T RVolume (veh/h) 10 0 27 Peak-Hour Factor, PHF 1.00 1.00 1.00 0.63 1.00 0.88 Hourly Flow Rate, HFR (veh/h) 0 0 0 15 0 30
Percent Heavy Vehicles 0 0 0 2 0 2 Percent Grade (%) 0 0 Flared Approach N N Storage 0 0 RT Channelized 0 0 Lanes 0 0 0 0 1 0 Configuration LTR Delay, Queue Length, and Level of ServiceApproach Northbound Southbound Westbound Eastbound
Movement 1 4 7 8 9 10 11 12
Lane Configuration LT LTR v (veh/h) 23 45 C (m) (veh/h) 919 423 v/c 0.03 0.11 95% queue length 0.08 0.35 Control Delay (s/veh) 9.0 14.5 LOS A B Approach Delay (s/veh) -- -- 14.5 Approach LOS -- -- B
Copyright © 2010 University of Florida, All Rights Reserved HCS+TM Version 5.6 Generated: 4/16/2015 3:21 PM
Page 1 of 1Two-Way Stop Control
4/16/2015file://C:\Users\asells\AppData\Local\Temp\u2k9370.tmp
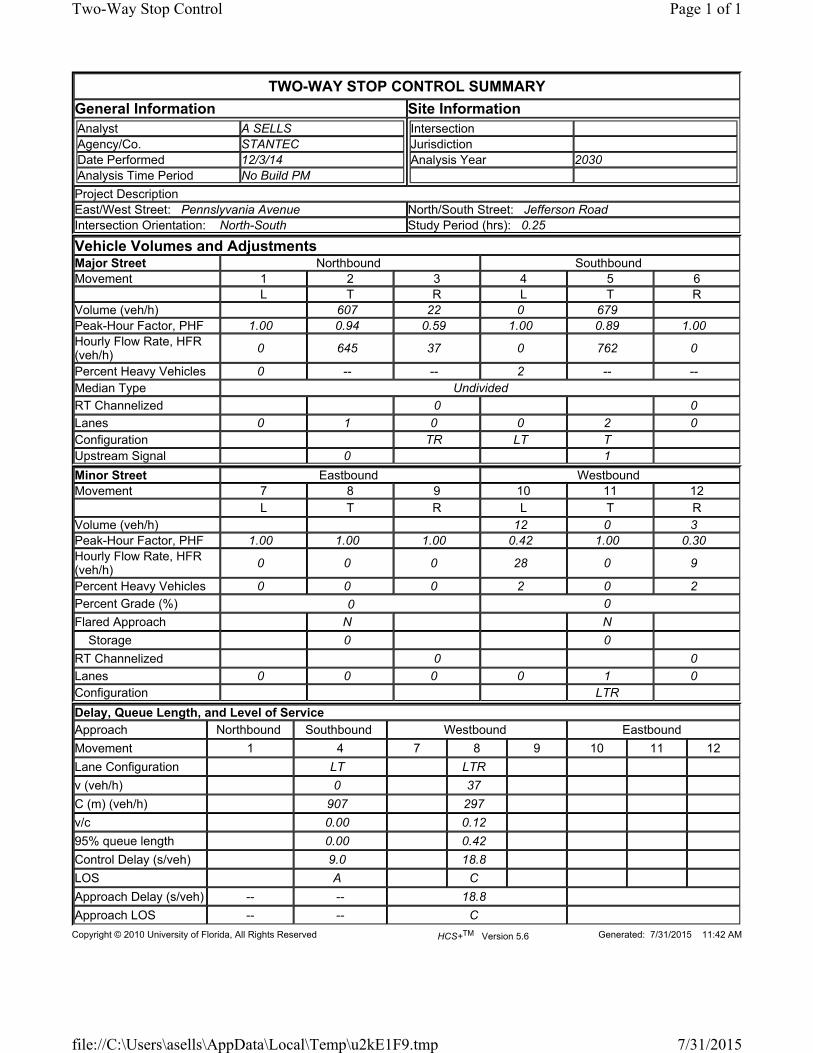
TWO-WAY STOP CONTROL SUMMARY
General Information Site Information Analyst A SELLS Agency/Co. STANTEC Date Performed 12/3/14 Analysis Time Period No Build PM
IntersectionJurisdictionAnalysis Year 2030
Project Description East/West Street: Pennslyvania Avenue North/South Street: Jefferson Road Intersection Orientation: North-South Study Period (hrs): 0.25
Vehicle Volumes and Adjustments Major Street Northbound Southbound Movement 1 2 3 4 5 6
L T R L T RVolume (veh/h) 607 22 0 679 Peak-Hour Factor, PHF 1.00 0.94 0.59 1.00 0.89 1.00 Hourly Flow Rate, HFR (veh/h)
0 645 37 0 762 0
Percent Heavy Vehicles 0 -- -- 2 -- -- Median Type Undivided RT Channelized 0 0 Lanes 0 1 0 0 2 0 Configuration TR LT T Upstream Signal 0 1 Minor Street Eastbound Westbound Movement 7 8 9 10 11 12
L T R L T RVolume (veh/h) 12 0 3 Peak-Hour Factor, PHF 1.00 1.00 1.00 0.42 1.00 0.30 Hourly Flow Rate, HFR (veh/h) 0 0 0 28 0 9
Percent Heavy Vehicles 0 0 0 2 0 2 Percent Grade (%) 0 0 Flared Approach N N Storage 0 0 RT Channelized 0 0 Lanes 0 0 0 0 1 0 Configuration LTR Delay, Queue Length, and Level of ServiceApproach Northbound Southbound Westbound Eastbound
Movement 1 4 7 8 9 10 11 12
Lane Configuration LT LTR v (veh/h) 0 37 C (m) (veh/h) 907 297 v/c 0.00 0.12 95% queue length 0.00 0.42 Control Delay (s/veh) 9.0 18.8 LOS A C Approach Delay (s/veh) -- -- 18.8 Approach LOS -- -- C
Copyright © 2010 University of Florida, All Rights Reserved HCS+TM Version 5.6 Generated: 7/31/2015 11:42 AM
Page 1 of 1Two-Way Stop Control
7/31/2015file://C:\Users\asells\AppData\Local\Temp\u2kE1F9.tmp

TWO-WAY STOP CONTROL SUMMARY
General Information Site Information Analyst A SELLS Agency/Co. Date Performed 12/3/2014 Analysis Time Period No Build PM
Intersection Jurisdiction Analysis Year 2030
Project Description East/West Street: Kramer Street North/South Street: Jefferson Road Intersection Orientation: North-South Study Period (hrs): 0.25
Vehicle Volumes and Adjustments Major Street Northbound Southbound Movement 1 2 3 4 5 6 L T R L T RVolume (veh/h) 5 1106 1042 5 Peak-Hour Factor, PHF 0.50 0.85 1.00 1.00 0.94 0.75 Hourly Flow Rate, HFR (veh/h)
10 1301 0 0 1108 6
Percent Heavy Vehicles 6 -- -- 0 -- -- Median Type Undivided RT Channelized 0 0 Lanes 0 1 0 0 1 0 Configuration LT TR Upstream Signal 1 0 Minor Street Eastbound Westbound Movement 7 8 9 10 11 12
L T R L T RVolume (veh/h) 5 0 5 Peak-Hour Factor, PHF 0.75 1.00 0.33 0.80 1.00 0.85 Hourly Flow Rate, HFR (veh/h) 6 0 15 0 0 0
Percent Heavy Vehicles 100 0 100 3 0 0 Percent Grade (%) 0 0 Flared Approach N N Storage 0 0 RT Channelized 0 0 Lanes 0 1 0 0 0 0 Configuration LTR Delay, Queue Length, and Level of ServiceApproach Northbound Southbound Westbound Eastbound
Movement 1 4 7 8 9 10 11 12
Lane Configuration LT LTR v (veh/h) 10 21 C (m) (veh/h) 612 47 v/c 0.02 0.45 95% queue length 0.05 1.62 Control Delay (s/veh) 11.0 132.9 LOS B F Approach Delay (s/veh) -- -- 132.9 Approach LOS -- -- F
Copyright © 2010 University of Florida, All Rights Reserved HCS+TM Version 5.6 Generated: 7/31/2015 11:30 AM
Page 1 of 1Two-Way Stop Control
7/31/2015file://C:\Users\asells\AppData\Local\Temp\u2k22FE.tmp

TWO-WAY STOP CONTROL SUMMARY
General Information Site Information Analyst A SELLS Agency/Co. Date Performed 7/22/2015 Analysis Time Period No Build PM
Intersection Jurisdiction Analysis Year 2030
Project Description East/West Street: US 119 North/South Street: Jefferson Road Intersection Orientation: North-South Study Period (hrs): 0.25
Vehicle Volumes and Adjustments Major Street Northbound Southbound Movement 1 2 3 4 5 6 L T R L T RVolume (veh/h) 39 876 330 Peak-Hour Factor, PHF 0.60 0.89 1.00 1.00 0.83 1.00 Hourly Flow Rate, HFR (veh/h)
64 984 0 0 397 0
Percent Heavy Vehicles 4 -- -- 0 -- -- Median Type Undivided RT Channelized 0 0 Lanes 1 1 0 0 1 0 Configuration L T T Upstream Signal 0 1 Minor Street Eastbound Westbound Movement 7 8 9 10 11 12
L T R L T RVolume (veh/h) 79 166 Peak-Hour Factor, PHF 1.00 1.00 1.00 0.69 1.00 0.78 Hourly Flow Rate, HFR (veh/h) 0 0 0 114 0 212
Percent Heavy Vehicles 0 0 0 5 0 0 Percent Grade (%) 0 0 Flared Approach N N Storage 0 0 RT Channelized 0 0 Lanes 0 0 0 1 0 1 Configuration L R Delay, Queue Length, and Level of ServiceApproach Northbound Southbound Westbound Eastbound
Movement 1 4 7 8 9 10 11 12
Lane Configuration L L R v (veh/h) 64 114 212 C (m) (veh/h) 1159 101 304 v/c 0.06 1.13 0.70 95% queue length 0.18 7.40 4.86 Control Delay (s/veh) 8.3 207.2 40.1 LOS A F E Approach Delay (s/veh) -- -- 98.6 Approach LOS -- -- F
Copyright © 2010 University of Florida, All Rights Reserved HCS+TM Version 5.6 Generated: 7/27/2015 2:26 PM
Page 1 of 1Two-Way Stop Control
7/27/2015file://C:\Users\asells\AppData\Local\Temp\u2kF491.tmp

No Build PM PeakSignalized

HCS 2010 Signalized Intersection Results Summary
General Information Intersection Information
Agency Duration, h 0.25
Analyst A SELLS Analysis Date Jul 22, 2015 Area Type Other
Jurisdiction Time Period No Build PM PHF 0.91
Urban Street MacCorkle Avenue Analysis Year 2030 Analysis Period 1> 4:30
Intersection MacCorkle Ave & Kenna … File Name No Build PM - MacCorkle.xus
Project Description
Demand Information EB WB NB SB
Approach Movement L T R L T R L T R L T R
Demand ( v ), veh/h 12 1500 20 59 2122 15 5 10 47 16 0 0
Signal Information
GreenYellowRed
2.9 4.9 94.4 7.8 0.0 0.03.0 0.0 4.0 4.0 0.0 0.01.0 0.0 2.0 1.0 0.0 0.0
1 2 3
5 6 7 8
Cycle, s 125.0 Reference Phase 2
Offset, s 0 Reference Point End
Uncoordinated No Simult. Gap E/W On
Force Mode Fixed Simult. Gap N/S On
Timer Results EBL EBT WBL WBT NBL NBT SBL SBT
Assigned Phase 1 6 5 2 4 8
Case Number 2.0 4.0 2.0 3.0 8.0 7.0
Phase Duration, s 6.9 100.4 11.8 105.3 12.8 12.8
Change Period, (Y+Rc), s 4.0 6.0 5.0 6.0 5.0 5.0
Max Allow Headway (MAH), s 3.1 0.0 3.1 0.0 3.2 3.2
Queue Clearance Time (gs), s 2.9 6.0 3.8 3.5
Green Extension Time (ge), s 0.0 0.0 0.1 0.0 0.0 0.0
Phase Call Probability 0.37 0.86 0.77 0.77
Max Out Probability 0.00 0.00 0.00 0.00
Movement Group Results EB WB NB SB
Approach Movement L T R L T R L T R L T R
Assigned Movement 1 6 16 5 2 12 7 4 14 3 8 18
Adjusted Flow Rate (v), veh/h 13 1116 554 56 2002 14 25 18 0
Adjusted Saturation Flow Rate (s), veh/h/ln 1727 1814 1801 1727 1693 1537 1658 1387 1537
Queue Service Time (gs), s 0.9 0.0 0.0 4.0 29.7 0.2 0.0 0.0 0.0
Cycle Queue Clearance Time (gc), s 0.9 0.0 0.0 4.0 29.7 0.2 1.8 1.5 0.0
Green Ratio (g/C) 0.02 0.76 0.76 0.05 0.79 0.79 0.06 0.06 0.06
Capacity (c), veh/h 41 2740 1360 94 2690 1221 138 144 95
Volume-to-Capacity Ratio (X) 0.323 0.407 0.407 0.590 0.744 0.012 0.183 0.122 0.000
Available Capacity (ca), veh/h 321 2740 1360 307 2690 1221 296 279 246
Back of Queue (Q), veh/ln (95th percentile) 0.8 0.3 0.6 3.3 8.2 0.1 1.4 1.0 0.0
Queue Storage Ratio (RQ) (95th percentile) 0.09 0.00 0.00 0.00 0.00 0.01 0.00 0.00 0.00
Uniform Delay (d1), s/veh 59.6 0.0 0.0 60.3 4.1 1.8 55.8 55.7 0.0
Incremental Delay (d2), s/veh 1.7 0.5 0.9 1.4 1.3 0.0 0.2 0.1 0.0
Initial Queue Delay (d3), s/veh 0.0 0.0 0.0 0.0 0.0 0.0 0.0 0.0 0.0
Control Delay (d), s/veh 61.2 0.5 0.9 61.7 5.3 1.8 56.0 55.8 0.0
Level of Service (LOS) E A A E A A E E
Approach Delay, s/veh / LOS 1.1 A 6.8 A 56.0 E 55.8 E
Intersection Delay, s/veh / LOS 4.8 A
Multimodal Results EB WB NB SB
Pedestrian LOS Score / LOS 2.1 B 2.2 B 3.3 C 3.0 C
Bicycle LOS Score / LOS 1.4 A 2.5 B 0.5 A 0.5 A
Copyright © 2015 University of Florida, All Rights Reserved. HCS 2010™ Streets Version 6.70 Generated: 7/27/2015 2:04:05 PM
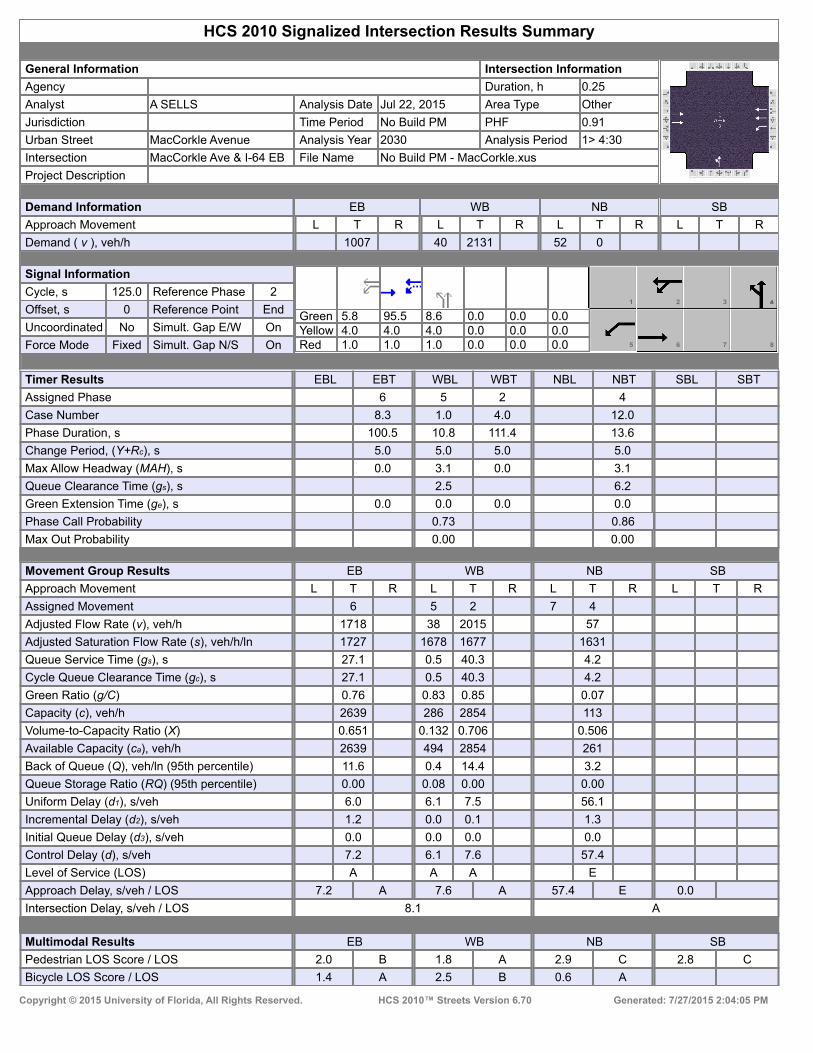
HCS 2010 Signalized Intersection Results Summary
General Information Intersection Information
Agency Duration, h 0.25
Analyst A SELLS Analysis Date Jul 22, 2015 Area Type Other
Jurisdiction Time Period No Build PM PHF 0.91
Urban Street MacCorkle Avenue Analysis Year 2030 Analysis Period 1> 4:30
Intersection MacCorkle Ave & I-64 EB File Name No Build PM - MacCorkle.xus
Project Description
Demand Information EB WB NB SB
Approach Movement L T R L T R L T R L T R
Demand ( v ), veh/h 1007 40 2131 52 0
Signal Information
GreenYellowRed
5.8 95.5 8.6 0.0 0.0 0.04.0 4.0 4.0 0.0 0.0 0.01.0 1.0 1.0 0.0 0.0 0.0
1 2 3
5 6 7 8
Cycle, s 125.0 Reference Phase 2
Offset, s 0 Reference Point End
Uncoordinated No Simult. Gap E/W On
Force Mode Fixed Simult. Gap N/S On
Timer Results EBL EBT WBL WBT NBL NBT SBL SBT
Assigned Phase 6 5 2 4
Case Number 8.3 1.0 4.0 12.0
Phase Duration, s 100.5 10.8 111.4 13.6
Change Period, (Y+Rc), s 5.0 5.0 5.0 5.0
Max Allow Headway (MAH), s 0.0 3.1 0.0 3.1
Queue Clearance Time (gs), s 2.5 6.2
Green Extension Time (ge), s 0.0 0.0 0.0 0.0
Phase Call Probability 0.73 0.86
Max Out Probability 0.00 0.00
Movement Group Results EB WB NB SB
Approach Movement L T R L T R L T R L T R
Assigned Movement 6 5 2 7 4
Adjusted Flow Rate (v), veh/h 1718 38 2015 57
Adjusted Saturation Flow Rate (s), veh/h/ln 1727 1678 1677 1631
Queue Service Time (gs), s 27.1 0.5 40.3 4.2
Cycle Queue Clearance Time (gc), s 27.1 0.5 40.3 4.2
Green Ratio (g/C) 0.76 0.83 0.85 0.07
Capacity (c), veh/h 2639 286 2854 113
Volume-to-Capacity Ratio (X) 0.651 0.132 0.706 0.506
Available Capacity (ca), veh/h 2639 494 2854 261
Back of Queue (Q), veh/ln (95th percentile) 11.6 0.4 14.4 3.2
Queue Storage Ratio (RQ) (95th percentile) 0.00 0.08 0.00 0.00
Uniform Delay (d1), s/veh 6.0 6.1 7.5 56.1
Incremental Delay (d2), s/veh 1.2 0.0 0.1 1.3
Initial Queue Delay (d3), s/veh 0.0 0.0 0.0 0.0
Control Delay (d), s/veh 7.2 6.1 7.6 57.4
Level of Service (LOS) A A A E
Approach Delay, s/veh / LOS 7.2 A 7.6 A 57.4 E 0.0
Intersection Delay, s/veh / LOS 8.1 A
Multimodal Results EB WB NB SB
Pedestrian LOS Score / LOS 2.0 B 1.8 A 2.9 C 2.8 C
Bicycle LOS Score / LOS 1.4 A 2.5 B 0.6 A
Copyright © 2015 University of Florida, All Rights Reserved. HCS 2010™ Streets Version 6.70 Generated: 7/27/2015 2:04:05 PM
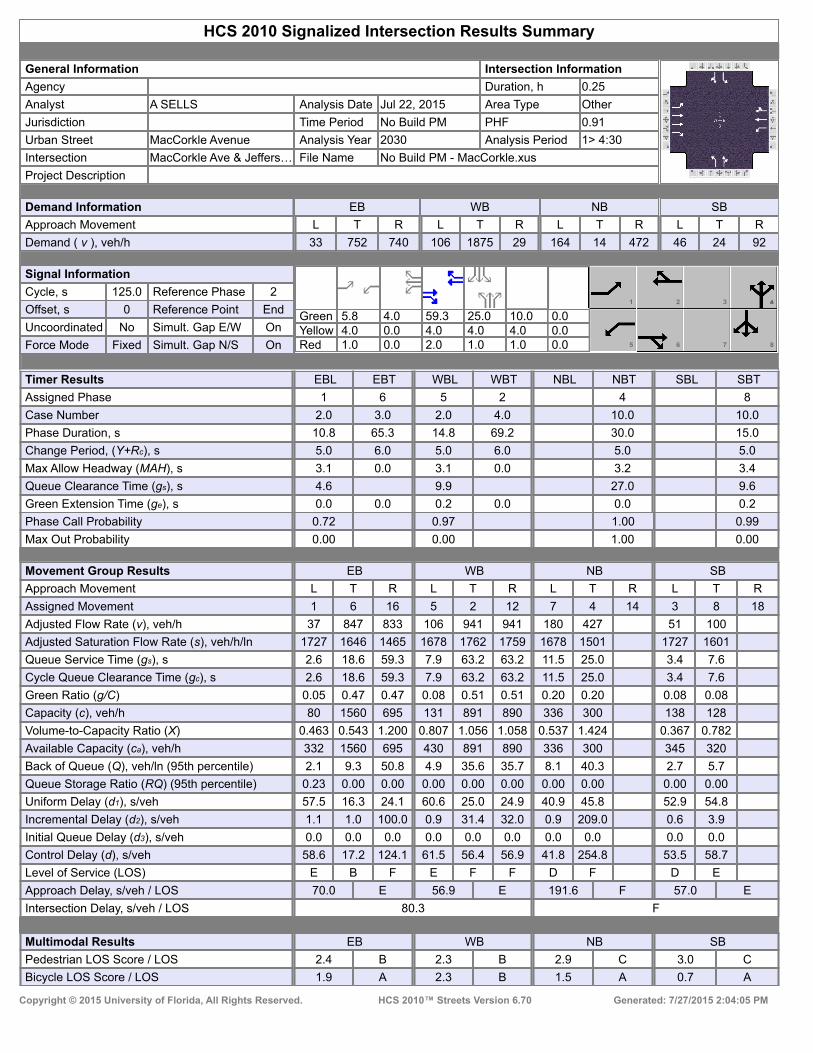
HCS 2010 Signalized Intersection Results Summary
General Information Intersection Information
Agency Duration, h 0.25
Analyst A SELLS Analysis Date Jul 22, 2015 Area Type Other
Jurisdiction Time Period No Build PM PHF 0.91
Urban Street MacCorkle Avenue Analysis Year 2030 Analysis Period 1> 4:30
Intersection MacCorkle Ave & Jeffers… File Name No Build PM - MacCorkle.xus
Project Description
Demand Information EB WB NB SB
Approach Movement L T R L T R L T R L T R
Demand ( v ), veh/h 33 752 740 106 1875 29 164 14 472 46 24 92
Signal Information
GreenYellowRed
5.8 4.0 59.3 25.0 10.0 0.04.0 0.0 4.0 4.0 4.0 0.01.0 0.0 2.0 1.0 1.0 0.0
1 2 3
5 6 7 8
Cycle, s 125.0 Reference Phase 2
Offset, s 0 Reference Point End
Uncoordinated No Simult. Gap E/W On
Force Mode Fixed Simult. Gap N/S On
Timer Results EBL EBT WBL WBT NBL NBT SBL SBT
Assigned Phase 1 6 5 2 4 8
Case Number 2.0 3.0 2.0 4.0 10.0 10.0
Phase Duration, s 10.8 65.3 14.8 69.2 30.0 15.0
Change Period, (Y+Rc), s 5.0 6.0 5.0 6.0 5.0 5.0
Max Allow Headway (MAH), s 3.1 0.0 3.1 0.0 3.2 3.4
Queue Clearance Time (gs), s 4.6 9.9 27.0 9.6
Green Extension Time (ge), s 0.0 0.0 0.2 0.0 0.0 0.2
Phase Call Probability 0.72 0.97 1.00 0.99
Max Out Probability 0.00 0.00 1.00 0.00
Movement Group Results EB WB NB SB
Approach Movement L T R L T R L T R L T R
Assigned Movement 1 6 16 5 2 12 7 4 14 3 8 18
Adjusted Flow Rate (v), veh/h 37 847 833 106 941 941 180 427 51 100
Adjusted Saturation Flow Rate (s), veh/h/ln 1727 1646 1465 1678 1762 1759 1678 1501 1727 1601
Queue Service Time (gs), s 2.6 18.6 59.3 7.9 63.2 63.2 11.5 25.0 3.4 7.6
Cycle Queue Clearance Time (gc), s 2.6 18.6 59.3 7.9 63.2 63.2 11.5 25.0 3.4 7.6
Green Ratio (g/C) 0.05 0.47 0.47 0.08 0.51 0.51 0.20 0.20 0.08 0.08
Capacity (c), veh/h 80 1560 695 131 891 890 336 300 138 128
Volume-to-Capacity Ratio (X) 0.463 0.543 1.200 0.807 1.056 1.058 0.537 1.424 0.367 0.782
Available Capacity (ca), veh/h 332 1560 695 430 891 890 336 300 345 320
Back of Queue (Q), veh/ln (95th percentile) 2.1 9.3 50.8 4.9 35.6 35.7 8.1 40.3 2.7 5.7
Queue Storage Ratio (RQ) (95th percentile) 0.23 0.00 0.00 0.00 0.00 0.00 0.00 0.00 0.00 0.00
Uniform Delay (d1), s/veh 57.5 16.3 24.1 60.6 25.0 24.9 40.9 45.8 52.9 54.8
Incremental Delay (d2), s/veh 1.1 1.0 100.0 0.9 31.4 32.0 0.9 209.0 0.6 3.9
Initial Queue Delay (d3), s/veh 0.0 0.0 0.0 0.0 0.0 0.0 0.0 0.0 0.0 0.0
Control Delay (d), s/veh 58.6 17.2 124.1 61.5 56.4 56.9 41.8 254.8 53.5 58.7
Level of Service (LOS) E B F E F F D F D E
Approach Delay, s/veh / LOS 70.0 E 56.9 E 191.6 F 57.0 E
Intersection Delay, s/veh / LOS 80.3 F
Multimodal Results EB WB NB SB
Pedestrian LOS Score / LOS 2.4 B 2.3 B 2.9 C 3.0 C
Bicycle LOS Score / LOS 1.9 A 2.3 B 1.5 A 0.7 A
Copyright © 2015 University of Florida, All Rights Reserved. HCS 2010™ Streets Version 6.70 Generated: 7/27/2015 2:04:05 PM

HCS 2010 Signalized Intersection Results Summary
General Information Intersection Information
Agency Duration, h 0.25
Analyst A SELLS Analysis Date Jul 22, 2015 Area Type Other
Jurisdiction Time Period No Build PM PHF 0.92
Urban Street MacCorkle Avenue Analysis Year 2030 Analysis Period 1> 4:30
Intersection MacCorkle Ave & I-64 WB File Name No Build PM - MacCorkle.xus
Project Description
Demand Information EB WB NB SB
Approach Movement L T R L T R L T R L T R
Demand ( v ), veh/h 707 563 193 1311 699 0
Signal Information
GreenYellowRed
10.9 55.1 44.0 0.0 0.0 0.04.0 4.0 4.0 0.0 0.0 0.01.0 1.0 1.0 0.0 0.0 0.0
1 2 3
5 6 7 8
Cycle, s 125.0 Reference Phase 2
Offset, s 0 Reference Point End
Uncoordinated No Simult. Gap E/W On
Force Mode Fixed Simult. Gap N/S On
Timer Results EBL EBT WBL WBT NBL NBT SBL SBT
Assigned Phase 6 5 2 4
Case Number 7.3 1.0 4.0 10.0
Phase Duration, s 60.1 15.9 76.0 49.0
Change Period, (Y+Rc), s 5.0 5.0 5.0 5.0
Max Allow Headway (MAH), s 0.0 3.1 0.0 3.1
Queue Clearance Time (gs), s 10.6 46.0
Green Extension Time (ge), s 0.0 0.3 0.0 0.0
Phase Call Probability 1.00 1.00
Max Out Probability 0.00 1.00
Movement Group Results EB WB NB SB
Approach Movement L T R L T R L T R L T R
Assigned Movement 6 16 5 2 7 4
Adjusted Flow Rate (v), veh/h 718 511 210 1425 760 0
Adjusted Saturation Flow Rate (s), veh/h/ln 1646 1465 1631 1631 1662 1850
Queue Service Time (gs), s 18.8 29.8 8.6 31.7 44.0 0.0
Cycle Queue Clearance Time (gc), s 18.8 29.8 8.6 31.7 44.0 0.0
Green Ratio (g/C) 0.44 0.44 0.54 0.57 0.35 0.35
Capacity (c), veh/h 1452 646 399 1853 585 651
Volume-to-Capacity Ratio (X) 0.494 0.790 0.525 0.769 1.299 0.000
Available Capacity (ca), veh/h 1452 646 584 1853 585 651
Back of Queue (Q), veh/ln (95th percentile) 10.1 10.0 5.3 12.1 60.5 0.0
Queue Storage Ratio (RQ) (95th percentile) 0.00 0.00 0.00 0.00 3.41 0.00
Uniform Delay (d1), s/veh 23.5 15.6 16.9 10.4 40.5 0.0
Incremental Delay (d2), s/veh 0.6 4.8 0.4 3.1 146.6 0.0
Initial Queue Delay (d3), s/veh 0.0 0.0 0.0 0.0 0.0 0.0
Control Delay (d), s/veh 24.1 20.4 17.3 13.5 187.1 0.0
Level of Service (LOS) C C B B F
Approach Delay, s/veh / LOS 22.6 C 14.0 B 187.1 F 0.0
Intersection Delay, s/veh / LOS 53.2 D
Multimodal Results EB WB NB SB
Pedestrian LOS Score / LOS 2.3 B 1.9 A 2.9 C 3.0 C
Bicycle LOS Score / LOS 1.6 A 1.8 A 1.7 A
Copyright © 2015 University of Florida, All Rights Reserved. HCS 2010™ Streets Version 6.70 Generated: 7/27/2015 2:04:05 PM

HCS 2010 Signalized Intersection Results Summary
General Information Intersection Information
Agency Duration, h 0.25
Analyst A SELLS Analysis Date Jul 22, 2015 Area Type Other
Jurisdiction Time Period No Build PM PHF 0.91
Urban Street Jefferson Road Analysis Year 2030 Analysis Period 1> 4:30
Intersection Jefferson Rd & Kanawh… File Name No Build PM - Kanawha.xus
Project Description
Demand Information EB WB NB SB
Approach Movement L T R L T R L T R L T R
Demand ( v ), veh/h 617 691 415 620 803 0
Signal Information
GreenYellowRed
76.9 7.3 36.8 0.0 0.0 0.04.0 4.0 4.0 0.0 0.0 0.01.0 1.0 1.0 0.0 0.0 0.0
1 2 3 4
5 6 7
Cycle, s 136.0 Reference Phase 2
Offset, s 0 Reference Point End
Uncoordinated No Simult. Gap E/W On
Force Mode Fixed Simult. Gap N/S On
Timer Results EBL EBT WBL WBT NBL NBT SBL SBT
Assigned Phase 2 1 6 8
Case Number 7.3 1.0 4.0 10.0
Phase Duration, s 81.9 12.3 94.2 41.8
Change Period, (Y+Rc), s 5.0 5.0 5.0 5.0
Max Allow Headway (MAH), s 0.0 3.1 0.0 3.1
Queue Clearance Time (gs), s 6.4 38.9
Green Extension Time (ge), s 0.0 0.8 0.0 0.0
Phase Call Probability 1.00 1.00
Max Out Probability 0.17 1.00
Movement Group Results EB WB NB SB
Approach Movement L T R L T R L T R L T R
Assigned Movement 2 12 1 6 3 8
Adjusted Flow Rate (v), veh/h 459 361 456 681 882 0
Adjusted Saturation Flow Rate (s), veh/h/ln 1796 1537 1711 1710 1631 1814
Queue Service Time (gs), s 25.3 18.9 4.4 4.7 36.9 0.0
Cycle Queue Clearance Time (gc), s 25.3 18.9 4.4 4.7 36.9 0.0
Green Ratio (g/C) 0.57 0.57 0.60 0.66 0.27 0.27
Capacity (c), veh/h 1014 868 479 2240 443 492
Volume-to-Capacity Ratio (X) 0.452 0.416 0.952 0.304 1.992 0.000
Available Capacity (ca), veh/h 1014 868 576 2240 443 492
Back of Queue (Q), veh/ln (95th percentile) 13.0 8.1 24.4 2.5 111.2 0.0
Queue Storage Ratio (RQ) (95th percentile) 0.00 0.00 0.00 0.00 6.57 0.00
Uniform Delay (d1), s/veh 25.1 17.9 41.8 3.3 49.5 0.0
Incremental Delay (d2), s/veh 0.1 0.1 22.5 0.4 454.6 0.0
Initial Queue Delay (d3), s/veh 0.0 0.0 0.0 0.0 0.0 0.0
Control Delay (d), s/veh 25.2 18.0 64.3 3.6 504.1 0.0
Level of Service (LOS) C B E A F
Approach Delay, s/veh / LOS 22.1 C 27.9 C 504.1 F 0.0
Intersection Delay, s/veh / LOS 174.2 F
Multimodal Results EB WB NB SB
Pedestrian LOS Score / LOS 2.3 B 1.9 A 2.5 B 3.0 C
Bicycle LOS Score / LOS 2.5 B 1.4 A 1.9 A
Copyright © 2015 University of Florida, All Rights Reserved. HCS 2010™ Streets Version 6.70 Generated: 7/27/2015 2:10:18 PM

HCS 2010 Signalized Intersection Results Summary
General Information Intersection Information
Agency Duration, h 0.25
Analyst A SELLS Analysis Date Jul 22, 2015 Area Type Other
Jurisdiction Time Period No Build PM PHF 0.91
Urban Street Jefferson Road Analysis Year 2030 Analysis Period 1> 4:30
Intersection Jefferson Rd & Kanawh… File Name No Build PM - Kanawha.xus
Project Description
Demand Information EB WB NB SB
Approach Movement L T R L T R L T R L T R
Demand ( v ), veh/h 617 691 415 620 803 0 223
Signal Information
GreenYellowRed
76.9 7.3 36.8 0.0 0.0 0.04.0 4.0 4.0 0.0 0.0 0.01.0 1.0 1.0 0.0 0.0 0.0
1 2 3 4
5 6 7
Cycle, s 136.0 Reference Phase 2
Offset, s 0 Reference Point End
Uncoordinated No Simult. Gap E/W On
Force Mode Fixed Simult. Gap N/S On
Timer Results EBL EBT WBL WBT NBL NBT SBL SBT
Assigned Phase 2 1 6 8
Case Number 7.3 1.0 4.0 9.0
Phase Duration, s 81.9 12.3 94.2 41.8
Change Period, (Y+Rc), s 5.0 5.0 5.0 5.0
Max Allow Headway (MAH), s 0.0 3.1 0.0 3.1
Queue Clearance Time (gs), s 6.4 38.9
Green Extension Time (ge), s 0.0 0.8 0.0 0.0
Phase Call Probability 1.00 1.00
Max Out Probability 0.17 1.00
Movement Group Results EB WB NB SB
Approach Movement L T R L T R L T R L T R
Assigned Movement 2 12 1 6 3 8 18
Adjusted Flow Rate (v), veh/h 459 361 456 681 882 0 115
Adjusted Saturation Flow Rate (s), veh/h/ln 1796 1537 1711 1710 1631 1814 1537
Queue Service Time (gs), s 25.3 18.9 4.4 4.7 36.9 0.0 8.0
Cycle Queue Clearance Time (gc), s 25.3 18.9 4.4 4.7 36.9 0.0 8.0
Green Ratio (g/C) 0.57 0.57 0.60 0.66 0.27 0.27 0.27
Capacity (c), veh/h 1015 868 479 2240 443 492 417
Volume-to-Capacity Ratio (X) 0.452 0.416 0.952 0.304 1.993 0.000 0.277
Available Capacity (ca), veh/h 1015 868 576 2240 443 492 417
Back of Queue (Q), veh/ln (95th percentile) 13.0 8.1 24.4 2.5 111.2 0.0 5.5
Queue Storage Ratio (RQ) (95th percentile) 0.00 0.00 0.00 0.00 6.57 0.00 0.00
Uniform Delay (d1), s/veh 25.1 17.9 41.8 3.3 49.5 0.0 39.0
Incremental Delay (d2), s/veh 0.1 0.1 22.4 0.4 455.0 0.0 0.1
Initial Queue Delay (d3), s/veh 0.0 0.0 0.0 0.0 0.0 0.0 0.0
Control Delay (d), s/veh 25.2 18.0 64.2 3.6 504.6 0.0 39.2
Level of Service (LOS) C B E A F D
Approach Delay, s/veh / LOS 22.1 C 27.9 C 450.8 F 0.0
Intersection Delay, s/veh / LOS 169.0 F
Multimodal Results EB WB NB SB
Pedestrian LOS Score / LOS 2.6 B 1.9 A 2.5 B 3.0 C
Bicycle LOS Score / LOS 2.5 B 1.4 A 2.1 B
Copyright © 2015 University of Florida, All Rights Reserved. HCS 2010™ Streets Version 6.70 Generated: 7/31/2015 11:19:08 AM

HCS 2010 Signalized Intersection Results Summary
General Information Intersection Information
Agency Duration, h 0.25
Analyst A SELLS Analysis Date Jul 22, 2015 Area Type Other
Jurisdiction Time Period No Build PM PHF 0.92
Urban Street Jefferson Road Analysis Year 2030 Analysis Period 1> 4:30
Intersection Jefferson Rd & Oakhurs… File Name No Build PM - US 119 & Oakhurst.xus
Project Description
Demand Information EB WB NB SB
Approach Movement L T R L T R L T R L T R
Demand ( v ), veh/h 790 32 125 55 153 256
Signal Information
GreenYellowRed
13.5 37.5 55.5 0.0 0.0 0.04.0 4.0 4.0 0.0 0.0 0.00.5 0.5 0.5 0.0 0.0 0.0
1 3 4
5 6 7 8
Cycle, s 120.0 Reference Phase 2
Offset, s 0 Reference Point Begin
Uncoordinated No Simult. Gap E/W On
Force Mode Fixed Simult. Gap N/S On
Timer Results EBL EBT WBL WBT NBL NBT SBL SBT
Assigned Phase 4 2 1 6
Case Number 9.0 7.3 2.0 4.0
Phase Duration, s 60.0 42.0 18.0 60.0
Change Period, (Y+Rc), s 4.5 4.5 4.5 4.5
Max Allow Headway (MAH), s 3.1 0.0 3.1 0.0
Queue Clearance Time (gs), s 57.5 13.5
Green Extension Time (ge), s 0.0 0.0 0.1 0.0
Phase Call Probability 1.00 1.00
Max Out Probability 1.00 1.00
Movement Group Results EB WB NB SB
Approach Movement L T R L T R L T R L T R
Assigned Movement 7 14 2 12 1 6
Adjusted Flow Rate (v), veh/h 859 33 136 36 166 278
Adjusted Saturation Flow Rate (s), veh/h/ln 1694 1507 1796 1568 1711 1796
Queue Service Time (gs), s 55.5 1.4 6.7 1.9 11.5 11.8
Cycle Queue Clearance Time (gc), s 55.5 1.4 6.7 1.9 11.5 11.8
Green Ratio (g/C) 0.46 0.46 0.31 0.31 0.11 0.46
Capacity (c), veh/h 784 697 562 490 192 831
Volume-to-Capacity Ratio (X) 1.096 0.047 0.242 0.073 0.866 0.335
Available Capacity (ca), veh/h 784 697 562 490 221 831
Back of Queue (Q), veh/ln (95th percentile) 47.4 0.9 5.5 1.4 10.1 8.7
Queue Storage Ratio (RQ) (95th percentile) 0.00 0.05 0.00 0.00 1.21 0.00
Uniform Delay (d1), s/veh 32.3 17.7 30.7 29.0 52.4 20.5
Incremental Delay (d2), s/veh 61.6 0.0 1.0 0.3 23.7 1.1
Initial Queue Delay (d3), s/veh 0.0 0.0 0.0 0.0 0.0 0.0
Control Delay (d), s/veh 93.8 17.7 31.7 29.3 76.1 21.6
Level of Service (LOS) F B C C E C
Approach Delay, s/veh / LOS 91.0 F 0.0 31.2 C 42.0 D
Intersection Delay, s/veh / LOS 69.7 E
Multimodal Results EB WB NB SB
Pedestrian LOS Score / LOS 2.4 B 2.3 B 1.9 A 1.7 A
Bicycle LOS Score / LOS F 0.8 A 1.2 A
Copyright © 2015 University of Florida, All Rights Reserved. HCS 2010™ Streets Version 6.70 Generated: 7/27/2015 2:22:12 PM

Alt 1 Phase 2 RHL AM Peak Unsignalized

TWO-WAY STOP CONTROL SUMMARY
General Information Site Information Analyst ASELLS Agency/Co. STANTEC Date Performed 11/25/2014 Analysis Time Period Alt 1 Phase 2 RHL AM
IntersectionJurisdictionAnalysis Year 2030
Project Description East/West Street: Bob Evans entrance North/South Street: Jefferson Road Intersection Orientation: North-South Study Period (hrs): 0.25
Vehicle Volumes and Adjustments Major Street Northbound Southbound Movement 1 2 3 4 5 6
L T R L T RVolume (veh/h) 5 438 768 25 Peak-Hour Factor, PHF 0.45 0.87 1.00 1.00 0.86 0.63 Hourly Flow Rate, HFR (veh/h)
11 503 0 0 893 39
Percent Heavy Vehicles 2 -- -- 0 -- -- Median Type Undivided RT Channelized 0 0 Lanes 0 2 0 0 2 0 Configuration LT T T TR Upstream Signal 1 0 Minor Street Eastbound Westbound Movement 7 8 9 10 11 12
L T R L T RVolume (veh/h) 10 10 Peak-Hour Factor, PHF 0.90 1.00 0.69 1.00 1.00 1.00 Hourly Flow Rate, HFR (veh/h) 11 0 14 0 0 0
Percent Heavy Vehicles 2 0 2 0 0 0 Percent Grade (%) 0 0 Flared Approach N N Storage 0 0 RT Channelized 0 0 Lanes 1 0 1 0 0 0 Configuration L R Delay, Queue Length, and Level of ServiceApproach Northbound Southbound Westbound Eastbound
Movement 1 4 7 8 9 10 11 12
Lane Configuration LT L R v (veh/h) 11 11 14 C (m) (veh/h) 728 187 594 v/c 0.02 0.06 0.02 95% queue length 0.05 0.19 0.07 Control Delay (s/veh) 10.0 25.5 11.2 LOS B D B Approach Delay (s/veh) -- -- 17.5 Approach LOS -- -- C
Copyright © 2010 University of Florida, All Rights Reserved HCS+TM Version 5.6 Generated: 4/16/2015 3:54 PM
Page 1 of 1Two-Way Stop Control
4/16/2015file://C:\Users\asells\AppData\Local\Temp\u2k7FA2.tmp

TWO-WAY STOP CONTROL SUMMARY
General Information Site Information Analyst ASELLS Agency/Co. STANTEC Date Performed 11/25/2014 Analysis Time Period Alt 1 Phase 2 RHL AM
Intersection Jurisdiction Analysis Year 2030
Project Description East/West Street: McDonalds entrance North/South Street: Jefferson Road Intersection Orientation: North-South Study Period (hrs): 0.25
Vehicle Volumes and Adjustments Major Street Northbound Southbound Movement 1 2 3 4 5 6 L T R L T RVolume (veh/h) 30 438 768 85 Peak-Hour Factor, PHF 0.83 0.87 1.00 1.00 0.88 0.83 Hourly Flow Rate, HFR (veh/h)
36 503 0 0 872 102
Percent Heavy Vehicles 2 -- -- 0 -- -- Median Type Undivided RT Channelized 0 0 Lanes 0 2 0 0 2 0 Configuration LT T T TR Upstream Signal 0 0 Minor Street Eastbound Westbound Movement 7 8 9 10 11 12
L T R L T RVolume (veh/h) 5 5 Peak-Hour Factor, PHF 0.50 1.00 0.25 1.00 1.00 1.00 Hourly Flow Rate, HFR (veh/h) 10 0 20 0 0 0
Percent Heavy Vehicles 2 0 2 0 0 0 Percent Grade (%) 0 0 Flared Approach N N Storage 0 0 RT Channelized 0 0 Lanes 1 0 1 0 0 0 Configuration L R Delay, Queue Length, and Level of ServiceApproach Northbound Southbound Westbound Eastbound
Movement 1 4 7 8 9 10 11 12
Lane Configuration LT L R v (veh/h) 36 10 20 C (m) (veh/h) 702 157 578 v/c 0.05 0.06 0.03 95% queue length 0.16 0.20 0.11 Control Delay (s/veh) 10.4 29.5 11.5 LOS B D B Approach Delay (s/veh) -- -- 17.5 Approach LOS -- -- C
Copyright © 2010 University of Florida, All Rights Reserved HCS+TM Version 5.6 Generated: 4/16/2015 3:56 PM
Page 1 of 1Two-Way Stop Control
4/16/2015file://C:\Users\asells\AppData\Local\Temp\u2kB311.tmp

TWO-WAY STOP CONTROL SUMMARY
General Information Site Information Analyst ASELLS Agency/Co. STANTEC Date Performed 11/25/2014 Analysis Time Period Alt 1 Phase 2 RHL AM
Intersection Jurisdiction Analysis Year 2030
Project Description East/West Street: Community Center - North North/South Street: Jefferson Road Intersection Orientation: North-South Study Period (hrs): 0.25
Vehicle Volumes and Adjustments Major Street Northbound Southbound Movement 1 2 3 4 5 6 L T R L T RVolume (veh/h) 2 431 760 8 Peak-Hour Factor, PHF 0.50 0.77 1.00 1.00 0.82 0.47 Hourly Flow Rate, HFR (veh/h)
4 559 0 0 926 17
Percent Heavy Vehicles 2 -- -- 0 -- -- Median Type Undivided RT Channelized 0 0 Lanes 0 2 0 0 2 0 Configuration LT T T TR Upstream Signal 0 0 Minor Street Eastbound Westbound Movement 7 8 9 10 11 12
L T R L T RVolume (veh/h) 7 0 3 Peak-Hour Factor, PHF 0.46 1.00 0.58 1.00 1.00 1.00 Hourly Flow Rate, HFR (veh/h) 15 0 5 0 0 0
Percent Heavy Vehicles 2 0 2 0 0 0 Percent Grade (%) 0 0 Flared Approach N N Storage 0 0 RT Channelized 0 0 Lanes 0 1 0 0 0 0 Configuration LTR Delay, Queue Length, and Level of ServiceApproach Northbound Southbound Westbound Eastbound
Movement 1 4 7 8 9 10 11 12
Lane Configuration LT LTR v (veh/h) 4 20 C (m) (veh/h) 721 208 v/c 0.01 0.10 95% queue length 0.02 0.31 Control Delay (s/veh) 10.0 24.1 LOS B C Approach Delay (s/veh) -- -- 24.1 Approach LOS -- -- C
Copyright © 2010 University of Florida, All Rights Reserved HCS+TM Version 5.6 Generated: 4/16/2015 3:54 PM
Page 1 of 1Two-Way Stop Control
4/16/2015file://C:\Users\asells\AppData\Local\Temp\u2k16A3.tmp

TWO-WAY STOP CONTROL SUMMARY
General Information Site Information Analyst ASELLS Agency/Co. STANTEC Date Performed 11/25/2014 Analysis Time Period Alt 1 Phase 2 RHL AM
Intersection Jurisdiction Analysis Year 2030
Project Description East/West Street: Community Center - South North/South Street: Jefferson Road Intersection Orientation: North-South Study Period (hrs): 0.25
Vehicle Volumes and Adjustments Major Street Northbound Southbound Movement 1 2 3 4 5 6 L T R L T RVolume (veh/h) 12 429 762 1 Peak-Hour Factor, PHF 0.67 0.81 1.00 1.00 0.91 0.25 Hourly Flow Rate, HFR (veh/h)
17 529 0 0 837 4
Percent Heavy Vehicles 2 -- -- 0 -- -- Median Type Raised curb RT Channelized 0 0 Lanes 0 2 0 0 2 0 Configuration LT T T TR Upstream Signal 0 0 Minor Street Eastbound Westbound Movement 7 8 9 10 11 12
L T R L T RVolume (veh/h) 4 0 1 Peak-Hour Factor, PHF 0.33 1.00 0.71 1.00 1.00 1.00 Hourly Flow Rate, HFR (veh/h) 12 0 1 0 0 0
Percent Heavy Vehicles 2 0 2 0 0 0 Percent Grade (%) 0 0 Flared Approach N N Storage 0 0 RT Channelized 0 0 Lanes 0 1 0 0 0 0 Configuration LTR Delay, Queue Length, and Level of ServiceApproach Northbound Southbound Westbound Eastbound
Movement 1 4 7 8 9 10 11 12
Lane Configuration LT LTR v (veh/h) 17 13 C (m) (veh/h) 788 385 v/c 0.02 0.03 95% queue length 0.07 0.10 Control Delay (s/veh) 9.7 14.7 LOS A B Approach Delay (s/veh) -- -- 14.7 Approach LOS -- -- B
Copyright © 2010 University of Florida, All Rights Reserved HCS+TM Version 5.6 Generated: 4/16/2015 3:53 PM
Page 1 of 1Two-Way Stop Control
4/16/2015file://C:\Users\asells\AppData\Local\Temp\u2k796B.tmp

TWO-WAY STOP CONTROL SUMMARY
General Information Site Information Analyst A SELLS Agency/Co. STANTEC Date Performed 11/25/2014 Analysis Time Period Alt 1 Phase 2 RHL AM
Intersection Jurisdiction Analysis Year 2030
Project Description East/West Street: Washington Street North/South Street: Jefferson Road Intersection Orientation: North-South Study Period (hrs): 0.25
Vehicle Volumes and Adjustments Major Street Northbound Southbound Movement 1 2 3 4 5 6 L T R L T RVolume (veh/h) 415 1 11 752 Peak-Hour Factor, PHF 1.00 0.80 0.92 0.69 0.91 1.00 Hourly Flow Rate, HFR (veh/h)
0 518 1 15 826 0
Percent Heavy Vehicles 0 -- -- 2 -- -- Median Type Raised curb RT Channelized 0 0 Lanes 0 2 0 0 2 0 Configuration T TR LT T Upstream Signal 0 0 Minor Street Eastbound Westbound Movement 7 8 9 10 11 12
L T R L T RVolume (veh/h) 5 0 14 Peak-Hour Factor, PHF 1.00 1.00 1.00 0.73 1.00 0.85 Hourly Flow Rate, HFR (veh/h) 0 0 0 6 0 16
Percent Heavy Vehicles 0 0 0 2 0 2 Percent Grade (%) 0 0 Flared Approach N N Storage 0 0 RT Channelized 0 0 Lanes 0 0 0 0 1 0 Configuration LTR Delay, Queue Length, and Level of ServiceApproach Northbound Southbound Westbound Eastbound
Movement 1 4 7 8 9 10 11 12
Lane Configuration LT LTR v (veh/h) 15 22 C (m) (veh/h) 1031 669 v/c 0.01 0.03 95% queue length 0.04 0.10 Control Delay (s/veh) 8.5 10.6 LOS A B Approach Delay (s/veh) -- -- 10.6 Approach LOS -- -- B
Copyright © 2010 University of Florida, All Rights Reserved HCS+TM Version 5.6 Generated: 4/16/2015 3:59 PM
Page 1 of 1Two-Way Stop Control
4/16/2015file://C:\Users\asells\AppData\Local\Temp\u2k9E49.tmp

TWO-WAY STOP CONTROL SUMMARY
General Information Site Information Analyst A SELLS Agency/Co. STANTEC Date Performed 11/25/2014 Analysis Time Period Alt 1 Phase 2 RHL AM
Intersection Jurisdiction Analysis Year 2030
Project Description East/West Street: Pennslyvania Avenue North/South Street: Jefferson Road Intersection Orientation: North-South Study Period (hrs): 0.25
Vehicle Volumes and Adjustments Major Street Northbound Southbound Movement 1 2 3 4 5 6 L T R L T RVolume (veh/h) 412 2 3 641 Peak-Hour Factor, PHF 1.00 0.83 1.00 0.50 0.97 1.00 Hourly Flow Rate, HFR (veh/h)
0 496 2 6 660 0
Percent Heavy Vehicles 0 -- -- 2 -- -- Median Type Undivided RT Channelized 0 0 Lanes 0 2 0 0 2 0 Configuration T TR LT T Upstream Signal 0 1 Minor Street Eastbound Westbound Movement 7 8 9 10 11 12
L T R L T RVolume (veh/h) 3 0 4 Peak-Hour Factor, PHF 1.00 1.00 1.00 1.00 1.00 0.65 Hourly Flow Rate, HFR (veh/h) 0 0 0 3 0 6
Percent Heavy Vehicles 0 0 0 2 0 2 Percent Grade (%) 0 0 Flared Approach N N Storage 0 0 RT Channelized 0 0 Lanes 0 0 0 0 1 0 Configuration LTR Delay, Queue Length, and Level of ServiceApproach Northbound Southbound Westbound Eastbound
Movement 1 4 7 8 9 10 11 12
Lane Configuration LT LTR v (veh/h) 6 9 C (m) (veh/h) 1062 635 v/c 0.01 0.01 95% queue length 0.02 0.04 Control Delay (s/veh) 8.4 10.8 LOS A B Approach Delay (s/veh) -- -- 10.8 Approach LOS -- -- B
Copyright © 2010 University of Florida, All Rights Reserved HCS+TM Version 5.6 Generated: 4/16/2015 3:57 PM
Page 1 of 1Two-Way Stop Control
4/16/2015file://C:\Users\asells\AppData\Local\Temp\u2k23FC.tmp

TWO-WAY STOP CONTROL SUMMARY
General Information Site Information Analyst A SELLS Agency/Co. Date Performed 12/3/2014 Analysis Time Period Alt 1 Phase 2 RHL AM Peak
Intersection Jurisdiction Analysis Year 2030
Project Description East/West Street: Kramer Street North/South Street: Jefferson Road Intersection Orientation: North-South Study Period (hrs): 0.25
Vehicle Volumes and Adjustments Major Street Northbound Southbound Movement 1 2 3 4 5 6 L T R L T RVolume (veh/h) 5 795 779 5 Peak-Hour Factor, PHF 0.50 0.85 1.00 1.00 0.94 0.75 Hourly Flow Rate, HFR (veh/h) 10 935 0 0 828 6
Percent Heavy Vehicles 6 -- -- 0 -- -- Median Type Undivided RT Channelized 0 0 Lanes 0 2 0 0 2 0 Configuration LT T T TR Upstream Signal 0 1 Minor Street Eastbound Westbound Movement 7 8 9 10 11 12
L T R L T RVolume (veh/h) 5 0 5 Peak-Hour Factor, PHF 0.75 1.00 0.33 0.80 1.00 0.85 Hourly Flow Rate, HFR (veh/h)
6 0 15 0 0 0
Percent Heavy Vehicles 100 0 100 3 0 0 Percent Grade (%) 0 0 Flared Approach N N Storage 0 0 RT Channelized 0 0 Lanes 0 1 0 0 0 0 Configuration LTR Delay, Queue Length, and Level of ServiceApproach Northbound Southbound Westbound Eastbound
Movement 1 4 7 8 9 10 11 12
Lane Configuration LT LTR v (veh/h) 10 21 C (m) (veh/h) 833 201 v/c 0.01 0.10 95% queue length 0.04 0.34 Control Delay (s/veh) 9.4 25.0 LOS A C Approach Delay (s/veh) -- -- 25.0 Approach LOS -- -- C
Copyright © 2010 University of Florida, All Rights Reserved HCS+TM Version 5.6 Generated: 4/16/2015 3:55 PM
Page 1 of 1Two-Way Stop Control
4/16/2015file://C:\Users\asells\AppData\Local\Temp\u2kB9F4.tmp

TWO-WAY STOP CONTROL SUMMARY
General Information Site Information Analyst A SELLS Agency/Co.Date Performed 7/22/2015 Analysis Time Period Alt 1 Phase 2 AM Peak
IntersectionJurisdictionAnalysis Year 2030
Project Description East/West Street: US 119 North/South Street: Jefferson Road Intersection Orientation: North-South Study Period (hrs): 0.25
Vehicle Volumes and Adjustments Major Street Northbound Southbound Movement 1 2 3 4 5 6
L T R L T RVolume (veh/h) 19 506 191 Peak-Hour Factor, PHF 0.60 0.89 1.00 1.00 0.83 1.00 Hourly Flow Rate, HFR (veh/h)
31 568 0 0 230 0
Percent Heavy Vehicles 4 -- -- 0 -- -- Median Type Undivided RT Channelized 0 0 Lanes 1 1 0 0 1 0 Configuration L T T Upstream Signal 0 1 Minor Street Eastbound Westbound Movement 7 8 9 10 11 12
L T R L T RVolume (veh/h) 16 128 Peak-Hour Factor, PHF 1.00 1.00 1.00 0.69 1.00 0.78 Hourly Flow Rate, HFR (veh/h) 0 0 0 23 0 164
Percent Heavy Vehicles 0 0 0 5 0 0 Percent Grade (%) 0 0 Flared Approach N N Storage 0 0 RT Channelized 0 0 Lanes 0 0 0 1 0 1 Configuration L R Delay, Queue Length, and Level of ServiceApproach Northbound Southbound Westbound Eastbound
Movement 1 4 7 8 9 10 11 12
Lane Configuration L L R v (veh/h) 31 23 164 C (m) (veh/h) 1339 314 526 v/c 0.02 0.07 0.31 95% queue length 0.07 0.24 1.32 Control Delay (s/veh) 7.8 17.4 14.9 LOS A C B Approach Delay (s/veh) -- -- 15.2 Approach LOS -- -- C
Copyright © 2010 University of Florida, All Rights Reserved HCS+TM Version 5.6 Generated: 7/31/2015 1:42 PM
Page 1 of 1Two-Way Stop Control
7/31/2015file://C:\Users\asells\AppData\Local\Temp\u2kE0B4.tmp

Alt 1 Phase 2 RHL AM Peak Signalized

HCS 2010 Signalized Intersection Results Summary
General Information Intersection Information
Agency Duration, h 0.25
Analyst A SELLS Analysis Date Jul 22, 2015 Area Type Other
Jurisdiction Time Period ALT 1 PH 2 RHL AM
PHF 0.91
Urban Street MacCorkle Avenue Analysis Year 2030 Analysis Period 1> 7:30
Intersection MacCorkle Ave & Kenna … File Name Alt 1 Phase 2 RHL AM - MacCorkle.xus
Project Description
Demand Information EB WB NB SB
Approach Movement L T R L T R L T R L T R
Demand ( v ), veh/h 14 1841 9 31 1021 15 8 1 68 5 0 0
Signal Information
GreenYellowRed
3.8 108.2 7.0 11.0 0.0 0.03.0 4.0 4.0 4.0 0.0 0.01.0 2.0 1.0 1.0 0.0 0.0
1 2 3
5 6 7 8
Cycle, s 150.0 Reference Phase 2
Offset, s 0 Reference Point End
Uncoordinated No Simult. Gap E/W On
Force Mode Fixed Simult. Gap N/S On
Timer Results EBL EBT WBL WBT NBL NBT SBL SBT
Assigned Phase 1 6 5 2 4 8
Case Number 2.0 4.0 2.0 3.0 8.0 7.0
Phase Duration, s 7.8 122.0 12.0 126.2 16.0 16.0
Change Period, (Y+Rc), s 4.0 6.0 6.0 6.0 5.0 5.0
Max Allow Headway (MAH), s 3.1 0.0 3.1 0.0 3.4 3.4
Queue Clearance Time (gs), s 3.3 4.8 7.0 2.6
Green Extension Time (ge), s 0.0 0.0 1.2 0.0 0.1 0.1
Phase Call Probability 0.47 0.75 0.92 0.92
Max Out Probability 0.00 0.97 0.00 0.00
Movement Group Results EB WB NB SB
Approach Movement L T R L T R L T R L T R
Assigned Movement 1 6 16 5 2 12 7 4 14 3 8 18
Adjusted Flow Rate (v), veh/h 15 1355 676 33 1098 16 55 5 0
Adjusted Saturation Flow Rate (s), veh/h/ln 1727 1814 1810 1727 1693 1537 1547 1351 1537
Queue Service Time (gs), s 1.3 0.0 0.0 2.8 12.9 0.2 0.0 0.0 0.0
Cycle Queue Clearance Time (gc), s 1.3 0.0 0.0 2.8 12.9 0.2 5.0 0.6 0.0
Green Ratio (g/C) 0.03 0.77 0.77 0.04 0.80 0.80 0.07 0.07 0.07
Capacity (c), veh/h 44 2804 1399 69 2714 1231 142 147 113
Volume-to-Capacity Ratio (X) 0.353 0.483 0.483 0.482 0.405 0.013 0.388 0.037 0.000
Available Capacity (ca), veh/h 184 2804 1399 92 2714 1231 202 201 174
Back of Queue (Q), veh/ln (95th percentile) 1.1 0.4 0.8 2.3 6.4 0.1 3.7 0.4 0.0
Queue Storage Ratio (RQ) (95th percentile) 0.13 0.00 0.00 0.00 0.00 0.02 0.00 0.00 0.00
Uniform Delay (d1), s/veh 71.3 0.0 0.0 70.4 3.8 2.4 66.7 64.6 0.0
Incremental Delay (d2), s/veh 1.8 0.6 1.2 1.8 0.4 0.0 0.6 0.0 0.0
Initial Queue Delay (d3), s/veh 0.0 0.0 0.0 0.0 0.0 0.0 0.0 0.0 0.0
Control Delay (d), s/veh 73.1 0.6 1.2 72.1 4.2 2.4 67.3 64.7 0.0
Level of Service (LOS) E A A E A A E E
Approach Delay, s/veh / LOS 1.3 A 6.1 A 67.3 E 64.7 E
Intersection Delay, s/veh / LOS 4.3 A
Multimodal Results EB WB NB SB
Pedestrian LOS Score / LOS 2.2 B 2.2 B 3.3 C 3.0 C
Bicycle LOS Score / LOS 1.6 A 1.5 A 0.6 A 0.5 A
Copyright © 2015 University of Florida, All Rights Reserved. HCS 2010™ Streets Version 6.70 Generated: 7/30/2015 4:16:02 PM

HCS 2010 Signalized Intersection Results Summary
General Information Intersection Information
Agency Duration, h 0.25
Analyst A SELLS Analysis Date Jul 22, 2015 Area Type Other
Jurisdiction Time Period ALT 1 PH 2 RHL AM
PHF 0.91
Urban Street MacCorkle Avenue Analysis Year 2030 Analysis Period 1> 7:30
Intersection MacCorkle Ave & I-64 EB File Name Alt 1 Phase 2 RHL AM - MacCorkle.xus
Project Description
Demand Information EB WB NB SB
Approach Movement L T R L T R L T R L T R
Demand ( v ), veh/h 1102 26 967 106 0
Signal Information
GreenYellowRed
118.3 4.1 12.6 0.0 0.0 0.04.0 4.0 4.0 0.0 0.0 0.01.0 1.0 1.0 0.0 0.0 0.0
1 2 3
5 6 7 8
Cycle, s 150.0 Reference Phase 2
Offset, s 0 Reference Point End
Uncoordinated No Simult. Gap E/W On
Force Mode Fixed Simult. Gap N/S On
Timer Results EBL EBT WBL WBT NBL NBT SBL SBT
Assigned Phase 6 5 2 4
Case Number 8.3 1.0 4.0 12.0
Phase Duration, s 123.3 9.1 132.4 17.6
Change Period, (Y+Rc), s 5.0 5.0 5.0 5.0
Max Allow Headway (MAH), s 0.0 3.1 0.0 3.1
Queue Clearance Time (gs), s 2.0 12.6
Green Extension Time (ge), s 0.0 1.3 0.0 0.1
Phase Call Probability 0.68 0.99
Max Out Probability 0.72 0.00
Movement Group Results EB WB NB SB
Approach Movement L T R L T R L T R L T R
Assigned Movement 6 5 2 7 4
Adjusted Flow Rate (v), veh/h 2103 28 1031 116
Adjusted Saturation Flow Rate (s), veh/h/ln 1727 1678 1677 1631
Queue Service Time (gs), s 39.3 0.0 7.0 10.6
Cycle Queue Clearance Time (gc), s 39.3 0.0 7.0 10.6
Green Ratio (g/C) 0.79 0.80 0.85 0.08
Capacity (c), veh/h 2724 191 2850 137
Volume-to-Capacity Ratio (X) 0.772 0.145 0.362 0.853
Available Capacity (ca), veh/h 2724 212 2850 218
Back of Queue (Q), veh/ln (95th percentile) 12.9 0.9 2.6 8.3
Queue Storage Ratio (RQ) (95th percentile) 0.00 0.18 0.00 0.00
Uniform Delay (d1), s/veh 5.2 18.6 1.5 67.8
Incremental Delay (d2), s/veh 1.9 0.1 0.3 9.7
Initial Queue Delay (d3), s/veh 0.0 0.0 0.0 0.0
Control Delay (d), s/veh 7.1 18.7 1.9 77.5
Level of Service (LOS) A B A E
Approach Delay, s/veh / LOS 7.1 A 2.3 A 77.5 E 0.0
Intersection Delay, s/veh / LOS 8.1 A
Multimodal Results EB WB NB SB
Pedestrian LOS Score / LOS 2.2 B 1.8 A 2.9 C 2.8 C
Bicycle LOS Score / LOS 1.5 A 1.4 A 0.7 A
Copyright © 2015 University of Florida, All Rights Reserved. HCS 2010™ Streets Version 6.70 Generated: 7/30/2015 4:16:02 PM
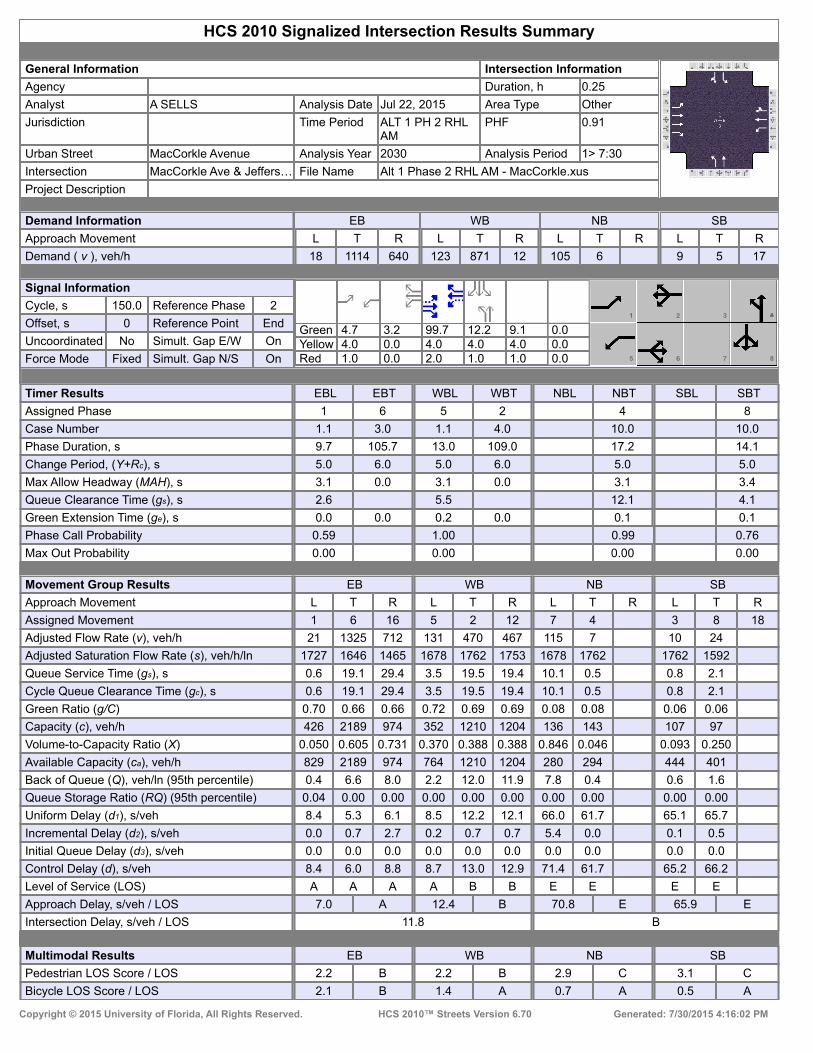
HCS 2010 Signalized Intersection Results Summary
General Information Intersection Information
Agency Duration, h 0.25
Analyst A SELLS Analysis Date Jul 22, 2015 Area Type Other
Jurisdiction Time Period ALT 1 PH 2 RHL AM
PHF 0.91
Urban Street MacCorkle Avenue Analysis Year 2030 Analysis Period 1> 7:30
Intersection MacCorkle Ave & Jeffers… File Name Alt 1 Phase 2 RHL AM - MacCorkle.xus
Project Description
Demand Information EB WB NB SB
Approach Movement L T R L T R L T R L T R
Demand ( v ), veh/h 18 1114 640 123 871 12 105 6 9 5 17
Signal Information
GreenYellowRed
4.7 3.2 99.7 12.2 9.1 0.04.0 0.0 4.0 4.0 4.0 0.01.0 0.0 2.0 1.0 1.0 0.0
1 2 3
5 6 7 8
Cycle, s 150.0 Reference Phase 2
Offset, s 0 Reference Point End
Uncoordinated No Simult. Gap E/W On
Force Mode Fixed Simult. Gap N/S On
Timer Results EBL EBT WBL WBT NBL NBT SBL SBT
Assigned Phase 1 6 5 2 4 8
Case Number 1.1 3.0 1.1 4.0 10.0 10.0
Phase Duration, s 9.7 105.7 13.0 109.0 17.2 14.1
Change Period, (Y+Rc), s 5.0 6.0 5.0 6.0 5.0 5.0
Max Allow Headway (MAH), s 3.1 0.0 3.1 0.0 3.1 3.4
Queue Clearance Time (gs), s 2.6 5.5 12.1 4.1
Green Extension Time (ge), s 0.0 0.0 0.2 0.0 0.1 0.1
Phase Call Probability 0.59 1.00 0.99 0.76
Max Out Probability 0.00 0.00 0.00 0.00
Movement Group Results EB WB NB SB
Approach Movement L T R L T R L T R L T R
Assigned Movement 1 6 16 5 2 12 7 4 3 8 18
Adjusted Flow Rate (v), veh/h 21 1325 712 131 470 467 115 7 10 24
Adjusted Saturation Flow Rate (s), veh/h/ln 1727 1646 1465 1678 1762 1753 1678 1762 1762 1592
Queue Service Time (gs), s 0.6 19.1 29.4 3.5 19.5 19.4 10.1 0.5 0.8 2.1
Cycle Queue Clearance Time (gc), s 0.6 19.1 29.4 3.5 19.5 19.4 10.1 0.5 0.8 2.1
Green Ratio (g/C) 0.70 0.66 0.66 0.72 0.69 0.69 0.08 0.08 0.06 0.06
Capacity (c), veh/h 426 2189 974 352 1210 1204 136 143 107 97
Volume-to-Capacity Ratio (X) 0.050 0.605 0.731 0.370 0.388 0.388 0.846 0.046 0.093 0.250
Available Capacity (ca), veh/h 829 2189 974 764 1210 1204 280 294 444 401
Back of Queue (Q), veh/ln (95th percentile) 0.4 6.6 8.0 2.2 12.0 11.9 7.8 0.4 0.6 1.6
Queue Storage Ratio (RQ) (95th percentile) 0.04 0.00 0.00 0.00 0.00 0.00 0.00 0.00 0.00 0.00
Uniform Delay (d1), s/veh 8.4 5.3 6.1 8.5 12.2 12.1 66.0 61.7 65.1 65.7
Incremental Delay (d2), s/veh 0.0 0.7 2.7 0.2 0.7 0.7 5.4 0.0 0.1 0.5
Initial Queue Delay (d3), s/veh 0.0 0.0 0.0 0.0 0.0 0.0 0.0 0.0 0.0 0.0
Control Delay (d), s/veh 8.4 6.0 8.8 8.7 13.0 12.9 71.4 61.7 65.2 66.2
Level of Service (LOS) A A A A B B E E E E
Approach Delay, s/veh / LOS 7.0 A 12.4 B 70.8 E 65.9 E
Intersection Delay, s/veh / LOS 11.8 B
Multimodal Results EB WB NB SB
Pedestrian LOS Score / LOS 2.2 B 2.2 B 2.9 C 3.1 C
Bicycle LOS Score / LOS 2.1 B 1.4 A 0.7 A 0.5 A
Copyright © 2015 University of Florida, All Rights Reserved. HCS 2010™ Streets Version 6.70 Generated: 7/30/2015 4:16:02 PM

HCS 2010 Signalized Intersection Results Summary
General Information Intersection Information
Agency Duration, h 0.25
Analyst A SELLS Analysis Date Jul 22, 2015 Area Type Other
Jurisdiction Time Period ALT 1 PH 2 RHL AM
PHF 0.91
Urban Street MacCorkle Avenue Analysis Year 2030 Analysis Period 1> 7:30
Intersection MacCorkle Ave & I-64 WB File Name Alt 1 Phase 2 RHL AM - MacCorkle.xus
Project Description
Demand Information EB WB NB SB
Approach Movement L T R L T R L T R L T R
Demand ( v ), veh/h 1092 358 76 659 347 0
Signal Information
GreenYellowRed
98.4 6.6 31.0 0.0 0.0 0.04.0 4.0 4.0 0.0 0.0 0.01.0 1.0 0.0 0.0 0.0 0.0
1 2 3
5 6 7 8
Cycle, s 150.0 Reference Phase 2
Offset, s 0 Reference Point End
Uncoordinated No Simult. Gap E/W On
Force Mode Fixed Simult. Gap N/S On
Timer Results EBL EBT WBL WBT NBL NBT SBL SBT
Assigned Phase 6 5 2 4
Case Number 7.3 1.0 4.0 10.0
Phase Duration, s 103.4 11.6 115.0 35.0
Change Period, (Y+Rc), s 5.0 5.0 5.0 4.0
Max Allow Headway (MAH), s 0.0 3.1 0.0 3.1
Queue Clearance Time (gs), s 2.0 33.0
Green Extension Time (ge), s 0.0 0.1 0.0 0.0
Phase Call Probability 0.97 1.00
Max Out Probability 0.25 1.00
Movement Group Results EB WB NB SB
Approach Movement L T R L T R L T R L T R
Assigned Movement 6 16 5 2 7 4
Adjusted Flow Rate (v), veh/h 997 274 84 724 381 0
Adjusted Saturation Flow Rate (s), veh/h/ln 1693 1507 1616 1616 1662 1850
Queue Service Time (gs), s 17.6 9.2 0.0 1.1 31.0 0.0
Cycle Queue Clearance Time (gc), s 17.6 9.2 0.0 1.1 31.0 0.0
Green Ratio (g/C) 0.66 0.66 0.69 0.73 0.21 0.21
Capacity (c), veh/h 2221 989 396 2370 344 382
Volume-to-Capacity Ratio (X) 0.449 0.277 0.211 0.306 1.110 0.000
Available Capacity (ca), veh/h 2221 989 411 2370 344 382
Back of Queue (Q), veh/ln (95th percentile) 9.1 5.2 2.6 0.6 29.7 0.0
Queue Storage Ratio (RQ) (95th percentile) 0.00 0.00 0.00 0.00 1.68 0.00
Uniform Delay (d1), s/veh 9.3 8.2 16.2 0.5 59.5 0.0
Incremental Delay (d2), s/veh 0.5 0.5 0.1 0.3 81.6 0.0
Initial Queue Delay (d3), s/veh 0.0 0.0 0.0 0.0 0.0 0.0
Control Delay (d), s/veh 9.8 8.7 16.3 0.8 141.1 0.0
Level of Service (LOS) A A B A F
Approach Delay, s/veh / LOS 9.6 A 2.4 A 141.1 F 0.0
Intersection Delay, s/veh / LOS 27.6 C
Multimodal Results EB WB NB SB
Pedestrian LOS Score / LOS 2.3 B 1.9 A 2.9 C 3.0 C
Bicycle LOS Score / LOS 1.7 A 1.2 A 1.1 A
Copyright © 2015 University of Florida, All Rights Reserved. HCS 2010™ Streets Version 6.70 Generated: 7/30/2015 4:16:02 PM

HCS 2010 Signalized Intersection Results Summary
General Information Intersection Information
Agency Duration, h 0.25
Analyst A SELLS Analysis Date Jul 22, 2015 Area Type Other
Jurisdiction Time Period Alt 1 Phase 2 RHL AM
PHF 0.92
Urban Street Jefferson Road Analysis Year 2030 Analysis Period 1> 7:30
Intersection Jefferson Rd & Kanawh… File Name Alt 1 Phase 2 RHL AM- Kanawha.xus
Project Description
Demand Information EB WB NB SB
Approach Movement L T R L T R L T R L T R
Demand ( v ), veh/h 24 270 310 256 262 132 362 256 190 429 212
Signal Information
GreenYellowRed
19.6 3.2 38.0 3.4 3.4 22.43.0 0.0 3.0 3.0 3.0 3.02.0 0.0 2.0 2.0 2.0 2.0
2 3 4
5 7 8
Cycle, s 115.0 Reference Phase 2
Offset, s 0 Reference Point End
Uncoordinated No Simult. Gap E/W On
Force Mode Fixed Simult. Gap N/S On
Timer Results EBL EBT WBL WBT NBL NBT SBL SBT
Assigned Phase 3 8 7 4 1 6 5 2
Case Number 2.0 3.0 2.0 4.0 1.1 3.0 1.1 4.0
Phase Duration, s 8.4 27.4 16.8 35.8 24.6 43.0 27.8 46.2
Change Period, (Y+Rc), s 5.0 5.0 5.0 5.0 5.0 5.0 5.0 5.0
Max Allow Headway (MAH), s 3.1 3.1 3.1 3.1 3.1 0.0 3.1 0.0
Queue Clearance Time (gs), s 3.7 19.9 11.1 29.0 18.9 22.0
Green Extension Time (ge), s 0.0 1.8 0.6 1.8 0.7 0.0 0.9 0.0
Phase Call Probability 0.57 1.00 1.00 1.00 1.00 1.00
Max Out Probability 0.00 0.00 0.00 0.00 0.00 0.00
Movement Group Results EB WB NB SB
Approach Movement L T R L T R L T R L T R
Assigned Movement 3 8 18 7 4 14 1 6 16 5 2
Adjusted Flow Rate (v), veh/h 26 293 220 278 416 393 278 113 466 230
Adjusted Saturation Flow Rate (s), veh/h/ln 1727 1814 1568 1711 1716 1727 1761 1537 1727 1727
Queue Service Time (gs), s 1.7 17.9 15.1 9.1 27.0 16.9 6.6 6.1 20.0 5.3
Cycle Queue Clearance Time (gc), s 1.7 17.9 15.1 9.1 27.0 16.9 6.6 6.1 20.0 5.3
Green Ratio (g/C) 0.03 0.19 0.19 0.10 0.27 0.50 0.33 0.33 0.53 0.36
Capacity (c), veh/h 51 354 306 350 460 697 1165 508 707 1238
Volume-to-Capacity Ratio (X) 0.512 0.830 0.718 0.794 0.906 0.565 0.239 0.222 0.659 0.186
Available Capacity (ca), veh/h 270 1013 876 1755 1083 1211 1165 508 1113 1238
Back of Queue (Q), veh/ln (95th percentile) 1.4 12.7 9.8 7.0 16.9 10.6 5.0 4.2 12.0 3.9
Queue Storage Ratio (RQ) (95th percentile) 0.10 0.00 0.00 0.39 0.00 0.62 0.00 0.00 0.97 0.00
Uniform Delay (d1), s/veh 55.0 44.5 43.3 50.4 40.7 18.6 28.0 27.8 17.7 25.4
Incremental Delay (d2), s/veh 2.9 1.9 1.2 1.6 2.8 0.3 0.5 1.0 0.4 0.3
Initial Queue Delay (d3), s/veh 0.0 0.0 0.0 0.0 0.0 0.0 0.0 0.0 0.0 0.0
Control Delay (d), s/veh 57.9 46.4 44.5 52.0 43.5 18.9 28.4 28.8 18.1 25.7
Level of Service (LOS) E D D D D B C C B C
Approach Delay, s/veh / LOS 46.2 D 46.9 D 23.7 C 20.6 C
Intersection Delay, s/veh / LOS 33.3 C
Multimodal Results EB WB NB SB
Pedestrian LOS Score / LOS 3.1 C 2.8 C 2.5 B 2.6 B
Bicycle LOS Score / LOS 1.4 A 1.6 A 1.1 A 1.1 A
Copyright © 2015 University of Florida, All Rights Reserved. HCS 2010™ Streets Version 6.70 Generated: 7/31/2015 12:19:05 PM

HCS 2010 Signalized Intersection Results Summary
General Information Intersection Information
Agency Duration, h 0.25
Analyst A SELLS Analysis Date Jul 22, 2015 Area Type Other
Jurisdiction Time Period Alt 1 Phase 2 RHL AM
PHF 0.92
Urban Street Jefferson Road Analysis Year 2030 Analysis Period 1> 7:30
Intersection RHL Boulevard File Name Alt 1 Phase 2 RHL AM - Jefferson & RHL.xus
Project Description
Demand Information EB WB NB SB
Approach Movement L T R L T R L T R L T R
Demand ( v ), veh/h 161 0 2 2 634 743 36
Signal Information
GreenYellowRed
51.2 8.8 0.0 0.0 0.0 0.03.0 3.0 0.0 0.0 0.0 0.02.0 2.0 0.0 0.0 0.0 0.0
1 2 3 4
5 7 8
Cycle, s 70.0 Reference Phase 2
Offset, s 0 Reference Point End
Uncoordinated No Simult. Gap E/W On
Force Mode Fixed Simult. Gap N/S On
Timer Results EBL EBT WBL WBT NBL NBT SBL SBT
Assigned Phase 8 6 2
Case Number 9.0 6.0 7.0
Phase Duration, s 13.8 56.2 56.2
Change Period, (Y+Rc), s 5.0 5.0 5.0
Max Allow Headway (MAH), s 3.1 0.0 0.0
Queue Clearance Time (gs), s 8.9
Green Extension Time (ge), s 0.1 0.0 0.0
Phase Call Probability 0.97
Max Out Probability 0.04
Movement Group Results EB WB NB SB
Approach Movement L T R L T R L T R L T R
Assigned Movement 3 8 18 1 6 2 12
Adjusted Flow Rate (v), veh/h 175 0 2 2 689 808 36
Adjusted Saturation Flow Rate (s), veh/h/ln 1727 1850 1537 672 1727 1727 1537
Queue Service Time (gs), s 6.9 0.0 0.1 0.1 4.7 5.7 0.4
Cycle Queue Clearance Time (gc), s 6.9 0.0 0.1 5.8 4.7 5.7 0.4
Green Ratio (g/C) 0.13 0.13 0.13 0.73 0.73 0.73 0.73
Capacity (c), veh/h 216 232 192 540 2528 2528 1125
Volume-to-Capacity Ratio (X) 0.809 0.000 0.011 0.004 0.273 0.320 0.032
Available Capacity (ca), veh/h 370 396 329 540 2528 2528 1125
Back of Queue (Q), veh/ln (95th percentile) 5.1 0.0 0.1 0.0 1.6 2.0 0.2
Queue Storage Ratio (RQ) (95th percentile) 1.29 0.00 0.01 0.01 0.00 0.00 0.03
Uniform Delay (d1), s/veh 29.8 0.0 26.8 4.3 3.1 3.3 2.6
Incremental Delay (d2), s/veh 2.7 0.0 0.0 0.0 0.3 0.3 0.1
Initial Queue Delay (d3), s/veh 0.0 0.0 0.0 0.0 0.0 0.0 0.0
Control Delay (d), s/veh 32.5 0.0 26.8 4.3 3.4 3.6 2.6
Level of Service (LOS) C C A A A A
Approach Delay, s/veh / LOS 32.5 C 0.0 3.4 A 3.6 A
Intersection Delay, s/veh / LOS 6.5 A
Multimodal Results EB WB NB SB
Pedestrian LOS Score / LOS 2.9 C 2.9 C 1.8 A 2.3 B
Bicycle LOS Score / LOS 0.8 A 1.1 A 1.2 A
Copyright © 2015 University of Florida, All Rights Reserved. HCS 2010™ Streets Version 6.70 Generated: 7/27/2015 3:10:40 PM

HCS 2010 Signalized Intersection Results Summary
General Information Intersection Information
Agency Duration, h 0.25
Analyst A SELLS Analysis Date Jul 22, 2015 Area Type Other
Jurisdiction Time Period Alt1 Phase 2 RHL AM
PHF 0.88
Urban Street Jefferson Road Analysis Year 2030 Analysis Period 1> 7:30
Intersection Jefferson Rd & Oakhurs… File Name Alt 1 Phase 2 RHL AM - US 119 & Oakhurst.xus
Project Description
Demand Information EB WB NB SB
Approach Movement L T R L T R L T R L T R
Demand ( v ), veh/h 377 11 148 99 128 79
Signal Information
GreenYellowRed
12.2 60.7 33.6 0.0 0.0 0.04.0 4.0 4.0 0.0 0.0 0.00.5 0.5 0.5 0.0 0.0 0.0
1 3 4
5 6 7 8
Cycle, s 120.0 Reference Phase 2
Offset, s 0 Reference Point Begin
Uncoordinated No Simult. Gap E/W On
Force Mode Fixed Simult. Gap N/S On
Timer Results EBL EBT WBL WBT NBL NBT SBL SBT
Assigned Phase 4 2 1 6
Case Number 9.0 7.3 2.0 4.0
Phase Duration, s 38.1 65.2 16.7 81.9
Change Period, (Y+Rc), s 4.5 4.5 4.5 4.5
Max Allow Headway (MAH), s 3.1 0.0 3.1 0.0
Queue Clearance Time (gs), s 32.8 12.0
Green Extension Time (ge), s 0.8 0.0 0.2 0.0
Phase Call Probability 1.00 1.00
Max Out Probability 0.00 0.00
Movement Group Results EB WB NB SB
Approach Movement L T R L T R L T R L T R
Assigned Movement 7 14 2 12 1 6
Adjusted Flow Rate (v), veh/h 428 13 168 56 145 90
Adjusted Saturation Flow Rate (s), veh/h/ln 1631 1452 1762 1568 1711 1796
Queue Service Time (gs), s 30.8 0.8 6.3 2.2 10.0 2.2
Cycle Queue Clearance Time (gc), s 30.8 0.8 6.3 2.2 10.0 2.2
Green Ratio (g/C) 0.28 0.28 0.51 0.51 0.10 0.65
Capacity (c), veh/h 457 406 891 793 175 1159
Volume-to-Capacity Ratio (X) 0.938 0.031 0.189 0.070 0.834 0.077
Available Capacity (ca), veh/h 755 671 891 793 533 1159
Back of Queue (Q), veh/ln (95th percentile) 19.1 0.5 4.6 1.4 7.9 1.5
Queue Storage Ratio (RQ) (95th percentile) 0.00 0.03 0.00 0.00 0.94 0.00
Uniform Delay (d1), s/veh 42.2 31.4 16.2 15.2 52.9 8.0
Incremental Delay (d2), s/veh 9.2 0.0 0.5 0.2 3.9 0.1
Initial Queue Delay (d3), s/veh 0.0 0.0 0.0 0.0 0.0 0.0
Control Delay (d), s/veh 51.4 31.4 16.7 15.4 56.8 8.1
Level of Service (LOS) D C B B E A
Approach Delay, s/veh / LOS 50.8 D 0.0 16.4 B 38.2 D
Intersection Delay, s/veh / LOS 39.0 D
Multimodal Results EB WB NB SB
Pedestrian LOS Score / LOS 2.4 B 2.3 B 1.9 A 1.7 A
Bicycle LOS Score / LOS F 0.9 A 0.9 A
Copyright © 2015 University of Florida, All Rights Reserved. HCS 2010™ Streets Version 6.70 Generated: 7/27/2015 3:12:53 PM

Alt 1 Phase 2 RHL PM Peak Unsignalized

TWO-WAY STOP CONTROL SUMMARY
General Information Site Information Analyst ASELLS Agency/Co. STANTEC Date Performed 11/25/2014 Analysis Time Period Alt 1 Phase 2 RHL PM
Intersection Jurisdiction Analysis Year 2030
Project Description East/West Street: Bob Evans entrance North/South Street: Jefferson Road Intersection Orientation: North-South Study Period (hrs): 0.25
Vehicle Volumes and Adjustments Major Street Northbound Southbound Movement 1 2 3 4 5 6 L T R L T RVolume (veh/h) 5 562 801 25 Peak-Hour Factor, PHF 0.45 0.87 1.00 1.00 0.86 0.63 Hourly Flow Rate, HFR (veh/h)
11 645 0 0 931 39
Percent Heavy Vehicles 2 -- -- 0 -- -- Median Type Undivided RT Channelized 0 0 Lanes 0 2 0 0 2 0 Configuration LT T T TR Upstream Signal 1 0 Minor Street Eastbound Westbound Movement 7 8 9 10 11 12
L T R L T RVolume (veh/h) 10 10 Peak-Hour Factor, PHF 0.90 1.00 0.69 1.00 1.00 1.00 Hourly Flow Rate, HFR (veh/h) 11 0 14 0 0 0
Percent Heavy Vehicles 2 0 2 0 0 0 Percent Grade (%) 0 0 Flared Approach N N Storage 0 0 RT Channelized 0 0 Lanes 1 0 1 0 0 0 Configuration L R Delay, Queue Length, and Level of ServiceApproach Northbound Southbound Westbound Eastbound
Movement 1 4 7 8 9 10 11 12
Lane Configuration LT L R v (veh/h) 11 11 14 C (m) (veh/h) 705 159 579 v/c 0.02 0.07 0.02 95% queue length 0.05 0.22 0.07 Control Delay (s/veh) 10.2 29.3 11.4 LOS B D B Approach Delay (s/veh) -- -- 19.3 Approach LOS -- -- C
Copyright © 2010 University of Florida, All Rights Reserved HCS+TM Version 5.6 Generated: 4/16/2015 4:10 PM
Page 1 of 1Two-Way Stop Control
4/16/2015file://C:\Users\asells\AppData\Local\Temp\u2k823.tmp

TWO-WAY STOP CONTROL SUMMARY
General Information Site Information Analyst ASELLS Agency/Co. STANTEC Date Performed 11/25/2014 Analysis Time Period Alt 1 Phase 2 RHL PM
Intersection Jurisdiction Analysis Year 2030
Project Description East/West Street: McDonalds entrance North/South Street: Jefferson Road Intersection Orientation: North-South Study Period (hrs): 0.25
Vehicle Volumes and Adjustments Major Street Northbound Southbound Movement 1 2 3 4 5 6 L T R L T RVolume (veh/h) 30 562 801 85 Peak-Hour Factor, PHF 0.83 0.87 1.00 1.00 0.88 0.83 Hourly Flow Rate, HFR (veh/h)
36 645 0 0 910 102
Percent Heavy Vehicles 2 -- -- 0 -- -- Median Type Undivided RT Channelized 0 0 Lanes 0 2 0 0 2 0 Configuration LT T T TR Upstream Signal 0 0 Minor Street Eastbound Westbound Movement 7 8 9 10 11 12
L T R L T RVolume (veh/h) 5 5 Peak-Hour Factor, PHF 0.50 1.00 0.25 1.00 1.00 1.00 Hourly Flow Rate, HFR (veh/h) 10 0 20 0 0 0
Percent Heavy Vehicles 2 0 2 0 0 0 Percent Grade (%) 0 0 Flared Approach N N Storage 0 0 RT Channelized 0 0 Lanes 1 0 1 0 0 0 Configuration L R Delay, Queue Length, and Level of ServiceApproach Northbound Southbound Westbound Eastbound
Movement 1 4 7 8 9 10 11 12
Lane Configuration LT L R v (veh/h) 36 10 20 C (m) (veh/h) 679 132 564 v/c 0.05 0.08 0.04 95% queue length 0.17 0.24 0.11 Control Delay (s/veh) 10.6 34.5 11.6 LOS B D B Approach Delay (s/veh) -- -- 19.2 Approach LOS -- -- C
Copyright © 2010 University of Florida, All Rights Reserved HCS+TM Version 5.6 Generated: 4/16/2015 4:11 PM
Page 1 of 1Two-Way Stop Control
4/16/2015file://C:\Users\asells\AppData\Local\Temp\u2kE44E.tmp

TWO-WAY STOP CONTROL SUMMARY
General Information Site Information Analyst ASELLS Agency/Co. STANTEC Date Performed 11/25/2014 Analysis Time Period Alt 1 Phase 2 RHL PM
Intersection Jurisdiction Analysis Year 2030
Project Description East/West Street: Community Center - North North/South Street: Jefferson Road Intersection Orientation: North-South Study Period (hrs): 0.25
Vehicle Volumes and Adjustments Major Street Northbound Southbound Movement 1 2 3 4 5 6 L T R L T RVolume (veh/h) 5 560 800 0 Peak-Hour Factor, PHF 0.50 0.77 1.00 1.00 0.82 0.47 Hourly Flow Rate, HFR (veh/h)
10 727 0 0 975 0
Percent Heavy Vehicles 2 -- -- 0 -- -- Median Type Undivided RT Channelized 0 0 Lanes 0 2 0 0 2 0 Configuration LT T T TR Upstream Signal 0 0 Minor Street Eastbound Westbound Movement 7 8 9 10 11 12
L T R L T RVolume (veh/h) 2 0 5 Peak-Hour Factor, PHF 0.46 1.00 0.58 1.00 1.00 1.00 Hourly Flow Rate, HFR (veh/h) 4 0 8 0 0 0
Percent Heavy Vehicles 2 0 2 0 0 0 Percent Grade (%) 0 0 Flared Approach N N Storage 0 0 RT Channelized 0 0 Lanes 0 1 0 0 0 0 Configuration LTR Delay, Queue Length, and Level of ServiceApproach Northbound Southbound Westbound Eastbound
Movement 1 4 7 8 9 10 11 12
Lane Configuration LT LTR v (veh/h) 10 12 C (m) (veh/h) 702 280 v/c 0.01 0.04 95% queue length 0.04 0.13 Control Delay (s/veh) 10.2 18.4 LOS B C Approach Delay (s/veh) -- -- 18.4 Approach LOS -- -- C
Copyright © 2010 University of Florida, All Rights Reserved HCS+TM Version 5.6 Generated: 4/17/2015 8:45 AM
Page 1 of 1Two-Way Stop Control
4/17/2015file://C:\Users\asells\AppData\Local\Temp\u2k9702.tmp

TWO-WAY STOP CONTROL SUMMARY
General Information Site Information Analyst ASELLS Agency/Co. STANTEC Date Performed 11/25/2014 Analysis Time Period Alt 1 Phase 2 RHL PM
Intersection Jurisdiction Analysis Year 2030
Project Description East/West Street: Community Center - South North/South Street: Jefferson Road Intersection Orientation: North-South Study Period (hrs): 0.25
Vehicle Volumes and Adjustments Major Street Northbound Southbound Movement 1 2 3 4 5 6 L T R L T RVolume (veh/h) 1 560 800 1 Peak-Hour Factor, PHF 0.67 0.81 1.00 1.00 0.91 0.25 Hourly Flow Rate, HFR (veh/h)
1 691 0 0 879 4
Percent Heavy Vehicles 2 -- -- 0 -- -- Median Type Raised curb RT Channelized 0 0 Lanes 0 2 0 0 2 0 Configuration LT T T TR Upstream Signal 0 0 Minor Street Eastbound Westbound Movement 7 8 9 10 11 12
L T R L T RVolume (veh/h) 4 0 25 Peak-Hour Factor, PHF 0.33 1.00 0.71 1.00 1.00 1.00 Hourly Flow Rate, HFR (veh/h) 12 0 35 0 0 0
Percent Heavy Vehicles 2 0 2 0 0 0 Percent Grade (%) 0 0 Flared Approach N N Storage 0 0 RT Channelized 0 0 Lanes 0 1 0 0 0 0 Configuration LTR Delay, Queue Length, and Level of ServiceApproach Northbound Southbound Westbound Eastbound
Movement 1 4 7 8 9 10 11 12
Lane Configuration LT LTR v (veh/h) 1 47 C (m) (veh/h) 760 517 v/c 0.00 0.09 95% queue length 0.00 0.30 Control Delay (s/veh) 9.7 12.7 LOS A B Approach Delay (s/veh) -- -- 12.7 Approach LOS -- -- B
Copyright © 2010 University of Florida, All Rights Reserved HCS+TM Version 5.6 Generated: 4/16/2015 4:08 PM
Page 1 of 1Two-Way Stop Control
4/16/2015file://C:\Users\asells\AppData\Local\Temp\u2kB3EC.tmp

TWO-WAY STOP CONTROL SUMMARY
General Information Site Information Analyst A SELLS Agency/Co. STANTEC Date Performed 11/25/2014 Analysis Time Period Alt 1 Phase 2 PM
Intersection Jurisdiction Analysis Year 2030
Project Description East/West Street: Washington Street North/South Street: Jefferson Road Intersection Orientation: North-South Study Period (hrs): 0.25
Vehicle Volumes and Adjustments Major Street Northbound Southbound Movement 1 2 3 4 5 6 L T R L T RVolume (veh/h) 560 1 1 825 Peak-Hour Factor, PHF 1.00 0.80 0.92 0.69 0.91 1.00 Hourly Flow Rate, HFR (veh/h)
0 699 1 1 906 0
Percent Heavy Vehicles 0 -- -- 2 -- -- Median Type Raised curb RT Channelized 0 0 Lanes 0 2 0 0 2 0 Configuration T TR LT T Upstream Signal 0 0 Minor Street Eastbound Westbound Movement 7 8 9 10 11 12
L T R L T RVolume (veh/h) 5 0 5 Peak-Hour Factor, PHF 1.00 1.00 1.00 0.73 1.00 0.85 Hourly Flow Rate, HFR (veh/h) 0 0 0 6 0 5
Percent Heavy Vehicles 0 0 0 2 0 2 Percent Grade (%) 0 0 Flared Approach N N Storage 0 0 RT Channelized 0 0 Lanes 0 0 0 0 1 0 Configuration LTR Delay, Queue Length, and Level of ServiceApproach Northbound Southbound Westbound Eastbound
Movement 1 4 7 8 9 10 11 12
Lane Configuration LT LTR v (veh/h) 1 11 C (m) (veh/h) 882 509 v/c 0.00 0.02 95% queue length 0.00 0.07 Control Delay (s/veh) 9.1 12.2 LOS A B Approach Delay (s/veh) -- -- 12.2 Approach LOS -- -- B
Copyright © 2010 University of Florida, All Rights Reserved HCS+TM Version 5.6 Generated: 4/16/2015 4:13 PM
Page 1 of 1Two-Way Stop Control
4/16/2015file://C:\Users\asells\AppData\Local\Temp\u2kEEE9.tmp
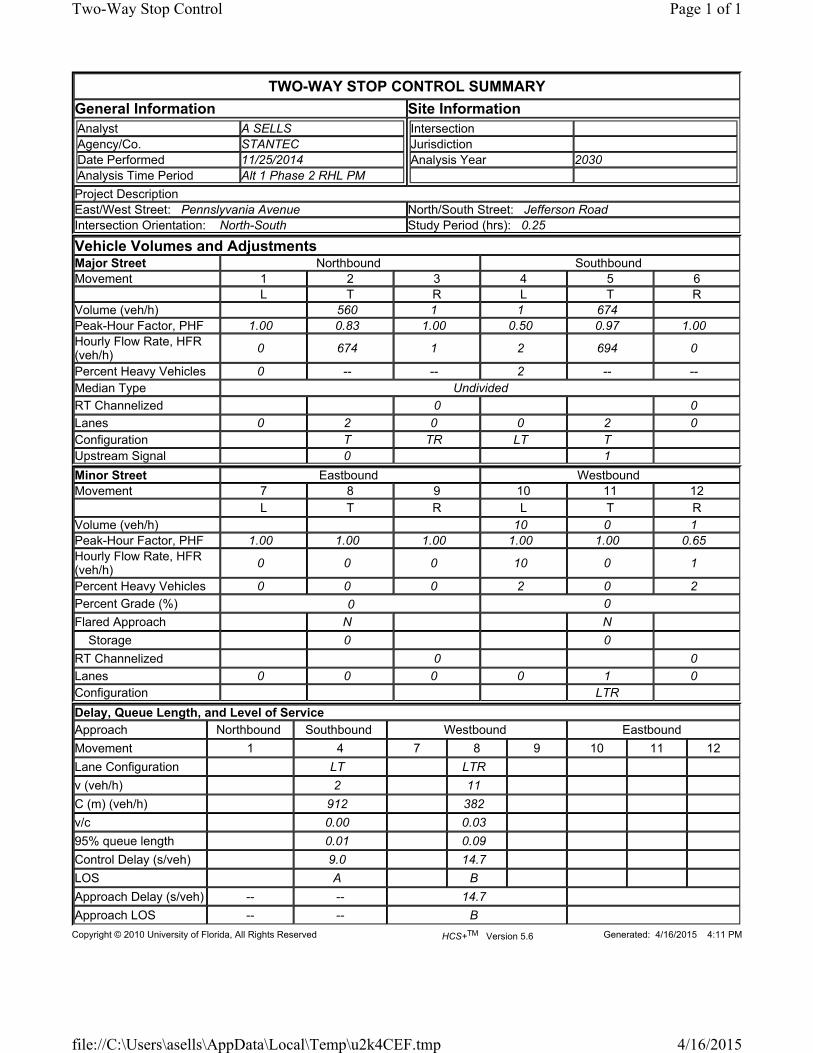
TWO-WAY STOP CONTROL SUMMARY
General Information Site Information Analyst A SELLS Agency/Co. STANTEC Date Performed 11/25/2014 Analysis Time Period Alt 1 Phase 2 RHL PM
Intersection Jurisdiction Analysis Year 2030
Project Description East/West Street: Pennslyvania Avenue North/South Street: Jefferson Road Intersection Orientation: North-South Study Period (hrs): 0.25
Vehicle Volumes and Adjustments Major Street Northbound Southbound Movement 1 2 3 4 5 6 L T R L T RVolume (veh/h) 560 1 1 674 Peak-Hour Factor, PHF 1.00 0.83 1.00 0.50 0.97 1.00 Hourly Flow Rate, HFR (veh/h)
0 674 1 2 694 0
Percent Heavy Vehicles 0 -- -- 2 -- -- Median Type Undivided RT Channelized 0 0 Lanes 0 2 0 0 2 0 Configuration T TR LT T Upstream Signal 0 1 Minor Street Eastbound Westbound Movement 7 8 9 10 11 12
L T R L T RVolume (veh/h) 10 0 1 Peak-Hour Factor, PHF 1.00 1.00 1.00 1.00 1.00 0.65 Hourly Flow Rate, HFR (veh/h) 0 0 0 10 0 1
Percent Heavy Vehicles 0 0 0 2 0 2 Percent Grade (%) 0 0 Flared Approach N N Storage 0 0 RT Channelized 0 0 Lanes 0 0 0 0 1 0 Configuration LTR Delay, Queue Length, and Level of ServiceApproach Northbound Southbound Westbound Eastbound
Movement 1 4 7 8 9 10 11 12
Lane Configuration LT LTR v (veh/h) 2 11 C (m) (veh/h) 912 382 v/c 0.00 0.03 95% queue length 0.01 0.09 Control Delay (s/veh) 9.0 14.7 LOS A B Approach Delay (s/veh) -- -- 14.7 Approach LOS -- -- B
Copyright © 2010 University of Florida, All Rights Reserved HCS+TM Version 5.6 Generated: 4/16/2015 4:11 PM
Page 1 of 1Two-Way Stop Control
4/16/2015file://C:\Users\asells\AppData\Local\Temp\u2k4CEF.tmp

TWO-WAY STOP CONTROL SUMMARY
General Information Site Information Analyst A SELLS Agency/Co. Date Performed 12/3/2014 Analysis Time Period Alt 1 Phase 2 RHL PM Peak
Intersection Jurisdiction Analysis Year 2030
Project Description East/West Street: Kramer Street North/South Street: Jefferson Road Intersection Orientation: North-South Study Period (hrs): 0.25
Vehicle Volumes and Adjustments Major Street Northbound Southbound Movement 1 2 3 4 5 6 L T R L T RVolume (veh/h) 5 1032 1070 5 Peak-Hour Factor, PHF 0.50 0.85 1.00 1.00 0.94 0.75 Hourly Flow Rate, HFR (veh/h) 10 1214 0 0 1138 6
Percent Heavy Vehicles 6 -- -- 0 -- -- Median Type Undivided RT Channelized 0 0 Lanes 0 2 0 0 2 0 Configuration LT T T TR Upstream Signal 0 1 Minor Street Eastbound Westbound Movement 7 8 9 10 11 12
L T R L T RVolume (veh/h) 5 0 5 Peak-Hour Factor, PHF 0.75 1.00 0.33 0.80 1.00 0.85 Hourly Flow Rate, HFR (veh/h)
6 0 15 0 0 0
Percent Heavy Vehicles 100 0 100 3 0 0 Percent Grade (%) 0 0 Flared Approach N N Storage 0 0 RT Channelized 0 0 Lanes 0 1 0 0 0 0 Configuration LTR Delay, Queue Length, and Level of ServiceApproach Northbound Southbound Westbound Eastbound
Movement 1 4 7 8 9 10 11 12
Lane Configuration LT LTR v (veh/h) 10 21 C (m) (veh/h) 649 97 v/c 0.02 0.22 95% queue length 0.05 0.77 Control Delay (s/veh) 10.6 52.1 LOS B F Approach Delay (s/veh) -- -- 52.1 Approach LOS -- -- F
Copyright © 2010 University of Florida, All Rights Reserved HCS+TM Version 5.6 Generated: 4/16/2015 4:10 PM
Page 1 of 1Two-Way Stop Control
4/16/2015file://C:\Users\asells\AppData\Local\Temp\u2k7C49.tmp

TWO-WAY STOP CONTROL SUMMARY
General Information Site Information Analyst A SELLS Agency/Co. Date Performed 7/22/2015
Analysis Time PeriodAlt 1 Phase 2 NO RHL PM Peak
Intersection Jurisdiction Analysis Year 2030
Project Description East/West Street: US 119 North/South Street: Jefferson Road Intersection Orientation: North-South Study Period (hrs): 0.25
Vehicle Volumes and Adjustments Major Street Northbound Southbound Movement 1 2 3 4 5 6 L T R L T RVolume (veh/h) 45 975 311 Peak-Hour Factor, PHF 0.60 0.89 1.00 1.00 0.83 1.00 Hourly Flow Rate, HFR (veh/h) 74 1095 0 0 374 0
Percent Heavy Vehicles 4 -- -- 0 -- -- Median Type Undivided RT Channelized 0 0 Lanes 1 1 0 0 1 0 Configuration L T T Upstream Signal 0 1 Minor Street Eastbound Westbound Movement 7 8 9 10 11 12
L T R L T RVolume (veh/h) 79 157 Peak-Hour Factor, PHF 1.00 1.00 1.00 0.69 1.00 0.78 Hourly Flow Rate, HFR (veh/h)
0 0 0 114 0 201
Percent Heavy Vehicles 0 0 0 5 0 0 Percent Grade (%) 0 0 Flared Approach N N Storage 0 0 RT Channelized 0 0 Lanes 0 0 0 1 0 1 Configuration L R Delay, Queue Length, and Level of ServiceApproach Northbound Southbound Westbound Eastbound
Movement 1 4 7 8 9 10 11 12
Lane Configuration L L R v (veh/h) 74 114 201 C (m) (veh/h) 1186 83 262 v/c 0.06 1.37 0.77 95% queue length 0.20 8.76 5.67 Control Delay (s/veh) 8.2 316.4 52.9 LOS A F F Approach Delay (s/veh) -- -- 148.3 Approach LOS -- -- F
Copyright © 2010 University of Florida, All Rights Reserved HCS+TM Version 5.6 Generated: 7/28/2015 10:07 AM
Page 1 of 1Two-Way Stop Control
7/28/2015file://C:\Users\asells\AppData\Local\Temp\u2k47DB.tmp

Alt 1 Phase 2 RHL PM Peak Signalized

HCS 2010 Signalized Intersection Results Summary
General Information Intersection Information
Agency Duration, h 0.25
Analyst A SELLS Analysis Date Jul 22, 2015 Area Type Other
Jurisdiction Time Period ALT 1 PH 2 RHL PM
PHF 0.91
Urban Street MacCorkle Avenue Analysis Year 2030 Analysis Period 1> 4:30
Intersection MacCorkle Ave & Kenna … File Name Alt 1 Phase 2 RHL PM - MacCorkle.xus
Project Description
Demand Information EB WB NB SB
Approach Movement L T R L T R L T R L T R
Demand ( v ), veh/h 9 1488 31 93 2094 15 12 1 64 5 16 1
Signal Information
GreenYellowRed
2.3 2.3 89.6 10.8 0.0 0.03.0 4.0 4.0 4.0 0.0 0.01.0 1.0 2.0 1.0 0.0 0.0
1 2 3
5 6 7 8
Cycle, s 125.0 Reference Phase 2
Offset, s 0 Reference Point End
Uncoordinated No Simult. Gap E/W On
Force Mode Fixed Simult. Gap N/S On
Timer Results EBL EBT WBL WBT NBL NBT SBL SBT
Assigned Phase 1 6 5 2 4 8
Case Number 2.0 4.0 2.0 3.0 8.0 7.0
Phase Duration, s 6.3 95.6 13.6 102.9 15.8 15.8
Change Period, (Y+Rc), s 4.0 6.0 5.0 6.0 5.0 5.0
Max Allow Headway (MAH), s 3.1 0.0 3.1 0.0 3.3 3.3
Queue Clearance Time (gs), s 2.7 8.9 5.0 3.5
Green Extension Time (ge), s 0.0 0.0 0.1 0.0 0.1 0.1
Phase Call Probability 0.29 0.96 0.90 0.90
Max Out Probability 0.00 0.00 0.00 0.00
Movement Group Results EB WB NB SB
Approach Movement L T R L T R L T R L T R
Assigned Movement 1 6 16 5 2 12 7 4 14 3 8 18
Adjusted Flow Rate (v), veh/h 10 1117 552 95 2145 15 42 23 1
Adjusted Saturation Flow Rate (s), veh/h/ln 1727 1779 1759 1727 1693 1537 1538 1744 1537
Queue Service Time (gs), s 0.7 3.0 3.0 6.9 42.0 0.2 0.0 0.0 0.1
Cycle Queue Clearance Time (gc), s 0.7 3.0 3.0 6.9 42.0 0.2 3.0 1.5 0.1
Green Ratio (g/C) 0.02 0.72 0.72 0.07 0.78 0.78 0.09 0.09 0.09
Capacity (c), veh/h 32 2549 1261 119 2625 1191 171 186 133
Volume-to-Capacity Ratio (X) 0.308 0.438 0.438 0.798 0.817 0.013 0.245 0.124 0.008
Available Capacity (ca), veh/h 279 2549 1261 266 2625 1191 281 310 246
Back of Queue (Q), veh/ln (95th percentile) 0.6 1.4 1.8 5.4 12.1 0.1 2.3 1.2 0.1
Queue Storage Ratio (RQ) (95th percentile) 0.07 0.00 0.00 0.00 0.00 0.01 0.00 0.00 0.00
Uniform Delay (d1), s/veh 60.2 0.9 0.9 61.0 6.0 2.3 53.6 52.9 52.2
Incremental Delay (d2), s/veh 2.0 0.5 1.1 2.6 1.7 0.0 0.3 0.1 0.0
Initial Queue Delay (d3), s/veh 0.0 0.0 0.0 0.0 0.0 0.0 0.0 0.0 0.0
Control Delay (d), s/veh 62.1 1.4 2.0 63.6 7.7 2.3 53.8 53.0 52.2
Level of Service (LOS) E A A E A A D D D
Approach Delay, s/veh / LOS 1.9 A 10.0 B 53.8 D 52.9 D
Intersection Delay, s/veh / LOS 7.3 A
Multimodal Results EB WB NB SB
Pedestrian LOS Score / LOS 2.1 B 2.2 B 3.3 C 3.0 C
Bicycle LOS Score / LOS 1.4 A 2.5 B 0.6 A 0.5 A
Copyright © 2015 University of Florida, All Rights Reserved. HCS 2010™ Streets Version 6.70 Generated: 7/30/2015 4:19:04 PM

HCS 2010 Signalized Intersection Results Summary
General Information Intersection Information
Agency Duration, h 0.25
Analyst A SELLS Analysis Date Jul 22, 2015 Area Type Other
Jurisdiction Time Period ALT 1 PH 2 RHL PM
PHF 0.91
Urban Street MacCorkle Avenue Analysis Year 2030 Analysis Period 1> 4:30
Intersection MacCorkle Ave & I-64 EB File Name Alt 1 Phase 2 RHL PM - MacCorkle.xus
Project Description
Demand Information EB WB NB SB
Approach Movement L T R L T R L T R L T R
Demand ( v ), veh/h 988 1 2100 88 0
Signal Information
GreenYellowRed
0.2 100.7 9.1 0.0 0.0 0.04.0 4.0 4.0 0.0 0.0 0.01.0 1.0 1.0 0.0 0.0 0.0
1 2 3
5 6 7 8
Cycle, s 125.0 Reference Phase 2
Offset, s 0 Reference Point End
Uncoordinated No Simult. Gap E/W On
Force Mode Fixed Simult. Gap N/S On
Timer Results EBL EBT WBL WBT NBL NBT SBL SBT
Assigned Phase 6 5 2 4
Case Number 8.3 1.0 4.0 12.0
Phase Duration, s 105.7 5.2 110.9 14.1
Change Period, (Y+Rc), s 5.0 5.0 5.0 5.0
Max Allow Headway (MAH), s 0.0 3.1 0.0 3.1
Queue Clearance Time (gs), s 2.0 9.3
Green Extension Time (ge), s 0.0 0.0 0.0 0.1
Phase Call Probability 0.04 0.97
Max Out Probability 0.00 0.00
Movement Group Results EB WB NB SB
Approach Movement L T R L T R L T R L T R
Assigned Movement 6 5 2 7 4
Adjusted Flow Rate (v), veh/h 1711 1 2159 97
Adjusted Saturation Flow Rate (s), veh/h/ln 1727 1678 1677 1631
Queue Service Time (gs), s 25.1 0.0 34.8 7.3
Cycle Queue Clearance Time (gc), s 25.1 0.0 34.8 7.3
Green Ratio (g/C) 0.81 0.82 0.85 0.07
Capacity (c), veh/h 2783 227 2843 118
Volume-to-Capacity Ratio (X) 0.615 0.005 0.759 0.817
Available Capacity (ca), veh/h 2783 506 2843 261
Back of Queue (Q), veh/ln (95th percentile) 11.0 0.0 9.1 5.6
Queue Storage Ratio (RQ) (95th percentile) 0.00 0.00 0.00 0.00
Uniform Delay (d1), s/veh 5.1 4.9 4.2 57.1
Incremental Delay (d2), s/veh 0.9 0.0 0.7 5.1
Initial Queue Delay (d3), s/veh 0.0 0.0 0.0 0.0
Control Delay (d), s/veh 6.1 4.9 4.9 62.3
Level of Service (LOS) A A A E
Approach Delay, s/veh / LOS 6.1 A 4.9 A 62.3 E 0.0
Intersection Delay, s/veh / LOS 6.8 A
Multimodal Results EB WB NB SB
Pedestrian LOS Score / LOS 2.0 B 1.8 A 2.9 C 2.8 C
Bicycle LOS Score / LOS 1.4 A 2.4 B 0.6 A
Copyright © 2015 University of Florida, All Rights Reserved. HCS 2010™ Streets Version 6.70 Generated: 7/30/2015 4:19:04 PM

HCS 2010 Signalized Intersection Results Summary
General Information Intersection Information
Agency Duration, h 0.25
Analyst A SELLS Analysis Date Jul 22, 2015 Area Type Other
Jurisdiction Time Period ALT 1 PH 2 RHL PM
PHF 0.91
Urban Street MacCorkle Avenue Analysis Year 2030 Analysis Period 1> 4:30
Intersection MacCorkle Ave & Jeffers… File Name Alt 1 Phase 2 RHL PM - MacCorkle.xus
Project Description
Demand Information EB WB NB SB
Approach Movement L T R L T R L T R L T R
Demand ( v ), veh/h 30 742 692 90 1872 24 131 8 45 19 98
Signal Information
GreenYellowRed
4.2 1.5 76.1 12.1 10.0 0.04.0 0.0 4.0 4.0 4.0 0.01.0 0.0 2.0 1.0 1.0 0.0
1 2 3
5 6 7 8
Cycle, s 125.0 Reference Phase 2
Offset, s 0 Reference Point End
Uncoordinated No Simult. Gap E/W On
Force Mode Fixed Simult. Gap N/S On
Timer Results EBL EBT WBL WBT NBL NBT SBL SBT
Assigned Phase 1 6 5 2 4 8
Case Number 1.1 3.0 1.1 4.0 10.0 10.0
Phase Duration, s 9.2 82.1 10.8 83.6 17.1 15.0
Change Period, (Y+Rc), s 5.0 6.0 5.0 6.0 5.0 5.0
Max Allow Headway (MAH), s 3.1 0.0 3.1 0.0 3.1 3.4
Queue Clearance Time (gs), s 2.9 4.4 12.0 9.8
Green Extension Time (ge), s 0.0 0.0 0.1 0.0 0.2 0.3
Phase Call Probability 0.70 0.96 1.00 0.99
Max Out Probability 0.00 0.00 0.00 0.00
Movement Group Results EB WB NB SB
Approach Movement L T R L T R L T R L T R
Assigned Movement 1 6 16 5 2 12 7 4 3 8 18
Adjusted Flow Rate (v), veh/h 35 868 786 92 967 966 144 9 49 101
Adjusted Saturation Flow Rate (s), veh/h/ln 1727 1693 1568 1727 1779 1771 1762 1814 1762 1587
Queue Service Time (gs), s 0.9 11.7 41.0 2.4 52.3 52.8 10.0 0.5 3.3 7.8
Cycle Queue Clearance Time (gc), s 0.9 11.7 41.0 2.4 52.3 52.8 10.0 0.5 3.3 7.8
Green Ratio (g/C) 0.64 0.61 0.61 0.65 0.62 0.62 0.10 0.10 0.08 0.08
Capacity (c), veh/h 158 2062 955 464 1105 1100 171 176 141 127
Volume-to-Capacity Ratio (X) 0.222 0.421 0.823 0.198 0.875 0.879 0.843 0.050 0.350 0.794
Available Capacity (ca), veh/h 609 2062 955 1005 1105 1100 352 363 534 481
Back of Queue (Q), veh/ln (95th percentile) 0.9 6.2 16.6 1.6 20.1 20.2 7.9 0.4 2.6 5.8
Queue Storage Ratio (RQ) (95th percentile) 0.11 0.00 0.00 0.00 0.00 0.00 0.00 0.00 0.00 0.00
Uniform Delay (d1), s/veh 22.3 7.6 11.3 8.8 14.7 14.7 53.5 49.4 52.8 54.8
Incremental Delay (d2), s/veh 0.2 0.5 6.1 0.0 2.4 2.5 4.3 0.0 0.5 4.2
Initial Queue Delay (d3), s/veh 0.0 0.0 0.0 0.0 0.0 0.0 0.0 0.0 0.0 0.0
Control Delay (d), s/veh 22.5 8.1 17.4 8.8 17.0 17.2 57.8 49.4 53.3 59.0
Level of Service (LOS) C A B A B B E D D E
Approach Delay, s/veh / LOS 12.7 B 16.7 B 57.3 E 57.2 E
Intersection Delay, s/veh / LOS 18.1 B
Multimodal Results EB WB NB SB
Pedestrian LOS Score / LOS 2.2 B 2.3 B 2.9 C 3.0 C
Bicycle LOS Score / LOS 1.8 A 2.3 B 0.7 A 0.7 A
Copyright © 2015 University of Florida, All Rights Reserved. HCS 2010™ Streets Version 6.70 Generated: 7/30/2015 4:19:04 PM

HCS 2010 Signalized Intersection Results Summary
General Information Intersection Information
Agency Duration, h 0.25
Analyst A SELLS Analysis Date Jul 22, 2015 Area Type Other
Jurisdiction Time Period ALT 1 PH 2 RHL PM
PHF 0.91
Urban Street MacCorkle Avenue Analysis Year 2030 Analysis Period 1> 4:30
Intersection MacCorkle Ave & I-64 WB File Name Alt 1 Phase 2 RHL PM - MacCorkle.xus
Project Description
Demand Information EB WB NB SB
Approach Movement L T R L T R L T R L T R
Demand ( v ), veh/h 689 521 202 1298 688 0
Signal Information
GreenYellowRed
11.6 54.4 45.0 0.0 0.0 0.04.0 4.0 4.0 0.0 0.0 0.01.0 1.0 0.0 0.0 0.0 0.0
1 2 3
5 6 7 8
Cycle, s 125.0 Reference Phase 2
Offset, s 0 Reference Point End
Uncoordinated No Simult. Gap E/W On
Force Mode Fixed Simult. Gap N/S On
Timer Results EBL EBT WBL WBT NBL NBT SBL SBT
Assigned Phase 6 5 2 4
Case Number 7.3 1.0 4.0 10.0
Phase Duration, s 59.4 16.6 76.0 49.0
Change Period, (Y+Rc), s 5.0 5.0 5.0 4.0
Max Allow Headway (MAH), s 0.0 3.1 0.0 3.1
Queue Clearance Time (gs), s 11.3 47.0
Green Extension Time (ge), s 0.0 0.3 0.0 0.0
Phase Call Probability 1.00 1.00
Max Out Probability 0.00 1.00
Movement Group Results EB WB NB SB
Approach Movement L T R L T R L T R L T R
Assigned Movement 6 16 5 2 7 4
Adjusted Flow Rate (v), veh/h 510 341 222 1426 756 0
Adjusted Saturation Flow Rate (s), veh/h/ln 1693 1507 1616 1616 1662 1850
Queue Service Time (gs), s 8.3 13.9 9.3 32.5 45.0 0.0
Cycle Queue Clearance Time (gc), s 8.3 13.9 9.3 32.5 45.0 0.0
Green Ratio (g/C) 0.44 0.44 0.54 0.57 0.36 0.36
Capacity (c), veh/h 1475 656 513 1836 598 666
Volume-to-Capacity Ratio (X) 0.346 0.520 0.433 0.777 1.263 0.000
Available Capacity (ca), veh/h 1475 656 687 1836 598 666
Back of Queue (Q), veh/ln (95th percentile) 5.2 7.2 5.6 12.3 57.6 0.0
Queue Storage Ratio (RQ) (95th percentile) 0.00 0.00 0.00 0.00 3.25 0.00
Uniform Delay (d1), s/veh 13.5 13.4 15.1 10.5 40.0 0.0
Incremental Delay (d2), s/veh 0.6 2.7 0.2 3.3 131.6 0.0
Initial Queue Delay (d3), s/veh 0.0 0.0 0.0 0.0 0.0 0.0
Control Delay (d), s/veh 14.1 16.0 15.4 13.8 171.6 0.0
Level of Service (LOS) B B B B F
Approach Delay, s/veh / LOS 14.9 B 14.0 B 171.6 F 0.0
Intersection Delay, s/veh / LOS 50.8 D
Multimodal Results EB WB NB SB
Pedestrian LOS Score / LOS 2.3 B 1.9 A 2.9 C 3.0 C
Bicycle LOS Score / LOS 1.5 A 1.8 A 1.7 A
Copyright © 2015 University of Florida, All Rights Reserved. HCS 2010™ Streets Version 6.70 Generated: 7/30/2015 4:19:04 PM
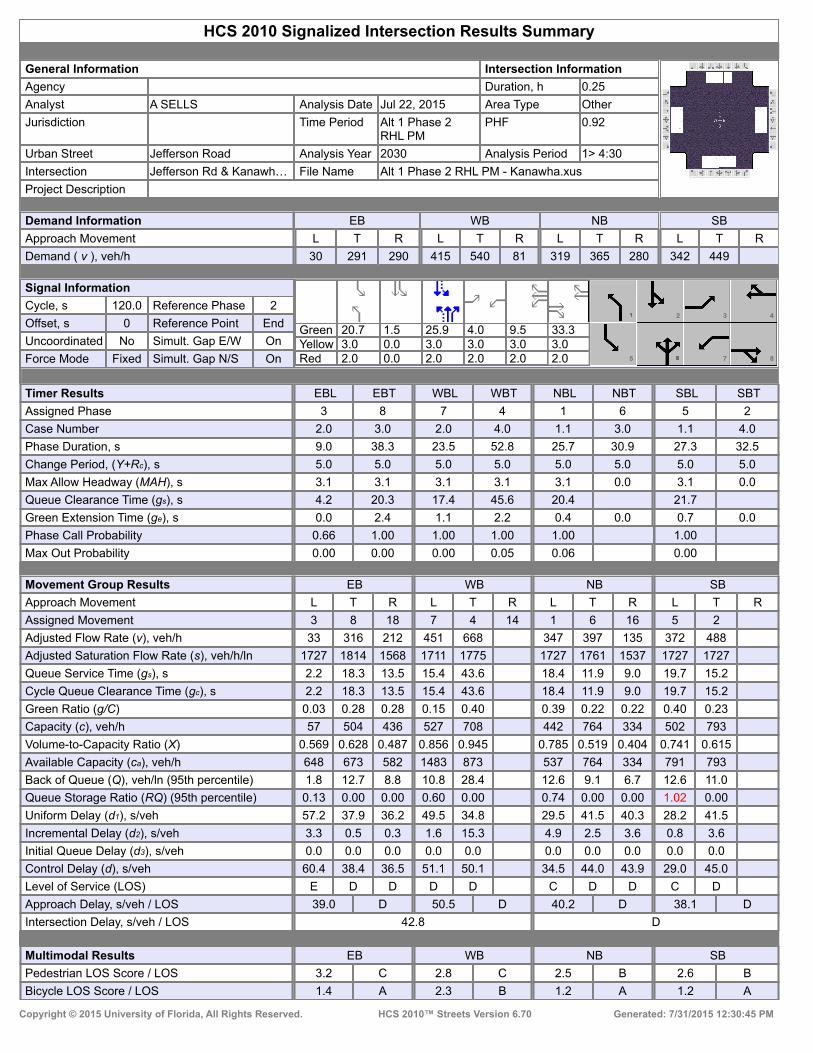
HCS 2010 Signalized Intersection Results Summary
General Information Intersection Information
Agency Duration, h 0.25
Analyst A SELLS Analysis Date Jul 22, 2015 Area Type Other
Jurisdiction Time Period Alt 1 Phase 2 RHL PM
PHF 0.92
Urban Street Jefferson Road Analysis Year 2030 Analysis Period 1> 4:30
Intersection Jefferson Rd & Kanawh… File Name Alt 1 Phase 2 RHL PM - Kanawha.xus
Project Description
Demand Information EB WB NB SB
Approach Movement L T R L T R L T R L T R
Demand ( v ), veh/h 30 291 290 415 540 81 319 365 280 342 449
Signal Information
GreenYellowRed
20.7 1.5 25.9 4.0 9.5 33.33.0 0.0 3.0 3.0 3.0 3.02.0 0.0 2.0 2.0 2.0 2.0
2 3 4
5 7 8
Cycle, s 120.0 Reference Phase 2
Offset, s 0 Reference Point End
Uncoordinated No Simult. Gap E/W On
Force Mode Fixed Simult. Gap N/S On
Timer Results EBL EBT WBL WBT NBL NBT SBL SBT
Assigned Phase 3 8 7 4 1 6 5 2
Case Number 2.0 3.0 2.0 4.0 1.1 3.0 1.1 4.0
Phase Duration, s 9.0 38.3 23.5 52.8 25.7 30.9 27.3 32.5
Change Period, (Y+Rc), s 5.0 5.0 5.0 5.0 5.0 5.0 5.0 5.0
Max Allow Headway (MAH), s 3.1 3.1 3.1 3.1 3.1 0.0 3.1 0.0
Queue Clearance Time (gs), s 4.2 20.3 17.4 45.6 20.4 21.7
Green Extension Time (ge), s 0.0 2.4 1.1 2.2 0.4 0.0 0.7 0.0
Phase Call Probability 0.66 1.00 1.00 1.00 1.00 1.00
Max Out Probability 0.00 0.00 0.00 0.05 0.06 0.00
Movement Group Results EB WB NB SB
Approach Movement L T R L T R L T R L T R
Assigned Movement 3 8 18 7 4 14 1 6 16 5 2
Adjusted Flow Rate (v), veh/h 33 316 212 451 668 347 397 135 372 488
Adjusted Saturation Flow Rate (s), veh/h/ln 1727 1814 1568 1711 1775 1727 1761 1537 1727 1727
Queue Service Time (gs), s 2.2 18.3 13.5 15.4 43.6 18.4 11.9 9.0 19.7 15.2
Cycle Queue Clearance Time (gc), s 2.2 18.3 13.5 15.4 43.6 18.4 11.9 9.0 19.7 15.2
Green Ratio (g/C) 0.03 0.28 0.28 0.15 0.40 0.39 0.22 0.22 0.40 0.23
Capacity (c), veh/h 57 504 436 527 708 442 764 334 502 793
Volume-to-Capacity Ratio (X) 0.569 0.628 0.487 0.856 0.945 0.785 0.519 0.404 0.741 0.615
Available Capacity (ca), veh/h 648 673 582 1483 873 537 764 334 791 793
Back of Queue (Q), veh/ln (95th percentile) 1.8 12.7 8.8 10.8 28.4 12.6 9.1 6.7 12.6 11.0
Queue Storage Ratio (RQ) (95th percentile) 0.13 0.00 0.00 0.60 0.00 0.74 0.00 0.00 1.02 0.00
Uniform Delay (d1), s/veh 57.2 37.9 36.2 49.5 34.8 29.5 41.5 40.3 28.2 41.5
Incremental Delay (d2), s/veh 3.3 0.5 0.3 1.6 15.3 4.9 2.5 3.6 0.8 3.6
Initial Queue Delay (d3), s/veh 0.0 0.0 0.0 0.0 0.0 0.0 0.0 0.0 0.0 0.0
Control Delay (d), s/veh 60.4 38.4 36.5 51.1 50.1 34.5 44.0 43.9 29.0 45.0
Level of Service (LOS) E D D D D C D D C D
Approach Delay, s/veh / LOS 39.0 D 50.5 D 40.2 D 38.1 D
Intersection Delay, s/veh / LOS 42.8 D
Multimodal Results EB WB NB SB
Pedestrian LOS Score / LOS 3.2 C 2.8 C 2.5 B 2.6 B
Bicycle LOS Score / LOS 1.4 A 2.3 B 1.2 A 1.2 A
Copyright © 2015 University of Florida, All Rights Reserved. HCS 2010™ Streets Version 6.70 Generated: 7/31/2015 12:30:45 PM

HCS 2010 Signalized Intersection Results Summary
General Information Intersection Information
Agency Duration, h 0.25
Analyst A SELLS Analysis Date Jul 22, 2015 Area Type Other
Jurisdiction Time Period Alt 1 Phase 2 RHL PM
PHF 0.92
Urban Street Jefferson Road Analysis Year 2030 Analysis Period 1> 4:30
Intersection Jefferson Rd & RHL Blvd File Name Alt 1 Phase 2 RHL PM - Jefferson & RHL.xus
Project Description
Demand Information EB WB NB SB
Approach Movement L T R L T R L T R L T R
Demand ( v ), veh/h 408 0 50 21 624 859 211
Signal Information
GreenYellowRed
77.0 33.0 0.0 0.0 0.0 0.03.0 3.0 0.0 0.0 0.0 0.02.0 2.0 0.0 0.0 0.0 0.0
1 2 3 4
5 7 8
Cycle, s 120.0 Reference Phase 2
Offset, s 0 Reference Point End
Uncoordinated No Simult. Gap E/W On
Force Mode Fixed Simult. Gap N/S On
Timer Results EBL EBT WBL WBT NBL NBT SBL SBT
Assigned Phase 8 6 2
Case Number 9.0 6.0 7.0
Phase Duration, s 38.0 82.0 82.0
Change Period, (Y+Rc), s 5.0 5.0 5.0
Max Allow Headway (MAH), s 3.1 0.0 0.0
Queue Clearance Time (gs), s 32.0
Green Extension Time (ge), s 1.0 0.0 0.0
Phase Call Probability 1.00
Max Out Probability 0.00
Movement Group Results EB WB NB SB
Approach Movement L T R L T R L T R L T R
Assigned Movement 3 8 18 1 6 2 12
Adjusted Flow Rate (v), veh/h 443 0 49 23 678 934 207
Adjusted Saturation Flow Rate (s), veh/h/ln 1727 1850 1537 597 1727 1727 1537
Queue Service Time (gs), s 30.0 0.0 2.9 2.3 10.5 15.9 6.7
Cycle Queue Clearance Time (gc), s 30.0 0.0 2.9 18.3 10.5 15.9 6.7
Green Ratio (g/C) 0.28 0.28 0.28 0.64 0.64 0.64 0.64
Capacity (c), veh/h 475 509 423 364 2216 2216 986
Volume-to-Capacity Ratio (X) 0.933 0.000 0.116 0.063 0.306 0.421 0.209
Available Capacity (ca), veh/h 1339 1434 1191 364 2216 2216 986
Back of Queue (Q), veh/ln (95th percentile) 18.8 0.0 1.9 0.6 6.7 9.6 3.9
Queue Storage Ratio (RQ) (95th percentile) 4.78 0.00 0.48 0.26 0.00 0.00 0.77
Uniform Delay (d1), s/veh 42.4 0.0 32.6 15.1 9.6 10.6 8.9
Incremental Delay (d2), s/veh 3.8 0.0 0.0 0.3 0.4 0.6 0.5
Initial Queue Delay (d3), s/veh 0.0 0.0 0.0 0.0 0.0 0.0 0.0
Control Delay (d), s/veh 46.2 0.0 32.6 15.4 9.9 11.2 9.4
Level of Service (LOS) D C B A B A
Approach Delay, s/veh / LOS 44.9 D 0.0 10.1 B 10.8 B
Intersection Delay, s/veh / LOS 17.8 B
Multimodal Results EB WB NB SB
Pedestrian LOS Score / LOS 2.9 C 2.9 C 1.9 A 2.4 B
Bicycle LOS Score / LOS 1.3 A 1.1 A 1.4 A
Copyright © 2015 University of Florida, All Rights Reserved. HCS 2010™ Streets Version 6.70 Generated: 7/27/2015 3:57:16 PM
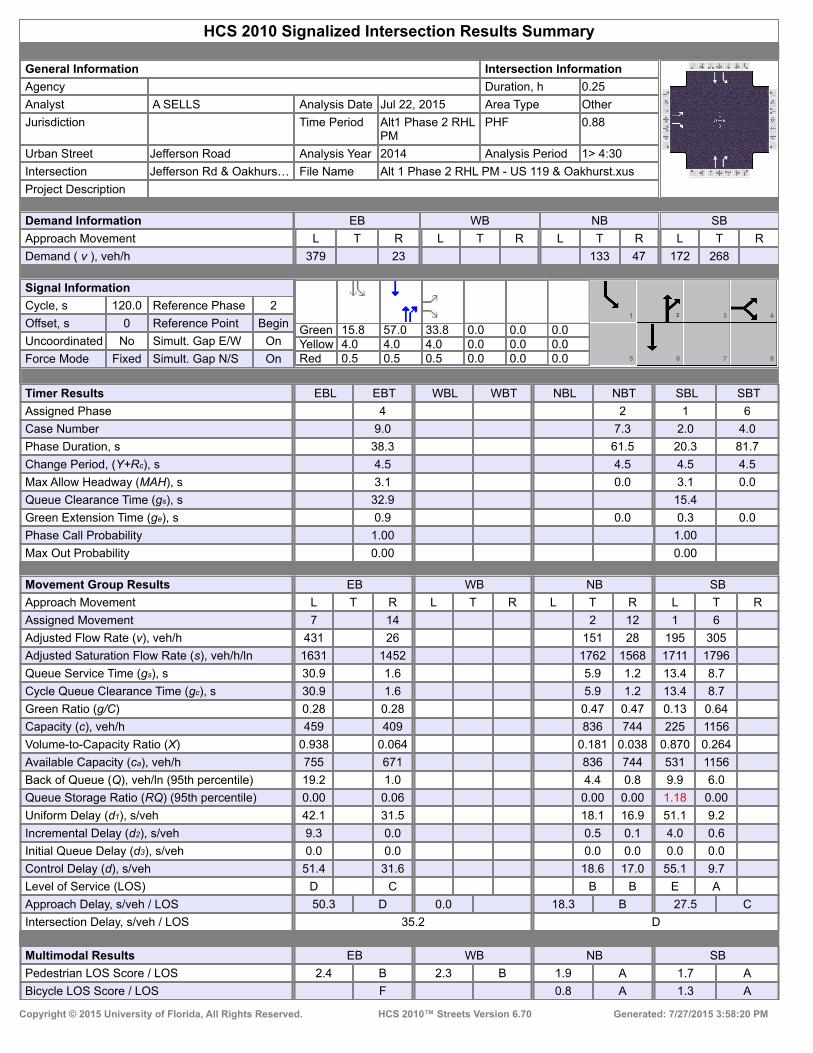
HCS 2010 Signalized Intersection Results Summary
General Information Intersection Information
Agency Duration, h 0.25
Analyst A SELLS Analysis Date Jul 22, 2015 Area Type Other
Jurisdiction Time Period Alt1 Phase 2 RHL PM
PHF 0.88
Urban Street Jefferson Road Analysis Year 2014 Analysis Period 1> 4:30
Intersection Jefferson Rd & Oakhurs… File Name Alt 1 Phase 2 RHL PM - US 119 & Oakhurst.xus
Project Description
Demand Information EB WB NB SB
Approach Movement L T R L T R L T R L T R
Demand ( v ), veh/h 379 23 133 47 172 268
Signal Information
GreenYellowRed
15.8 57.0 33.8 0.0 0.0 0.04.0 4.0 4.0 0.0 0.0 0.00.5 0.5 0.5 0.0 0.0 0.0
1 3 4
5 6 7 8
Cycle, s 120.0 Reference Phase 2
Offset, s 0 Reference Point Begin
Uncoordinated No Simult. Gap E/W On
Force Mode Fixed Simult. Gap N/S On
Timer Results EBL EBT WBL WBT NBL NBT SBL SBT
Assigned Phase 4 2 1 6
Case Number 9.0 7.3 2.0 4.0
Phase Duration, s 38.3 61.5 20.3 81.7
Change Period, (Y+Rc), s 4.5 4.5 4.5 4.5
Max Allow Headway (MAH), s 3.1 0.0 3.1 0.0
Queue Clearance Time (gs), s 32.9 15.4
Green Extension Time (ge), s 0.9 0.0 0.3 0.0
Phase Call Probability 1.00 1.00
Max Out Probability 0.00 0.00
Movement Group Results EB WB NB SB
Approach Movement L T R L T R L T R L T R
Assigned Movement 7 14 2 12 1 6
Adjusted Flow Rate (v), veh/h 431 26 151 28 195 305
Adjusted Saturation Flow Rate (s), veh/h/ln 1631 1452 1762 1568 1711 1796
Queue Service Time (gs), s 30.9 1.6 5.9 1.2 13.4 8.7
Cycle Queue Clearance Time (gc), s 30.9 1.6 5.9 1.2 13.4 8.7
Green Ratio (g/C) 0.28 0.28 0.47 0.47 0.13 0.64
Capacity (c), veh/h 459 409 836 744 225 1156
Volume-to-Capacity Ratio (X) 0.938 0.064 0.181 0.038 0.870 0.264
Available Capacity (ca), veh/h 755 671 836 744 531 1156
Back of Queue (Q), veh/ln (95th percentile) 19.2 1.0 4.4 0.8 9.9 6.0
Queue Storage Ratio (RQ) (95th percentile) 0.00 0.06 0.00 0.00 1.18 0.00
Uniform Delay (d1), s/veh 42.1 31.5 18.1 16.9 51.1 9.2
Incremental Delay (d2), s/veh 9.3 0.0 0.5 0.1 4.0 0.6
Initial Queue Delay (d3), s/veh 0.0 0.0 0.0 0.0 0.0 0.0
Control Delay (d), s/veh 51.4 31.6 18.6 17.0 55.1 9.7
Level of Service (LOS) D C B B E A
Approach Delay, s/veh / LOS 50.3 D 0.0 18.3 B 27.5 C
Intersection Delay, s/veh / LOS 35.2 D
Multimodal Results EB WB NB SB
Pedestrian LOS Score / LOS 2.4 B 2.3 B 1.9 A 1.7 A
Bicycle LOS Score / LOS F 0.8 A 1.3 A
Copyright © 2015 University of Florida, All Rights Reserved. HCS 2010™ Streets Version 6.70 Generated: 7/27/2015 3:58:20 PM

Alt 1 Phase 2 No RHL AM Peak Unsignalized

TWO-WAY STOP CONTROL SUMMARY
General Information Site Information Analyst ASELLS Agency/Co. STANTEC Date Performed 11/25/2014 Analysis Time Period Alt 1 Phase 2 No RHL AM
Intersection Jurisdiction Analysis Year 2030
Project Description East/West Street: Bob Evans entrance North/South Street: Jefferson Road Intersection Orientation: North-South Study Period (hrs): 0.25
Vehicle Volumes and Adjustments Major Street Northbound Southbound Movement 1 2 3 4 5 6 L T R L T RVolume (veh/h) 5 438 768 25 Peak-Hour Factor, PHF 0.45 0.87 1.00 1.00 0.86 0.63 Hourly Flow Rate, HFR (veh/h)
11 503 0 0 893 39
Percent Heavy Vehicles 2 -- -- 0 -- -- Median Type Undivided RT Channelized 0 0 Lanes 0 2 0 0 2 0 Configuration LT T T TR Upstream Signal 1 0 Minor Street Eastbound Westbound Movement 7 8 9 10 11 12
L T R L T RVolume (veh/h) 10 10 Peak-Hour Factor, PHF 0.90 1.00 0.69 1.00 1.00 1.00 Hourly Flow Rate, HFR (veh/h) 11 0 14 0 0 0
Percent Heavy Vehicles 2 0 2 0 0 0 Percent Grade (%) 0 0 Flared Approach N N Storage 0 0 RT Channelized 0 0 Lanes 1 0 1 0 0 0 Configuration L R Delay, Queue Length, and Level of ServiceApproach Northbound Southbound Westbound Eastbound
Movement 1 4 7 8 9 10 11 12
Lane Configuration LT L R v (veh/h) 11 11 14 C (m) (veh/h) 728 186 594 v/c 0.02 0.06 0.02 95% queue length 0.05 0.19 0.07 Control Delay (s/veh) 10.0 25.6 11.2 LOS B D B Approach Delay (s/veh) -- -- 17.5 Approach LOS -- -- C
Copyright © 2010 University of Florida, All Rights Reserved HCS+TM Version 5.6 Generated: 4/16/2015 3:32 PM
Page 1 of 1Two-Way Stop Control
4/16/2015file://C:\Users\asells\AppData\Local\Temp\u2k3E01.tmp

TWO-WAY STOP CONTROL SUMMARY
General Information Site Information Analyst ASELLS Agency/Co. STANTEC Date Performed 11/25/2014 Analysis Time Period Alt 1 Phase 2 No RHL AM
Intersection Jurisdiction Analysis Year 2030
Project Description East/West Street: McDonalds entrance North/South Street: Jefferson Road Intersection Orientation: North-South Study Period (hrs): 0.25
Vehicle Volumes and Adjustments Major Street Northbound Southbound Movement 1 2 3 4 5 6 L T R L T RVolume (veh/h) 30 438 768 85 Peak-Hour Factor, PHF 0.83 0.87 1.00 1.00 0.88 0.83 Hourly Flow Rate, HFR (veh/h)
36 503 0 0 872 102
Percent Heavy Vehicles 2 -- -- 0 -- -- Median Type Undivided RT Channelized 0 0 Lanes 0 2 0 0 2 0 Configuration LT T T TR Upstream Signal 0 0 Minor Street Eastbound Westbound Movement 7 8 9 10 11 12
L T R L T RVolume (veh/h) 5 5 Peak-Hour Factor, PHF 0.50 1.00 0.25 1.00 1.00 1.00 Hourly Flow Rate, HFR (veh/h) 10 0 20 0 0 0
Percent Heavy Vehicles 2 0 2 0 0 0 Percent Grade (%) 0 0 Flared Approach N N Storage 0 0 RT Channelized 0 0 Lanes 1 0 1 0 0 0 Configuration L R Delay, Queue Length, and Level of ServiceApproach Northbound Southbound Westbound Eastbound
Movement 1 4 7 8 9 10 11 12
Lane Configuration LT L R v (veh/h) 36 10 20 C (m) (veh/h) 702 157 578 v/c 0.05 0.06 0.03 95% queue length 0.16 0.20 0.11 Control Delay (s/veh) 10.4 29.5 11.5 LOS B D B Approach Delay (s/veh) -- -- 17.5 Approach LOS -- -- C
Copyright © 2010 University of Florida, All Rights Reserved HCS+TM Version 5.6 Generated: 4/16/2015 3:33 PM
Page 1 of 1Two-Way Stop Control
4/16/2015file://C:\Users\asells\AppData\Local\Temp\u2k33C4.tmp

TWO-WAY STOP CONTROL SUMMARY
General Information Site Information Analyst ASELLS Agency/Co. STANTEC Date Performed 11/25/2014 Analysis Time Period Alt 1 Phase 2 No RHL AM
Intersection Jurisdiction Analysis Year 2030
Project Description East/West Street: Community Center - North North/South Street: Jefferson Road Intersection Orientation: North-South Study Period (hrs): 0.25
Vehicle Volumes and Adjustments Major Street Northbound Southbound Movement 1 2 3 4 5 6 L T R L T RVolume (veh/h) 1 433 760 8 Peak-Hour Factor, PHF 0.50 0.77 1.00 1.00 0.82 0.47 Hourly Flow Rate, HFR (veh/h)
2 562 0 0 926 17
Percent Heavy Vehicles 2 -- -- 0 -- -- Median Type Undivided RT Channelized 0 0 Lanes 0 2 0 0 2 0 Configuration LT T T TR Upstream Signal 0 0 Minor Street Eastbound Westbound Movement 7 8 9 10 11 12
L T R L T RVolume (veh/h) 5 0 2 Peak-Hour Factor, PHF 0.46 1.00 0.58 1.00 1.00 1.00 Hourly Flow Rate, HFR (veh/h) 10 0 3 0 0 0
Percent Heavy Vehicles 2 0 2 0 0 0 Percent Grade (%) 0 0 Flared Approach N N Storage 0 0 RT Channelized 0 0 Lanes 0 1 0 0 0 0 Configuration LTR Delay, Queue Length, and Level of ServiceApproach Northbound Southbound Westbound Eastbound
Movement 1 4 7 8 9 10 11 12
Lane Configuration LT LTR v (veh/h) 2 13 C (m) (veh/h) 721 205 v/c 0.00 0.06 95% queue length 0.01 0.20 Control Delay (s/veh) 10.0 23.7 LOS B C Approach Delay (s/veh) -- -- 23.7 Approach LOS -- -- C
Copyright © 2010 University of Florida, All Rights Reserved HCS+TM Version 5.6 Generated: 4/16/2015 3:38 PM
Page 1 of 1Two-Way Stop Control
4/16/2015file://C:\Users\asells\AppData\Local\Temp\u2k3B72.tmp

TWO-WAY STOP CONTROL SUMMARY
General Information Site Information Analyst ASELLS Agency/Co. STANTEC Date Performed 11/25/2014 Analysis Time Period Alt 1 Phase 2 No RHL AM
IntersectionJurisdictionAnalysis Year 2030
Project Description East/West Street: Community Center - South North/South Street: Jefferson Road Intersection Orientation: North-South Study Period (hrs): 0.25
Vehicle Volumes and Adjustments Major Street Northbound Southbound Movement 1 2 3 4 5 6
L T R L T RVolume (veh/h) 1 430 760 2 Peak-Hour Factor, PHF 0.67 0.81 1.00 1.00 0.91 0.25 Hourly Flow Rate, HFR (veh/h)
1 530 0 0 835 8
Percent Heavy Vehicles 2 -- -- 0 -- -- Median Type Raised curb RT Channelized 0 0 Lanes 0 2 0 0 2 0 Configuration LT T T TR Upstream Signal 0 0 Minor Street Eastbound Westbound Movement 7 8 9 10 11 12
L T R L T RVolume (veh/h) 4 2 Peak-Hour Factor, PHF 0.33 1.00 0.71 1.00 1.00 1.00 Hourly Flow Rate, HFR (veh/h) 12 0 2 0 0 0
Percent Heavy Vehicles 2 0 2 0 0 0 Percent Grade (%) 0 0 Flared Approach N N Storage 0 0 RT Channelized 0 0 Lanes 0 1 0 0 0 0 Configuration Delay, Queue Length, and Level of ServiceApproach Northbound Southbound Westbound Eastbound
Movement 1 4 7 8 9 10 11 12
Lane Configuration LT v (veh/h) 1 C (m) (veh/h) 787 v/c 0.00 95% queue length 0.00 Control Delay (s/veh) 9.6 LOS A Approach Delay (s/veh) -- -- 14.4 Approach LOS -- -- B
Copyright © 2010 University of Florida, All Rights Reserved HCS+TM Version 5.6 Generated: 4/16/2015 3:38 PM
Page 1 of 1Two-Way Stop Control
4/16/2015file://C:\Users\asells\AppData\Local\Temp\u2kCA77.tmp

TWO-WAY STOP CONTROL SUMMARY
General Information Site Information Analyst A SELLS Agency/Co. STANTEC Date Performed 11/25/2014 Analysis Time Period Alt 1 Phase 2 No RHL AM
Intersection Jurisdiction Analysis Year 2030
Project Description East/West Street: Washington Street North/South Street: Jefferson Road Intersection Orientation: North-South Study Period (hrs): 0.25
Vehicle Volumes and Adjustments Major Street Northbound Southbound Movement 1 2 3 4 5 6 L T R L T RVolume (veh/h) 415 1 12 750 Peak-Hour Factor, PHF 1.00 0.80 0.92 0.69 0.91 1.00 Hourly Flow Rate, HFR (veh/h)
0 518 1 17 824 0
Percent Heavy Vehicles 0 -- -- 2 -- -- Median Type Raised curb RT Channelized 0 0 Lanes 0 2 0 0 2 0 Configuration T TR LT T Upstream Signal 0 0 Minor Street Eastbound Westbound Movement 7 8 9 10 11 12
L T R L T RVolume (veh/h) 3 0 16 Peak-Hour Factor, PHF 1.00 1.00 1.00 0.73 1.00 0.85 Hourly Flow Rate, HFR (veh/h) 0 0 0 4 0 18
Percent Heavy Vehicles 0 0 0 2 0 2 Percent Grade (%) 0 0 Flared Approach N N Storage 0 0 RT Channelized 0 0 Lanes 0 0 0 0 1 0 Configuration LTR Delay, Queue Length, and Level of ServiceApproach Northbound Southbound Westbound Eastbound
Movement 1 4 7 8 9 10 11 12
Lane Configuration LT LTR v (veh/h) 17 22 C (m) (veh/h) 1031 698 v/c 0.02 0.03 95% queue length 0.05 0.10 Control Delay (s/veh) 8.6 10.3 LOS A B Approach Delay (s/veh) -- -- 10.3 Approach LOS -- -- B
Copyright © 2010 University of Florida, All Rights Reserved HCS+TM Version 5.6 Generated: 4/16/2015 3:35 PM
Page 1 of 1Two-Way Stop Control
4/16/2015file://C:\Users\asells\AppData\Local\Temp\u2kABC1.tmp

TWO-WAY STOP CONTROL SUMMARY
General Information Site Information Analyst A SELLS Agency/Co. STANTEC Date Performed 11/25/2014 Analysis Time Period Alt 1 Phase 2 No RHL AM
IntersectionJurisdictionAnalysis Year 2030
North/South Street: Jefferson Road Project Description East/West Street: Pennslyvania AveIntersection Orientation: North-South Study Period (hrs): 0.25
Vehicle Volumes and Adjustments Major Street Northbound Southbound Movement 1 2 3 4 5 6
L T R L T RVolume (veh/h) 412 2 1 639 Peak-Hour Factor, PHF 1.00 0.83 1.00 0.50 0.97 1.00 Hourly Flow Rate, HFR (veh/h)
0 496 2 2 658 0
Percent Heavy Vehicles 0 -- -- 2 -- -- Median Type Undivided RT Channelized 0 0 Lanes 0 2 0 0 2 0 Configuration T TR LT T Upstream Signal 0 1 Minor Street Eastbound Westbound Movement 7 8 9 10 11 12
L T R L T RVolume (veh/h) 2 0 4 Peak-Hour Factor, PHF 1.00 1.00 1.00 1.00 1.00 0.65 Hourly Flow Rate, HFR (veh/h) 0 0 0 2 0 6
Percent Heavy Vehicles 0 0 0 2 0 2 Percent Grade (%) 0 0 Flared Approach N N Storage 0 0 RT Channelized 0 0 Lanes 0 0 0 0 1 0 Configuration LTR Delay, Queue Length, and Level of ServiceApproach Northbound Southbound Westbound Eastbound
Movement 1 4 7 8 9 10 11 12
Lane Configuration LT LTR v (veh/h) 2 8 C (m) (veh/h) 1062 680 v/c 0.00 0.01 95% queue length 0.01 0.04 Control Delay (s/veh) 8.4 10.4 LOS A B Approach Delay (s/veh) -- -- 10.4 Approach LOS -- -- B
Copyright © 2010 University of Florida, All Rights Reserved HCS+TM Version 5.6 Generated: 7/31/2015 1:38 PM
Page 1 of 1Two-Way Stop Control
7/31/2015file://C:\Users\asells\AppData\Local\Temp\u2k3C5A.tmp
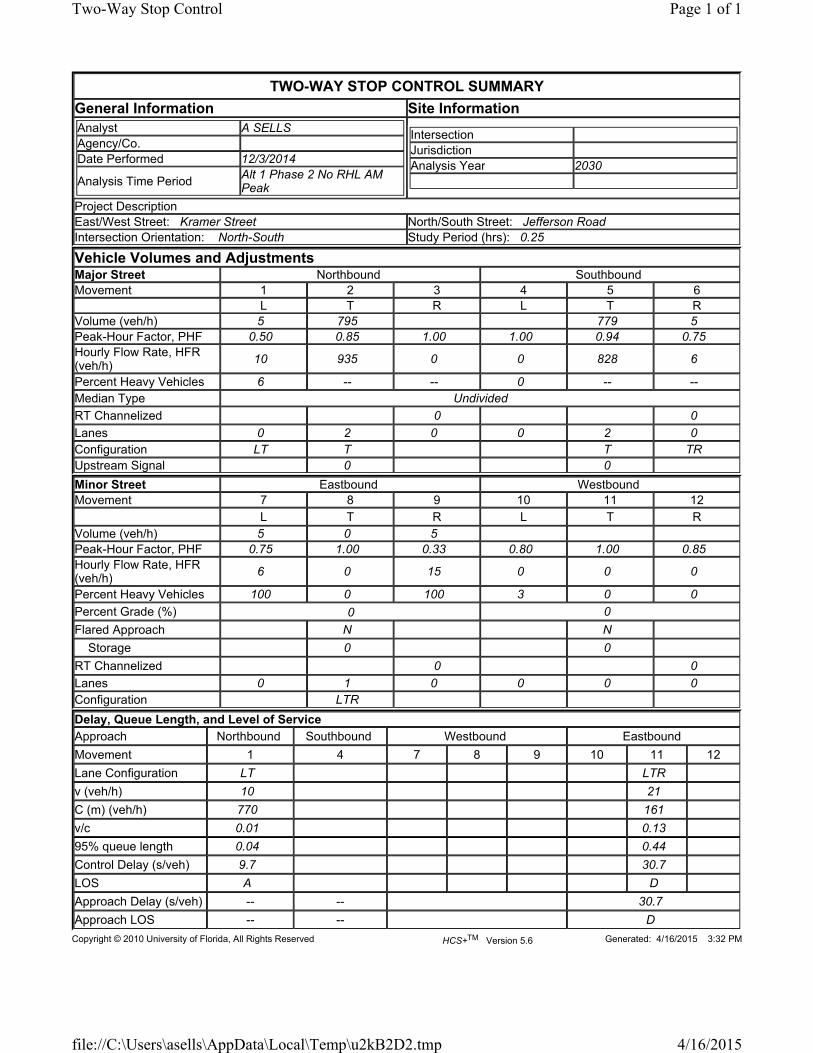
TWO-WAY STOP CONTROL SUMMARY
General Information Site Information Analyst A SELLS Agency/Co. Date Performed 12/3/2014
Analysis Time PeriodAlt 1 Phase 2 No RHL AM Peak
Intersection Jurisdiction Analysis Year 2030
Project Description East/West Street: Kramer Street North/South Street: Jefferson Road Intersection Orientation: North-South Study Period (hrs): 0.25
Vehicle Volumes and Adjustments Major Street Northbound Southbound Movement 1 2 3 4 5 6 L T R L T RVolume (veh/h) 5 795 779 5 Peak-Hour Factor, PHF 0.50 0.85 1.00 1.00 0.94 0.75 Hourly Flow Rate, HFR (veh/h) 10 935 0 0 828 6
Percent Heavy Vehicles 6 -- -- 0 -- -- Median Type Undivided RT Channelized 0 0 Lanes 0 2 0 0 2 0 Configuration LT T T TR Upstream Signal 0 0 Minor Street Eastbound Westbound Movement 7 8 9 10 11 12
L T R L T RVolume (veh/h) 5 0 5 Peak-Hour Factor, PHF 0.75 1.00 0.33 0.80 1.00 0.85 Hourly Flow Rate, HFR (veh/h)
6 0 15 0 0 0
Percent Heavy Vehicles 100 0 100 3 0 0 Percent Grade (%) 0 0 Flared Approach N N Storage 0 0 RT Channelized 0 0 Lanes 0 1 0 0 0 0 Configuration LTR Delay, Queue Length, and Level of ServiceApproach Northbound Southbound Westbound Eastbound
Movement 1 4 7 8 9 10 11 12
Lane Configuration LT LTR v (veh/h) 10 21 C (m) (veh/h) 770 161 v/c 0.01 0.13 95% queue length 0.04 0.44 Control Delay (s/veh) 9.7 30.7 LOS A D Approach Delay (s/veh) -- -- 30.7 Approach LOS -- -- D
Copyright © 2010 University of Florida, All Rights Reserved HCS+TM Version 5.6 Generated: 4/16/2015 3:32 PM
Page 1 of 1Two-Way Stop Control
4/16/2015file://C:\Users\asells\AppData\Local\Temp\u2kB2D2.tmp
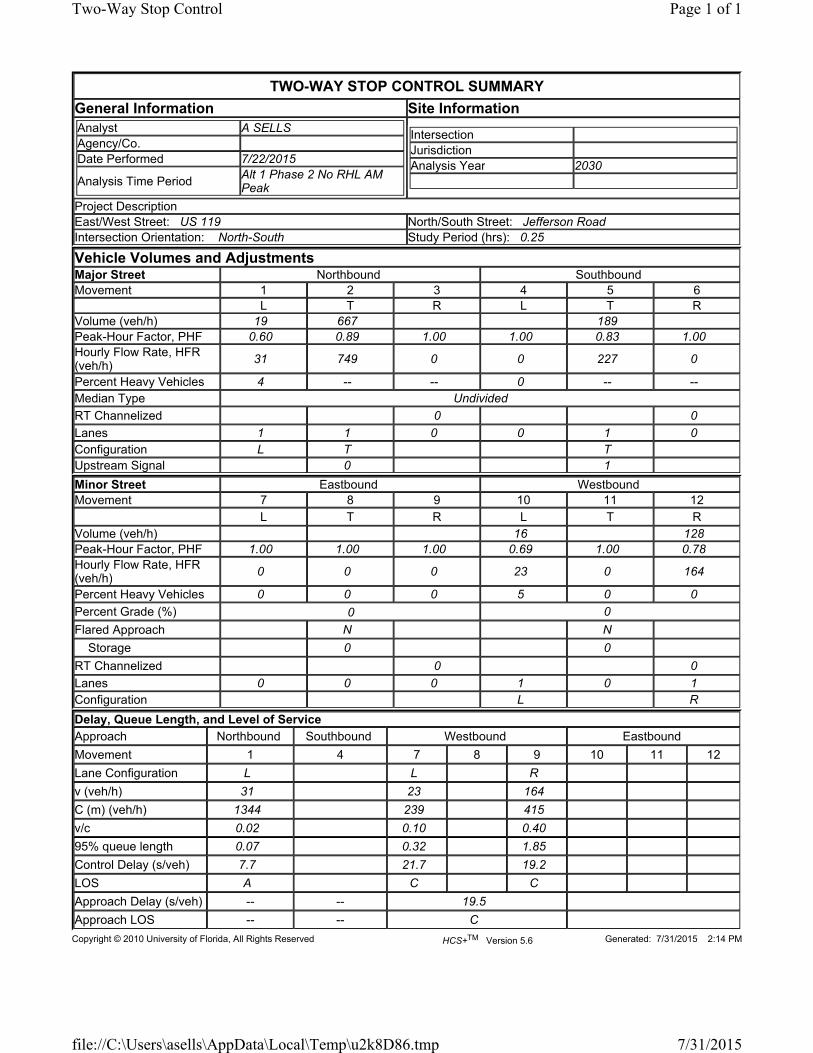
TWO-WAY STOP CONTROL SUMMARY
General Information Site Information Analyst A SELLS Agency/Co.Date Performed 7/22/2015
Analysis Time PeriodAlt 1 Phase 2 No RHL AM Peak
IntersectionJurisdictionAnalysis Year 2030
Project Description East/West Street: US 119 North/South Street: Jefferson Road Intersection Orientation: North-South Study Period (hrs): 0.25
Vehicle Volumes and Adjustments Major Street Northbound Southbound Movement 1 2 3 4 5 6
L T R L T RVolume (veh/h) 19 667 189 Peak-Hour Factor, PHF 0.60 0.89 1.00 1.00 0.83 1.00 Hourly Flow Rate, HFR (veh/h) 31 749 0 0 227 0
Percent Heavy Vehicles 4 -- -- 0 -- -- Median Type Undivided RT Channelized 0 0 Lanes 1 1 0 0 1 0 Configuration L T T Upstream Signal 0 1 Minor Street Eastbound Westbound Movement 7 8 9 10 11 12
L T R L T RVolume (veh/h) 16 128 Peak-Hour Factor, PHF 1.00 1.00 1.00 0.69 1.00 0.78 Hourly Flow Rate, HFR (veh/h)
0 0 0 23 0 164
Percent Heavy Vehicles 0 0 0 5 0 0 Percent Grade (%) 0 0 Flared Approach N N Storage 0 0 RT Channelized 0 0 Lanes 0 0 0 1 0 1 Configuration L R Delay, Queue Length, and Level of ServiceApproach Northbound Southbound Westbound Eastbound
Movement 1 4 7 8 9 10 11 12
Lane Configuration L L R v (veh/h) 31 23 164 C (m) (veh/h) 1344 239 415 v/c 0.02 0.10 0.40 95% queue length 0.07 0.32 1.85 Control Delay (s/veh) 7.7 21.7 19.2 LOS A C C Approach Delay (s/veh) -- -- 19.5 Approach LOS -- -- C
Copyright © 2010 University of Florida, All Rights Reserved HCS+TM Version 5.6 Generated: 7/31/2015 2:14 PM
Page 1 of 1Two-Way Stop Control
7/31/2015file://C:\Users\asells\AppData\Local\Temp\u2k8D86.tmp

Alt 1 Phase 2 No RHL AM Peak Signalized

HCS 2010 Signalized Intersection Results Summary
General Information Intersection Information
Agency Duration, h 0.25
Analyst A SELLS Analysis Date Jul 22, 2015 Area Type Other
Jurisdiction Time Period ALT 1 PH 2 No RHL AM
PHF 0.91
Urban Street MacCorkle Avenue Analysis Year 2030 Analysis Period 1> 7:30
Intersection Kenna Drive File Name Alt 1 Phase 2 No RHL AM - MacCorkle.xus
Project Description
Demand Information EB WB NB SB
Approach Movement L T R L T R L T R L T R
Demand ( v ), veh/h 14 1841 1 31 1021 15 8 1 68 1 0 0
Signal Information
GreenYellowRed
3.8 108.4 7.0 10.8 0.0 0.03.0 4.0 4.0 4.0 0.0 0.01.0 2.0 1.0 1.0 0.0 0.0
1 2 3
5 6 7 8
Cycle, s 150.0 Reference Phase 2
Offset, s 0 Reference Point End
Uncoordinated No Simult. Gap E/W On
Force Mode Fixed Simult. Gap N/S On
Timer Results EBL EBT WBL WBT NBL NBT SBL SBT
Assigned Phase 1 6 5 2 4 8
Case Number 2.0 4.0 2.0 3.0 8.0 7.0
Phase Duration, s 7.8 122.2 12.0 126.4 15.8 15.8
Change Period, (Y+Rc), s 4.0 6.0 6.0 6.0 5.0 5.0
Max Allow Headway (MAH), s 3.1 0.0 3.1 0.0 3.4 3.4
Queue Clearance Time (gs), s 3.3 4.8 7.0 2.1
Green Extension Time (ge), s 0.0 0.0 1.2 0.0 0.0 0.1
Phase Call Probability 0.47 0.75 0.90 0.90
Max Out Probability 0.00 0.97 0.00 0.00
Movement Group Results EB WB NB SB
Approach Movement L T R L T R L T R L T R
Assigned Movement 1 6 16 5 2 12 7 4 14 3 8 18
Adjusted Flow Rate (v), veh/h 15 2023 0 33 1098 16 55 1 0
Adjusted Saturation Flow Rate (s), veh/h/ln 1727 1814 0 1727 1693 1537 1547 1350 1537
Queue Service Time (gs), s 1.3 0.0 0.0 2.8 12.9 0.2 0.2 0.0 0.0
Cycle Queue Clearance Time (gc), s 1.3 0.0 0.0 2.8 12.9 0.2 5.0 0.1 0.0
Green Ratio (g/C) 0.03 0.77 0.04 0.80 0.80 0.07 0.07 0.07
Capacity (c), veh/h 44 4214 69 2718 1233 140 146 111
Volume-to-Capacity Ratio (X) 0.353 0.480 0.000 0.482 0.404 0.013 0.393 0.008 0.000
Available Capacity (ca), veh/h 186 4214 92 2718 1233 202 201 174
Back of Queue (Q), veh/ln (95th percentile) 1.1 0.3 0.0 2.3 6.4 0.1 3.7 0.1 0.0
Queue Storage Ratio (RQ) (95th percentile) 0.13 0.00 0.00 0.00 0.00 0.02 0.00 0.00 0.00
Uniform Delay (d1), s/veh 71.3 0.0 70.4 3.8 2.3 66.9 64.6 0.0
Incremental Delay (d2), s/veh 1.8 0.4 0.0 1.8 0.4 0.0 0.7 0.0 0.0
Initial Queue Delay (d3), s/veh 0.0 0.0 0.0 0.0 0.0 0.0 0.0 0.0 0.0
Control Delay (d), s/veh 73.1 0.4 72.1 4.2 2.4 67.5 64.6 0.0
Level of Service (LOS) E A E A A E E
Approach Delay, s/veh / LOS 0.9 A 6.1 A 67.5 E 64.6 E
Intersection Delay, s/veh / LOS 3.9 A
Multimodal Results EB WB NB SB
Pedestrian LOS Score / LOS 2.2 B 2.2 B 3.3 C 3.0 C
Bicycle LOS Score / LOS 1.6 A 1.5 A 0.6 A 0.5 A
Copyright © 2015 University of Florida, All Rights Reserved. HCS 2010™ Streets Version 6.70 Generated: 7/30/2015 4:30:49 PM

HCS 2010 Signalized Intersection Results Summary
General Information Intersection Information
Agency Duration, h 0.25
Analyst A SELLS Analysis Date Jul 22, 2015 Area Type Other
Jurisdiction Time Period ALT 1 PH 2 No RHL AM
PHF 0.91
Urban Street MacCorkle Avenue Analysis Year 2030 Analysis Period 1> 7:30
Intersection I-64 EB File Name Alt 1 Phase 2 No RHL AM - MacCorkle.xus
Project Description
Demand Information EB WB NB SB
Approach Movement L T R L T R L T R L T R
Demand ( v ), veh/h 1102 26 967 106 0
Signal Information
GreenYellowRed
4.1 118.3 12.6 0.0 0.0 0.04.0 4.0 4.0 0.0 0.0 0.01.0 1.0 1.0 0.0 0.0 0.0
1 2 3
5 6 7 8
Cycle, s 150.0 Reference Phase 2
Offset, s 0 Reference Point End
Uncoordinated No Simult. Gap E/W On
Force Mode Fixed Simult. Gap N/S On
Timer Results EBL EBT WBL WBT NBL NBT SBL SBT
Assigned Phase 6 5 2 4
Case Number 8.3 1.0 4.0 12.0
Phase Duration, s 123.3 9.1 132.4 17.6
Change Period, (Y+Rc), s 5.0 5.0 5.0 5.0
Max Allow Headway (MAH), s 0.0 3.1 0.0 3.1
Queue Clearance Time (gs), s 2.4 12.6
Green Extension Time (ge), s 0.0 0.0 0.0 0.1
Phase Call Probability 0.68 0.99
Max Out Probability 0.00 0.00
Movement Group Results EB WB NB SB
Approach Movement L T R L T R L T R L T R
Assigned Movement 6 5 2 7 4
Adjusted Flow Rate (v), veh/h 2099 28 1031 116
Adjusted Saturation Flow Rate (s), veh/h/ln 1727 1678 1677 1631
Queue Service Time (gs), s 22.7 0.4 7.2 10.6
Cycle Queue Clearance Time (gc), s 22.7 0.4 7.2 10.6
Green Ratio (g/C) 0.79 0.83 0.85 0.08
Capacity (c), veh/h 2724 214 2850 137
Volume-to-Capacity Ratio (X) 0.770 0.129 0.362 0.853
Available Capacity (ca), veh/h 2724 364 2850 218
Back of Queue (Q), veh/ln (95th percentile) 5.6 0.2 2.7 8.3
Queue Storage Ratio (RQ) (95th percentile) 0.00 0.04 0.00 0.00
Uniform Delay (d1), s/veh 1.9 4.7 1.6 67.8
Incremental Delay (d2), s/veh 1.9 0.1 0.3 9.7
Initial Queue Delay (d3), s/veh 0.0 0.0 0.0 0.0
Control Delay (d), s/veh 3.8 4.8 1.9 77.5
Level of Service (LOS) A A A E
Approach Delay, s/veh / LOS 3.8 A 2.0 A 77.5 E 0.0
Intersection Delay, s/veh / LOS 5.8 A
Multimodal Results EB WB NB SB
Pedestrian LOS Score / LOS 2.0 B 1.8 A 2.9 C 2.8 C
Bicycle LOS Score / LOS 1.5 A 1.4 A 0.7 A
Copyright © 2015 University of Florida, All Rights Reserved. HCS 2010™ Streets Version 6.70 Generated: 7/30/2015 4:30:49 PM

HCS 2010 Signalized Intersection Results Summary
General Information Intersection Information
Agency Duration, h 0.25
Analyst A SELLS Analysis Date Jul 22, 2015 Area Type Other
Jurisdiction Time Period ALT 1 PH 2 No RHL AM
PHF 0.91
Urban Street MacCorkle Avenue Analysis Year 2030 Analysis Period 1> 7:30
Intersection Jefferson Road File Name Alt 1 Phase 2 No RHL AM - MacCorkle.xus
Project Description
Demand Information EB WB NB SB
Approach Movement L T R L T R L T R L T R
Demand ( v ), veh/h 18 1114 640 123 871 12 105 6 9 5 17
Signal Information
GreenYellowRed
3.5 4.4 100.0 11.9 9.1 0.04.0 0.0 4.0 4.0 4.0 0.01.0 0.0 2.0 1.0 1.0 0.0
1 2 3
5 6 7 8
Cycle, s 150.0 Reference Phase 2
Offset, s 0 Reference Point End
Uncoordinated No Simult. Gap E/W On
Force Mode Fixed Simult. Gap N/S On
Timer Results EBL EBT WBL WBT NBL NBT SBL SBT
Assigned Phase 1 6 5 2 4 8
Case Number 1.1 3.0 1.1 4.0 10.0 10.0
Phase Duration, s 8.5 106.0 13.0 110.4 16.9 14.1
Change Period, (Y+Rc), s 5.0 6.0 5.0 6.0 5.0 5.0
Max Allow Headway (MAH), s 3.1 0.0 3.1 0.0 3.1 3.4
Queue Clearance Time (gs), s 2.6 5.3 11.6 4.1
Green Extension Time (ge), s 0.0 0.0 0.2 0.0 0.1 0.1
Phase Call Probability 0.59 1.00 0.99 0.76
Max Out Probability 0.00 0.00 0.00 0.00
Movement Group Results EB WB NB SB
Approach Movement L T R L T R L T R L T R
Assigned Movement 1 6 16 5 2 12 7 4 3 8 18
Adjusted Flow Rate (v), veh/h 21 1322 711 131 470 467 115 7 10 24
Adjusted Saturation Flow Rate (s), veh/h/ln 1727 1693 1568 1727 1779 1770 1762 1814 1762 1592
Queue Service Time (gs), s 0.6 19.6 26.8 3.3 18.7 18.6 9.6 0.5 0.8 2.1
Cycle Queue Clearance Time (gc), s 0.6 19.6 26.8 3.3 18.7 18.6 9.6 0.5 0.8 2.1
Green Ratio (g/C) 0.69 0.67 0.67 0.73 0.70 0.70 0.08 0.08 0.06 0.06
Capacity (c), veh/h 421 2258 1045 361 1239 1232 140 144 107 97
Volume-to-Capacity Ratio (X) 0.051 0.585 0.680 0.361 0.379 0.379 0.824 0.046 0.093 0.250
Available Capacity (ca), veh/h 841 2258 1045 788 1239 1232 294 302 447 404
Back of Queue (Q), veh/ln (95th percentile) 0.4 7.3 8.5 2.1 11.6 11.4 7.8 0.4 0.6 1.6
Queue Storage Ratio (RQ) (95th percentile) 0.04 0.00 0.00 0.00 0.00 0.00 0.00 0.00 0.00 0.00
Uniform Delay (d1), s/veh 8.4 6.0 6.6 8.4 11.4 11.4 66.0 61.9 65.1 65.7
Incremental Delay (d2), s/veh 0.0 0.6 2.0 0.2 0.7 0.7 4.6 0.0 0.1 0.5
Initial Queue Delay (d3), s/veh 0.0 0.0 0.0 0.0 0.0 0.0 0.0 0.0 0.0 0.0
Control Delay (d), s/veh 8.4 6.6 8.6 8.6 12.1 12.1 70.6 62.0 65.2 66.2
Level of Service (LOS) A A A A B B E E E E
Approach Delay, s/veh / LOS 7.3 A 11.7 B 70.1 E 65.9 E
Intersection Delay, s/veh / LOS 11.7 B
Multimodal Results EB WB NB SB
Pedestrian LOS Score / LOS 2.2 B 2.2 B 2.9 C 3.1 C
Bicycle LOS Score / LOS 2.1 B 1.4 A 0.7 A 0.5 A
Copyright © 2015 University of Florida, All Rights Reserved. HCS 2010™ Streets Version 6.70 Generated: 7/30/2015 4:30:49 PM
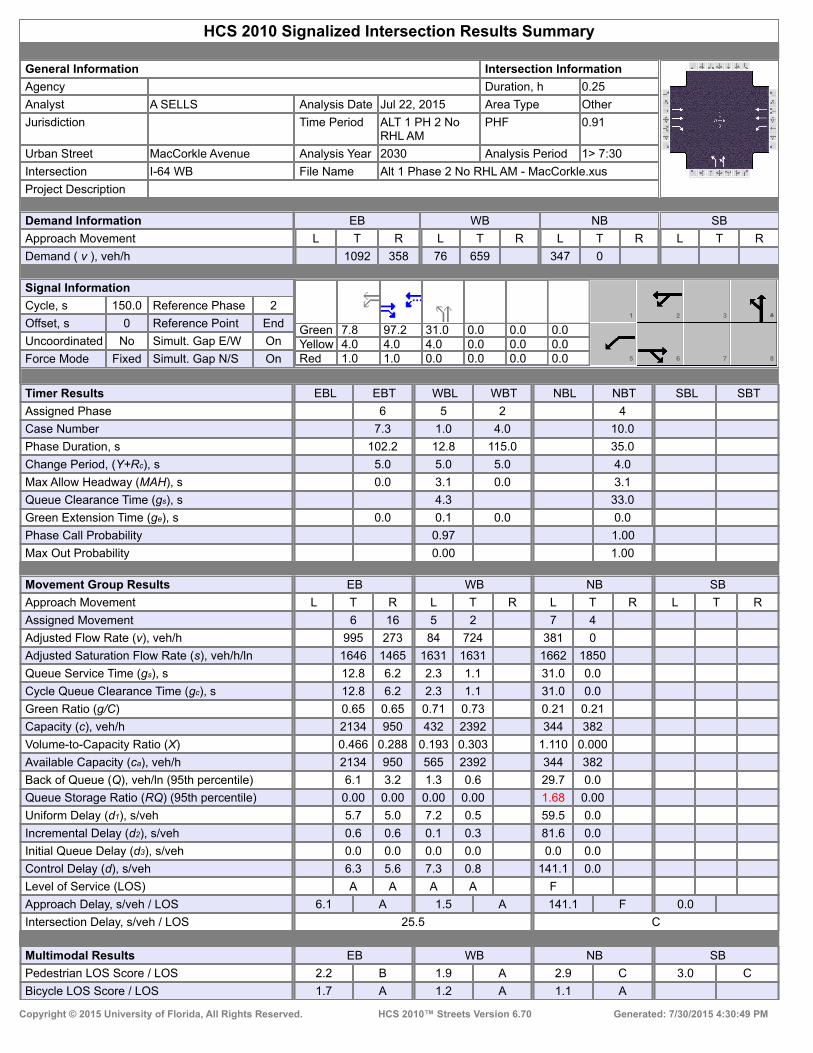
HCS 2010 Signalized Intersection Results Summary
General Information Intersection Information
Agency Duration, h 0.25
Analyst A SELLS Analysis Date Jul 22, 2015 Area Type Other
Jurisdiction Time Period ALT 1 PH 2 No RHL AM
PHF 0.91
Urban Street MacCorkle Avenue Analysis Year 2030 Analysis Period 1> 7:30
Intersection I-64 WB File Name Alt 1 Phase 2 No RHL AM - MacCorkle.xus
Project Description
Demand Information EB WB NB SB
Approach Movement L T R L T R L T R L T R
Demand ( v ), veh/h 1092 358 76 659 347 0
Signal Information
GreenYellowRed
7.8 97.2 31.0 0.0 0.0 0.04.0 4.0 4.0 0.0 0.0 0.01.0 1.0 0.0 0.0 0.0 0.0
1 2 3
5 6 7 8
Cycle, s 150.0 Reference Phase 2
Offset, s 0 Reference Point End
Uncoordinated No Simult. Gap E/W On
Force Mode Fixed Simult. Gap N/S On
Timer Results EBL EBT WBL WBT NBL NBT SBL SBT
Assigned Phase 6 5 2 4
Case Number 7.3 1.0 4.0 10.0
Phase Duration, s 102.2 12.8 115.0 35.0
Change Period, (Y+Rc), s 5.0 5.0 5.0 4.0
Max Allow Headway (MAH), s 0.0 3.1 0.0 3.1
Queue Clearance Time (gs), s 4.3 33.0
Green Extension Time (ge), s 0.0 0.1 0.0 0.0
Phase Call Probability 0.97 1.00
Max Out Probability 0.00 1.00
Movement Group Results EB WB NB SB
Approach Movement L T R L T R L T R L T R
Assigned Movement 6 16 5 2 7 4
Adjusted Flow Rate (v), veh/h 995 273 84 724 381 0
Adjusted Saturation Flow Rate (s), veh/h/ln 1646 1465 1631 1631 1662 1850
Queue Service Time (gs), s 12.8 6.2 2.3 1.1 31.0 0.0
Cycle Queue Clearance Time (gc), s 12.8 6.2 2.3 1.1 31.0 0.0
Green Ratio (g/C) 0.65 0.65 0.71 0.73 0.21 0.21
Capacity (c), veh/h 2134 950 432 2392 344 382
Volume-to-Capacity Ratio (X) 0.466 0.288 0.193 0.303 1.110 0.000
Available Capacity (ca), veh/h 2134 950 565 2392 344 382
Back of Queue (Q), veh/ln (95th percentile) 6.1 3.2 1.3 0.6 29.7 0.0
Queue Storage Ratio (RQ) (95th percentile) 0.00 0.00 0.00 0.00 1.68 0.00
Uniform Delay (d1), s/veh 5.7 5.0 7.2 0.5 59.5 0.0
Incremental Delay (d2), s/veh 0.6 0.6 0.1 0.3 81.6 0.0
Initial Queue Delay (d3), s/veh 0.0 0.0 0.0 0.0 0.0 0.0
Control Delay (d), s/veh 6.3 5.6 7.3 0.8 141.1 0.0
Level of Service (LOS) A A A A F
Approach Delay, s/veh / LOS 6.1 A 1.5 A 141.1 F 0.0
Intersection Delay, s/veh / LOS 25.5 C
Multimodal Results EB WB NB SB
Pedestrian LOS Score / LOS 2.2 B 1.9 A 2.9 C 3.0 C
Bicycle LOS Score / LOS 1.7 A 1.2 A 1.1 A
Copyright © 2015 University of Florida, All Rights Reserved. HCS 2010™ Streets Version 6.70 Generated: 7/30/2015 4:30:49 PM
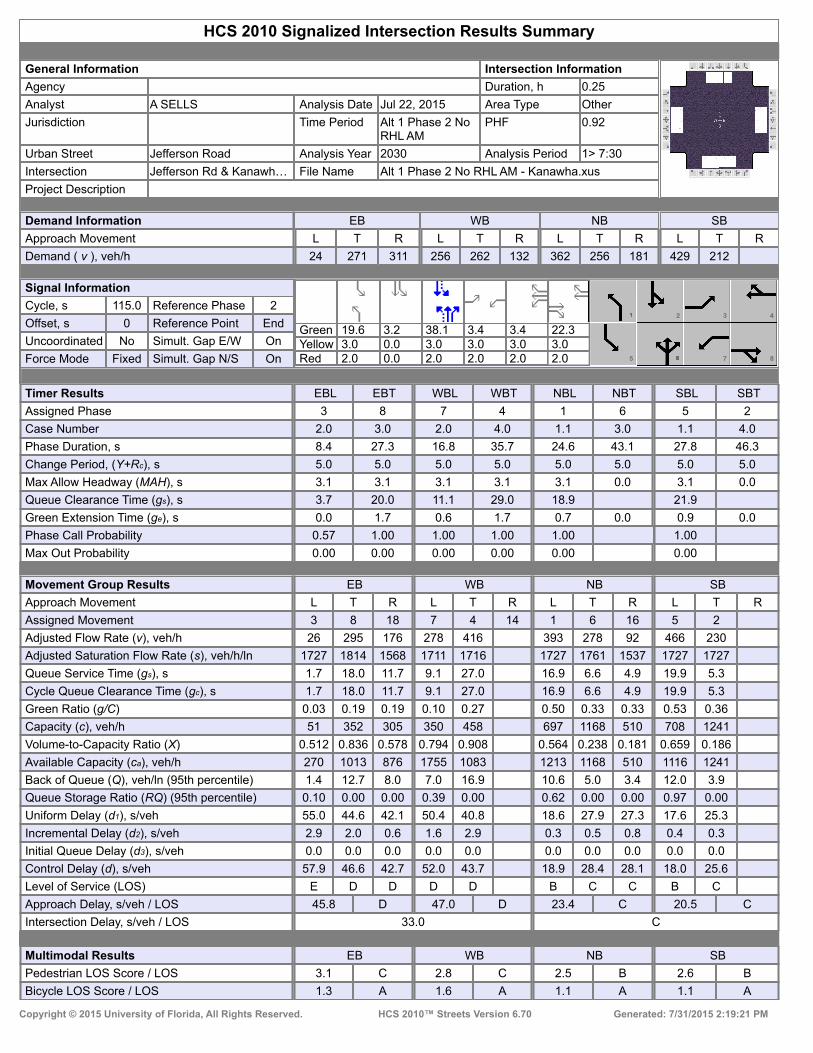
HCS 2010 Signalized Intersection Results Summary
General Information Intersection Information
Agency Duration, h 0.25
Analyst A SELLS Analysis Date Jul 22, 2015 Area Type Other
Jurisdiction Time Period Alt 1 Phase 2 No RHL AM
PHF 0.92
Urban Street Jefferson Road Analysis Year 2030 Analysis Period 1> 7:30
Intersection Jefferson Rd & Kanawh… File Name Alt 1 Phase 2 No RHL AM - Kanawha.xus
Project Description
Demand Information EB WB NB SB
Approach Movement L T R L T R L T R L T R
Demand ( v ), veh/h 24 271 311 256 262 132 362 256 181 429 212
Signal Information
GreenYellowRed
19.6 3.2 38.1 3.4 3.4 22.33.0 0.0 3.0 3.0 3.0 3.02.0 0.0 2.0 2.0 2.0 2.0
2 3 4
5 7 8
Cycle, s 115.0 Reference Phase 2
Offset, s 0 Reference Point End
Uncoordinated No Simult. Gap E/W On
Force Mode Fixed Simult. Gap N/S On
Timer Results EBL EBT WBL WBT NBL NBT SBL SBT
Assigned Phase 3 8 7 4 1 6 5 2
Case Number 2.0 3.0 2.0 4.0 1.1 3.0 1.1 4.0
Phase Duration, s 8.4 27.3 16.8 35.7 24.6 43.1 27.8 46.3
Change Period, (Y+Rc), s 5.0 5.0 5.0 5.0 5.0 5.0 5.0 5.0
Max Allow Headway (MAH), s 3.1 3.1 3.1 3.1 3.1 0.0 3.1 0.0
Queue Clearance Time (gs), s 3.7 20.0 11.1 29.0 18.9 21.9
Green Extension Time (ge), s 0.0 1.7 0.6 1.7 0.7 0.0 0.9 0.0
Phase Call Probability 0.57 1.00 1.00 1.00 1.00 1.00
Max Out Probability 0.00 0.00 0.00 0.00 0.00 0.00
Movement Group Results EB WB NB SB
Approach Movement L T R L T R L T R L T R
Assigned Movement 3 8 18 7 4 14 1 6 16 5 2
Adjusted Flow Rate (v), veh/h 26 295 176 278 416 393 278 92 466 230
Adjusted Saturation Flow Rate (s), veh/h/ln 1727 1814 1568 1711 1716 1727 1761 1537 1727 1727
Queue Service Time (gs), s 1.7 18.0 11.7 9.1 27.0 16.9 6.6 4.9 19.9 5.3
Cycle Queue Clearance Time (gc), s 1.7 18.0 11.7 9.1 27.0 16.9 6.6 4.9 19.9 5.3
Green Ratio (g/C) 0.03 0.19 0.19 0.10 0.27 0.50 0.33 0.33 0.53 0.36
Capacity (c), veh/h 51 352 305 350 458 697 1168 510 708 1241
Volume-to-Capacity Ratio (X) 0.512 0.836 0.578 0.794 0.908 0.564 0.238 0.181 0.659 0.186
Available Capacity (ca), veh/h 270 1013 876 1755 1083 1213 1168 510 1116 1241
Back of Queue (Q), veh/ln (95th percentile) 1.4 12.7 8.0 7.0 16.9 10.6 5.0 3.4 12.0 3.9
Queue Storage Ratio (RQ) (95th percentile) 0.10 0.00 0.00 0.39 0.00 0.62 0.00 0.00 0.97 0.00
Uniform Delay (d1), s/veh 55.0 44.6 42.1 50.4 40.8 18.6 27.9 27.3 17.6 25.3
Incremental Delay (d2), s/veh 2.9 2.0 0.6 1.6 2.9 0.3 0.5 0.8 0.4 0.3
Initial Queue Delay (d3), s/veh 0.0 0.0 0.0 0.0 0.0 0.0 0.0 0.0 0.0 0.0
Control Delay (d), s/veh 57.9 46.6 42.7 52.0 43.7 18.9 28.4 28.1 18.0 25.6
Level of Service (LOS) E D D D D B C C B C
Approach Delay, s/veh / LOS 45.8 D 47.0 D 23.4 C 20.5 C
Intersection Delay, s/veh / LOS 33.0 C
Multimodal Results EB WB NB SB
Pedestrian LOS Score / LOS 3.1 C 2.8 C 2.5 B 2.6 B
Bicycle LOS Score / LOS 1.3 A 1.6 A 1.1 A 1.1 A
Copyright © 2015 University of Florida, All Rights Reserved. HCS 2010™ Streets Version 6.70 Generated: 7/31/2015 2:19:21 PM

HCS 2010 Signalized Intersection Results Summary
General Information Intersection Information
Agency Duration, h 0.25
Analyst A SELLS Analysis Date Jul 22, 2015 Area Type Other
Jurisdiction Time Period Alt1 Phase 2 No RHL AM
PHF 0.88
Urban Street Jefferson Road Analysis Year 2030 Analysis Period 1> 7:30
Intersection Jefferson Rd & Oakhurs… File Name Alt 1 Phase 2 No RHL AM- US 119 & Oakhurst.xus
Project Description
Demand Information EB WB NB SB
Approach Movement L T R L T R L T R L T R
Demand ( v ), veh/h 538 13 148 99 128 77
Signal Information
GreenYellowRed
12.2 46.0 46.8 0.0 0.0 0.04.0 4.0 4.0 0.0 0.0 0.00.5 0.5 2.0 0.0 0.0 0.0
1 3 4
5 6 7 8
Cycle, s 120.0 Reference Phase 2
Offset, s 0 Reference Point Begin
Uncoordinated No Simult. Gap E/W On
Force Mode Fixed Simult. Gap N/S On
Timer Results EBL EBT WBL WBT NBL NBT SBL SBT
Assigned Phase 4 2 1 6
Case Number 9.0 7.3 2.0 4.0
Phase Duration, s 52.8 50.5 16.7 67.2
Change Period, (Y+Rc), s 6.0 4.5 4.5 4.5
Max Allow Headway (MAH), s 3.1 0.0 3.1 0.0
Queue Clearance Time (gs), s 45.9 12.0
Green Extension Time (ge), s 1.0 0.0 0.2 0.0
Phase Call Probability 1.00 1.00
Max Out Probability 0.08 0.00
Movement Group Results EB WB NB SB
Approach Movement L T R L T R L T R L T R
Assigned Movement 7 14 2 12 1 6
Adjusted Flow Rate (v), veh/h 611 15 168 56 145 88
Adjusted Saturation Flow Rate (s), veh/h/ln 1631 1452 1762 1568 1711 1796
Queue Service Time (gs), s 43.9 0.8 7.8 2.7 10.0 2.9
Cycle Queue Clearance Time (gc), s 43.9 0.8 7.8 2.7 10.0 2.9
Green Ratio (g/C) 0.39 0.39 0.38 0.38 0.10 0.52
Capacity (c), veh/h 637 567 675 601 174 938
Volume-to-Capacity Ratio (X) 0.960 0.026 0.249 0.093 0.838 0.093
Available Capacity (ca), veh/h 734 653 675 601 323 938
Back of Queue (Q), veh/ln (95th percentile) 27.8 0.5 6.1 1.9 7.9 2.2
Queue Storage Ratio (RQ) (95th percentile) 0.00 0.03 0.00 0.00 0.94 0.00
Uniform Delay (d1), s/veh 35.7 22.5 25.2 23.7 52.9 14.4
Incremental Delay (d2), s/veh 21.5 0.0 0.9 0.3 4.1 0.2
Initial Queue Delay (d3), s/veh 0.0 0.0 0.0 0.0 0.0 0.0
Control Delay (d), s/veh 57.2 22.5 26.1 24.0 57.0 14.6
Level of Service (LOS) E C C C E B
Approach Delay, s/veh / LOS 56.4 E 0.0 25.6 C 41.1 D
Intersection Delay, s/veh / LOS 46.7 D
Multimodal Results EB WB NB SB
Pedestrian LOS Score / LOS 2.4 B 2.3 B 1.9 A 1.7 A
Bicycle LOS Score / LOS F 0.9 A 0.9 A
Copyright © 2015 University of Florida, All Rights Reserved. HCS 2010™ Streets Version 6.70 Generated: 7/28/2015 9:49:23 AM

Alt 1 Phase 2 No RHL PM Peak Unsignalized

TWO-WAY STOP CONTROL SUMMARY
General Information Site Information Analyst ASELLS Agency/Co. STANTEC Date Performed 11/25/2014 Analysis Time Period Alt 1 Phase 2 No RHL PM
Intersection Jurisdiction Analysis Year 2030
Project Description East/West Street: Bob Evans entrance North/South Street: Jefferson Road Intersection Orientation: North-South Study Period (hrs): 0.25
Vehicle Volumes and Adjustments Major Street Northbound Southbound Movement 1 2 3 4 5 6 L T R L T RVolume (veh/h) 5 562 801 25 Peak-Hour Factor, PHF 0.45 0.87 1.00 1.00 0.86 0.63 Hourly Flow Rate, HFR (veh/h)
11 645 0 0 931 39
Percent Heavy Vehicles 2 -- -- 0 -- -- Median Type Undivided RT Channelized 0 0 Lanes 0 2 0 0 2 0 Configuration LT T T TR Upstream Signal 1 0 Minor Street Eastbound Westbound Movement 7 8 9 10 11 12
L T R L T RVolume (veh/h) 10 10 Peak-Hour Factor, PHF 0.90 1.00 0.69 1.00 1.00 1.00 Hourly Flow Rate, HFR (veh/h) 11 0 14 0 0 0
Percent Heavy Vehicles 2 0 2 0 0 0 Percent Grade (%) 0 0 Flared Approach N N Storage 0 0 RT Channelized 0 0 Lanes 1 0 1 0 0 0 Configuration L R Delay, Queue Length, and Level of ServiceApproach Northbound Southbound Westbound Eastbound
Movement 1 4 7 8 9 10 11 12
Lane Configuration LT L R v (veh/h) 11 11 14 C (m) (veh/h) 705 159 579 v/c 0.02 0.07 0.02 95% queue length 0.05 0.22 0.07 Control Delay (s/veh) 10.2 29.3 11.4 LOS B D B Approach Delay (s/veh) -- -- 19.3 Approach LOS -- -- C
Copyright © 2010 University of Florida, All Rights Reserved HCS+TM Version 5.6 Generated: 4/16/2015 3:42 PM
Page 1 of 1Two-Way Stop Control
4/16/2015file://C:\Users\asells\AppData\Local\Temp\u2k8878.tmp

TWO-WAY STOP CONTROL SUMMARY
General Information Site Information Analyst ASELLS Agency/Co. STANTEC Date Performed 11/25/2014 Analysis Time Period Alt 1 Phase 2 No RHL PM
Intersection Jurisdiction Analysis Year 2030
Project Description East/West Street: McDonalds entrance North/South Street: Jefferson Road Intersection Orientation: North-South Study Period (hrs): 0.25
Vehicle Volumes and Adjustments Major Street Northbound Southbound Movement 1 2 3 4 5 6 L T R L T RVolume (veh/h) 30 562 801 85 Peak-Hour Factor, PHF 0.83 0.87 1.00 1.00 0.88 0.83 Hourly Flow Rate, HFR (veh/h)
36 645 0 0 910 102
Percent Heavy Vehicles 2 -- -- 0 -- -- Median Type Undivided RT Channelized 0 0 Lanes 0 2 0 0 2 0 Configuration LT T T TR Upstream Signal 0 0 Minor Street Eastbound Westbound Movement 7 8 9 10 11 12
L T R L T RVolume (veh/h) 5 5 Peak-Hour Factor, PHF 0.50 1.00 0.25 1.00 1.00 1.00 Hourly Flow Rate, HFR (veh/h) 10 0 20 0 0 0
Percent Heavy Vehicles 2 0 2 0 0 0 Percent Grade (%) 0 0 Flared Approach N N Storage 0 0 RT Channelized 0 0 Lanes 1 0 1 0 0 0 Configuration L R Delay, Queue Length, and Level of ServiceApproach Northbound Southbound Westbound Eastbound
Movement 1 4 7 8 9 10 11 12
Lane Configuration LT L R v (veh/h) 36 10 20 C (m) (veh/h) 679 132 564 v/c 0.05 0.08 0.04 95% queue length 0.17 0.24 0.11 Control Delay (s/veh) 10.6 34.5 11.6 LOS B D B Approach Delay (s/veh) -- -- 19.2 Approach LOS -- -- C
Copyright © 2010 University of Florida, All Rights Reserved HCS+TM Version 5.6 Generated: 4/16/2015 3:43 PM
Page 1 of 1Two-Way Stop Control
4/16/2015file://C:\Users\asells\AppData\Local\Temp\u2k69B2.tmp
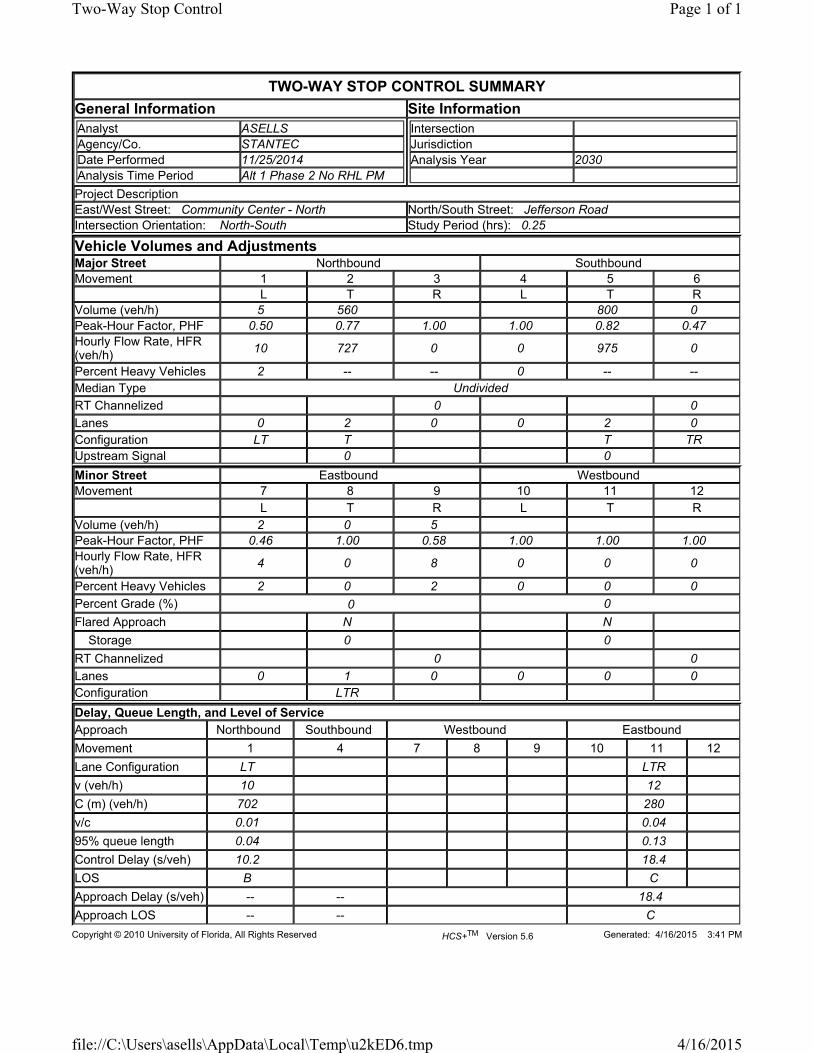
TWO-WAY STOP CONTROL SUMMARY
General Information Site Information Analyst ASELLS Agency/Co. STANTEC Date Performed 11/25/2014 Analysis Time Period Alt 1 Phase 2 No RHL PM
Intersection Jurisdiction Analysis Year 2030
Project Description East/West Street: Community Center - North North/South Street: Jefferson Road Intersection Orientation: North-South Study Period (hrs): 0.25
Vehicle Volumes and Adjustments Major Street Northbound Southbound Movement 1 2 3 4 5 6 L T R L T RVolume (veh/h) 5 560 800 0 Peak-Hour Factor, PHF 0.50 0.77 1.00 1.00 0.82 0.47 Hourly Flow Rate, HFR (veh/h)
10 727 0 0 975 0
Percent Heavy Vehicles 2 -- -- 0 -- -- Median Type Undivided RT Channelized 0 0 Lanes 0 2 0 0 2 0 Configuration LT T T TR Upstream Signal 0 0 Minor Street Eastbound Westbound Movement 7 8 9 10 11 12
L T R L T RVolume (veh/h) 2 0 5 Peak-Hour Factor, PHF 0.46 1.00 0.58 1.00 1.00 1.00 Hourly Flow Rate, HFR (veh/h) 4 0 8 0 0 0
Percent Heavy Vehicles 2 0 2 0 0 0 Percent Grade (%) 0 0 Flared Approach N N Storage 0 0 RT Channelized 0 0 Lanes 0 1 0 0 0 0 Configuration LTR Delay, Queue Length, and Level of ServiceApproach Northbound Southbound Westbound Eastbound
Movement 1 4 7 8 9 10 11 12
Lane Configuration LT LTR v (veh/h) 10 12 C (m) (veh/h) 702 280 v/c 0.01 0.04 95% queue length 0.04 0.13 Control Delay (s/veh) 10.2 18.4 LOS B C Approach Delay (s/veh) -- -- 18.4 Approach LOS -- -- C
Copyright © 2010 University of Florida, All Rights Reserved HCS+TM Version 5.6 Generated: 4/16/2015 3:41 PM
Page 1 of 1Two-Way Stop Control
4/16/2015file://C:\Users\asells\AppData\Local\Temp\u2kED6.tmp

TWO-WAY STOP CONTROL SUMMARY
General Information Site Information Analyst ASELLS Agency/Co. STANTEC Date Performed 11/25/2014 Analysis Time Period Alt 1 Phase 2 RHL PM
Intersection Jurisdiction Analysis Year 2030
Project Description East/West Street: Community Center - South North/South Street: Jefferson Road Intersection Orientation: North-South Study Period (hrs): 0.25
Vehicle Volumes and Adjustments Major Street Northbound Southbound Movement 1 2 3 4 5 6 L T R L T RVolume (veh/h) 1 560 800 1 Peak-Hour Factor, PHF 0.67 0.81 1.00 1.00 0.91 0.25 Hourly Flow Rate, HFR (veh/h)
1 691 0 0 879 4
Percent Heavy Vehicles 2 -- -- 0 -- -- Median Type Raised curb RT Channelized 0 0 Lanes 0 2 0 0 2 0 Configuration LT T T TR Upstream Signal 0 0 Minor Street Eastbound Westbound Movement 7 8 9 10 11 12
L T R L T RVolume (veh/h) 1 0 25 Peak-Hour Factor, PHF 0.33 1.00 0.71 1.00 1.00 1.00 Hourly Flow Rate, HFR (veh/h) 3 0 35 0 0 0
Percent Heavy Vehicles 2 0 2 0 0 0 Percent Grade (%) 0 0 Flared Approach N N Storage 0 0 RT Channelized 0 0 Lanes 0 1 0 0 0 0 Configuration LTR Delay, Queue Length, and Level of ServiceApproach Northbound Southbound Westbound Eastbound
Movement 1 4 7 8 9 10 11 12
Lane Configuration LT LTR v (veh/h) 1 38 C (m) (veh/h) 760 580 v/c 0.00 0.07 95% queue length 0.00 0.21 Control Delay (s/veh) 9.7 11.6 LOS A B Approach Delay (s/veh) -- -- 11.6 Approach LOS -- -- B
Copyright © 2010 University of Florida, All Rights Reserved HCS+TM Version 5.6 Generated: 4/16/2015 3:41 PM
Page 1 of 1Two-Way Stop Control
4/16/2015file://C:\Users\asells\AppData\Local\Temp\u2k2FDE.tmp
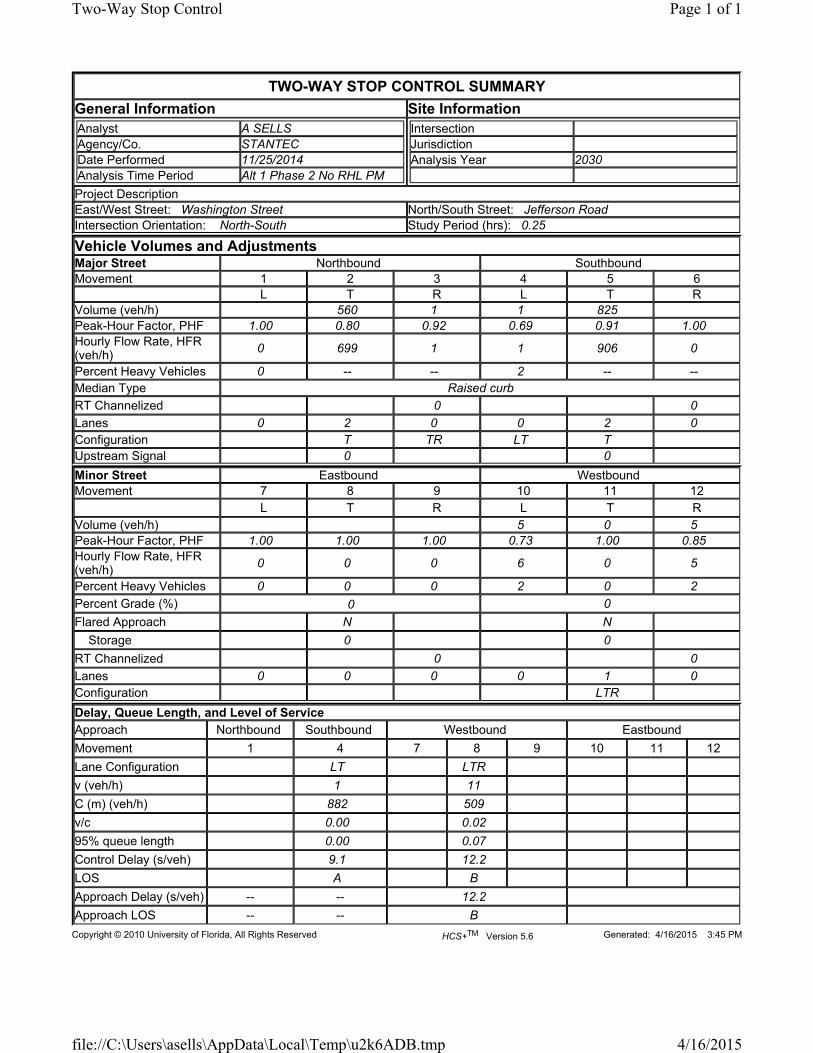
TWO-WAY STOP CONTROL SUMMARY
General Information Site Information Analyst A SELLS Agency/Co. STANTEC Date Performed 11/25/2014 Analysis Time Period Alt 1 Phase 2 No RHL PM
Intersection Jurisdiction Analysis Year 2030
Project Description East/West Street: Washington Street North/South Street: Jefferson Road Intersection Orientation: North-South Study Period (hrs): 0.25
Vehicle Volumes and Adjustments Major Street Northbound Southbound Movement 1 2 3 4 5 6 L T R L T RVolume (veh/h) 560 1 1 825 Peak-Hour Factor, PHF 1.00 0.80 0.92 0.69 0.91 1.00 Hourly Flow Rate, HFR (veh/h)
0 699 1 1 906 0
Percent Heavy Vehicles 0 -- -- 2 -- -- Median Type Raised curb RT Channelized 0 0 Lanes 0 2 0 0 2 0 Configuration T TR LT T Upstream Signal 0 0 Minor Street Eastbound Westbound Movement 7 8 9 10 11 12
L T R L T RVolume (veh/h) 5 0 5 Peak-Hour Factor, PHF 1.00 1.00 1.00 0.73 1.00 0.85 Hourly Flow Rate, HFR (veh/h) 0 0 0 6 0 5
Percent Heavy Vehicles 0 0 0 2 0 2 Percent Grade (%) 0 0 Flared Approach N N Storage 0 0 RT Channelized 0 0 Lanes 0 0 0 0 1 0 Configuration LTR Delay, Queue Length, and Level of ServiceApproach Northbound Southbound Westbound Eastbound
Movement 1 4 7 8 9 10 11 12
Lane Configuration LT LTR v (veh/h) 1 11 C (m) (veh/h) 882 509 v/c 0.00 0.02 95% queue length 0.00 0.07 Control Delay (s/veh) 9.1 12.2 LOS A B Approach Delay (s/veh) -- -- 12.2 Approach LOS -- -- B
Copyright © 2010 University of Florida, All Rights Reserved HCS+TM Version 5.6 Generated: 4/16/2015 3:45 PM
Page 1 of 1Two-Way Stop Control
4/16/2015file://C:\Users\asells\AppData\Local\Temp\u2k6ADB.tmp

TWO-WAY STOP CONTROL SUMMARY
General Information Site Information Analyst A SELLS Agency/Co. STANTEC Date Performed 11/25/2014 Analysis Time Period Alt 1 Phase 2 No RHL PM
Intersection Jurisdiction Analysis Year 2030
Project Description East/West Street: Pennslyvania Avenue North/South Street: Jefferson Road Intersection Orientation: North-South Study Period (hrs): 0.25
Vehicle Volumes and Adjustments Major Street Northbound Southbound Movement 1 2 3 4 5 6 L T R L T RVolume (veh/h) 560 1 1 674 Peak-Hour Factor, PHF 1.00 0.83 1.00 0.50 0.97 1.00 Hourly Flow Rate, HFR (veh/h)
0 674 1 2 694 0
Percent Heavy Vehicles 0 -- -- 2 -- -- Median Type Undivided RT Channelized 0 0 Lanes 0 2 0 0 2 0 Configuration T TR LT T Upstream Signal 0 1 Minor Street Eastbound Westbound Movement 7 8 9 10 11 12
L T R L T RVolume (veh/h) 10 0 1 Peak-Hour Factor, PHF 1.00 1.00 1.00 1.00 1.00 0.65 Hourly Flow Rate, HFR (veh/h) 0 0 0 10 0 1
Percent Heavy Vehicles 0 0 0 2 0 2 Percent Grade (%) 0 0 Flared Approach N N Storage 0 0 RT Channelized 0 0 Lanes 0 0 0 0 1 0 Configuration LTR Delay, Queue Length, and Level of ServiceApproach Northbound Southbound Westbound Eastbound
Movement 1 4 7 8 9 10 11 12
Lane Configuration LT LTR v (veh/h) 2 11 C (m) (veh/h) 912 370 v/c 0.00 0.03 95% queue length 0.01 0.09 Control Delay (s/veh) 9.0 15.0 LOS A C Approach Delay (s/veh) -- -- 15.0 Approach LOS -- -- C
Copyright © 2010 University of Florida, All Rights Reserved HCS+TM Version 5.6 Generated: 4/16/2015 3:44 PM
Page 1 of 1Two-Way Stop Control
4/16/2015file://C:\Users\asells\AppData\Local\Temp\u2k60FB.tmp

TWO-WAY STOP CONTROL SUMMARY
General Information Site Information Analyst A SELLS Agency/Co. Date Performed 12/3/2014
Analysis Time PeriodAlt 1 Phase 2 No RHL PM Peak
IntersectionJurisdictionAnalysis Year 2030
Project Description East/West Street: Kramer Street North/South Street: Jefferson Road Intersection Orientation: North-South Study Period (hrs): 0.25
Vehicle Volumes and Adjustments Major Street Northbound Southbound Movement 1 2 3 4 5 6 L T R L T RVolume (veh/h) 5 1032 1070 5 Peak-Hour Factor, PHF 0.50 0.85 1.00 1.00 0.94 0.75 Hourly Flow Rate, HFR (veh/h) 10 1214 0 0 1138 6
Percent Heavy Vehicles 6 -- -- 0 -- -- Median Type Undivided RT Channelized 0 Lanes 0 2 0 0 2 0 Configuration LT T T TR Upstream Signal 1 0 Minor Street Eastbound Westbound Movement 7 8 9 10 11 12
L T R L T RVolume (veh/h) 5 0 5 Peak-Hour Factor, PHF 0.75 1.00 0.33 0.80 1.00 0.85 Hourly Flow Rate, HFR (veh/h)
6 0 15 0 0 0
Percent Heavy Vehicles 100 0 100 3 0 0 Percent Grade (%) 0 0 Flared Approach N Storage 0 RT Channelized 0 0 Lanes 0 1 0 0 0 0 Configuration LTR Delay, Queue Length, and Level of ServiceApproach Northbound Southbound Westbound Eastbound
Movement 1 4 7 8 9 11
Lane Configuration LTR v (veh/h) 21 C (m) (veh/h) 75 v/c 0.28 95% queue length 1.01 Control Delay (s/veh) 70.7 LOS F Approach Delay (s/veh) -- -- 70.7 Approach LOS -- -- F
Copyright © 2010 University of Florida, All Rights Reserved HCS+TM Version 5.6 Generated: 7/31/2015 2:43 PM
Page 1 of 1Two-Way Stop Control
7/31/2015file://C:\Users\asells\AppData\Local\Temp\u2k5AE3.tmp

TWO-WAY STOP CONTROL SUMMARY
General Information Site Information Analyst A SELLS Agency/Co. Date Performed 7/22/2015
Analysis Time PeriodAlt 1 Phase 2 NO RHL PM Peak
Intersection Jurisdiction Analysis Year 2030
Project Description East/West Street: US 119 North/South Street: Jefferson Road Intersection Orientation: North-South Study Period (hrs): 0.25
Vehicle Volumes and Adjustments Major Street Northbound Southbound Movement 1 2 3 4 5 6 L T R L T RVolume (veh/h) 45 975 311 Peak-Hour Factor, PHF 0.60 0.89 1.00 1.00 0.83 1.00 Hourly Flow Rate, HFR (veh/h) 74 1095 0 0 374 0
Percent Heavy Vehicles 4 -- -- 0 -- -- Median Type Undivided RT Channelized 0 0 Lanes 1 1 0 0 1 0 Configuration L T T Upstream Signal 0 1 Minor Street Eastbound Westbound Movement 7 8 9 10 11 12
L T R L T RVolume (veh/h) 79 157 Peak-Hour Factor, PHF 1.00 1.00 1.00 0.69 1.00 0.78 Hourly Flow Rate, HFR (veh/h)
0 0 0 114 0 201
Percent Heavy Vehicles 0 0 0 5 0 0 Percent Grade (%) 0 0 Flared Approach N N Storage 0 0 RT Channelized 0 0 Lanes 0 0 0 1 0 1 Configuration L R Delay, Queue Length, and Level of ServiceApproach Northbound Southbound Westbound Eastbound
Movement 1 4 7 8 9 10 11 12
Lane Configuration L L R v (veh/h) 74 114 201 C (m) (veh/h) 1186 83 262 v/c 0.06 1.37 0.77 95% queue length 0.20 8.76 5.67 Control Delay (s/veh) 8.2 316.4 52.9 LOS A F F Approach Delay (s/veh) -- -- 148.3 Approach LOS -- -- F
Copyright © 2010 University of Florida, All Rights Reserved HCS+TM Version 5.6 Generated: 7/31/2015 2:45 PM
Page 1 of 1Two-Way Stop Control
7/31/2015file://C:\Users\asells\AppData\Local\Temp\u2kAE8E.tmp

Alt 1 Phase 2 No RHL PM Peak Signalized
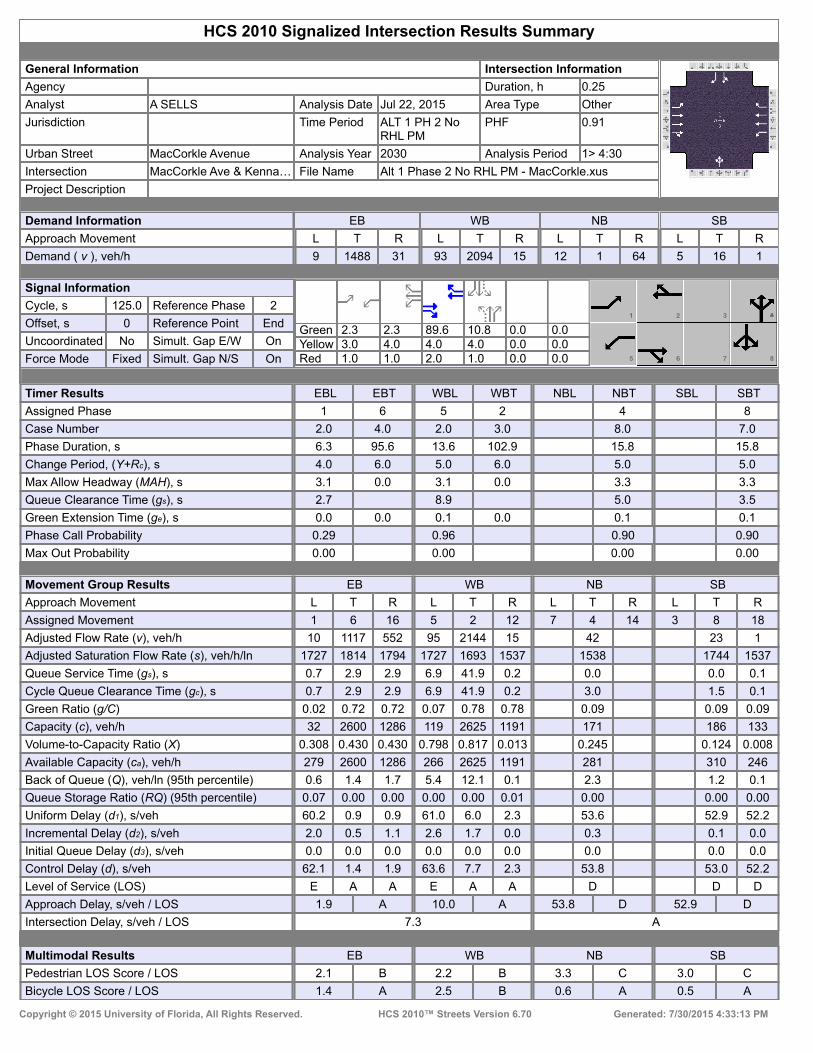
HCS 2010 Signalized Intersection Results Summary
General Information Intersection Information
Agency Duration, h 0.25
Analyst A SELLS Analysis Date Jul 22, 2015 Area Type Other
Jurisdiction Time Period ALT 1 PH 2 No RHL PM
PHF 0.91
Urban Street MacCorkle Avenue Analysis Year 2030 Analysis Period 1> 4:30
Intersection MacCorkle Ave & Kenna … File Name Alt 1 Phase 2 No RHL PM - MacCorkle.xus
Project Description
Demand Information EB WB NB SB
Approach Movement L T R L T R L T R L T R
Demand ( v ), veh/h 9 1488 31 93 2094 15 12 1 64 5 16 1
Signal Information
GreenYellowRed
2.3 2.3 89.6 10.8 0.0 0.03.0 4.0 4.0 4.0 0.0 0.01.0 1.0 2.0 1.0 0.0 0.0
1 2 3
5 6 7 8
Cycle, s 125.0 Reference Phase 2
Offset, s 0 Reference Point End
Uncoordinated No Simult. Gap E/W On
Force Mode Fixed Simult. Gap N/S On
Timer Results EBL EBT WBL WBT NBL NBT SBL SBT
Assigned Phase 1 6 5 2 4 8
Case Number 2.0 4.0 2.0 3.0 8.0 7.0
Phase Duration, s 6.3 95.6 13.6 102.9 15.8 15.8
Change Period, (Y+Rc), s 4.0 6.0 5.0 6.0 5.0 5.0
Max Allow Headway (MAH), s 3.1 0.0 3.1 0.0 3.3 3.3
Queue Clearance Time (gs), s 2.7 8.9 5.0 3.5
Green Extension Time (ge), s 0.0 0.0 0.1 0.0 0.1 0.1
Phase Call Probability 0.29 0.96 0.90 0.90
Max Out Probability 0.00 0.00 0.00 0.00
Movement Group Results EB WB NB SB
Approach Movement L T R L T R L T R L T R
Assigned Movement 1 6 16 5 2 12 7 4 14 3 8 18
Adjusted Flow Rate (v), veh/h 10 1117 552 95 2144 15 42 23 1
Adjusted Saturation Flow Rate (s), veh/h/ln 1727 1814 1794 1727 1693 1537 1538 1744 1537
Queue Service Time (gs), s 0.7 2.9 2.9 6.9 41.9 0.2 0.0 0.0 0.1
Cycle Queue Clearance Time (gc), s 0.7 2.9 2.9 6.9 41.9 0.2 3.0 1.5 0.1
Green Ratio (g/C) 0.02 0.72 0.72 0.07 0.78 0.78 0.09 0.09 0.09
Capacity (c), veh/h 32 2600 1286 119 2625 1191 171 186 133
Volume-to-Capacity Ratio (X) 0.308 0.430 0.430 0.798 0.817 0.013 0.245 0.124 0.008
Available Capacity (ca), veh/h 279 2600 1286 266 2625 1191 281 310 246
Back of Queue (Q), veh/ln (95th percentile) 0.6 1.4 1.7 5.4 12.1 0.1 2.3 1.2 0.1
Queue Storage Ratio (RQ) (95th percentile) 0.07 0.00 0.00 0.00 0.00 0.01 0.00 0.00 0.00
Uniform Delay (d1), s/veh 60.2 0.9 0.9 61.0 6.0 2.3 53.6 52.9 52.2
Incremental Delay (d2), s/veh 2.0 0.5 1.1 2.6 1.7 0.0 0.3 0.1 0.0
Initial Queue Delay (d3), s/veh 0.0 0.0 0.0 0.0 0.0 0.0 0.0 0.0 0.0
Control Delay (d), s/veh 62.1 1.4 1.9 63.6 7.7 2.3 53.8 53.0 52.2
Level of Service (LOS) E A A E A A D D D
Approach Delay, s/veh / LOS 1.9 A 10.0 A 53.8 D 52.9 D
Intersection Delay, s/veh / LOS 7.3 A
Multimodal Results EB WB NB SB
Pedestrian LOS Score / LOS 2.1 B 2.2 B 3.3 C 3.0 C
Bicycle LOS Score / LOS 1.4 A 2.5 B 0.6 A 0.5 A
Copyright © 2015 University of Florida, All Rights Reserved. HCS 2010™ Streets Version 6.70 Generated: 7/30/2015 4:33:13 PM

HCS 2010 Signalized Intersection Results Summary
General Information Intersection Information
Agency Duration, h 0.25
Analyst A SELLS Analysis Date Jul 22, 2015 Area Type Other
Jurisdiction Time Period ALT 1 PH 2 No RHL PM
PHF 0.91
Urban Street MacCorkle Avenue Analysis Year 2030 Analysis Period 1> 4:30
Intersection MacCorkle Ave & I-64 EB File Name Alt 1 Phase 2 No RHL PM - MacCorkle.xus
Project Description
Demand Information EB WB NB SB
Approach Movement L T R L T R L T R L T R
Demand ( v ), veh/h 988 1 2100 88 0
Signal Information
GreenYellowRed
0.2 100.7 9.1 0.0 0.0 0.04.0 4.0 4.0 0.0 0.0 0.01.0 1.0 1.0 0.0 0.0 0.0
1 2 3
5 6 7 8
Cycle, s 125.0 Reference Phase 2
Offset, s 0 Reference Point End
Uncoordinated No Simult. Gap E/W On
Force Mode Fixed Simult. Gap N/S On
Timer Results EBL EBT WBL WBT NBL NBT SBL SBT
Assigned Phase 6 5 2 4
Case Number 8.3 1.0 4.0 12.0
Phase Duration, s 105.7 5.2 110.9 14.1
Change Period, (Y+Rc), s 5.0 5.0 5.0 5.0
Max Allow Headway (MAH), s 0.0 3.1 0.0 3.1
Queue Clearance Time (gs), s 2.0 9.3
Green Extension Time (ge), s 0.0 0.0 0.0 0.1
Phase Call Probability 0.04 0.97
Max Out Probability 0.00 0.00
Movement Group Results EB WB NB SB
Approach Movement L T R L T R L T R L T R
Assigned Movement 6 5 2 7 4
Adjusted Flow Rate (v), veh/h 1711 1 2158 97
Adjusted Saturation Flow Rate (s), veh/h/ln 1727 1678 1677 1631
Queue Service Time (gs), s 25.1 0.0 34.7 7.3
Cycle Queue Clearance Time (gc), s 25.1 0.0 34.7 7.3
Green Ratio (g/C) 0.81 0.82 0.85 0.07
Capacity (c), veh/h 2783 227 2843 118
Volume-to-Capacity Ratio (X) 0.615 0.005 0.759 0.817
Available Capacity (ca), veh/h 2783 506 2843 261
Back of Queue (Q), veh/ln (95th percentile) 11.0 0.0 9.1 5.6
Queue Storage Ratio (RQ) (95th percentile) 0.00 0.00 0.00 0.00
Uniform Delay (d1), s/veh 5.1 4.9 4.2 57.1
Incremental Delay (d2), s/veh 0.9 0.0 0.8 5.1
Initial Queue Delay (d3), s/veh 0.0 0.0 0.0 0.0
Control Delay (d), s/veh 6.1 4.9 4.9 62.3
Level of Service (LOS) A A A E
Approach Delay, s/veh / LOS 6.1 A 4.9 A 62.3 E 0.0
Intersection Delay, s/veh / LOS 6.8 A
Multimodal Results EB WB NB SB
Pedestrian LOS Score / LOS 2.0 B 1.8 A 2.9 C 2.8 C
Bicycle LOS Score / LOS 1.4 A 2.4 B 0.6 A
Copyright © 2015 University of Florida, All Rights Reserved. HCS 2010™ Streets Version 6.70 Generated: 7/30/2015 4:33:13 PM

HCS 2010 Signalized Intersection Results Summary
General Information Intersection Information
Agency Duration, h 0.25
Analyst A SELLS Analysis Date Jul 22, 2015 Area Type Other
Jurisdiction Time Period ALT 1 PH 2 No RHL PM
PHF 0.91
Urban Street MacCorkle Avenue Analysis Year 2030 Analysis Period 1> 4:30
Intersection MacCorkle Ave & Jeffers… File Name Alt 1 Phase 2 No RHL PM - MacCorkle.xus
Project Description
Demand Information EB WB NB SB
Approach Movement L T R L T R L T R L T R
Demand ( v ), veh/h 30 742 692 90 1872 24 131 8 45 19 98
Signal Information
GreenYellowRed
4.2 1.5 76.0 12.2 10.1 0.04.0 0.0 4.0 4.0 4.0 0.01.0 0.0 2.0 1.0 1.0 0.0
1 2 3
5 6 7 8
Cycle, s 125.0 Reference Phase 2
Offset, s 0 Reference Point End
Uncoordinated No Simult. Gap E/W On
Force Mode Fixed Simult. Gap N/S On
Timer Results EBL EBT WBL WBT NBL NBT SBL SBT
Assigned Phase 1 6 5 2 4 8
Case Number 1.1 3.0 1.1 4.0 10.0 10.0
Phase Duration, s 9.2 82.0 10.8 83.5 17.2 15.1
Change Period, (Y+Rc), s 5.0 6.0 5.0 6.0 5.0 5.0
Max Allow Headway (MAH), s 3.1 0.0 3.1 0.0 3.1 3.4
Queue Clearance Time (gs), s 2.9 4.4 12.0 9.8
Green Extension Time (ge), s 0.0 0.0 0.1 0.0 0.2 0.3
Phase Call Probability 0.70 0.96 1.00 0.99
Max Out Probability 0.00 0.00 0.00 0.00
Movement Group Results EB WB NB SB
Approach Movement L T R L T R L T R L T R
Assigned Movement 1 6 16 5 2 12 7 4 3 8 18
Adjusted Flow Rate (v), veh/h 35 867 809 92 956 956 144 9 49 101
Adjusted Saturation Flow Rate (s), veh/h/ln 1727 1693 1568 1727 1779 1777 1762 1814 1762 1587
Queue Service Time (gs), s 0.9 11.7 44.4 2.4 50.8 50.9 10.0 0.5 3.3 7.8
Cycle Queue Clearance Time (gc), s 0.9 11.7 44.4 2.4 50.8 50.9 10.0 0.5 3.3 7.8
Green Ratio (g/C) 0.64 0.61 0.61 0.65 0.62 0.62 0.10 0.10 0.08 0.08
Capacity (c), veh/h 162 2060 953 464 1103 1103 172 177 142 128
Volume-to-Capacity Ratio (X) 0.216 0.421 0.848 0.198 0.866 0.867 0.839 0.050 0.348 0.791
Available Capacity (ca), veh/h 612 2060 953 1003 1103 1103 352 363 533 480
Back of Queue (Q), veh/ln (95th percentile) 0.9 6.2 15.5 1.6 19.5 19.6 8.1 0.4 2.7 5.9
Queue Storage Ratio (RQ) (95th percentile) 0.10 0.00 0.00 0.00 0.00 0.00 0.00 0.00 0.00 0.00
Uniform Delay (d1), s/veh 21.4 7.6 11.7 8.9 14.5 14.5 55.5 51.2 54.4 56.4
Incremental Delay (d2), s/veh 0.2 0.5 7.2 0.0 2.2 2.2 4.2 0.0 0.5 4.1
Initial Queue Delay (d3), s/veh 0.0 0.0 0.0 0.0 0.0 0.0 0.0 0.0 0.0 0.0
Control Delay (d), s/veh 21.5 8.1 18.9 8.9 16.7 16.7 59.6 51.2 54.9 60.5
Level of Service (LOS) C A B A B B E D D E
Approach Delay, s/veh / LOS 13.5 B 16.3 B 59.1 E 58.7 E
Intersection Delay, s/veh / LOS 18.3 B
Multimodal Results EB WB NB SB
Pedestrian LOS Score / LOS 2.2 B 2.3 B 2.9 C 3.0 C
Bicycle LOS Score / LOS 1.8 A 2.3 B 0.7 A 0.7 A
Copyright © 2015 University of Florida, All Rights Reserved. HCS 2010™ Streets Version 6.70 Generated: 7/30/2015 4:33:13 PM
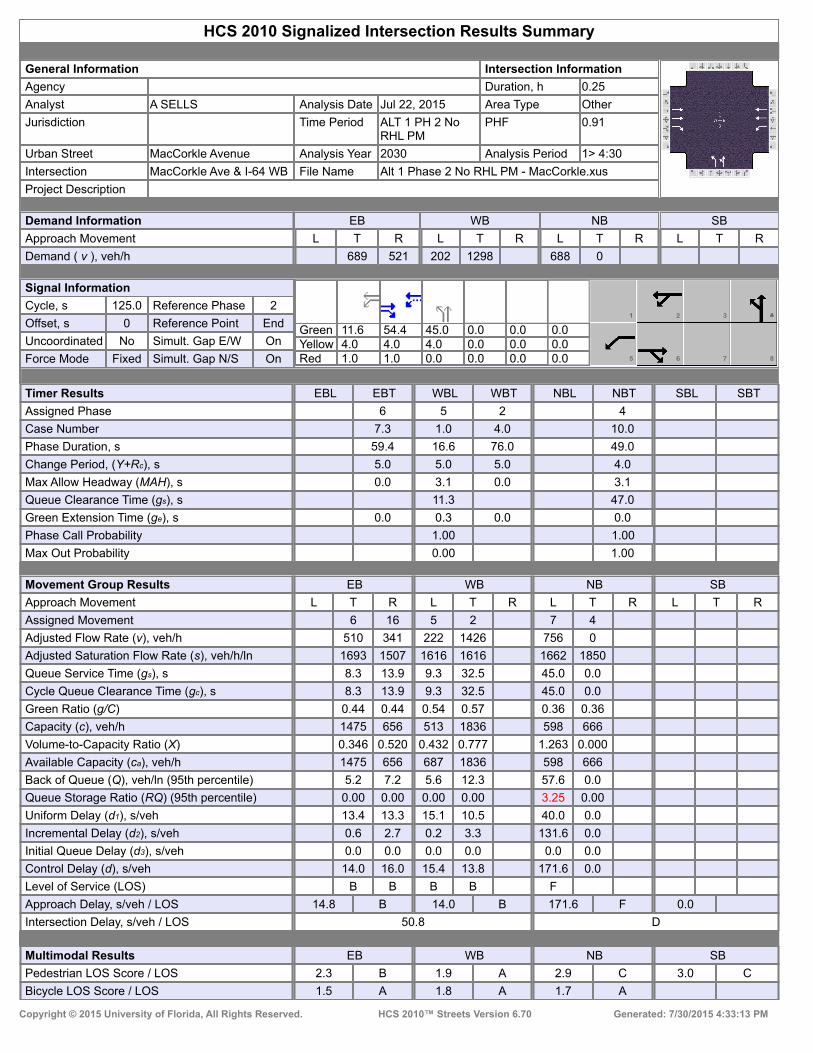
HCS 2010 Signalized Intersection Results Summary
General Information Intersection Information
Agency Duration, h 0.25
Analyst A SELLS Analysis Date Jul 22, 2015 Area Type Other
Jurisdiction Time Period ALT 1 PH 2 No RHL PM
PHF 0.91
Urban Street MacCorkle Avenue Analysis Year 2030 Analysis Period 1> 4:30
Intersection MacCorkle Ave & I-64 WB File Name Alt 1 Phase 2 No RHL PM - MacCorkle.xus
Project Description
Demand Information EB WB NB SB
Approach Movement L T R L T R L T R L T R
Demand ( v ), veh/h 689 521 202 1298 688 0
Signal Information
GreenYellowRed
11.6 54.4 45.0 0.0 0.0 0.04.0 4.0 4.0 0.0 0.0 0.01.0 1.0 0.0 0.0 0.0 0.0
1 2 3
5 6 7 8
Cycle, s 125.0 Reference Phase 2
Offset, s 0 Reference Point End
Uncoordinated No Simult. Gap E/W On
Force Mode Fixed Simult. Gap N/S On
Timer Results EBL EBT WBL WBT NBL NBT SBL SBT
Assigned Phase 6 5 2 4
Case Number 7.3 1.0 4.0 10.0
Phase Duration, s 59.4 16.6 76.0 49.0
Change Period, (Y+Rc), s 5.0 5.0 5.0 4.0
Max Allow Headway (MAH), s 0.0 3.1 0.0 3.1
Queue Clearance Time (gs), s 11.3 47.0
Green Extension Time (ge), s 0.0 0.3 0.0 0.0
Phase Call Probability 1.00 1.00
Max Out Probability 0.00 1.00
Movement Group Results EB WB NB SB
Approach Movement L T R L T R L T R L T R
Assigned Movement 6 16 5 2 7 4
Adjusted Flow Rate (v), veh/h 510 341 222 1426 756 0
Adjusted Saturation Flow Rate (s), veh/h/ln 1693 1507 1616 1616 1662 1850
Queue Service Time (gs), s 8.3 13.9 9.3 32.5 45.0 0.0
Cycle Queue Clearance Time (gc), s 8.3 13.9 9.3 32.5 45.0 0.0
Green Ratio (g/C) 0.44 0.44 0.54 0.57 0.36 0.36
Capacity (c), veh/h 1475 656 513 1836 598 666
Volume-to-Capacity Ratio (X) 0.346 0.520 0.432 0.777 1.263 0.000
Available Capacity (ca), veh/h 1475 656 687 1836 598 666
Back of Queue (Q), veh/ln (95th percentile) 5.2 7.2 5.6 12.3 57.6 0.0
Queue Storage Ratio (RQ) (95th percentile) 0.00 0.00 0.00 0.00 3.25 0.00
Uniform Delay (d1), s/veh 13.4 13.3 15.1 10.5 40.0 0.0
Incremental Delay (d2), s/veh 0.6 2.7 0.2 3.3 131.6 0.0
Initial Queue Delay (d3), s/veh 0.0 0.0 0.0 0.0 0.0 0.0
Control Delay (d), s/veh 14.0 16.0 15.4 13.8 171.6 0.0
Level of Service (LOS) B B B B F
Approach Delay, s/veh / LOS 14.8 B 14.0 B 171.6 F 0.0
Intersection Delay, s/veh / LOS 50.8 D
Multimodal Results EB WB NB SB
Pedestrian LOS Score / LOS 2.3 B 1.9 A 2.9 C 3.0 C
Bicycle LOS Score / LOS 1.5 A 1.8 A 1.7 A
Copyright © 2015 University of Florida, All Rights Reserved. HCS 2010™ Streets Version 6.70 Generated: 7/30/2015 4:33:13 PM

HCS 2010 Signalized Intersection Results Summary
General Information Intersection Information
Agency Duration, h 0.25
Analyst A SELLS Analysis Date Jul 22, 2015 Area Type Other
Jurisdiction Time Period Alt 1 Phase 2 RHL PM
PHF 0.92
Urban Street Jefferson Road Analysis Year 2030 Analysis Period 1> 4:30
Intersection Jefferson Rd & Kanawh… File Name Alt 1 Phase 2 No RHL PM - Kanawha.xus
Project Description
Demand Information EB WB NB SB
Approach Movement L T R L T R L T R L T R
Demand ( v ), veh/h 30 291 290 415 540 81 319 365 255 342 449
Signal Information
GreenYellowRed
21.3 2.1 18.0 4.0 9.5 40.13.0 0.0 3.0 3.0 3.0 3.02.0 0.0 2.0 2.0 2.0 2.0
2 3 4
5 7 8
Cycle, s 120.0 Reference Phase 2
Offset, s 0 Reference Point End
Uncoordinated No Simult. Gap E/W On
Force Mode Fixed Simult. Gap N/S On
Timer Results EBL EBT WBL WBT NBL NBT SBL SBT
Assigned Phase 3 8 7 4 1 6 5 2
Case Number 2.0 4.0 2.0 4.0 1.1 3.0 1.1 4.0
Phase Duration, s 9.0 45.1 23.5 59.7 26.3 23.0 28.4 25.1
Change Period, (Y+Rc), s 5.0 5.0 5.0 5.0 5.0 5.0 5.0 5.0
Max Allow Headway (MAH), s 3.1 3.1 3.1 3.1 3.1 0.0 3.1 0.0
Queue Clearance Time (gs), s 4.2 39.7 17.4 42.1 21.9 23.3
Green Extension Time (ge), s 0.0 1.5 1.1 2.5 0.0 0.0 0.6 0.0
Phase Call Probability 0.66 1.00 1.00 1.00 1.00 1.00
Max Out Probability 0.00 0.62 0.00 0.02 1.00 0.00
Movement Group Results EB WB NB SB
Approach Movement L T R L T R L T R L T R
Assigned Movement 3 8 18 7 4 14 1 6 16 5 2
Adjusted Flow Rate (v), veh/h 33 537 451 668 347 397 118 372 488
Adjusted Saturation Flow Rate (s), veh/h/ln 1727 1689 1711 1775 1727 1761 1537 1727 1727
Queue Service Time (gs), s 2.2 37.7 15.4 40.1 19.9 12.8 8.4 21.3 16.3
Cycle Queue Clearance Time (gc), s 2.2 37.7 15.4 40.1 19.9 12.8 8.4 21.3 16.3
Green Ratio (g/C) 0.03 0.33 0.15 0.46 0.34 0.15 0.15 0.36 0.17
Capacity (c), veh/h 57 550 527 793 411 573 250 470 611
Volume-to-Capacity Ratio (X) 0.569 0.976 0.856 0.843 0.845 0.692 0.474 0.791 0.799
Available Capacity (ca), veh/h 648 627 1483 873 439 573 250 690 611
Back of Queue (Q), veh/ln (95th percentile) 1.8 26.5 10.8 24.5 14.6 10.1 6.5 13.8 12.3
Queue Storage Ratio (RQ) (95th percentile) 0.13 0.00 0.60 0.00 0.85 0.00 0.00 1.11 0.00
Uniform Delay (d1), s/veh 57.2 40.0 49.5 29.5 34.0 47.4 45.6 32.6 47.3
Incremental Delay (d2), s/veh 3.3 27.5 1.6 6.4 12.4 6.7 6.3 2.1 10.5
Initial Queue Delay (d3), s/veh 0.0 0.0 0.0 0.0 0.0 0.0 0.0 0.0 0.0
Control Delay (d), s/veh 60.4 67.5 51.1 35.8 46.4 54.1 51.9 34.7 57.8
Level of Service (LOS) E E D D D D D C E
Approach Delay, s/veh / LOS 67.1 E 42.0 D 50.7 D 47.8 D
Intersection Delay, s/veh / LOS 49.8 D
Multimodal Results EB WB NB SB
Pedestrian LOS Score / LOS 3.2 C 2.8 C 2.5 B 2.4 B
Bicycle LOS Score / LOS 1.4 A 2.3 B 1.2 A 1.2 A
Copyright © 2015 University of Florida, All Rights Reserved. HCS 2010™ Streets Version 6.70 Generated: 7/31/2015 2:31:35 PM

HCS 2010 Signalized Intersection Results Summary
General Information Intersection Information
Agency Duration, h 0.25
Analyst A SELLS Analysis Date Jul 22, 2015 Area Type Other
Jurisdiction Time Period Alt1 Phase 2 No RHL PM
PHF 0.88
Urban Street Jefferson Road Analysis Year 2030 Analysis Period 1> 4:30
Intersection Jefferson Rd & Oakhurs… File Name Alt 1 Phase 2 No RHL PM - US 119 & Oakhurst.xus
Project Description
Demand Information EB WB NB SB
Approach Movement L T R L T R L T R L T R
Demand ( v ), veh/h 787 38 133 47 137 253
Signal Information
GreenYellowRed
12.8 38.2 55.5 0.0 0.0 0.04.0 4.0 4.0 0.0 0.0 0.00.5 0.5 0.5 0.0 0.0 0.0
1 3 4
5 6 7 8
Cycle, s 120.0 Reference Phase 2
Offset, s 0 Reference Point Begin
Uncoordinated No Simult. Gap E/W On
Force Mode Fixed Simult. Gap N/S On
Timer Results EBL EBT WBL WBT NBL NBT SBL SBT
Assigned Phase 4 2 1 6
Case Number 9.0 7.3 2.0 4.0
Phase Duration, s 60.0 42.7 17.3 60.0
Change Period, (Y+Rc), s 4.5 4.5 4.5 4.5
Max Allow Headway (MAH), s 3.1 0.0 3.1 0.0
Queue Clearance Time (gs), s 57.5 12.7
Green Extension Time (ge), s 0.0 0.0 0.1 0.0
Phase Call Probability 1.00 1.00
Max Out Probability 1.00 1.00
Movement Group Results EB WB NB SB
Approach Movement L T R L T R L T R L T R
Assigned Movement 7 14 2 12 1 6
Adjusted Flow Rate (v), veh/h 894 43 151 28 156 288
Adjusted Saturation Flow Rate (s), veh/h/ln 1631 1452 1762 1568 1711 1796
Queue Service Time (gs), s 55.5 2.0 7.7 1.5 10.7 12.3
Cycle Queue Clearance Time (gc), s 55.5 2.0 7.7 1.5 10.7 12.3
Green Ratio (g/C) 0.46 0.46 0.32 0.32 0.11 0.46
Capacity (c), veh/h 755 671 561 499 182 831
Volume-to-Capacity Ratio (X) 1.185 0.064 0.269 0.057 0.853 0.346
Available Capacity (ca), veh/h 755 671 561 499 221 831
Back of Queue (Q), veh/ln (95th percentile) 57.8 1.2 6.1 1.1 9.4 9.0
Queue Storage Ratio (RQ) (95th percentile) 0.00 0.07 0.00 0.00 1.13 0.00
Uniform Delay (d1), s/veh 32.3 17.9 30.5 28.4 52.7 20.6
Incremental Delay (d2), s/veh 96.6 0.0 1.2 0.2 20.1 1.1
Initial Queue Delay (d3), s/veh 0.0 0.0 0.0 0.0 0.0 0.0
Control Delay (d), s/veh 128.8 17.9 31.7 28.6 72.8 21.8
Level of Service (LOS) F B C C E C
Approach Delay, s/veh / LOS 123.7 F 0.0 31.2 C 39.7 D
Intersection Delay, s/veh / LOS 89.2 F
Multimodal Results EB WB NB SB
Pedestrian LOS Score / LOS 2.4 B 2.3 B 1.9 A 1.7 A
Bicycle LOS Score / LOS F 0.8 A 1.2 A
Copyright © 2015 University of Florida, All Rights Reserved. HCS 2010™ Streets Version 6.70 Generated: 7/28/2015 10:05:13 AM

Alt 5 AM Peak Unsignalized

TWO-WAY STOP CONTROL SUMMARY
General Information Site Information Analyst ASELLS Agency/Co. STANTEC Date Performed 11/25/2014 Analysis Time Period ALT 5 AM
Intersection Jurisdiction Analysis Year 2030
Project Description East/West Street: Bob Evans entrance North/South Street: Jefferson Road Intersection Orientation: North-South Study Period (hrs): 0.25
Vehicle Volumes and Adjustments Major Street Northbound Southbound Movement 1 2 3 4 5 6 L T R L T RVolume (veh/h) 5 432 780 25 Peak-Hour Factor, PHF 0.45 0.87 1.00 1.00 0.86 0.63 Hourly Flow Rate, HFR (veh/h)
11 496 0 0 906 39
Percent Heavy Vehicles 2 -- -- 0 -- -- Median Type Undivided RT Channelized 0 0 Lanes 0 2 0 0 2 0 Configuration LT T T TR Upstream Signal 1 0 Minor Street Eastbound Westbound Movement 7 8 9 10 11 12
L T R L T RVolume (veh/h) 10 10 Peak-Hour Factor, PHF 0.90 1.00 0.69 1.00 1.00 1.00 Hourly Flow Rate, HFR (veh/h) 11 0 14 0 0 0
Percent Heavy Vehicles 2 0 2 0 0 0 Percent Grade (%) 0 0 Flared Approach N N Storage 0 0 RT Channelized 0 0 Lanes 1 0 1 0 0 0 Configuration L R Delay, Queue Length, and Level of ServiceApproach Northbound Southbound Westbound Eastbound
Movement 1 4 7 8 9 10 11 12
Lane Configuration LT L R v (veh/h) 11 11 14 C (m) (veh/h) 720 178 589 v/c 0.02 0.06 0.02 95% queue length 0.05 0.20 0.07 Control Delay (s/veh) 10.1 26.6 11.3 LOS B D B Approach Delay (s/veh) -- -- 18.0 Approach LOS -- -- C
Copyright © 2010 University of Florida, All Rights Reserved HCS+TM Version 5.6 Generated: 7/30/2015 2:38 PM
Page 1 of 1Two-Way Stop Control
7/30/2015file://C:\Users\asells\AppData\Local\Temp\u2k24B7.tmp

TWO-WAY STOP CONTROL SUMMARY
General Information Site Information Analyst ASELLS Agency/Co. STANTEC Date Performed 11/25/2014 Analysis Time Period ALT 5 AM
Intersection Jurisdiction Analysis Year 2030
Project Description East/West Street: McDonalds entrance North/South Street: Jefferson Road Intersection Orientation: North-South Study Period (hrs): 0.25
Vehicle Volumes and Adjustments Major Street Northbound Southbound Movement 1 2 3 4 5 6 L T R L T RVolume (veh/h) 30 432 780 85 Peak-Hour Factor, PHF 0.83 0.87 1.00 1.00 0.88 0.83 Hourly Flow Rate, HFR (veh/h)
36 496 0 0 886 102
Percent Heavy Vehicles 2 -- -- 0 -- -- Median Type Undivided RT Channelized 0 0 Lanes 0 2 0 0 2 0 Configuration LT T T TR Upstream Signal 0 0 Minor Street Eastbound Westbound Movement 7 8 9 10 11 12
L T R L T RVolume (veh/h) 5 5 Peak-Hour Factor, PHF 0.50 1.00 0.25 1.00 1.00 1.00 Hourly Flow Rate, HFR (veh/h) 10 0 20 0 0 0
Percent Heavy Vehicles 2 0 2 0 0 0 Percent Grade (%) 0 0 Flared Approach N N Storage 0 0 RT Channelized 0 0 Lanes 1 0 1 0 0 0 Configuration L R Delay, Queue Length, and Level of ServiceApproach Northbound Southbound Westbound Eastbound
Movement 1 4 7 8 9 10 11 12
Lane Configuration LT L R v (veh/h) 36 10 20 C (m) (veh/h) 694 154 573 v/c 0.05 0.06 0.03 95% queue length 0.16 0.21 0.11 Control Delay (s/veh) 10.5 30.0 11.5 LOS B D B Approach Delay (s/veh) -- -- 17.7 Approach LOS -- -- C
Copyright © 2010 University of Florida, All Rights Reserved HCS+TM Version 5.6 Generated: 4/17/2015 8:37 AM
Page 1 of 1Two-Way Stop Control
4/17/2015file://C:\Users\asells\AppData\Local\Temp\u2k473D.tmp

TWO-WAY STOP CONTROL SUMMARY
General Information Site Information Analyst ASELLS Agency/Co. STANTEC Date Performed 11/25/2014 Analysis Time Period Alt 5 AM
Intersection Jurisdiction Analysis Year 2030
Project Description East/West Street: Community Center - North North/South Street: Jefferson Road Intersection Orientation: North-South Study Period (hrs): 0.25
Vehicle Volumes and Adjustments Major Street Northbound Southbound Movement 1 2 3 4 5 6 L T R L T RVolume (veh/h) 468 764 10 Peak-Hour Factor, PHF 0.50 0.77 1.00 1.00 0.82 0.47 Hourly Flow Rate, HFR (veh/h)
0 607 0 0 931 21
Percent Heavy Vehicles 2 -- -- 0 -- -- Median Type Raised curb RT Channelized 0 0 Lanes 0 2 0 0 2 0 Configuration T T TR Upstream Signal 0 1 Minor Street Eastbound Westbound Movement 7 8 9 10 11 12
L T R L T RVolume (veh/h) 0 5 Peak-Hour Factor, PHF 0.46 1.00 0.58 1.00 1.00 1.00 Hourly Flow Rate, HFR (veh/h) 0 0 8 0 0 0
Percent Heavy Vehicles 2 0 2 0 0 0 Percent Grade (%) 0 0 Flared Approach N N Storage 0 0 RT Channelized 0 0 Lanes 0 1 0 0 0 0 Configuration TR Delay, Queue Length, and Level of ServiceApproach Northbound Southbound Westbound Eastbound
Movement 1 4 7 8 9 10 11 12
Lane Configuration TR v (veh/h) 8 C (m) (veh/h) 629 v/c 0.01 95% queue length 0.04 Control Delay (s/veh) 10.8 LOS B Approach Delay (s/veh) -- -- 10.8 Approach LOS -- -- B
Copyright © 2010 University of Florida, All Rights Reserved HCS+TM Version 5.6 Generated: 7/30/2015 2:35 PM
Page 1 of 1Two-Way Stop Control
7/30/2015file://C:\Users\asells\AppData\Local\Temp\u2k6BD4.tmp

TWO-WAY STOP CONTROL SUMMARY
General Information Site Information Analyst A SELLS Agency/Co. STANTEC Date Performed 11/25/2014 Analysis Time Period Alt 5 AM
Intersection Jurisdiction Analysis Year 2030
Project Description East/West Street: Pennslyvania Avenue North/South Street: Jefferson Road Intersection Orientation: North-South Study Period (hrs): 0.25
Vehicle Volumes and Adjustments Major Street Northbound Southbound Movement 1 2 3 4 5 6 L T R L T RVolume (veh/h) 406 5 5 760 Peak-Hour Factor, PHF 1.00 0.83 1.00 0.50 0.97 1.00 Hourly Flow Rate, HFR (veh/h)
0 489 5 10 783 0
Percent Heavy Vehicles 0 -- -- 2 -- -- Median Type Undivided RT Channelized 0 0 Lanes 0 2 0 0 2 0 Configuration T TR LT T Upstream Signal 1 0 Minor Street Eastbound Westbound Movement 7 8 9 10 11 12
L T R L T RVolume (veh/h) 5 0 5 Peak-Hour Factor, PHF 1.00 1.00 1.00 1.00 1.00 0.65 Hourly Flow Rate, HFR (veh/h) 0 0 0 5 0 7
Percent Heavy Vehicles 0 0 0 2 0 2 Percent Grade (%) 0 0 Flared Approach N N Storage 0 0 RT Channelized 0 0 Lanes 0 0 0 0 1 0 Configuration LTR Delay, Queue Length, and Level of ServiceApproach Northbound Southbound Westbound Eastbound
Movement 1 4 7 8 9 10 11 12
Lane Configuration LT LTR v (veh/h) 10 12 C (m) (veh/h) 1120 488 v/c 0.01 0.02 95% queue length 0.03 0.08 Control Delay (s/veh) 8.2 12.6 LOS A B Approach Delay (s/veh) -- -- 12.6 Approach LOS -- -- B
Copyright © 2010 University of Florida, All Rights Reserved HCS+TM Version 5.6 Generated: 7/30/2015 2:37 PM
Page 1 of 1Two-Way Stop Control
7/30/2015file://C:\Users\asells\AppData\Local\Temp\u2k2D2F.tmp

TWO-WAY STOP CONTROL SUMMARY
General Information Site Information Analyst A SELLS Agency/Co. Date Performed 12/3/2014 Analysis Time Period Alt 5 AM Peak
Intersection Jurisdiction Analysis Year 2030
Project Description East/West Street: Kramer Street North/South Street: Jefferson Road Intersection Orientation: North-South Study Period (hrs): 0.25
Vehicle Volumes and Adjustments Major Street Northbound Southbound Movement 1 2 3 4 5 6 L T R L T RVolume (veh/h) 782 785 5 Peak-Hour Factor, PHF 0.50 0.85 1.00 1.00 0.94 0.75 Hourly Flow Rate, HFR (veh/h)
0 919 0 0 835 6
Percent Heavy Vehicles 6 -- -- 0 -- -- Median Type Undivided RT Channelized 0 0 Lanes 0 2 0 0 2 0 Configuration T T TR Upstream Signal 0 1 Minor Street Eastbound Westbound Movement 7 8 9 10 11 12
L T R L T RVolume (veh/h) 0 0 5 Peak-Hour Factor, PHF 0.75 1.00 0.33 0.80 1.00 0.85 Hourly Flow Rate, HFR (veh/h) 0 0 15 0 0 0
Percent Heavy Vehicles 100 0 100 3 0 0 Percent Grade (%) 0 0 Flared Approach N N Storage 0 0 RT Channelized 0 0 Lanes 0 1 0 0 0 0 Configuration LTR Delay, Queue Length, and Level of ServiceApproach Northbound Southbound Westbound Eastbound
Movement 1 4 7 8 9 10 11 12
Lane Configuration LTR v (veh/h) 15 C (m) (veh/h) 613 v/c 0.02 95% queue length 0.08 Control Delay (s/veh) 11.0 LOS B Approach Delay (s/veh) -- -- 11.0 Approach LOS -- -- B
Copyright © 2010 University of Florida, All Rights Reserved HCS+TM Version 5.6 Generated: 7/31/2015 3:51 PM
Page 1 of 1Two-Way Stop Control
7/31/2015file://C:\Users\asells\AppData\Local\Temp\u2k1A9A.tmp

TWO-WAY STOP CONTROL SUMMARY
General Information Site Information Analyst A SELLS Agency/Co.Date Performed 7/22/2015 Analysis Time Period Alt 5 AM Peak
IntersectionJurisdictionAnalysis Year 2030
Project Description East/West Street: US 119 North/South Street: Jefferson Road Intersection Orientation: North-South Study Period (hrs): 0.25
Vehicle Volumes and Adjustments Major Street Northbound Southbound Movement 1 2 3 4 5 6
L T R L T RVolume (veh/h) 19 543 184 Peak-Hour Factor, PHF 0.60 0.89 1.00 1.00 0.83 1.00 Hourly Flow Rate, HFR (veh/h)
31 610 0 0 221 0
Percent Heavy Vehicles 4 -- -- 0 -- -- Median Type Undivided RT Channelized 0 0 Lanes 1 1 0 0 1 0 Configuration L T T Upstream Signal 0 1 Minor Street Eastbound Westbound Movement 7 8 9 10 11 12
L T R L T RVolume (veh/h) 16 134 Peak-Hour Factor, PHF 1.00 1.00 1.00 0.69 1.00 0.78 Hourly Flow Rate, HFR (veh/h) 0 0 0 23 0 171
Percent Heavy Vehicles 0 0 0 5 0 0 Percent Grade (%) 0 0 Flared Approach N N Storage 0 0 RT Channelized 0 0 Lanes 0 0 0 1 0 1 Configuration L R Delay, Queue Length, and Level of ServiceApproach Northbound Southbound Westbound Eastbound
Movement 1 4 7 8 9 10 11 12
Lane Configuration L L R v (veh/h) 31 23 171 C (m) (veh/h) 1176 297 498 v/c 0.03 0.08 0.34 95% queue length 0.08 0.25 1.51 Control Delay (s/veh) 8.1 18.1 16.0 LOS A C C Approach Delay (s/veh) -- -- 16.2 Approach LOS -- -- C
Copyright © 2010 University of Florida, All Rights Reserved HCS+TM Version 5.6 Generated: 7/30/2015 2:46 PM
Page 1 of 1Two-Way Stop Control
7/30/2015file://C:\Users\asells\AppData\Local\Temp\u2kF7BE.tmp

Alt 5 AM Peak Signalized

HCS 2010 Signalized Intersection Results Summary
General Information Intersection Information
Agency Duration, h 0.25
Analyst A SELLS Analysis Date Jul 22, 2015 Area Type Other
Jurisdiction Time Period ALT 5 AM PHF 0.91
Urban Street MacCorkle Avenue Analysis Year 2030 Analysis Period 1> 7:30
Intersection MacCorkle Ave & Kenna … File Name Alt 5 AM - MacCorkle.xus
Project Description
Demand Information EB WB NB SB
Approach Movement L T R L T R L T R L T R
Demand ( v ), veh/h 8 1835 1 34 1012 21 11 1 65 1 0 0
Signal Information
GreenYellowRed
2.5 109.5 7.2 10.8 0.0 0.03.0 4.0 4.0 4.0 0.0 0.01.0 2.0 1.0 1.0 0.0 0.0
1 2 3
5 6 7 8
Cycle, s 150.0 Reference Phase 2
Offset, s 0 Reference Point End
Uncoordinated No Simult. Gap E/W On
Force Mode Fixed Simult. Gap N/S On
Timer Results EBL EBT WBL WBT NBL NBT SBL SBT
Assigned Phase 1 6 5 2 4 8
Case Number 2.0 4.0 2.0 3.0 8.0 7.0
Phase Duration, s 6.5 121.9 12.2 127.7 15.8 15.8
Change Period, (Y+Rc), s 4.0 6.0 6.0 6.0 5.0 5.0
Max Allow Headway (MAH), s 3.1 0.0 3.1 0.0 3.4 3.4
Queue Clearance Time (gs), s 2.8 5.1 7.0 2.1
Green Extension Time (ge), s 0.0 0.0 1.1 0.0 0.0 0.1
Phase Call Probability 0.31 0.78 0.90 0.90
Max Out Probability 0.00 1.00 0.00 0.00
Movement Group Results EB WB NB SB
Approach Movement L T R L T R L T R L T R
Assigned Movement 1 6 16 5 2 12 7 4 14 3 8 18
Adjusted Flow Rate (v), veh/h 9 1345 672 36 1083 22 55 1 0
Adjusted Saturation Flow Rate (s), veh/h/ln 1727 1814 1813 1727 1693 1537 1544 1358 1537
Queue Service Time (gs), s 0.8 0.0 0.0 3.1 11.2 0.3 0.8 0.0 0.0
Cycle Queue Clearance Time (gc), s 0.8 0.0 0.0 3.1 11.2 0.3 5.0 0.1 0.0
Green Ratio (g/C) 0.02 0.77 0.77 0.04 0.81 0.81 0.07 0.07 0.07
Capacity (c), veh/h 28 2803 1401 72 2748 1247 141 146 111
Volume-to-Capacity Ratio (X) 0.311 0.480 0.480 0.506 0.394 0.018 0.390 0.008 0.000
Available Capacity (ca), veh/h 186 2803 1401 92 2748 1247 203 202 174
Back of Queue (Q), veh/ln (95th percentile) 0.6 0.4 0.8 2.5 5.2 0.2 3.7 0.1 0.0
Queue Storage Ratio (RQ) (95th percentile) 0.08 0.00 0.00 0.00 0.00 0.02 0.00 0.00 0.00
Uniform Delay (d1), s/veh 72.5 0.0 0.0 70.5 3.1 2.1 66.9 64.6 0.0
Incremental Delay (d2), s/veh 2.3 0.6 1.2 1.9 0.4 0.0 0.7 0.0 0.0
Initial Queue Delay (d3), s/veh 0.0 0.0 0.0 0.0 0.0 0.0 0.0 0.0 0.0
Control Delay (d), s/veh 74.8 0.6 1.2 72.4 3.5 2.1 67.5 64.6 0.0
Level of Service (LOS) E A A E A A E E
Approach Delay, s/veh / LOS 1.1 A 5.6 A 67.5 E 64.6 E
Intersection Delay, s/veh / LOS 3.9 A
Multimodal Results EB WB NB SB
Pedestrian LOS Score / LOS 2.2 B 2.2 B 3.3 C 3.0 C
Bicycle LOS Score / LOS 1.6 A 1.5 A 0.6 A 0.5 A
Copyright © 2015 University of Florida, All Rights Reserved. HCS 2010™ Streets Version 6.70 Generated: 7/31/2015 4:16:30 PM

HCS 2010 Signalized Intersection Results Summary
General Information Intersection Information
Agency Duration, h 0.25
Analyst A SELLS Analysis Date Jul 22, 2015 Area Type Other
Jurisdiction Time Period ALT 5 AM PHF 0.91
Urban Street MacCorkle Avenue Analysis Year 2030 Analysis Period 1> 7:30
Intersection MacCorkle Ave & I-64 EB File Name Alt 5 AM - MacCorkle.xus
Project Description
Demand Information EB WB NB SB
Approach Movement L T R L T R L T R L T R
Demand ( v ), veh/h 11108 38 964 102 0
Signal Information
GreenYellowRed
118.0 4.9 12.1 0.0 0.0 0.04.0 4.0 4.0 0.0 0.0 0.01.0 1.0 1.0 0.0 0.0 0.0
1 2 3
5 6 7 8
Cycle, s 150.0 Reference Phase 2
Offset, s 0 Reference Point End
Uncoordinated No Simult. Gap E/W On
Force Mode Fixed Simult. Gap N/S On
Timer Results EBL EBT WBL WBT NBL NBT SBL SBT
Assigned Phase 6 5 2 4
Case Number 8.3 1.0 4.0 12.0
Phase Duration, s 123.0 9.9 132.9 17.1
Change Period, (Y+Rc), s 5.0 5.0 5.0 5.0
Max Allow Headway (MAH), s 0.0 3.1 0.0 3.1
Queue Clearance Time (gs), s 2.0 12.2
Green Extension Time (ge), s 0.0 1.3 0.0 0.1
Phase Call Probability 0.82 0.99
Max Out Probability 0.72 0.00
Movement Group Results EB WB NB SB
Approach Movement L T R L T R L T R L T R
Assigned Movement 6 5 2 7 4
Adjusted Flow Rate (v), veh/h 2089 41 1029 112
Adjusted Saturation Flow Rate (s), veh/h/ln 1727 1678 1677 1631
Queue Service Time (gs), s 40.2 0.0 9.0 10.2
Cycle Queue Clearance Time (gc), s 40.2 0.0 9.0 10.2
Green Ratio (g/C) 0.79 0.81 0.85 0.08
Capacity (c), veh/h 2716 199 2859 132
Volume-to-Capacity Ratio (X) 0.769 0.204 0.360 0.848
Available Capacity (ca), veh/h 2716 211 2859 218
Back of Queue (Q), veh/ln (95th percentile) 14.0 1.5 3.5 8.0
Queue Storage Ratio (RQ) (95th percentile) 0.00 0.28 0.00 0.00
Uniform Delay (d1), s/veh 5.6 20.1 2.1 68.0
Incremental Delay (d2), s/veh 1.9 0.2 0.3 7.5
Initial Queue Delay (d3), s/veh 0.0 0.0 0.0 0.0
Control Delay (d), s/veh 7.5 20.3 2.4 75.5
Level of Service (LOS) A C A E
Approach Delay, s/veh / LOS 7.5 A 3.1 A 75.5 E 0.0
Intersection Delay, s/veh / LOS 8.4 A
Multimodal Results EB WB NB SB
Pedestrian LOS Score / LOS 2.2 B 1.8 A 2.9 C 2.8 C
Bicycle LOS Score / LOS 10.6 F 1.4 A 0.7 A
Copyright © 2015 University of Florida, All Rights Reserved. HCS 2010™ Streets Version 6.70 Generated: 7/31/2015 4:16:30 PM
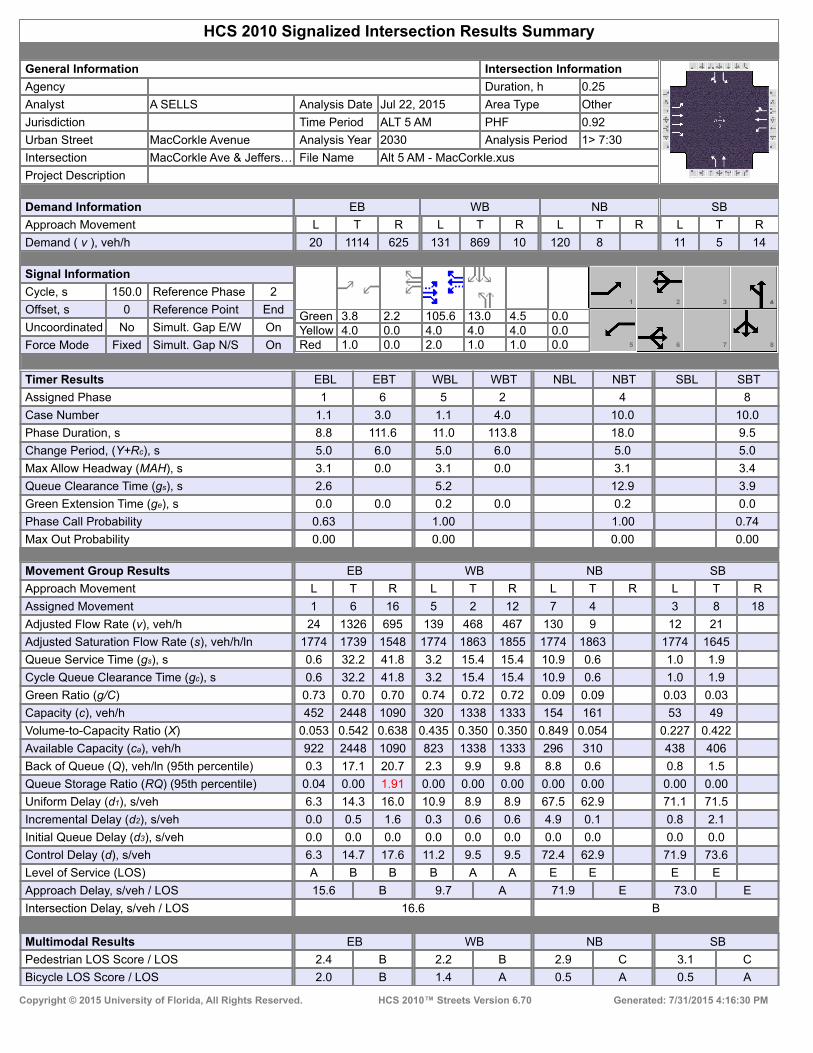
HCS 2010 Signalized Intersection Results Summary
General Information Intersection Information
Agency Duration, h 0.25
Analyst A SELLS Analysis Date Jul 22, 2015 Area Type Other
Jurisdiction Time Period ALT 5 AM PHF 0.92
Urban Street MacCorkle Avenue Analysis Year 2030 Analysis Period 1> 7:30
Intersection MacCorkle Ave & Jeffers… File Name Alt 5 AM - MacCorkle.xus
Project Description
Demand Information EB WB NB SB
Approach Movement L T R L T R L T R L T R
Demand ( v ), veh/h 20 1114 625 131 869 10 120 8 11 5 14
Signal Information
GreenYellowRed
3.8 2.2 105.6 13.0 4.5 0.04.0 0.0 4.0 4.0 4.0 0.01.0 0.0 2.0 1.0 1.0 0.0
1 2 3
5 6 7 8
Cycle, s 150.0 Reference Phase 2
Offset, s 0 Reference Point End
Uncoordinated No Simult. Gap E/W On
Force Mode Fixed Simult. Gap N/S On
Timer Results EBL EBT WBL WBT NBL NBT SBL SBT
Assigned Phase 1 6 5 2 4 8
Case Number 1.1 3.0 1.1 4.0 10.0 10.0
Phase Duration, s 8.8 111.6 11.0 113.8 18.0 9.5
Change Period, (Y+Rc), s 5.0 6.0 5.0 6.0 5.0 5.0
Max Allow Headway (MAH), s 3.1 0.0 3.1 0.0 3.1 3.4
Queue Clearance Time (gs), s 2.6 5.2 12.9 3.9
Green Extension Time (ge), s 0.0 0.0 0.2 0.0 0.2 0.0
Phase Call Probability 0.63 1.00 1.00 0.74
Max Out Probability 0.00 0.00 0.00 0.00
Movement Group Results EB WB NB SB
Approach Movement L T R L T R L T R L T R
Assigned Movement 1 6 16 5 2 12 7 4 3 8 18
Adjusted Flow Rate (v), veh/h 24 1326 695 139 468 467 130 9 12 21
Adjusted Saturation Flow Rate (s), veh/h/ln 1774 1739 1548 1774 1863 1855 1774 1863 1774 1645
Queue Service Time (gs), s 0.6 32.2 41.8 3.2 15.4 15.4 10.9 0.6 1.0 1.9
Cycle Queue Clearance Time (gc), s 0.6 32.2 41.8 3.2 15.4 15.4 10.9 0.6 1.0 1.9
Green Ratio (g/C) 0.73 0.70 0.70 0.74 0.72 0.72 0.09 0.09 0.03 0.03
Capacity (c), veh/h 452 2448 1090 320 1338 1333 154 161 53 49
Volume-to-Capacity Ratio (X) 0.053 0.542 0.638 0.435 0.350 0.350 0.849 0.054 0.227 0.422
Available Capacity (ca), veh/h 922 2448 1090 823 1338 1333 296 310 438 406
Back of Queue (Q), veh/ln (95th percentile) 0.3 17.1 20.7 2.3 9.9 9.8 8.8 0.6 0.8 1.5
Queue Storage Ratio (RQ) (95th percentile) 0.04 0.00 1.91 0.00 0.00 0.00 0.00 0.00 0.00 0.00
Uniform Delay (d1), s/veh 6.3 14.3 16.0 10.9 8.9 8.9 67.5 62.9 71.1 71.5
Incremental Delay (d2), s/veh 0.0 0.5 1.6 0.3 0.6 0.6 4.9 0.1 0.8 2.1
Initial Queue Delay (d3), s/veh 0.0 0.0 0.0 0.0 0.0 0.0 0.0 0.0 0.0 0.0
Control Delay (d), s/veh 6.3 14.7 17.6 11.2 9.5 9.5 72.4 62.9 71.9 73.6
Level of Service (LOS) A B B B A A E E E E
Approach Delay, s/veh / LOS 15.6 B 9.7 A 71.9 E 73.0 E
Intersection Delay, s/veh / LOS 16.6 B
Multimodal Results EB WB NB SB
Pedestrian LOS Score / LOS 2.4 B 2.2 B 2.9 C 3.1 C
Bicycle LOS Score / LOS 2.0 B 1.4 A 0.5 A 0.5 A
Copyright © 2015 University of Florida, All Rights Reserved. HCS 2010™ Streets Version 6.70 Generated: 7/31/2015 4:16:30 PM

HCS 2010 Signalized Intersection Results Summary
General Information Intersection Information
Agency Duration, h 0.25
Analyst A SELLS Analysis Date Jul 22, 2015 Area Type Other
Jurisdiction Time Period ALT 5 AM PHF 0.91
Urban Street MacCorkle Avenue Analysis Year 2030 Analysis Period 1> 7:30
Intersection MacCorkle Ave & I-64 WB File Name Alt 5 AM - MacCorkle.xus
Project Description
Demand Information EB WB NB SB
Approach Movement L T R L T R L T R L T R
Demand ( v ), veh/h 1097 368 65 665 337 0
Signal Information
GreenYellowRed
98.5 6.5 31.0 0.0 0.0 0.04.0 4.0 4.0 0.0 0.0 0.01.0 1.0 0.0 0.0 0.0 0.0
1 2 3
5 6 7 8
Cycle, s 150.0 Reference Phase 2
Offset, s 0 Reference Point End
Uncoordinated No Simult. Gap E/W On
Force Mode Fixed Simult. Gap N/S On
Timer Results EBL EBT WBL WBT NBL NBT SBL SBT
Assigned Phase 6 5 2 4
Case Number 7.3 1.0 4.0 10.0
Phase Duration, s 103.5 11.5 115.0 35.0
Change Period, (Y+Rc), s 5.0 5.0 5.0 4.0
Max Allow Headway (MAH), s 0.0 3.1 0.0 3.1
Queue Clearance Time (gs), s 2.0 33.0
Green Extension Time (ge), s 0.0 0.1 0.0 0.0
Phase Call Probability 0.95 1.00
Max Out Probability 0.25 1.00
Movement Group Results EB WB NB SB
Approach Movement L T R L T R L T R L T R
Assigned Movement 6 16 5 2 7 4
Adjusted Flow Rate (v), veh/h 1076 304 71 731 370 0
Adjusted Saturation Flow Rate (s), veh/h/ln 1693 1507 1616 1616 1662 1850
Queue Service Time (gs), s 15.1 7.4 0.0 1.1 31.0 0.0
Cycle Queue Clearance Time (gc), s 15.1 7.4 0.0 1.1 31.0 0.0
Green Ratio (g/C) 0.66 0.66 0.69 0.73 0.21 0.21
Capacity (c), veh/h 2225 990 383 2370 344 382
Volume-to-Capacity Ratio (X) 0.484 0.307 0.187 0.308 1.078 0.000
Available Capacity (ca), veh/h 2225 990 400 2370 344 382
Back of Queue (Q), veh/ln (95th percentile) 7.3 3.9 2.1 0.6 28.0 0.0
Queue Storage Ratio (RQ) (95th percentile) 0.00 0.00 0.00 0.00 1.58 0.00
Uniform Delay (d1), s/veh 6.4 5.4 14.8 0.5 59.5 0.0
Incremental Delay (d2), s/veh 0.6 0.7 0.1 0.3 71.0 0.0
Initial Queue Delay (d3), s/veh 0.0 0.0 0.0 0.0 0.0 0.0
Control Delay (d), s/veh 7.0 6.1 14.9 0.8 130.5 0.0
Level of Service (LOS) A A B A F
Approach Delay, s/veh / LOS 6.8 A 2.0 A 130.5 F 0.0
Intersection Delay, s/veh / LOS 23.3 C
Multimodal Results EB WB NB SB
Pedestrian LOS Score / LOS 2.3 B 1.9 A 2.9 C 3.0 C
Bicycle LOS Score / LOS 1.8 A 1.1 A 1.1 A
Copyright © 2015 University of Florida, All Rights Reserved. HCS 2010™ Streets Version 6.70 Generated: 7/31/2015 4:16:30 PM

HCS 2010 Signalized Intersection Results Summary
General Information Intersection Information
Agency Duration, h 0.25
Analyst A SELLS Analysis Date Jul 22, 2015 Area Type Other
Jurisdiction Time Period ALT 5 AM PHF 0.92
Urban Street Jefferson Road Analysis Year 2030 Analysis Period 1> 7:30
Intersection Jefferson Rd & Access Rd File Name ALT 5 AM - Jefferson & Access Road.xus
Project Description
Demand Information EB WB NB SB
Approach Movement L T R L T R L T R L T R
Demand ( v ), veh/h 1 1 1 7 1 1 1 437 2 29 733 2
Signal Information
GreenYellowRed
3.3 63.5 1.3 0.5 0.0 0.03.0 3.5 3.5 3.5 0.0 0.02.0 2.0 2.0 2.0 0.0 0.0
1 2 3 4
5 7 8
Cycle, s 90.0 Reference Phase 2
Offset, s 0 Reference Point End
Uncoordinated No Simult. Gap E/W On
Force Mode Fixed Simult. Gap N/S On
Timer Results EBL EBT WBL WBT NBL NBT SBL SBT
Assigned Phase 8 4 6 5 2
Case Number 12.0 12.0 6.3 2.0 4.0
Phase Duration, s 6.0 6.8 69.0 8.3 77.2
Change Period, (Y+Rc), s 5.5 5.5 5.5 5.0 5.5
Max Allow Headway (MAH), s 3.3 3.3 0.0 3.1 0.0
Queue Clearance Time (gs), s 2.2 2.5 3.6
Green Extension Time (ge), s 0.0 0.0 0.0 0.0 0.0
Phase Call Probability 0.08 0.22 0.55
Max Out Probability 0.00 0.00 0.00
Movement Group Results EB WB NB SB
Approach Movement L T R L T R L T R L T R
Assigned Movement 3 8 18 7 4 14 1 6 16 5 2 12
Adjusted Flow Rate (v), veh/h 3 10 1 239 238 32 400 399
Adjusted Saturation Flow Rate (s), veh/h/ln 1685 1713 678 1814 1811 1727 1814 1812
Queue Service Time (gs), s 0.2 0.5 0.0 4.0 4.0 1.6 5.2 5.2
Cycle Queue Clearance Time (gc), s 0.2 0.5 0.1 4.0 4.0 1.6 5.2 5.2
Green Ratio (g/C) 0.01 0.01 0.71 0.71 0.71 0.04 0.80 0.80
Capacity (c), veh/h 9 25 558 1279 1277 63 1445 1444
Volume-to-Capacity Ratio (X) 0.370 0.395 0.002 0.187 0.187 0.502 0.276 0.276
Available Capacity (ca), veh/h 331 181 558 1279 1277 523 1445 1444
Back of Queue (Q), veh/ln (95th percentile) 0.2 0.4 0.0 2.2 2.2 1.3 1.9 1.9
Queue Storage Ratio (RQ) (95th percentile) 0.00 0.00 0.00 0.00 0.00 0.22 0.00 0.00
Uniform Delay (d1), s/veh 44.6 44.0 3.9 4.5 4.5 42.6 2.4 2.4
Incremental Delay (d2), s/veh 9.3 3.7 0.0 0.3 0.3 2.3 0.5 0.5
Initial Queue Delay (d3), s/veh 0.0 0.0 0.0 0.0 0.0 0.0 0.0 0.0
Control Delay (d), s/veh 54.0 47.7 3.9 4.8 4.8 44.9 2.9 2.9
Level of Service (LOS) D D A A A D A A
Approach Delay, s/veh / LOS 54.0 D 47.7 D 4.8 A 4.4 A
Intersection Delay, s/veh / LOS 5.0 A
Multimodal Results EB WB NB SB
Pedestrian LOS Score / LOS 2.9 C 2.9 C 2.0 B 2.0 B
Bicycle LOS Score / LOS 0.5 A 0.5 A 0.9 A 1.2 A
Copyright © 2015 University of Florida, All Rights Reserved. HCS 2010™ Streets Version 6.70 Generated: 7/30/2015 2:13:51 PM
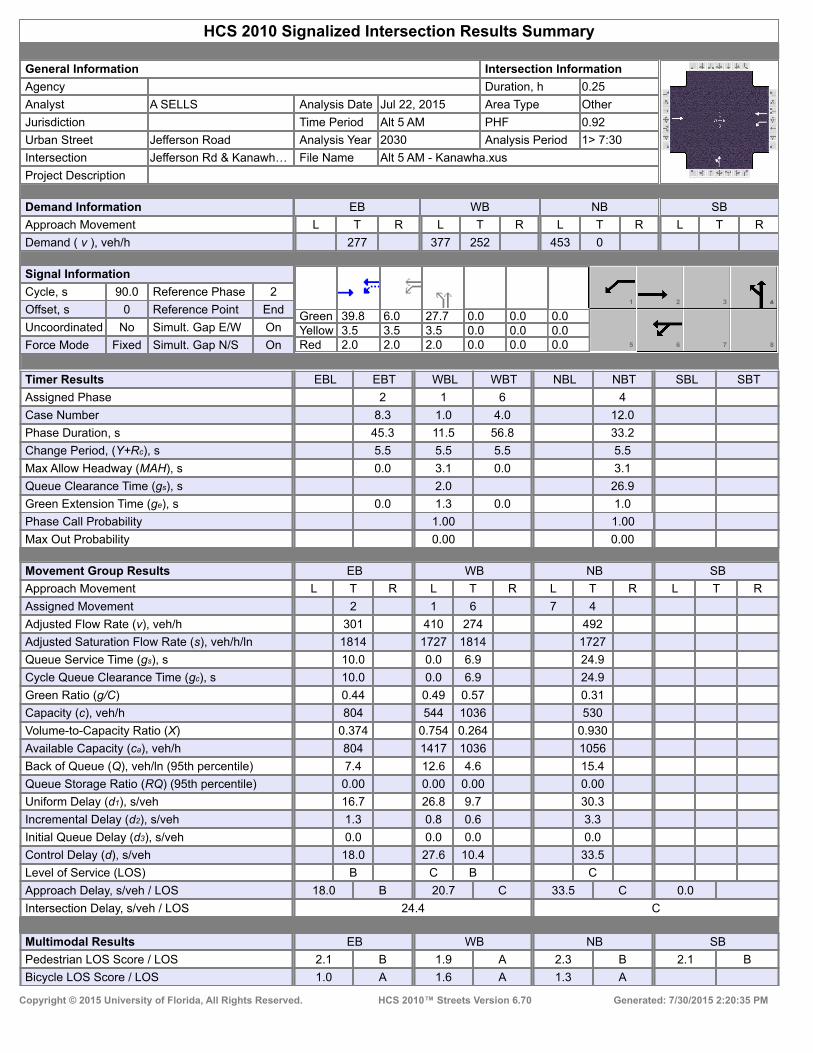
HCS 2010 Signalized Intersection Results Summary
General Information Intersection Information
Agency Duration, h 0.25
Analyst A SELLS Analysis Date Jul 22, 2015 Area Type Other
Jurisdiction Time Period Alt 5 AM PHF 0.92
Urban Street Jefferson Road Analysis Year 2030 Analysis Period 1> 7:30
Intersection Jefferson Rd & Kanawh… File Name Alt 5 AM - Kanawha.xus
Project Description
Demand Information EB WB NB SB
Approach Movement L T R L T R L T R L T R
Demand ( v ), veh/h 277 377 252 453 0
Signal Information
GreenYellowRed
39.8 6.0 27.7 0.0 0.0 0.03.5 3.5 3.5 0.0 0.0 0.02.0 2.0 2.0 0.0 0.0 0.0
1 2 3
5 6 7 8
Cycle, s 90.0 Reference Phase 2
Offset, s 0 Reference Point End
Uncoordinated No Simult. Gap E/W On
Force Mode Fixed Simult. Gap N/S On
Timer Results EBL EBT WBL WBT NBL NBT SBL SBT
Assigned Phase 2 1 6 4
Case Number 8.3 1.0 4.0 12.0
Phase Duration, s 45.3 11.5 56.8 33.2
Change Period, (Y+Rc), s 5.5 5.5 5.5 5.5
Max Allow Headway (MAH), s 0.0 3.1 0.0 3.1
Queue Clearance Time (gs), s 2.0 26.9
Green Extension Time (ge), s 0.0 1.3 0.0 1.0
Phase Call Probability 1.00 1.00
Max Out Probability 0.00 0.00
Movement Group Results EB WB NB SB
Approach Movement L T R L T R L T R L T R
Assigned Movement 2 1 6 7 4
Adjusted Flow Rate (v), veh/h 301 410 274 492
Adjusted Saturation Flow Rate (s), veh/h/ln 1814 1727 1814 1727
Queue Service Time (gs), s 10.0 0.0 6.9 24.9
Cycle Queue Clearance Time (gc), s 10.0 0.0 6.9 24.9
Green Ratio (g/C) 0.44 0.49 0.57 0.31
Capacity (c), veh/h 804 544 1036 530
Volume-to-Capacity Ratio (X) 0.374 0.754 0.264 0.930
Available Capacity (ca), veh/h 804 1417 1036 1056
Back of Queue (Q), veh/ln (95th percentile) 7.4 12.6 4.6 15.4
Queue Storage Ratio (RQ) (95th percentile) 0.00 0.00 0.00 0.00
Uniform Delay (d1), s/veh 16.7 26.8 9.7 30.3
Incremental Delay (d2), s/veh 1.3 0.8 0.6 3.3
Initial Queue Delay (d3), s/veh 0.0 0.0 0.0 0.0
Control Delay (d), s/veh 18.0 27.6 10.4 33.5
Level of Service (LOS) B C B C
Approach Delay, s/veh / LOS 18.0 B 20.7 C 33.5 C 0.0
Intersection Delay, s/veh / LOS 24.4 C
Multimodal Results EB WB NB SB
Pedestrian LOS Score / LOS 2.1 B 1.9 A 2.3 B 2.1 B
Bicycle LOS Score / LOS 1.0 A 1.6 A 1.3 A
Copyright © 2015 University of Florida, All Rights Reserved. HCS 2010™ Streets Version 6.70 Generated: 7/30/2015 2:20:35 PM

HCS 2010 Signalized Intersection Results Summary
General Information Intersection Information
Agency Duration, h 0.25
Analyst ASELLS Analysis Date Jul 22, 2015 Area Type Other
Jurisdiction Time Period Alt 5 AM PHF 0.92
Urban Street Jefferson Road Analysis Year 2030 Analysis Period 1> 7:30
Intersection Jefferson Rd & Connect… File Name Alt 5 AM - Jefferson & Connector Road.xus
Project Description
Demand Information EB WB NB SB
Approach Movement L T R L T R L T R L T R
Demand ( v ), veh/h 168 0 531 274 211 520
Signal Information
GreenYellowRed
18.0 44.8 11.2 0.0 0.0 0.03.0 3.5 3.5 0.0 0.0 0.02.0 2.0 2.0 0.0 0.0 0.0
1 3 4
6 7 8
Cycle, s 90.0 Reference Phase 2
Offset, s 0 Reference Point End
Uncoordinated No Simult. Gap E/W On
Force Mode Fixed Simult. Gap N/S On
Timer Results EBL EBT WBL WBT NBL NBT SBL SBT
Assigned Phase 4 5 2 6
Case Number 10.0 2.0 4.0 7.3
Phase Duration, s 16.7 23.0 73.3 50.3
Change Period, (Y+Rc), s 5.5 5.0 5.5 5.5
Max Allow Headway (MAH), s 3.1 3.1 0.0 0.0
Queue Clearance Time (gs), s 11.1 16.6
Green Extension Time (ge), s 0.2 1.4 0.0 0.0
Phase Call Probability 0.99 1.00
Max Out Probability 0.01 0.00
Movement Group Results EB WB NB SB
Approach Movement L T R L T R L T R L T R
Assigned Movement 7 4 5 2 6 16
Adjusted Flow Rate (v), veh/h 183 0 577 298 229 505
Adjusted Saturation Flow Rate (s), veh/h/ln 1762 1850 1711 1850 1850 1568
Queue Service Time (gs), s 9.1 0.0 14.6 4.3 6.4 21.5
Cycle Queue Clearance Time (gc), s 9.1 0.0 14.6 4.3 6.4 21.5
Green Ratio (g/C) 0.12 0.12 0.20 0.75 0.50 0.50
Capacity (c), veh/h 219 230 685 1394 921 781
Volume-to-Capacity Ratio (X) 0.835 0.000 0.843 0.214 0.249 0.647
Available Capacity (ca), veh/h 362 380 1837 1394 921 781
Back of Queue (Q), veh/ln (95th percentile) 7.2 0.0 9.9 2.0 4.6 12.3
Queue Storage Ratio (RQ) (95th percentile) 1.56 0.00 0.70 0.00 0.00 0.00
Uniform Delay (d1), s/veh 38.5 0.0 34.6 3.3 12.9 16.7
Incremental Delay (d2), s/veh 3.5 0.0 1.1 0.4 0.6 4.1
Initial Queue Delay (d3), s/veh 0.0 0.0 0.0 0.0 0.0 0.0
Control Delay (d), s/veh 42.0 0.0 35.8 3.6 13.6 20.9
Level of Service (LOS) D D A B C
Approach Delay, s/veh / LOS 42.0 D 0.0 24.8 C 18.6 B
Intersection Delay, s/veh / LOS 24.0 C
Multimodal Results EB WB NB SB
Pedestrian LOS Score / LOS 2.5 B 2.4 B 1.8 A 2.7 B
Bicycle LOS Score / LOS 0.8 A 1.9 A 1.7 A
Copyright © 2015 University of Florida, All Rights Reserved. HCS 2010™ Streets Version 6.70 Generated: 7/30/2015 2:15:44 PM

HCS 2010 Signalized Intersection Results Summary
General Information Intersection Information
Agency Duration, h 0.25
Analyst A SELLS Analysis Date Jul 22, 2015 Area Type Other
Jurisdiction Time Period Alt 5 AM PHF 0.92
Urban Street Jefferson Road Analysis Year 2030 Analysis Period 1> 7:30
Intersection Jefferson Rd & RHL Blvd File Name Alt 5 AM - Jefferson & RHL.xus
Project Description
Demand Information EB WB NB SB
Approach Movement L T R L T R L T R L T R
Demand ( v ), veh/h 102 0 2 1 719 732 16
Signal Information
GreenYellowRed
6.0 60.1 7.4 0.0 0.0 0.03.5 3.5 3.5 0.0 0.0 0.02.0 2.0 2.0 0.0 0.0 0.0
2 3 4
5 7 8
Cycle, s 90.0 Reference Phase 2
Offset, s 0 Reference Point End
Uncoordinated No Simult. Gap E/W On
Force Mode Fixed Simult. Gap N/S On
Timer Results EBL EBT WBL WBT NBL NBT SBL SBT
Assigned Phase 8 1 6 2
Case Number 9.0 1.0 4.0 7.3
Phase Duration, s 12.9 11.5 77.1 65.6
Change Period, (Y+Rc), s 5.5 5.5 5.5 5.5
Max Allow Headway (MAH), s 3.1 3.1 0.0 0.0
Queue Clearance Time (gs), s 7.7 2.0
Green Extension Time (ge), s 0.1 0.0 0.0 0.0
Phase Call Probability 0.94 1.00
Max Out Probability 0.00 0.00
Movement Group Results EB WB NB SB
Approach Movement L T R L T R L T R L T R
Assigned Movement 3 8 18 1 6 2 12
Adjusted Flow Rate (v), veh/h 111 0 2 1 782 796 14
Adjusted Saturation Flow Rate (s), veh/h/ln 1727 1850 1537 1727 1727 1727 1537
Queue Service Time (gs), s 5.7 0.0 0.1 0.0 5.4 8.9 0.3
Cycle Queue Clearance Time (gc), s 5.7 0.0 0.1 0.0 5.4 8.9 0.3
Green Ratio (g/C) 0.08 0.08 0.15 0.76 0.80 0.67 0.67
Capacity (c), veh/h 141 151 228 582 2749 2308 1027
Volume-to-Capacity Ratio (X) 0.786 0.000 0.010 0.002 0.284 0.345 0.014
Available Capacity (ca), veh/h 470 504 521 978 2749 2308 1027
Back of Queue (Q), veh/ln (95th percentile) 4.4 0.0 0.1 0.0 1.8 4.8 0.1
Queue Storage Ratio (RQ) (95th percentile) 1.13 0.00 0.02 0.00 0.00 0.00 0.03
Uniform Delay (d1), s/veh 40.6 0.0 32.7 3.3 2.4 6.4 5.0
Incremental Delay (d2), s/veh 3.6 0.0 0.0 0.0 0.3 0.4 0.0
Initial Queue Delay (d3), s/veh 0.0 0.0 0.0 0.0 0.0 0.0 0.0
Control Delay (d), s/veh 44.2 0.0 32.7 3.3 2.7 6.8 5.0
Level of Service (LOS) D C A A A A
Approach Delay, s/veh / LOS 43.9 D 0.0 2.7 A 6.8 A
Intersection Delay, s/veh / LOS 7.4 A
Multimodal Results EB WB NB SB
Pedestrian LOS Score / LOS 2.9 C 2.9 C 1.8 A 2.4 B
Bicycle LOS Score / LOS 0.7 A 1.1 A 1.2 A
Copyright © 2015 University of Florida, All Rights Reserved. HCS 2010™ Streets Version 6.70 Generated: 7/30/2015 2:19:05 PM

HCS 2010 Signalized Intersection Results Summary
General Information Intersection Information
Agency Duration, h 0.25
Analyst A SELLS Analysis Date Jul 22, 2015 Area Type Other
Jurisdiction Time Period Existing AM PHF 0.88
Urban Street Jefferson Road Analysis Year 2014 Analysis Period 1> 7:30
Intersection Jefferson Rd/Oakhurst a… File Name Existing AM - US 119 & Oakhurst.xus
Project Description
Demand Information EB WB NB SB
Approach Movement L T R L T R L T R L T R
Demand ( v ), veh/h 444 7 120 113 130 62
Signal Information
GreenYellowRed
12.4 53.5 39.1 0.0 0.0 0.04.0 4.0 4.0 0.0 0.0 0.00.5 0.5 2.0 0.0 0.0 0.0
1 3 4
5 6 7 8
Cycle, s 120.0 Reference Phase 2
Offset, s 0 Reference Point Begin
Uncoordinated No Simult. Gap E/W On
Force Mode Fixed Simult. Gap N/S On
Timer Results EBL EBT WBL WBT NBL NBT SBL SBT
Assigned Phase 4 2 1 6
Case Number 9.0 7.3 2.0 4.0
Phase Duration, s 45.1 58.0 16.9 74.9
Change Period, (Y+Rc), s 6.0 4.5 4.5 4.5
Max Allow Headway (MAH), s 3.1 0.0 3.1 0.0
Queue Clearance Time (gs), s 38.2 12.2
Green Extension Time (ge), s 0.9 0.0 0.2 0.0
Phase Call Probability 1.00 1.00
Max Out Probability 0.00 0.00
Movement Group Results EB WB NB SB
Approach Movement L T R L T R L T R L T R
Assigned Movement 7 14 2 12 1 6
Adjusted Flow Rate (v), veh/h 505 8 136 72 148 70
Adjusted Saturation Flow Rate (s), veh/h/ln 1631 1452 1762 1568 1711 1796
Queue Service Time (gs), s 36.2 0.4 5.6 3.2 10.2 2.0
Cycle Queue Clearance Time (gc), s 36.2 0.4 5.6 3.2 10.2 2.0
Green Ratio (g/C) 0.33 0.33 0.45 0.45 0.10 0.59
Capacity (c), veh/h 532 474 785 699 176 1053
Volume-to-Capacity Ratio (X) 0.948 0.017 0.174 0.102 0.837 0.067
Available Capacity (ca), veh/h 734 653 785 699 433 1053
Back of Queue (Q), veh/ln (95th percentile) 22.9 0.3 4.2 2.1 8.0 1.4
Queue Storage Ratio (RQ) (95th percentile) 0.00 0.02 0.00 0.00 0.95 0.00
Uniform Delay (d1), s/veh 39.4 27.4 20.0 19.3 52.8 10.7
Incremental Delay (d2), s/veh 15.7 0.0 0.5 0.3 4.0 0.1
Initial Queue Delay (d3), s/veh 0.0 0.0 0.0 0.0 0.0 0.0
Control Delay (d), s/veh 55.1 27.4 20.5 19.6 56.8 10.8
Level of Service (LOS) E C C B E B
Approach Delay, s/veh / LOS 54.7 D 0.0 20.2 C 42.0 D
Intersection Delay, s/veh / LOS 44.1 D
Multimodal Results EB WB NB SB
Pedestrian LOS Score / LOS 2.4 B 2.3 B 1.9 A 1.7 A
Bicycle LOS Score / LOS F 0.8 A 0.8 A
Copyright © 2015 University of Florida, All Rights Reserved. HCS 2010™ Streets Version 6.70 Generated: 7/30/2015 2:56:29 PM

Alt 5 PM Peak Unsignalized

TWO-WAY STOP CONTROL SUMMARY
General Information Site Information Analyst ASELLS Agency/Co. STANTEC Date Performed 11/25/2014 Analysis Time Period Alt 5 PM
Intersection Jurisdiction Analysis Year 2030
Project Description East/West Street: Bob Evans entrance North/South Street: Jefferson Road Intersection Orientation: North-South Study Period (hrs): 0.25
Vehicle Volumes and Adjustments Major Street Northbound Southbound Movement 1 2 3 4 5 6 L T R L T RVolume (veh/h) 10 585 869 45 Peak-Hour Factor, PHF 0.95 0.96 1.00 1.00 0.90 0.69 Hourly Flow Rate, HFR (veh/h)
10 609 0 0 965 65
Percent Heavy Vehicles 2 -- -- 0 -- -- Median Type Undivided RT Channelized 0 0 Lanes 0 2 0 0 2 0 Configuration LT T T TR Upstream Signal 1 0 Minor Street Eastbound Westbound Movement 7 8 9 10 11 12
L T R L T RVolume (veh/h) 20 25 Peak-Hour Factor, PHF 0.32 1.00 0.88 1.00 1.00 1.00 Hourly Flow Rate, HFR (veh/h) 62 0 28 0 0 0
Percent Heavy Vehicles 2 0 2 0 0 0 Percent Grade (%) 0 0 Flared Approach N N Storage 0 0 RT Channelized 0 0 Lanes 1 0 1 0 0 0 Configuration L R Delay, Queue Length, and Level of ServiceApproach Northbound Southbound Westbound Eastbound
Movement 1 4 7 8 9 10 11 12
Lane Configuration LT L R v (veh/h) 10 62 28 C (m) (veh/h) 666 148 555 v/c 0.02 0.42 0.05 95% queue length 0.05 1.85 0.16 Control Delay (s/veh) 10.5 45.8 11.8 LOS B E B Approach Delay (s/veh) -- -- 35.2 Approach LOS -- -- E
Copyright © 2010 University of Florida, All Rights Reserved HCS+TM Version 5.6 Generated: 7/28/2015 2:41 PM
Page 1 of 1Two-Way Stop Control
7/28/2015file://C:\Users\asells\AppData\Local\Temp\u2k4A21.tmp

TWO-WAY STOP CONTROL SUMMARY
General Information Site Information Analyst ASELLS Agency/Co. STANTEC Date Performed 11/25/2014 Analysis Time Period Alt 5 PM
Intersection Jurisdiction Analysis Year 2030
Project Description East/West Street: McDonalds entrance North/South Street: Jefferson Road Intersection Orientation: North-South Study Period (hrs): 0.25
Vehicle Volumes and Adjustments Major Street Northbound Southbound Movement 1 2 3 4 5 6 L T R L T RVolume (veh/h) 20 585 869 35 Peak-Hour Factor, PHF 0.78 0.94 1.00 1.00 0.89 0.87 Hourly Flow Rate, HFR (veh/h)
25 622 0 0 976 40
Percent Heavy Vehicles 2 -- -- 0 -- -- Median Type Undivided RT Channelized 0 0 Lanes 0 2 0 0 2 0 Configuration LT T T TR Upstream Signal 0 0 Minor Street Eastbound Westbound Movement 7 8 9 10 11 12
L T R L T RVolume (veh/h) 5 5 Peak-Hour Factor, PHF 1.00 1.00 1.00 1.00 1.00 1.00 Hourly Flow Rate, HFR (veh/h) 5 0 5 0 0 0
Percent Heavy Vehicles 2 0 2 0 0 0 Percent Grade (%) 0 0 Flared Approach N N Storage 0 0 RT Channelized 0 0 Lanes 1 0 1 0 0 0 Configuration L R Delay, Queue Length, and Level of ServiceApproach Northbound Southbound Westbound Eastbound
Movement 1 4 7 8 9 10 11 12
Lane Configuration LT L R v (veh/h) 25 5 5 C (m) (veh/h) 675 134 560 v/c 0.04 0.04 0.01 95% queue length 0.12 0.12 0.03 Control Delay (s/veh) 10.5 32.9 11.5 LOS B D B Approach Delay (s/veh) -- -- 22.2 Approach LOS -- -- C
Copyright © 2010 University of Florida, All Rights Reserved HCS+TM Version 5.6 Generated: 4/17/2015 8:51 AM
Page 1 of 1Two-Way Stop Control
4/17/2015file://C:\Users\asells\AppData\Local\Temp\u2k81AE.tmp

TWO-WAY STOP CONTROL SUMMARY
General Information Site Information Analyst ASELLS Agency/Co. STANTEC Date Performed 11/25/2014 Analysis Time Period Alt 5 PM
Intersection Jurisdiction Analysis Year 2030
Project Description East/West Street: Community Center - North North/South Street: Jefferson Road Intersection Orientation: North-South Study Period (hrs): 0.25
Vehicle Volumes and Adjustments Major Street Northbound Southbound Movement 1 2 3 4 5 6 L T R L T RVolume (veh/h) 10 585 869 35 Peak-Hour Factor, PHF 0.83 0.98 1.00 1.00 0.98 0.75 Hourly Flow Rate, HFR (veh/h)
12 596 0 0 886 46
Percent Heavy Vehicles 2 -- -- 0 -- -- Median Type Raised curb RT Channelized 0 0 Lanes 0 2 0 0 2 0 Configuration LT T T TR Upstream Signal 0 1 Minor Street Eastbound Westbound Movement 7 8 9 10 11 12
L T R L T RVolume (veh/h) 10 0 10 Peak-Hour Factor, PHF 0.88 1.00 0.79 1.00 1.00 1.00 Hourly Flow Rate, HFR (veh/h) 11 0 12 0 0 0
Percent Heavy Vehicles 2 0 2 0 0 0 Percent Grade (%) 0 0 Flared Approach N N Storage 0 0 RT Channelized 0 0 Lanes 0 1 0 0 0 0 Configuration LTR Delay, Queue Length, and Level of ServiceApproach Northbound Southbound Westbound Eastbound
Movement 1 4 7 8 9 10 11 12
Lane Configuration LT LTR v (veh/h) 12 23 C (m) (veh/h) 808 547 v/c 0.01 0.04 95% queue length 0.05 0.13 Control Delay (s/veh) 9.5 11.9 LOS A B Approach Delay (s/veh) -- -- 11.9 Approach LOS -- -- B
Copyright © 2010 University of Florida, All Rights Reserved HCS+TM Version 5.6 Generated: 7/28/2015 2:40 PM
Page 1 of 1Two-Way Stop Control
7/28/2015file://C:\Users\asells\AppData\Local\Temp\u2k992A.tmp

TWO-WAY STOP CONTROL SUMMARY
General Information Site Information Analyst A SELLS Agency/Co. STANTEC Date Performed 11/25/2014 Analysis Time Period Alt 5 PM
Intersection Jurisdiction Analysis Year 2030
Project Description East/West Street: Pennslyvania Avenue North/South Street: Jefferson Road Intersection Orientation: North-South Study Period (hrs): 0.25
Vehicle Volumes and Adjustments Major Street Northbound Southbound Movement 1 2 3 4 5 6 L T R L T RVolume (veh/h) 553 5 5 838 Peak-Hour Factor, PHF 1.00 0.83 1.00 0.50 0.97 1.00 Hourly Flow Rate, HFR (veh/h)
0 666 5 10 863 0
Percent Heavy Vehicles 0 -- -- 2 -- -- Median Type Undivided RT Channelized 0 0 Lanes 0 2 0 0 2 0 Configuration T TR LT T Upstream Signal 1 0 Minor Street Eastbound Westbound Movement 7 8 9 10 11 12
L T R L T RVolume (veh/h) 5 0 5 Peak-Hour Factor, PHF 1.00 1.00 1.00 0.65 1.00 0.65 Hourly Flow Rate, HFR (veh/h) 0 0 0 7 0 7
Percent Heavy Vehicles 0 0 0 2 0 2 Percent Grade (%) 0 0 Flared Approach N N Storage 0 0 RT Channelized 0 0 Lanes 0 0 0 0 1 0 Configuration LTR Delay, Queue Length, and Level of ServiceApproach Northbound Southbound Westbound Eastbound
Movement 1 4 7 8 9 10 11 12
Lane Configuration LT LTR v (veh/h) 10 14 C (m) (veh/h) 995 363 v/c 0.01 0.04 95% queue length 0.03 0.12 Control Delay (s/veh) 8.7 15.3 LOS A C Approach Delay (s/veh) -- -- 15.3 Approach LOS -- -- C
Copyright © 2010 University of Florida, All Rights Reserved HCS+TM Version 5.6 Generated: 7/28/2015 2:48 PM
Page 1 of 1Two-Way Stop Control
7/28/2015file://C:\Users\asells\AppData\Local\Temp\u2kCCD7.tmp

TWO-WAY STOP CONTROL SUMMARY
General Information Site Information Analyst A SELLS Agency/Co. Date Performed 12/3/2014 Analysis Time Period Alt 5 PM Peak
Intersection Jurisdiction Analysis Year 2030
Project Description East/West Street: Kramer Street North/South Street: Jefferson Road Intersection Orientation: North-South Study Period (hrs): 0.25
Vehicle Volumes and Adjustments Major Street Northbound Southbound Movement 1 2 3 4 5 6 L T R L T RVolume (veh/h) 1032 1076 5 Peak-Hour Factor, PHF 0.50 0.85 1.00 1.00 0.94 0.75 Hourly Flow Rate, HFR (veh/h)
0 1214 0 0 1144 6
Percent Heavy Vehicles 6 -- -- 0 -- -- Median Type Raised curb RT Channelized 0 0 Lanes 0 2 0 0 2 0 Configuration T T TR Upstream Signal 0 1 Minor Street Eastbound Westbound Movement 7 8 9 10 11 12
L T R L T RVolume (veh/h) 0 5 Peak-Hour Factor, PHF 0.75 1.00 0.33 0.80 1.00 0.85 Hourly Flow Rate, HFR (veh/h) 0 0 15 0 0 0
Percent Heavy Vehicles 100 0 100 3 0 0 Percent Grade (%) 0 0 Flared Approach N N Storage 0 0 RT Channelized 0 0 Lanes 0 1 0 0 0 0 Configuration TR Delay, Queue Length, and Level of ServiceApproach Northbound Southbound Westbound Eastbound
Movement 1 4 7 8 9 10 11 12
Lane Configuration TR v (veh/h) 15 C (m) (veh/h) 471 v/c 0.03 95% queue length 0.10 Control Delay (s/veh) 12.9 LOS B Approach Delay (s/veh) -- -- 12.9 Approach LOS -- -- B
Copyright © 2010 University of Florida, All Rights Reserved HCS+TM Version 5.6 Generated: 7/28/2015 2:46 PM
Page 1 of 1Two-Way Stop Control
7/28/2015file://C:\Users\asells\AppData\Local\Temp\u2k8B07.tmp

TWO-WAY STOP CONTROL SUMMARY
General Information Site Information Analyst A SELLS Agency/Co.Date Performed 12/3/2014 Analysis Time Period Alt 5 PM Peak
IntersectionJurisdictionAnalysis Year 2030
Project Description East/West Street: US 119 North/South Street: Jefferson Road Intersection Orientation: North-South Study Period (hrs): 0.25
Vehicle Volumes and Adjustments Major Street Northbound Southbound Movement 1 2 3 4 5 6
L T R L T RVolume (veh/h) 29 548 376 Peak-Hour Factor, PHF 0.60 0.89 1.00 1.00 0.83 1.00 Hourly Flow Rate, HFR (veh/h)
48 615 0 0 453 0
Percent Heavy Vehicles 4 -- -- 0 -- -- Median Type Undivided RT Channelized 0 0 Lanes 1 1 0 0 1 0 Configuration L T T Upstream Signal 0 1 Minor Street Eastbound Westbound Movement 7 8 9 10 11 12
L T R L T RVolume (veh/h) 79 164 Peak-Hour Factor, PHF 1.00 1.00 1.00 0.69 1.00 0.78 Hourly Flow Rate, HFR (veh/h) 0 0 0 114 0 210
Percent Heavy Vehicles 0 0 0 5 0 0 Percent Grade (%) 0 0 Flared Approach N N Storage 0 0 RT Channelized 0 0 Lanes 0 0 0 1 0 1 Configuration L R Delay, Queue Length, and Level of ServiceApproach Northbound Southbound Westbound Eastbound
Movement 1 4 7 8 9 10 11 12
Lane Configuration L L R v (veh/h) 48 114 210 C (m) (veh/h) 1111 176 495 v/c 0.04 0.65 0.42 95% queue length 0.14 3.73 2.09 Control Delay (s/veh) 8.4 56.8 17.5 LOS A F C Approach Delay (s/veh) -- -- 31.4 Approach LOS -- -- D
Copyright © 2010 University of Florida, All Rights Reserved HCS+TM Version 5.6 Generated: 7/28/2015 2:58 PM
Page 1 of 1Two-Way Stop Control
7/28/2015file://C:\Users\asells\AppData\Local\Temp\u2k66C5.tmp
Alt 5 PM Peak Signalized

HCS 2010 Signalized Intersection Results Summary
General Information Intersection Information
Agency Duration, h 0.25
Analyst A SELLS Analysis Date Jul 22, 2015 Area Type Other
Jurisdiction Time Period Alt 5 PM PHF 0.91
Urban Street MacCorkle Avenue Analysis Year 2030 Analysis Period 1> 4:30
Intersection MacCorkle Ave & Kenna … File Name Alt 5 PM - MacCorkle.xus
Project Description
Demand Information EB WB NB SB
Approach Movement L T R L T R L T R L T R
Demand ( v ), veh/h 9 1503 12 51 2056 2 0 0 48 16 0 0
Signal Information
GreenYellowRed
2.3 0.3 94.9 7.4 0.0 0.03.0 4.0 4.0 4.0 0.0 0.01.0 1.0 2.0 1.0 0.0 0.0
1 2 3
5 6 7 8
Cycle, s 125.0 Reference Phase 2
Offset, s 0 Reference Point End
Uncoordinated No Simult. Gap E/W On
Force Mode Fixed Simult. Gap N/S On
Timer Results EBL EBT WBL WBT NBL NBT SBL SBT
Assigned Phase 1 6 5 2 4 8
Case Number 2.0 4.0 2.0 3.0 8.0 7.0
Phase Duration, s 6.3 100.9 11.7 106.3 12.4 12.4
Change Period, (Y+Rc), s 4.0 6.0 5.0 6.0 5.0 5.0
Max Allow Headway (MAH), s 3.1 0.0 3.1 0.0 3.3 3.3
Queue Clearance Time (gs), s 2.7 5.7 2.8 4.3
Green Extension Time (ge), s 0.0 0.0 0.0 0.0 0.0 0.0
Phase Call Probability 0.29 0.83 0.61 0.61
Max Out Probability 0.00 0.00 0.00 0.00
Movement Group Results EB WB NB SB
Approach Movement L T R L T R L T R L T R
Assigned Movement 1 6 16 5 2 12 7 4 14 3 8 18
Adjusted Flow Rate (v), veh/h 10 1111 553 52 2087 2 0 18 0
Adjusted Saturation Flow Rate (s), veh/h/ln 1727 1779 1771 1727 1693 1537 0 1256 1537
Queue Service Time (gs), s 0.7 0.0 0.0 3.7 32.7 0.0 0.0 1.5 0.0
Cycle Queue Clearance Time (gc), s 0.7 0.0 0.0 3.7 32.7 0.0 0.0 2.3 0.0
Green Ratio (g/C) 0.02 0.76 0.76 0.05 0.80 0.80 0.06 0.06
Capacity (c), veh/h 32 2702 1345 92 2718 1233 132 91
Volume-to-Capacity Ratio (X) 0.308 0.411 0.411 0.561 0.768 0.002 0.000 0.133 0.000
Available Capacity (ca), veh/h 326 2702 1345 313 2718 1233 273 246
Back of Queue (Q), veh/ln (95th percentile) 0.6 0.3 0.6 3.0 8.6 0.0 0.0 1.0 0.0
Queue Storage Ratio (RQ) (95th percentile) 0.07 0.00 0.00 0.00 0.00 0.00 0.00 0.00 0.00
Uniform Delay (d1), s/veh 60.2 0.0 0.0 60.1 4.2 1.8 56.8 0.0
Incremental Delay (d2), s/veh 2.0 0.5 0.9 1.3 1.4 0.0 0.0 0.2 0.0
Initial Queue Delay (d3), s/veh 0.0 0.0 0.0 0.0 0.0 0.0 0.0 0.0 0.0
Control Delay (d), s/veh 62.1 0.5 0.9 61.3 5.6 1.8 56.9 0.0
Level of Service (LOS) E A A E A A E
Approach Delay, s/veh / LOS 1.0 A 6.9 A 55.9 E 56.9 E
Intersection Delay, s/veh / LOS 4.7 A
Multimodal Results EB WB NB SB
Pedestrian LOS Score / LOS 2.1 B 2.2 B 3.3 C 3.0 C
Bicycle LOS Score / LOS 1.4 A 2.4 B 0.5 A 0.5 A
Copyright © 2015 University of Florida, All Rights Reserved. HCS 2010™ Streets Version 6.70 Generated: 7/31/2015 3:54:57 PM

HCS 2010 Signalized Intersection Results Summary
General Information Intersection Information
Agency Duration, h 0.25
Analyst A SELLS Analysis Date Jul 22, 2015 Area Type Other
Jurisdiction Time Period Alt 5 PM PHF 0.91
Urban Street MacCorkle Avenue Analysis Year 2030 Analysis Period 1> 4:30
Intersection MacCorkle Ave & I-64 EB File Name Alt 5 PM - MacCorkle.xus
Project Description
Demand Information EB WB NB SB
Approach Movement L T R L T R L T R L T R
Demand ( v ), veh/h 1012 1 2060 45 0
Signal Information
GreenYellowRed
0.2 104.9 4.9 0.0 0.0 0.04.0 4.0 4.0 0.0 0.0 0.01.0 1.0 1.0 0.0 0.0 0.0
1 2 3
5 6 7 8
Cycle, s 125.0 Reference Phase 2
Offset, s 0 Reference Point End
Uncoordinated No Simult. Gap E/W On
Force Mode Fixed Simult. Gap N/S On
Timer Results EBL EBT WBL WBT NBL NBT SBL SBT
Assigned Phase 6 5 2 4
Case Number 8.3 1.0 4.0 12.0
Phase Duration, s 109.9 5.2 115.1 9.9
Change Period, (Y+Rc), s 5.0 5.0 5.0 5.0
Max Allow Headway (MAH), s 0.0 3.1 0.0 3.1
Queue Clearance Time (gs), s 2.0 5.8
Green Extension Time (ge), s 0.0 0.0 0.0 0.0
Phase Call Probability 0.03 0.82
Max Out Probability 0.00 0.00
Movement Group Results EB WB NB SB
Approach Movement L T R L T R L T R L T R
Assigned Movement 6 5 2 7 4
Adjusted Flow Rate (v), veh/h 1722 1 2091 49
Adjusted Saturation Flow Rate (s), veh/h/ln 1727 1678 1677 1631
Queue Service Time (gs), s 23.2 0.0 35.7 3.8
Cycle Queue Clearance Time (gc), s 23.2 0.0 35.7 3.8
Green Ratio (g/C) 0.84 0.86 0.88 0.04
Capacity (c), veh/h 2897 239 2954 64
Volume-to-Capacity Ratio (X) 0.594 0.004 0.708 0.770
Available Capacity (ca), veh/h 2897 573 2954 261
Back of Queue (Q), veh/ln (95th percentile) 10.1 0.0 13.1 3.0
Queue Storage Ratio (RQ) (95th percentile) 0.00 0.00 0.00 0.00
Uniform Delay (d1), s/veh 4.2 3.9 5.0 59.5
Incremental Delay (d2), s/veh 0.8 0.0 0.7 7.0
Initial Queue Delay (d3), s/veh 0.0 0.0 0.0 0.0
Control Delay (d), s/veh 5.0 3.9 5.7 66.5
Level of Service (LOS) A A A E
Approach Delay, s/veh / LOS 5.0 A 5.7 A 66.5 E 0.0
Intersection Delay, s/veh / LOS 6.2 A
Multimodal Results EB WB NB SB
Pedestrian LOS Score / LOS 2.0 B 1.8 A 2.9 C 2.8 C
Bicycle LOS Score / LOS 1.4 A 2.4 B 0.6 A
Copyright © 2015 University of Florida, All Rights Reserved. HCS 2010™ Streets Version 6.70 Generated: 7/31/2015 3:54:57 PM
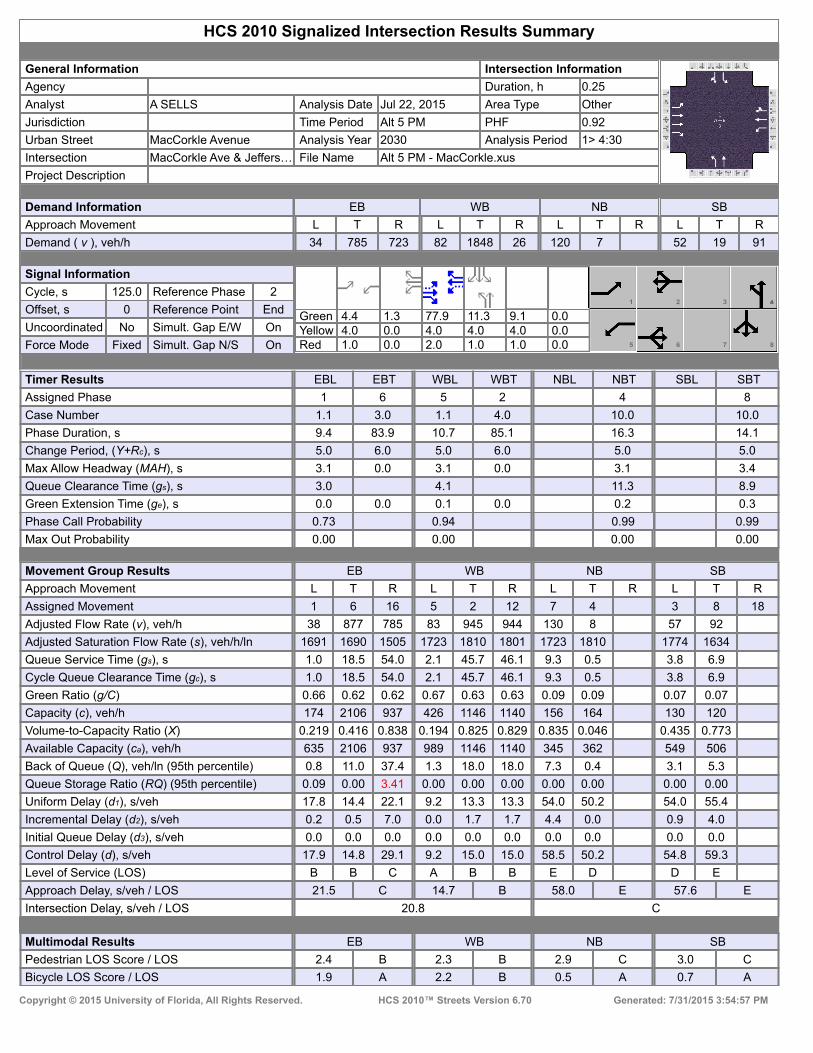
HCS 2010 Signalized Intersection Results Summary
General Information Intersection Information
Agency Duration, h 0.25
Analyst A SELLS Analysis Date Jul 22, 2015 Area Type Other
Jurisdiction Time Period Alt 5 PM PHF 0.92
Urban Street MacCorkle Avenue Analysis Year 2030 Analysis Period 1> 4:30
Intersection MacCorkle Ave & Jeffers… File Name Alt 5 PM - MacCorkle.xus
Project Description
Demand Information EB WB NB SB
Approach Movement L T R L T R L T R L T R
Demand ( v ), veh/h 34 785 723 82 1848 26 120 7 52 19 91
Signal Information
GreenYellowRed
4.4 1.3 77.9 11.3 9.1 0.04.0 0.0 4.0 4.0 4.0 0.01.0 0.0 2.0 1.0 1.0 0.0
1 2 3
5 6 7 8
Cycle, s 125.0 Reference Phase 2
Offset, s 0 Reference Point End
Uncoordinated No Simult. Gap E/W On
Force Mode Fixed Simult. Gap N/S On
Timer Results EBL EBT WBL WBT NBL NBT SBL SBT
Assigned Phase 1 6 5 2 4 8
Case Number 1.1 3.0 1.1 4.0 10.0 10.0
Phase Duration, s 9.4 83.9 10.7 85.1 16.3 14.1
Change Period, (Y+Rc), s 5.0 6.0 5.0 6.0 5.0 5.0
Max Allow Headway (MAH), s 3.1 0.0 3.1 0.0 3.1 3.4
Queue Clearance Time (gs), s 3.0 4.1 11.3 8.9
Green Extension Time (ge), s 0.0 0.0 0.1 0.0 0.2 0.3
Phase Call Probability 0.73 0.94 0.99 0.99
Max Out Probability 0.00 0.00 0.00 0.00
Movement Group Results EB WB NB SB
Approach Movement L T R L T R L T R L T R
Assigned Movement 1 6 16 5 2 12 7 4 3 8 18
Adjusted Flow Rate (v), veh/h 38 877 785 83 945 944 130 8 57 92
Adjusted Saturation Flow Rate (s), veh/h/ln 1691 1690 1505 1723 1810 1801 1723 1810 1774 1634
Queue Service Time (gs), s 1.0 18.5 54.0 2.1 45.7 46.1 9.3 0.5 3.8 6.9
Cycle Queue Clearance Time (gc), s 1.0 18.5 54.0 2.1 45.7 46.1 9.3 0.5 3.8 6.9
Green Ratio (g/C) 0.66 0.62 0.62 0.67 0.63 0.63 0.09 0.09 0.07 0.07
Capacity (c), veh/h 174 2106 937 426 1146 1140 156 164 130 120
Volume-to-Capacity Ratio (X) 0.219 0.416 0.838 0.194 0.825 0.829 0.835 0.046 0.435 0.773
Available Capacity (ca), veh/h 635 2106 937 989 1146 1140 345 362 549 506
Back of Queue (Q), veh/ln (95th percentile) 0.8 11.0 37.4 1.3 18.0 18.0 7.3 0.4 3.1 5.3
Queue Storage Ratio (RQ) (95th percentile) 0.09 0.00 3.41 0.00 0.00 0.00 0.00 0.00 0.00 0.00
Uniform Delay (d1), s/veh 17.8 14.4 22.1 9.2 13.3 13.3 54.0 50.2 54.0 55.4
Incremental Delay (d2), s/veh 0.2 0.5 7.0 0.0 1.7 1.7 4.4 0.0 0.9 4.0
Initial Queue Delay (d3), s/veh 0.0 0.0 0.0 0.0 0.0 0.0 0.0 0.0 0.0 0.0
Control Delay (d), s/veh 17.9 14.8 29.1 9.2 15.0 15.0 58.5 50.2 54.8 59.3
Level of Service (LOS) B B C A B B E D D E
Approach Delay, s/veh / LOS 21.5 C 14.7 B 58.0 E 57.6 E
Intersection Delay, s/veh / LOS 20.8 C
Multimodal Results EB WB NB SB
Pedestrian LOS Score / LOS 2.4 B 2.3 B 2.9 C 3.0 C
Bicycle LOS Score / LOS 1.9 A 2.2 B 0.5 A 0.7 A
Copyright © 2015 University of Florida, All Rights Reserved. HCS 2010™ Streets Version 6.70 Generated: 7/31/2015 3:54:57 PM

HCS 2010 Signalized Intersection Results Summary
General Information Intersection Information
Agency Duration, h 0.25
Analyst A SELLS Analysis Date Jul 22, 2015 Area Type Other
Jurisdiction Time Period Alt 5 PM PHF 0.91
Urban Street MacCorkle Avenue Analysis Year 2030 Analysis Period 1> 4:30
Intersection MacCorkle Ave & I-64 WB File Name Alt 5 PM - MacCorkle.xus
Project Description
Demand Information EB WB NB SB
Approach Movement L T R L T R L T R L T R
Demand ( v ), veh/h 753 491 233 1250 698 0
Signal Information
GreenYellowRed
13.4 52.6 45.0 0.0 0.0 0.04.0 4.0 4.0 0.0 0.0 0.01.0 1.0 0.0 0.0 0.0 0.0
1 2 3
5 6 7 8
Cycle, s 125.0 Reference Phase 2
Offset, s 0 Reference Point End
Uncoordinated No Simult. Gap E/W On
Force Mode Fixed Simult. Gap N/S On
Timer Results EBL EBT WBL WBT NBL NBT SBL SBT
Assigned Phase 6 5 2 4
Case Number 7.3 1.0 4.0 10.0
Phase Duration, s 57.6 18.4 76.0 49.0
Change Period, (Y+Rc), s 5.0 5.0 5.0 4.0
Max Allow Headway (MAH), s 0.0 3.1 0.0 3.1
Queue Clearance Time (gs), s 13.0 47.0
Green Extension Time (ge), s 0.0 0.4 0.0 0.0
Phase Call Probability 1.00 1.00
Max Out Probability 0.00 1.00
Movement Group Results EB WB NB SB
Approach Movement L T R L T R L T R L T R
Assigned Movement 6 16 5 2 7 4
Adjusted Flow Rate (v), veh/h 619 354 256 1374 767 0
Adjusted Saturation Flow Rate (s), veh/h/ln 1693 1507 1616 1616 1662 1850
Queue Service Time (gs), s 11.8 16.1 11.0 29.8 45.0 0.0
Cycle Queue Clearance Time (gc), s 11.8 16.1 11.0 29.8 45.0 0.0
Green Ratio (g/C) 0.42 0.42 0.54 0.57 0.36 0.36
Capacity (c), veh/h 1427 635 476 1836 598 666
Volume-to-Capacity Ratio (X) 0.434 0.558 0.538 0.748 1.282 0.000
Available Capacity (ca), veh/h 1427 635 626 1836 598 666
Back of Queue (Q), veh/ln (95th percentile) 7.1 8.2 6.6 11.4 59.7 0.0
Queue Storage Ratio (RQ) (95th percentile) 0.00 0.00 0.00 0.00 3.37 0.00
Uniform Delay (d1), s/veh 15.8 15.5 16.0 10.2 40.0 0.0
Incremental Delay (d2), s/veh 0.9 3.2 0.4 2.8 139.3 0.0
Initial Queue Delay (d3), s/veh 0.0 0.0 0.0 0.0 0.0 0.0
Control Delay (d), s/veh 16.7 18.7 16.3 13.0 179.3 0.0
Level of Service (LOS) B B B B F
Approach Delay, s/veh / LOS 17.4 B 13.5 B 179.3 F 0.0
Intersection Delay, s/veh / LOS 52.4 D
Multimodal Results EB WB NB SB
Pedestrian LOS Score / LOS 2.3 B 1.9 A 2.9 C 3.0 C
Bicycle LOS Score / LOS 1.6 A 1.8 A 1.8 A
Copyright © 2015 University of Florida, All Rights Reserved. HCS 2010™ Streets Version 6.70 Generated: 7/31/2015 3:54:57 PM

HCS 2010 Signalized Intersection Results Summary
General Information Intersection Information
Agency Duration, h 0.25
Analyst A SELLS Analysis Date Jul 22, 2015 Area Type Other
Jurisdiction Time Period ALT 5 PM PHF 0.92
Urban Street Jefferson Road Analysis Year 2030 Analysis Period 1> 4:30
Intersection Jefferson Rd & Access Rd File Name ALT 5 PM - Jefferson & Access Road.xus
Project Description
Demand Information EB WB NB SB
Approach Movement L T R L T R L T R L T R
Demand ( v ), veh/h 1 1 1 36 1 30 1 505 2 64 767 1
Signal Information
GreenYellowRed
5.2 68.9 5.3 0.5 0.0 0.04.0 4.0 4.0 4.0 0.0 0.01.0 1.0 1.0 1.0 0.0 0.0
1 2 3 4
5 7 8
Cycle, s 100.0 Reference Phase 2
Offset, s 0 Reference Point End
Uncoordinated No Simult. Gap E/W On
Force Mode Fixed Simult. Gap N/S On
Timer Results EBL EBT WBL WBT NBL NBT SBL SBT
Assigned Phase 8 4 6 5 2
Case Number 12.0 12.0 6.3 2.0 4.0
Phase Duration, s 5.5 10.3 73.9 10.2 84.1
Change Period, (Y+Rc), s 5.0 5.0 5.0 5.0 5.0
Max Allow Headway (MAH), s 3.3 3.4 0.0 3.1 0.0
Queue Clearance Time (gs), s 2.2 6.2 6.0
Green Extension Time (ge), s 0.0 0.1 0.0 0.1 0.0
Phase Call Probability 0.09 0.86 0.86
Max Out Probability 0.00 0.00 0.00
Movement Group Results EB WB NB SB
Approach Movement L T R L T R L T R L T R
Assigned Movement 3 8 18 7 4 14 1 6 16 5 2 12
Adjusted Flow Rate (v), veh/h 3 70 1 276 275 70 417 417
Adjusted Saturation Flow Rate (s), veh/h/ln 1685 1643 655 1814 1811 1727 1814 1813
Queue Service Time (gs), s 0.2 4.2 0.1 5.6 5.6 4.0 6.2 6.2
Cycle Queue Clearance Time (gc), s 0.2 4.2 0.1 5.6 5.6 4.0 6.2 6.2
Green Ratio (g/C) 0.01 0.05 0.69 0.69 0.69 0.05 0.79 0.79
Capacity (c), veh/h 9 88 524 1250 1249 90 1435 1435
Volume-to-Capacity Ratio (X) 0.372 0.793 0.002 0.221 0.221 0.774 0.291 0.291
Available Capacity (ca), veh/h 415 246 524 1250 1249 676 1435 1435
Back of Queue (Q), veh/ln (95th percentile) 0.2 3.3 0.0 3.4 3.4 3.2 2.7 2.8
Queue Storage Ratio (RQ) (95th percentile) 0.00 0.00 0.00 0.00 0.00 0.57 0.00 0.00
Uniform Delay (d1), s/veh 49.6 46.8 4.8 5.7 5.7 46.8 2.8 2.8
Incremental Delay (d2), s/veh 9.4 5.9 0.0 0.4 0.4 5.2 0.5 0.5
Initial Queue Delay (d3), s/veh 0.0 0.0 0.0 0.0 0.0 0.0 0.0 0.0
Control Delay (d), s/veh 59.0 52.7 4.8 6.1 6.1 52.1 3.3 3.3
Level of Service (LOS) E D A A A D A A
Approach Delay, s/veh / LOS 59.0 E 52.7 D 6.1 A 7.1 A
Intersection Delay, s/veh / LOS 8.9 A
Multimodal Results EB WB NB SB
Pedestrian LOS Score / LOS 2.9 C 2.9 C 2.1 B 2.0 B
Bicycle LOS Score / LOS 0.5 A 0.6 A 0.9 A 1.2 A
Copyright © 2015 University of Florida, All Rights Reserved. HCS 2010™ Streets Version 6.70 Generated: 7/30/2015 3:16:04 PM

HCS 2010 Signalized Intersection Results Summary
General Information Intersection Information
Agency Duration, h 0.25
Analyst A SELLS Analysis Date Jul 22, 2015 Area Type Other
Jurisdiction Time Period Alt 5 PM PHF 0.92
Urban Street Connector Road Analysis Year 2030 Analysis Period 1> 4:30
Intersection Connector Rd & Kanaw… File Name Alt 5 PM - Kanawha.xus
Project Description
Demand Information EB WB NB SB
Approach Movement L T R L T R L T R L T R
Demand ( v ), veh/h 260 534 494 468 0
Signal Information
GreenYellowRed
20.7 30.0 29.3 0.0 0.0 0.04.0 4.0 4.0 0.0 0.0 0.01.0 1.0 1.0 0.0 0.0 0.0
1 2 3
5 6 7 8
Cycle, s 95.0 Reference Phase 2
Offset, s 0 Reference Point End
Uncoordinated No Simult. Gap E/W On
Force Mode Fixed Simult. Gap N/S On
Timer Results EBL EBT WBL WBT NBL NBT SBL SBT
Assigned Phase 2 1 6 4
Case Number 8.3 1.0 4.0 12.0
Phase Duration, s 35.0 25.7 60.7 34.3
Change Period, (Y+Rc), s 5.0 5.0 5.0 5.0
Max Allow Headway (MAH), s 0.0 3.1 0.0 3.1
Queue Clearance Time (gs), s 22.7 28.7
Green Extension Time (ge), s 0.0 0.0 0.0 0.7
Phase Call Probability 1.00 1.00
Max Out Probability 1.00 0.14
Movement Group Results EB WB NB SB
Approach Movement L T R L T R L T R L T R
Assigned Movement 2 1 6 7 4
Adjusted Flow Rate (v), veh/h 283 580 537 509
Adjusted Saturation Flow Rate (s), veh/h/ln 1850 1762 1850 1762
Queue Service Time (gs), s 11.7 20.7 16.1 26.7
Cycle Queue Clearance Time (gc), s 11.7 20.7 16.1 26.7
Green Ratio (g/C) 0.32 0.55 0.59 0.31
Capacity (c), veh/h 584 674 1084 544
Volume-to-Capacity Ratio (X) 0.484 0.861 0.495 0.936
Available Capacity (ca), veh/h 584 674 1084 649
Back of Queue (Q), veh/ln (95th percentile) 9.2 14.2 10.3 19.4
Queue Storage Ratio (RQ) (95th percentile) 0.00 0.00 0.00 0.00
Uniform Delay (d1), s/veh 26.2 16.2 11.5 31.9
Incremental Delay (d2), s/veh 2.9 10.6 1.6 17.9
Initial Queue Delay (d3), s/veh 0.0 0.0 0.0 0.0
Control Delay (d), s/veh 29.1 26.7 13.1 49.8
Level of Service (LOS) C C B D
Approach Delay, s/veh / LOS 29.1 C 20.2 C 49.8 D 0.0
Intersection Delay, s/veh / LOS 29.4 C
Multimodal Results EB WB NB SB
Pedestrian LOS Score / LOS 2.1 B 1.9 A 2.3 B 2.1 B
Bicycle LOS Score / LOS 1.0 A 2.3 B 1.3 A
Copyright © 2015 University of Florida, All Rights Reserved. HCS 2010™ Streets Version 6.70 Generated: 7/30/2015 10:49:35 AM

HCS 2010 Signalized Intersection Results Summary
General Information Intersection Information
Agency Duration, h 0.25
Analyst A SELLS Analysis Date Jul 22, 2015 Area Type Other
Jurisdiction Time Period Alt 5 PM PHF 0.92
Urban Street Jefferson Road Analysis Year 2030 Analysis Period 1> 4:30
Intersection Jefferson Rd & Connect… File Name Alt 5 PM - Jefferson & Connector Road.xus
Project Description
Demand Information EB WB NB SB
Approach Movement L T R L T R L T R L T R
Demand ( v ), veh/h 115 0 627 412 379 429
Signal Information
GreenYellowRed
20.7 45.3 8.0 0.0 0.0 0.03.0 3.5 3.5 0.0 0.0 0.02.0 2.0 2.0 0.0 0.0 0.0
1 3 4
6 7 8
Cycle, s 90.0 Reference Phase 2
Offset, s 0 Reference Point End
Uncoordinated No Simult. Gap E/W On
Force Mode Fixed Simult. Gap N/S On
Timer Results EBL EBT WBL WBT NBL NBT SBL SBT
Assigned Phase 4 5 2 6
Case Number 10.0 2.0 4.0 7.3
Phase Duration, s 13.5 25.7 76.5 50.8
Change Period, (Y+Rc), s 5.5 5.0 5.5 5.5
Max Allow Headway (MAH), s 3.1 3.1 0.0 0.0
Queue Clearance Time (gs), s 8.3 19.2
Green Extension Time (ge), s 0.1 1.5 0.0 0.0
Phase Call Probability 0.96 1.00
Max Out Probability 0.02 0.01
Movement Group Results EB WB NB SB
Approach Movement L T R L T R L T R L T R
Assigned Movement 7 4 5 2 6 16
Adjusted Flow Rate (v), veh/h 125 0 682 448 412 416
Adjusted Saturation Flow Rate (s), veh/h/ln 1762 1850 1711 1850 1850 1568
Queue Service Time (gs), s 6.3 0.0 17.2 6.1 12.8 16.2
Cycle Queue Clearance Time (gc), s 6.3 0.0 17.2 6.1 12.8 16.2
Green Ratio (g/C) 0.09 0.09 0.23 0.79 0.50 0.50
Capacity (c), veh/h 156 164 787 1460 931 789
Volume-to-Capacity Ratio (X) 0.799 0.000 0.866 0.307 0.442 0.527
Available Capacity (ca), veh/h 284 298 1198 1460 931 789
Back of Queue (Q), veh/ln (95th percentile) 5.0 0.0 11.5 2.5 8.9 9.6
Queue Storage Ratio (RQ) (95th percentile) 1.08 0.00 0.82 0.00 0.00 0.00
Uniform Delay (d1), s/veh 40.2 0.0 33.3 2.6 14.3 15.1
Incremental Delay (d2), s/veh 3.5 0.0 2.9 0.5 1.5 2.5
Initial Queue Delay (d3), s/veh 0.0 0.0 0.0 0.0 0.0 0.0
Control Delay (d), s/veh 43.8 0.0 36.2 3.2 15.8 17.6
Level of Service (LOS) D D A B B
Approach Delay, s/veh / LOS 43.8 D 0.0 23.1 C 16.7 B
Intersection Delay, s/veh / LOS 21.8 C
Multimodal Results EB WB NB SB
Pedestrian LOS Score / LOS 2.5 B 2.4 B 1.8 A 2.7 B
Bicycle LOS Score / LOS 0.7 A 2.4 B 1.9 A
Copyright © 2015 University of Florida, All Rights Reserved. HCS 2010™ Streets Version 6.70 Generated: 7/30/2015 10:46:04 AM

HCS 2010 Signalized Intersection Results Summary
General Information Intersection Information
Agency Duration, h 0.25
Analyst A SELLS Analysis Date 12/5/2014 Area Type Other
Jurisdiction Time Period Alt 5 PM PHF 0.92
Urban Street Jefferson Road Analysis Year 2030 Analysis Period 1> 4:30
Intersection Jefferson Rd & RHL Blvd File Name Alt 5 PM - Jefferson & RHL.xus
Project Description
Demand Information EB WB NB SB
Approach Movement L T R L T R L T R L T R
Demand ( v ), veh/h 375 0 69 28 663 912 189
Signal Information
GreenYellowRed
55.7 23.3 0.0 0.0 0.0 0.03.5 3.5 0.0 0.0 0.0 0.02.0 2.0 0.0 0.0 0.0 0.0
1 2 3 4
5 7 8
Cycle, s 90.0 Reference Phase 2
Offset, s 0 Reference Point End
Uncoordinated No Simult. Gap E/W On
Force Mode Fixed Simult. Gap N/S On
Timer Results EBL EBT WBL WBT NBL NBT SBL SBT
Assigned Phase 8 6 2
Case Number 9.0 6.0 7.0
Phase Duration, s 28.8 61.2 61.2
Change Period, (Y+Rc), s 5.5 5.5 5.5
Max Allow Headway (MAH), s 3.1 0.0 0.0
Queue Clearance Time (gs), s 22.6
Green Extension Time (ge), s 0.7 0.0 0.0
Phase Call Probability 1.00
Max Out Probability 0.05
Movement Group Results EB WB NB SB
Approach Movement L T R L T R L T R L T R
Assigned Movement 3 8 18 1 6 2 12
Adjusted Flow Rate (v), veh/h 408 0 68 30 721 991 200
Adjusted Saturation Flow Rate (s), veh/h/ln 1727 1850 1537 566 1727 1727 1537
Queue Service Time (gs), s 20.6 0.0 3.1 2.7 9.0 13.8 5.1
Cycle Queue Clearance Time (gc), s 20.6 0.0 3.1 16.5 9.0 13.8 5.1
Green Ratio (g/C) 0.26 0.26 0.26 0.62 0.62 0.62 0.62
Capacity (c), veh/h 447 478 397 344 2138 2138 952
Volume-to-Capacity Ratio (X) 0.912 0.000 0.172 0.089 0.337 0.464 0.210
Available Capacity (ca), veh/h 585 627 521 344 2138 2138 952
Back of Queue (Q), veh/ln (95th percentile) 15.0 0.0 2.0 0.7 5.3 8.0 2.8
Queue Storage Ratio (RQ) (95th percentile) 3.80 0.00 0.50 0.28 0.00 0.00 0.54
Uniform Delay (d1), s/veh 32.4 0.0 25.9 13.6 8.2 9.2 7.5
Incremental Delay (d2), s/veh 13.7 0.0 0.1 0.5 0.4 0.7 0.5
Initial Queue Delay (d3), s/veh 0.0 0.0 0.0 0.0 0.0 0.0 0.0
Control Delay (d), s/veh 46.1 0.0 26.0 14.1 8.7 9.9 8.0
Level of Service (LOS) D C B A A A
Approach Delay, s/veh / LOS 43.2 D 0.0 8.9 A 9.6 A
Intersection Delay, s/veh / LOS 16.0 B
Multimodal Results EB WB NB SB
Pedestrian LOS Score / LOS 2.9 C 2.9 C 1.9 A 2.4 B
Bicycle LOS Score / LOS 1.3 A 1.1 A 1.5 A
Copyright © 2015 University of Florida, All Rights Reserved. HCS 2010™ Streets Version 6.70 Generated: 7/30/2015 10:48:05 AM

HCS 2010 Signalized Intersection Results Summary
General Information Intersection Information
Agency Duration, h 0.25
Analyst A SELLS Analysis Date Jul 22, 2015 Area Type Other
Jurisdiction Time Period Alt 5 PM PHF 0.88
Urban Street Jefferson Road Analysis Year 2030 Analysis Period 1> 4:30
Intersection Jefferson Rd/Oakhurst … File Name Alt 5 PM - US 119 & Oakhurst.xus
Project Description
Demand Information EB WB NB SB
Approach Movement L T R L T R L T R L T R
Demand ( v ), veh/h 549 29 122 47 156 219
Signal Information
GreenYellowRed
14.4 44.3 47.8 0.0 0.0 0.04.0 4.0 4.0 0.0 0.0 0.00.5 0.5 0.5 0.0 0.0 0.0
1 3 4
5 6 7 8
Cycle, s 120.0 Reference Phase 2
Offset, s 0 Reference Point Begin
Uncoordinated No Simult. Gap E/W On
Force Mode Fixed Simult. Gap N/S On
Timer Results EBL EBT WBL WBT NBL NBT SBL SBT
Assigned Phase 4 2 1 6
Case Number 9.0 7.3 2.0 4.0
Phase Duration, s 52.3 48.8 18.9 67.7
Change Period, (Y+Rc), s 4.5 4.5 4.5 4.5
Max Allow Headway (MAH), s 3.1 0.0 3.1 0.0
Queue Clearance Time (gs), s 46.7 14.2
Green Extension Time (ge), s 1.1 0.0 0.2 0.0
Phase Call Probability 1.00 1.00
Max Out Probability 0.06 0.00
Movement Group Results EB WB NB SB
Approach Movement L T R L T R L T R L T R
Assigned Movement 7 14 2 12 1 6
Adjusted Flow Rate (v), veh/h 624 33 139 28 177 249
Adjusted Saturation Flow Rate (s), veh/h/ln 1631 1452 1762 1568 1711 1796
Queue Service Time (gs), s 44.7 1.7 6.5 1.4 12.2 9.1
Cycle Queue Clearance Time (gc), s 44.7 1.7 6.5 1.4 12.2 9.1
Green Ratio (g/C) 0.40 0.40 0.37 0.37 0.12 0.53
Capacity (c), veh/h 650 578 651 579 205 946
Volume-to-Capacity Ratio (X) 0.960 0.057 0.213 0.049 0.864 0.263
Available Capacity (ca), veh/h 755 671 651 579 331 946
Back of Queue (Q), veh/ln (95th percentile) 28.1 1.0 5.0 1.0 9.4 6.8
Queue Storage Ratio (RQ) (95th percentile) 0.00 0.06 0.00 0.00 1.13 0.00
Uniform Delay (d1), s/veh 35.2 22.2 25.9 24.3 51.8 15.6
Incremental Delay (d2), s/veh 21.0 0.0 0.7 0.2 7.2 0.7
Initial Queue Delay (d3), s/veh 0.0 0.0 0.0 0.0 0.0 0.0
Control Delay (d), s/veh 56.2 22.2 26.7 24.5 59.1 16.3
Level of Service (LOS) E C C C E B
Approach Delay, s/veh / LOS 54.5 D 0.0 26.3 C 34.1 C
Intersection Delay, s/veh / LOS 43.8 D
Multimodal Results EB WB NB SB
Pedestrian LOS Score / LOS 2.4 B 2.3 B 1.9 A 1.7 A
Bicycle LOS Score / LOS F 0.8 A 1.2 A
Copyright © 2015 University of Florida, All Rights Reserved. HCS 2010™ Streets Version 6.70 Generated: 7/30/2015 3:25:22 PM

JEFFERSON ROAD IMPROVEMENTS TRAFFIC ANALYSIS STATE PROJECT U320-601-0.00 03
TRAFFIC SIMULATION MODEL CALIBRATION Appendix D
As part of the 2010 base year simulation model development and calibration, hourly directional volumes and peak hour intersection turning movement counts were collected by DOH staff. A map showing the traffic count locations is provided in Figure D-1.
The traffic counts were used in the development of base year origin-destination (O-D) matrices, which represent a tabulation of all vehicle trips through the simulation network for the analysis period. The O-D matrices were assigned to the roadway network and estimated turning movements were compared with the observed count volumes. A summary of the calibration results with respect to turning movements is shown in Table D-1. The Percent Root Mean Square Error (which measures the differences between predicted and observed values) was 8.5 percent for the A.M. peak and 14.3 percent for the P.M. peak, indicating that there was a generally good agreement between the “predicted” base year simulation model turning movements and the actual observed counts.
Maximum queue lengths were another measure that was used in the simulation model calibration. Maximum queues were observed in the field and compared with 2010 base year predicted queues from the simulation model for the following key approaches:
• Northbound Jefferson Road at MacCorkle Avenue
• Southbound Jefferson Road at Kanawha Turnpike
• Northbound Jefferson Road at Kanawha Turnpike
D.6

JEFFERSON ROAD IMPROVEMENTS TRAFFIC ANALYSIS STATE PROJECT U320-601-0.00 03
Figure D- 1. Simulation Model Development Traffic Count Locations
Ma p ID Prima ry Stre e t Cro ss Stre e t1 MacCorkle Ave. Kenna Dr.2 MacCorkle Ave. I-64 EB Ramps3 MacCorkle Ave. Jefferson Rd.4 MacCorkle Ave. I-64 WB Ramps5 Jefferson Rd. Kanawha Tpke.6 Jefferson Rd. Kanawha Tpke.7 Jefferson Rd. US 119 SB Ramps8 Jefferson Rd. US 119 NB Ramps/Oakhurst Dr.9 US 119 Shopping Center Access10 RHL Boulevard Shopping Center Access11 US 119 Oakhurst Rd./Jefferson Rd.12 US 119 Southridge Blvd.13 US 119 Southridge Shopping Cntr. Access14 US 119 Sherwood Forest Rd.15 US 119 Shopping Center Access16 RHL Boulevard Shopping Center Access17 RHL Boulevard Green Rd./Oakhurst Dr.18 Jefferson Road Kramer St.19 Kanawha Tpke. Valley Dr.
D.7

JEFFERSON ROAD IMPROVEMENTS TRAFFIC ANALYSIS STATE PROJECT U320-601-0.00 03
Table D- 1. Turning Movement Comparison Summary Total Turn Movements AM Peak PM Peak
Counts: 7,795 11,844Assignment: 7,823 11,736
Assignment-to-Count Ratio: 100.36% 99.09%
Pct. Rooot Mean Square Error AM Peak PM PeakTurning Movement %RMSE: 8.5 14.3
With respect to queue lengths, “maximum” refers to the farthest queue from the intersection approach stop bar during the analysis period, where stopped vehicles in the queue are defined by the simulation software as vehicles traveling at a speed of 3 mph or less. A summary of 2010 base year queue lengths are predicted by the simulation model is shown in Table D-2.
Table D- 2. 2010 Base Year Simulation Model Maximum Queues
Approach AM Peak PM PeakNB Jefferson Rd. at MacCorkle Ave. 200 500 SB Jefferson Rd. at Kanawha Tpke. 300 800 NB Jefferson Rd. at Kanawha Tpke. 500 2,200
Maximum Queue (ft.)
Further evaluation revealed that maximum queues predicted by the simulation model were consistent with those observed in the field.
Inspection of the RIC travel demand model showed that forecasted base year daily traffic volumes agreed reasonably well with 24-hour traffic counts obtained from the DOH for Jefferson Road, MacCorkle Avenue, Kanawha Turnpike and US 119 in the study area. It was decided that no further subarea calibration of the RIC model was necessary before using it to develop year 2030 traffic forecasts.
Because of the stochastic nature of microsimulation models, multiple repetitions of the same model scenario are required to account for the variation due to the inherent randomness that occurs. The question then becomes how many model runs are needed to provide a statistically valid mean of the performance measures in question. A methodology for determining the minimum number of required model runs is provided in the FHWA Traffic Analysis Toolbox Volume III: Guidelines for Applying Traffic Microsimulation Modeling Software1. The method begins with an assumption of the number of runs that will be needed and then uses the mean and standard deviation of the desired parameter to determine the number of model runs that would be needed to ensure that the parameter would fall within a specified confidence interval at a desired level of confidence.
1 Traffic Analysis Toolbox Volume III: Guidelines for Applying Traffic Microsimulation Modeling Software, Publication No. FHWA-HRT-04-040, Federal Highway Administration, U.S. Department of Transportation, Turner-Fairbank Highway Research Center, McLean, Virginia, July 2004.
D.8

JEFFERSON ROAD IMPROVEMENTS TRAFFIC ANALYSIS STATE PROJECT U320-601-0.00 03
An initial assumption was made that 10 model runs would provide a statistically significant estimate of the model parameter. In this case, directional link flow (i.e. volume) on mid-block segments of the network was used. The results are summarized in Table D-3 below:
Segment Dir. Mean Flow* Std. Dev. (-) (+)Confidence
Interval
DesiredRangeC.I./S Mean Flow* Std. Dev. (-) (+)
ConfidenceInterval
DesiredRangeC.I./S
Jefferson Road (north of Kanawha Tpke.) SB 581.8 25.6 560.0 603.6 43.6 1.7 573.1 14.2 560.0 603.6 43.6 3.1NB 395.0 13.7 380.2 409.8 29.6 2.2 431.7 23.6 380.2 409.8 29.6 1.3
Jefferson Road (south of Kanawha Tpke.) SB 681.8 21.4 656.2 707.4 51.1 2.4 879.3 17.2 656.2 707.4 51.1 3.0NB 673.7 18.7 648.4 699.0 50.5 2.7 743.3 27.6 648.4 699.0 50.5 1.8
Kanawha Turnpike (east of Jefferson Road) EB 707.8 31.2 681.3 734.3 53.1 1.7 535.5 19.5 681.3 734.3 53.1 2.7WB 505.1 15.1 486.2 524.0 37.9 2.5 838.0 28.0 486.2 524.0 37.9 1.4
MacCorkle Ave. (west of Jefferson Road) EB 1779.5 4.7 1712.8 1846.2 133.5 28.4 1124.0 1.3 1712.8 1846.2 133.5 102.7WB 752.4 27.0 724.2 780.6 56.4 2.1 1960.0 17.0 724.2 780.6 56.4 3.3
MacCorkle Ave. (eest of Jefferson Road) EB 1383.6 29.6 1331.7 1435.5 103.8 3.5 1033.3 26.5 1331.7 1435.5 103.8 3.9WB 689.1 17.3 663.3 714.9 51.7 3.0 1855.0 19.3 663.3 714.9 51.7 2.7
* Mean flow (in vehicles per hour) for 10 simulation runsDesired Confidence Interval 7.5% (± 3.8% )
Existing A.M. Peak Existing A.M. Peak
The objective is to verify that the number of model runs produces a Desired Range (where the Desired Range equals the desired confidence interval divided by the standard deviation) equal to or greater than the value shown in the chart below:
Source: FHWA Traffic Analysis Toolbox Volume III: Guidelines for Applying Traffic Microsimulation Modeling Software
With respect to the simulated traffic volumes, the results indicated that 10 model runs would produce a confidence interval between 90% and 95%, which was deemed sufficient for these analyses.
D.9


![Welcome! [transportation.wv.gov]transportation.wv.gov/highways/engineering/comment/closed/wv14mw… · Welcome! Informational Workshop Public Meeting for the WV 14, Mineral Wells](https://static.fdocuments.in/doc/165x107/5b3625387f8b9a436d8df360/welcome-welcome-informational-workshop-public-meeting-for-the-wv-14-mineral.jpg)


