FHLBank Atlanta 1 March 22, 2012 Counterparty Credit FHLBank Atlanta GIOA Conference.
Upload
winifred-mccarthyCategory
view
214download
0
Jefferies & Company, Inc.
FHLB and Agency StrategiesGIOA 2009
March 26, 2009
Mike EffronAgency Trading
Member SIPC
J:\ST\OTHER\PRESENTATIONS & TEMPLATES\TEMPLATES\JEFPOINT.PPT 2/26/09 2:59 PM
J:\ST\OTHER\PRESENTATIONS & TEMPLATES\TEMPLATES\JEFPOINT.PPT 2/26/09 2:59 PM
Disclaimer
The information contained herein is based on sources that we believe to be reliable, but we do not represent that it is accurate or complete. Additional and supporting information is available upon request. It is not to be considered an offer to sell or solicitation of an offer to buy the securities or other products discussed herein. This information is provided for informational purposes only and is intended solely for your use and may not be quoted, circulated or otherwise referred to without our express consent. Any commentary contained herein was prepared by trading desk personnel. This is not a research report and the commentary contained herein should not be considered to be research. All prices, yields and opinions expressed are indicative only and are subject to change without notice. Jefferies & Company, Inc. and its affiliates (collectively "Jefferies"), may have a position in the securities or other products discussed herein, and may make purchases from and/or sales to customers on a principal basis or as agent for another person. Jefferies also may have acted as an underwriter of such securities or other products, and may currently be providing investment banking services to the issuers of such securities products.
i
J:\ST\OTHER\PRESENTATIONS & TEMPLATES\TEMPLATES\JEFPOINT.PPT 2/26/09 2:59 PM
Table of Contents
1. Recent Events
2. System Overview and Mission Statement
3. FHLBanks Selected Financials
4. System Funding Trends
5. Role of the FHLB Office of Finance
6. Trade Process
7. Current Trends in Callable Issuance
8. Investment Strategy: Using Step-ups
J:\ST\OTHER\PRESENTATIONS & TEMPLATES\TEMPLATES\JEFPOINT.PPT 2/26/09 2:59 PM
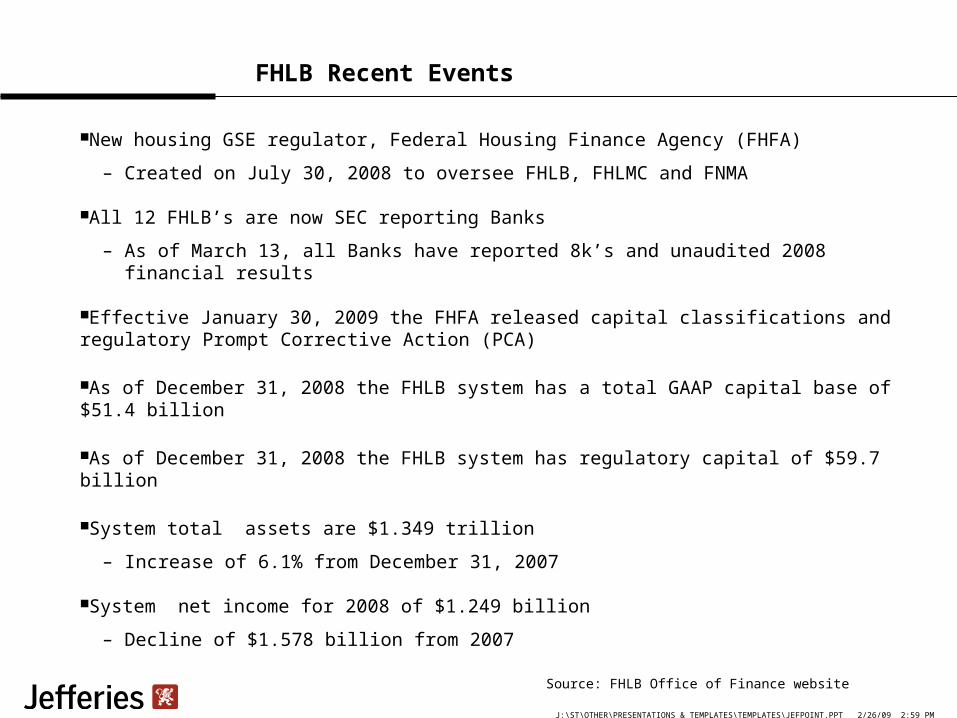
FHLB Recent Events
New housing GSE regulator, Federal Housing Finance Agency (FHFA)
– Created on July 30, 2008 to oversee FHLB, FHLMC and FNMA
All 12 FHLB’s are now SEC reporting Banks
– As of March 13, all Banks have reported 8k’s and unaudited 2008 financial results
Effective January 30, 2009 the FHFA released capital classifications and regulatory Prompt Corrective Action (PCA)
As of December 31, 2008 the FHLB system has a total GAAP capital base of $51.4 billion
As of December 31, 2008 the FHLB system has regulatory capital of $59.7 billion
System total assets are $1.349 trillion
– Increase of 6.1% from December 31, 2007
System net income for 2008 of $1.249 billion
– Decline of $1.578 billion from 2007
Source: FHLB Office of Finance website

J:\ST\OTHER\PRESENTATIONS & TEMPLATES\TEMPLATES\JEFPOINT.PPT 2/26/09 2:59 PM
FHLB Recent Events- Cont’d
Effective January 30, 2009 the FHFA instituted a series of defined capital adequacy levels
Requirement involves three metrics
– Total Capital Ratio = 4.00% minimum ALL Banks meet or exceed this hurdle 4.50% for FHLBChicago
– Leverage Capital Ratio = 5.00% minimum
– Risk-Based Capital = three factors determine the minimum Credit Risk Market Risk Operational Risk
FHLBanks can receive one of four capital classifications
– Adequately Capitalized
– Undercapitalized
– Significantly Undercapitalized
– Critically Undercapitalized
Source: FHLBanks Office of Finance
J:\ST\OTHER\PRESENTATIONS & TEMPLATES\TEMPLATES\JEFPOINT.PPT 2/26/09 2:59 PM
FHLB Recent Events- Cont’d
For detailed analysis and up to date financial information, please view the FHLBanks Office of Finance Website at:
– www.fhlb-of.com
Source: FHLBanks Office of Finance
J:\ST\OTHER\PRESENTATIONS & TEMPLATES\TEMPLATES\JEFPOINT.PPT 2/26/09 2:59 PM
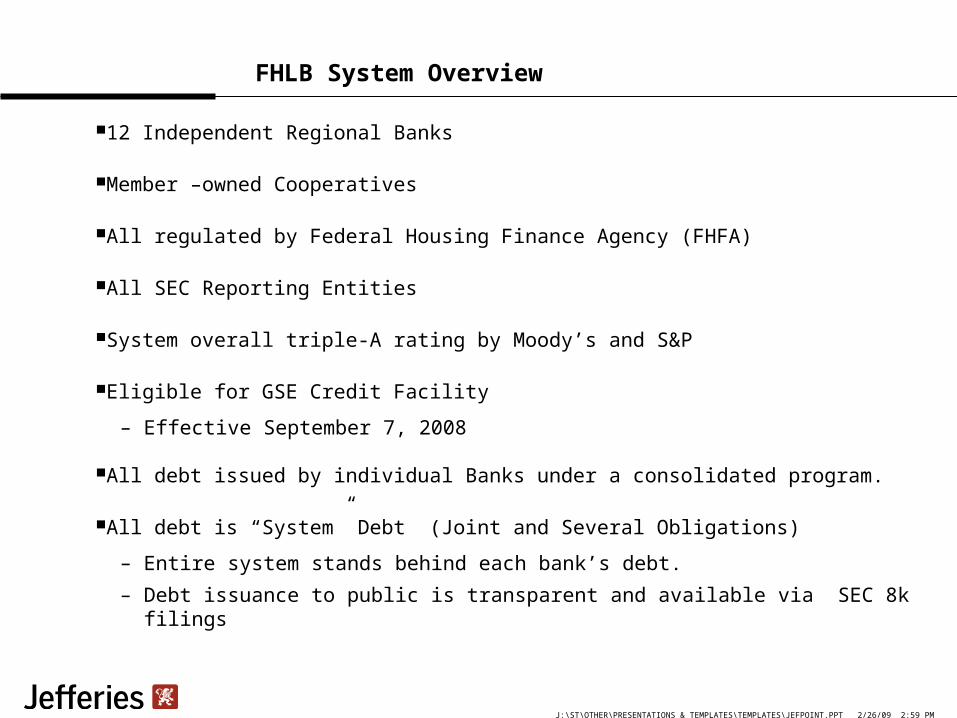
FHLB System Overview
12 Independent Regional Banks
Member –owned Cooperatives
All regulated by Federal Housing Finance Agency (FHFA)
All SEC Reporting Entities
System overall triple-A rating by Moody’s and S&P
Eligible for GSE Credit Facility
– Effective September 7, 2008
All debt issued by individual Banks under a consolidated program.
All debt is “System” Debt (Joint and Several Obligations)
– Entire system stands behind each bank’s debt.
– Debt issuance to public is transparent and available via SEC 8k filings

J:\ST\OTHER\PRESENTATIONS & TEMPLATES\TEMPLATES\JEFPOINT.PPT 2/26/09 2:59 PM
FHLB Member Bank Ratings
Bank Credit Rating (1)
Moody/S&P
Bank Credit Rating (1)
Moody/S&P
Atlanta AAA/Aaa Indianapolis AAA/Aa
Boston AAA/Aaa New York AAA/Aa
Chicago AAA/Aa
Aa2 sub
Pittsburgh AAA/Aa
Cincinnati AAA/Aaa San Francisco AAA/Aaa
Dallas AAA/Aaa Seattle AAA/Aa+
Des Moines AAA/Aaa Topeka AAA/Aaa
FHLB SYSTEM RATING
AAA/AAA
(1) Source: Moody’s Long-Term Deposit ratings as of Feb. 2009
S&P as of Sept. 2008

J:\ST\OTHER\PRESENTATIONS & TEMPLATES\TEMPLATES\JEFPOINT.PPT 2/26/09 2:59 PM
System Mission and History
The primary purpose of the FHLBanks is to ensure the flow of credit and other services for housing and community development to member financial institutions. This liquidity serves the public by enhancing the availability of residential mortgage and community investment funds. As cooperatives, the FHLBanks seek to maintain a balance between their public policy mission and the obligation to provide adequate returns on the capital supplied by members. The FHLBanks achieve this balance by delivering low-cost financing, and providing members a viable alternative to the secondary mortgage market via the mortgage loan programs, while paying a dividend. The FHLBanks also help members with other local housing and community development needs through self-funded affordable housing programs. (1)
Exempt from state and local taxes.
Loans are made in the form of collateralized advances.
Created in 1932 by an Act of Congress.
(1)FHLBanks Office of Finance website.

J:\ST\OTHER\PRESENTATIONS & TEMPLATES\TEMPLATES\JEFPOINT.PPT 2/26/09 2:59 PM
FHLB Selected Financials- Balance Sheet
Total System Assets
Advances (secured loans to members)
Investments include MBS, overnight/term Federal funds sold, CD’s, commercial paper and GSE securities
12/31/08 12/31/07 12/31/06 12/31/05 12/31/04 12/31/03
Advances $929,000 $875,061 $640,681 $619,860 $581,216 $514,037
Mortgage Loans, net
87,000 91,610 97,974 105,240 113,922 113,438
Investments 306,000 297,058 270,663 266,454 224,911 189,561
Total Assets 1,349,000 1,271,800 1,016,469 997,389 924,751 822,418
Source FHLB Office of Finance
In Millions

J:\ST\OTHER\PRESENTATIONS & TEMPLATES\TEMPLATES\JEFPOINT.PPT 2/26/09 2:59 PM
FHLB Selected Financials-Liabilities and Capital
Total System Liabilities and Capital
Consolidated Obligations (Debt Issuance)
Total Capital Stock
Retained Earnings
12/31/08 12/31/07 12/31/06 12/31/05 12/31/04 12/31/03
Consolidated Obligations 1,258,000 1,178,916 934,214 915,901 845,738 740,721
Total Capital (1) 51,400 53,597 44,985 44,480 41,863 38,980
Source FHLB Office of Finance
(1) Total GAAP combined capital
In millions
J:\ST\OTHER\PRESENTATIONS & TEMPLATES\TEMPLATES\JEFPOINT.PPT 2/26/09 2:59 PM
0
50
100
150
200
250
300
350
400
450
$ Billions
2005 2005 2006 2007 2009
Year
Globals
Bullets/TAP's
FRN's
Callables
DN's
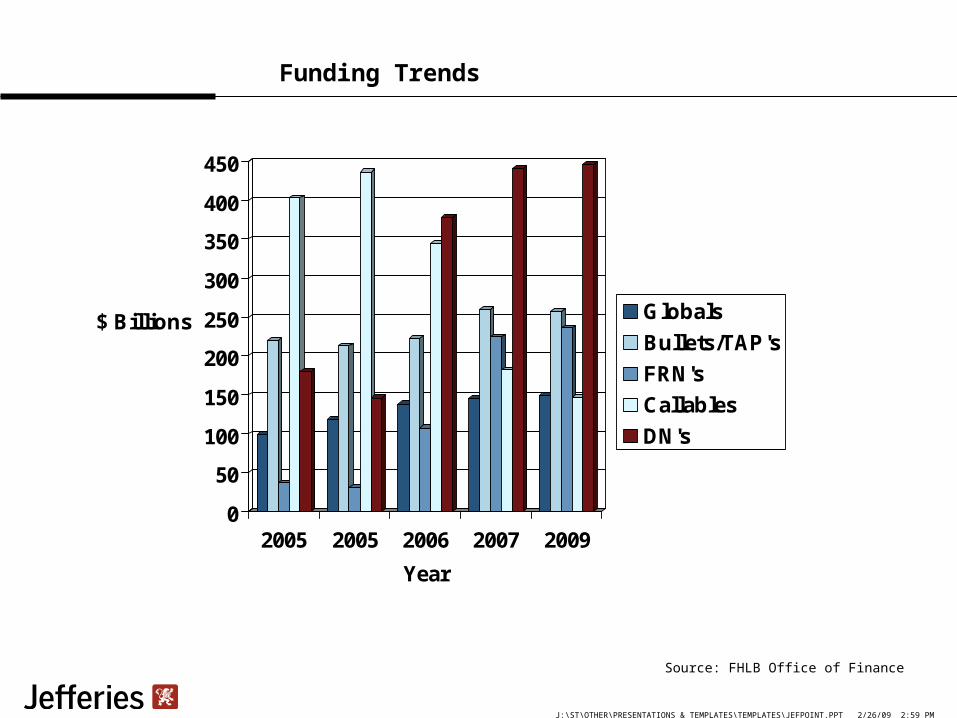
Funding Trends
Source: FHLB Office of Finance

J:\ST\OTHER\PRESENTATIONS & TEMPLATES\TEMPLATES\JEFPOINT.PPT 2/26/09 2:59 PM
Funding Trends-Changes in FHLB Funding Mix
2009 Projected Issuance
21%
12%
36%
12% 19%
2005 Issuance
4%
19%
11%
23%
43%
Globals
Bullets/TAP's
FRN's
Callables
DN's
Source:FHLB Office of Finance
J:\ST\OTHER\PRESENTATIONS & TEMPLATES\TEMPLATES\JEFPOINT.PPT 2/26/09 2:59 PM
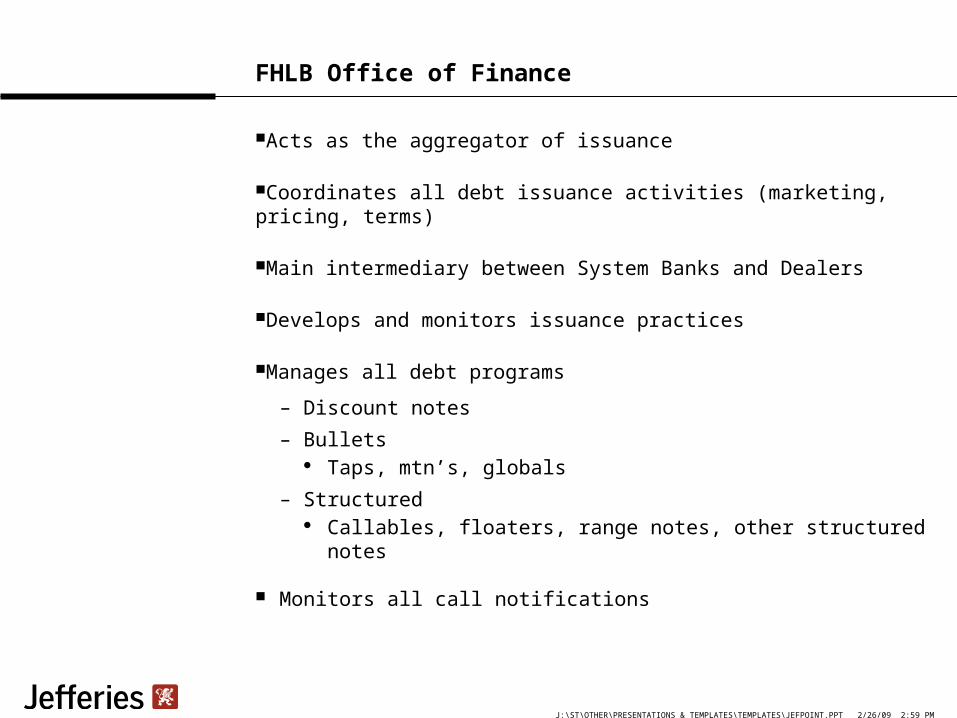
FHLB Office of Finance
Acts as the aggregator of issuance
Coordinates all debt issuance activities (marketing, pricing, terms)
Main intermediary between System Banks and Dealers
Develops and monitors issuance practices
Manages all debt programs
– Discount notes
– Bullets Taps, mtn’s, globals
– Structured Callables, floaters, range notes, other structured notes
Monitors all call notifications

J:\ST\OTHER\PRESENTATIONS & TEMPLATES\TEMPLATES\JEFPOINT.PPT 2/26/09 2:59 PM
The Trade Process- Callable Auction
Primary source for funding MBS portfolio
Driven by each Home Loan Bank
Needs are determined daily by 9:45 a.m. est.
Auctions posted at 10:00 a.m. est.
Round 1 is at 10:30 a.m. est. (round 2 is at 11:00 a.m. est. if necessary)
Web based auction
Lowest Coupon or lowest cost to pricing life date wins
Dealers bid Coupon and Concessions

J:\ST\OTHER\PRESENTATIONS & TEMPLATES\TEMPLATES\JEFPOINT.PPT 2/26/09 2:59 PM
The Trade Process- Callable Auction- cont’d
Call style is always American
Bidding syndicates are permitted
Post auction issues can be reopened or upsized with mutual agreement from FHLB and underwriter(s)
Auction structure determined by each Home Loan Bank to match funding needs
Multiple Banks can participate in an issue on a consolidated basis
Auctions can fail if bids are not acceptable to the Home Loan Banks
Award size can be less than original auction amount
J:\ST\OTHER\PRESENTATIONS & TEMPLATES\TEMPLATES\JEFPOINT.PPT 2/26/09 2:59 PM
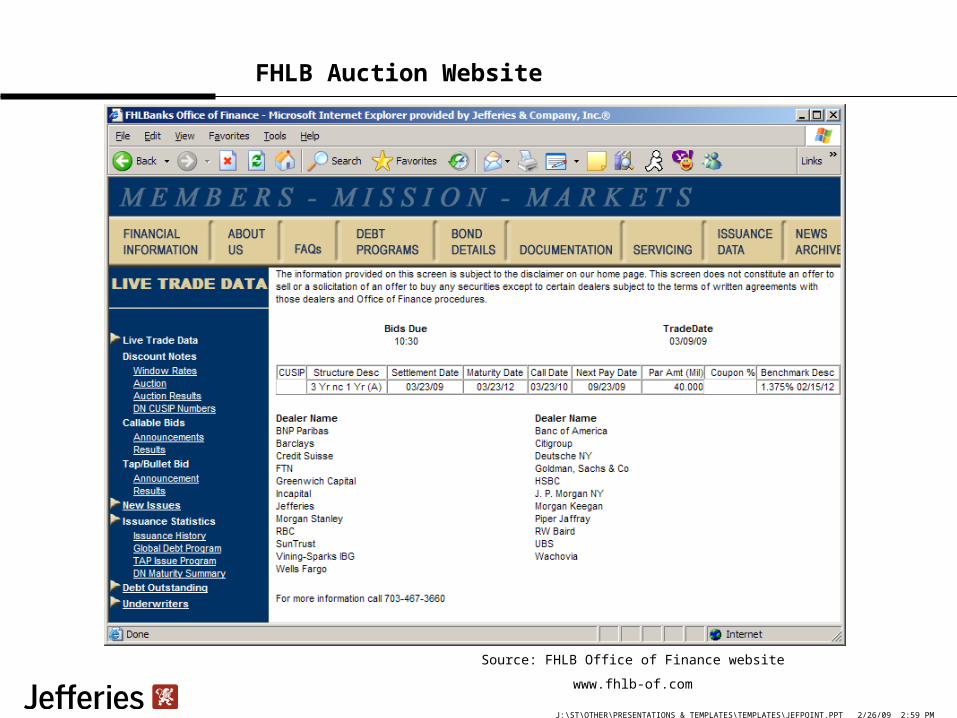
FHLB Auction Website
Source: FHLB Office of Finance website
www.fhlb-of.com
J:\ST\OTHER\PRESENTATIONS & TEMPLATES\TEMPLATES\JEFPOINT.PPT 2/26/09 2:59 PM
The Trade Process for TAPS
Driven by each FHLB’s specific needs
Needs are determined daily in coordination with the Office of Finance
Auctions posted at 11:00 a.m. est.
Bidding commences at 11:30 a.m.
– If needed, second auction commences at 12 pm
Web based auction
Spread bid versus Treasury all-in
– I.e. for the 2yr TAP you bid a spread versus the 2yr Tsy.

J:\ST\OTHER\PRESENTATIONS & TEMPLATES\TEMPLATES\JEFPOINT.PPT 2/26/09 2:59 PM
The Trade Process for TAPS- Cont’d
Coupon determined the first time it’s issued
– New auction cycle is every quarter– Set in 1/8 increments– Can pay premium or discount
Previous cycles can be reopened
– OID and large premium considerations would apply
No bidding syndicate
– Each dealer must bid a minimum of $25mm – If less than $25mm must bid for the entire size– Can place multiple bids– After auction, no reopening until next day’s TAP auction
Specific maturities chosen by each Bank based upon it’s funding needs
J:\ST\OTHER\PRESENTATIONS & TEMPLATES\TEMPLATES\JEFPOINT.PPT 2/26/09 2:59 PM
Trade Process- Negotiated Transactions
Dealers receive a variety of swap levels from swap dealers
Dealers contact any or all of the 12 FHLBanks to determine funding needs
Each Bank states funding targets
– Office of Finance monitors and has oversight on funding targets
Each dealer negotiates structures with individual system Banks
No transactions are exclusive
– Multiple Banks can do exact trades with multiple dealers– Deals that are >$25mm will receive one hour protection– Global transactions have additional structure black out periods

J:\ST\OTHER\PRESENTATIONS & TEMPLATES\TEMPLATES\JEFPOINT.PPT 2/26/09 2:59 PM
Trade Process- Negotiated Transactions
3 ways to create a negotiated bond:
– Customer inquiry Customer has asked a dealer(s) to price up a specific
transaction– Dealer inquiry– System bank(s) inquiry
Bank approaches a dealer(s) with a transaction
Trade entry is via e-Negotiated website
Dealer arranges FHLbank(s) and swap dealer– Conference call with the Office of Finance, underwriters, swap
dealer and representative from individual Bank– Read over terms, agree, trade done
J:\ST\OTHER\PRESENTATIONS & TEMPLATES\TEMPLATES\JEFPOINT.PPT 2/26/09 2:59 PM
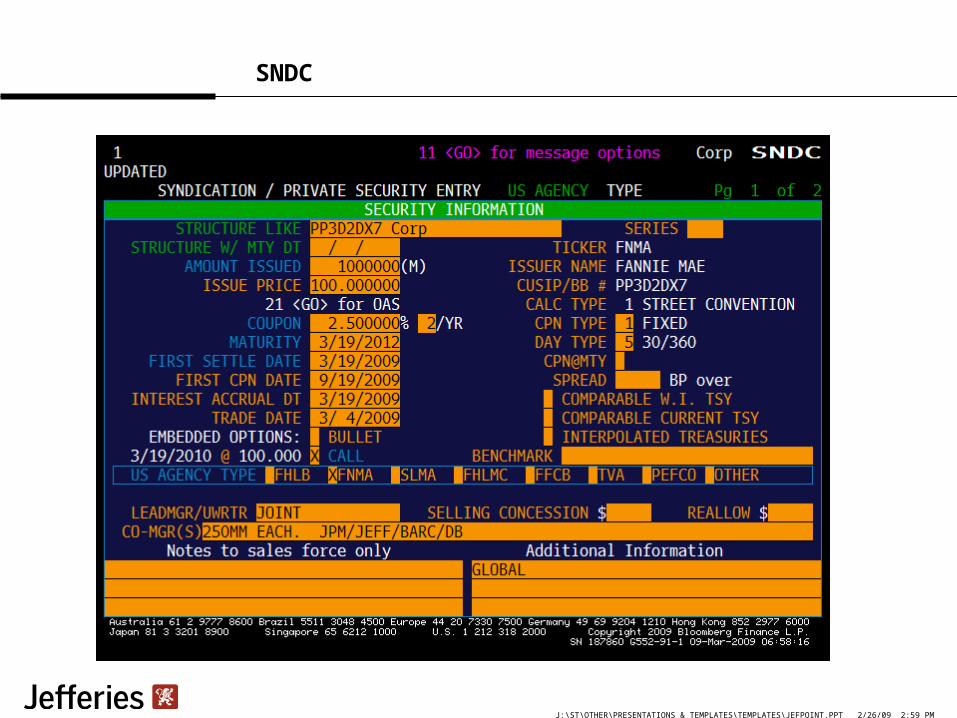
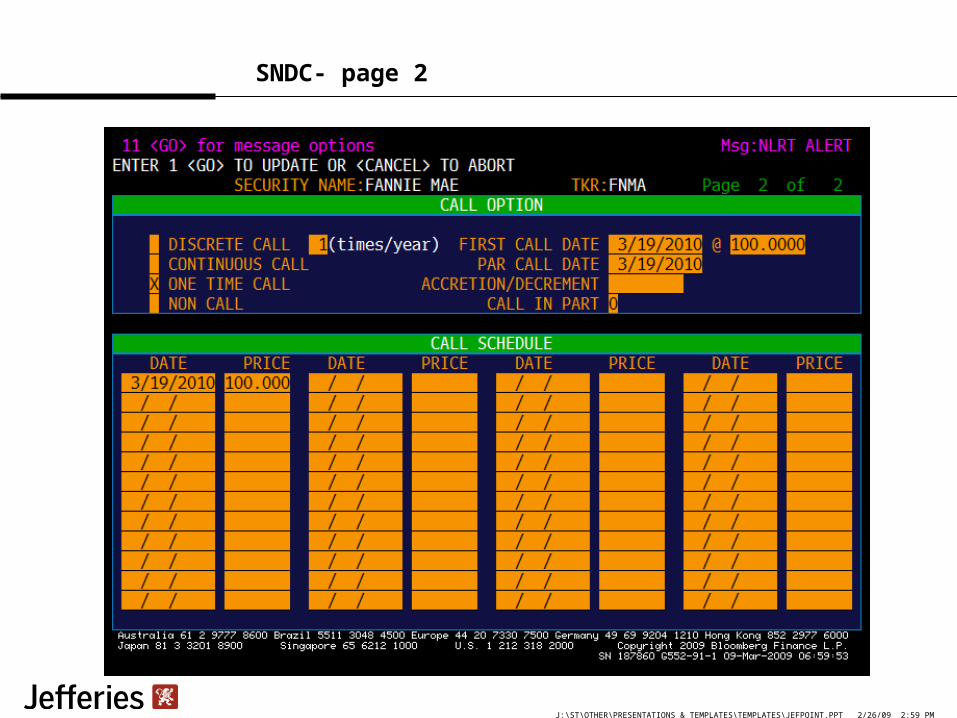
Trade Process- Modeling Trade for Bloomberg
Use function SNCD
Complete the details and send to Bloomberg
Once trade is modeled on SNDC analytics can be run
Trades can be modeled but not sent to Bloomberg
SNDC allows an option to post trades to New Issue Monitor (NIM2)
What determines posting to NIM2
– Dealer
– Customer
– Office of Finance
J:\ST\OTHER\PRESENTATIONS & TEMPLATES\TEMPLATES\JEFPOINT.PPT 2/26/09 2:59 PM
SNDC
J:\ST\OTHER\PRESENTATIONS & TEMPLATES\TEMPLATES\JEFPOINT.PPT 2/26/09 2:59 PM
SNDC- page 2

J:\ST\OTHER\PRESENTATIONS & TEMPLATES\TEMPLATES\JEFPOINT.PPT 2/26/09 2:59 PM
*Bermudan Spread Grid-an illustration
Structure*
Agency “x”
Agency “y”
Agency “ z”
libor flat spread
libor Flat levels
2yr nc 3mo 1.60 1.98 1.95 107.2 2.00
2yr nc 6mo 1.55 1.90 1.89 102.8 1.98
2yr nc 1yr 1.80 1.95 2.00 92.2 1.90
3yr nc 3mo 1.95 2.55 2.52 115.5 2.52
3yr nc 6mo 2.00 2.45 2.45 107 2.45
3yr nc 1yr 2.30 2.50 2.52 96.7 2.45
3yr nc 2yr 2.25 2.30 2.35 78.8 2.15
4yr nc 3mo 2.40 2.45 2.55 135.25 2.97
4yr nc 6mo 2.50 2.65 2.72 128.9 2.91
4yr nc 1yr 2.70 2.75 2.80 113 2.75
4yr nc 2yr 2.65 2.75 2.72 94.8 2.57
*this is for illustration purposes only and may not reflect actual levels

J:\ST\OTHER\PRESENTATIONS & TEMPLATES\TEMPLATES\JEFPOINT.PPT 2/26/09 2:59 PM
Recent Trends in Callable Issuance
1. Shift in issuance from callable auctions to large negotiated deals
2. Shift in call issuance from shorter lock-outs to longer lock-outs
3. Increase issuance in step-up notes

J:\ST\OTHER\PRESENTATIONS & TEMPLATES\TEMPLATES\JEFPOINT.PPT 2/26/09 2:59 PM
Return of the $1 billion deal size
Over 25 callable issues since February 1 with issue size greater than $1bln
All issuance has been FHLMC and FNMA only
Minimum of one year lock out and all have been European calls
FNMA has issued $23.4 billion in 12 deals
FHLMC has issued $22.5 billion in 15 deals
Substantial coupon pick-up versus smaller deals
– Including those at the $250 million index eligible deal size
Large liquid deals with strong secondary market support
Customer demand appears strong with limited dealer inventories
Short settlement dates
Source: Bloomberg data from Feb. 1 to March 6, 2009
J:\ST\OTHER\PRESENTATIONS & TEMPLATES\TEMPLATES\JEFPOINT.PPT 2/26/09 2:59 PM
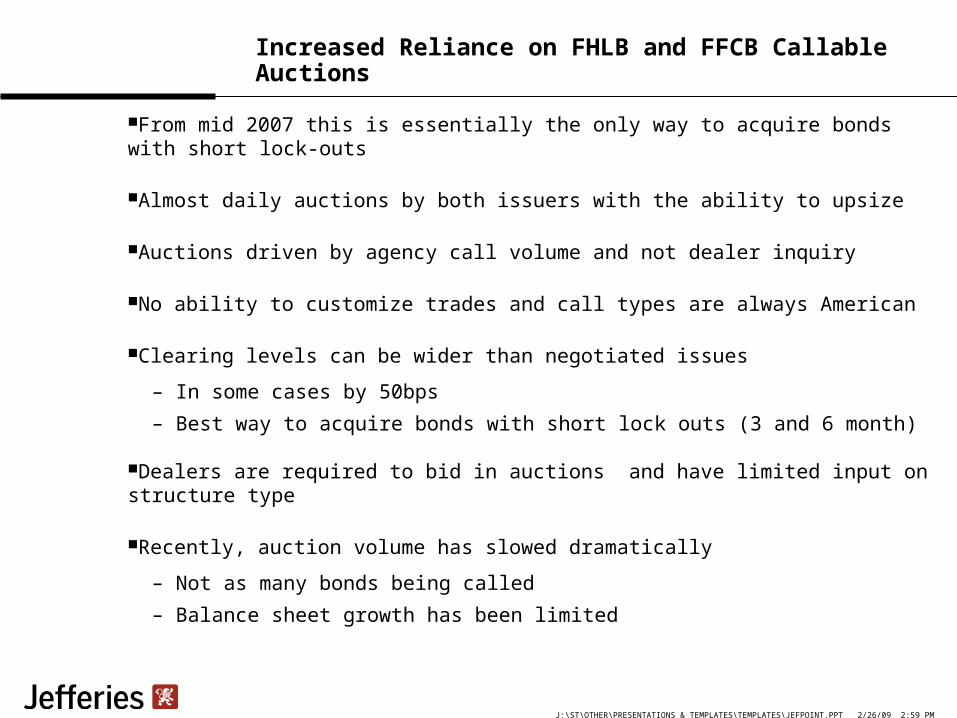
Increased Reliance on FHLB and FFCB Callable Auctions
From mid 2007 this is essentially the only way to acquire bonds with short lock-outs
Almost daily auctions by both issuers with the ability to upsize
Auctions driven by agency call volume and not dealer inquiry
No ability to customize trades and call types are always American
Clearing levels can be wider than negotiated issues
– In some cases by 50bps
– Best way to acquire bonds with short lock outs (3 and 6 month)
Dealers are required to bid in auctions and have limited input on structure type
Recently, auction volume has slowed dramatically
– Not as many bonds being called
– Balance sheet growth has been limited

J:\ST\OTHER\PRESENTATIONS & TEMPLATES\TEMPLATES\JEFPOINT.PPT 2/26/09 2:59 PM
Longer versus Shorter Lock-outs
Longer lock-outs have been pricing with higher coupons than shorter lock-outs
– In normal times this process is reversed
– The shorter the lock, the higher the coupon
Agencies are viewing 3 and 6 months lock-outs versus issuing discount notes
– If they can issue a 3 month discount note at EDSF- 97, why issue a 2nc3mo?
Discount notes are trading very rich vs. EDSF
Agencies have need for longer duration liabilities
– Funding levels for longer lock-outs are much more aggressive
– Recent success in issuing large bullet issues to secure term funding
J:\ST\OTHER\PRESENTATIONS & TEMPLATES\TEMPLATES\JEFPOINT.PPT 2/26/09 2:59 PM
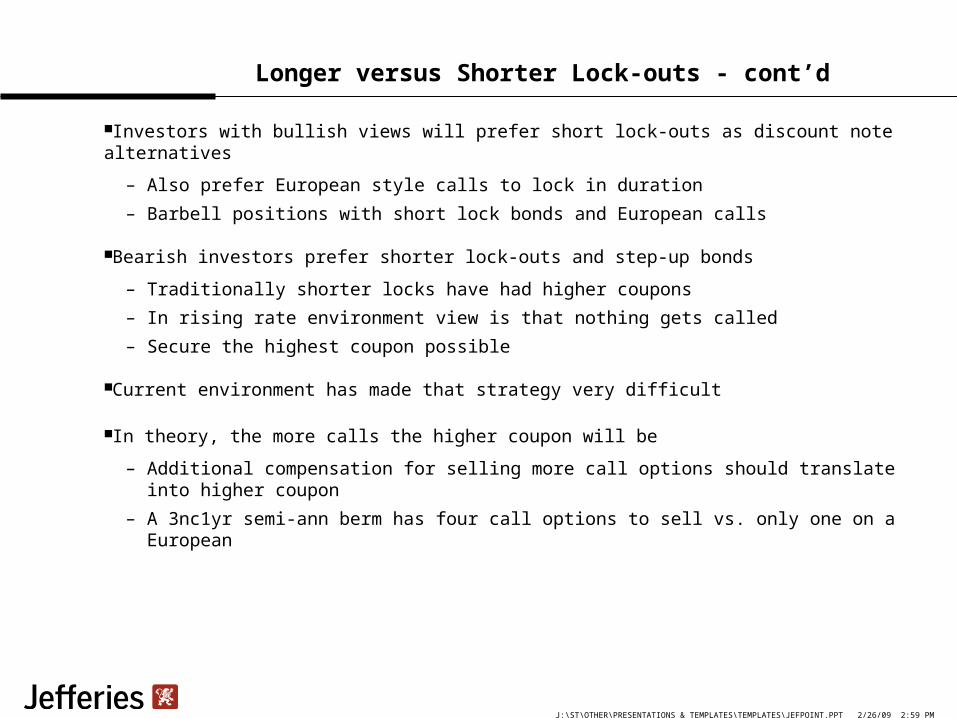
Longer versus Shorter Lock-outs - cont’d
Investors with bullish views will prefer short lock-outs as discount note alternatives
– Also prefer European style calls to lock in duration
– Barbell positions with short lock bonds and European calls
Bearish investors prefer shorter lock-outs and step-up bonds
– Traditionally shorter locks have had higher coupons
– In rising rate environment view is that nothing gets called
– Secure the highest coupon possible
Current environment has made that strategy very difficult
In theory, the more calls the higher coupon will be
– Additional compensation for selling more call options should translate into higher coupon
– A 3nc1yr semi-ann berm has four call options to sell vs. only one on a European

J:\ST\OTHER\PRESENTATIONS & TEMPLATES\TEMPLATES\JEFPOINT.PPT 2/26/09 2:59 PM
Discount Note Funding Matrix
Tenor Discount Notes EDSF Difference
3 months .33% 1.30% -.97 bps
6 months .55% 1.36% -.81 bps
1year- bullet 1.05% 1.47% -.42 bps
As of March 6, 2009
Source: FHLB discount note window
J:\ST\OTHER\PRESENTATIONS & TEMPLATES\TEMPLATES\JEFPOINT.PPT 2/26/09 2:59 PM
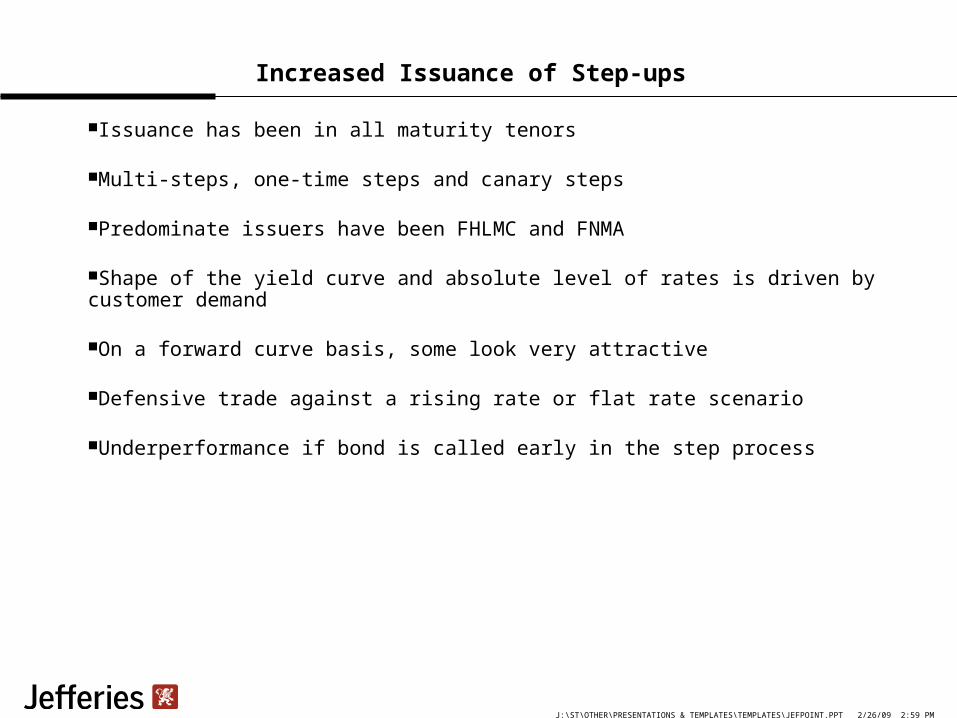
Increased Issuance of Step-ups
Issuance has been in all maturity tenors
Multi-steps, one-time steps and canary steps
Predominate issuers have been FHLMC and FNMA
Shape of the yield curve and absolute level of rates is driven by customer demand
On a forward curve basis, some look very attractive
Defensive trade against a rising rate or flat rate scenario
Underperformance if bond is called early in the step process

J:\ST\OTHER\PRESENTATIONS & TEMPLATES\TEMPLATES\JEFPOINT.PPT 2/26/09 2:59 PM
Using Step-ups in Your Investing Strategy
Short maturity step-ups seem to fit better with public entity accounts
Buyers of step-ups tend to be defensive in nature (bearish)
– Hybrid between adding the duration vis-à-vis bullet and;
– not giving up the coupon of a callable bond
The lower the initial coupon the less probable the bond gets called at the initial call date
Make sure you compare the step-up versus a variety of alternative investments
– Fixed-rate callables
– Discount note
– Short-bullets
Make use of the forward curve analysis on Bloomberg
– EDSF and FWCV
J:\ST\OTHER\PRESENTATIONS & TEMPLATES\TEMPLATES\JEFPOINT.PPT 2/26/09 2:59 PM
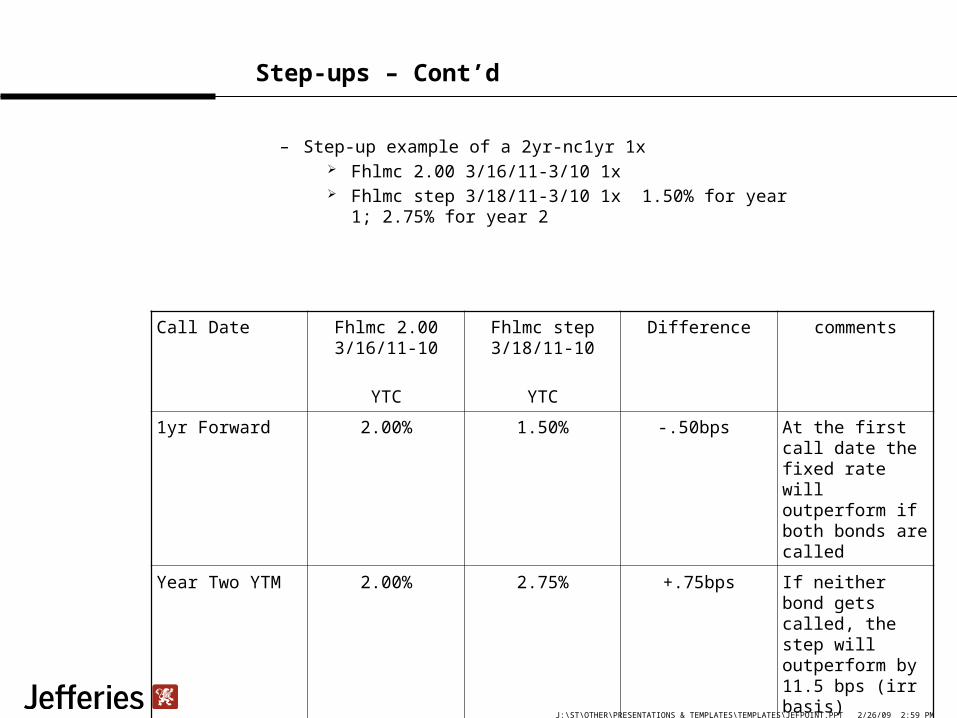
Step-ups – Cont’d
– Step-up example of a 2yr-nc1yr 1x Fhlmc 2.00 3/16/11-3/10 1x Fhlmc step 3/18/11-3/10 1x 1.50% for year 1; 2.75% for
year 2
Call Date Fhlmc 2.00 3/16/11-10
YTC
Fhlmc step 3/18/11-10
YTC
Difference comments
1yr Forward 2.00% 1.50% -.50bps At the first call date the fixed rate will outperform if both bonds are called
Year Two YTM 2.00% 2.75% +.75bps If neither bond gets called, the step will outperform by 11.5 bps (irr basis)

J:\ST\OTHER\PRESENTATIONS & TEMPLATES\TEMPLATES\JEFPOINT.PPT 2/26/09 2:59 PM
Compare alternatives to 2nc1 1x trade
Review forward FHLMC bullet curve
– 1yr rate/1yr forward shows 2.05% This implies that 1yr bullets in 1yr will yield 2.05%
Compare vs. a 1 year bullet investment now
– Current 1 year bullet yields 1.05%
Calculate and compare breakeven for the 1yr bullet Use Bloomberg GA3 function In this example the breakeven’s are 2.954% for the fixed callable and; 3.192% for the step-up
See example

J:\ST\OTHER\PRESENTATIONS & TEMPLATES\TEMPLATES\JEFPOINT.PPT 2/26/09 2:59 PM
Forward Curve Matrix

J:\ST\OTHER\PRESENTATIONS & TEMPLATES\TEMPLATES\JEFPOINT.PPT 2/26/09 2:59 PM
Bloomberg Breakeven Analysis
J:\ST\OTHER\PRESENTATIONS & TEMPLATES\TEMPLATES\JEFPOINT.PPT 2/26/09 2:59 PM
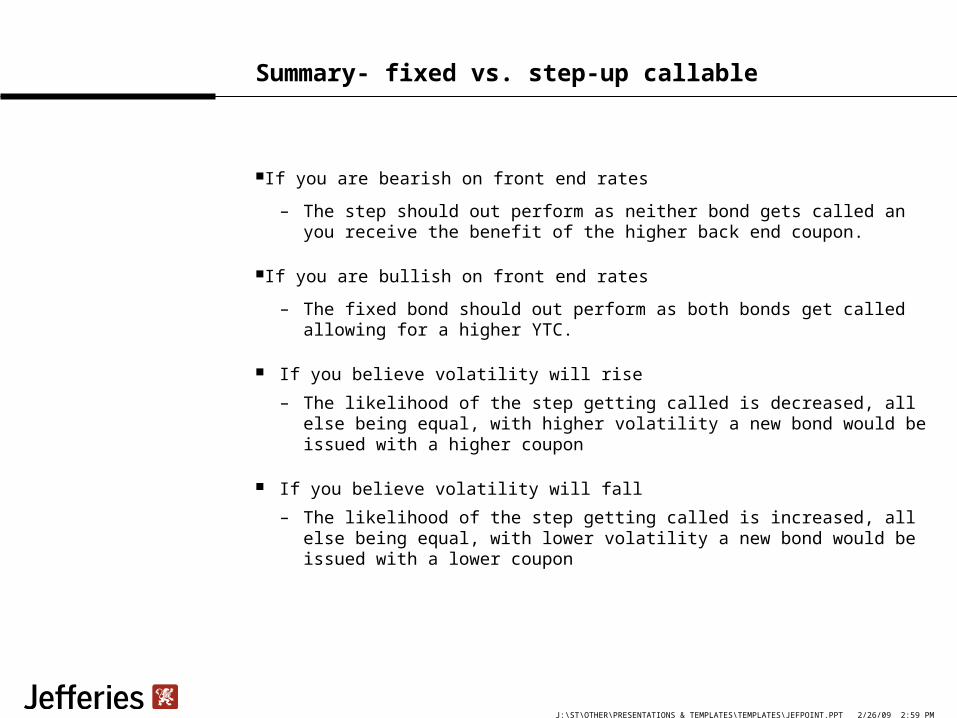
Summary- fixed vs. step-up callable
If you are bearish on front end rates
– The step should out perform as neither bond gets called an you receive the benefit of the higher back end coupon.
If you are bullish on front end rates
– The fixed bond should out perform as both bonds get called allowing for a higher YTC.
If you believe volatility will rise
– The likelihood of the step getting called is decreased, all else being equal, with higher volatility a new bond would be issued with a higher coupon
If you believe volatility will fall
– The likelihood of the step getting called is increased, all else being equal, with lower volatility a new bond would be issued with a lower coupon
J:\ST\OTHER\PRESENTATIONS & TEMPLATES\TEMPLATES\JEFPOINT.PPT 2/26/09 2:59 PM
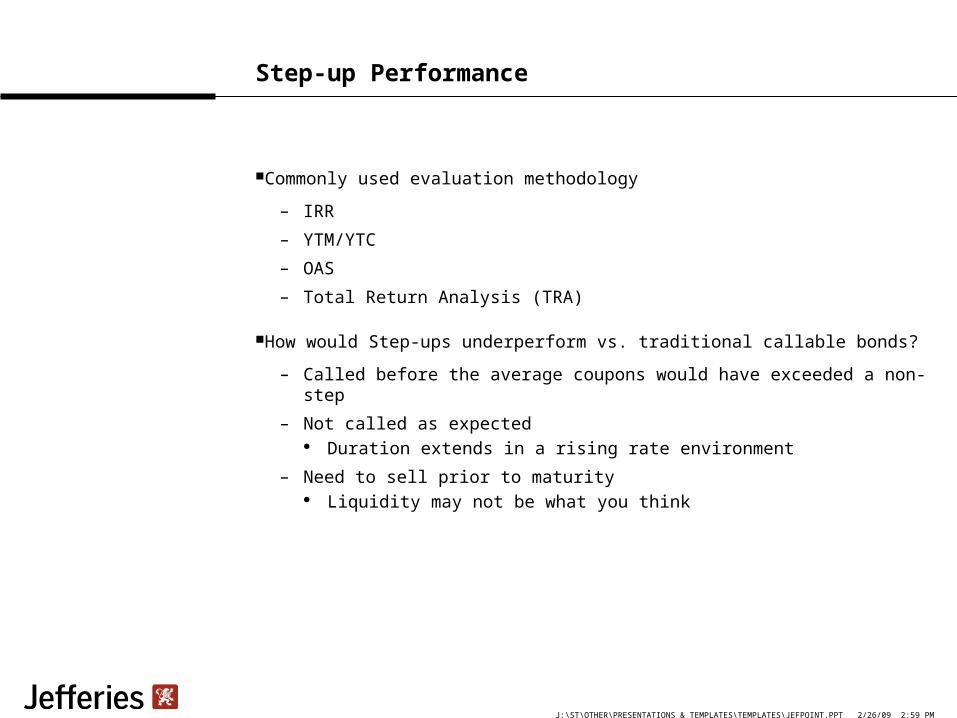
Step-up Performance
Commonly used evaluation methodology
– IRR
– YTM/YTC
– OAS
– Total Return Analysis (TRA)
How would Step-ups underperform vs. traditional callable bonds?
– Called before the average coupons would have exceeded a non-step
– Not called as expected Duration extends in a rising rate environment
– Need to sell prior to maturity Liquidity may not be what you think