Jeff Kantor LSST Data Management Systems Manager LSST Corporation Institute for Astronomy University...
18
Jeff Kantor LSST Data Management Systems Manager LSST Corporation Institute for Astronomy University of Hawaii Honolulu, Hawaii June 19, 2008 LSST Data Management: Making Peta-scale Data Accessible
-
date post
19-Dec-2015 -
Category
Documents
-
view
220 -
download
0
Transcript of Jeff Kantor LSST Data Management Systems Manager LSST Corporation Institute for Astronomy University...

Jeff KantorLSST Data Management Systems Manager
LSST Corporation
Institute for AstronomyUniversity of Hawaii
Honolulu, HawaiiJune 19, 2008
LSST Data Management:
Making Peta-scale Data Accessible

June 19, 2008 Institute for Astronomy
University of HawaiiHonolulu, Hawaii
2
LSST Data Management System
Long-Haul CommunicationsChile - U.S. & w/in U.S.
2.5 Gbps avg, 10 Gbps peak
Archive Center
NCSA, Champaign, IL
100 to 250 TFLOPS, 75 PB
Data Access CentersU.S. (2) and Chile (1)45 TFLOPS, 87 PB
Mountain Summit/Base FacilityCerro Pachon, La Serena, Chile
10x10 Gbps fiber optics25 TFLOPS, 150 TB
1 TFLOPS = 10^12 floating point operations/second
1 PB = 2^50 bytes or ~10^15 bytes

June 19, 2008 Institute for Astronomy
University of HawaiiHonolulu, Hawaii
3
Processing
Cadence
Image Category
(files)
Catalog Category
(database)
Alert Category
(database)
Nightly Raw science image
Calibrated science image
Subtracted science image
Noise image
Sky image
Data quality analysis
Source catalog (from difference images)
Object catalog (from difference images)
Orbit catalog
Data quality analysis
Transient alert
Moving object
alert
Data quality
analysis
Data Release
(Annual)
Stacked science image
Template image
Calibration image
RGB JPEG Images
Data quality analysis
Source catalog (from calibrated science
images)
Object catalog (optimally measured
properties)
Data quality analysis
Alert statistics &
summaries
Data quality
analysis
LSST Data Products
June 19, 2008 Institute for Astronomy
University of HawaiiHonolulu, Hawaii
4
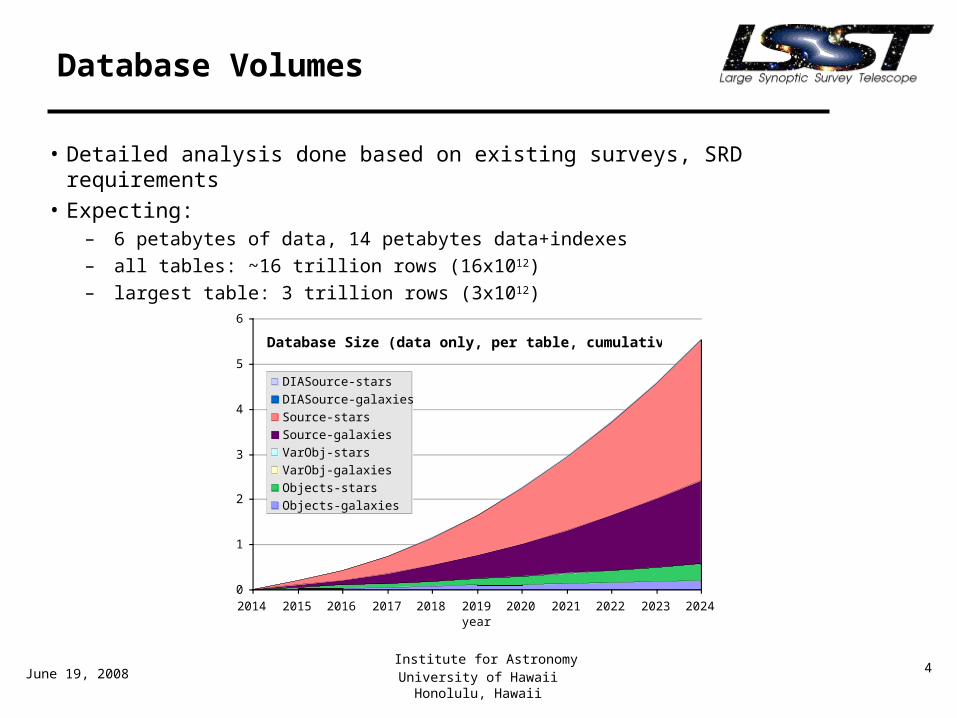
Database Volumes
• Detailed analysis done based on existing surveys, SRD requirements• Expecting:
– 6 petabytes of data, 14 petabytes data+indexes
– all tables: ~16 trillion rows (16x1012)
– largest table: 3 trillion rows (3x10¹²)
Database Size (data only, per table, cumulative)
0
1
2
3
4
5
6
2014 2015 2016 2017 2018 2019 2020 2021 2022 2023 2024year
PB
DIASource-stars
DIASource-galaxies
Source-stars
Source-galaxies
VarObj-stars
VarObj-galaxies
Objects-stars
Objects-galaxies

June 19, 2008 Institute for Astronomy
University of HawaiiHonolulu, Hawaii
5
Data Products Pipelines
Application Framework
Application Layer
Middleware Layer Data Access Distr. Processing
System Administration, Operations, Security
User Interface
Infrastructure LayerComputing Communications
Physical Plant
Storage
The DM reference design uses layers for scalability, reliability, evolution
• Scientific Layer• Pipelines constructed from reusable, standard “parts”, i.e. Application Framework• Data Products representations standardized• Metadata extendable without schema change• Object-oriented, python, C++ Custom Software
• Portability to clusters, grid, other• Provide standard services so applications behave consistently (e.g. recording provenance)• Keep “thin” for performance and scalability • Open Source, Off-the-shelf Software, Custom Integration
•Distributed Platform•Different parts specialized for real-time alerting vs peta-scale data access•Off-the-shelf, Commercial Hardware & Software, Custom Integration

June 19, 2008 Institute for Astronomy
University of HawaiiHonolulu, Hawaii
6
LSST DM Middleware makes it easy to answer these questions
• There are 75 PB of data, how do I get the data I need as fast as I need it?
• I want to run an analysis code on MY [laptop, workstation, cluster, Grid], how do I do that?
• I want to run an analysis code on YOUR [laptop, workstation, cluster, Grid], how do I do that?
• My multi-core nodes are only getting 10% performance and I don’t know how to code for GPUs, how can I get better performance in my pipeline?
• I want to reuse LSST pipeline software and add some of my own, how can I do that?
June 19, 2008 Institute for Astronomy
University of HawaiiHonolulu, Hawaii
7
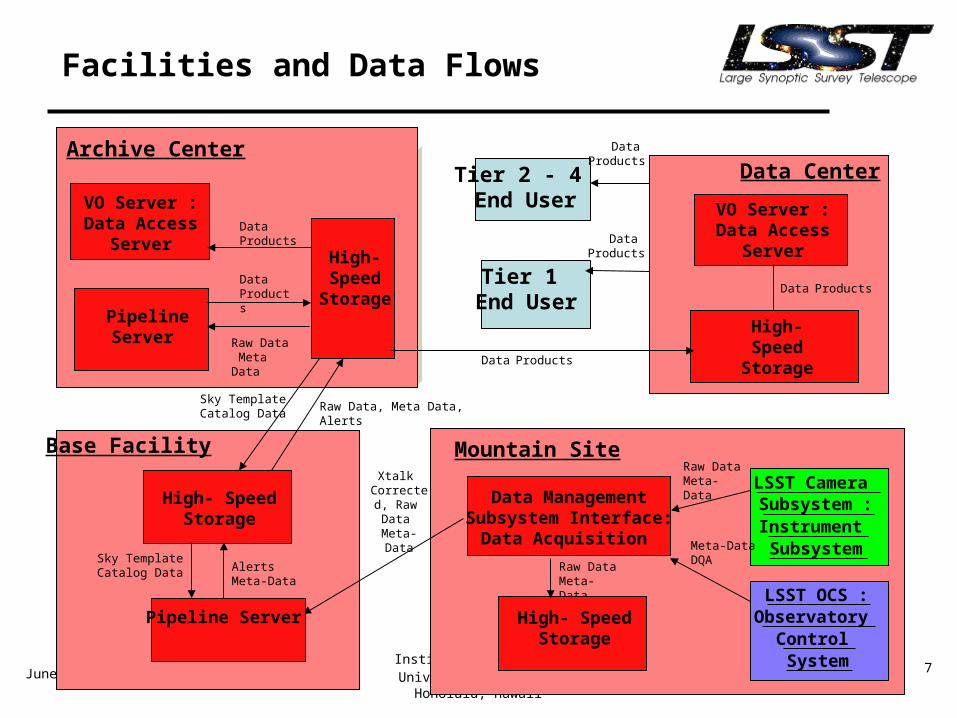
Facilities and Data Flows
Base Facility
Archive CenterData Center
LSST Camera Subsystem :Instrument Subsystem
LSST OCS :Observatory
Control System
Data ManagementSubsystem Interface:
Data Acquisition
High- SpeedStorage
Tier 2 - 4 End User
Tier 1 End User
High-Speed
Storage
VO Server :Data Access
Server
Raw Data, Meta Data, Alerts
High-Speed
Storage
Data
Products
Data Products
Data Products
Data Products
Raw DataMeta-Data
Raw DataMeta-Data
Meta-DataDQA
Xtalk Corrected,
Raw Data
Meta-Data
Sky TemplateCatalog Data
Mountain Site
High- SpeedStorage
Pipeline Server
Sky TemplateCatalog Data Alerts
Meta-Data
PipelineServer
Data Products
VO Server :Data Access
ServerData
Products
Raw Data Meta Data

June 19, 2008 Institute for Astronomy
University of HawaiiHonolulu, Hawaii
8
ArchiveCenter
Base
Data AccessCenter Archive Center
Trend Line
Computing needs show moderate growth

June 19, 2008 Institute for Astronomy
University of HawaiiHonolulu, Hawaii
9
CerroPachonLa
Serena
Long-haul communications are feasible
• Over 2 terabytes/second dark
fiber capacity available
• Only new fiber is Cerro Pachon
to La Serena (~100 km)
• 2.4 gigabits/second needed from
La Serena to Champaign, IL
• Quotes from carriers include 10
gigabit/second burst for failure
recovery
• Specified availability is 98%
• Clear channel, protected circuits

June 19, 2008 Institute for Astronomy
University of HawaiiHonolulu, Hawaii
10
FY-09 FY-10 FY-11 FY-12 FY-13 FY-14 FY-15 FY-16
LSST Timeline
FY-17FY-07 FY-08
NSF D&D FundingMREFC Proposal Submission
NSF CoDRMREFC Readiness
NSF PDRNSB
NSF CDR NSF MREFC Funding
Commissioning
Operations
DOE R&D Funding
DOE CD-0 (Q1-06)
DOE MIE Funding
DOE CD-1
DOE CD-2
DOE CD-3Sensor Procurement Starts
DOE CD-4Camera Delivered to Chile
Camera Fabrication (5 years)
Telescope First Light
DOE OpsFunding
Camera Ready to Install
NSF + Privately Supported Construction (8.5 years) System First Light
ORR
Camera I&C

June 19, 2008 Institute for Astronomy
University of HawaiiHonolulu, Hawaii
11
Data Challenge Goals
#1
Jan 2006 -
Oct 2006
• Validate infrastructure and middleware scalability to 5% of LSST required rates
#2
Jan 2007 -
Jan 2008
• Validate nightly pipeline algorithms
• Create Application Framework and Middleware, validate by creating functioning pipelines with
them
• Validate infrastructure and middleware scalability to 10% of LSST required rates
#3
Mar 2008 -
Jun 2009
• Validate deep detection, calibration, SDQA pipelines
• Expand Middleware for Control & Management, Inter-slice Communications
• Validate infrastructure and middleware reliability
• Validate infrastructure and middleware scalability to 15% of LSST required rates
#4
Jul 2009 -
Jun 2010
• Validate open interfaces and data access
• Validate infrastructure and middleware scalability to 20% of LSST required rates
Validating the design - Data Challenges

June 19, 2008 Institute for Astronomy
University of HawaiiHonolulu, Hawaii
12
Data Challenge Work Products
#1
Jan 2006 -
Oct 2006
• 3 Teragrid nodes used to simulate data transfer: Mountain (Purdue), Base (SDSC),
Archive Center (NCSA) using Storage Resource Broker (SRB)
• IA64 itanium 2 clusters at SDSC, NCSA, 32-bit Xeon cluster at Purdue
• MPI-based Pipeline Harness developed in C and python
• Simulated nightly processing application pipelines developed (CPU, i/o, RAM loads)
• Initial database schema designed and MySQL database configured
• Data ingest service developed
• Initial development environment configured, used throughout
#2
Jan 2007 -
Jan 2008
• 10-node, 58-CPU dedicated cluster acquired and configured at NCSA• Application Framework and Middleware API developed and tested• Image Processing, Detection, Association pipelines developed• Moving object pipeline (jointly developed with Pan-STARRS) ported to DM
environment, modularized, and re-architected for nightly mode (nightMOPS)• Major schema upgrade and implementation in MySQL with CORAL • Acquired 2.5 TB pre-cursor data (CFHTLS-deep, TALCS) for testing• Complete development environment configured, standardized, used throughout
Validating the design -
Data Challenge work products to date

June 19, 2008 Institute for Astronomy
University of HawaiiHonolulu, Hawaii
13
Data Challenge Execution Results
#1
Jan 2006 -
Oct 2006
• 70 megabytes/ second data transfers (>15% of LSST transfer rate)• 192 CCDs (0.1 - 1.0 gigabytes each) runs processed with simulated
pipelines across 16 nodes/32 itanium CPUs with latency and throughput of
approximately 141.5 seconds (>42% of LSST per node image processing
rate)• 6.1 megabytes/ second source data ingest (>100% of LSST required ingest
rate at the Base Facility)
#2
Jan 2007 -
Jan 2008
• 61 visits (0.1 gigabytes each CCD) runs processed through all pipelines
(image processing & detection, association, night MOPS) across 58 xeon
CPUs with latency and throughput of approximately 257 seconds
(25% of LSST per node processing rate)• Fast nodes only (48 xeon CPUs) run processed in approximately 180
seconds
(30% of LSST per node processing rate)• Data transfer and ingest rates same as DC1
Data Challenges 1 & 2 were very successful

June 19, 2008 Institute for Astronomy
University of HawaiiHonolulu, Hawaii
14
LSST Data Management Resources
• Base year (2006) cost for developing LSST DM system and reducing/releasing data is
– $5.5M R&D – $106M MREFC – $17M/yr Operations– For software, support, mountain, base, archive center, science centers
• Includes Data Access user resources– Two DACs in U.S. locations– One EPO DAC at another U.S. location (added recently)– One DAC in Chile
• Total Scientific Data Access user resources available across DACs– 16 Gbps network bandwidth– 12 petabyes of end user storage– 25 TFLOPS computing

June 19, 2008 Institute for Astronomy
University of HawaiiHonolulu, Hawaii
15
Philosophy & Terminology
• Access to LSST data should be completely open to anyone, anywhere– All data in the LSST public archive should be accessible to
everyone worldwide; we should not restrict any of this data to “special” users
– Library analogy: anyone can check out any book
• Access to LSST data processing resources must be managed– Computers, bandwidth, and storage cost real money to purchase
and to operate; we cannot size the system to allow everyone unlimited computing resources
– Library analogy: we limit how many books various people can check out at one time so as equitably to share resources
• Throughout the following, “access” will mean access to resources, not permission to view the data

June 19, 2008 Institute for Astronomy
University of HawaiiHonolulu, Hawaii
16
Data Access Policy Considerations
• The vast quantity of LSST data makes it necessary to use computing located at a copy of the archive– Compute power to access and work with the data is a limited
resource
• LSSTC must equitably and efficiently manage the allocation of finite resources– Declaring “open season” on the data will lead to inefficient use– Granting different levels of access to various uses will ensure
increased scientific return
• The data have value– Building and operating the system will require significant
expenditures– Setting a value on the data product is an important ingredient of
any cost-sharing negotiation
June 19, 2008 Institute for Astronomy
University of HawaiiHonolulu, Hawaii
17
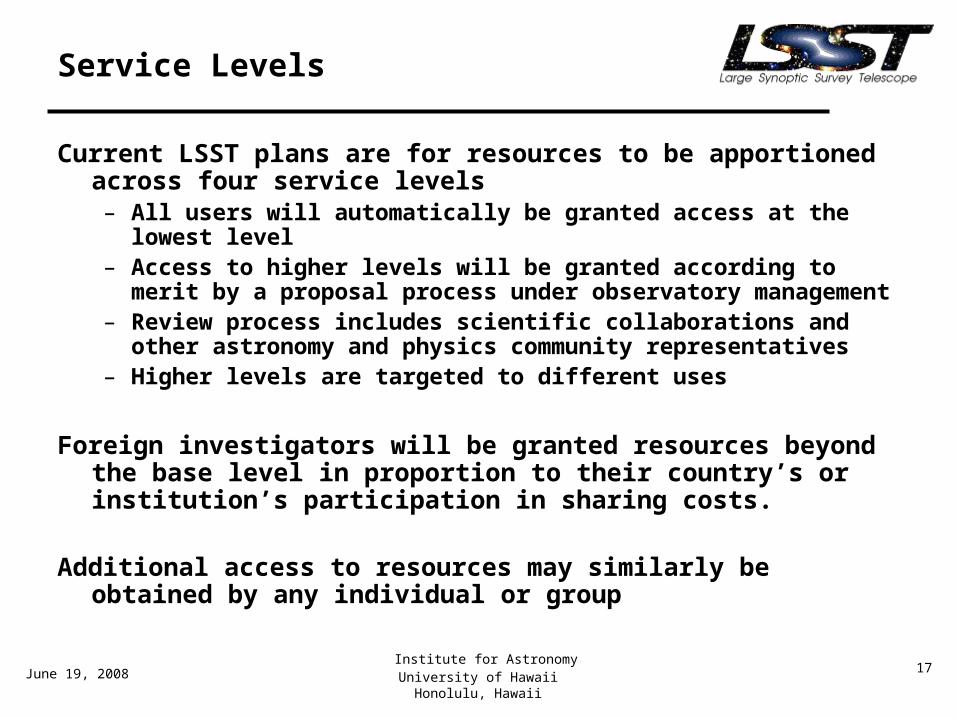
Service Levels
Current LSST plans are for resources to be apportioned across four service levels– All users will automatically be granted access at the lowest level– Access to higher levels will be granted according to merit by a
proposal process under observatory management– Review process includes scientific collaborations and other
astronomy and physics community representatives– Higher levels are targeted to different uses
Foreign investigators will be granted resources beyond the base level in proportion to their country’s or institution’s participation in sharing costs.
Additional access to resources may similarly be obtained by any individual or group

June 19, 2008 Institute for Astronomy
University of HawaiiHonolulu, Hawaii
18
Service Levels defined in MREFC Proposal
Level 4 – typical/general users, no special access required6 Gbps bandwidth1 PB data storage1 TFlop total
Level 3 - power user individuals, requires approval2 Gbps bandwidth100 TB storage1 TFlop at each DAC
Level 2 - power user institutions, requires approval2 Gbps bandwidth900 TB storage (100 TB/yr)5 TFlops at each DAC (1 TFlop/yr for 5 years)
Level 1 –most demanding applications, requires approval6 Gbps10 PB storage (1 PB/yr)25 TFlops (5 TFlops/yr for 5 years)