
JED, TJWT & APPENDIX - JED & TJWT - 2010 Results...
82
2010 RESULTS 25 February 2011 Eric Daniels Group Chief Executive
Transcript of JED, TJWT & APPENDIX - JED & TJWT - 2010 Results...

2010 RESULTS25 February 2011y
Eric DanielsGroup Chief Executive

BUSINESS HIGHLIGHTSA year of significant progress
STRONG OPERATING PERFORMANCE RISK REDUCED
Step change in profitability Balance sheet reduction plan
ahead of schedule
Sharp fall in impairments Funding risk much reduced
Good franchise momentum
Integration programme on
Capital position further strengthened
g p gtrack More predictable asset
portfolios
A much stronger business
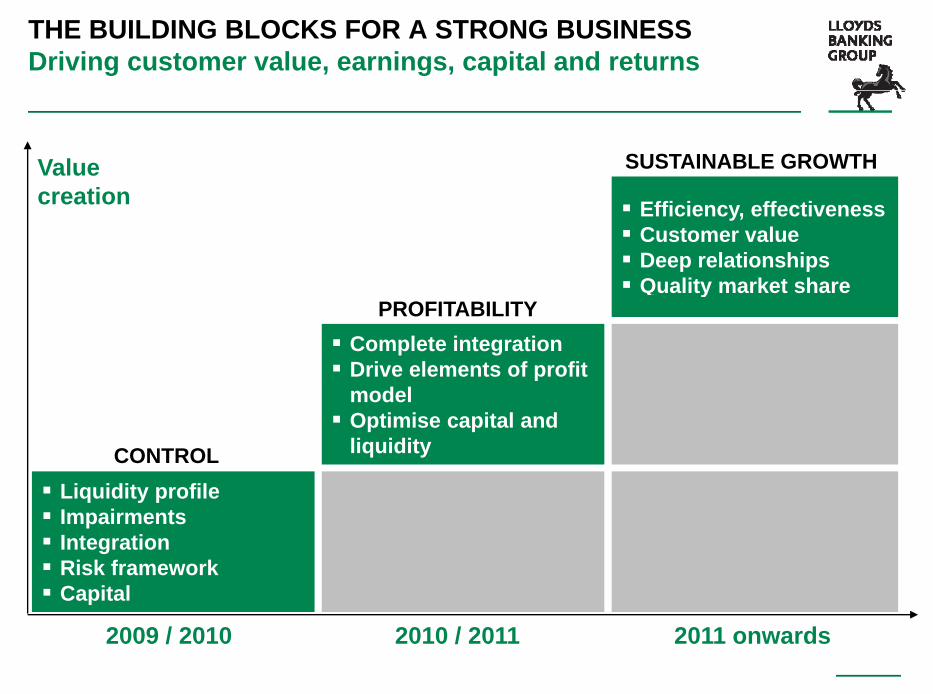
THE BUILDING BLOCKS FOR A STRONG BUSINESSDriving customer value, earnings, capital and returns
SUSTAINABLE GROWTHValue creation Efficiency, effectiveness
Customer value Deep relationships Quality market share
creation
PROFITABILITY Complete integration Drive elements of profit
model
y
CONTROL
model Optimise capital and
liquidity
Liquidity profileq y p Impairments Integration Risk framework Capital
2009 / 2010 2010 / 2011 2011 onwards
p
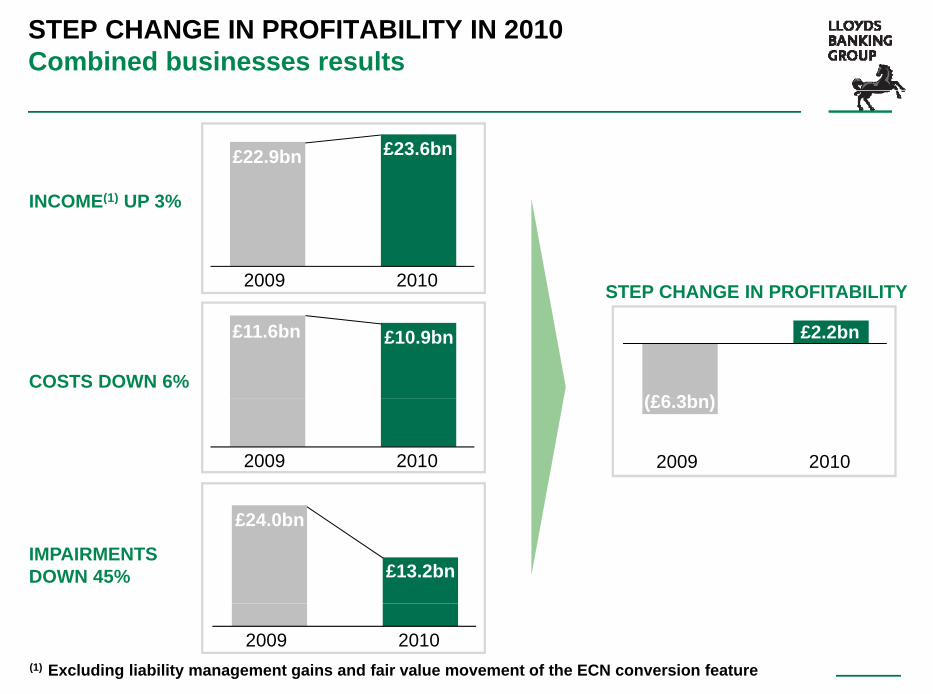
STEP CHANGE IN PROFITABILITY IN 2010Combined businesses results
(1)
£22.9bn £23.6bn
INCOME(1) UP 3%
STEP CHANGE IN PROFITABILITY2009 2010
COSTS DOWN 6%
STEP CHANGE IN PROFITABILITY
£11.6bn £10.9bn
(£6 3bn)
£2.2bn
2009 2010 2009 2010
(£6.3bn)
IMPAIRMENTSDOWN 45%
£24.0bn
£13.2bn
(1) Excluding liability management gains and fair value movement of the ECN conversion feature
2009 2010
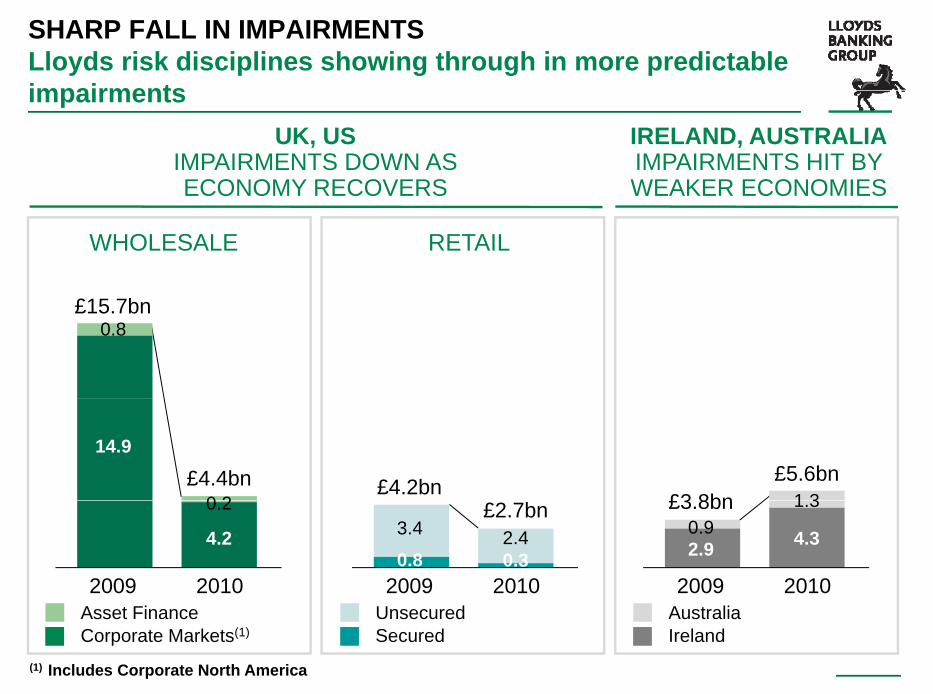
SHARP FALL IN IMPAIRMENTSLloyds risk disciplines showing through in more predictable impairmentsimpairments
UK, US IMPAIRMENTS DOWN AS ECONOMY RECOVERS
IRELAND, AUSTRALIAIMPAIRMENTS HIT BY WEAKER ECONOMIESECONOMY RECOVERS WEAKER ECONOMIES
WHOLESALE RETAIL
£15.7bn0.8
£5.6bn1 3£3 8bn
£4.2bn£4.4bn0 2
14.9
0.82009 2010
4.3
1.3
2.90.9
£3.8bn
2009 2010
£2.7bn
0.32.43.4
2009 2010
4.2
0.2
(1) Includes Corporate North America
Asset FinanceCorporate Markets(1)
UnsecuredSecured
AustraliaIreland

GOOD FRANCHISE MOMENTUM IN 2010Building the drivers of future growth
GROWING THEFRANCHISE
SUPPORTING THEECONOMIC RECOVERY
1.9 million new personal current accounts £30 billion gross mortgage
l di (i l di 5.2 million new savings accounts, 5% growth in retail savings book
lending (including remortgages)
£49 billion committed gross Over 100,000 new start-up
commercial customers
£49 billion committed gross lending to UK businesses
Focus on supporting recovery 17,000 new private banking
customers
Market leading customer
and growth in the SME sector
Lending commitments will be met Market-leading customer
initiatives to build relationshipsmet

INTEGRATING THE BUSINESSIntegration in the final phase
RUN-RATE COST SAVINGSKEY DEVELOPMENTS
Standardised operating modelmodel
Harmonised terms and £2,000m
conditions
Standardised procurement £766m
£1,379m
pand property processes
Major systems changes 2009 2010 2011 Major systems changes target
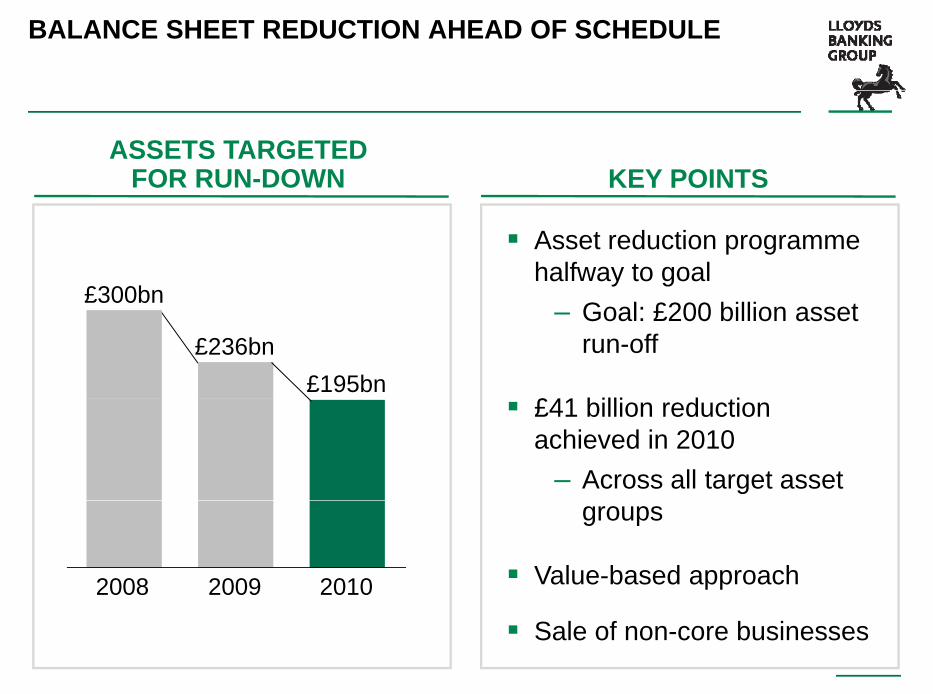
BALANCE SHEET REDUCTION AHEAD OF SCHEDULE
KEY POINTSASSETS TARGETED
FOR RUN-DOWN
Asset reduction programme halfway to goal
£300bn – Goal: £200 billion asset run-off
£41 billi d ti
£300bn
£236bn£195bn
£41 billion reduction achieved in 2010
– Across all target asset groups
Value-based approach2008 2009 2010
Sale of non-core businesses

FUNDING RISK MUCH REDUCED
£162bn £149b
WHOLESALE FUNDING <1 YEARTERM ISSUANCE
£162bn £149bn
£10b (1)
£50bn
£10bn(1)
2009 2010 End 2009 End 2010
£157.2bn
CENTRAL BANK FUNDING
169% 154%
LOAN:DEPOSIT RATIO
£96.6bn
End 2009 End 2010 End 2009 End 2010(1) Excluding government guaranteed issuance

CAPITAL POSITION FURTHER STRENGTHENED
STRONG CAPITAL POSITIONCORE TIER 1 RATIO
Reduced our risk profile in 20102010
Well placed for Basel III8.1%
10.2%
Robust performance in stress tests
5.6%
Core tier 1 ratio including ECNs would be 12 1%31 Dec 31 Dec 31 Dec ECNs would be 12.1%2008 2009 2010

PERFORMING IN LINE WITH OUR 2010 GUIDANCENow getting more predictable financials
GUIDANCE 2010(1)
REVENUE(2) GROWTH High single digit growth within 2 years
MARGINS Margin expected to
COST:INCOME RATIO c.200 p.a. basis points improvement
MARGINS g pincrease to c.2%
INTEGRATION BENEFITS Run rate savings of£2 billion p.a. by end of 2011
p
Half yearly run rate
BALANCE SHEET £200 billion asset
IMPAIRMENTSHalf-yearly run rate
improvement to continue through 2010
REDUCTION reduction (1) Combined businesses basis(2) From core businesses, excludes liability management transactions
SUMMARYA year of significant progress
RISK REDUCEDRETURN TO PROFITABILITY
Group delivering profits in 2010
B l h t b i Good franchise momentum
across all divisions
Balance sheet being restructured
Integration programme on track
Funding position enhanced
Capital position strengthened Trajectory is clear
Capital position strengthened
A much stronger business, positioned for growth

2010 RESULTS25 February 2011
Tim Tookeyoo eyGroup Finance Director

DELIVERING ……
BUSINESS MOMENTUM BUSINESS MOMENTUM
BALANCE SHEET AND CAPITAL STRENGTH BALANCE SHEET AND CAPITAL STRENGTH
A STRENGTHENED FUNDING POSITION A STRENGTHENED FUNDING POSITION
SUMMARY SUMMARY
13

BUSINESS PERFORMANCEIncome statement
£m 2009UNDERLYING % CHANGE2010
HEADLINE % CHANGE
Income(1) 23,444 23,964 3%(2)(2)%
Core +7% Non-core (9)%
Impairments (13,181)(23,988) 45%
Costs (11,078)(11,609) 6%(3)
45%
5%
Profit before tax(4) 2,212 (6,300)
Integration savings run-rate 1,379 766
Margin 2.10%1.77%
14
The Group has delivered a good performance in 2010(1) Net of insurance claims (2) Excluding liability management gains and fair value movement of the ECN conversion feature(3) Excluding impairment of fixed assets (4) Combined businesses basis

RETURN TO PROFITABILITYBusiness performance and statutory profit
PROFIT BEFORE TAX (£m)(1) 2009 H2 2010 H1 2010 2010
(7,371) 1,421988 2,409Divisional performance
Liability management gains 4231,498 - 423Fair value movement of ECN conversion feature 192(427) (812) (620)
Profit/(loss) before tax (6 300) 6091 603 2,21Profit/(loss) before tax (6,300) 6091,603 2
GAPS fee -(2 500)Volatility arising in insurance businesses 306478Integration costs (1,653)(1,096)
GAPS fee -(2,500)
Pension curtailment gain 910-
Negative goodwill credit -11,173
Amortisation(2) and goodwill impairment (629)(993)g
Pre-acquisition results of HBOS plc -280Customer goodwill and payments provision (500)-Loss on disposal of businesses (365)-
15
(1) Combined businesses basis (2) of purchased intangibles
Profit before tax - statutory 2811,042

REVENUE TRENDSGood underlying income growth
42322,893 23,64123,964 23,444
£m+3%
11,238
(1,498)
10,167 9, 6229, 819
(348)427
(620)
13,822
1,096
13 82212,726 12,726 13,822
2009 LiabilityMgmt
Underlying2009
LiabilityMgmt
Underlying2010
2010
Net Interest Income Other Operating Income less insurance claims
MTM onECNs(1)
MTM onECNs(1)
NII OOI
16
Good underlying income growth driven by NII(1) Fair value movement of the ECN conversion feature

NET INTEREST INCOME DRIVERSGood performance driven by increased asset pricing
IMPACT ON NII£bn
VOLUME
Non-core lending continues to fall Customer deleveraging continues Assets (0.4)
Liabilities Growth in relationship deposits Competitive pressures remain
PRICING
0.1
Increase driven by risk re-pricing Repricing largely complete in line with previous guidance Asset pricing
Liability pricing Margins remain depressed
2.6
(1 1) Liability pricing g p Focus on relationship products reduces margin strain
FUNDING VOLUME
(1.1)
(0.2)FUNDING RATE0.4
17
NON BANKING INCOME (0.3)
1.1

NET INTEREST INCOME DRIVERSGood performance despite increasing funding costs
IMPACT ON NII£bn
VOLUME (0 3)
FUNDING VOLUME
Fall in funding
VOLUMEPRICING
(0.3)1.5
0 6 Significant reduction in customer funding gapFall in funding requirement
Term issuance plan 2010 issuance requirements exceeded
0.6
(0.2)
FUNDING RATE
Higher issuance spreads increasing average funding costs Market spreads
plan
(0 2)Higher issuance spreads increasing average funding costsMarket spreads (0.2)
1 1
NON BANKING INCOME (0.3)
18
1.1

OTHER OPERATING INCOMEUnderlying income fell 3%(1)
(£m)
10,167(3)%
10,167
(70) 9,819(100) (61)(117)(117)
Underlying 2009
OtherImpact of PPInew
businessl
Overdraftcharges
Underlying 2010
Assetsales
19
(1) Underlying income excludes liability management gains and the fair value movement of the ECN conversion feature
closure

ECONOMIC ASSUMPTIONSExpect slow recovery, in line with consensus
BASE RATEGDP
(% growth) 2.6(% growth)
Market implied rate2.0
2.5
3.0
vera
ge
1 4
1.9
2.4
2.12.11.9
Group assumption0 5
1.0
1.5
% q
uart
er a
v1.4
2010 2011 2012 2011 20120.0
0.5%GroupBase
Consensus from HMTsurvey of Independent
OBR data
House prices
D 2% i 2011
Commercial property prices
D 2% i 2011
Unemployment
E t d t k i 2011
BaseScenario
survey of Independentforecasts Nov and Dec 2010
20
– Down 2% in 2011– Up 2% in 2012
– Down 2% in 2011– Up 3% in 2012
– Expected to peak in 2011 at 8.1%
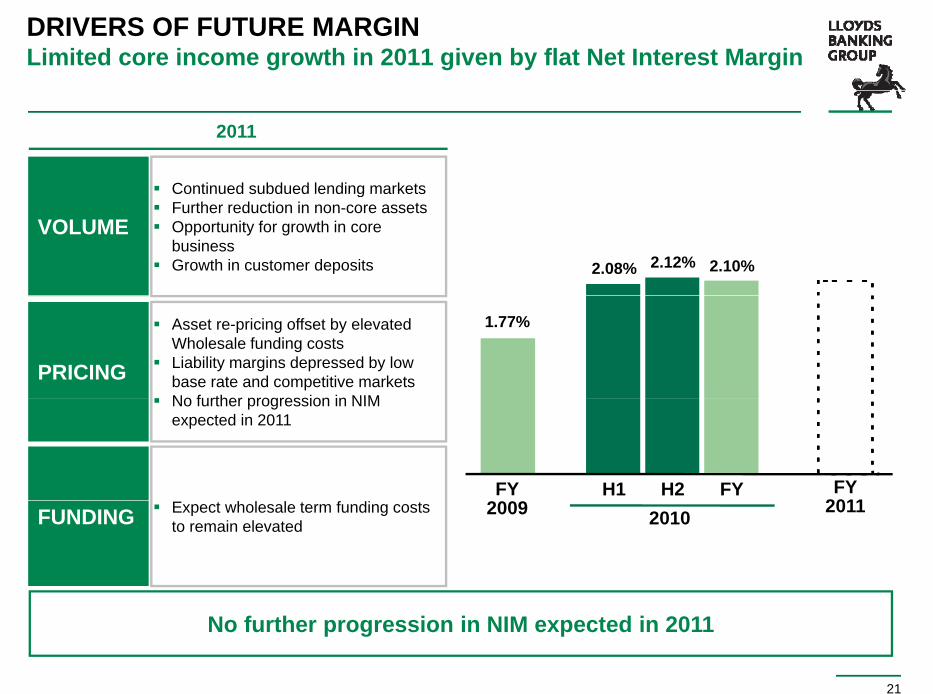
DRIVERS OF FUTURE MARGINLimited core income growth in 2011 given by flat Net Interest Margin
Continued subdued lending markets
2011
Continued subdued lending markets Further reduction in non-core assets Opportunity for growth in core
business Growth in customer deposits
VOLUME
2.08% 2.12% 2.10%
PRICING
Asset re-pricing offset by elevated Wholesale funding costs
Liability margins depressed by low base rate and competitive markets
No further progression in NIM
1.77%
No further progression in NIM expected in 2011
FY2011
H2FY H1 FYFUNDING Expect wholesale term funding costs
to remain elevated201120102009
21
No further progression in NIM expected in 2011

DRIVERS OF FUTURE MARGIN
BANK BASE RATE, WHOLESALE ISSUANCE COSTS & MARGIN OUTLOOK
20142010 20142010
3.21% Higher absolute issuance costs but at lower spreads over timeWHOLESALE ISSUANCE COSTS(1)
0.50% Lloyds Banking Group forecast 3.75%BANK BASE RATE
1 56% ASSET MARGIN1.56% Limited further improvementASSET MARGIN
0.97% Increases facilitated by base rate movementsLIABILITY MARGIN
2 10% >2.5% driven by liability margin
22
(1) Based on market rates as at 31 December 2010 for a 5 year benchmark senior floating rate note
2.10% growth and reduced wholesale issuance spreads
NIM

COST PERFORMANCEContinued strong cost control
£m (6)%
11,609393 10,928(1)
,
(247)
(827)
Investment/Other
2009Operatingexpenses
Operatinglease
depreciation
Cost synergies
2010Operatingexpenses
23
(1) Excluding impairment of fixed assets acquired after debt restructuring
Continued strong cost control and delivery of synergy programmes
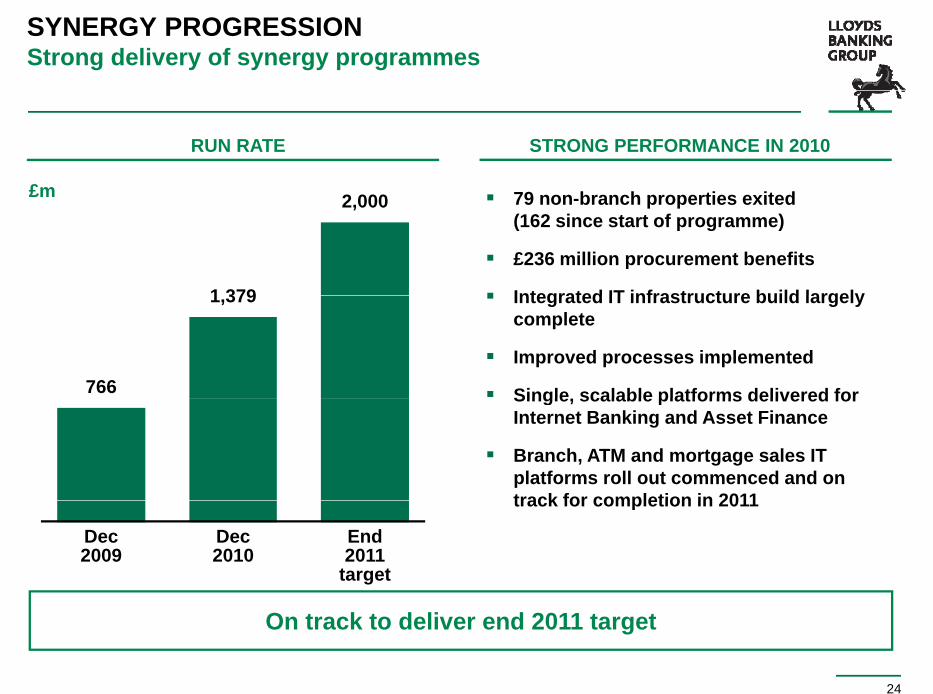
SYNERGY PROGRESSIONStrong delivery of synergy programmes
79 b h ti it d£m
RUN RATE STRONG PERFORMANCE IN 2010
79 non-branch properties exited(162 since start of programme)
£236 million procurement benefits
Integrated IT infrastructure build largely
£m 2,000
1 379 Integrated IT infrastructure build largely complete
Improved processes implemented
Single scalable platforms delivered for766
1,379
Single, scalable platforms delivered for Internet Banking and Asset Finance
Branch, ATM and mortgage sales IT platforms roll out commenced and on track for completion in 2011track for completion in 2011
Dec2009
End2011
target
Dec2010
24
On track to deliver end 2011 target

REDUCTIONS IN UNDERLYING COST : INCOME RATIO
50.7%
UNDERLYING COST : INCOME RATIO(1)
46.2%
c.40%Excl. Bank Levy
201420102009
25
(1) Excluding liability management gains, fair value movement of the ECN conversion feature and impairment of fixed assets
Costs broadly flat in 2011

GROUP IMPAIRMENT CHARGESignificant reduction, primarily driven by Wholesale
£10.8 billion (45%) reduction in Group impairment charge
£bn
£1.5 billion (35%) reduction in Retail impairment charge
£11.2 billion (72%) reduction in Wholesale impairment charge
13.412.4
24.0 (45)%
– primarily driven by a reduction in commercial real estate and related portfolios
£1.9 billion (47%) increase in Wealth and
10.6
6 66 6
13.2
International charge
– Driven by further deterioration in Ireland in second half
– Some effect from specific Australian2.5
6.66.6
Some effect from specific Australian exposures
Ahead of original 2009 year end guidance for 2010H1/08 H2/08 H1/09 H2/09 H1/10 H2/10
26
Further reduction in impairment charge expected in 2011

IRISH PORTFOLIOCoverage level increased due to economic uncertainties
IMPAIRED/UNIMPAIRED ASSETS
Market sentiment adversely impacted by downturn and EU-IMF bail out
Consequently asset prices54%
Consequently asset prices expected to be depressed for longer
Coverage ratio increased to 54% (from 42% at H1) due to likely53%
37%42%40%
(from 42% at H1) due to likely deferred realisation of asset values
Downside risks still remain
H1/09 H2/09 H1/10 H2/10
14%33%
44% 53%
UnimpairedImpaired Coverage ratio
BOSI now dissolved assets fully managed from UK and
H1/09 H2/09 H1/10 H2/10
27
BOSI now dissolved, assets fully managed from UK andrundown driven by experienced BSU team

RETAIL – GOOD PERFORMANCEGood performance driven by income growth and lower impairment
Profit before tax increased to £4 7 billion driven by good
PROFIT BEFORE TAX (£bn)
4.70.7 £4.7 billion, driven by good income growth, tight cost control and a significantly lower impairment charge
Income up 12% largely as a
4.7
1.0Income
Core +£1.0 billionNon-core +£0.2 billion
Income up 12% largely as a result of continued repricing of risk, mortgage customers moving onto SVR and a decrease in the LIBOR to Base Rate
(0.1)1.2
0.5
spread
Operating expenses tightly controlled
I i t h d 35%
1.4
Impairment charge down 35% driven by reduced impairment on both secured and unsecured portfoliosDec
2009Dec2010
Income Costs SecuredImpair-ment
UnsecuredImpair-ment
Increase In fairvalue
28
ment ment valueunwind

WHOLESALE – IMPAIRMENT SIGNIFICANTLY LOWERReturn to profitability driven by reduction in impairment
0 6 Profit before tax increased to
PROFIT BEFORE TAX (£bn)
(3.7)0.6
£3.3 billion principally driven by significant reduction in impairment charge
Impairment charge 72% lower
IncomeCore +£0.2 billion
Non-core -£0.5 billion
11.2
Impairment charge 72% lower than last year at £4.4 billion but continues to be driven by HBOS heritage corporate real estate and related portfolios
3.3
(4 7)
Income down 4%, primarily driven by lower interest earning asset balances, in line with targeted balance sheet
(4.7) reductions and lower income in Treasury and Trading
Good progress in reducing operating expenses
29
(0.3) 0.2Dec2009
Dec2010
Income Costs Impair-ment
Other Decreasein fair
value unwind

INSURANCE – SOLID PERFORMANCECapital intensity reduced
SALES DOWN
WHILST
SALES –PVNBP (20)%
3.5%EEV
MarginWHILST MARGINS
UPINCREASED
PROFITABILITY
(140)bps3 3%
2009 2010
2.5%
IFRS
£975m£1,102m
+13%
NEW BUSINESS CAPITAL
IMPROVED(1)
1.9%
3.3% £975m
GI COMBINED
2009 2010
83% 79%
(400)bps 2009 2010
RATIO IMPROVED
2009 2010
30
Focus on value over volume, driving improved returns(1) New business capital divided by sales

DELIVERING ……
BUSINESS MOMENTUM BUSINESS MOMENTUM
BALANCE SHEET AND CAPITAL STRENGTH BALANCE SHEET AND CAPITAL STRENGTH
A STRENGTHENED FUNDING POSITION A STRENGTHENED FUNDING POSITION
SUMMARY SUMMARY
31
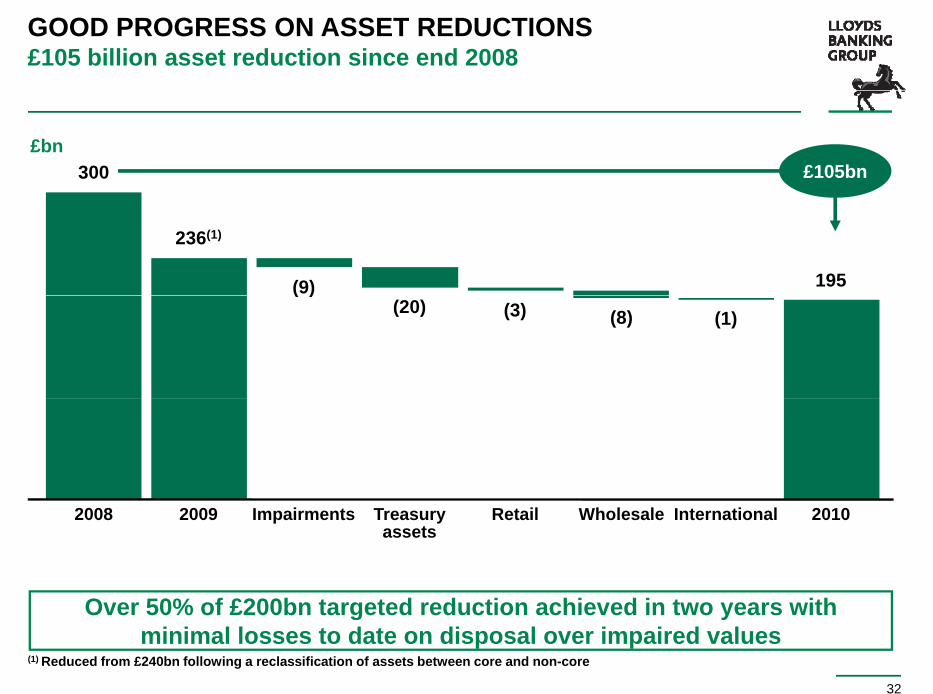
GOOD PROGRESS ON ASSET REDUCTIONS£105 billion asset reduction since end 2008
£bn300 £105bn
236(1)
(9) 195
(8)(20)( )
(3) (1)
2009 Impairments RetailTreasuryassets
2010
Over 50% of £200bn targeted reduction achieved in two years with
InternationalWholesale2008
32
Over 50% of £200bn targeted reduction achieved in two years with minimal losses to date on disposal over impaired values
(1) Reduced from £240bn following a reclassification of assets between core and non-core

INDICATIVE PROFILE OF CORE / NON-CORE BUSINESSNon-core reductions continue to be important
NON-CORECORE
1882%Income (underlying)
69
35
31
65
%
%
Impairment
RWAs
195797£bnTotal assets
Non core assets are more capital intensive and generate a
33
Non-core assets are more capital intensive and generate a disproportionate level of impairment

BALANCE SHEET DE-RISKINGReducing the capital intensity of our business
RISK-WEIGHTED ASSETS (£bn)
Overall RWA reduction driven by:
– Asset reductions
493.3
406.4– Reclassification of certain assets to
Foundation IRB (£23bn impact)
Further risk-weighted asset reductions t d t f
Non-core 188.7
141.0
expected over next few years
– Further asset reduction
– Improving economic conditionsCore 304.6
265.4
December 2009
December2010
34
Further reduction of risk-weighted assets expected over next few years
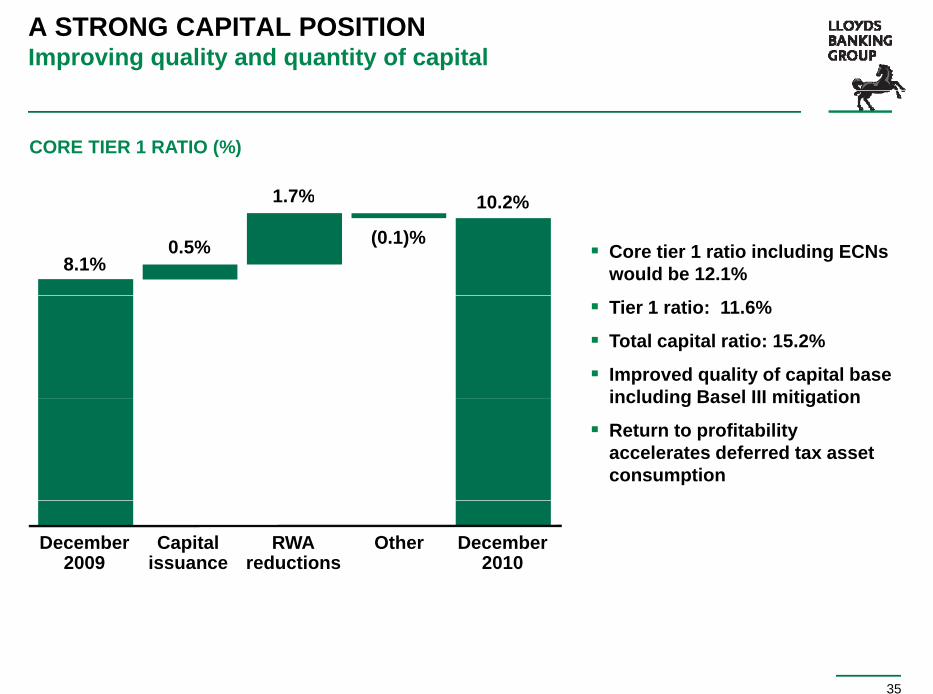
A STRONG CAPITAL POSITIONImproving quality and quantity of capital
1 7%
CORE TIER 1 RATIO (%)
8.1%
1.7%
0.5% (0.1)% Core tier 1 ratio including ECNs
would be 12.1%
10.2%
Tier 1 ratio: 11.6%
Total capital ratio: 15.2%
Improved quality of capital base including Basel III mitigationincluding Basel III mitigation
Return to profitability accelerates deferred tax asset consumption
December2009
Other December2010
RWAreductions
Capitalissuance
35

IMPACT OF BASEL CHANGESImpact of Basel 2.5/3 changes on pro-forma Core tier 1 ratio(1)
Impact of insurance deduction on CT1 in
3.7%
2.0%
(1.2)%
14.7%
deduction on CT1 in 2014 is c.0.3%B2.5
B3
20%
80%
10.2%
Existing asset reduction programme mitigates likely
Dec 2010CT1 ratioBasel 2
Consensusretained earnings
(2011 – 2013)
Illustrative£60bn RWA non-core
reduction
Increase in RWA’s from Basel 2.5/3
Dec 2013CT1 ratioBasel 3
(transitional rules)before new business growth
36
Existing asset reduction programme mitigates likely impact of Basel proposals
(1) See preparation notes in appendix
DELIVERING ……
BUSINESS MOMENTUM BUSINESS MOMENTUM
BALANCE SHEET AND CAPITAL STRENGTH BALANCE SHEET AND CAPITAL STRENGTH
A STRENGTHENED FUNDING POSITION A STRENGTHENED FUNDING POSITION
SUMMARY SUMMARY
37

FURTHER REDUCTIONS IN OUR WHOLESALE FUNDING…and maturity profile maintained
WHOLESALE FUNDING £298BNWHOLESALE FUNDING MATURITY PROFILE
£bn (13)% 50%
1–2 years£47bn
2–5 years£52bn
> 5 years £50bn
151
343326
1
298
( )
15144% 164
50%
> 1 yr14950%
22% reductionin < 1 year
19256% 162
50%< 1 yr 149
50% P i li id
in < 1 year
Continued progress in reducing wholesale funding position goodDec 2008 Dec 2009 Dec 2010
50%
Less than 1 year£149bn
Primary liquid asset
coverage(1)
38
Continued progress in reducing wholesale funding position, good progress on reducing liquidity risk
(1) Primary liquidity of £98 billion

FURTHER REDUCTIONS IN GOVERNMENT & CENTRAL BANK FUNDINGAccelerated pay-down ahead of contractual maturitiesAccelerated pay-down ahead of contractual maturities
REDUCING GOVERNMENT & CENTRAL BANK FUNDING
£bn (39)%£bn (39)%
£61 billion reduction in government and central bank funding
157.2
Other(1)
107.2
funding
Further £13 billion repayment of government and central bank funding since year end
96.6
CGS
No remaining ECB or US Fed funding
Other(2)
51.2
Dec 2009
CGS50.0
Dec 2010
CGS45.4
All facilities mature by Q4/2012
39
(1) Other: UK Special Liquidity Scheme facilities, US Federal Reserve, ECB, Bank of Japan and Reserve Bank of Australia (2) Other: UK Special Liquidity Scheme facilities and Reserve Bank of Australia

FURTHER REDUCTIONS IN OUR LOAN TO DEPOSIT RATIOLoan to deposit ratio now at 154% - Core book ratio is 119%
REPORTED RATIO CORE BUSINESS RATIO
(1500)bps
169% 154%128% 119%
(1500)bps
(900)bps
2009 2010 2009 2010
Loan to deposit ratio continues to improve due to:– Excellent relationship deposit growth– Continued customer deleveragingContinued customer deleveraging– Subdued new lending demand
Loan to deposit ratio on core book significantly lower at 119%
C i d l d i i f ll b l 140% f
40
Continue to expect reported loan to deposit ratio to fall to below 140% over next few years
Liquidity Coverage Ratio : 71% / Net Stable Funding Ratio : 88%

FUNDING SUMMARYExecuting a broad funding strategy
Reduced absolute level of wholesale funding
Good deposit growth
Reducing reliance on short-term funding
Reduced government and central bank funding by £61 billion
Substantial liquid asset buffer (£98 billion) provides 2011 flexibility
Completed c.£50 billion of term issuance in 2010, well ahead of plan
Diverse range of funding products and sources
Plans to reduce wholesale funding further while reinvesting for growth
41
A strengthened funding position

DELIVERING ……
BUSINESS MOMENTUM BUSINESS MOMENTUM
BALANCE SHEET AND CAPITAL STRENGTH BALANCE SHEET AND CAPITAL STRENGTH
A STRENGTHENED FUNDING POSITION A STRENGTHENED FUNDING POSITION
SUMMARY SUMMARY
42

A PROFITABLE, STRENGTHENED BUSINESSGood progress towards our medium term targets
Strong progress in balance sheet reduction
Funding and liquidity position much improved
Further reduction in risk in the business
g q y p p
Substantial reduction in Group impairments
Stronger capital ratios
Substantial reduction in Group impairments
2010 margin improvements delivered
On track to deliver improved shareholder returns
43
Strong prospects over the medium term

APPENDIXAPPENDIX

LOANS AND ADVANCES TO CUSTOMERS
31 Dec 2010LOANS AND ADVANCES TO CUSTOMERS £611 BILLION(1)
Property companies13%
Financial, business & other services10%
Construction1%
Personal other6%
Personal mortgages58%
Corporate other1%
Manufacturing2%
Lease financing & hire purchase2%
Agriculture, forestry & fishery1%
45
(1) Before allowance for impairment losses totalling £18.4 billion and fair value adjustments
Transport, distribution & hotels6%

MORTGAGE PORTFOLIO
31 Dec 2010UK MORTGAGE PORTFOLIO £341.1 BILLION
Specialist£29.3bn
Mainstream£265 4bn
Buy to let£46.4bn
£265.4bn
46

MORTGAGE PORTFOLIO
NEW BUSINESS
31 Dec 2009 31 Dec 2010
First TimeBuyer
Buy to Let£4.4bnFirst Time
BuyerBuy to Let & Other(1)
£5.0bn
£34.7bn £30.1bn
Buyer£5.5bn
Buyer£5.3bn
18%15%15%14%
Further Advances
£2.9bn
Further Advances
£4.0bn 12% 10%
Homemovers£11.2bn
Remortgages
Homemovers£11.0bn
Remortgages
20% 37%27%
32%
Remortgages£6.1bn
Remortgages£9.4bn
47
(1) Incorporates a small amount of specialist business
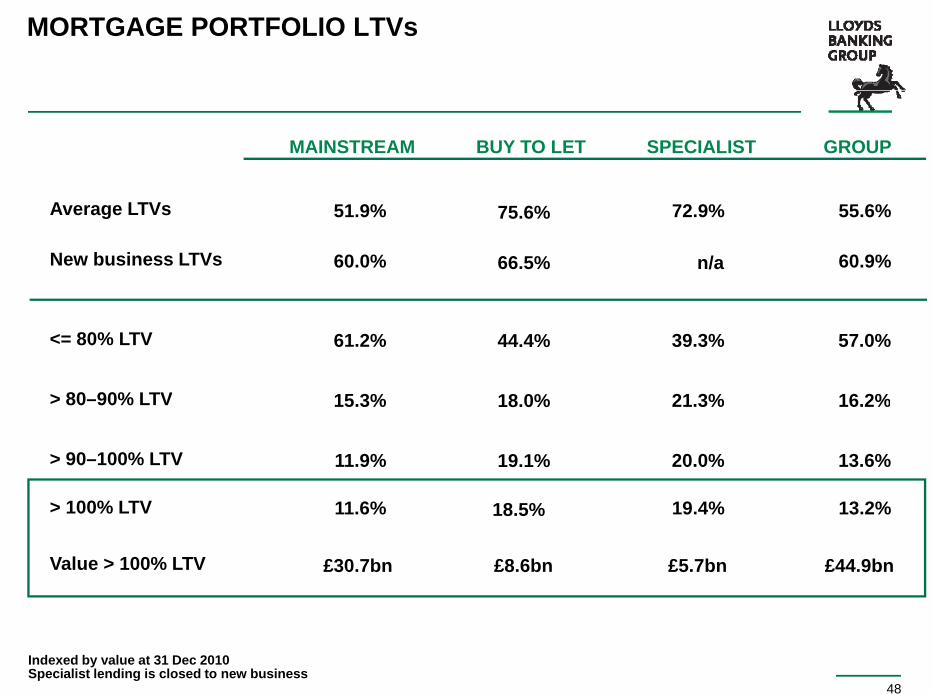
MORTGAGE PORTFOLIO LTVs
BUY TO LET GROUPSPECIALISTMAINSTREAM
New business LTVs
Average LTVs
66.5%
75.6%
60.9%
55.6%
n/a
72.9%
60.0%
51.9%
<= 80% LTV 44.4% 57.0%39.3%61.2%
> 80 90% LTV 18 0% 16 2%21 3%15 3%
100% LTV
> 80–90% LTV 18.0% 16.2%21.3%15.3%
> 90–100% LTV 19.1% 13.6%20.0%11.9%
> 100% LTV
Value > 100% LTV
18.5%
£8.6bn
13.2%
£44.9bn
19.4%
£5.7bn
11.6%
£30.7bn
48
Indexed by value at 31 Dec 2010Specialist lending is closed to new business

MORTGAGE PORTFOLIO
Portfolio
31 DEC 2010
>100% >100% >100%
31 DEC 2009
Specialist
£341.1bn
£29.3bn 8.6% £5.7bn (19.4%)
LTV
£0 8b (2 7%)
LTV and >3 months
in arrears
LTV and >3 months
in arrears
Buy to let £46.4bn 13.6%£8.6bn (18.5%) £0.6bn (1.3%)
£0.8bn (2.7%)
£0.6bn (1.2%)
£0.7bn (2.3%)
M i t £265 4b 77 8%Mainstream £265.4bn 77.8%
£30.7bn (11.6%)
£1.8bn (0.7%) £1.7bn (0.6%)
49
£3.2bn (0.9%) £3.0bn (0.9%)

MORTGAGE ARREARS TRENDS
% OF TOTAL CASES >3 MONTHS IN ARREARS8%
6%
7%
Market2 11%(2)
4%
5%
2.11%(2)
2%
3%
Q4 08Q3 07 Q3 08Q2 08Q1 08Q4 07Q2 07Q1 07 Q2 09Q1 09 Q3 09 Q4 09 Q1 10 Q2 10 Q3 10 Q4 10
0%
1%
50
(1) Source: Council of Mortgage Lenders (2) CML Q4 10Note: chart shows mortgages >3 months in arrears excluding possessions stock as a proportion of total cases
CML total market (1) Mainstream Buy to LetSpecialist

TREND IN MORTGAGE PORTFOLIO ARREARS
Volume ‘000s
CUSTOMERS NEW TO ARREARS
144160
131 128 129 128
H1 08 H2 09H1 09H2 08 H1 10 H2 10
51
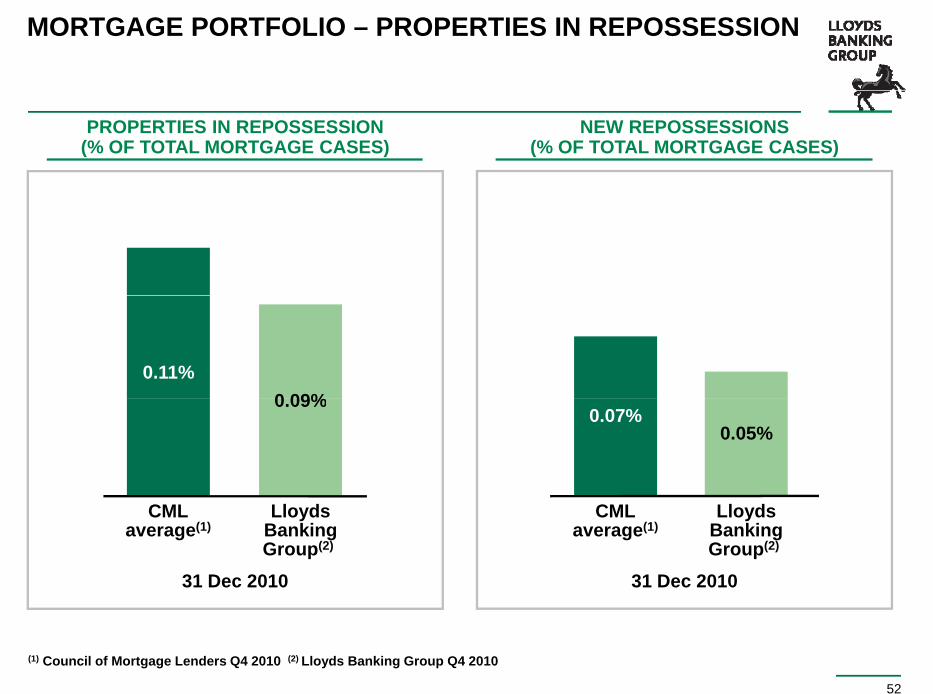
MORTGAGE PORTFOLIO – PROPERTIES IN REPOSSESSION
NEW REPOSSESSIONS(% OF TOTAL MORTGAGE CASES)
PROPERTIES IN REPOSSESSION(% OF TOTAL MORTGAGE CASES)
0 09%0.11%
0.05%0.07%
0.09%
LloydsBankingGroup(2)
CMLaverage(1)
31 Dec 201031 Dec 2010
LloydsBankingGroup(2)
CMLaverage(1)
52
(1) Council of Mortgage Lenders Q4 2010 (2) Lloyds Banking Group Q4 2010

MORTGAGE PORTFOLIO – PROPERTIES IN REPOSSESSION
% of mortgage cases
PROPERTIES IN REPOSSESSION
Peaked in 2008 Q3Peaked in 2008 Q30.13%
Council of Mortgage Lenders0.20%
0.25%
Lloyds Banking Group0.05%
0.10%
0.15%
0.00%
Q1 08 Q2 08 Q3 08 Q4 08 Q1 09 Q2 09 Q3 09 Q4 09 Q1 10 Q2 10 Q3 10 Q4 10
53

MORTGAGE PORTFOLIO – NEW REPOSSESSIONS
% of total cases
NEW REPOSSESSIONS
0.05%0.07%
0.06%0.09%
31 Dec 2010
LBG CML
31 Dec 2009
LBGCML
54

REPOSSESSIONS FLOW
FLOW TO REPOSSESSION0.14%
0 10%
0.12%
0.08%
0.10%
0.04%
0.06%
0 00%
0.02%
55
Lloyds Banking Group Council of Mortgage Lenders
Q4 08 Q4 09 Q4 100.00%

UNSECURED LENDING PORTFOLIO
31 DEC 2009£32.1bn
31 DEC 2010£27.9bn
Credit cards
£11.2bnOther£0.2bn
Credit cards
£12.3bnOther£0.3bn
PersonalCurrent
Accounts£2.6bn
PersonalCurrent
Accounts£2.6bn
Loans£13.9bn
Loans£16.9bn
Impairment charge as a % of average lending
56
LoansCards11.4% 7.7%
LoansCards9.5% 5.9%

UNSECURED LENDING PORTFOLIO
UNSECURED IMPAIRED LOANS£m
2,981
3,6033,819
2,981
Dec 2010
June 2010
Dec 2009
Loans Cards Current accounts
57
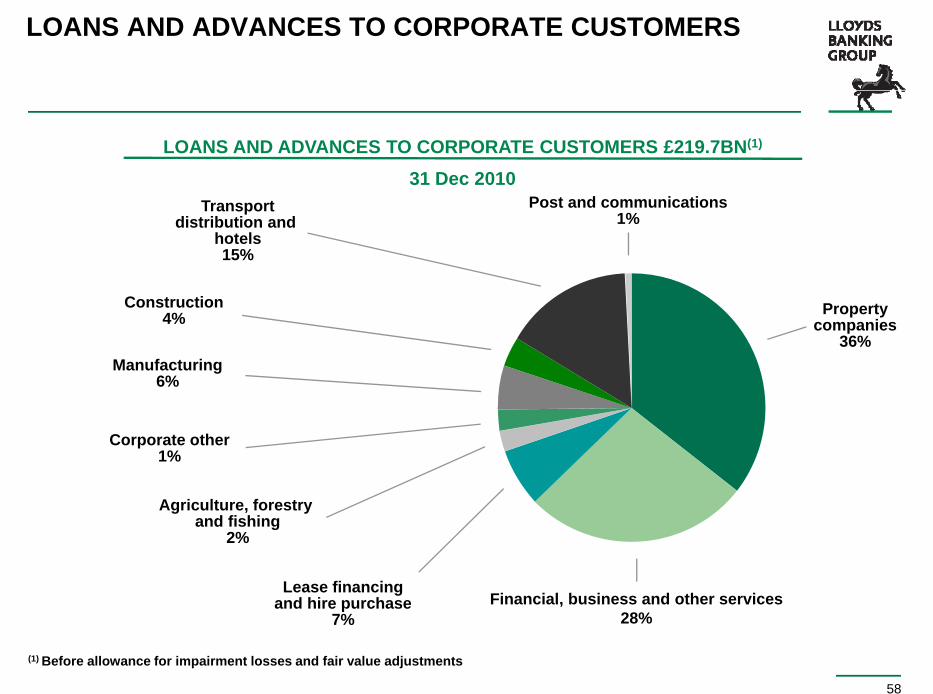
LOANS AND ADVANCES TO CORPORATE CUSTOMERS
31 Dec 2010LOANS AND ADVANCES TO CORPORATE CUSTOMERS £219.7BN(1)
Transportdistribution and
hotels15%
Post and communications1%
Propertycompanies
36%Manufacturing
6%
Construction4%
Corporate other1%
A i lt f t
Lease financingand hire purchase
Agriculture, forestry and fishing
2%
Financial, business and other services
58
and hire purchase7%
Financial, business and other services28%
(1) Before allowance for impairment losses and fair value adjustments

COMMERCIAL/RESIDENTIAL PROPERTY & HOUSEBUILDER LENDING
£83.7bn
Lloyds Banking Group UK £56.3bn
Lloyds Banking Group Overseas(1)
£27.4bn33%67%
LBG UK
LBG Overseas
59
Gross (pre FV adjustment and impairment). Includes Joint Ventures(1) Includes lending to non UK residents, and excludes residential mortgages

UK COMMERCIAL/RESIDENTIAL PROPERTY &HOUSEBUILDER LENDING
COMMERCIAL PROPERTY £35.7bn
£56.3bn(1)
RESIDENTIAL PROPERTY £17.3bn
Through the cycle policy, 54% Housing Associations supporting existing customer franchise
Some concentration seen in South East and London,
(local authority cash flows)
Larger residential property companies
although well spread across remaining UK
Portfolio weighted toward investment over development 63%
31%
HOUSEBUILDERS £3.3bn Key development origination criteria:
LTSB heritage exposure mainly to the national housebuilders Lower of 60% of gross
6%
housebuilders.
HBOS previously focused on regional housebuilders
development value or 65% project costs
Min 100% cover from pre-lets
Avoid pure speculative development
Commercial property
Residential Property
Housebuilders
60
development Housebuilders
(1) Gross (pre FV adjustment and impairment)
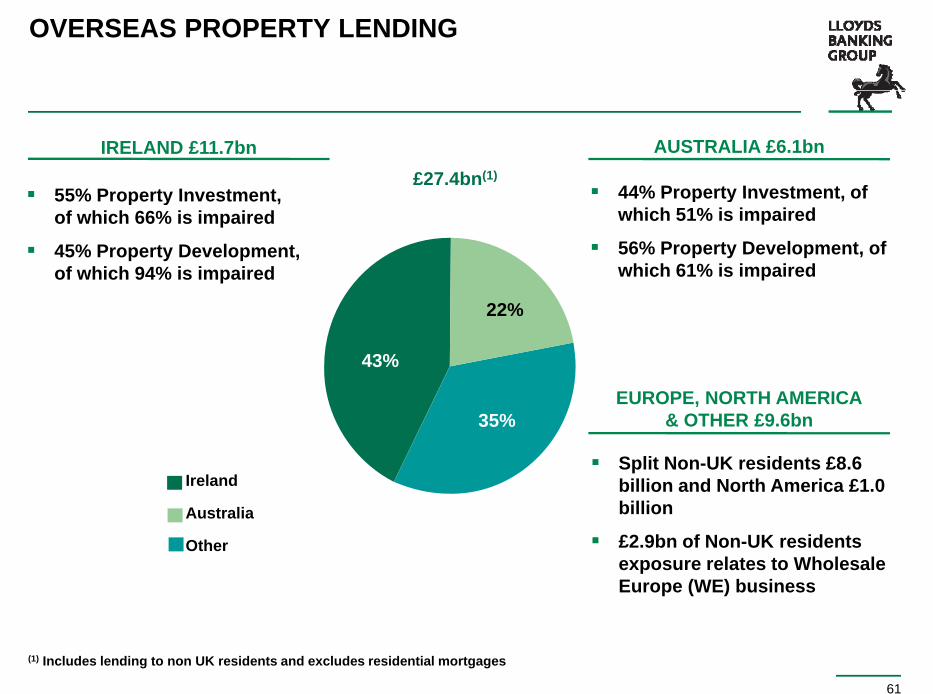
OVERSEAS PROPERTY LENDING
£27.4bn(1)
IRELAND £11.7bn AUSTRALIA £6.1bn
55% Property Investment 44% Property Investment of 55% Property Investment, of which 66% is impaired
45% Property Development, of which 94% is impaired
44% Property Investment, of which 51% is impaired
56% Property Development, of which 61% is impaired
EUROPE NORTH AMERICA
43%
22%
EUROPE, NORTH AMERICA& OTHER £9.6bn
Split Non-UK residents £8.6 billion and North America £1.0 Ireland
35%
billion
£2.9bn of Non-UK residents exposure relates to Wholesale Europe (WE) business
Australia
Other
61
(1) Includes lending to non UK residents and excludes residential mortgages

LEVERAGED FINANCE LENDING
K d t i h fl
LLOYDS ACQUISITION FINANCE£11.6bn
£14.5bn
LLOYDS INTERNATIONAL£2.9bn
Key product is cash flow lending. The business originates, executes and portfolio manages deals
Portfolio exposure has
Well spread by industry sector
95% of country risk in portfolio is Australia or New Z l d ith i d Portfolio exposure has
reduced by c.£2.6 billion in 2010 with new business offset by asset repayments and sales
Zealand, with remainder relating to Asia
£0.8bn considered sub standard/ impaired20%
80%
A highly selective origination strategy
Predominantly UK focused
Underwriting criteria same as for held assets
Assets monitored closely, with c.£6.0 billion of the
Lloyds Acquisition Finance
Lloyds International
62
portfolio considered substandard/impaired

RISK CAPITAL PORTFOLIO AT CARRY VALUE(1)
MANAGE FOR GROWTHLLOYDS DEVELOPMENT CAPITAL (£1.2bn)
£4.1bn(2) Ongoing direct equity business being
MANAGE FOR VALUEFUND INVESTMENTS (£2.3bn)
Generally, Limited Partner Investments in managed for growth
LDC has been profitable throughout the last economic cycle
Portfolio is highly diversified by sector, UK geography and, through investing consistently through the cycle by vintage 56%
private equity funds; well diversified underlying exposure principally in UK and Europe
Includes a small direct investment portfolio of private equity deals.
consistently through the cycle, by vintage year
Portfolio consists of c.85 investments, average size of investment is c.£14m
3%
56% During H2, 70% of the Bosif portfolio was sold to Cavendish Square Partners LP. A 30% stake retained in the new Cavendish vehicle is managed by the Fund Investments Team
JOINT VENTURES (£0.15bn)
Asset backed investments, principal sectors Real Estate (UK & Europe), Hotels and House builders
PROJECT FINANCE (£0.3bn)
Portfolio of high-quality, predominantly operational, PFI/PPP assets largely based in the UK.
3%30%8%
3%
Primarily availability driven, these investments are structured with the objective of providing long-term, secure cash flows
BUSINESS SUPPORT UNIT (£0.15bn)
To manage equity positions resulting from restructuring activity across Wholesale and
MANAGE FOR RECOVERYFunds Investment
Joint Ventures
Business Support Unit
Project Finance
63
(1) Excludes undrawn commitments of c.£1.4bn(2) Excludes £0.1bn of funds investments managed by BoS USA and £0.1bn carry value of Risk Capital held by W&I Division
restructuring activity across Wholesale and other legacy assets
j
Lloyds Development Capital

TREASURY DEBT SECURITIES PORTFOLIO
31 DEC 10LOANS ANDADVANCES
£bnTOTAL
£bn
FAIR VALUE THROUGH P&L
£bn
AVAILABLEFOR SALE
£bn
Asset Backed Securities 24.2 9.4 1.1 34.7
Covered bonds - 3.5 - 3.5
Bank / Financial Institution Fixed and Floating Rate Notes 0.8 8.7 1.8 11.3
Bank Certificate of Deposits 0 4 4 2 4 6Bank Certificate of Deposits - 0.4 4.2 4.6
Other 0 3 0 1 4 9 5 3
Treasury Bills and other bills - 5.9 0.2 6.1
Other 0.3 0.1 4.9 5.3
Total 25.3 28.0 12.2 65.5
64
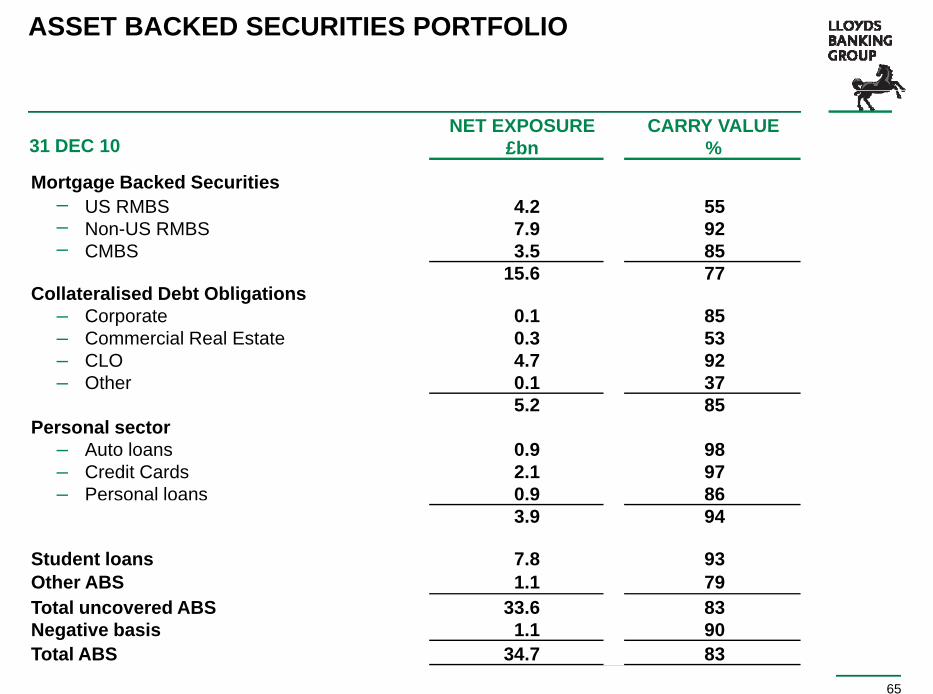
ASSET BACKED SECURITIES PORTFOLIO
Mortgage Backed Securities
%£bnCARRY VALUENET EXPOSURE
31 DEC 10
Collateralised Debt Obligations7715.6853.5CMBS–927.9Non-US RMBS–554.2US RMBS–
855 2370.1Other–924.7CLO–530.3Commercial Real Estate–850.1Corporate–
Collateralised Debt Obligations
860.9Personal loans–972.1Credit Cards–980.9Auto loans–
Personal sector855.2
8333 6T t l d ABS791.1Other ABS937.8Student loans
943.9
65
8334.7Total ABS901.1Negative basis8333.6Total uncovered ABS
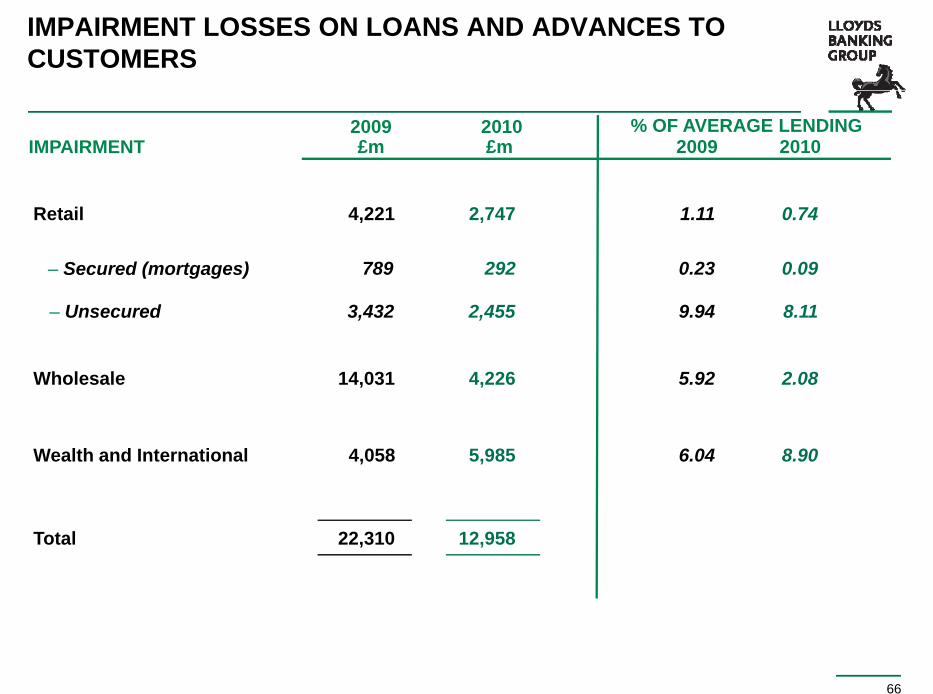
IMPAIRMENT LOSSES ON LOANS AND ADVANCES TO CUSTOMERS
% OF AVERAGE LENDINGIMPAIRMENT
2010£m 20102009
2009£m
Retail 2,747 0.741.114,221
– Secured (mortgages) 292 0.090.23789
– Unsecured 2,455 8.119.943,432
Wholesale 4,226 2.085.9214,031
Wealth and International 5,985 8.906.044,058
Total 12,95822,310
66

IMPAIRMENT CHARGESignificant reduction, primarily driven by Wholesale
Significant reduction in secured and
RETAIL
45% reduction in Group impairment charge
GROUP
Significant reduction in secured and unsecured impairments
Improving asset quality expected to support future trends
45% reduction in Group impairment charge Reduction primarily driven by reductions in
Wholesale, partially offset by the impact of Ireland
(45)%24.0
13.412.4
10.6
(35)%6.66.6
13.2
4.2
2.02.3 2.21.31.4
2.51.4
2.74.2
67
H2/08 H1/09 H2/09 H1/10H1/08H1/08 H2/08 H1/09 H2/09 H1/10 H2/10 H2/10
Secured Unsecured

IMPAIRMENT CHARGESignificant reduction, primarily driven by Wholesale
Primarily driven by reductions in
WHOLESALE
Driven by further deterioration in Ireland in
W&I
Primarily driven by reductions in commercial real estate and related portfolios
Traditional business impairments performing as expected
Driven by further deterioration in Ireland in second half
Some effect from specific Australian exposures
(72)%15.7
9 3 9.7
47%
4.4 4.16.0
9.3
6.0
1.1
H1/08 H2/08 H1/09 H1/10
3.01.4
0.1 0.71.5
2.6 2.23.8
68
Other Ireland
H1/08 H2/08 H1/09 H2/09 H1/10 H2/10 H1/08 H2/08 H1/09 H2/09 H1/10 H2/10

IMPAIRED ASSET RATIOS – GROUP
WHOLESALE GROUPRETAIL WEALTH & INT’L2010
Loans and advancesto customers (gross) £188bn £626bn£369bn £66bn
Impaired loans £35bn £65bn£10bn £20bn
Impaired loans as %of closing advances 18 4% 10 3%2 6% 30 7%of closing advances 18.4% 10.3%2.6% 30.7%
Impairment provisions £16bn £30bn£3bn £11bn
Impairment provisions as %of impaired loans 45.9% 45.9%31.8% 52.5%
69

IRISH PORTFOLIOStatic loan book with increased provisioning across the business
31 Dec 2009 31 Dec 2010
PORTFOLIO BREAKDOWN£bn
0.6 0 3
8.37.7
0 90.6
3 0
0.3
1.19.1 8.1
0.9
4.3
0.6
2 43.0 1.1
11.7 11.7
4.3
9 2
2.4
Impairedloan
b l
Impairmentprovision
6.1
Loanbook
2.2Loanbook
Impairedloan
b l
9.2
Impairmentprovision
4.8
70
balance
Commercial Real Estate RetailCorporate & Other
balance

ASSET & LIABILITY MARGINSAsset repricing gains but deposit spread pressure
Average Interest Earning Assets: Average Interest Bearing Liabilities:
ASSET MARGIN LIABILITY MARGIN
45bp
£674bn
Average Interest Earning Assets:
£637bn £353bn
1.56%
Average Interest Bearing Liabilities:
£347bn
3bp
0.97%(28)bp (3)bp
1.11%(3)bp 1.28%
( ) p
2010Depositspread
2009 Assetpricing
Assetmix
2009 Other2010Other
71
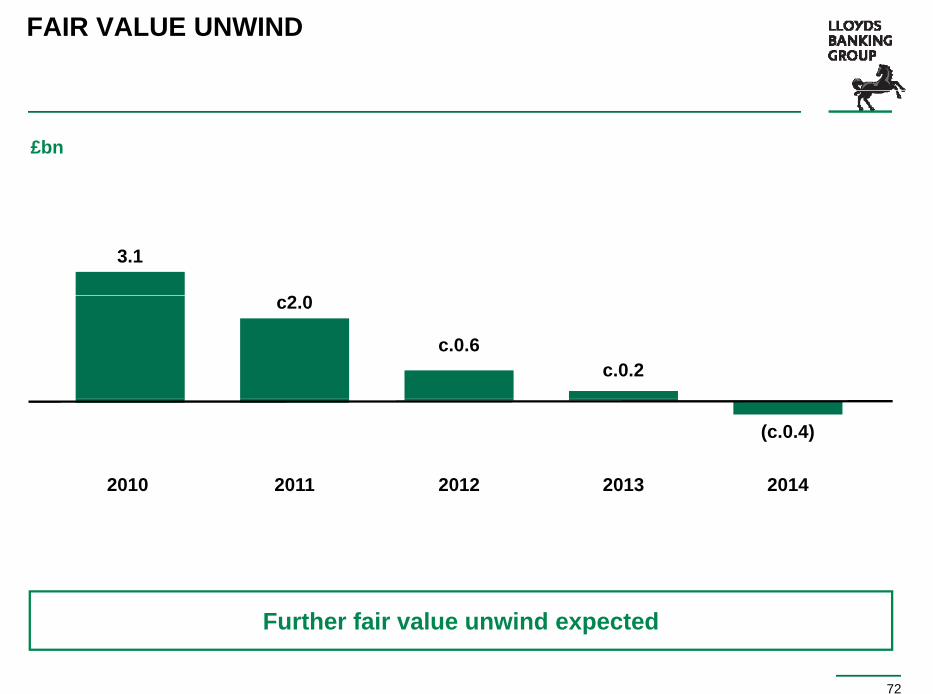
FAIR VALUE UNWIND
£bn
3.1
2 0c2.0
c.0.6c.0.2
2010 2011 2012 2013 2014
(c.0.4)
72
Further fair value unwind expected

NET TANGIBLE ASSETS
NET TANGIBLE ASSETS (£bn) NET TANGIBLE ASSETS PER SHARE (p)
2.2 0.4 0.6 40.3
58.1
(0.3)
0.4 1.0 59.2
37.12.2
31 Dec2009
Exchangeoffers
2010Earningsi t
Other 31 Dec2010
31 Dec2009
Exchangeoffers
2010 Earningsi t
Other 31 Dec2010
73
impact impact

BUSINESS PERFORMANCEBalance Sheet
2009 % IMPROVED2010
Balance sheet strength:Balance sheet strength:
Funded assets £655bn£715bn
Liquid assets £98bn£88bn 11%
8%
Core Tier 1 ratio 10.2%8.1%
Strong capital and funding position:
Loan/deposit ratio 154%169%
Central bank & government funding £97bn£157bn 38%
Wholesale funding requirement £298bn£326bn 9%
Wholesale funding >1 year 50%50%
74
Further strengthening of capital and funding position
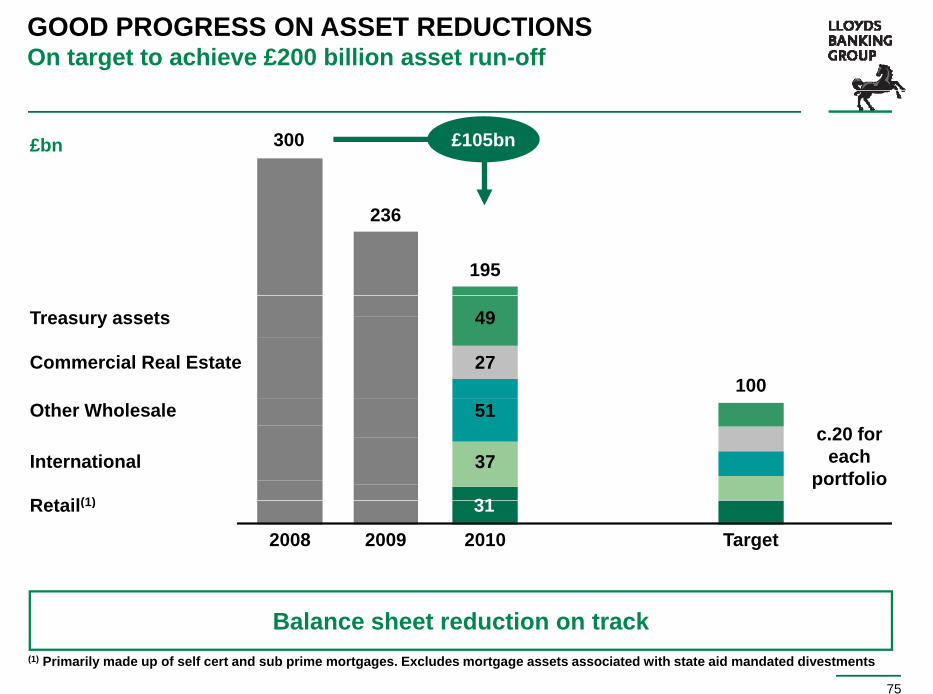
GOOD PROGRESS ON ASSET REDUCTIONSOn target to achieve £200 billion asset run-off
300£bn £105bn
236
195
100
Treasury assets
Commercial Real Estate
49
27
Other Wholesale
International
R t il(1)
c.20 foreach
portfolio
51
37
31
2008 2009 Target
Retail(1)
2010
31
75
Balance sheet reduction on track(1) Primarily made up of self cert and sub prime mortgages. Excludes mortgage assets associated with state aid mandated divestments

REDUCING OUR WHOLESALE FUNDING REQUIREMENTSMaintaining broad spread of wholesale funding
DEC 2009£bn DEC 2010
49Bank deposits
51Certificates of deposit
90Medium-term notes
26
42
88
Clear benefit delivered by managing balance sheet down
28Covered bonds
35Commercial paper
36Securitisation
32
33
39
Good relationship customer deposit growth of £12 billion
Primary liquid asset holding of £98 billion
37Subordinated debt
Wholesale (excl. customer deposits) 326
38
298
£98 billion
371Customer deposits(1)
697Total Group funding
383
681
Increasing strength of funding position has facilitated an accelerated pay
76
Increasing strength of funding position has facilitated an accelerated pay down of central bank funding
(1) Excluding repos

SUCCESSFUL TERM ISSUANCE - £50bn ACHIEVED Utilising a wide variety of funding products and sources
c.£30 billion of public
TERM ISSUANCE 2010 PUBLIC TERM ISSUANCE BY CURRENCY
2010 PUBLIC TERM ISSUANCE BY PRODUCT
c.£30 billion of public term issuance completed in 2010
Additi l £20 billi
GBP18%
Other10%
USD39%
Tier14%
MTN33%
Lower Tier 211%
Additional c.£20 billion of term funding via private placements completed
Expected public term issuance of c.£20-25 billion per annum over next 2
EURO33%
Securitisations 39%
CoveredBonds
13%annum over next 2 years
33%
77
Diverse range of funding products and sources

WHOLESALE FUNDING COSTS Funding spreads have continued to increase through 2010
LLOYDS 5 YEAR CDS (bps)250
The cost of wholesale funding has continued to increase through 2010 – higher average H2/10 issuance costs than H1/10
150
200
Weighted average cost of wholesale funding rising as older, cheaper debt matures
Throughout the sovereign debt crisis we bl t i d bt b t t i ifi tlSECONDARY TRADING LEVELS
201050
100
were able to issue debt but at a significantly greater cost
Over time, spreads expected to normalise
SECONDARY TRADING LEVELS(bps)(1)
150
190
125
205
78
(1) Z spreadBased on trading for: Lloyds €6.375% 6/17 - Lloyds €3,75% 7/15
Unsecured09 10
5yr Senior CDS09 10
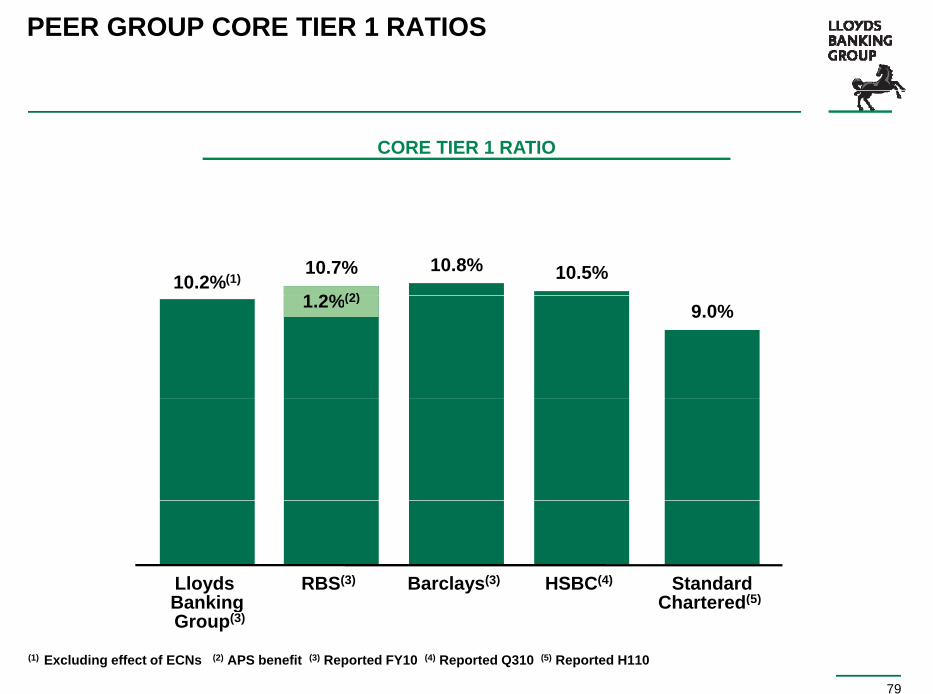
PEER GROUP CORE TIER 1 RATIOS
CORE TIER 1 RATIO
10.2%(1)
1 2%(2)
10.7% 10.8% 10.5%1.2%(2)
9.0%
Lloyds Banking
RBS(3) Barclays(3) HSBC(4) StandardChartered(5)
79
(1) Excluding effect of ECNs (2) APS benefit (3) Reported FY10 (4) Reported Q310 (5) Reported H110
BankingGroup(3)
Chartered( )

IMPACT OF BASEL 3Preparation notes
Please find below preparation notes regarding slide 25
The 2013 Core Tier 1 ratio presented is illustrative.
Consensus estimates for retained earnings are from 23 analysts as at 8 Feb 2011 Not all these analystsConsensus estimates for retained earnings are from 23 analysts as at 8 Feb 2011. Not all these analysts provided estimates for the full 3 year period. Lloyds Banking Group neither endorses nor verifies the estimates used.
The significant items included in “Increase in RWA’s from Basel 2.5/3”, without any mitigation, are:
increased RWA for certain securitisation and resecuritisation exposures and Market Risk (Basel 2.5)
increased RWA associated with counterparty credit risk, exposures to Financial institutions and securitisation exposures, net of the impact of adding back securitisation deductions to Core Tier 1 capital (Basel 3)
risk weighting the element of the investment in insurance under the 10% of Core Tier 1 limit at 250% (Basel 3)(Basel 3)
To illustrate the potential impacts on RWA of the planned disposal of non-core assets, a reduction of £60bn has been included. The Group plans to reduce non-core assets from £195bn to £100bn over the next 3 years. Based upon the average risk weighting of non-core assets held on the balance sheet as at 31 December 2010 of 72%, this equates to a £69bn reduction in RWAs.
The following are not included in presented 2013 Core Tier 1 ratio:
Basel 3 deductions from Core Tier 1 capital for Material Holdings (i.e. insurance holding), Expected Losses in excess of impairments, Minority Interests and Deferred Tax Assets. Any such deductions would transition in, at 20% per annum, from 1 January 2014 to 1 January 2018. The additional impact in 2014 of the deduction in relation to Insurance holdings is estimated at 0.3%, based on current net asset value and therefore takes no
80
gaccount of any further action taken to mitigate this impact.
The impacts of possible changes to accounting in relation to pensions, insurance and expected loss provisioning which, in combination with Basel 3 regulations, may impact the Core Tier 1 ratio.

FORWARD LOOKING STATEMENTS
This announcement contains forward looking statements with respect to the business, strategy and plans of theLloyds Banking Group, its current goals and expectations relating to its future financial condition and performance.Statements that are not historical facts including statements about the Group or the Group’s management’s beliefs andStatements that are not historical facts, including statements about the Group or the Group s management s beliefs andexpectations, are forward looking statements. By their nature, forward looking statements involve risk and uncertaintybecause they relate to events and depend on circumstances that will occur in the future. The Group’s actual futurebusiness, strategy, plans and/or results may differ materially from those expressed or implied in these forward lookingstatements as a result of a variety of risks, uncertainties and other factors, including, without limitation, UK domestic andy , , g, ,global economic and business conditions; the ability to derive cost savings and other benefits, as well as the ability tointegrate successfully the acquisition of HBOS; the ability to access sufficient funding to meet the Group’s liquidity needs;changes to the Group’s credit ratings; risks concerning borrower or counterparty credit quality; market related trends anddevelopments; changing demographic trends; changes in customer preferences; changes to regulation, accountingstandards or taxation, including changes to regulatory capital or liquidity requirements; the policies and actions ofGovernmental or regulatory authorities in the UK, the European Union, or jurisdictions outside the UK, including otherEuropean countries and the US; the ability to attract and retain senior management and other employees; requirementsor limitations imposed on the Group as a result of HM Treasury’s investment in the Group; the ability to complete
ti f t il th di l f t i t t f th G ’ EU St t Aid bli ti th t t f f tsatisfactorily the disposal of certain assets as part of the Group’s EU State Aid obligations; the extent of any futureimpairment charges or write-downs caused by depressed asset valuations; exposure to regulatory scrutiny, legalproceedings or complaints, actions of competitors and other factors. Please refer to the latest Annual Report on form 20-Ffiled with the US Securities and Exchange Commission for a discussion of such factors together with examples of forwardlooking statements The forward looking statements contained in this announcement are made as at the date of this
81
looking statements. The forward looking statements contained in this announcement are made as at the date of thisannouncement, and the Group undertakes no obligation to update any of its forward looking statements.