20 March 2007 VOMS etc - - Andrew McNab VOMS etc Andrew McNab University of Manchester.

1
California GAMA Program: Tracking Water Quality Changes during Groundwater Banking at Two Sites in San Joaquin County
Jean E. Moran, Michael J. Singleton, Walt M. McNab, Roald Leif, and Bradley K. Esser
Prepared in cooperation with the State of California State Water Resources Control Board
June 2009 (Draft)
November 2009 (Final)
LLNL-TR-412861

Disclaimer This document was prepared as an account of work sponsored by an agency of the United States government. Neither the United States government nor Lawrence Livermore National Security, LLC, nor any of their employees makes any warranty, expressed or implied, or assumes any legal liability or responsibility for the accuracy, completeness, or usefulness of any information, apparatus, product, or process disclosed, or represents that its use would not infringe privately owned rights. Reference herein to any specific commercial product, process, or service by trade name, trademark, manufacturer, or otherwise does not necessarily constitute or imply its endorsement, recommendation, or favoring by the United States government or Lawrence Livermore National Security, LLC. The views and opinions of authors expressed herein do not necessarily state or reflect those of the United States government or Lawrence Livermore National Security, LLC, and shall not be used for advertising or product endorsement purposes.
Auspices Statement This work performed under the auspices of the U.S. Department of Energy by Lawrence Livermore National Laboratory under Contract DE-AC52-07NA27344.

LLNL-TR-412861
This work performed under the auspices of the U.S. Department of Energy by Lawrence
Livermore National Laboratory under Contract DE-AC52-07NA27344.
GAMA: AMBIENT GROUNDWATER
MONITORING & ASSESSMENT PROGRAM
SPECIAL STUDY
California GAMA Program: Tracking Water Quality Changes During Groundwater Banking at Two Sites in San Joaquin
County
Jean E. Moran, Michael J. Singleton, Walt W. McNab, Roald Leif, and
Bradley K. Esser
Lawrence Livermore National Laboratory
Prepared in cooperation with the California State Water Board
June 2009 (Revised November 2009)

GAMA: Water Quality Changes during Groundwater Banking page 2
Table of Contents
Executive Summary ......................................................................... 5
Introduction ...................................................................................... 7
Methods ............................................................................................. 9
Methods: SF6 by Gas Chromatography ................................................................................... 10
Methods: Geochemical Modeling ............................................................................................ 11
Study Site I: Stockton-East Water District (SEWD) ..................... 12
SEWD: Tracer Test .................................................................................................................. 13
SEWD: Tracer Test Results ..................................................................................................... 14
SEWD: Water Transport and Water Quality Indicators ........................................................ 16
SEWD: Geochemical Modeling ............................................................................................... 22
SEWD: Discussion of Geochemical Modeling Results ........................................................... 24
Study Site II: Morada Lane Detention Pond, Stockton, CA ........ 32
Morada Lane: SF6 Tracer Test ............................................................................................... 32
Morada Lane: Isotopic Compositions and Groundwater Age ................................................ 37
Morada Lane: Water Quality Measurements.......................................................................... 40
Morada Lane: Noble Gas-Derived Recharge Conditions ....................................................... 47
Morada Lane: Geochemical Modeling .................................................................................... 48
Summary: Comparing Results from SEWD and Morada Lane ... 51
Acknowledgements ........................................................................ 53
References ...................................................................................... 54
Appendix: Data Tables Table A-1: SEWD Water Quality Data ............................................................................. A2
Table A-2: SEWD Tracer Data ......................................................................................... A4
Table A-3: SEWD Noble Gas & Tritium Data.................................................................. A9
Table A-4: SEWD Organic Data .................................................................................... A10
Table A-5: Morada Water Quality Data ......................................................................... A11
Table A-6: Morada Tracer Data ..................................................................................... A12
Table A-7: Morada Noble Gas & Tritium Data ............................................................. A16
Table A-8: Morada Organic Data .................................................................................. A17

GAMA: Water Quality Changes during Groundwater Banking page 3
List of Figures
Figure 1. Location of Stockton East Water District (SEWD) and Morada Lane
study sites.................................................................................................................. 8
Figure 2. Representative GC chromatograms showing signal response near or below the reporting limit. ....................................................................................... 11
Figure 3. Locations of wells, surface water samples, and tracer water introduction point at SEWD. ....................................................................................................... 13
Figure 4. SF6 tracer concentrations in surface water and groundwater samples collected at SEWD. Concentrations are given as ppb SF6 in a fixed headspace. A dashed line shows the MDL for this method. Collection date for a full suite of water quality samples is shown as an arrow. ....................... 15
Figure 5. SF6 concentrations normalized to the peak concentrations measured in the recharge pond. ................................................................................................. 15
Figure 6. West to East cross section of apparent mean 3H-3He ages and percentage of pre-modern (<1955) water in groundwater wells at SEWD. Cross-section and well logs from [Montgomery Watson Harza, 2006]. ........ 16
Figure 7. North to South cross section of apparent mean 3H-3He ages and percentage of pre-modern (<1955) water in groundwater wells at SEWD. Cross-section and well logs from [Montgomery Watson Harza, 2006]. ........ 17
Figure 8. Calculations (curves) of pre-modern (<1955) water present in groundwater below SEWD. Sample results are shown as dots. .................... 18
Figure 9. Oxygen and hydrogen stable isotope compositions in waters collected at SEWD. ................................................................................................................. 19
Figure 10. Oxygen stable isotope compositions for samples collected between Jan 26 and May 30, 2007. .................................................................................... 20
Figure 11. Arsenic concentrations in surface water and groundwater samples collected at SEWD. ................................................................................................ 22
Figure 12. Observed and simulated relationships between various geochemical indicators (cation ratios – left; arsenic versus TDS – upper right; vanadium
versus 18O – lower right) measured during the August 2006 sampling round. ....................................................................................................................... 25
Figure 13. Temperature and conductivity of water samples collected at SEWD. 27
Figure 14. pH and oxidation reduction potential (ORP) of water samples collected at SEWD. ................................................................................................................. 28
Figure 15. Dissolved inorganic (DIC) and organic carbon (DOC) of water samples collected at SEWD. ................................................................................................ 29
Figure 16. Dissolved oxygen (DO) and nitrate concentration of water samples collected at SEWD. ................................................................................................ 30
Figure 17. Chloride and sulfate concentrations of water samples collected at SEWD. ..................................................................................................................... 31
Figure 18. Morada Lane detention basin two (DB2) site showing the location of tracer introduction and the locations where surface water and groundwater samples were taken. .............................................................................................. 33
Figure 19. USGS water level measurements at Morada Lane monitoring wells. Water levels are in feet below land surface. ...................................................... 34

GAMA: Water Quality Changes during Groundwater Banking page 4
Figure 20. Precipitation record (inches) at the Stockton Fire Station from August 2006 to June 2007 (California Department of Water Resources). ................. 34
Figure 21. Results of SF6 tracer analysis from Morada Lane surface waters. ..... 35
Figure 22. Results of SF6 tracer analysis from Morada Lane surface water and groundwater. ........................................................................................................... 35
Figure 23. Oxygen and hydrogen stable isotope compositions for surface water and groundwater samples collected from the Morada Lane study site. ........ 38
Figure 24. Results of oxygen isotope analysis from Morada Lane surface water and groundwater. ................................................................................................... 38
Figure 25. Apparent 3H-3He ages, 3H activity in pCi/L, and recharge temperature (RT) for monitoring wells and public supply wells near the Morada Lane detention basin. The screen depth for each well is shown as a white box. .. 39
Figure 26. Water quality parameters measured in the field at the Morada Lane site. ........................................................................................................................... 41
Figure 27. Anion concentrations from samples collected at the Morada Lane site.................................................................................................................................... 42
Figure 28. Trace Element concentrations from samples collected at the Morada Lane site. ................................................................................................................. 43
Figure 29. Dissolved carbon concentration and isotopic composition from samples collected at the Morada Lane site. ...................................................... 44
Figure 30. Oxidative reduction potential and redox-sensitive dissolved gases from samples collected at the Morada Lane site. ............................................. 45
Figure 31. Parameters derived from noble gas compositions of groundwater near the Morada Lane site. ............................................................................................ 46
Figure 32. MW1(114’) water composition compared to modeled changes in component concentrations; 50-50 mixture of pond water and MW1(220’) under various assumptions. .................................................................................. 49
Figure 33. MW1(114’) water composition compared to modeled changes in component concentrations; 90-10 mixture of pond water and MW1(220’) under various assumptions. .................................................................................. 49
List of Tables
Table 1. Geochemical and isotopic constituents measured in this study. .............. 8
Table 2. Tracer arrival times in days since the start of the tracer experiment on 10/3/2006. Peak tracer concentrations (Co) are based on the maximum observed value in the pond. ................................................................................. 36

GAMA: Water Quality Changes during Groundwater Banking page 5
Executive Summary
Under the Special Studies portion of the State Water Resources Control Board‘s
Groundwater Ambient Monitoring and Assessment (GAMA) program, water quality
topics of statewide relevance are addressed through focused research studies carried out
in collaboration with Lawrence Livermore National Laboratory. The study described here
addresses changes in water quality associated with groundwater banking. Geochemical
processes associated with groundwater banking, which may entail imported recharge
water with very low total dissolved solids (TDS), have received less attention than
artificial recharge using treated wastewater or locally-captured water. Improvements to
water quality during infiltration have been previously documented and may include
removal or degradation of organic compounds and denitrification. However, introduction
of water that is substantially out of equilibrium with ambient groundwater can result in
mineral precipitation/dissolution reactions, redox reactions, and trace element
mobilization that can exert detrimental effects on water quality as well as on local aquifer
permeability.
In order to quantify changes in water quality that are a direct result of managed recharge,
we introduced an inert dissolved gas tracer at two groundwater banking sites in San
Joaquin County near Stockton, an area severely affected by historical and continuing
overdraft. Detection of the tracer in nearby wells allows precise determination of the
groundwater transit time as well as a measure of the relative proportions of ambient
groundwater and recent recharge. Both tracer tests were successful in that the tagged
surface water was observed at various wells in the vicinity of the recharge ponds. Many
parameters that can be used to assess water source and transport such as groundwater age
and stable isotopes of the water molecule, as well as the fate of metals, organics and
nitrate were examined along with the introduced gas tracer. This allowed us to constrain
the important geochemical and biogeochemical reactions taking place during infiltration
and subsequent transport in aquifers.
One study site, operated by Stockton East Water District (SEWD), consists of ponds
adjacent to agricultural fields and a surface water treatment plant. Approximately 7000
acre-ft of imported water from New Melones and New Hogan reservoirs are recharged
annually. Wells immediately adjacent to the pond had tracer detections 6 to 11 days after
the peak tracer detection in the pond, while nested monitoring wells downgradient had
detections after 17 days. Production wells are screened below semi-confining units, have
groundwater ages indicating that produced water recharged at least several decades ago,
and had no tracer detections. A few monitoring wells with short-duration tracer
detections were affected by the mound developed after the pond was loaded; subsequent
transport was in the direction of the regional groundwater gradient.
Overall groundwater quality in the area is very good, with a maximum nitrate
concentration of 17 mg/L (as NO3-), total organic carbon < 1 mg/L, and a low frequency
of detection of low level volatile organic compounds. Mixing between low TDS recharge
water and ambient groundwater, along with typical water-rock reactions such as

GAMA: Water Quality Changes during Groundwater Banking page 6
carbonate dissolution and cation exchange on clay surfaces control major ion chemistry
and result in positive correlations between chloride and sodium, calcium, and bicarbonate
ion. The trace elements arsenic, vanadium, and molybdenum, on the other hand, show a
sharp increase in concentration in wells strongly affected by recent recharge of imported
water. Geochemical modeling shows that surface reactions on hydrous ferric oxides,
whereby oxyanions exchange with OH- at near neutral pH, can result in the observed
increases in oxyanion-forming trace elements. Arsenic concentrations that hover around
the MCL of 10 g/L are the most significant water quality issue at the SEWD site.
The other study site, operated by the City of Stockton, consists of a storm water detention
basin (Morada Lane DB2) which receives imported Mokelumne River water in dry
months and storm water runoff during the rainy season. Tracer movement was more
complex at this site where groundwater infiltration seems to be controlled by relatively
slow vertical movement until it reaches high conductivity lenses that are in hydraulic
connection with production wells, whereupon lateral movement occurs at flow rates of up
to 30 ft/d (9.7 m/d). Tracer arrived at a nearby drinking water well 119 days after the
peak tracer detection in the detention basin, and after 169 days in another production well
situated nearly one mile to the west of the pond.
Overall, the quality of the groundwater near the pond is very good – this area is not
affected by the saline water intrusion that is a regional problem. Given the different
recharge water sources loaded into the pond over the course of the study, it is not
surprising that several water quality parameters such as TDS and total organic carbon,
vary widely in surface water. The same parameters show a damped, varying pattern in the
shallowest monitoring well, and less variation in deeper wells. A stable isotope signature
that marks the presence of imported water is observed in monitoring wells up to 300 ft
deep, and shows mixing between ambient groundwater and water recharged from the
pond.
Redox indicators such as dissolved oxygen as well as redox-sensitive constituents show
large variations in dissolved concentrations with depth due to changes in speciation. In
particular, nitrate is affected by denitrification in reducing zones, which is mirrored by
changes in sulfate concentration due to sulfate reduction. Trace elements such as
uranium, vanadium, and arsenic are mobilized and show higher dissolved concentrations
in the same zones where redox indicators mark reducing conditions. The redox process
proceeds all the way to methane generation, which is present in the shallowest well
(where organic carbon from surface water provides an electron donor) and in the deepest
portion of the aquifer system (where reduction is presumably driven by solid phases).
Potential water quality problems are mobilization of arsenic in shallow groundwater and
fast transport to the nearby drinking water well, which has implications for groundwater
management when considering potential transport of microbes and viruses.

GAMA: Water Quality Changes during Groundwater Banking page 7
Introduction
Subsurface storage of excess winter/spring flows or imported water in overdrafted
groundwater basins plays a major role in the management of a strained water supply in
California. Groundwater banking, or managed underground storage, wherein water from
any source is stored in aquifers for later recovery, involves artificial recharge followed by
extraction at production wells. Artificial recharge facilities typically consist of spreading
ponds, temporary dams on streams, or injection wells, where almost a billion cubic
meters of water is intentionally recharged per year statewide.
Artificial recharge entails the introduction of a water composition that is often out of
thermodynamic equilibrium with ambient groundwater and local aquifer mineral
assemblages. Improvements to water quality (e.g., remineralization of organic material,
sorption or biodegradation of organic compounds, denitrification) are often observed
during recharge, dramatically so in situations involving agricultural return water and
treated wastewater recharge (Clark et al.2004, Davisson et al.2004, Moran and Halliwell,
2003). However, geochemical processes associated with groundwater banking, which
may entail recharge water with very low total dissolved solids (TDS), have received less
attention. Introduction of water that is substantially out of equilibrium with ambient
groundwater can potentially result in mineral precipitation/dissolution reactions, redox
reactions, and trace element mobilization that can exert detrimental effects on water
quality as well as local aquifer permeability.
In order to constrain the mixing of applied recharge in produced groundwater, we
introduced an inert SF6 gas tracer in applied recharge water at two sites in the San
Joaquin Valley, CA and tracked its movement in nearby wells over the following several
months. Tracer studies have been previously employed as a means of understanding
transport near artificial recharge facilities (Gamlin et al., 2001, Clark et al., 2004, Quast
et al., 2006). A number of chemical and isotopic tracers were examined simultaneously to
track flow and recharge in these aquifers, and to determine the influence of applied
recharge on groundwater quality (Table 1).
The two sites; former agricultural fields adjacent to the Stockton East Water District
water treatment plant (called ‗SEWD site‘) and a stormwater detention basin (called
‗Morada Lane site‘) operated by the City of Stockton, are shown on the map in Figure 1.
Analytical methods employed at both sites are discussed first, followed by separate
discussions of tracer and water quality results from SEWD and Morada Lane; in
conclusion results from the two sites are compared. The Morada Lane study was carried
out in collaboration with the U.S. Geological Survey (USGS) and the California
Department of Water Resources (DWR). The Stockton East Water District, City of
Stockton, and San Joaquin County Groundwater Banking Authority all provided valuable
information about recharge operations at the sites and assisted with logistics and
sampling.

GAMA: Water Quality Changes during Groundwater Banking page 8
Table 1. Geochemical and isotopic constituents measured in this study.
Constituent Process or parameter
examined
Major ions & trace elements such as Cl-, NO3-, SO4
2-,
Na, Ca, Fe, Mn, U, and As, low-level VOCs, low-level
semi-volatile compounds
Water quality, geochemical
reactions
Stable isotopes of the water molecule O and D Water source identification*
Isotopes of nitrate
N and
O; major dissolved gases Nitrate source identification &
fate of nitrate
DIC and DOC; Carbon isotopes 13C Sources of C, biogeochemical
reactions, redox conditions
Tritium and dissolved noble gases Water transport, groundwater
age, recharge conditions
Field water quality parameters pH, TDS, DO, ORP Redox conditions, changes in
water quality *
SF6 Water transport tracer*
*Time series analyzed for well water and surface water (up to 15 sampling events)
Figure 1. Location of Stockton East Water District (SEWD) and Morada Lane study sites to the east of Stockton, California.

GAMA: Water Quality Changes during Groundwater Banking page 9
Methods
Surface water and groundwater samples for multiple geochemical and isotopic analyses
were collected and analyzed as part of a baseline survey and subsequently during the
tracer experiments. Samples were analyzed for major cations (Ca2+
, Mg2+
, Na+, K
+) and
anions (SO42-
, Cl-, NO3
-) by ion chromatography using a Dionex DX-600 ®. Selected
trace element concentrations (e.g., As, B, Ba, Co, Cu, Mo, Ni, Sr, V, U, Zn) were
measured by inductively coupled plasma mass spectrometry (ICP-MS; ThermoElectron
Series X). Dissolved oxygen, pH, and oxidation-reduction potential were measured in the
field using a Horiba U-22® water quality parameter field meter. The oxygen isotopic
composition of water in groundwater and surface water samples was determined using a
VG Prism II ® or GV Instruments IsoPrime isotope ratio mass spectrometer and are
reported in permil (‰) values relative to the Vienna Standard Mean Ocean Water
(SMOW). Dissolved inorganic carbon and its carbon isotope composition were
determined using the automated DIC-DOC-IRMS technique (St-Jean, 2003) consisting of
an OI Analytical Model 1030 Carbon analyzer and a GV Instruments IsoPrime mass
spectrometer. Dissolved organic carbon (DOC) was analyzed via wet oxidation by
persulfate. Selected dissolved gases (O2, N2, CO2, CH4, and Ar) were measured by
membrane inlet mass spectrometry (Kana et al., 1994).
Groundwater age dating by the 3He/
3H method the has been applied as an aid in
quantifying flow and transport on the aquifer scale in a number of studies (e.g., Poreda et
al., 1988, Solomon et al., 1992, Ekwurzel et al., 1994). Under this technique,
groundwater samples are assigned an apparent age, t, based upon measured abundances
of tritium and its daughter product, tritiogenic helium (3Hetrit):
t, years = -17.8 x ln (1 +
3Hetrit/
3H) (Equation 1)
As part of the age calculation, the measured concentration of 3He must be corrected for
components not related to 3H decay (Ekwurzel et al., 1994, Aeschbach-Hertig et al.,
1999). The resulting inferred groundwater age represents the mean age of the sample
subjected to mixing along the flow path from points of recharge to the well screen
(Weissmann et al., 2002). The calculated age represents only the age of the portion of the
water sample that contains measurable tritium; samples with a 3H abundance that is too
low for accurate age determination (less than 1 pCi/L) are regarded as ―pre-modern‖, or
greater than 50 years in age.
For 3H/
3He age dating, sample handling and processing included collection of
groundwater samples containing dissolved noble gases in copper tubes filled to prevent
exposure to the atmosphere and sealed with a cold weld in the field. Dissolved noble gas
concentrations were measured after gas extraction on a vacuum manifold and cryogenic
separation of the noble gases using a quadrupole mass spectrometer. The ratio of 3He to
4He was measured on a VG5400 mass spectrometer. Tritium was determined

GAMA: Water Quality Changes during Groundwater Banking page 10
independently by measuring 3He accumulation after vacuum degassing 0.5-L
groundwater samples following a three- to four-week accumulation time. The resulting
typical analytical error for groundwater age determination is ±1 year.
Methods: SF6 by Gas Chromatography
As part of this study, a highly sensitive technique for measuring dissolved SF6
concentrations in water was implemented. Analyses of water samples for dissolved sulfur
hexafluoride were performed by extracting a known amount of sample, typically 40-43
grams, with 10 mL SF6-free air in a gas-tight syringe and analyzing the headspace by gas
chromatography (GC). Analyses were performed using a Hewlett-Packard 5890 Series II
gas chromatograph equipped with a model G1223A electron capture detector (ECD). A
Valco two position 10-port valve was installed in the GC and modified for a tandem 2
column configuration, with backflushing of the first column to vent. A 1.0 mL sample
loop was used for sample introduction. The analyses were performed with the oven
temperature set isothermal at 50C and ECD temperature set at 300C, with P5 (5%
methane/95% argon) as carrier gas (no make-up gas flow to detector) using a 12 in. x 1/8
in. stainless steel molecular sieve 5A packed column (80/100 mesh, Alltech Associates)
for the critical gas chromatographic separation that occurs in the first column. Total run
time was 26 sec.
The GC was calibrated using 49 sulfur hexafluoride standards ranging in concentration
from 9.3 part per trillion (ppt) to 980 part per billion (ppb). Five separate contiguous
calibration curves were constructed to quantify samples throughout the entire range. The
GC has a calculated detection limit of 0.6 ppt. Extrapolation of the low level calibration
curve with intercept forced through the origin was used to quantify samples below 9.3 ppt
but the reporting limit was set at 10 ppt SF6 in the extracted headspace. A set of seven
calibration check standards was used to monitor system stability and selected samples
were run in replicate.
Four representative chromatograms are shown in Figure 2. The GC run time was 26 sec
(0.43 min.) but except for the Zero Air run, the chromatograms are offset on the x-axis
for clarity. Zero Air is an ultrapure synthetic air standard free of SF6 and was used to
extract the SF6 from the water samples for headspace analysis. The Blank Water
chromatogram is the result of extracting an SF6–free water sample with Zero Air. The
small response for SF6 in this chromatogram was due to minor contamination with room
air during sample injection. The next chromatogram shows the response for the 9.3 ppt
SF6 calibration standard, the lowest level calibration standard used. The final
chromatogram is a dilution of a surface water sample from the SEWD site, prepared by
diluting 100 µL of this sample to 42.65 mL. The dynamic range for this analytical
method indicates that one part surface water could be detected in approximately 40,000
parts well water at the SEWD site and one part surface water in 10,000 parts well water at
the Morada Lane site, for the concentrations observed in the surface water at each site.

GAMA: Water Quality Changes during Groundwater Banking page 11
Figure 2. Representative GC chromatograms showing signal response near or below the reporting limit.
Methods: Geochemical Modeling
Changes in water quality parameters as a result of mixing of imported recharge water and
groundwater were interpreted with the aid of the PHREEQC geochemical model
(Parkhurst and Appelo, 2002). For this study, PHREEQC and its accompanying
complexation constant data sets were used to postulate a geochemical model of recharge
water-aquifer interactions in the presence of both an ion exchanger and a hydrous ferric
oxide phase with a population of active complexation sites, each specified to be in
equilibrium with an end-member groundwater composition as an initial condition. The
MIX feature of PHREEQC was used to predict the equilibrium concentrations of major
ions, trace elements, and pH in response to the incremental displacement of end-member
groundwater by recharge water while the mixture was maintained in equilibrium with
aquifer mineral surfaces.
0
10
20
30
40
50
60
70
80
0.0 0.2 0.4 0.6 0.8 1.0 1.2 1.4 1.6 1.8 2.0
Retention Time (minutes)
Dete
cto
r R
esp
on
se
Zero Air
(No Sulfur Hexafluoride)
9.3 ppt Sulfur Hexafluoride Std.
104576D
(1:426 Dilution of Sample 104576)
Blank Water
(Extraction Check)

GAMA: Water Quality Changes during Groundwater Banking page 12
Study Site I: Stockton-East Water District (SEWD)
The study area is within the Eastern San Joaquin Ground Water Subbasin (California
Department of Water Resources, 2006). The subbasin is several hundred meters (m) of
consolidated, partly-consolidated and unconsolidated sedimentary deposits (California
Department of Water Resources, 1967). The SEWD site is underlain to a depth of
approximately 60 meters by the Pliocene-Pleistocene-age Modesto Formation which is
comprised of fluvial arkosic sedimentary materials (Marchand and Allwardt, 1981). Prior
to the onset of groundwater pumping, groundwater movement in the alluvial fan deposits
was from recharge areas along the foothills of the Sierra Nevada to discharge areas near
the San Joaquin Delta. Recharge also occurred as infiltration of surface water along the
upstream reaches of rivers and streams crossing the alluvial fan deposits, while
groundwater discharge occurred along the lower reaches of these streams (California
Department of Water Resources, 1967).
The City of Stockton (population 300,000), about 130 km east of San Francisco (Figure 1), relies on groundwater for over 30% of its public supply (City of Stockton, 2007). In
the 1950‘s, water levels in parts of the subbasin declined to below sea level and chloride
concentrations in a number of wells increased (California Department of Water
Resources, 1967). Under present-day conditions, ground-water recharge within the
subbasin is about 1.11 x 10⁹ m
3 (900,000 acre-feet per year [acre-ft/yr]), pumping
exceeds recharge by 1.85 x 10⁹ m
3 (150,000 acre-ft/yr) (CDM, Inc. 2001), and water
levels in parts of the subbasin are declining at rates as high as 0.61 m per year
(Northeastern San Joaquin County Groundwater Banking authority, 2004).
The Stockton East Water District (SEWD) Water Treatment Plant provides a majority of
the drinking water supply to the City of Stockton. The facility receives water from the
New Melones and New Hogan Reservoirs in the foothills of the Sierra Nevada some 50
kilometers to the east. Beginning in 2003, the SEWD has been periodically discharging
surplus water from these sources into surface impoundment ponds to facilitate
groundwater recharge under the Farmington Recharge Program, a joint groundwater
storage effort by SEWD, other local water purveyors, and the U.S. Army Corps of
Engineers. Each year some 7,000 acre·ft/yr of water is infiltrated into the subsurface;
ascertaining the fate of the recharged water is still a major goal. The objectives of the
recharge program include drought protection, addressing overdraft, and mitigating
saltwater intrusion.
Existing groundwater wells in the vicinity of the recharge ponds include monitoring
wells as well as local agricultural supply wells (Figure 3). Well construction details
indicate that most of these wells are screened across portions of the Modesto
Formation. Exceptions include water supply wells 74-01 and 74-02 which are
screened entirely in pre-Modesto sedimentary materials at depths below 60 meters.
Past pumping tests have indicated that these two wells are hydraulically isolated to
some extent from wells screened at shallower depths (MWH, 2006).

GAMA: Water Quality Changes during Groundwater Banking page 13
Figure 3. Locations of wells, surface water samples, and tracer water introduction point at SEWD. CWS-35 is off the map to the left.
In August, 2006, 20 samples from the Stockton East Water District groundwater banking
facilities were collected in advance of tracer introduction. This sampling campaign had
the following goals: 1) to determine background water quality prior to tracer introduction
2) to examine possibilities for the presence of intrinsic tracers such as stable isotope
signature or chemical parameters that delineate the imported water component in
groundwater 3) to determine which wells to target for tracer sampling, as indicated by
groundwater age and intrinsic tracers. Samples were collected for the constituents listed
in Table 1 and described in the Methods section; results are described below.
SEWD: Tracer Test
Tracer introduction at the Stockton East Water District (SEWD) groundwater banking
site took place from Jan. 17th
to Feb.1st 2007, via bubbling SF6 gas into a 12‖ inlet pipe
that delivers water to the main infiltration pond. LLNL coordinated tracer introduction to
coincide roughly with a change in the imported water source from New Melones
(Stanislaus River) water to New Hogan (Calaveras River) water.
A-4
74-01
T-3
CN-1
MW-3
(A,B,C)
MW-2
(A,B,C)
60-acre
MW-NW-1
PZ-1
74-02
nested well location
BZ
MW-1
(A,B,C)
tracer introduction location
well location
surface water sample

GAMA: Water Quality Changes during Groundwater Banking page 14
Sulfur hexafluoride was introduced using a gas cylinder with a standard regulator and a
mass flow controller that kept the gas flow rate at 10 cm3/min. The precise amount of SF6
that dissolves into the water and is retained in the water depends upon the water
temperature and diffusion at the water-atmosphere interface. Vertical mixing of the tracer
in the water column depends on the presence/absence of a thermocline, while the degree
of horizontal mixing within the pond depends largely on wind duration and speed. The
maximum tracer concentration and retention time of the tracer in the surface water body
is therefore dependent upon a number of environmental factors and difficult to predict
ahead of time. Approximately 125,000 m3 (101.3 acre-ft) of water was tagged with tracer.
Subsequent monthly sampling rounds through mid-2007 entailed collection for tracer and
selected analytes in a subset of the groundwater wells. Samples were collected from wells
PZ-1, A-4, 74-01, 74-02, 60-Acre, T-3, CN-1, BZ, MW-NW-1, and the MW-1(A,B,C),
MW-2(A,B,C), and MW-3(A,B,C) well clusters, each of the latter screened at shallow
(10m depth), intermediate (15m depth), and deeper (20m depth) portions of the shallow
aquifer (Figure 3). Because the water source for artificial recharge is high elevation, low-
TDS water from New Melones reservoir, several intrinsic tracers are present in the
artificially recharged water in addition to the SF6 tracer, which tags a limited portion of
the artificially recharged water.
SEWD: Tracer Test Results
Results of tracer analyses are shown in Figure 4 and Figure 5. Tracer observations in
surface water samples show that the pond was fairly well-mixed by Feb. 6th
(on the
falling limb of the tracer curve). Arrival at 60-acre well occurred 17 days after the
experiment began, and 10 days after the peak concentration in the pond. Travel to PZ-1
was similarly rapid – 22 days from initiation of the experiment and 20 days from the
observed peak in the surface water. Similar arrival times, with much lower
concentrations, were observed at nested wells MW3(A,B and C), MW2(A, B, and C);
tracer arrived slightly later (27 days) and at extremely low concentrations (about 1 part in
1000 of pond water, or C/C0 of .001) at wells MW1(A, B, and C). Simultaneous arrival at
nested wells MW1(A,B, C) and MW2(A,B,C) indicates that these wells all sample the
same shallow aquifer and that transport over this interval is uniform in a vertical sense.
Observed concentrations in MW3(A,B,C) peaked on 2/21/07, came down to near
background then continued an upward trend through the final sampling event (July,
2007). Results from this set of nested wells indicate ‗fast path‘ transport of a small
volume of pond water with subsequent transport of pond water as the mound relaxed after
the infiltration event. Indeed, following the initial pulse recorded in nearby wells, tracer
concentrations continued to increase only in MW3(A,B, C), and in well CN-1, all to the
S-SW of the ponds in the direction of the regional gradient (Figure 5). Concentrations
are highest in well MW3C; In contrast, the MW1(A, B, and C) and MW2A wells likely
catch a just a marginal portion of the ‗plume‘ during the time of significant mounding.
Considering tracer travel times to the cluster of MW3 and CN-1 wells, bulk lateral flow
rates ranged from 6.5 to 13.7 ft/d. Vertical transport, as determined from tracer arrival in

GAMA: Water Quality Changes during Groundwater Banking page 15
PZ-1, which is located only 20 ft from the edge of the pond but is screened at a depth of
40 to 65 ft BGS is on the order of 2 ft/d. The very long tails exhibited by the PZ-1 and
60-acre well tracer curves are likely due to slow vertical transport of tracer laden water
over those wells‘ long screened intervals.
Figure 4. SF6 tracer concentrations in surface water and groundwater samples collected at SEWD. Concentrations are given as ppb SF6 in a fixed headspace. A dashed line shows the MDL for this method. Collection date for a full suite of water quality samples is shown as an arrow.
Figure 5. SF6 concentrations normalized to the peak concentrations measured in the recharge pond.

GAMA: Water Quality Changes during Groundwater Banking page 16
SEWD: Water Transport and Water Quality Indicators
The 3H/
3He age dating method was used to determine a mean groundwater age and to
identify the fraction of pre-modern (i.e., recharged prior to approximately 1955; see figs.
6,7,8) water present in groundwater samples collected at the site during the initial
sampling in August 2006. Mean groundwater ages for wells adjacent to the ponds (PZ-1,
60-Acre, MW-1A, MW-1B, MW-1C, MW-2A, MW-2B, MW-2C, MW-3A, MW-3B,
and MW-3C) were all determined to be less than 2 years (Appendix 1), indicating that the
tritium-containing portion of the produced groundwater is transported to the capture zone
of these wells over a short time scale. Groundwater sampled from well T-3, which is
further from the ponds but screened in alluvium, was found to have a mean age of 3
years. The production wells 74-01, 74-02 have mean ages that indicate that the tritium-
containing portion of the produced water recharge several decades ago. Comparing age
dating results between these two wells, it is evident that the confining unit (shown on the
cross section in
Figure 6) plays a role in preventing transport from the shallow zone in the location of
Well 74-02. Pump tests carried out by MWH likewise indicated that the deep and shallow
systems are not hydraulically connected on the time scale of the pump test (MWH, 2000).
Figure 6. West to East cross section of apparent mean 3H-
3He ages and percentage of pre-
modern (<1955) water in groundwater wells at SEWD. Cross-section and well logs from [Montgomery Watson Harza, 2006]. Note that the screen interval for well A-4 is not well known, and likely extends across both the shallow and deep aqufiers.
?

GAMA: Water Quality Changes during Groundwater Banking page 17
Figure 7. Northwest to Southeast cross section of apparent mean 3H-
3He ages and percentage of
pre-modern (<1955) water in groundwater wells at SEWD. Cross-section and well logs from (Montgomery Watson Harza, 2006).
In addition to the recently recharged portion of the groundwater, many of these wells tap
ambient groundwater that recharged more than several decades ago and does not contain
tritium. Comparing the measured tritium with the tritium expected at the time of recharge
provides a means for calculation of the fraction pre-modern (Manning et al., 2006; Moran
et al., 2003; Figure 8). Because groundwater banking began only a few years ago at this
site, the wells draw groundwater with a bimodal age distribution – older ambient
groundwater mixed with recent artificially recharged groundwater. Well A-4, which is
likely screened across a long interval that includes both the shallow and deep aquifer
systems, is an interesting example of this. While its mean tritium-helium age is less than
one year, it produces a relatively large fraction of pre-modern water at approximately
40%.
MW-NW-1 74-01 74-02

GAMA: Water Quality Changes during Groundwater Banking page 18
Figure 8. Calculations (curves) of pre-modern (<1955) water present in groundwater below SEWD. Sample results are shown as dots.
Based on information derived from tracer and age dating results, wells were categorized
as being strongly affected by recent recharge (―Recharge‖ wells – PZ-1 and 60-acre),
being somewhat affected by recent recharge (―Mixed‖ wells – nested monitoring well
sets MW1, MW2, and MW3, and well CN-1), or being unaffected by the recharge
activities either because they are distal or screened only in the deep aquifer system or
both (―Deep‖ wells – 74-01, 74-02, CWS-35, T3, A4, and BZ). Well A-4 is problematic
since screen intervals are not known with certainty, and it is closer to the recharge ponds
that the other unaffected wells. For the geochemical modeling exercise, the pre-modern
fractions were used as a means to estimate the component of imported recharge water
present in each groundwater sample as a result of groundwater banking operations, with
the tacit assumption that the end-member groundwater mixing component is
predominantly pre-modern. These well categories are used in describing the isotope and
water quality results that follow.
Another tracer of water source and transport is the stable isotope signature of water. In
particular, values of 18
O associated with surface water supplies originating in the Sierra
Nevada are isotopically light (enriched in 16
O relative to 18
O) in comparison to those of
local groundwater as a result of cooler precipitation temperatures at higher elevation.
Measured 18
O values in site groundwater and surface water samples are given on
Appendix 1. Comparatively high-elevation New Melones reservoir water is characterized
by a 18
O value of -11.5‰ (sample ―North Pond‖), background groundwater recharged
from local precipitation and runoff is characterized by a 18
O value of around -8‰.
However, multiple water sources are delivered to the recharge ponds, including sources
from the lower elevation New Hogan reservoir, and these water sources are alternated
over periods of weeks to months. The resulting pattern in groundwater 18
O is complex

GAMA: Water Quality Changes during Groundwater Banking page 19
and does not provide a clear marker of imported water in site groundwater in comparison
to other parameters (Figure 10).
Figure 9. Oxygen and hydrogen stable isotope compositions in waters collected at SEWD.

GAMA: Water Quality Changes during Groundwater Banking page 20
Figure 10. Oxygen stable isotope compositions for samples collected between Jan 26 and May 30, 2007.
Overall groundwater quality in the area is very good, with a maximum nitrate
concentration of 17 mg/L (as NO3-), TOC < 1 mg/L, and a low frequency of detection of
VOCs. Arsenic concentrations in some wells hover around the MCL of 10 g/L and are
discussed further below. Spatial patterns in field parameters, VOCs, major ions, trace
elements, nitrate, and inorganic carbon were examined according to whether wells were
categorized as ―Recharge‖, ―Mixed‖, or ―Deep‖; the categories having been assigned
using tracer and age results as described above.

GAMA: Water Quality Changes during Groundwater Banking page 21
Water quality parameters measured using a Horiba U-22 field probe show significant
differences between the three water groupings. pH varies in surface water but on average
is slightly higher in surface water than in groundwater. Dissolved oxygen and redox
potential measurements of groundwater samples indicate the shallow aquifer is generally
aerobic. Low concentrations of dissolved organic carbon – generally less than 1 mg/L as
carbon – were measured in surface water samples and in some groundwater samples in
conjunction with slightly reduced oxygen concentrations, but direct evidence of
anaerobic conditions (e.g., dissolved oxygen concentrations below detection limit,
reduced or negative redox potentials, excess dissolved N2 generated via denitrification)
was not observed. (Significant excess nitrogen concentrations show that denitrification
may be an important process in mitigating the effects of nitrate loading at deep
production wells.)
TDS, as indicated by field conductivity is low in surface and ―Recharge‖ water and
increases in ―Mixed‖ and ―Deep‖ samples, due to water-rock interaction along flowpaths.
With respect to major cations, groundwater samples exhibit a relative enrichment in
sodium and potassium at the expense of calcium and magnesium when compared to the
pond water composition. This tendency is most pronounced in ―Recharge‖ wells
characterized by a significant tracer response (Figure 5) and is likely the result of cation
exchange on clay surfaces. In addition, certain trace elements – arsenic, vanadium and
molybdenum – are characterized by inverse correlations with TDS in groundwater.
Specifically, the concentrations of these elements exhibit a spike in groundwater samples
at low TDS values in comparison to imported recharge water samples that contain very
low concentrations of these elements. The pattern is particularly evident for ―Recharge‖
and ―Mixed‖ wells that exhibited a significant tracer response.
Dissolved inorganic carbon (mainly bicarbonate ion) concentrations increase significantly
from surface water to ―Recharge‖ wells to ―Mixed‖ and ―Deep‖ wells. An inverse
correlation exists between dissolved inorganic carbon and δ13
C that likely reflects mixing
of imported surface water (δ13
C value of -11 to -4 ‰) with local groundwater
characterized by lower δ13
C values (-18 to -16 ‰), the latter likely reflecting
biogeochemical processes involving soil CO2. Because the dissolved organic carbon
content of both local groundwater and imported surface water is typically less than 1
mg/L (as carbon) it is unlikely that oxidation of dissolved organic carbon significantly
affects the δ13
C values of dissolved inorganic carbon at the site.
Chloroform is by far the most frequently detected VOC. SEWD operates it recharge and
water treatment facilities such that lightly chlorinated water is occasionally loaded into
one of the recharge ponds. Chloroform and other trihalomethanes (THMs) act as
additional tracers of recent recharge at this site. There is a correlation between
chloroform concentrations and 18
O, with wells having a light (imported) isotope
signature tending to have higher chloroform concentrations. Treated imported water is
mixed with ambient groundwater with heavier 18
O and no THMs.
Further insight into the mechanisms involved in generating the observed water quality
changes is gained through results of the geochemical modeling exercise described below.

GAMA: Water Quality Changes during Groundwater Banking page 22
Figure 11. Arsenic concentrations in surface water and groundwater samples collected at SEWD.
SEWD: Geochemical Modeling
A geochemical model was constructed to constrain the mixing of recharge water with
background groundwater in the presence of aquifer materials. For the SEWD site,
negative log saturation indices were calculated for site groundwater compositions for
common buffering mineral species such as calcite or dolomite. As such, the principal
modeled water-aquifer material interactions involve (1) ion exchange reactions and (2)
complexation reactions on hydrous ferric oxide (HFO) phases. For ion exchange,
PHREEQC employs a reaction formulation that assumes equivalent fractions for
activities of exchange sites in the overall geochemical model of the form,
Ca2+
+ 2X- CaX2 (Equation 2)
where X represents an exchange site. Equilibrium cation exchange constants for major
cations (e.g., Ba2+
, Ca2+
, Cu2+
, K+, Mg
2+, Na
+, Sr
2+, and Zn
2+) are included in the
PHREEQC.DAT database from various sources (Appelo and Postma, 1993). The cation
exchange conceptualization requires that the overall abundance of such exchange sites
must be specified in the model definition. Independent measurements of cation exchange
capacity (CEC) for site materials were not available, so a postulated value that produced
reasonable model agreement with site data, as discussed below, was selected. A total of
0.5 mole of exchange sites were assumed to be available per liter of groundwater,
equivalent to a CEC on the order of 0.08 moles of charge per kilogram, a value that is
T-3

GAMA: Water Quality Changes during Groundwater Banking page 23
typical of alluvial materials (Sposito, 1989). No adjustments were made to the values
complexation constants provided in the PHREEQC.DAT default data set.
PHREEQC also employs a database developed by Dzombak and Morel (1990) to
quantify complexation of trace elements onto an HFO surface. This model assumes
―strong‖ and ―weak‖ binding sites, with abundances of 0.2 mole of weak sites and 0.005
mole of strong sites per mole of Fe(III). Pertinent data include binding site complexation
constants for As, Ba, B, Ca, Cu, Mg, Mo, Ni, U, V, and Zn. For this study, 0.07 mole of
reactive solid-phase Fe(III) per liter of groundwater was used to provide a reasonable fit
to the trace element data, as discussed below. This corresponds to a weight percent
abundance of reactive ferric oxyhydroxide as Fe(OH)3 or FeOOH per unit mass of
aquifer material on the order of 0.1%. No adjustments were made to the values
complexation constants provided in the Dzombak and Morel (1990) data set.
Definition of a background groundwater composition is needed for use as (1) an end-
member in the mixing calculations and (2) as a basis for an initial putative equilibration
distribution of species among the ion exchange and HFO surface complexation sites on
the solid aquifer material. However, selection of a representative end-member
groundwater is nontrivial because of a paucity of monitoring wells that are not in the
immediate vicinity of the recharge ponds (i.e., more likely to represent background
conditions) and that are also screened in the shallow zone above 60-m depth. In this
context, the water composition from well T-3, located several hundred meters west of the
recharge ponds, was identified as best representing shallow background groundwater
among the wells sampled, as it generally behaves as a near-end-member composition for
many of the geochemical trends identified in the data and yet is not strongly influenced
by pre-modern water associated with deeper groundwater. For example, the T-1 water
composition is characterized by an apparent age of 3 years and fraction pre-modern of
only 14%, relatively low 13
C and high inorganic carbon values, elevated chloride,
nitrate, and sulfate (94th
, 83rd
, and 100th
percentiles, by rank, respectively), elevated
calcium, magnesium, and sodium (83rd
, 83rd
, and 89th
percentiles), comparatively low
combined sodium and potassium contributions to the cation pool (33rd
percentile),
indicative of only minimal to moderate cation exchange, elevated barium (78th
percentile), elevated boron, nickel, strontium, and uranium (all at the 83rd
percentile,
respectively), and comparatively low arsenic (17th
percentile) and vanadium (44th
percentile) among the groundwater samples collected during the August 2006 sampling
round.
The selection of recharge water composition for mixing is a less critical issue than the
end-member groundwater because the pond water solution is comparatively unbuffered
and is not used to equilibrate ion exchange or surface complexation sites on mineral
surfaces. The water composition measured in a pond sample collected during the August
2006 sampling round was selected for this purpose.
PHREEQC was used to assess the changes in composition from the T-3 water
composition (i.e., background groundwater, or zero pore-volume shift of imported
recharge water) to 90% of pore volume of imported recharge water. In this context, a one

GAMA: Water Quality Changes during Groundwater Banking page 24
pore-volume shift would imply that the pore water in contact with the aquifer mineral
assemblage has been replaced by 100% imported recharge water which has been allowed
to come into equilibrium with that mineral assemblage. In general, the model reproduced
the trends observed in the cation exchange data: the solution is preferentially enriched in
sodium and potassium from the exchanger surface in response to the low-TDS but
comparatively calcium- and magnesium-rich imported water composition (Figure 12). In
comparison to observed trace element concentrations, the model also matched the arsenic
concentrations in tracer-impacted wells reasonably well (Figure 12), given that the
default Dzombak and Morel (1990) database parameters were not adjusted to match the
data. The vanadium and molybdenum concentrations measured in wells characterized by
a tracer response exhibit much scatter (the vanadium example is shown on Figure 12); the
model only qualitatively captured the trend and magnitude of the concentration changes
in response to mixing with recharge water.
SEWD: Discussion of Geochemical Modeling Results
Taken together, the results of this study indicate that mixing of recharge water with
ambient groundwater creates a geochemical footprint that includes a shift in the relative
abundances of major cations and the mobilization of certain trace elements. Among those
trace elements included in the data set, only arsenic(V), vanadium, molybdenum, and
uranium are predicted to form anionic complexes at near-neutral pH values, specifically
HAsO42-
, H2AsO4-, H2VO4
-, MoO4
-, UO2(CO3)2
-2, and UO2(CO3)3
-4. Recharge water is
characterized by a somewhat elevated pH in comparison to site groundwater, so
displacement of oxyanions by OH- on the HFO binding sites is a plausible explanation for
the observed behavior of arsenic, vanadium, and molybdenum. A number of previous
studies have suggested this mechanism could play a role in mobilizing arsenic and other
trace elements (Rai and Zachara, 1984, Welch et al., 2000, Smedley and Kinniburgh,
2002, Belitz et al., 2003). Among the anionic trace element complexes, uranium is
unique in that it does not exhibit an apparent increase in concentration stemming from
desorption. The likely reason is that uranium-carbonate complexes may be comparatively
weakly adsorbed. Wazne et al. (2003) reported experimental results that indicated that
carbonate inhibited adsorption of uranium-VI onto ferrihydrite by forming uranyl
carbonate complexes that exhibit a lower affinity to adsorb onto iron hydroxide surfaces
at intermediate pH values. The implication is that uranium will exhibit a relatively high
affinity for the aqueous phase in carbonate-rich waters. Virtually all uranium in the
SEWD shallow groundwater is predicted by PHREEQC to be complexed with carbonate
groups, so consequently the HFO surface would not be expected to act as a reservoir for
uranium to the extent that it does for arsenic, vanadium, and molybdenum.
As a practical matter, the potential for arsenic mobilization is the main environmental
concern associated with groundwater banking at the SEWD site. The U.S. Environmental
Protection Agency‘s maximum contaminant level for arsenic is 10 µg/L. Arsenic
concentrations in many of the shallow wells – those effected directly by recharge water
(e.g., MW-3 cluster) – are on the order of 7-9 µg/L, whereas the putative background
groundwater composition associated with well T-3 is characterized by an arsenic
concentration of approximately 4 µg/L. Belitz et al. (2003) report that groundwater

GAMA: Water Quality Changes during Groundwater Banking page 25
samples collected from alluvial fans on the western side of the San Joaquin Valley are
typically characterized by arsenic concentrations less than 5 µg/L. (Deep groundwater at
this site and at several other locations in the western San Joaquin Valley has elevated
arsenic concentrations above or near 10 µg/L (Appendix 1 and Izbicki et al., 2008),
which is likely caused by the release of arsenic through the reductive dissolution of iron
and manganese hydroxide coating on iron sulfide mineral grains that occurs on very long
time scales and generally under reducing conditions.
Figure 12. Observed and simulated relationships between various geochemical indicators (cation
ratios – left; arsenic versus TDS – upper right; vanadium versus 18
O – lower right) measured during the August 2006 sampling round.
Groundwater samples from wells exhibiting a significant tracer response, typically
characterized by a low proportion of pre-modern water (large, gray circles) are
distinguished from those with low or minimal tracer response (and typically) a high
proportion of pre-modern water (small, black circles). Surface water samples are
indicated by open circles. Geochemical modeling results, as indicated by black lines,
reflect the flushing of up to a 0.9 pore volume of recharge water through ambient aquifer
conditions, which are defined as being in equilibrium with the T-3 water composition.
0.0 0.2 0.4 0.6 0.8 1.0
Na+ + K+
1.0
0.8
0.6
0.4
0.2
0.0
Mg2+
1.0
0.8
0.6
0.4
0.2
0.0
Ca
2+
GW sample in well with tracer response (8/06)
GW sample in well with no tracer response (8/06)
Pond sample (8/06)
PHREEQC model
0.9 pore-volume
T-1
PZ-1 0.00
0.02
0.04
0.06
0.08
0.10
0.12
0.14
0.16
0 2 4 6 8 10 12 14 16 18
Co
nce
ntr
atio
n (μ
mo
l/L)
TDS (mmol/L)
GW sample + tracer response (8/06)
GW sample with no tracer response (8/06)
Pond sample (8/06)
PHREEQC model
Arsenic
0.00
0.20
0.40
0.60
0.80
1.00
1.20
1.40
-12.0 -11.0 -10.0 -9.0 -8.0 -7.0
Co
nce
ntr
atio
n (μ
mo
l/L)
18O (‰)
GW sample + tracer response (8/06)
GW sample with no tracer response (8/06)
Pond sample (8/06)
PHREEQC model
Vanadium
0.9 pore-volume
0.9 pore-volume
T-1
T-1 T-3
T-3
T-3

GAMA: Water Quality Changes during Groundwater Banking page 26
Adsorbed arsenic represents a significant source of groundwater contamination at low
concentrations (Gao et al., 2006). Soil arsenic concentration data are not available for the
SEWD site. The assumptions employed by the PHREEQC model imply that the aquifer
material in equilibrium with the putative T-3 end-member groundwater composition
harbors some 15 mg/kg of adsorbed arsenic. Gao et al. (2004) found arsenic
concentrations up to 24 mg/kg in sediments collected from the Tulare Lake Bed area in
the southern San Joaquin Valley, much of which was leachable by repeated flushing with
artificial pore water. However, the soil arsenic concentrations reported by Belitz et al.
(2003) on the order of 8-10 mg/kg or higher (for comparatively high soil arsenic
concentrations) occurring on the western side of the valley are probably more
representative. In this context, the modeled value of 15 mg/kg is somewhat elevated but
not unreasonable.
The focus of the geochemical modeling portion of the study has been placed on
quantifying water quality responses to the mixing of high-quality, low-total-dissolved-
solids recharge water with ambient groundwater via a postulated geochemical model of
the underlying aquifer material entailing an ion exchanger and HFO surface. The
consistency of model results with major and minor element concentration data, tracer
data, and calculated groundwater age provides an additional degree of model validation.
As such, the modeling approach provides a plausible quantitative framework with which
to predict the potential water quality changes in shallow aquifer systems in response to
artificial recharge water composition. Nonetheless, although the results of this study are
qualitatively consistent with expectations, it is important to recognize that a number of
significant sources of error exist in the interpretation of the data, particularly in regard to
the geochemical modeling. The two most important limitations include (1) a very
simplified mixing model, most notably the definition of an un-impacted groundwater
end-member composition, which may not be available in reality, given the temporally
variable recharge history, and (2) slow adsorption-desorption kinetics and/or rate-limiting
diffusive transport, both of which could act to impede the ability of the system to achieve
thermodynamic equilibrium (Williams et al., 2003; Zhang and Selim, 2005) over the
weeks-to-months transport time scales suggested by the tracer test data.

GAMA: Water Quality Changes during Groundwater Banking page 27
Figure 13. Temperature and conductivity of water samples collected at SEWD.

GAMA: Water Quality Changes during Groundwater Banking page 28
Figure 14. pH and oxidation reduction potential (ORP) of water samples collected at SEWD.

GAMA: Water Quality Changes during Groundwater Banking page 29
Figure 15. Dissolved inorganic (DIC) and organic carbon (DOC) of water samples collected at SEWD.

GAMA: Water Quality Changes during Groundwater Banking page 30
Figure 16. Dissolved oxygen (DO) and nitrate concentration of water samples collected at SEWD.

GAMA: Water Quality Changes during Groundwater Banking page 31
Figure 17. Chloride and sulfate concentrations of water samples collected at SEWD.

GAMA: Water Quality Changes during Groundwater Banking page 32
Study Site II: Morada Lane Detention Pond, Stockton, CA
Like the SEWD site, the Morada Lane study area is within the Eastern San Joaquin
Ground Water Subbasin (California Department of Water Resources, 2006). At the study
site, volcanic deposits approximately 200 m below land surface separate overlying
alluvial-fan deposits from underlying marine deposits and form the effective base of fresh
water. The volcanic deposits are blanketed by a layer of alluvium eroded from these
deposits about 30 m thick the remainder of the deposits consist of alluvial-fan deposits
eroded primarily from the Sierra Nevada. During the study the regional ground-water
gradient at the study site was to the southeast toward the regional pumping depression.
The City of Stockton is using various water sources including imported water, local
surface water and storm flow to recharge underlying alluvial aquifers via spreading
ponds. Morada Lane Detention Basin 2 (DB2), a 40 hectare (10 acre) pond (Figure 18),
is used for storm water retention in spring and winter months and for artificial recharge of
imported water in summer and fall. In 2005, approximately 900 acre-ft of Mokelumne
River water supplied by the Woodbridge Irrigation District was infiltrated at this site. A
similar volume was recharged in 2004. Water was delivered to the pond in 4 to 9 cycles
per year, each cycle having a volume of 100 to 200 acre-ft (Condor Earth Technologies,
2006); the final delivery of the 2005 season was tagged with tracer for this study.
Subsequent inflow of storm water was not metered.
The USGS-installed wells just adjacent to the pond provided an opportunity to sample
water at multiple depths in the aquifer. Five monitoring wells screened at depths of 114,
220, 300, 540 and 635 feet BGS (depths are for the center of 10 ft screens), were sampled
for the list of constituents in Table 1. In addition, the two drinking water wells, pond
water, and canal water, were sampled for all constituents. In a manner similar to the
SEWD site, this study focuses on the travel time and the amount of influence the
artificially recharged water has on local wells, along with water quality changes related to
the introduction of recharged water such as the interaction between recharge water and
aquifer sediments and the fate of organics and nitrate.
Morada Lane: SF6 Tracer Test
Tracer introduction at the Morada Lane DB2 groundwater banking site took place from
Oct. 3 to Oct. 10, 2006. The tracer introduction was coordinated to coincide with the final
delivery of the season of imported water from the Woodbridge Irrigation District.
Approximately 50 acre-ft of water was loaded into the pond beginning on Oct. 4 and
ending on Oct. 12.
Sulfur hexafluoride was introduced using a gas cylinder with a standard regulator and an
automatic switching valve that kept the gas flow rate at 20 cm3/min. The precise amount
of SF6 that dissolves into the water and is retained in the water depends upon the water
temperature and diffusion at the water-atmosphere interface. Vertical mixing of the tracer

GAMA: Water Quality Changes during Groundwater Banking page 33
in the water column depends on the presence/absence of a thermocline, while the degree
of horizontal mixing within the pond depends largely on wind duration and speed. The
maximum tracer concentration and retention time of the tracer in the surface water body
is therefore dependent upon a number of environmental factors and difficult to predict
ahead of time.
Figure 18. Morada Lane Detention Basin 2 (DB2) site showing the location of tracer introduction and the locations where surface water and groundwater samples were taken. Lysimeters are co-located with the USGS MW-114’ monitoring well (MW-114’). Results are tabulated in Appendix A5. Note that the two CWS wells, CWS-19 and CWS-24, are labeled as CSW-19 and CSW-24 in this figure and throughout the text.
Following the tracer introduction, surface water samples were collected regularly from
five locations around the retention pond (Figure 18). USGS water level measurements in
public and monitor wells, and precipitation at a nearby fire station are shown over the
course of the tracer experiment in Figures 19 and 20.
All samples were analyzed for SF6 concentration and stable isotope compositions of
hydrogen and oxygen in the water. Analyzing surface water samples is important because
predicting the concentration based on the amount of gas bubbled in is difficult, as
discussed above, and because one needs to know the initial, or input concentration for
comparison to groundwater results. Results of surface water analyses of SF6 are shown in
Figure 21. SF6 concentrations in surface and groundwater in this study (Figures 21 and
22) are measured and expressed as concentrations in the gas samples extracted from the
water samples, and not as concentrations in the water.
On the second day of the tracer experiment, a sample collected near the tracer
introduction point had the highest concentration of SF6 that was measured in the surface
water samples. Apart from this sample, the concentrations in the surface water form a
smooth tracer curve input function (Figure 21). The peak in tracer concentration from
samples collected around the pond was observed about 9 days after the beginning of
tracer input. The width (duration) of the peak of tracer concentrations in the surface water
was approximately one month. The similarity of concentrations on the falling limb of the
USGS MW (114‘)
USGS Multi-level
CSW-24
CSW-19

GAMA: Water Quality Changes during Groundwater Banking page 34
tracer curve suggests that by about two weeks after the onset of the experiment, the pond
was well-mixed with respect to SF6. The method detection limit is about 1000 times
below the maximum observed in the pond, indicating that 0.1% of pond water in the well
water would be detectable.
Figure 19. USGS water level measurements at Morada Lane monitoring wells. Water levels are in feet below land surface.
Figure 20. Precipitation record (inches) at the Stockton Fire Station from August 2006 to June 2007 (California Department of Water Resources).

GAMA: Water Quality Changes during Groundwater Banking page 35
Figure 21. Results of SF6 tracer analysis from Morada Lane surface waters (locations shown on Figure 18).
Figure 22. Results of SF6 tracer analysis from Morada Lane surface water and groundwater.

GAMA: Water Quality Changes during Groundwater Banking page 36
The surface water with the highest concentration of SF6 was collected near the inlet of the
canal water, close to the tracer injection point. This sample had a temperature of 16.7 C,
which was more than three degrees cooler than the rest of the pond. One possible
explanation for the concentration range observed in surface water and wells is that
incoming Mokelumne River water is colder and denser than the ambient surface water
and moves into the deeper section of the pond. The lower temperature of this water also
increases the solubility of SF6. The cold water may have recharged mainly through the
bottom of the pond. Upward diffusion of the tracer would then result in the smooth,
mixed curve observed in the upper portion of the pond, which subsequently infiltrates
through the sides and bottom of the pond.
The first groundwater samples for SF6 analysis were collected on Oct. 6, three days after
the start of tracer injection into the pond. The shallowest monitoring well (114‘) had an
ambiguous detection of SF6, above background levels, on 10/10/2006. No other tracer
detections were observed in any of the wells sampled during the following two months,
as indicated on Figure 22, even though these monitoring wells are in close proximity to
the pond. Indeed, water level responses in these wells (which were all outfitted by the
USGS with pressure transducers) after infiltration indicate that pressure changes are
transmitted efficiently. Water levels rose in the MW-114‘ foot well almost immediately
after the pond was loaded, and in the MW-220‘ and MW-300‘ wells after just two days
(O‘Leary et al., in review). Given the fast response exhibited by water levels, it was
somewhat surprising that there were no tracer detections for 12 weeks in wells adjacent to
the detention basin. However, tracer appeared in multiple wells in January, 2007.
Table 2. Tracer arrival times in days since the start of the tracer experiment on 10/3/2006. Peak tracer concentrations (Co) are based on the maximum observed value in the pond.
Location Distance
from pond
margin
(m, ft)
First
Detection
(days)
Tracer
Maximum
(days)
Maximum
C/Co
Calculated
Linear
Velocity*
{ft/day, (m/d)}
Pond 1 1 1.000 NA
Pond margin
(shallow)
0‘ 1 9 0.340 NA
MW-114‘ 30‘, 98 119 119 0.667
MW-220‘ 60‘, 197 108 122 0.984 1.6 (0.6)
MW-300‘ 60‘, 197 122 122 0.540
MW-540‘ 60‘, 197 175 212 0.002
MW-635‘ 60‘, 197 - - - NA
CSW-24
(long screen)
198‘, 650 119 119 0.317 22 (6.7)
CSW-19
(long screen)
1557‘,
5108
169 169 0.021 30 (9.2)
*See text for explanation of determination of velocity at tracer maximum for each well.

GAMA: Water Quality Changes during Groundwater Banking page 37
Based on the timing of tracer arrival and the concentrations observed in wells relative to
surface water, surface water/groundwater interaction is quite complex in the vicinity of
the pond. Groundwater from the 114, 220, and 300 foot USGS wells contained
concentrations of SF6 that were higher than the majority of the pond samples, which
displayed a smooth peak. However, the sample collected near the tracer injection point on
Oct. 6 is matched by the highest detection observed in well water. Concentrations of SF6
observed at the nearby drinking water well (CSW-24) follow the lower surface water SF6
concentrations that were measured in the subsequent pond samples.
The arrival time at drinking water CSW-24 was 119 days after the tracer peak in the
surface water. The tracer was also detected at CSW-19, one mile to the west of the pond
169 days after the tracer injection. Apparently, the tracer tagged water that had infiltrated
from the pond migrated relatively slowly in the vertical direction until it reached the
highly conductive zones that are in hydraulic connection with the production well(s).
Based on the first arrival of tracer in the MW-220‘ well, the rate of (mainly vertical) flow
to that well is 1.6 ft/d (0.6 m/d). The arrival time at CSW-24 indicates a much higher
average (mainly horizontal) flow rate between the MW-220‘ well and CSW-24 of 22 ft/d
(6.7 m/d). The average lateral flow rate calculated in a similar way, based on the arrival
at CSW-19, is 30 ft/d (9.2 m/d). The tracer tagged water reached deeper monitoring wells
after reaching CSW-24, in keeping with the notion that vertical transport is much slower
than lateral transport. An extremely low concentration of SF6 was observed after 175
days in the MW-540‘ well; tracer was not detected in the deepest monitoring well.
Mixing and dilution due to dispersion during transport between the pond and CSW-24 is
the likely reason for the much lower concentrations observed there compared to the MW-
220‘ and MW-300‘ wells (similarly for the very low concentrations observed at Well
CSW-19). For several months following the arrival of tracer tagged water, CSW-24 was
not operational. Multilevel samples were collected from CSW-24 by the USGS in June
2006, but no tracer was detected.
Morada Lane: Isotopic Compositions and Groundwater Age
Mokelumne River water, delivered by Woodbridge Irrigation District, has a stable
isotope signature that is lighter (more negative) than ambient groundwater in the Stockton
area. For example, a sample from the inlet canal had a 18
O value of -10.9 ‰, while a
nearby drinking well had a 18
O value of -9.2 ‰. The stable isotopes do not exhibit as
large a dynamic range as the SF6. However, there is a detectable dip in the deuterium (to
lighter values) in the surface water when the Mokelumne water was introduced to the
pond (Figure 24), no change in the 220 ft. well over the same time period, and a small
change in 18
O in the 114 ft. well, but in the opposite direction (gets isotopically heavier).
So the stable isotopes are consistent with the SF6 results in showing no pond water in the
groundwater from the tagged pulse of surface water. However, the samples collected at
times when the tracer was detected in the wells do not show a decrease in 18
O as
expected, indicating that the imported water makes up a component of the well water.

GAMA: Water Quality Changes during Groundwater Banking page 38
Figure 23. Oxygen and hydrogen stable isotope compositions for surface water and groundwater samples collected from the Morada Lane study site. Well 19 and 24 in legend refer to CSW-19 and CSW-24, and MW 1, 2, 3 & 4 refer the USGS multi-level monitor wells, which are identified only by their depth in the text (e.g., MW-114’).
Figure 24. Results of oxygen isotope analysis from Morada Lane surface water and groundwater. MW 1, 2, 3 & 4 refer the USGS multi-level monitor wells, which are identified only by their depth in the text (e.g., MW-114’).

GAMA: Water Quality Changes during Groundwater Banking page 39
Groundwater 3H-
3He apparent ages,
3H activity, and recharge temperatures are shown in
relation to well screen depth on Figure 25. In general, the apparent age of groundwater
increases with depth. The shallowest monitoring well MW-114‘, has an apparent age of 2
years, while the deepest monitoring wells have ages beyond the 50-year range that is
dateable by the 3H-
3He technique. Approximate ages, based on radiogenic
4He
accumulation, indicate that the 540 feet BGS well water produces groundwater with a
component that is approximately 3000 years old, while the 635 feet BGS well water
produces a component that is approximately 10,000 years old. The monitoring wells at
220 and 300 feet BGS have apparent ages for the tritium-containing portion of the
groundwater of 39 and 40 years. (Reconciling these ages with tracer results from these
two wells, where a high concentration of tracer was observed on a short time scale, is
difficult. Ages reflect the bulk flow rate of the tritium-containing portion of the
groundwater. Our hypothesis is that faulty well construction is responsible for the high
concentrations of tracer observed in these two monitoring wells.) The top of the
production well screens at approximately 200 feet BGS are similar to these mid-depth
wells, but both production wells produce water that is 10 to 15 years younger than the
monitoring wells. The younger water is likely present in the production wells is likely
due to younger water drawn in as pumping leads to formation of a cone of depression as
well as aquifer heterogeneity that leads to a wide distribution of water ages when sampled
over long screens.
Figure 25. Apparent 3H-
3He ages,
3H activity in pCi/L, and recharge temperature (RT) for
monitoring wells and public supply wells near the Morada Lane detention basin. The screen depth for each well is shown as a white box.
RT 22.3º RT 22.3º
RT 18.4º
RT 15.4º RT 15.2º
RT 18.8º RT 16.3º
RT 15.5 to 20.6º

GAMA: Water Quality Changes during Groundwater Banking page 40
Morada Lane: Water Quality Measurements
Figures 26 through 31 show the mean and variation of measured parameters at the public
supply wells, monitoring wells and the detention pond for samples collected during this
study. For each plot the mean value is shown as a horizontal line, and the minimum and
maximum values are shown as a vertical line. These plots allow for the comparison of
measured parameters between different levels within the aquifer system and the surface
water. In this way, it is possible to examine the relations of measured parameters to
processes occurring within the aquifer and in response to the managed aquifer recharge
operation.
Measurements taken with a Horiba multi meter during sampling are shown in Figure 26.
The pond samples showed the widest range of pH values, ranging from 6.3 to 10. All of
the groundwater samples had pH values between 7 and 8, with the two deep monitoring
wells showing the highest pH values. The pond also had the widest range of temperatures
recorded, reflecting the influence of air temperature changes throughout the year. The
114 foot deep monitoring well (MW-114‘) shows the highest range of variation in
temperature, which may indicate the influence of pond recharge on this well. The pond
water had a lower mean conductivity than the groundwater well samples, due to the use
of low TDS Mokelumne River water as the recharge source.
Figure 27 shows the concentration ranges for anions in samples from this study.
Increased salinity due to sea water intrusion has been documented in this area (Izbicki et
al., 2008), however the wells sampled in this study do not appear to have elevated levels
of chloride. Nitrate concentrations are generally low in the groundwater and surface
water samples. Nitrate may be further reduced in the deepest wells (MW-635‘ and MW-
540‘) due to reducing conditions deep in the aquifer. Nitrate concentrations are also low
in MW-114‘, which may be related to reduction reactions occurring during the infiltration
of pond water. These three wells also show depletions in sulfate concentrations,
consistent with sulfate reduction.
The influence of redox conditions is also evident in the trace element concentrations
shown in Figure 28. Uranium and vanadium are strongly depleted in the deepest
monitoring wells. MW-114‘ has low concentrations of uranium, similar to the pond
samples, but has elevated concentrations of vanadium. Arsenic concentrations are highest
in the two deepest monitoring wells, and are consistent with the regional observations of
high arsenic concentrations such as those observed at the SEWD site and elsewhere
(Izbicki et al., 2008). MW-114‘ has slightly elevated arsenic concentrations relative to the
pond water and to MW-220‘ and MW-300‘. The slight elevation of arsenic in this well
may be related to the addition of recharge water that is out of equilibrium with the aquifer
sediments, similar to the SEWD site. Unlike the SEWD site, redox chemistry may
influence the concentration of arsenic at this well.

GAMA: Water Quality Changes during Groundwater Banking page 41
Figure 26. Water quality parameters measured in the field at the Morada Lane site. MW 1, 2, 3 & 4 refer the USGS multi-level monitor wells, which are identified only by their depth in the text (e.g., MW-114’).

GAMA: Water Quality Changes during Groundwater Banking page 42
Figure 27. Anion concentrations from samples collected at the Morada Lane site. MW 1, 2, 3 & 4 refer the USGS multi-level monitor wells, which are identified only by their depth in the text (e.g., MW-114’).

GAMA: Water Quality Changes during Groundwater Banking page 43
Figure 28. Trace Element concentrations from samples collected at the Morada Lane site. MW 1, 2, 3 & 4 refer the USGS multi-level monitor wells, which are identified only by their depth in the text (e.g., MW-114’).

GAMA: Water Quality Changes during Groundwater Banking page 44
Figure 29. Dissolved carbon concentration and isotopic composition from samples collected at the Morada Lane site. MW 1, 2, 3 & 4 refer the USGS multi-level monitor wells, which are identified only by their depth in the text (e.g., MW-114’).

GAMA: Water Quality Changes during Groundwater Banking page 45
Figure 30. Oxidative reduction potential and redox-sensitive dissolved gases from samples collected at the Morada Lane site. MW 1, 2, 3 & 4 refer the USGS multi-level monitor wells, which are identified only by their depth in the text (e.g., MW-114’).

GAMA: Water Quality Changes during Groundwater Banking page 46
Figure 31. Parameters derived from noble gas compositions of groundwater near the Morada Lane site. MW 1, 2, 3 & 4 refer the USGS multi-level monitor wells, which are identified only by their depth in the text (e.g., MW-114’).

GAMA: Water Quality Changes during Groundwater Banking page 47
The concentration and isotopic composition of dissolved carbon are shown in Figure 29.
Total organic carbon (TOC) concentrations were 4-8 times higher in the pond than in the
groundwater samples. The shallow monitoring well had the highest observed
concentrations of organic carbon. The shallow well was also similar to the pond in having
the lowest concentration of total inorganic carbon (TIC). Carbon isotope compositions of
total inorganic carbon in most wells were consistent with the incorporation of respired
CO2 during infiltration through the soil zone. The shallow well had the highest 13
C
values, which may indicate a higher proportion of atmospheric CO2-equilibrated water. A
sample collected from the canal (Appendix 1; not shown in Figure 29) has a 13
C value
of -11.7 ‰, which may represent an end member for atmospheric CO2-equilibrated
water. Only one sample from the pond was analyzed for its TIC isotope composition, and
it had a value of -16.5 ‰, which is much lower than expected for surface water.
Figure 30 combines the results of oxidation reduction potentials (ORP) measured in the
field with two redox sensitive dissolved gases (excess N2 and CH4) measured using
membrane inlet mass spectrometry. The lowest ORP values were measured in the two
deepest monitoring wells. The deepest monitoring well (MW-635‘) contained excess
nitrogen and elevated dissolved methane, indicating denitrification and methanogenisis in
the deep aquifer system. Elevated methane concentrations were also observed in the
shallow monitoring well, which indicate methanogenisis that may occur as a result of
redox reactions due to the influence of organic carbon in the recharge from the pond.
Morada Lane: Noble Gas-Derived Recharge Conditions
Figure 31 shows the percentage of pre-modern water, recharge temperature, and excess
air concentration, which are calculated from dissolved noble gas and tritium
concentrations. The fraction pre-modern (recharged more than approximately 50 years
before present) is determined using a plot of tritium in precipitation versus recharge year
and comparing a sample‘s measured tritium to the tritium expected based on the 3H-
3He
age of the sample (Manning and Thiros, 2005; Moran et al., 2004). Pre-modern water
does not contain tritium, and is not reflected in the 3H-
3He apparent age of a sample. The
two deepest monitoring wells contain no detectable tritium, and are therefore completely
pre-modern. The long-screened production CSW-24, has a large range of percent pre-
modern values, which may reflect variations in flow with depth during the year. The
shallow monitoring well contains approximately 24% pre-modern water.
The recharge temperature indicates the temperature of the water when it was last in
contact with the atmosphere during infiltration and recharge. The shallow monitoring
well shows the largest variation in recharge temperature, which is consistent with the
large variation in discharge temperatures as well as 18
O and water quality parameters at
this well. The two deepest monitoring wells have recharge temperatures that are
approximately 5-6 degrees cooler than the temperatures measured during sampling. An
increase in temperature after recharge may indicate warming during to the geothermal
gradient with depth, and could also indicate recharge during different climate conditions.

GAMA: Water Quality Changes during Groundwater Banking page 48
Excess air concentrations are based on the observation of dissolved noble gas
concentrations being higher than equilibrium with the atmosphere would permit. The
cause of excess air in groundwater is generally attributed to the dissolution of entrapped
air bubbles at the water table interface (Aesbach-Hertig et al.1999; Cey et al., 2008).
Managed aquifer recharge operations can have a significant impact on excess air
concentrations due to the episodic nature of the recharge. High excess air concentrations
are also reported for areas where recharge pond water entraps air from what was
originally an unsaturated zone (Heilweil et al., 2004). Excess air concentrations are
highest in MW-300‘ and MW-220‘, while the shallowest monitoring well (MW-114‘) has
a low concentration of excess air. This pattern is in keeping with tracer results which
show a greater contribution of pond recharge in MW-300‘ and MW-220‘than in MW-
114‘. CSW-24 also has relatively high concentrations of excess air with a significant
amount of variability, which may indicate temporal variations in the fraction of water
derived from the recharge operation.
Morada Lane: Geochemical Modeling
PHREEQC was used to model the idealized mixing of recharge pond water with ambient
shallow background groundwater in an attempt to identify the key geochemical processes
affecting the evolution of the aquifer chemistry in response to recharge. Specifically, the
mixing model assumed that the water composition measured in MW-114‘ in February
2007 could be described by a mixture of:
Pond water composition, as represented by the Morada Pond NE sample collected
in September 2006.
Ambient background groundwater, as represented by the average composition of
two sampling rounds collected from MW-220‘ in Feb and March of 2007. The
SF6 tracer study indicates that this well is influenced by the recharge pond, but the
average groundwater age (~18 years) suggests that this influence may be sporadic.
Dissolved organic carbon.
The mixing model considered six different mixing scenarios, with the results of each
compared to the MW-114‘ water composition measured in February 2007:
1. A non-reactive binary 50-50 mixture of pond water with MW-220‘ water ("Binary
50-50");
2. A 50-50 mixture of pond water with MW-220‘ water subject to water-mineral
interactions as described below ("50-50 Reactive Mix");
3. The same as (2), but with the mineralization of 0.0001 mol/L organic carbon,
modeled as CH2O, included in the PHREEQC mixing calculations ("50-50
Reactive Mix with OC");
4. A non-reactive binary 90-10 mixture of pond water with MW-220‘ water
("Binary 90-10");
5. A 90-10 mixture of pond water with MW-220‘ water subject to water-mineral
interactions as described below ("90-10 Reactive Mix");
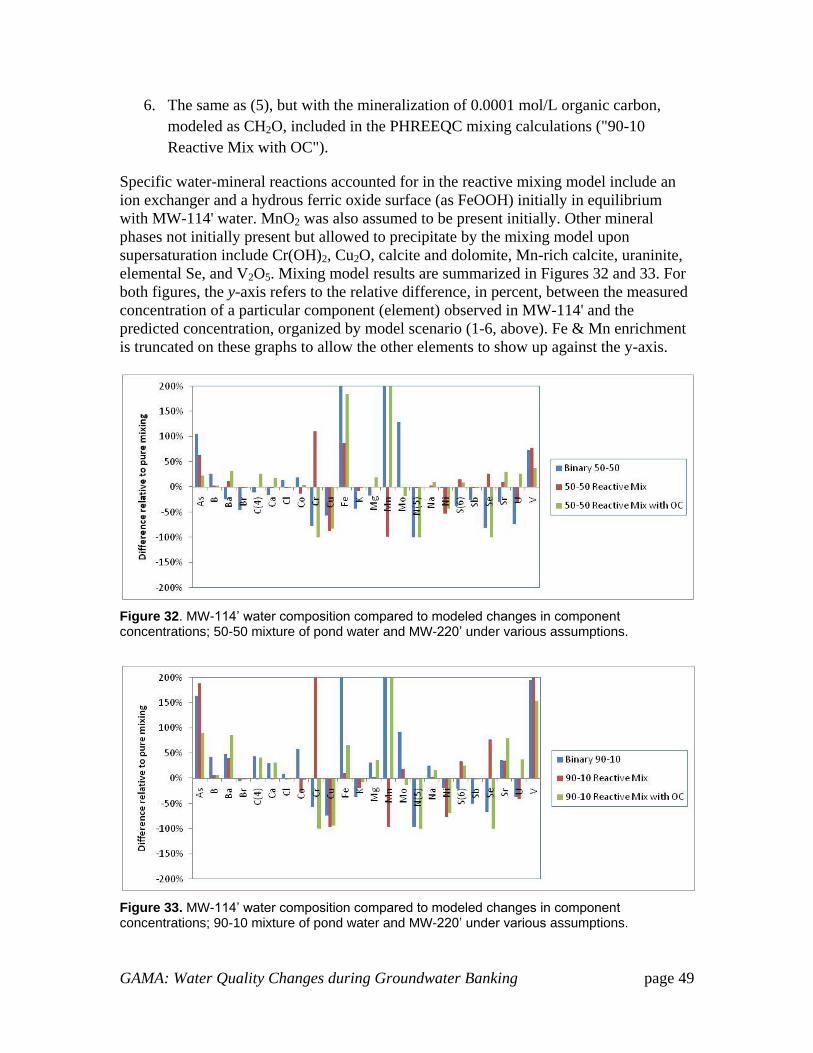
GAMA: Water Quality Changes during Groundwater Banking page 49
6. The same as (5), but with the mineralization of 0.0001 mol/L organic carbon,
modeled as CH2O, included in the PHREEQC mixing calculations ("90-10
Reactive Mix with OC").
Specific water-mineral reactions accounted for in the reactive mixing model include an
ion exchanger and a hydrous ferric oxide surface (as FeOOH) initially in equilibrium
with MW-114' water. MnO2 was also assumed to be present initially. Other mineral
phases not initially present but allowed to precipitate by the mixing model upon
supersaturation include Cr(OH)2, Cu2O, calcite and dolomite, Mn-rich calcite, uraninite,
elemental Se, and V2O5. Mixing model results are summarized in Figures 32 and 33. For
both figures, the y-axis refers to the relative difference, in percent, between the measured
concentration of a particular component (element) observed in MW-114' and the
predicted concentration, organized by model scenario (1-6, above). Fe & Mn enrichment
is truncated on these graphs to allow the other elements to show up against the y-axis.
Figure 32. MW-114’ water composition compared to modeled changes in component concentrations; 50-50 mixture of pond water and MW-220’ under various assumptions.
Figure 33. MW-114’ water composition compared to modeled changes in component concentrations; 90-10 mixture of pond water and MW-220’ under various assumptions.

GAMA: Water Quality Changes during Groundwater Banking page 50
In summary, both binary mixing models indicate that MW-114' is enriched in As, Fe,
Mn, and V and is depleted in Cr, Cu, N(5) - nitrate, and Se as compared to what would be
expected under ideal (non-reactive) mixing. The Binary 90-10 mixture model appears to
produce a better match to both the non-reactive natural tracers (Br and Cl) than does the
Binary 50-50 mixture. In the context of reproducing many of the observed component
concentration trends, the 90-10 Reactive Mix with OC model yields a reasonable degree
of semi-quantitative agreement between the data and the model with respect to As, Ba,
Br, C(4) - DIC, Ca, Cl, Cr, Cu, Fe, Mg, Mn, N(5) - nitrate, Se, Sr, and V. This model,
however, did not produce results consistent with the data for Co, Mo, S(6) - sulfate, Sb,
and U. Most of the model result stem from predicted changes in pH that impact surface
complexation reactions, although redox processes are important for Cr, Fe, Mn, and N(5).

GAMA: Water Quality Changes during Groundwater Banking page 51
Summary: Comparing Results from SEWD and Morada Lane
The two banking sites discussed here are operated because local and regional aquifers are
in overdraft conditions due to historical and ongoing withdrawals for agriculture. Both
operations are successful in maintaining reasonably high rates of infiltration and good
water quality. Hydrogeologic, geochemical and operational differences explain the
observed differences in tracer transport and water quality at the two sites.
With respect to infiltration, pond depth is greater at Morada Lane, while SEWD ponds
are ribbed to enhance infiltration. Overall, the infiltration rate is probably higher at
SEWD because of more permeable material at infiltration sites. SEWD applies only
imported water while at Morada Lane both imported and storm water runoff are
infiltrated; in both cases imported water exhibits very low TDS. The effect of recharging
storm water at Morada Lane is seen in higher TOC and trace metal concentrations in
surface water, but storm water recharge appears to have minimal effect on overall
groundwater quality, with the possible exception that infiltrating organic carbon drives
the redox process near the sediment-water interface.
Both methods of tracer introduction were successful and tracer curves were established
for nearby monitoring wells. Deep, multi-level sampling points were available at Morada
Lane but available wells provided very limited spatial coverage, while at SEWD near-
field spatial coverage was adequate but there was limited opportunity for acquiring
samples at specific depths of interest. An important result with respect to effects on water
quality is that overall water quality is good in both settings, and further improved by
removal of organic matter during infiltration, but arsenic is released from sediments at a
rate that is higher than would be expected for natural infiltration. At SEWD, As release is
associated with exchange on hydrous ferric oxides due to a change in pH, while at
Morada Lane redox processes with an organic carbon electron donor likely cause As
release in near field groundwater.
At both locations, extraction wells are in relatively close proximity to recharge ponds.
Pressure is transmitted to nearby monitoring wells almost immediately after infiltration
but water mass movement lags and has more complex behavior. Rapid lateral transport of
water from the recharge pond to drinking water wells takes place at Morada Lane, while
tracer was not observed at SEWD drinking water wells over the course of the study. At
both sites, groundwater ages in production wells indicate that the bulk of the produced
water has subsurface residence times greater than 20 years. At Morada Lane vertical
transport is fairly slow but is followed by rapid lateral transport through high hydraulic
conductivity lenses. At SEWD, mounding and lateral transport are rapid and are followed
by lateral transport according to the regional groundwater gradient; evidence for
significant vertical transport is lacking, but the resolution is poor because of limited
sampling points. Production well pumping does not have a direct affect on transport at
SEWD, possibly because production wells are screened in a semi-confined unit, which
also explains the lack of tracer detections in the production wells. At Morada Lane, a
direct, strong effect of pumping is observed due to unconfined conditions, and rapid

GAMA: Water Quality Changes during Groundwater Banking page 52
lateral transport may have implications for groundwater management when considering
potential transport of microbes and viruses to drinking water wells.

GAMA: Water Quality Changes during Groundwater Banking page 53
Acknowledgements
Samples were collected at Morada Lane by Tanya Meeth and others from DWR. USGS
collected some samples at CSW-24. Dave O‘Leary and John Izbicki provided useful
information about their monitoring wells and operation of the production well, and
collaborated in the interpretation of the tracer results. Phillip Norton assisted in the tracer
experiments and collected many of the samples for these studies. Rachel Lindvall
analyzed samples for cations, anions and trace metals.
John Yoshimura and Kevin Kaufmann provided much logistical assistance during the
SEWD tracer test, as well as information about the operation of SEWD‘s banking
facilities. Robert Granberg of the City of Stockton provided assistance during the Morada
Lane tracer test and well sampling campaign.

GAMA: Water Quality Changes during Groundwater Banking page 54
References
Appelo, C.A.J., and Postma, D., 1993. Geochemistry, Groundwater and Pollution, A.A.
Balkema, Rotterdam, 536 p.
Aeschbach-Hertig, W., F. Peeters, U. Beyerle, and R. Kipfer, 1999. Interpretation of
dissolved atmospheric noble gases in natural waters, Water Resources Research, 35,
2779-2792.
Belitz, K., N.M. Dubrovsky, K. Burow, B. Jurgens, and T. Johnson, 2003. Framework for
a ground-water quality monitoring and assessment program for California, U.S.
Geological Survey Water-Resources Investigations Report 03-4166, Appendix A:
Arsenic in the San Joaquin Valley – evaluating the utility of existing data.
Bouwer, H. 2002. Artificial recharge of groundwater: hydrogeology and engineering.
Hydrogeology Journal Vol. 10: pp. 121-142.
California Department of Water Resources, 1967. San Joaquin County Investigation:
Bulletin No. 146. California Department of Water Resources, Sacramento, California,
variously paged.
California Department of Water Resources, 2006, California‘s Groundwater, Bulletin
118, San Joaquin Valley Groundwater Basin, Eastern San Joaquin Sub-basin.
California Department of Water Resources, 2008. Morada Lane Stormwater Basin
Groundwater Monitoring Project San Joaquin County, California Memorandum Report.
California Department of Water Resources, Sacramento, California.
CDM, Inc., 2001. San Joaquin County Water Management Plan: Phase 1-Planning
Analysis and Strategy. Camp, Dresser, and McKee, Inc., Sacramento, Calif., variously
paged.
Clark, J. F., G.B. Hudson, M.L. Davisson, G. Woodside, and R. Herndon 2004.
Geochemical imaging of flow near an artificial recharge facility, Orange County, CA.
Ground Water Vol. 42: pp. 167-174.
City of Stockton, 2007. City of Stockton 2007 Drinking Water Quality Report.
City of Stockton, Municipal Utilities Department, p. 1
Condor Earth Technologies, 2003. WID Recharge Operations Report—2003 Operations
SJAFCA Detention Basin No. 2., 9 p.
Condor Earth Technologies, 2006. Detention Basin No. 2 2006 Recharge Operations
Report. City of Stockton Municipal Utilities Department, variously paged.

GAMA: Water Quality Changes during Groundwater Banking page 55
Cey, B., Hudson, G.B., Moran, J.E., and Scanlon, B.R. (2008) Impact of Artificial
Recharge on Dissolved Noble Gases in Groundwater in California, USA. Environ. Sci.
Technol. 42, 1017-1023.
Davisson, M.L., Hudson, G.B., Clark, J.F., Woodside, G., and Herndon, R. (2004) Final
report on isotope tracer investigations in the forebay of the Orange County groundwater
basin. UCRL-TR-201735.
Dzombak, D.A., and F.M.M. Morel, 1990. Surface Complexation Modeling – Hydrous
Ferric Oxide, John Wiley, New York, 393 p.
Ekwurzel, B., P. Schlosser, W.M. Smethie, L.N. Plummer, E. Busenberg, R.L. Michel, R.
Weppernig, and M. Stute, 1994. Dating of shallow groundwater – comparison of the
transient tracers H-3/He-3, chlorofluorocarbons, and Kr-85, Water Resources Research,
30, 1693-1708.
Gamlin, J. D., Clark, J. F., Woodside, G., and Herndon, R., 2001. Large-scale tracing of
ground water with sulfur hexafluoride. Journal Of Environmental Engineering-ASCE 27,
171-174.
Gao, S., R. Fujii, A. T. Chalmers, and K. K. Tanji, 2004. Evaluation of Adsorbed Arsenic
and Potential Contribution to Shallow Groundwater in Tulare Lake Bed Area, Tulare
Basin, California, Soil Science Society of America Journal, 68, 89-95.
Gao, S., S. Goldberg, M.J. Herbel, A.T. Chalmers, R. Fujii, and K.K. Tanji, 2006.
Sorption processes affecting arsenic solubility in oxidized surface, sediments from Tulare
Lake Bed, California, Chemical Geology, 228, 33–43.
Heilweil, V.M., D.K. Solomon, K.S. Perkins, and K.M. Ellett, 2004. Gas-partitioning
tracer test to quantify trapped gas during recharge. Ground Water Vol. 42, no. 4
Herndon, R.L., R.G. Woodside, M.L. Davisson, and G.B. Hudson, 2003. Use of isotopes
to estimate groundwater age and flow paths. Southwest Hydrology Vol. 2 no. 1: pp. 24-
25, & 36. http://www.swhydro.arizona.edu/archive/V2_N1/feature4.pdf
Izbicki, J.A., L.F. Metzger, K.R. McPherson, R.E. Everett, and G.L. Bennett, 2006.
Sources of High-Chloride Water to Wells, Eastern San Joaquin Ground-Water Subbasin,
California. U.S. Geological Survey Open File Report 2006-1309.
Izbicki, J.A., C.L. Stamos, L.F. Metzger, K.J. Halford, T.R. Kulp, and G.L. Bennett,
2008. Source, Distribution, and Management of Arsenic in Water from Wells, Eastern
San Joaquin Ground-Water Subbasin, California. U.S. Geological Survey Open-File
Report 2008-1272: 8 p.
Kana, T.M., C. Darkangelo, M.D. Hunt, J.B. Oldham, G.E. Bennett, and J.C. Cornwell, 1994.
Analytical Chemistry, 66, 4166-4170.

GAMA: Water Quality Changes during Groundwater Banking page 56
Manning, A., D.K. Solomon, and S.A. Thiros, 2005. 3H/3He age data in assessing the
susceptibility of wells to contamination. Ground Water, 43(3), 353–367.
Marchand, D.E., and A. Allwardt, 1981. Late Cenozoic stratigraphic units, northeastern San
Joaquin Valley, California, U.S. Geological Survey Bulletin 1470, 70 p.
McNab, W.W., M.J. Singleton, J.E. Moran, and B.K. Esser, 2009. Ion exchange and trace
element surface complexation reactions associated with applied recharge of low-TSD
water in the San Joaquin Valley, California. Applied Geochemistry Vol. 24: pp. 129-137.
Montgomery Watson Harza, 2006. Aquifer Test Work Plan. , Farmington Groundwater
Recharge Program, File 1511398.141802.
Moran, J.E. and Halliwell, M., 2003. Characterizing groundwater recharge: A comprehensive
isotopic approach. American Water Works Association, final report 90941, 199 pp.
Moran, J.E., G.B. Hudson, R.L. Leif, and G.F. Eaton, 2004. A contamination
vulnerability assessment for the Santa Clara and San Mateo County Groundwater Basins,
UCRL-TR-201929, 77pp.
Northeastern San Joaquin County Groundwater Banking Authority, 2004, Eastern San
Joaquin Basin groundwater management plan: Northeastern San Joaquin Groundwater
Banking Authority, Stockton, California, variously paged.
O‘Leary, D., Izbicki, J. A., Moran, J.E., Meeth, T. and Singleton, M.J. (in review)
Movement of water infiltrated from a recharge pond to wells. USGS report.
Parkhurst, D. L. and C.A.J. Appelo, 2002. User's Guide to PHREEQC (Version 2) – A
Computer Program for Speciation, Batch Reaction One-Dimensional Transport, and
Inverse Geochemical Calculations, U. S. Geological Survey Water-Resources
Investigations Report 99-4259.
Poreda, R. J., T.E. Cerling, and D.K. Solomon, 1998. Tritium and helium-isotopes as
hydrologic tracers in a shallow unconfined aquifer, Journal of Hydrology, 103, 1-9.
Quast, K.W., K. Lansey, R. Arnold, R. Bassett, and M. Rincon. 2006. Boron Isotopes as
an artificial tracer. Ground Water, Vol. 44, no. 3:pp. 453-466.
DOI: 10.1111/j.1745-6584.2006.00186.x
Rai, D., and J.M. Zachara, 1984. Chemical Attenuation Rates, Coefficients, and
Constants in Leachate Migration, Volume 1: A Critical Review, Electric Power Research
Institute, Palo Alto, California, EA-3356.
Smedley, P.L., and D.G. Kinniburgh, 2002. A review of the source, behaviour and
distribution of arsenic in natural waters, Applied Geochemistry, 17, 517–568.

GAMA: Water Quality Changes during Groundwater Banking page 57
Solomon, D. K, R.J. Poreda, S.L. Schiff, and J.A. Cherry, 1992. Tritium and He-3 as
groundwater age tracers in the Borden Aquifer, Water Resources Research, 28, 741-755.
Sposito, G., 1989. The Chemistry of Soils, Oxford University Press, New York, 304 p.
Wazne, M., G.P. Korfiatis, and X. Meng, 2003. Carbonate effects on hexavalent uranium
adsorption by iron oxyhydroxide, Environmental Science and Technology, 37(16), 3619-
3624.
Weissmann, G.S, Y. Zhang, E.M. LaBolle, and G.E. Fogg, 2002. Dispersion of
groundwater age in an alluvial aquifer system, Water Resources Research, 38.
Welch, A.H., Westjohn, D.B., Helsel, D.R., Wanty, R.B., 2000. Arsenic in ground water
of the United States: occurrence and geochemistry. Ground Water 38, 589–604.
Williams, L.E., M.O. Barnett, T.A. Kramer, and J.G. Melville, 2003. Adsorption and
transport of arsenic(V) in experimental subsurface systems, Journal of Environmental
Quality, 32, 841–850.
Zhang, H., and H.M. Selim, 2005. Kinetics of arsenate adsorption -desorption in soils,
Environmental Science and Technology, 39(16), 6101-6108.

California GAMA Program: Tracking Water Quality Changes During Groundwater Banking at Two Sites in San Joaquin County
Data Tables PageTable A-1: SEWD Water Quality Data A2Table A-2: SEWD Tracer Data A4Table A-3: SEWD Noble Gas & Tritium Data A9Table A-4: SEWD Organic Data A10Table A-5: Morada Water Quality Data A11Table A-6: Morada Tracer Data A12Table A-7: Morada Noble Gas & Tritium Data A16Table A-8: Morada Organic Data A17
Note: Multiple listings of an individual well in the following tables indicate that the well was sampled on more than one occasion (as indicated by sample date).I l t li t l lit
Appendix A, Data Tables
In select cases, replicate sample splits were run (as indicated by the same sample date and LLNL ID).

Table A-1: SEWD Water Quality Data
LLNL ID Site Location Sample Date Depth of well screen (ft)
Cl-
(mg/L)NO3
(mg/L)SO4 (mg/L)
Na (mg/L)
NH3 (mg/L)
K (mg/L) Mg (mg/L)
Mn Ca (mg/L)
As (ug/L)
U (ug/L) V (ug/L)
Dissolved CH4
(ccSTP/g)Excess N2 (as equiv. mg/L NO3-)
TIC (mg/L)
TOC (mg/L)
δ13C TIC (‰ VPDB)
d13C-TOC
3H pCi/L δ15N NO3-
(‰ Air) δ18O NO3
-
(‰ SMOW)
104267 SEWD 60Acre 08/22/2006 4.8 0.9 11.8 15.7 <0.1 2.0 7.0 7.2 7.6 0.12 46.1 2.0E-08 ND 17.9 0.8 -13.2 10.0 9.1 2.8104857 SEWD 60Acre 01/26/2007 2.6 <0.4 6.3 15.6 <0.1 1.9 4.4 6.9 11.1 0.9104868 SEWD 60Acre 01/30/2007 2.3 0.4 5.9 11.6 <0.1 1.5 2.2 5.3104879 SEWD 60Acre 02/05/2007 1.9 0.3 4.6 15.4 <0.1 2.0 5.8 7.1104906 SEWD 60Acre 02/12/2007 2.5 0.3 6.1 14.8 <0.01 2.0 4.5 9.0 1.2E-08 ND 13.8 0.2 -11.7 9.6104976 SEWD 60Acre 03/13/2007 3.3 0.4 7.7 14.7 < .01 2.1 4.3 8.9 1.8E-08 ND 14.6 0.7 -12.6 -11.6 13.6105288 SEWD 60Acre 05/30/2007 4.1 < 0.4 8.1105512 SEWD 60Acre 07/16/2007 4.1 < 0.4 6.8 1.5 0.01 1.2104271 SEWD 74-01 08/22/2006 210 10.4 6.0 19.6 21.3 < .01 6.4 15.1 33.3 6.2 1.73 18.9 2.4E-08 12.0 14.7 0.1 -14.8 11.8 3.6 -0.4105299 SEWD 74-01 05/31/2007 210 9.5 6.8 19.8 7.2 0.7105797 SEWD 74-01 08/22/2007 210 8.1 5.1 15.0 21.7 < 0.01 6.4 13.5 22.0 6.3 1.55 18.2 5.4 4.0106019 SEWD 74-01 11/02/2007 210 9.5 5.5 18.7 5.9 4.2104265 SEWD 74-02 08/22/2006 200 11.7 5.1 19.5 33.2 < .01 4.0 11.2 23.4 11.0 1.01 9.6 2.6E-08 7.9 45.0 0.4 -15.7 10.6 3.5 2.1105298 SEWD 74-02 05/31/2007 200 14.3 3.3 15.9 3.2 13.0105798 SEWD 74-02 08/22/2007 200 11.0 2.9 12.7 28.9 < 0.01 5.1 14.1 19.3 12.3 0.90 10.6 7.1 4.6106018 SEWD 74-02 11/02/2007 200 10.9 6.9 20.7 5.8 0.0104257 SEWD A4 08/21/2006 15.0 10.2 25.4 21.5 < .01 2.8 15.9 35.1 4.9 4.24 36.4 3.1E-08 7.6 33.9 0.3 -17.5 7.8 9.6 0.9105297 SEWD A4 05/31/2007 7.3 6.7 15.7 6.2 0.9105513 SEWD A4 07/16/2007 9.0 7.3 16.3 5.3 3.39 37.1 54.7 0.5 -17.7 -22.5 3.0 8.1104270 SEWD BZ 08/22/2006 298 15.7 12.9 29.4 3.6 4.00 22.6 3.0E-08 24.7 15.6 0.3 8.2 5.1 1.3104300 SEWD CN-1 08/23/2006 5.3 1.2 14.6 16.1 < .01 4.1 7.2 15.2 7.0 0.37 22.0 1.7E-08 7.7 26.8 0.4 -13.2 10.6 7.9 0.2105300 SEWD CN-1 05/31/2007 4.5 1.2 12.9 7.2 2.0105515 SEWD CN-1 07/16/2007 4.5 1.2 11.6 15.8 < 0.01 4.2 6.6 13.3 8.4 0.23 24.1 20.7 0.5 -13.5 -21.9 5.8 7.5106020 SEWD CN-1 11/02/2007 4.7 1.2 12.8 11.2 9.2 4.4104301 SEWD CWS-35 08/23/2006 7.3 3.0 13.2 7.2 0.72 23.4 2.2E-08 4.5 32.5 0.3 -13.6 11.2 8.3 2.0104305 SEWD Diversion Canal 08/23/2006 surface 3.9 <0.2 8.5 5.8 1.2 1.7 7.8 15.6 0.7 -0.06 2.2 1.7E-08 ND 11.9 2.8 -12.6105301 SEWD Diversion Canal 05/31/2007 surface 4.6 0.2 10.8 -2.7 11.6104256 SEWD MW-1A 08/21/2006 35 12.9 13.8 29.2 59.2 < .01 4.2 25.2 56.2 3.9 8.24 27.4 4.2E-08 ND 26.9 0.2 10.8 9.4 5.8105291 SEWD MW-1A 05/30/2007 35 11.0 10.7 31.2 9.8 2.4104255 SEWD MW-1B 08/21/2006 50 6.9 4.8 17.1 24.8 <0.01 2.0 9.9 20.9 5.8 2.35 43.8 2.5E-08 3.2 50.3 0.5 10.9105082 SEWD MW-1B 03/27/2007 50 5.4 3.5 13.3 40.5 < .01 2.4 11.7 25.7 2.4E-08 ND 47.2 0.7 -19.2 -22.7 18.6 7.9 1.1105292 SEWD MW-1B 05/30/2007 50 6.1 4.7 14.9 6.5 5.8104254 SEWD MW-1C 08/21/2006 77 3.3 0.8 8.5 15.3 <0.01 2.0 4.0 8.7 8.5 0.15 52.6 2.0E-08 8.3 21.0 0.4 -14.4 12.6 3.5 -1.6105083 SEWD MW-1C 03/27/2007 77 3.1 0.6 9.0 19.4 < .01 2.5 5.6 11.2 2.0E-08 ND 17.2 0.6 -13.8 -22.8 19.2 7.3 -2.2105293 SEWD MW-1C 05/30/2007 77 3.3 1.0 10.0 3.6E-08 ND 20.0 0.7 -13.2 -23.4 8.3 0.4104266 SEWD MW-2A 08/22/2006 29 25.4 17.4 23.8 39.8 < .01 2.5 12.7 27.0 4.5 1.88 38.2 2.3E-08 ND 43.6 0.8 11.3 4.5 3.6105287 SEWD MW-2A 05/30/2007 29 18.0 16.4 19.6 6.1 6.9105521 SEWD MW-2A 07/16/2007 29 23.5 22.7 20.7 5.6 1.91 40.6 8.3 6.2104260 SEWD MW-2B 08/22/2006 47 16.0 1.6 19.4 30.8 < .01 2.5 6.9 14.8 5.6 0.68 36.7 2.2E-08 ND 33.1 1.2 -13.4 12.5 9.8 9.1105286 SEWD MW-2B 05/30/2007 47 6.9 0.8 11.7 12.1 10.5104261 SEWD MW-2C 08/22/2006 65 6.2 0.4 11.8 23.3 <0.01 2.0 6.4 13.7 5.6 0.40 42.2 2.8E-08 0.9 28.2 0.5 -12.4 10.4 10.7 16.8105140 SEWD MW-2C 04/23/2007 65 4.7 < 0.4 9.8 23.8 < .01 2.1 7.0 14.2 2.3E-08 2.6 25.3 0.8 -13.7 -22.8 11.7105285 SEWD MW-2C 05/30/2007 65 5.2 0.4 11.5 3.2E-08 ND 24.7 1.0 -14.1 -23.3105520 SEWD MW-2C 07/16/2007 65 4.6 < 0.4 8.9 6.6 0.27 43.6104263 SEWD MW-3A 08/21/2006 30 4.5 2.6 15.8 22.4 < .01 2.4 6.4 14.3 6.5 0.54 43.3 1.7E-08 5.8 33.6 0.8 -13.3 11.5 0.9 7.2105296 SEWD MW-3A 05/30/2007 30 5.0 3.1 12.8 3.7 5.4105518 SEWD MW-3A 07/16/2007 30 5.0 1.8 11.0 8.3 0.21 56.1 22.7 0.7 -13.9 -23.9 4.8 8.3104259 SEWD MW-3B 08/21/2006 42 3.9 0.5 12.8 19.6 <0.01 2.5 4.6 10.9 7.0 0.29 40.5 2.2E-08 ND 25.9 1.0 -13.8 11.5104966 SEWD MW-3B 03/13/2007 42 2.4 1.6 5.8 19.8 < .01 2.4 5.0 11.3 2.2E-08 ND 18.3 0.8 -13.1 -17.7 18.2 3.7 9.0105295 SEWD MW-3B 05/30/2007 42 4.9 1.0 10.9 1.8 10.8105516 SEWD MW-3B 07/16/2007 42 5.7 0.7 11.5 9.6 0.14 61.8 19.3 0.8 -13.2 -24.2 0.4 2.7104258 SEWD MW-3C 08/21/2006 70 5.2 0.6 16.1 12.4 <0.01 1.3 2.3 5.0 9.2 0.16 50.8 1.9E-08 ND 21.2 0.9 -14.4 11.5105146 SEWD MW-3C 04/23/2007 70 1.5 0.3 3.8 19.6 < .01 2.1 3.7 7.8 2.0E-08 ND 16.7 0.7 -12.5 -23.1 10.7105294 SEWD MW-3C 05/30/2007 70 4.3 0.6 9.1 3.3E-08 ND 16.0 0.7 -12.9 -23.2 5.4 1.8105511 SEWD MW-3C 07/16/2007 70 5.2 0.6 10.5 12.0 0.07 66.9 16.7 0.7 -13.1 -23.9 5.6 5.1104303 SEWD MW-NW-1 08/23/2006 55 4.6 1.7 11.0 3.6 0.58 32.1 2.0E-08 ND 33.7 0.8 -13.9 9.4 4.9 2.5104272 SEWD North Pond (inflow) 08/22/2006 surface 2.8 <0.2 6.2 5.4 <0.1 1.1 7.6 12.8 0.4 <0.04 1.3 3.1E-08 ND 7.3 1.7 -12.7104845 SEWD Overflow Pond (near pipe) 01/22/2007 surface 4.6 <0.4 11.3 6.2 <0.1 1.3 11.8 15.4104861 SEWD Overflow Pond (near pipe) 01/26/2007 surface 5.2 <0.4 12.5104264 SEWD PZ-1 08/21/2006 40 3.0 0.3 8.6 7.1 <0.1 1.9 7.0 7.8 6.6 0.10 43.1 1.8E-08 ND 17.8 1.0 -12.7 9.5 18.6 16.7104856 SEWD PZ-1 01/26/2007 40 2.0 0.5 4.5 6.9 <0.1 1.6 4.2 6.9 6.9 -1.7104867 SEWD PZ-1 01/30/2007 40 1.8 0.3 4.2 6.6 <0.1 1.6 2.9 7.4 6.6 -1.5104878 SEWD PZ-1 02/05/2007 40 1.8 0.4 4.5 6.9 <0.01 1.7 4.4 9.2104961 SEWD PZ-1 03/13/2007 40 4.1 0.4 9.0 8.0 < .01 2.1 8.1 16.5 1.8E-08 ND 10.3 0.8 -11.7 -19.7 12.4105290 SEWD PZ-1 05/30/2007 40 3.9 0.8 10.8 -2.5 28.3105517 SEWD PZ-1 07/16/2007 40 2.0 0.7 5.9 7.4 0.05 45.6 13.3 0.7 -11.9 -23.2 2.7 -4.4104273 SEWD South Pond 08/22/2006 surface 0.9 <0.2 2.5 5.6 <0.1 1.2 7.6 12.7 0.4 <0.06 0.9 1.4E-08 ND 6.6 1.9 -7.4104844 SEWD South Pond 01/22/2007 surface 4.6 <0.4 11.1 5.8 <0.1 1.1 8.6 14.1
GAMA: Water Quality Changes during Groundwater Banking, Appendix A: Data Tables Page A2

Table A-1: SEWD Water Quality Data
LLNL ID Site Location Sample Date Depth of well screen (ft)
Cl-
(mg/L)NO3
(mg/L)SO4 (mg/L)
Na (mg/L)
NH3 (mg/L)
K (mg/L) Mg (mg/L)
Mn Ca (mg/L)
As (ug/L)
U (ug/L) V (ug/L)
Dissolved CH4
(ccSTP/g)Excess N2 (as equiv. mg/L NO3-)
TIC (mg/L)
TOC (mg/L)
δ13C TIC (‰ VPDB)
d13C-TOC
3H pCi/L δ15N NO3-
(‰ Air) δ18O NO3
-
(‰ SMOW)
104846 SEWD South Pond 01/22/2007 surface 4.9 <0.4 12.0 5.6 <0.1 1.2 7.8 13.0104847 SEWD South Pond 01/22/2007 surface 4.7 <0.4 11.4 5.5 <0.1 1.1 7.8 12.6104848 SEWD South Pond 01/22/2007 surface 4.5 <0.4 10.9 5.9 <0.1 1.3 10.6 13.6104858 SEWD South Pond 01/26/2007 surface 4.9 <0.4 11.3 5.8 <0.1 1.2 10.3 13.6104859 SEWD South Pond 01/26/2007 surface 4.8 <0.4 11.3 6.1 <0.1 1.2 11.5 15.0104860 SEWD South Pond 01/26/2007 surface 5.1 <0.4 12.3 6.2 <0.1 1.2 12.1 15.6104862 SEWD South Pond 01/26/2007 surface 5.2 <0.4 12.5 4.1 <0.1 0.8 3.9 10.3104880 SEWD South Pond 02/05/2007 surface 3.8 < 0.1 9.1 4.1 <0.1 0.9 3.8 10.5104881 SEWD South Pond 02/05/2007 surface 3.6 < 0.1 8.7 6.2 <0.1 1.3 5.8 15.2104882 SEWD South Pond 02/06/2007 surface 5.3 < 0.1 13.0 6.3 <0.1 1.4 5.4 14.4104883 SEWD South Pond 02/06/2007 surface 5.2 < 0.1 12.8 6.2 <0.1 1.2 5.4 14.6104884 SEWD South Pond 02/06/2007 surface 5.2 < 0.1 12.8 8.2 <0.01 1.5 8.2 16.2104969 SEWD South Pond 03/13/2007 surface 7.6 0.2 17.5 3.1 < .01 0.7 2.2 5.7 2.1E-08 ND 15.1 3.6 -10.6 -24.0 15.6105289 SEWD South Pond 05/30/2007 surface 2.1 < 0.4 6.2105519 SEWD South Pond 07/16/2007 surface 2.1 < 0.4 5.1 0.6 0.01 3.6 4.7 3.9 -5.7 -25.8104302 SEWD T-3 08/23/2006 19.5 12.7 31.7 4.2 2.73 36.4 2.4E-08 ND 59.9 0.5 -15.1 11.0 7.3 2.4105514 SEWD T-3 07/16/2007 12.6 8.1 18.2 4.5 2.59 34.6 56.0 0.7 -16.3 -29.7 6.0 2.4
GAMA: Water Quality Changes during Groundwater Banking, Appendix A: Data Tables Page A3

Table A-2: SEWD Tracer Data
LLNL ID Site Location Sample Date δ18O H2O (‰ VSMOW)
δ2H H2O (‰ VSMOW)
SF6 (ppb in headspace)
Conductivity (uS/cm)
pH ORP Temperature (°C)
DO (mg/L)
104267 SEWD 60Acre 08/22/2006 -9.9 -73.3 228 6.7 -8 20.8 2.3104857 SEWD 60Acre 01/26/2007 -10.5 -75.3 5.5E-03 194 7.4 321 14.0104868 SEWD 60Acre 01/30/2007 -10.5 -75.8 7.5E-04 189 7.4 320 17.1 1.8104879 SEWD 60Acre 02/05/2007 -10.5 -75.6 2.4E-01104906 SEWD 60Acre 02/12/2007 -10.3 -73.0 6.8E+00 186 7.6 356 16.0 0.2104924 SEWD 60Acre 02/21/2007 -10.3 4.8E+01 193 7.5 366 14.8104950 SEWD 60Acre 03/02/2007 -10.3 9.6E+01 192 7.6 305 13.2104976 SEWD 60Acre 03/13/2007 -10.2 -72.9 1.0E+02 206 7.5 277 15.0 0.3105090 SEWD 60Acre 03/28/2007 -9.8 -69.0 8.0E+01 214 7.0 341 12.9 2.3105142 SEWD 60Acre 04/23/2007 -9.4 -67.2 4.8E+01 240 7.5 283 16.3 1.8105288 SEWD 60Acre 05/30/2007 -10.1 -72.4 4.2E+01 207 7.7 247 20.2 0.2105512 SEWD 60Acre 07/16/2007 -9.9 -71.6 2.8E+01 217 7.9 177 23.4 4.3104271 SEWD 74-01 08/22/2006 -8.0 -54.5 512 6.7 83 19.1 5.7105086 SEWD 74-01 03/26/2007 -8.3 -59.2 5.1E-04105153 SEWD 74-01 04/24/2007 -7.7 -55.7 1.5E-03 515 7.5 278 18.9 6.4105299 SEWD 74-01 05/31/2007 -7.9 -53.9 2.1E-02 527 7.4 265 18.2 4.1105383 SEWD 74-01 06/12/2007 -8.0 -56.4 5.7E-04105797 SEWD 74-01 08/22/2007 -7.9 547 7.3 217 18.5 3.8105892 SEWD 74-01 08/31/2007 -8.2105894 SEWD 74-01 09/06/2007 -8.1106021 SEWD 74-01 09/11/2007 -8.2 -56.9 2.5E-04106019 SEWD 74-01 11/02/2007 -8.1 -57.2 4.9E-04 364 7.1 258 18.2 3.8104265 SEWD 74-02 08/22/2006 -8.3 -59.7 419 6.8 72 19.9 5.6105152 SEWD 74-02 04/24/2007 -8.4 -61.8 5.9E-04 548 7.5 259 18.4 5.8105298 SEWD 74-02 05/31/2007 -8.3 -57.8 1.4E-03 481 7.6 243 17.8 4.5105384 SEWD 74-02 06/12/2007 -8.4 -59.4 4.4E-04105798 SEWD 74-02 08/22/2007 -8.3 490 7.4 221 18.6 5.9105893 SEWD 74-02 08/31/2007 -8.6105895 SEWD 74-02 09/06/2007 -8.6106022 SEWD 74-02 09/11/2007 -8.3 -58.7 2.7E-04106018 SEWD 74-02 11/02/2007 -8.6 -60.9 6.5E-04 398 7.1 274 20.0 3.5104257 SEWD A4 08/21/2006 -8.9 -64.7 751 6.7 53 20.0 5.0105084 SEWD A4 03/27/2007 -8.9 -65.1 3.2E-04 747 7.2 146 18.9 4.6105151 SEWD A4 04/24/2007 -9.0 -59.8 2.2E-03 671 7.3 204 19.8 3.9105297 SEWD A4 05/31/2007 -9.1 -64.1 3.0E-03 720 7.4 275 19.3 3.9105513 SEWD A4 07/16/2007 -9.0 -64.4 1.1E-02 706 7.1 288 20.2 5.0104270 SEWD BZ 08/22/2006 -8.3 -58.7 720 6.7 71 20.7 8.0104300 SEWD CN-1 08/23/2006 -9.1 -67.3 321 6.7 114 17.6 3.1104959 SEWD CN-1 03/02/2007 -9.6 8.0E-04104975 SEWD CN-1 03/13/2007 -9.5 -69.1 8.6E-04 305 7.5 268 18.2 0.8105080 SEWD CN-1 03/27/2007 -9.5 -68.9 3.7E-04 313 7.4 302 17.1 2.6105143 SEWD CN-1 04/23/2007 -9.5 -68.8 3.5E-03 300 7.5 283 17.8 2.2105300 SEWD CN-1 05/31/2007 -9.6 -70.9 9.0E-04 293 7.6 284 18.1 1.4
GAMA: Water Quality Changes during Groundwater Banking, Appendix A: Data Tables Page A4

Table A-2: SEWD Tracer Data
LLNL ID Site Location Sample Date δ18O H2O (‰ VSMOW)
δ2H H2O (‰ VSMOW)
SF6 (ppb in headspace)
Conductivity (uS/cm)
pH ORP Temperature (°C)
DO (mg/L)
105515 SEWD CN-1 07/16/2007 -9.5 -68.0 3.3E-02 310 7.5 283 17.9 2.3105796 SEWD CN-1 08/22/2007 -9.8 3.8E-01 299 7.4 170 17.7 2.3106020 SEWD CN-1 11/02/2007 -9.7 -71.7 3.3E-01 216 7.3 274 18.1 2.0104301 SEWD CWS-35 08/23/2006 -8.1 -56.6 380 6.8 688 18.8 7.1104305 SEWD Diversion Canal 08/23/2006 -8.9 -59.4 196 7.4 216 22.2 12.0104977 SEWD Diversion Canal 03/13/2007 -7.8 -52.9 3.0E-03105095 SEWD Diversion Canal 03/28/2007 -7.0 -49.3 5.7E-04105301 SEWD Diversion Canal 05/31/2007 -7.6 -52.5 3.2E-04 243 8.4 225 24.9 8.1104256 SEWD MW-1A 08/21/2006 -9.0 -64.9 940 6.7 63 21.3 5.1104910 SEWD MW-1A 02/12/2007 -8.9 -61.3 6.8E-03 972 7.0 338 18.8 2.4104928 SEWD MW-1A 02/21/2007 -8.9 1.9E-02 892 7.1 355 19.1 2.7104953 SEWD MW-1A 03/02/2007 -9.2 5.8E-02 896 7.1 348 19.4 3.2104972 SEWD MW-1A 03/13/2007 -9.2 -66.0 1.3E-02 921 7.0 243 21.0 3.5105081 SEWD MW-1A 03/27/2007 -9.1 -65.4 8.5E-04 905 6.9 274 19.1 4.5105148 SEWD MW-1A 04/24/2007 -9.2 -68.2 4.6E-03 851 7.0 386 20.0 4.8105291 SEWD MW-1A 05/30/2007 -9.1 -64.1 2.0E-02 900 7.0 282 20.6 1.1104255 SEWD MW-1B 08/21/2006 -9.7 -71.4 569 6.7 95 19.8 3.6104911 SEWD MW-1B 02/12/2007 -9.9 -71.0 4.0E-03 655 7.3 332 18.1 1.4104929 SEWD MW-1B 02/21/2007 -9.8 9.3E-03 608 7.4 338 18.6 2.0104954 SEWD MW-1B 03/02/2007 -10.0 3.5E-02 583 7.4 337 19.0 2.8104973 SEWD MW-1B 03/13/2007 -10.0 -69.0 5.8E-03 593 7.3 274 20.0 1.9105082 SEWD MW-1B 03/27/2007 -9.9 -72.1 1.3E-03 607 7.2 278 18.9 3.8105149 SEWD MW-1B 04/24/2007 -9.7 -68.4 3.7E-03 607 7.3 286 19.7 3.6105292 SEWD MW-1B 05/30/2007 -9.7 -69.1 1.2E-02 634 7.4 285 19.8 3.2104254 SEWD MW-1C 08/21/2006 -10.2 -72.3 240 6.4 120 19.5 2.9104955 SEWD MW-1C 03/02/2007 -10.4 3.6E-02 240 7.6 278 19.2 2.6104974 SEWD MW-1C 03/13/2007 -10.4 -72.9 5.8E-03 247 7.6 232 20.2 2.8105083 SEWD MW-1C 03/27/2007 -9.7 -68.0 7.8E-04 248 7.4 266 18.4 3.2105150 SEWD MW-1C 04/24/2007 -9.8 -59.8 2.0E-03 247 7.5 309 19.9 2.9105293 SEWD MW-1C 05/30/2007 -9.7 -69.2 1.7E-02 261 7.7 266 20.4 2.3104266 SEWD MW-2A 08/22/2006 -9.2 -68.0 639 6.6 88 20.3 7.5104951 SEWD MW-2A 03/02/2007 -9.1 3.7E+00 560 7.4 330 17.9 0.9104963 SEWD MW-2A 03/13/2007 -8.9 3.8E-01 648 7.2 342 19.4 3.6105087 SEWD MW-2A 03/28/2007 -8.9 -65.7 8.6E-03 623 7.0 385 18.2 3.6105139 SEWD MW-2A 04/23/2007 -9.3 -64.8 1.4E-04 550 7.3 314 19.5 2.4105287 SEWD MW-2A 05/30/2007 -9.2 -67.7 1.1E-01 582 7.5 244 19.4 3.6105521 SEWD MW-2A 07/16/2007 -9.2 -66.8 8.2E-03 653 7.2 280 19.5 4.6104260 SEWD MW-2B 08/22/2006 -9.1 -67.8 458 7.0 101 19.7 3.1104952 SEWD MW-2B 03/02/2007 -9.3 3.8E+00 397 8.3 295 18.5104965 SEWD MW-2B 03/13/2007 -9.3 -69.0 1.3E-01 403 7.9 305 19.5105088 SEWD MW-2B 03/28/2007 -9.3 -67.2 9.8E-03 389 7.8 338 18.4 1.0105141 SEWD MW-2B 04/23/2007 -9.4 -68.6 1.1E-03 381 8.0 269 19.5 1.3105286 SEWD MW-2B 05/30/2007 -9.8 -71.2 6.6E-03 359 8.0 220 19.1 1.6
GAMA: Water Quality Changes during Groundwater Banking, Appendix A: Data Tables Page A5

Table A-2: SEWD Tracer Data
LLNL ID Site Location Sample Date δ18O H2O (‰ VSMOW)
δ2H H2O (‰ VSMOW)
SF6 (ppb in headspace)
Conductivity (uS/cm)
pH ORP Temperature (°C)
DO (mg/L)
104261 SEWD MW-2C 08/22/2006 -8.6 -62.7 329 6.7 110 19.0 2.6104964 SEWD MW-2C 03/13/2007 -9.2 -68.0 1.5E-01 340 7.4 322 19.0105089 SEWD MW-2C 03/28/2007 -9.2 -68.7 3.7E-03 321 7.2 323 17.9 1.4105140 SEWD MW-2C 04/23/2007 -9.4 -67.1 2.7E-04 338 7.5 284 19.4 0.9105285 SEWD MW-2C 05/30/2007 -9.7 -71.9 1.8E-03 323 7.4 202 18.6 0.2105520 SEWD MW-2C 07/16/2007 -9.8 -71.4 2.0E-01 319 7.3 267 19.5 3.3104263 SEWD MW-3A 08/21/2006 -8.5 -61.9 454 7.0 53 19.2 4.3104909 SEWD MW-3A 02/12/2007 -9.9 -75.4 1.7E-02 421 7.5 312 20.1 1.0104927 SEWD MW-3A 02/21/2007 -10.4 5.0E+00 279 7.6 327 20.9104956 SEWD MW-3A 03/02/2007 -10.2 3.3E-02 291 7.5 318 21.4 0.7104967 SEWD MW-3A 03/13/2007 -10.3 -74.0 6.8E-02 367 7.5 308 22.1 2.0105077 SEWD MW-3A 03/27/2007 -9.8 -72.8 8.8E-02 456 7.4 325 20.8 3.4105144 SEWD MW-3A 04/23/2007 -9.9 -70.2 8.7E-01 301 7.5 269 23.2 4.3105296 SEWD MW-3A 05/30/2007 -9.5 -67.3 4.3E+00 403 7.5 265 23.1 3.9105518 SEWD MW-3A 07/16/2007 -9.3 -66.1 1.1E+01 375 7.5 286 22.0 3.8104259 SEWD MW-3B 08/21/2006 -8.3 -60.7 303 6.9 7 17.9 2.5104908 SEWD MW-3B 02/12/2007 -10.5 -77.7 2.4E-02 252 7.6 295 21.0104926 SEWD MW-3B 02/21/2007 -10.5 4.9E+00 252 7.6 330 20.6104957 SEWD MW-3B 03/02/2007 -10.3 3.0E-02 241 7.4 318 21.0104966 SEWD MW-3B 03/13/2007 -10.7 -79.0 5.5E-02 251 7.6 287 22.2 1.0105078 SEWD MW-3B 03/27/2007 -9.1 -66.4 1.1E-01 324 7.3 300 21.1 2.4105145 SEWD MW-3B 04/23/2007 -10.2 -74.3 7.7E-01 272 7.3 293 23.2 2.5105295 SEWD MW-3B 05/30/2007 -10.0 -70.7 6.8E+00 268 7.4 283 23.7 3.4105516 SEWD MW-3B 07/16/2007 -9.8 -69.1 2.8E+01 290 7.5 293 22.3 3.3104258 SEWD MW-3C 08/21/2006 -7.9 -53.3 271 6.8 103 18.7 4.5104925 SEWD MW-3C 02/21/2007 -10.6 4.0E+00 218 7.7 345 18.7104958 SEWD MW-3C 03/02/2007 -10.8 1.8E-02 201 7.6 316 18.7 0.8104968 SEWD MW-3C 03/13/2007 -11.0 -78.0 2.1E-02 205 7.6 294 19.9105079 SEWD MW-3C 03/27/2007 -10.8 -78.2 1.1E-02 210 7.6 295 19.2 2.6105146 SEWD MW-3C 04/23/2007 -11.0 -80.0 9.0E-01 210 7.5 304 20.9 1.5105294 SEWD MW-3C 05/30/2007 -10.9 -76.9 3.1E+01 227 7.4 291 22.2 2.0105511 SEWD MW-3C 07/16/2007 -10.4 -72.9 6.2E+01 261 7.6 311 21.7 1.9104303 SEWD MW-NW-1 08/23/2006 -8.5 -58.5 374 6.8 298 19.0 5.8104272 SEWD North Pond (inflow) 08/22/2006 -11.2 -80.6 99 6.9 77 24.5 11.7104845 SEWD Overflow Pond (near pipe) 01/22/2007 -9.0 -61.9 1.2E+02 197 7.5 273 8.5 2.9104861 SEWD Overflow Pond (near pipe) 01/26/2007 -8.2 -55.1 5.4E+02 221 8.1 265 8.4 9.1104920 SEWD Overflow Pond (near pipe) 02/21/2007 -7.4 6.5E-02104947 SEWD Overflow Pond (near pipe) 03/02/2007 -7.6 4.8E-02 255 8.0 298 10.8 9.2104970 SEWD Overflow Pond (near pipe) 03/13/2007 -7.4 -51.0 1.1E-02105156 SEWD Overflow Pond (near pipe) 04/24/2007 -11.0 -79.1 1.5E-03104264 SEWD PZ-1 08/21/2006 -9.8 -69.9 208 7.0 -13 18.3 1.2104856 SEWD PZ-1 01/26/2007 -11.4 -78.8 5.2E-03 150 7.2 324 19.7 3.1104867 SEWD PZ-1 01/30/2007 -11.4 -80.5 1.5E-03 147 7.0 340 19.1 3.8
GAMA: Water Quality Changes during Groundwater Banking, Appendix A: Data Tables Page A6

Table A-2: SEWD Tracer Data
LLNL ID Site Location Sample Date δ18O H2O (‰ VSMOW)
δ2H H2O (‰ VSMOW)
SF6 (ppb in headspace)
Conductivity (uS/cm)
pH ORP Temperature (°C)
DO (mg/L)
104878 SEWD PZ-1 02/05/2007 -11.4 -80.5 1.2E-03104903 SEWD PZ-1 02/12/2007 -11.2 -81.0 7.1E+00 145 7.6 368 19.3 3.8104923 SEWD PZ-1 02/21/2007 -11.4 1.0E+01 153 7.5 377 18.4 3.9104944 SEWD PZ-1 03/02/2007 -11.5 5.0E+01 151 7.2 425 16.9 4.2104961 SEWD PZ-1 03/13/2007 -11.2 1.4E+02 163 7.4 359 16.9 4.5105085 SEWD PZ-1 03/27/2007 -10.2 -73.5 1.6E+02 197 7.5 245 14.8 5.1105147 SEWD PZ-1 04/23/2007 -8.6 -61.9 5.0E+01 251 7.5 334 13.0 4.4105290 SEWD PZ-1 05/30/2007 -8.0 -56.2 1.7E+01 256 7.3 280 14.5 1.8105517 SEWD PZ-1 07/16/2007 -10.5 -76.9 6.0E+00 198 7.5 261 18.4 1.4104273 SEWD South Pond 08/22/2006 -11.7 -83.4 80 7.1 76 22.5 11.7104840 SEWD South Pond 01/17/2007 -9.2 -65.5 1.4E-03 184 7.3 365 7.4 4.2104841 SEWD South Pond 01/17/2007 8.6E-04104844 SEWD South Pond 01/22/2007 -8.8 -64.9 1.9E+02 201 7.3 301 8.2 2.7104846 SEWD South Pond 01/22/2007 -8.5 -57.6 1.3E+02 218 7.6 286 8.0 3.1104847 SEWD South Pond 01/22/2007 -8.6 -165.1 4.1E+02 203 7.8 275 9.6 4.2104848 SEWD South Pond 01/22/2007 -9.1 -62.8 2.1E+02 199 7.8 271 7.9 3.5104858 SEWD South Pond 01/26/2007 -8.5 -60.8 2.6E+02 208 7.5 325 8.8 9.4104859 SEWD South Pond 01/26/2007 -8.7 -60.4 2.8E+02 205 7.9 282 7.8 10.1104860 SEWD South Pond 01/26/2007 -8.5 -58.5 8.4E+02 220 8.0 272 8.5 9.6104862 SEWD South Pond 01/26/2007 -8.1 -56.1 1.2E+03 229 8.1 264 8.3 9.7104880 SEWD South Pond 02/05/2007 -8.0 -55.7 3.7E+02104881 SEWD South Pond 02/05/2007 -8.0 -53.7 3.6E+01104882 SEWD South Pond 02/06/2007 -7.9 -56.4 7.6E+01104883 SEWD South Pond 02/06/2007 -7.9 -56.1 2.4E+02104884 SEWD South Pond 02/06/2007 -8.0 -57.8 2.5E+02104902 SEWD South Pond 02/12/2007 -7.8 -56.0 2.4E+00 237 8.1 319 14.3 10.5104904 SEWD South Pond 02/12/2007 -7.7 -55.5 2.1E+00 227 7.9 270 14.5 10.4104905 SEWD South Pond 02/12/2007 -7.8 -54.7 1.4E+00 229 8.0 293 13.8 9.8104907 SEWD South Pond 02/12/2007 -7.7 -54.4 8.4E+00 211 7.9 323 17.1 9.6104918 SEWD South Pond 02/21/2007 -7.7 -51.9 1.5E-01104919 SEWD South Pond 02/21/2007 -7.6 1.9E-01104921 SEWD South Pond 02/21/2007 -7.6 2.7E-01104922 SEWD South Pond 02/21/2007 -7.6 2.6E-01104945 SEWD South Pond 03/02/2007 -7.7 1.1E-01 258 7.4 372 11.1 11.1104946 SEWD South Pond 03/02/2007 -7.7 8.5E-02 268 7.6 297 11.7 9.9104948 SEWD South Pond 03/02/2007 -7.6 8.3E-02 252 7.9 300 10.4 9.0104949 SEWD South Pond 03/02/2007 -7.6 8.3E-02 257 7.2 292 11.3 8.5104960 SEWD South Pond 03/13/2007 -7.3 2.1E-02104962 SEWD South Pond 03/13/2007 -7.7 2.8E-02104969 SEWD South Pond 03/13/2007 -7.5 -48.0 2.0E-02 270 8.6 224 20.8 12.6104971 SEWD South Pond 03/13/2007 -7.3 -50.0 3.7E-02105091 SEWD South Pond 03/28/2007 -6.6 -45.5 2.7E-02 0.0105092 SEWD South Pond 03/28/2007 -7.4 -54.9 3.4E-03 252 8.0 293 14.1 9.3
GAMA: Water Quality Changes during Groundwater Banking, Appendix A: Data Tables Page A7

Table A-2: SEWD Tracer Data
LLNL ID Site Location Sample Date δ18O H2O (‰ VSMOW)
δ2H H2O (‰ VSMOW)
SF6 (ppb in headspace)
Conductivity (uS/cm)
pH ORP Temperature (°C)
DO (mg/L)
105093 SEWD South Pond 03/28/2007 -7.3 -53.0 1.8E-02105094 SEWD South Pond 03/28/2007 -7.3 -50.8 4.8E-03105154 SEWD South Pond 04/24/2007 -10.9 -80.1 1.9E-02 0105155 SEWD South Pond 04/24/2007 -11.0 -79.0 5.2E-03105157 SEWD South Pond 04/24/2007 -11.2 -80.1 3.8E-03 101 7.6 296 20.7 8.1105158 SEWD South Pond 04/24/2007 -10.6 -78.5 3.5E-03105289 SEWD South Pond 05/30/2007 -11.1 -82.9 91 7.2 294 22.6 6.5105519 SEWD South Pond 07/16/2007 -11.2 -80.4 100 8.3 248 25.3 11.2104839 SEWD South Pond 01/17/2007 -9.0 -63.2 1.6E-03 210 7.1 370 6.1 5.3104302 SEWD T-3 08/23/2006 -8.0 -61.8 729 6.8 340 19.1 7.1105514 SEWD T-3 07/16/2007 -8.7 -62.0 1.0E-02 804 7.3 288 19.2 7.3
GAMA: Water Quality Changes during Groundwater Banking, Appendix A: Data Tables Page A8

Table A-3: SEWD Noble Gas and Tritium Data
LLNL ID Site ion Sample Date 4He (cc STP/g)
Ne (cc STP/g) Ar (cc STP/g) Kr (cc STP/g) Xe (cc STP/g) 3H pCi/L +/- 3He/4He +/- Excess Air (cc STP/g)
+/- Radiogenic 4He (cc STP/g)
Radiogenic 4He error (cc STP/g)
3H-3He age (yr)
3H-3He age error (yr)
Percent Premodern
Recharge Temp. from Xe (deg C)
Recharge Temp. from
Xe error (deg C)
104267 SEWD 60ACRE 8/21/2006 5.97E-08 2.44E-07 3.42E-04 7.32E-08 9.55E-09 10.03 0.47 1.37E-06 1.03E-08 0.0028 0.0003 0.00E+00 1.23E-09 0.2 1.0 24% 21.0 1.1104271 SEWD 74-01 8/21/2006 1.35E-07 4.90E-07 5.13E-04 9.63E-08 1.22E-08 11.81 0.52 1.63E-06 1.22E-08 0.0163 0.0005 4.52E-09 2.61E-09 30.1 1.7 84% 18.0 2.6104265 SEWD 74-02 8/21/2006 1.60E-07 4.38E-07 4.99E-04 9.55E-08 1.20E-08 10.58 0.48 1.68E-06 1.26E-08 0.0134 0.0005 4.55E-08 2.47E-09 47.8 1.0 98% 17.5 2.2104257 SEWD A4 8/20/2006 9.76E-08 3.86E-07 4.54E-04 9.03E-08 1.14E-08 7.78 0.60 1.36E-06 1.02E-08 0.0106 0.0004 0.00E+00 2.02E-09 0.0 4.0 41% 18.3 1.9104270 SEWD BZ 8/21/2006 1.41E-07 5.11E-07 5.15E-04 9.71E-08 1.20E-08 8.24 0.45 1.47E-06 1.10E-08 0.0174 0.0006 4.79E-09 2.73E-09 25.1 2.0 82% 19.1 2.8104300 SEWD CN-1 8/22/2006 9.36E-08 3.73E-07 4.24E-04 8.48E-08 1.10E-08 10.61 0.48 1.44E-06 1.08E-08 0.0099 0.0004 0.00E+00 1.96E-09 9.6 1.0 27% 19.2 1.8104301 SEWD CWS-35 8/22/2006 9.95E-08 3.65E-07 4.37E-04 8.85E-08 1.12E-08 11.24 1.03 1.90E-06 1.42E-08 0.0094 0.0004 4.71E-09 1.90E-09 36.5 1.7 92% 18.2 1.7104256 SEWD MW-1A 8/20/2006 4.78E-08 2.08E-07 3.41E-04 7.37E-08 9.83E-09 10.79 0.52 1.36E-06 1.02E-08 0.0008 0.0002 0.00E+00 1.01E-09 0.0 1.0 18% 19.1 1.0104255 SEWD MW-1B 8/20/2006 1.00E-07 4.04E-07 4.56E-04 8.83E-08 1.10E-08 10.87 0.49 1.34E-06 1.01E-08 0.0117 0.0004 0.00E+00 2.14E-09 0.0 4.0 18% 21.2 2.2104255 SEWD MW-1B 8/20/2006 1.00E-07 4.04E-07 4.56E-04 8.83E-08 1.10E-08 10.50 1.00 1.36E-06 1.02E-08 0.0119 0.0004 0.00E+00 2.13E-09 0.0 3.0 20% 20.2 2.2104254 SEWD MW-1C 8/20/2006 8.92E-08 3.40E-07 3.77E-04 7.76E-08 1.03E-08 12.64 0.57 1.37E-06 1.03E-08 0.0083 0.0004 0.00E+00 1.79E-09 0.0 2.0 4% 20.9 1.7104266 SEWD MW-2A 8/21/2006 4.82E-08 3.38E-07 3.73E-04 7.43E-08 9.72E-09 11.26 0.56 1.38E-06 1.04E-08 0.0079 0.0004 0.00E+00 1.96E-09 0.3 2.0 14% 22.9 1.7104260 SEWD MW-2B 8/21/2006 5.61E-08 2.52E-07 3.69E-04 7.62E-08 1.07E-08 12.46 0.62 1.37E-06 1.03E-08 0.0032 0.0003 0.00E+00 1.26E-09 0.0 1.0 6% 17.2 1.1104261 SEWD MW-2C 8/21/2006 9.64E-08 4.09E-07 4.45E-04 8.69E-08 1.10E-08 10.42 0.50 1.39E-06 1.04E-08 0.0115 0.0005 0.00E+00 2.18E-09 2.6 2.0 19% 19.7 2.1104263 SEWD MW-3A 8/21/2006 6.92E-08 2.87E-07 3.37E-04 7.10E-08 9.36E-09 11.46 0.56 1.36E-06 1.02E-08 0.0051 0.0003 0.00E+00 1.50E-09 0.0 2.0 13% 22.9 1.4104259 SEWD MW-3B 8/21/2006 6.53E-08 2.65E-07 3.27E-04 6.83E-08 9.00E-09 11.49 0.65 1.39E-06 1.04E-08 0.0039 0.0003 0.00E+00 1.37E-09 1.9 1.0 11% 23.7 1.3104258 SEWD MW-3C 8/20/2006 5.84E-08 2.45E-07 3.31E-04 7.15E-08 9.53E-09 11.47 0.57 1.36E-06 1.02E-08 0.0030 0.0003 0.00E+00 1.25E-09 0.0 1.0 13% 21.2 1.1104303 SEWD MW-NW-1 8/22/2006 6.37E-08 2.76E-07 4.31E-04 9.09E-08 1.20E-08 9.41 0.45 1.37E-06 1.03E-08 0.0045 0.0003 0.00E+00 1.36E-09 -0.1 2.0 29% bad fit na104303 SEWD MW-NW-1 8/23/2006 6.37E-08 2.76E-07 4.31E-04 9.09E-08 1.20E-08 9.00 1.00 1.36E-06 1.02E-08 0.0095 0.0004 0.00E+00 1.85E-09 0.0 3.0 32% bad fit na104264 SEWD PZ-1 8/20/2006 4.75E-08 1.98E-07 2.86E-04 6.04E-08 7.93E-09 9.52 0.51 1.39E-06 1.04E-08 0.0002 0.0002 0.00E+00 9.95E-10 2.5 1.0 26% bad fit na104264 SEWD PZ-1 8/21/2006 4.75E-08 1.98E-07 2.86E-04 6.04E-08 7.93E-09 9.00 1.00 1.37E-06 1.02E-08 0.0017 0.0002 0.00E+00 1.12E-09 -0.4 1.0 32% 23.0 1.1104302 SEWD T-3 8/22/2006 7.50E-08 3.22E-07 4.14E-04 8.54E-08 1.13E-08 10.99 0.84 1.39E-06 1.05E-08 0.0070 0.0004 0.00E+00 1.66E-09 3.0 1.0 14% 17.0 1.4
GAMA: Water Quality Changes during Groundwater Banking, Appendix A: Data Tables Page A9

Table A-4: SEWD Organic Data
LLNL ID Site Location Sample Date TOC (mg/L)
Dichloro methane
(ng/L)
MtBE (ng/L) Chloroform (ng/L)
1_2_Dichloro propane (ng/L)
Bromodichloro methane (ng/L)
Toluene (ng/L)
Tetrachloro ethene (ng/L)
Dibromochloro methane (ng/L)
Bromoform (ng/L)
DEET (ng/L)
Triclosan (ng/L)
Triphenyl phosphate
(ng/L)
Norflurazon (ng/L)
Simazine (ng/L)
104267 SEWD 60Acre 08/22/2006 0.79 6 <5 1059 <5 59 <5 <5 <5 <5 ND ND ND ND 46104906 SEWD 60Acre 02/12/2007 NM 14 <5 1020 <5 43 <5 <5 <5 <5 NM NM NM NM NM104976 SEWD 60Acre 03/13/2007 NM 9 <5 958 <5 83 <5 <5 <5 <5 NM NM NM NM NM104271 SEWD 74-01 08/22/2006 0.12 11 10 1508 <5 185 <5 <5 8 <5 16 ND ND ND 18105797 SEWD 74-01 08/22/2007 NM 22 14 1509 <5 176 <5 5 8 <5 NM NM NM NM NM104265 SEWD 74-02 08/22/2006 0.40 26 11 1754 52 123 <5 9 18 6 ND ND 15 ND ND105798 SEWD 74-02 08/22/2007 NM 21 9 940 54 92 8 8 22 15 NM NM NM NM NM104257 SEWD A4 08/21/2006 0.30 7 11 2287 60 211 <5 13 6 <5 ND ND ND ND ND104270 SEWD BZ 08/22/2006 0.28 14 73 1888 <5 139 <5 25 5 <5 ND ND ND ND ND104300 SEWD CN-1 08/23/2006 0.41 12 12 2850 6 270 <5 <5 9 <5 ND ND 14 ND ND104301 SEWD CWS-35 08/23/2006 0.32 <5 <5 1611 <5 1872 <5 10 1587 370 ND ND 29 ND 36104305 SEWD Divsersion Canal 08/23/2006 2.78 <5 <5 7 <5 <5 6 <5 <5 <5 ND ND ND ND 35104256 SEWD MW-1A 08/21/2006 0.21 <5 <5 1431 <5 137 <5 <5 <5 <5 ND ND ND ND ND104255 SEWD MW-1B 08/21/2006 0.51 <5 <5 1235 <5 102 <5 <5 <5 <5 ND ND ND ND ND104254 SEWD MW-1C 08/21/2006 0.39 <5 <5 1215 <5 94 <5 <5 <5 <5 ND ND ND ND ND105293 SEWD MW-1C 05/30/2007 NM 11 <5 1010 <5 64 <5 <5 <5 <5 NM NM NM NM NM104266 SEWD MW-2A 08/22/2006 0.81 <5 <5 136 <5 <5 7 <5 <5 <5 ND ND ND ND ND104260 SEWD MW-2B 08/22/2006 1.23 <5 <5 131 <5 <5 5 <5 <5 <5 ND ND ND ND ND104261 SEWD MW-2C 08/22/2006 0.54 <5 <5 136 <5 7 7 <5 <5 <5 ND ND ND ND ND105285 SEWD MW-2C 05/30/2007 NM 11 <5 113 <5 <5 6 <5 <5 <5 NM NM NM NM NM104263 SEWD MW-3A 08/21/2006 0.85 <5 <5 478 <5 23 5 <5 <5 <5 ND ND ND ND 56104259 SEWD MW-3B 08/21/2006 0.99 5 <5 417 <5 13 6 <5 <5 <5 ND ND ND ND 66104966 SEWD MW-3B 03/13/2007 NM 9 <5 490 <5 13 <5 <5 <5 <5 NM NM NM NM NM104258 SEWD MW-3C 08/21/2006 0.88 <5 <5 690 <5 36 <5 <5 <5 <5 ND ND ND ND 76105294 SEWD MW-3C 05/30/2007 NM 11 <5 734 <5 zzzzzzzzz <5 <5 <5 <5 NM NM NM NM NM104303 SEWD MW-NW-1 08/23/2006 0.81 <5 <5 21 <5 <5 <5 <5 <5 <5 ND ND ND ND 55104272 SEWD North Pond (inflow) 08/22/2006 1.74 11 <5 2638 <5 126 <5 <5 8 <5 ND ND ND ND ND104264 SEWD PZ-1 08/21/2006 0.95 7 <5 372 <5 <5 7 <5 <5 <5 ND ND ND ND 31104944 SEWD PZ-1 03/02/2007 NM 8 <5 777 <5 40 <5 <5 <5 <5 NM NM NM NM NM104961 SEWD PZ-1 03/13/2007 NM 9 <5 944 <5 74 <5 <5 <5 <5 NM NM NM NM NM104840 SEWD South Pond 01/17/2007 NM 12 5 1593 5 152 5 5 10 5 NM NM NM NM NM104969 SEWD South Pond 03/13/2007 NM 12 <5 3250 <5 417 <5 <5 31 <5 NM NM NM NM NM104839 SEWD South Pond 01/17/2007 NM 12 5 3278 5 405 8 5 27 5 NM NM NM NM NM104302 SEWD T-3 08/23/2006 0.53 8 45 1793 <5 75 <5 8 <5 <5 ND ND ND ND ND
GAMA: Water Quality Changes during Groundwater Banking, Appendix A: Data Tables Page A10

Table A-5: Morada Water Quality Data
LLNL ID Site Location Sample Date Depth of well screen (ft)
Cl- (mg/L) NO3 (mg/L) SO4 (mg/L) Na (mg/L) K (mg/L) Mg (mg/L) Ca (mg/L) As (ug/L) U (ug/L) V (ug/L) Chloroform (ng/L)
Dissolved CH4
(ccSTP/g)Excess N2 (as
equiv. mg/L NO3-)
TIC (mg/L) TOC (mg/L) δ13C TIC (‰ VPDB)
3H pCi/L δ15N NO3- (‰
Air) δ18O NO3
- (‰ SMOW)
104446 Morada DB2 Pond (Culvert) 09/13/2006 surface 4.9 <0.4 7.0 6.4 2.0 5.9 10.2 2.1 0.48 11.4 13.1 2.54E-08 ND 9.04 3.87 -16.5104916 Morada DB2 Pond (Culvert) 02/14/2007 surface 4.8 2.1 8.5 7.3 2.5 6.3 12.7 2.0 0.61 7.6 101.9 5.2 16.2105382 Morada DB2 Pond (Culvert) 06/12/2007 surface 15.7 < 0.4 31.9 20.4 7.3 16.4 37.8104440 Morada CSW-24 09/13/2006 long screen 9.9 6.7 24.1 9.6 3.5 17.9 23.9 3.7 8.53 39.0 2.87E-08 4.1 57.36 0.59 -14.7 24.3 3.8 1.4104900 Morada CSW-24 02/09/2007 long screen 8.8 6.2 24.2 19.1 6.6 37.0 49.5 3.7 7.00 33.4 7.6 2.38E-08 ND 49.53 0.10 -16.5 22.1 6.0 0.4104930 Morada CSW-19 02/21/2007 long screen 12.9 10.0 33.0 16.9 4.7 22.2 46.9 4.5 5.80 37.5 8.6 1.88E-08 0.4 0.10 36.3104986 Morada CSW-19 03/21/2007 long screen 12.1 9.3 31.2 17.3 5.1 20.7 45.2 5.3 5.27 32.5 4.7 0.4105112 Morada CSW-19 04/06/2007 long screen 10.6 3.8 14.7 11.3 2.8 9.7 24.8 3.5 0.1105302 Morada CSW-19 05/31/2007 long screen 16.4 8.0 25.6 19.6 4.9 18.4 41.2 4.4 0.4104447 Morada MW-Lysimeter-47' 09/14/2006 47 3.3 0.6 6.9 5.2 0.3 8.4 13.3 0.51 26.4 17.39 1.37104438 Morada MW-220' 09/13/2006 220 5.1 13.1 15.3 12.8 3.0 33.1 23.3 2.9 3.25 28.4 1.76E-08 0.1 42.92 0.37 -14.9 41.2 3.1 3.1104913 Morada MW-220' 02/14/2007 220 5.5 13.7 14.6 12.6 3.1 21.3 29.3 3.7 2.88 35.4 8.3 1.38E-08 2.7 41.11 0.10 -15.7 46.8 4.1 1.7105099 Morada MW-220' 03/28/2007 220 3.1 7.9 9.9 8.4 2.0 10.8 23.8 3.7 3.10 35.6 3.7 -0.6105380 Morada MW-220' 06/12/2007 220 5.7 14.1 17.5 15.1 3.5 18.7 36.9 3.9 0.3104443 Morada MW-300' 09/13/2006 300 7.7 8.4 28.9 15.4 4.7 31.8 21.1 3.8 4.50 34.9 2.22E-08 3.7 46.34 0.55 -15.0 47.8 0.4 4.0104914 Morada MW-300' 02/14/2007 300 10.3 8.5 29.7 11.2 3.6 21.1 29.4 3.8 4.90 34.6 1.55E-08 ND 46.85 0.10 -15.6 43.6 4.2 0.6105098 Morada MW-300' 03/28/2007 300 5.8 5.7 21.4 10.3 3.3 14.8 30.9 3.8 5.20 35.0 5.5 -0.6105379 Morada MW-300' 06/12/2007 300 6.5 9.1 27.5 16.1 4.9 21.9 41.6 4.3 0.4104442 Morada MW-540' 09/13/2006 540 4.6 <0.4 5.2 36.1 3.3 5.4 9.1 14.4 0.03 0.9 2.47E-08 1.0 22.70 -16.0 0.1104915 Morada MW-540' 02/14/2007 540 5.1 < 0.4 6.7 25.5 3.7 7.4 11.2 14.1 0.05 1.3 2.39E-08 ND 22.84 0.10 -16.5 1.0105097 Morada MW-540' 03/27/2007 540 3.4 < 0.4 4.4 16.7 2.4 3.4 8.2 14.4 0.02 0.8105378 Morada MW-540' 06/12/2007 540 5.7 < 0.4 8.8 25.8 3.7 5.6 12.1104441 Morada MW-635' 09/13/2006 635 10.1 <0.4 <0.4 118.0 3.6 1.1 1.9 26.6 <0.01 0.2 2.30E-06 15.6 42.20 0.41 -15.8 -0.2105096 Morada MW-635' 03/27/2007 635 7.0 < 0.4 < 0.1 42.8 2.5 0.9 2.0 26.6 0.01 0.5105377 Morada MW-635' 06/12/2007 635 11.9 < 0.4 < 0.4 74.9 4.8 1.8 4.0104444 Morada MW-114' 09/14/2006 114 3.4 <0.4 5.5 9.4 1.4 10.8 14.6 6.8 0.27 48.4 71.4 7.14E-07 2.9 17.35 1.30 -14.0 10.4104877 Morada MW-114' 02/02/2007 114 6.5 < 0.1 7.2 6.3 1.0 4.8 11.8 6.1 0.46 40.5 21.0 2.07E-06 ND 23.19 0.55 -13.2104901 Morada MW-114' 02/09/2007 114 4.1 < 0.1 4.7 10.8 1.7 13.4 19.1 6.0 0.47 41.0105111 Morada MW-114' 03/29/2007 114 3.8 < 0.4 4.4 7.0 1.0 6.7 14.8105381 Morada MW-114' 06/12/2007 114 5.5 < 0.4 7.0 10.1 1.5 10.2 21.0
GAMA: Water Quality Changes during Groundwater Banking, Appendix A: Data Tables Page A11

Table A-6: Morada Tracer Data
LLNL ID Sample Date Site Location δ18O H O (‰ δ2H H O (‰ SF6 (ppb in Conductivity pH ORP Temperature DO (mg/L)LLNL ID Sample Date Site Location δ18O H2O (‰ δ2H H2O (‰ SF6 (ppb in h d )
Conductivity ( S/ )
pH ORP Temperature (°C)
DO (mg/L)VSMOW) VSMOW) headspace) (uS/cm) (°C)VSMOW) VSMOW) headspace) (uS/cm) ( C)
104439 09/14/2006 M d L M d C l 10 9 75 4 128 6 94 239 19 5 11 5104439 09/14/2006 Morada Lane Morada Canal -10.9 -75.4 128 6.94 239 19.5 11.5104439 09/14/2006 Morada Lane Morada Canal 10.9 75.4 128 6.94 239 19.5 11.5104454 10/04/2006 Morada Lane DB2 Pond (Bubbler at culvert) 10 4 73 9 33 16104454 10/04/2006 Morada Lane DB2 Pond (Bubbler at culvert) -10.4 -73.9 33.16( )104508 10/05/2006 Morada Lane DB2 Pond (Bubbler at culvert) -10 8 -75 3 1 00104508 10/05/2006 Morada Lane DB2 Pond (Bubbler at culvert) -10.8 -75.3 1.00104510 10/06/2006 Morada Lane DB2 Pond (Bubbler at culvert) -10.6 -76.1 3.09 76 6.34 252 16.7 10.6104510 10/06/2006 Morada Lane DB2 Pond (Bubbler at culvert) -10.6 -76.1 3.09 76 6.34 252 16.7 10.6104554 10/10/2006 M d L DB2 P d (B bbl t l t) 11 2 77 8 7 63 21 4104554 10/10/2006 Morada Lane DB2 Pond (Bubbler at culvert) -11.2 -77.8 7.63 21.40 55 0/ 0/ 006 o ada a e o d ( ubb e at cu e t) 8 63104574 10/11/2006 Morada Lane DB2 Pond (Bubbler at culvert) 11 2 77 6 7 47 20 5104574 10/11/2006 Morada Lane DB2 Pond (Bubbler at culvert) -11.2 -77.6 7.47 20.5105560 10/12/2006 Morada Lane DB2 Pond (Bubbler at culvert) -11.2 -79.7 11.29 22.9105560 10/12/2006 Morada Lane DB2 Pond (Bubbler at culvert) -11.2 -79.7 11.29 22.9104568 10/19/2006 M d L DB2 P d (B bbl t l t) 10 8 77 7 3 87 239 8 31 206 20 7 8 8104568 10/19/2006 Morada Lane DB2 Pond (Bubbler at culvert) -10.8 -77.7 3.87 239 8.31 206 20.7 8.8104568 10/19/2006 Morada Lane DB2 Pond (Bubbler at culvert) 10.8 77.7 3.87 239 8.31 206 20.7 8.8104543 10/23/2006 Morada Lane DB2 Pond (Bubbler at culvert) 10 5 76 6 2 91 230 8 79 275 21 1 10 0104543 10/23/2006 Morada Lane DB2 Pond (Bubbler at culvert) -10.5 -76.6 2.91 230 8.79 275 21.1 10.0( )104623 10/26/2006 Morada Lane DB2 Pond (Bubbler at culvert) -10 8 -75 0 2 51 172 8 25 236 19 7 9 2104623 10/26/2006 Morada Lane DB2 Pond (Bubbler at culvert) -10.8 -75.0 2.51 172 8.25 236 19.7 9.2104629 10/31/2006 Morada Lane DB2 Pond (Bubbler at culvert) -10.2 -73.9 0.89 16.2104629 10/31/2006 Morada Lane DB2 Pond (Bubbler at culvert) -10.2 -73.9 0.89 16.2104647 11/06/2006 M d L DB2 P d (B bbl t l t) 9 7 72 0 0 65 244 8 31 289 21 4 7 1104647 11/06/2006 Morada Lane DB2 Pond (Bubbler at culvert) -9.7 -72.0 0.65 244 8.31 289 21.4 7.10 6 /06/ 006 o ada a e o d ( ubb e at cu e t) 9 0 0 65 8 3 89104659 11/14/2006 Morada Lane DB2 Pond (Bubbler at culvert) 7 6 53 7 0 11 305 7 74 144 17 8 8 6104659 11/14/2006 Morada Lane DB2 Pond (Bubbler at culvert) -7.6 -53.7 0.11 305 7.74 144 17.8 8.6104674 11/20/2006 Morada Lane DB2 Pond (Bubbler at culvert) -10.0 -72.6 305 7.9 249 17.1 10.2104674 11/20/2006 Morada Lane DB2 Pond (Bubbler at culvert) -10.0 -72.6 305 7.9 249 17.1 10.2104681 11/27/2006 M d L DB2 P d (B bbl t l t) 8 3 56 3 ND 361 7 53 281 17 1 8 2104681 11/27/2006 Morada Lane DB2 Pond (Bubbler at culvert) -8.3 -56.3 ND 361 7.53 281 17.1 8.2104681 11/27/2006 Morada Lane DB2 Pond (Bubbler at culvert) 8.3 56.3 ND 361 7.53 281 17.1 8.2104730 12/12/2006 Morada Lane DB2 Pond (Bubbler at culvert) 7 4 50 8 ND 172 7 11 338 11 0 8 5104730 12/12/2006 Morada Lane DB2 Pond (Bubbler at culvert) -7.4 -50.8 ND 172 7.11 338 11.0 8.5( )104836 01/12/2007 Morada Lane DB2 Pond (Bubbler at culvert) -9 2 -68 6 ND 328 8 62 224 11 5 6 1104836 01/12/2007 Morada Lane DB2 Pond (Bubbler at culvert) -9.2 -68.6 ND 328 8.62 224 11.5 6.1104873 01/30/2007 Morada Lane DB2 Pond (Bubbler at culvert) -6.4 -44.6 ND 210 10.01 196 15.8 16.1104873 01/30/2007 Morada Lane DB2 Pond (Bubbler at culvert) -6.4 -44.6 ND 210 10.01 196 15.8 16.1104916 02/14/2007 M d L DB2 P d (B bbl t l t) 6 4 43 5 ND 183 8 64 272 13 8 9 1104916 02/14/2007 Morada Lane DB2 Pond (Bubbler at culvert) -6.4 -43.5 ND 183 8.64 272 13.8 9.10 9 6 0 / / 00 o ada a e o d ( ubb e at cu e t) 6 3 5 83 8 6 3 8 9104511 10/06/2006 Morada Lane DB2 Pond (East bank) 10 6 75 8 177 7 39 185 20 0 9 2104511 10/06/2006 Morada Lane DB2 Pond (East bank) -10.6 -75.8 177 7.39 185 20.0 9.2104456 10/04/2006 Morada Lane DB2 Pond (Northwest corner) 3.23104456 10/04/2006 Morada Lane DB2 Pond (Northwest corner) 3.23104512 10/06/2006 M d L DB2 P d (N th t ) 10 6 78 2 3 76 181 7 51 183 19 9 9 7104512 10/06/2006 Morada Lane DB2 Pond (Northwest corner) -10.6 -78.2 3.76 181 7.51 183 19.9 9.7104512 10/06/2006 Morada Lane DB2 Pond (Northwest corner) 10.6 78.2 3.76 181 7.51 183 19.9 9.7104553 10/10/2006 Morada Lane DB2 Pond (Northwest corner) 11 0 78 7 7 81 20 4104553 10/10/2006 Morada Lane DB2 Pond (Northwest corner) -11.0 -78.7 7.81 20.4( )104575 10/11/2006 Morada Lane DB2 Pond (Northwest corner) -11 2 -78 4 6 11 20 9104575 10/11/2006 Morada Lane DB2 Pond (Northwest corner) -11.2 -78.4 6.11 20.9105559 10/12/2006 Morada Lane DB2 Pond (Northwest corner) -11.2 -79.0 6.29 22.3105559 10/12/2006 Morada Lane DB2 Pond (Northwest corner) -11.2 -79.0 6.29 22.3104565 10/19/2006 M d L DB2 P d (N th t ) 10 8 79 5 3 20 220 8 74 205 21 4 9 9104565 10/19/2006 Morada Lane DB2 Pond (Northwest corner) -10.8 -79.5 3.20 220 8.74 205 21.4 9.90 565 0/ 9/ 006 o ada a e o d ( o t est co e ) 0 8 9 5 3 0 0 8 05 9 9104544 10/23/2006 Morada Lane DB2 Pond (Northwest corner) 10 8 77 2 3 09 190 8 85 265 21 4 10 0104544 10/23/2006 Morada Lane DB2 Pond (Northwest corner) -10.8 -77.2 3.09 190 8.85 265 21.4 10.0104624 10/26/2006 Morada Lane DB2 Pond (Northwest corner) -10.7 -77.7 2.45 175 8.54 217 20.2 9.7104624 10/26/2006 Morada Lane DB2 Pond (Northwest corner) -10.7 -77.7 2.45 175 8.54 217 20.2 9.7104646 11/06/2006 M d L DB2 P d (N th t ) 9 8 69 9 0 94 202 7 79 324 20 6 6 7104646 11/06/2006 Morada Lane DB2 Pond (Northwest corner) -9.8 -69.9 0.94 202 7.79 324 20.6 6.7104646 11/06/2006 Morada Lane DB2 Pond (Northwest corner) 9.8 69.9 0.94 202 7.79 324 20.6 6.7104658 11/14/2006 Morada Lane DB2 Pond (Northwest corner) 8 0 52 3 0 21 202 7 24 154 16 0 8 8104658 11/14/2006 Morada Lane DB2 Pond (Northwest corner) -8.0 -52.3 0.21 202 7.24 154 16.0 8.8( )104673 11/20/2006 Morada Lane DB2 Pond (Northwest corner) -7 9 -54 5 183 8 19 256 15 4 11 2104673 11/20/2006 Morada Lane DB2 Pond (Northwest corner) -7.9 -54.5 183 8.19 256 15.4 11.2104682 11/27/2006 Morada Lane DB2 Pond (Northwest corner) -7.6 -52.8 0.03 255 8.13 265 15.2 11.9104682 11/27/2006 Morada Lane DB2 Pond (Northwest corner) -7.6 -52.8 0.03 255 8.13 265 15.2 11.9104731 12/12/2006 M d L DB2 P d (N th t ) 7 3 49 7 ND 175 7 15 342 11 0 8 9104731 12/12/2006 Morada Lane DB2 Pond (Northwest corner) -7.3 -49.7 ND 175 7.15 342 11.0 8.90 3 / / 006 o ada a e o d ( o t est co e ) 3 9 5 5 3 0 8 9104837 01/12/2007 Morada Lane DB2 Pond (Northwest corner) 6 3 42 2 ND 159 9 27 219 8 1 6 5104837 01/12/2007 Morada Lane DB2 Pond (Northwest corner) -6.3 -42.2 ND 159 9.27 219 8.1 6.5104871 01/30/2007 Morada Lane DB2 Pond (Northwest corner) -6.8 -47.1 ND 256 9.64 224 15.5 18.5104871 01/30/2007 Morada Lane DB2 Pond (Northwest corner) -6.8 -47.1 ND 256 9.64 224 15.5 18.5104446 09/13/2006 M d L DB2 P d (R ) 10 4 70 0 202 8 9 123 26 6 18 6104446 09/13/2006 Morada Lane DB2 Pond (Ramp) -10.4 -70.0 202 8.9 123 26.6 18.6104446 09/13/2006 Morada Lane DB2 Pond (Ramp) 10.4 70.0 202 8.9 123 26.6 18.6104455 10/04/2006 Morada Lane DB2 Pond (Ramp) 11 1104455 10/04/2006 Morada Lane DB2 Pond (Ramp) -11.1( p)104509 10/05/2006 Morada Lane DB2 Pond (Ramp) -10 6 -75 6 0 27104509 10/05/2006 Morada Lane DB2 Pond (Ramp) -10.6 -75.6 0.27104514 10/06/2006 Morada Lane DB2 Pond (Ramp) -10.6 -77.8 1.64104514 10/06/2006 Morada Lane DB2 Pond (Ramp) -10.6 -77.8 1.64104555 10/10/2006 M d L DB2 P d (R ) 11 1 79 4 5 41 20 3104555 10/10/2006 Morada Lane DB2 Pond (Ramp) -11.1 -79.4 5.41 20.30 555 0/ 0/ 006 o ada a e o d ( a p) 9 5 0 3104573 10/11/2006 Morada Lane DB2 Pond (Ramp) 11 1 81 4 6 02 21 0104573 10/11/2006 Morada Lane DB2 Pond (Ramp) -11.1 -81.4 6.02 21.0105561 10/12/2006 Morada Lane DB2 Pond (Ramp) -11.2 -80.9 10.66 23.9105561 10/12/2006 Morada Lane DB2 Pond (Ramp) -11.2 -80.9 10.66 23.9104567 10/19/2006 M d L DB2 P d (R ) 11 0 79 5 4 41 149 8 29 200 20 1 9 3104567 10/19/2006 Morada Lane DB2 Pond (Ramp) -11.0 -79.5 4.41 149 8.29 200 20.1 9.3104567 10/19/2006 Morada Lane DB2 Pond (Ramp) 11.0 79.5 4.41 149 8.29 200 20.1 9.3
GAMA: Water Quality Changes during Groundwater Banking, Appendix A: Data Tables Page A12

Table A-6: Morada Tracer Data
LLNL ID Sample Date Site Location δ18O H O (‰ δ2H H O (‰ SF6 (ppb in Conductivity pH ORP Temperature DO (mg/L)LLNL ID Sample Date Site Location δ18O H2O (‰ δ2H H2O (‰ SF6 (ppb in h d )
Conductivity ( S/ )
pH ORP Temperature (°C)
DO (mg/L)VSMOW) VSMOW) headspace) (uS/cm) (°C)VSMOW) VSMOW) headspace) (uS/cm) ( C)
104542 10/23/2006 M d L DB2 P d (R ) 10 5 77 1 3 03 22 8 8 280 21 1 9 7104542 10/23/2006 Morada Lane DB2 Pond (Ramp) -10.5 -77.1 3.03 227 8.78 280 21.1 9.7104542 10/23/2006 Morada Lane DB2 Pond (Ramp) 10.5 77.1 3.03 227 8.78 280 21.1 9.7104622 10/26/2006 Morada Lane DB2 Pond (Ramp) 10 9 76 6 2 40 171 8 04 244 19 3 8 8104622 10/26/2006 Morada Lane DB2 Pond (Ramp) -10.9 -76.6 2.40 171 8.04 244 19.3 8.8( p)105382 06/12/2007 Morada Lane DB2 Pond (South bank) -7 2 -58 9105382 06/12/2007 Morada Lane DB2 Pond (South bank) -7.2 -58.9104453 10/03/2006 Morada Lane DB2 Pond (Surface) -10.5 -77.0 ND104453 10/03/2006 Morada Lane DB2 Pond (Surface) -10.5 -77.0 ND104457 10/04/2006 M d L DB2 P d (S f ) 0 01104457 10/04/2006 Morada Lane DB2 Pond (Surface) 0.01104457 10/04/2006 Morada Lane DB2 Pond (Surface) 0.01104513 10/06/2006 Morada Lane DB2 Pond (West bank) 10 7 76 7 5 13 177 7 84 178 20 4 9 8104513 10/06/2006 Morada Lane DB2 Pond (West bank) -10.7 -76.7 5.13 177 7.84 178 20.4 9.8( )104552 10/10/2006 Morada Lane DB2 Pond (West bank) -11 0 -80 2 7 34 20 2104552 10/10/2006 Morada Lane DB2 Pond (West bank) -11.0 -80.2 7.34 20.2104576 10/11/2006 M d L DB2 P d (W t b k) 11 1 77 3 7 24 21 2104576 10/11/2006 Morada Lane DB2 Pond (West bank) -11.1 -77.3 7.24 21.2104576 10/11/2006 Morada Lane DB2 Pond (West bank) 11.1 77.3 7.24 21.2105558 10/12/2006 Morada Lane DB2 Pond (West bank) 11 3 79 9 5 77 21 2105558 10/12/2006 Morada Lane DB2 Pond (West bank) -11.3 -79.9 5.77 21.2( )104566 10/19/2006 Morada Lane DB2 Pond (West bank) -11 0 -79 5 4 19 144 8 99 196 21 1 11 0104566 10/19/2006 Morada Lane DB2 Pond (West bank) -11.0 -79.5 4.19 144 8.99 196 21.1 11.0104541 10/23/2006 Morada Lane DB2 Pond (West bank) -10.8 -78.7 3.41 169 8.96 289 20.2 10.3104541 10/23/2006 Morada Lane DB2 Pond (West bank) -10.8 -78.7 3.41 169 8.96 289 20.2 10.3104621 10/26/2006 M d L DB2 P d (W t b k) 10 8 77 4 2 79 167 8 08 245 19 0 9 8104621 10/26/2006 Morada Lane DB2 Pond (West bank) -10.8 -77.4 2.79 167 8.08 245 19.0 9.8104621 10/26/2006 Morada Lane DB2 Pond (West bank) 10.8 77.4 2.79 167 8.08 245 19.0 9.8104447 09/14/2006 Morada Lane MW Lysimeter 47' 9 1 65 0 202 8 9 123 26 6 18 6104447 09/14/2006 Morada Lane MW-Lysimeter-47' -9.1 -65.0 202 8.9 123 26.6 18.6y104571 10/16/2006 Morada Lane MW-Lysimeter-47' ND104571 10/16/2006 Morada Lane MW-Lysimeter-47 ND104610 10/19/2006 M d L MW L i t 47' ND104610 10/19/2006 Morada Lane MW-Lysimeter-47' ND104610 10/19/2006 Morada Lane MW Lysimeter 47 ND104609 10/19/2006 Morada Lane MW Lysimeter 47' ND104609 10/19/2006 Morada Lane MW-Lysimeter-47' NDy104546 10/23/2006 Morada Lane MW-Lysimeter-47' ND104546 10/23/2006 Morada Lane MW-Lysimeter-47' ND104545 10/23/2006 Morada Lane MW-Lysimeter-47' ND104545 10/23/2006 Morada Lane MW-Lysimeter-47 ND104628 10/26/2006 M d L MW L i t 47' ND104628 10/26/2006 Morada Lane MW-Lysimeter-47' ND104628 10/26/2006 Morada Lane MW Lysimeter 47 ND104627 10/26/2006 Morada Lane MW Lysimeter 47' ND104627 10/26/2006 Morada Lane MW-Lysimeter-47' NDy104640 10/31/2006 Morada Lane MW-Lysimeter-47' ND104640 10/31/2006 Morada Lane MW-Lysimeter-47 ND104639 10/31/2006 M d L MW L i t 47' ND104639 10/31/2006 Morada Lane MW-Lysimeter-47' ND104639 10/31/2006 Morada Lane MW Lysimeter 47 ND104651 11/06/2006 Morada Lane MW Lysimeter 47'104651 11/06/2006 Morada Lane MW-Lysimeter-47'y104650 11/06/2006 Morada Lane MW-Lysimeter-47'104650 11/06/2006 Morada Lane MW-Lysimeter-47'104665 11/14/2006 Morada Lane MW-Lysimeter-47'104665 11/14/2006 Morada Lane MW-Lysimeter-47104664 11/14/2006 M d L MW L i t 47'104664 11/14/2006 Morada Lane MW-Lysimeter-47'104664 11/14/2006 Morada Lane MW Lysimeter 47104680 11/20/2006 Morada Lane MW Lysimeter 47' ND104680 11/20/2006 Morada Lane MW-Lysimeter-47' NDy104679 11/20/2006 Morada Lane MW-Lysimeter-47' ND104679 11/20/2006 Morada Lane MW-Lysimeter-47 ND104688 11/27/2006 M d L MW L i t 47' ND104688 11/27/2006 Morada Lane MW-Lysimeter-47' ND104688 11/27/2006 Morada Lane MW Lysimeter 47 ND104687 11/27/2006 Morada Lane MW Lysimeter 47'104687 11/27/2006 Morada Lane MW-Lysimeter-47'y104444 09/14/2006 Morada Lane MW-114' -9 6 -68 9 184 7 66 -44 6 21 2 0 1104444 09/14/2006 Morada Lane MW-114' -9.6 -68.9 184 7.66 -44.6 21.2 0.1104515 10/06/2006 Morada Lane MW-114' -9.1 -64.8 ND104515 10/06/2006 Morada Lane MW-114 -9.1 -64.8 ND105556 10/10/2006 M d L MW 114' 9 0 61 5 ND105556 10/10/2006 Morada Lane MW-114' -9.0 -61.5 ND105556 10/10/2006 Morada Lane MW 114 9.0 61.5 ND105563 10/12/2006 Morada Lane MW 114' 9 1 63 6 ND105563 10/12/2006 Morada Lane MW-114' -9.1 -63.6 ND104569 10/16/2006 Morada Lane MW-114' -9 0 -61 7 ND104569 10/16/2006 Morada Lane MW-114 -9.0 -61.7 ND104607 10/19/2006 M d L MW 114' 8 8 59 8 ND104607 10/19/2006 Morada Lane MW-114' -8.8 -59.8 ND104607 10/19/2006 Morada Lane MW 114 8.8 59.8 ND104626 10/26/2006 Morada Lane MW 114' 8 6 58 5 ND104626 10/26/2006 Morada Lane MW-114' -8.6 -58.5 ND104637 10/31/2006 Morada Lane MW-114' -8 6 -59 7 ND104637 10/31/2006 Morada Lane MW-114' -8.6 -59.7 ND104649 11/06/2006 Morada Lane MW-114' -8.4 -58.2 ND104649 11/06/2006 Morada Lane MW-114 -8.4 -58.2 ND104661 11/14/2006 M d L MW 114' 8 3 58 0 ND104661 11/14/2006 Morada Lane MW-114' -8.3 -58.0 ND104661 11/14/2006 Morada Lane MW 114 8.3 58.0 ND104663 11/14/2006 Morada Lane MW 114' ND104663 11/14/2006 Morada Lane MW-114' ND104677 11/20/2006 Morada Lane MW-114' ND104677 11/20/2006 Morada Lane MW-114 ND104678 11/20/2006 M d L MW 114' 8 2 55 4 ND104678 11/20/2006 Morada Lane MW-114' -8.2 -55.4 ND104678 11/20/2006 Morada Lane MW 114 8.2 55.4 ND
GAMA: Water Quality Changes during Groundwater Banking, Appendix A: Data Tables Page A13

Table A-6: Morada Tracer Data
LLNL ID Sample Date Site Location δ18O H O (‰ δ2H H O (‰ SF6 (ppb in Conductivity pH ORP Temperature DO (mg/L)LLNL ID Sample Date Site Location δ18O H2O (‰ δ2H H2O (‰ SF6 (ppb in h d )
Conductivity ( S/ )
pH ORP Temperature (°C)
DO (mg/L)VSMOW) VSMOW) headspace) (uS/cm) (°C)VSMOW) VSMOW) headspace) (uS/cm) ( C)
104685 11/27/2006 M d L MW 114' 8 0 55 7 ND104685 11/27/2006 Morada Lane MW-114' -8.0 -55.7 ND104685 11/27/2006 Morada Lane MW 114 8.0 55.7 ND104686 11/27/2006 Morada Lane MW 114' 8 1 54 3 ND104686 11/27/2006 Morada Lane MW-114' -8.1 -54.3 ND104737 12/13/2006 Morada Lane MW-114' -7 9 -55 2 ND104737 12/13/2006 Morada Lane MW-114' -7.9 -55.2 ND104838 01/12/2007 Morada Lane MW-114' -7.8 -57.4 ND 280 7.82 180 17.6 0.3104838 01/12/2007 Morada Lane MW-114 -7.8 -57.4 ND 280 7.82 180 17.6 0.3104872 01/30/2007 M d L MW 114' 7 7 54 1 22 12 308 7 7 211 18 9 0 0104872 01/30/2007 Morada Lane MW-114' -7.7 -54.1 22.12 308 7.7 211 18.9 0.0104872 01/30/2007 Morada Lane MW 114 7.7 54.1 22.12 308 7.7 211 18.9 0.0104877 02/02/2007 Morada Lane MW 114' 7 7 52 5 ND 310 7 69 188 19 5 0 0104877 02/02/2007 Morada Lane MW-114' -7.7 -52.5 ND 310 7.69 188 19.5 0.0104901 02/09/2007 Morada Lane MW-114' -7 6 -55 0 ND 317 7 77 241 18 1104901 02/09/2007 Morada Lane MW-114 -7.6 -55.0 ND 317 7.77 241 18.1104931 02/21/2007 M d L MW 114' 7 8 54 6 0 04 303 243 18 3 0 0104931 02/21/2007 Morada Lane MW-114' -7.8 -54.6 0.04 303 243 18.3 0.0104931 02/21/2007 Morada Lane MW 114 7.8 54.6 0.04 303 243 18.3 0.0105111 03/29/2007 Morada Lane MW 114' 8 1 56 2105111 03/29/2007 Morada Lane MW-114' -8.1 -56.2105180 05/03/2007 Morada Lane MW-114' -8 1 -56 6 0 53 316 7 64 194 18 7 0 0105180 05/03/2007 Morada Lane MW-114' -8.1 -56.6 0.53 316 7.64 194 18.7 0.0105381 06/12/2007 Morada Lane MW-114' -8.2 -58.0 0.56 336 7.13 98 19.1 0.8105381 06/12/2007 Morada Lane MW-114 -8.2 -58.0 0.56 336 7.13 98 19.1 0.8104438 09/13/2006 M d L MW 220' 9 9 73 5 345 7 54 4 6 20 3 2 4104438 09/13/2006 Morada Lane MW-220' -9.9 -73.5 345 7.54 4.6 20.3 2.4104438 09/13/2006 Morada Lane MW 220 9.9 73.5 345 7.54 4.6 20.3 2.4104548 10/06/2006 Morada Lane MW 220' 0 01104548 10/06/2006 Morada Lane MW-220' 0.01105557 10/10/2006 Morada Lane MW-220' -9 8 -72 5 ND105557 10/10/2006 Morada Lane MW-220 -9.8 -72.5 ND104564 10/12/2006 M d L MW 220' 9 8 72 6 ND104564 10/12/2006 Morada Lane MW-220' -9.8 -72.6 ND104564 10/12/2006 Morada Lane MW 220 9.8 72.6 ND104570 10/16/2006 Morada Lane MW 220' 9 8 74 7 ND104570 10/16/2006 Morada Lane MW-220' -9.8 -74.7 ND104608 10/19/2006 Morada Lane MW-220' -9 8 -71 4 ND104608 10/19/2006 Morada Lane MW-220' -9.8 -71.4 ND104625 10/26/2006 Morada Lane MW-220' -9.7 -73.2 ND104625 10/26/2006 Morada Lane MW-220 -9.7 -73.2 ND104638 10/31/2006 M d L MW 220' 9 9 73 2 ND104638 10/31/2006 Morada Lane MW-220' -9.9 -73.2 ND104638 10/31/2006 Morada Lane MW 220 9.9 73.2 ND104648 11/06/2006 Morada Lane MW 220' 9 9 74 1 ND104648 11/06/2006 Morada Lane MW-220' -9.9 -74.1 ND104660 11/14/2006 Morada Lane MW-220' -9 8 -73 5 ND104660 11/14/2006 Morada Lane MW-220 -9.8 -73.5 ND104662 11/14/2006 M d L MW 220' ND104662 11/14/2006 Morada Lane MW-220' ND104662 11/14/2006 Morada Lane MW 220 ND104675 11/20/2006 Morada Lane MW 220' ND104675 11/20/2006 Morada Lane MW-220' ND104676 11/20/2006 Morada Lane MW-220' -9 8 -72 1 ND104676 11/20/2006 Morada Lane MW-220' -9.8 -72.1 ND104683 11/27/2006 Morada Lane MW-220' -9.8 -73.1 ND104683 11/27/2006 Morada Lane MW-220 -9.8 -73.1 ND104684 11/27/2006 M d L MW 220' 9 8 73 6 ND104684 11/27/2006 Morada Lane MW-220' -9.8 -73.6 ND104684 11/27/2006 Morada Lane MW 220 9.8 73.6 ND104736 12/12/2006 Morada Lane MW 220' 9 8 74 0 ND104736 12/12/2006 Morada Lane MW-220' -9.8 -74.0 ND104843 01/19/2007 Morada Lane MW-220' -9 7 -71 7 12 23 550 7 32 124 19 8 0 0104843 01/19/2007 Morada Lane MW-220 -9.7 -71.7 12.23 550 7.32 124 19.8 0.0104870 01/30/2007 M d L MW 220' 9 8 72 3 23 41 563 7 48 321 19 6 1 0104870 01/30/2007 Morada Lane MW-220' -9.8 -72.3 23.41 563 7.48 321 19.6 1.0104870 01/30/2007 Morada Lane MW 220 9.8 72.3 23.41 563 7.48 321 19.6 1.0104875 02/02/2007 Morada Lane MW 220' 9 9 72 5 32 63 568 7 52 313 19 9 1 1104875 02/02/2007 Morada Lane MW-220' -9.9 -72.5 32.63 568 7.52 313 19.9 1.1104913 02/14/2007 Morada Lane MW-220' -9 8 -71 4 ND 548 7 52 380 20 1 0 9104913 02/14/2007 Morada Lane MW-220' -9.8 -71.4 ND 548 7.52 380 20.1 0.9104932 02/21/2007 Morada Lane MW-220' -9.7 -70.1 ND 582 7.61 328 19.8 1.3104932 02/21/2007 Morada Lane MW-220 -9.7 -70.1 ND 582 7.61 328 19.8 1.3105099 03/28/2007 M d L MW 220' 9 8 74 1 ND105099 03/28/2007 Morada Lane MW-220' -9.8 -74.1 ND105099 03/28/2007 Morada Lane MW 220 9.8 74.1 ND105179 05/03/2007 Morada Lane MW 220' 9 8 71 0 0 06 562 7 46 336 20 6 2 6105179 05/03/2007 Morada Lane MW-220' -9.8 -71.0 0.06 562 7.46 336 20.6 2.6105380 06/12/2007 Morada Lane MW-220' -9 8 -69 9 ND 583 7 03 144 20 7 3 2105380 06/12/2007 Morada Lane MW-220 -9.8 -69.9 ND 583 7.03 144 20.7 3.2104443 09/13/2006 M d L MW 300' 9 8 72 5 412 7 45 10 5 20 5 2 9104443 09/13/2006 Morada Lane MW-300' -9.8 -72.5 412 7.45 -10.5 20.5 2.9104443 09/13/2006 Morada Lane MW 300 9.8 72.5 412 7.45 10.5 20.5 2.9105562 10/12/2006 Morada Lane MW 300' 9 7 71 3 ND105562 10/12/2006 Morada Lane MW-300' -9.7 -71.3 ND104734 12/12/2006 Morada Lane MW-300' -9 8 -70 7 ND104734 12/12/2006 Morada Lane MW-300' -9.8 -70.7 ND104876 02/02/2007 Morada Lane MW-300' -9.8 -71.4 17.91 653 7.46 299 20.0 1.8104876 02/02/2007 Morada Lane MW-300 -9.8 -71.4 17.91 653 7.46 299 20.0 1.8104914 02/14/2007 M d L MW 300' 9 6 71 9 ND 648 7 36 356 20 5 1 4104914 02/14/2007 Morada Lane MW-300' -9.6 -71.9 ND 648 7.36 356 20.5 1.4104914 02/14/2007 Morada Lane MW 300 9.6 71.9 ND 648 7.36 356 20.5 1.4104933 02/21/2007 Morada Lane MW 300' 9 6 69 5 ND 642 7 43 350 19 6 1 4104933 02/21/2007 Morada Lane MW-300' -9.6 -69.5 ND 642 7.43 350 19.6 1.4105098 03/28/2007 Morada Lane MW-300' -9 7 -70 6 ND105098 03/28/2007 Morada Lane MW-300 -9.7 -70.6 ND105178 05/03/2007 M d L MW 300' 9 8 79 6 0 06 651 7 41 339 20 8 3 4105178 05/03/2007 Morada Lane MW-300' -9.8 -79.6 0.06 651 7.41 339 20.8 3.4105178 05/03/2007 Morada Lane MW 300 9.8 79.6 0.06 651 7.41 339 20.8 3.4
GAMA: Water Quality Changes during Groundwater Banking, Appendix A: Data Tables Page A14

Table A-6: Morada Tracer Data
LLNL ID Sample Date Site Location δ18O H O (‰ δ2H H O (‰ SF6 (ppb in Conductivity pH ORP Temperature DO (mg/L)LLNL ID Sample Date Site Location δ18O H2O (‰ δ2H H2O (‰ SF6 (ppb in h d )
Conductivity ( S/ )
pH ORP Temperature (°C)
DO (mg/L)VSMOW) VSMOW) headspace) (uS/cm) (°C)VSMOW) VSMOW) headspace) (uS/cm) ( C)
105379 06/12/2007 M d L MW 300' 9 8 73 5 ND 631 7 06 167 20 6 3 5105379 06/12/2007 Morada Lane MW-300' -9.8 -73.5 ND 631 7.06 167 20.6 3.5105379 06/12/2007 Morada Lane MW 300 9.8 73.5 ND 631 7.06 167 20.6 3.5104442 09/13/2006 Morada Lane MW 540' 8 9 62 6 211 7 94 93 6 22 5 0 1104442 09/13/2006 Morada Lane MW-540' -8.9 -62.6 211 7.94 -93.6 22.5 0.1104733 12/11/2006 Morada Lane MW-540' -9 0 -61 5 ND104733 12/11/2006 Morada Lane MW-540' -9.0 -61.5 ND104915 02/14/2007 Morada Lane MW-540' -8.8 -62.1 ND 300 7.53 323 21.1 0.0104915 02/14/2007 Morada Lane MW-540 -8.8 -62.1 ND 300 7.53 323 21.1 0.0104934 02/21/2007 M d L MW 540' 9 1 65 3 ND 295 7 8 321104934 02/21/2007 Morada Lane MW-540' -9.1 -65.3 ND 295 7.8 321104934 02/21/2007 Morada Lane MW 540 9.1 65.3 ND 295 7.8 321105097 03/27/2007 Morada Lane MW 540' 9 0 61 2 0 01105097 03/27/2007 Morada Lane MW-540' -9.0 -61.2 0.01105177 05/03/2007 Morada Lane MW-540' -9 0 -61 0 0 08 308 7 84 283 21 6 0 3105177 05/03/2007 Morada Lane MW-540 -9.0 -61.0 0.08 308 7.84 283 21.6 0.3105378 06/12/2007 M d L MW 540' 9 0 62 3 ND 328 7 52 123 20 6 0 4105378 06/12/2007 Morada Lane MW-540' -9.0 -62.3 ND 328 7.52 123 20.6 0.4105378 06/12/2007 Morada Lane MW 540 9.0 62.3 ND 328 7.52 123 20.6 0.4104441 09/13/2006 Morada Lane MW 635' 8 8 60 6 344 8 09 114 9 22 2 0 1104441 09/13/2006 Morada Lane MW-635' -8.8 -60.6 344 8.09 -114.9 22.2 0.1104732 12/11/2006 Morada Lane MW-635' -8 9 -61 0 ND104732 12/11/2006 Morada Lane MW-635' -8.9 -61.0 ND104835 01/12/2007 Morada Lane MW-635' -8.9 -62.0 ND 478 8.02 -39 19.9 0.5104835 01/12/2007 Morada Lane MW-635 -8.9 -62.0 ND 478 8.02 -39 19.9 0.5105096 03/27/2007 M d L MW 635' 8 9 64 6 ND105096 03/27/2007 Morada Lane MW-635' -8.9 -64.6 ND105096 03/27/2007 Morada Lane MW 635 8.9 64.6 ND105377 06/12/2007 Morada Lane MW 635' 9 0 51 6 ND 524 7 78 187 20 7 0 3105377 06/12/2007 Morada Lane MW-635' -9.0 -51.6 ND 524 7.78 -187 20.7 0.3104930 02/21/2007 Morada Lane CSW-19 -8 9 -63 2 ND 649 7 44 407 18 0 2 7104930 02/21/2007 Morada Lane CSW-19 -8.9 -63.2 ND 649 7.44 407 18.0 2.7104986 03/21/2007 M d L CSW 19 9 0 63 7 0 71 664 7 35 333 19 9 3 1104986 03/21/2007 Morada Lane CSW-19 -9.0 -63.7 0.71 664 7.35 333 19.9 3.1104986 03/21/2007 Morada Lane CSW 19 9.0 63.7 0.71 664 7.35 333 19.9 3.1105112 04/06/2007 Morada Lane CSW 19 9 1 62 8 602 7 41 340 20 4 2 5105112 04/06/2007 Morada Lane CSW-19 -9.1 -62.8 602 7.41 340 20.4 2.5105176 05/03/2007 Morada Lane CSW-19 -9 0 -63 8 0 15 625 7 5 372 19 8 2 3105176 05/03/2007 Morada Lane CSW-19 -9.0 -63.8 0.15 625 7.5 372 19.8 2.3105302 05/31/2007 Morada Lane CSW-19 -9.1 -63.1 ND105302 05/31/2007 Morada Lane CSW-19 -9.1 -63.1 ND104440 09/13/2006 M d L CSW 24 9 2 65 5 760 6 88 179 20 1 5 2104440 09/13/2006 Morada Lane CSW-24 -9.2 -65.5 760 6.88 179 20.1 5.2104440 09/13/2006 Morada Lane CSW 24 9.2 65.5 760 6.88 179 20.1 5.2104645 11/06/2006 Morada Lane CSW 24 9 3 67 8 ND 751 7 54 315 19 8 4 8104645 11/06/2006 Morada Lane CSW-24 -9.3 -67.8 ND 751 7.54 315 19.8 4.8104735 12/13/2006 Morada Lane CSW-24 -9 3 -68 1 ND 732 7 53 343 19 3 6 2104735 12/13/2006 Morada Lane CSW-24 -9.3 -68.1 ND 732 7.53 343 19.3 6.2104842 01/19/2007 M d L CSW 24 9 2 66 4 ND 760 7 4 138 18 7 1 8104842 01/19/2007 Morada Lane CSW-24 -9.2 -66.4 ND 760 7.4 138 18.7 1.8104842 01/19/2007 Morada Lane CSW 24 9.2 66.4 ND 760 7.4 138 18.7 1.8104869 01/30/2007 Morada Lane CSW 24 9 2 66 3 10 50 727 7 5 324 19 2 4 7104869 01/30/2007 Morada Lane CSW-24 -9.2 -66.3 10.50 727 7.5 324 19.2 4.7104874 02/02/2007 Morada Lane CSW-24 -9 2 -65 6 9 71 734 7 35 330 19 2 1 8104874 02/02/2007 Morada Lane CSW-24 -9.2 -65.6 9.71 734 7.35 330 19.2 1.8104900 02/09/2007 Morada Lane CSW-24 -9.2 -70.0 7.22 744 7.44 288 19.3104900 02/09/2007 Morada Lane CSW-24 -9.2 -70.0 7.22 744 7.44 288 19.3105423 06/19/2007 M d L CSW 24 f 9 4 65 1 ND105423 06/19/2007 Morada Lane CSW-24-surface -9.4 -65.1 ND105423 06/19/2007 Morada Lane CSW 24 surface 9.4 65.1 ND105424 06/19/2007 Morada Lane CSW 24 315' 9 3 67 4 ND105424 06/19/2007 Morada Lane CSW-24-315' -9.3 -67.4 ND105425 06/19/2007 Morada Lane CSW-24-350' ND105425 06/19/2007 Morada Lane CSW-24-350 ND105426 06/20/2007 M d L CSW 24 420' ND105426 06/20/2007 Morada Lane CSW-24-420' ND105426 06/20/2007 Morada Lane CSW 24 420 ND105427 06/20/2007 Morada Lane CSW 24 450' ND105427 06/20/2007 Morada Lane CSW-24-450' ND105428 06/20/2007 Morada Lane CSW-24-481' -9 4 -67 6 ND105428 06/20/2007 Morada Lane CSW-24-481' -9.4 -67.6 ND
GAMA: Water Quality Changes during Groundwater Banking, Appendix A: Data Tables Page A15

Table A-7: Morada Noble Gas and Tritium Data
LLNL ID Site Location Sample Date 4He (cc STP/g)
Ne (cc STP/g) Ar (cc STP/g)
Kr (cc STP/g)
Xe (cc STP/g)
3H pCi/L +/- 3He/4He +/- Excess Air (cc STP/g)
+/- Radiogenic 4He (cc STP/g)
Radiogenic 4He error (cc
STP/g)
3H-3He age (yr)
3H-3He age error (yr)
Percent Premodern
Recharge Temp. from Xe (deg C)
Recharge Temp. from
Xe error (deg C)
104444 Morada MW-114' 09/14/06 5.82E-08 2.31E-07 3.70E-04 8.28E-08 1.12E-08 10.38 0.48 1.38E-06 1.04E-08 0.0020 0.0003 1.91E-09 1.13E-09 1.7 0.2 21% 15.5 1.0104877 Morada MW-114' 02/02/07 6.10E-08 2.69E-07 3.47E-04 7.51E-08 9.89E-09 10.00 0.50 1.37E-06 1.03E-08 0.0042 0.0003 0.00E+00 1.39E-09 -0.4 1.0 25% 20.6 1.2104737 Morada MW-114' 12/13/06 5.96E-08 2.50E-07 3.50E-04 7.59E-08 1.03E-08 10.12 0.50 1.36E-06 1.02E-08 0.0031 0.0003 0.00E+00 1.26E-09 0.0 1.0 25% 18.6 1.1104438 Morada MW-220' 09/13/06 7.75E-08 3.54E-07 4.03E-04 7.86E-08 1.01E-08 44.68 1.50 4.95E-06 3.71E-08 0.0091 0.0004 0.00E+00 1.88E-09 39.3 0.6 77% 22.3 1.9104736 Morada MW-220' 12/12/07 36.70 0.50104913 Morada MW-220' 02/14/07 46.79 1.73104736 Morada MW-220' 12/12/07 38.45 1.47104443 Morada MW-300' 09/13/06 48.75 1.81104443 Morada MW-300' 09/13/06 9.51E-08 3.95E-07 4.81E-04 9.77E-08 1.19E-08 47.00 2.00 4.60E-06 3.45E-08 0.0109 0.0004 0.00E+00 2.05E-09 40.1 0.7 78% 16.7 1.8104734 Morada MW-300' 12/12/06 8.20E-08 3.40E-07 4.20E-04 8.28E-08 1.11E-08 51.26 0.50 5.42E-06 4.06E-08 0.0083 0.0004 0.00E+00 1.76E-09 40.0 0.2 75% 18.4 1.6104914 Morada MW-300' 02/14/07 63.24 2.83104914 Morada MW-300' 02/14/07 62.77 2.48104442 Morada MW-540' 09/13/06 1.92E-07 2.48E-07 3.74E-04 8.00E-08 1.14E-08 0.06 0.12 1.57E-06 1.18E-08 0.0030 0.0003 1.30E-07 2.88E-09 >50 100% 15.2 1.0104915 Morada MW-540' 02/14/07 1.01 0.26104441 Morada MW-635' 09/13/06 1.03E-06 2.21E-07 4.27E-04 8.11E-08 1.11E-08 0.00 0.12 1.15E-06 8.60E-09 0.0013 0.0002 9.75E-07 1.95E-08 >50 100% bad fit na104930 Morada CSW-19 02/22/07 7.01E-08 2.91E-07 3.91E-04 8.47E-08 1.13E-08 60.25 2.31 3.38E-06 2.54E-08 0.0052 0.0003 0.00E+00 1.48E-09 24.8 0.5 bad fit 16.3 1.2104440 Morada CSW-24 09/13/06 7.58E-08 3.68E-07 4.26E-04 8.58E-08 1.11E-08 25.16 1.02 3.68E-06 2.76E-08 0.0094 0.0004 0.00E+00 1.97E-09 41.1 0.7 89% 18.8 1.8104900 Morada CSW-24 02/09/07 7.59E-08 3.03E-07 4.12E-04 8.37E-08 1.09E-08 44.87 1.89 3.43E-06 2.57E-08 0.0059 0.0003 0.00E+00 1.54E-09 30.4 0.6 43% 17.8 1.3104900 Morada CSW-24 02/09/07 7.47E-08 3.15E-07 4.03E-04 8.56E-08 1.07E-08 42.78 1.73 3.43E-06 2.57E-08 0.0065 0.0003 0.00E+00 1.62E-09 30.9 0.6 48% 18.9 1.4
GAMA: Water Quality Changes during Groundwater Banking, Appendix A: Data Tables Page A16

Table A-8: Morada Organic Data
LLNL ID Sample Date Site Location TOC (mg/L) Dichloro methane (ng/L)
MtBE (ng/L) Chloroform (ng/L)
1_2_Dichloropropane (ng/L)
Bromo dichloro methane (ng/L)
Toluene (ng/L)
Tetrachloro ethene (ng/L)
Dibromo chloro methane (ng/L)
Bromoform (ng/L)
DEET (ng/L) Triclosan (ng/L)
Triphenyl phosphate (ng/L)
Norflurazon (ng/L)
Simazine (ng/L)
104439 09/14/2006 Morada Canal 2.2 11 <5 <5 <5 <5 <5 <5 <5 <5 ND ND ND ND 14104916 02/14/2007 Morada DB2 Pond (Bubbler at culvert) NM 12 <5 102 <5 6 16 <5 <5 <5 NM NM NM NM NM104446 09/13/2006 Morada DB Pond (Ramp) 3.5 13 <5 13 <5 <5 12 <5 <5 <5 34 ND ND ND ND104444 09/14/2006 Morada MW-114' 1.2 20 <5 71 <5 <5 19 <5 <5 <5 71 ND 66 ND ND104877 02/02/2007 Morada MW-114' NM 17 <5 21 <5 <5 <5 <5 <5 <5 NM NM NM NM NM104438 09/13/2006 Morada MW-220' 0.4 12 <5 <5 <5 <5 13 <5 <5 <5 24 ND 49 ND ND104913 02/14/2007 Morada MW-220' NM 9 <5 8 <5 <5 <5 <5 <5 <5 NM NM NM NM NM104443 09/13/2006 Morada MW-300' 0.5 9 <5 <5 <5 <5 6 <5 <5 <5 20 ND 51 ND ND104914 02/14/2007 Morada MW-300' NM 10 <5 <5 <5 <5 <5 <5 <5 <5 NM NM NM NM NM104442 09/13/2006 Morada MW-540' 0.2 9 <5 <5 <5 <5 29 <5 <5 <5 31 ND 49 ND ND104915 02/14/2007 Morada MW-540' NM 10 <5 <5 <5 <5 <5 <5 <5 <5 NM NM NM NM NM104441 09/13/2006 Morada MW-635' 0.4 9 <5 <5 <5 <5 9 <5 <5 <5 68 ND 76 ND ND104930 02/21/2007 Morada CSW-19 NM 12 <5 9 13 <5 <5 <5 <5 <5 NM NM NM NM NM104440 09/13/2006 Morada CSW-24 0.7 14 <5 <5 <5 <5 <5 <5 <5 <5 ND ND ND ND ND104900 02/09/2007 Morada CSW-24 NM 11 <5 8 <5 <5 <5 <5 <5 <5 NM NM NM NM NM
GAMA: Water Quality Changes during Groundwater Banking, Appendix A: Data Tables Page A17