JCI 2 figures.ppt
13
Figure S1 A naline (nM) scent A Plasma adren B renaline (nM) No scent Plasma adr Figure S1 Time course of plasma adrenaline levels following acute stress. Plasma adrenaline levels were measured following acute stress (1 hour immobilization) with fox scent (A) or without were measured following acute stress (1 hour immobilization) with fox scent (A) or without fox scent (B) at indicated time points. Error bars represent SD from the average of 3 mice.
Transcript of JCI 2 figures.ppt
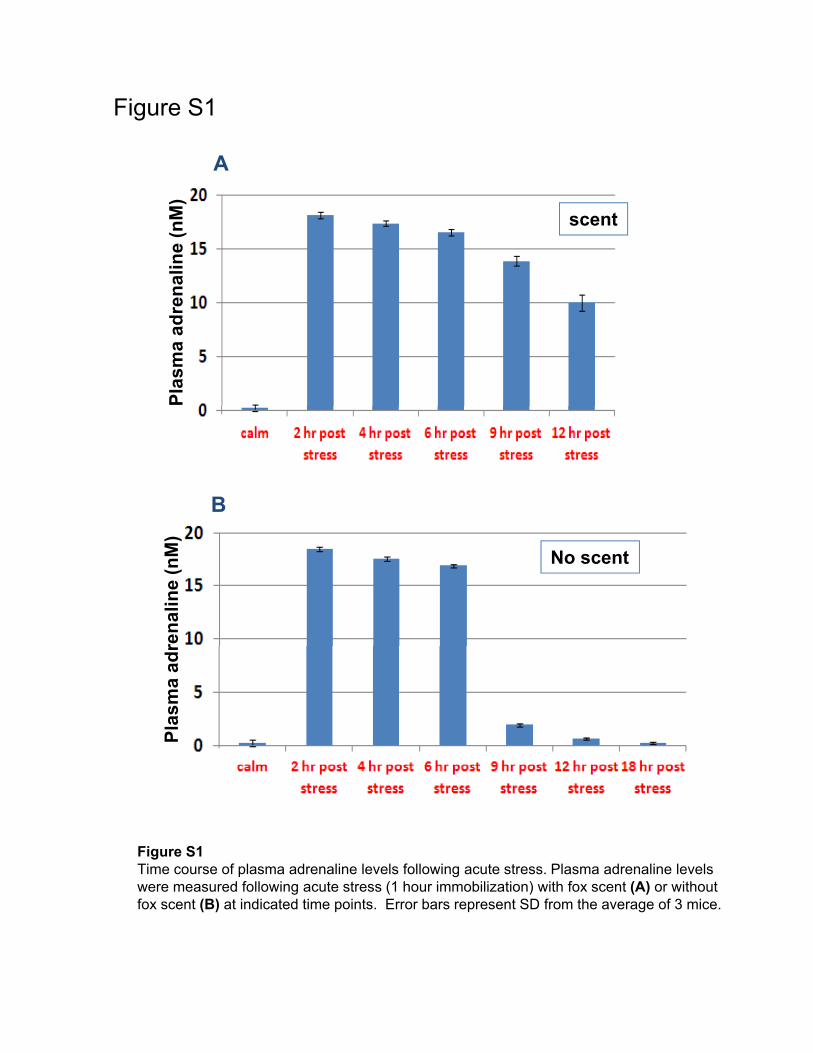
Figure S1
An
alin
e (n
M)
scent
AP
lasm
a ad
ren
B
ren
alin
e (n
M)
No scent
Pla
sma
adr
Figure S1Time course of plasma adrenaline levels following acute stress. Plasma adrenaline levels were measured following acute stress (1 hour immobilization) with fox scent (A) or withoutwere measured following acute stress (1 hour immobilization) with fox scent (A) or without fox scent (B) at indicated time points. Error bars represent SD from the average of 3 mice.

Table S1. Tissue content of adrenaline and noradrenaline in spleen, C42LucBAD ft d t t f l d t d i ( 3/ ) d 1h
Tissue types Adrenaline ( )
Noradrenaline( )
xenografts, and prostates of calm and stressed mice (n=3/group) measured 1h after stress (ng/mg wet tissue ± 1 SD)
(ELISA) (HPLC)
Spleen (calm) 0.05±0.12 0.21±0.14
Spleen (stress) 0.26±0.03 0.86±0.55
X f 0 02 0 01 0 03 0 03Xenograft(calm)
0.02±0.01 0.03±0.03
Xenograft(stress)
0.12±0.049 0.11±0.04
Prostate (calm) 0.053±0.065 0.28±0.05
Prostate (stress) 0.18±0.006 0.54±0.11
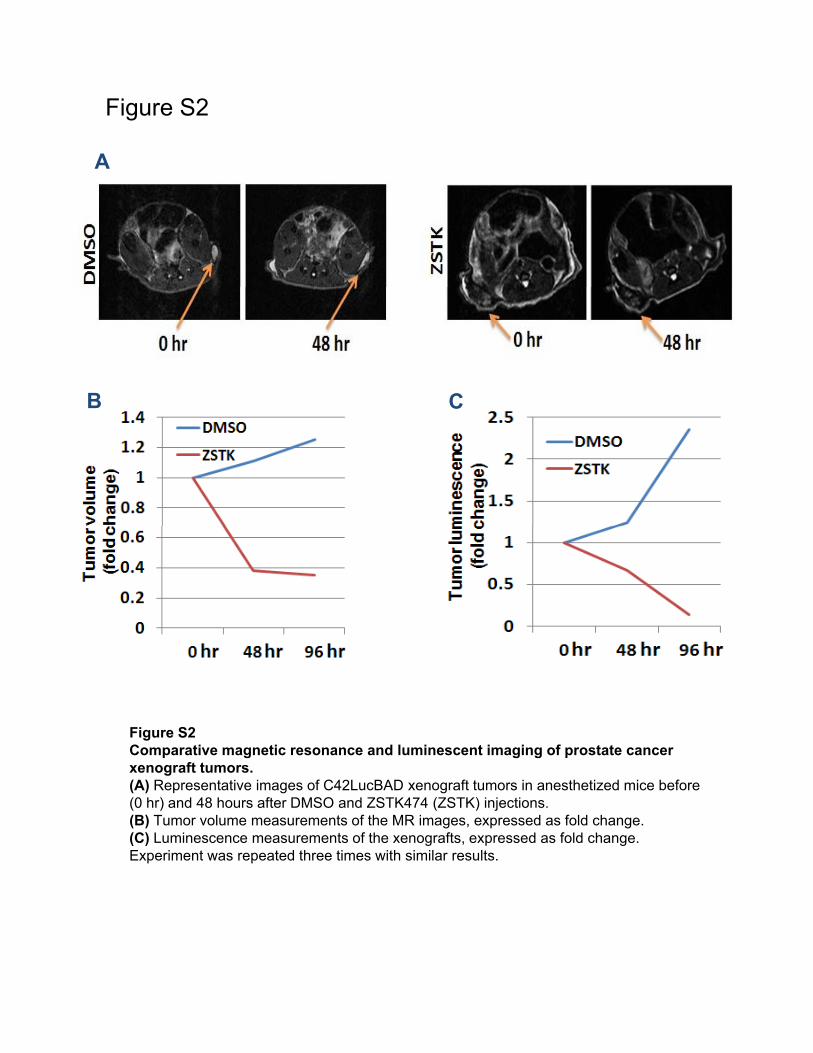
Figure S2
AA
B CB C
Figure S2Comparative magnetic resonance and luminescent imaging of prostate cancer xenograft tumorsxenograft tumors.(A) Representative images of C42LucBAD xenograft tumors in anesthetized mice before (0 hr) and 48 hours after DMSO and ZSTK474 (ZSTK) injections. (B) Tumor volume measurements of the MR images, expressed as fold change. (C) Luminescence measurements of the xenografts, expressed as fold change. Experiment was repeated three times with similar results.

Figure S3
A
B
Figure S3gDouble immunofluorescence for cleaved caspase 3 (c-caspase 3) and DNA fragmentation (TUNEL) in C42LucBAD cells and xenografts.Detection of c-caspase 3 in relation to DNA fragmentation (TUNEL) in (A) human prostate cancer (C42LucBAD) cells treated with DMSO or PI3 kinase inhibitor ZSTK474 (5 µM) for 4 hours and (B) C42LucBAD xenografts treated with DMSO or ZSTK474 (5 mM, 40 µl; 0.8 mg/kg) for 6 hours. Increased staining for c-caspase 3 and TUNEL was observed in ZSTK474-treated samples. Co-localization of c-caspase 3 and TUNEL staining wasZSTK474 treated samples. Co localization of c caspase 3 and TUNEL staining was observed in C42LucBAD cells.
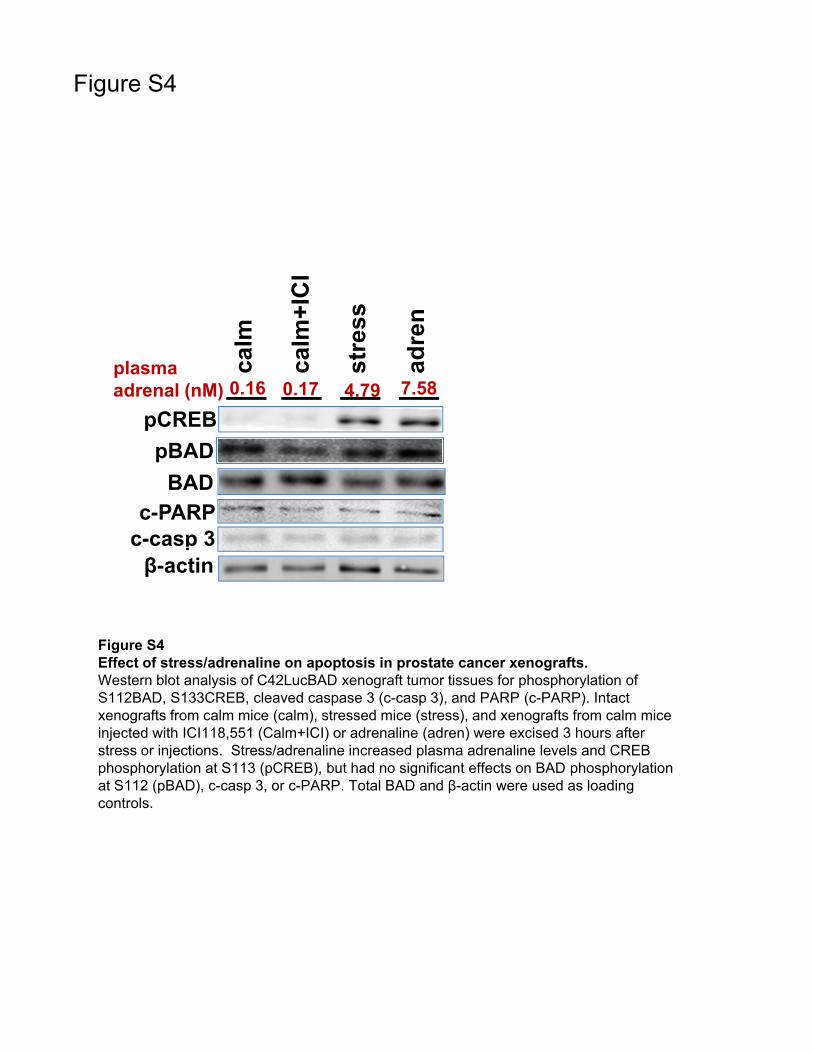
Figure S4
CI
plasma adrenal (nM)
calm
calm
+IC
stre
ss
adre
n0.16 0.17 4.79 7.58
pCREB
pBAD
c-PARP
BAD
Figure S4
c-casp 3β-actin
Figure S4Effect of stress/adrenaline on apoptosis in prostate cancer xenografts.Western blot analysis of C42LucBAD xenograft tumor tissues for phosphorylation of S112BAD, S133CREB, cleaved caspase 3 (c-casp 3), and PARP (c-PARP). Intact xenografts from calm mice (calm), stressed mice (stress), and xenografts from calm mice injected with ICI118,551 (Calm+ICI) or adrenaline (adren) were excised 3 hours after stress or injections. Stress/adrenaline increased plasma adrenaline levels and CREB phosphorylation at S113 (pCREB) but had no significant effects on BAD phosphorylationphosphorylation at S113 (pCREB), but had no significant effects on BAD phosphorylation at S112 (pBAD), c-casp 3, or c-PARP. Total BAD and β-actin were used as loading controls.
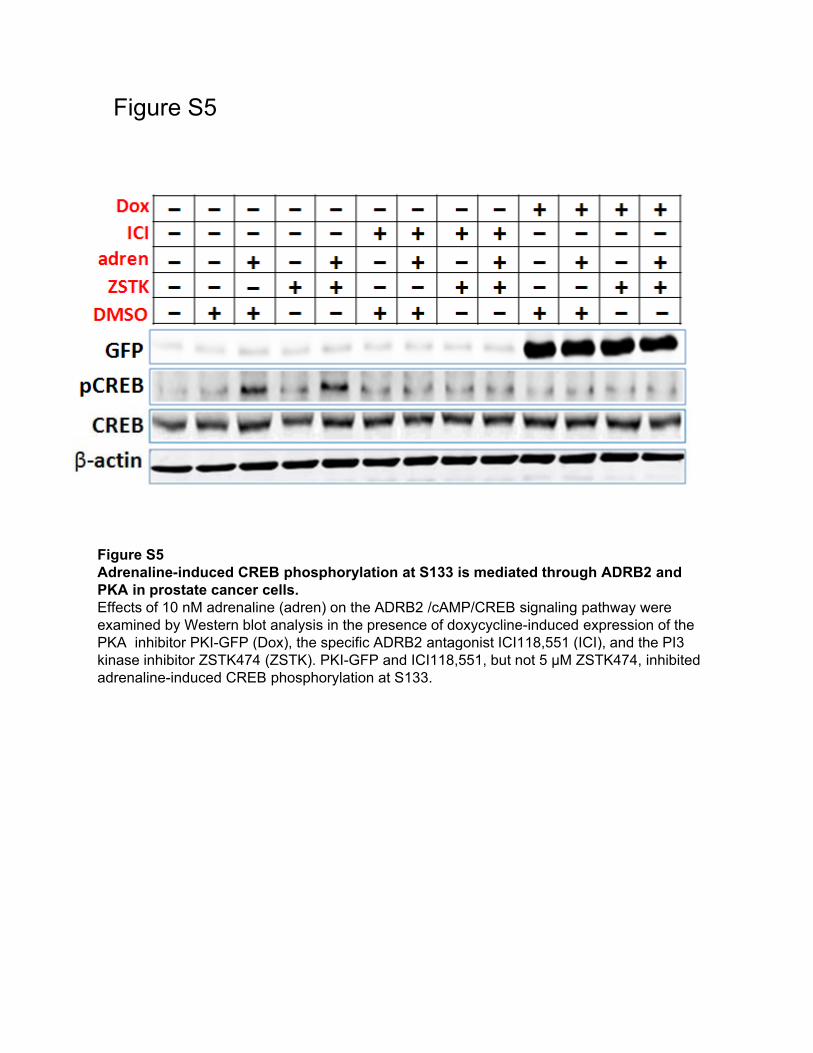
Figure S5
Figure S5Adrenaline-induced CREB phosphorylation at S133 is mediated through ADRB2 and PKA in prostate cancer cells.Effects of 10 nM adrenaline (adren) on the ADRB2 /cAMP/CREB signaling pathway were examined by Western blot analysis in the presence of doxycycline-induced expression of the PKA inhibitor PKI-GFP (Dox), the specific ADRB2 antagonist ICI118,551 (ICI), and the PI3PKA inhibitor PKI GFP (Dox), the specific ADRB2 antagonist ICI118,551 (ICI), and the PI3 kinase inhibitor ZSTK474 (ZSTK). PKI-GFP and ICI118,551, but not 5 μM ZSTK474, inhibited adrenaline-induced CREB phosphorylation at S133.

Figure S6
AA
BB
Figure S6Stress-induced serum adrenaline levels correlate with CREB and BAD phosphorylation in BALB/c mouse prostate glands.phosphorylation in BALB/c mouse prostate glands.(A) Western blot analysis of CREB phosphorylation at Ser133 and BAD phosphorylation at Ser112 in mouse prostate glands. Blood and anterior prostate lobes were collected from intact (calm) or stressed mice. Plasma adrenaline levels (nM; shown above Western blot) were determined by ELISA; CREB and BAD phosphorylation were measured by Western blotting with phospho-specific antibodies, followed by fluorescently labeled secondary antibodies. (B) Correlation plots of CREB (right) and BAD (left) phosphorylation (pS133CREB/beta-actin; pS112BAD/beta-actin) and adrenaline levels in blood. Significant correlations were found between adrenaline levels and BAD, adrenaline levels and CREB phosphorylation, by linear regression analysis (p=0.0001 for pCREB, p=0.0436 for pBAD).
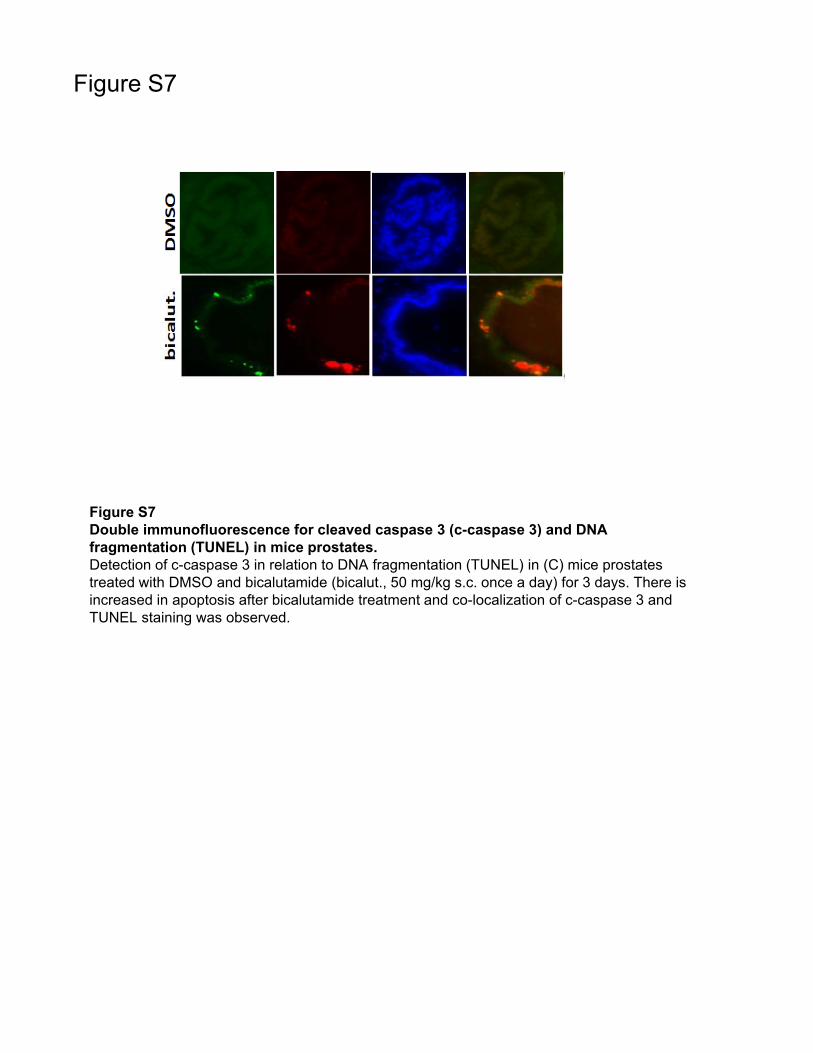
Figure S7
Figure S7D bl i fl f l d 3 ( 3) d DNADouble immunofluorescence for cleaved caspase 3 (c-caspase 3) and DNA fragmentation (TUNEL) in mice prostates.Detection of c-caspase 3 in relation to DNA fragmentation (TUNEL) in (C) mice prostates treated with DMSO and bicalutamide (bicalut., 50 mg/kg s.c. once a day) for 3 days. There is increased in apoptosis after bicalutamide treatment and co-localization of c-caspase 3 and TUNEL staining was observed.
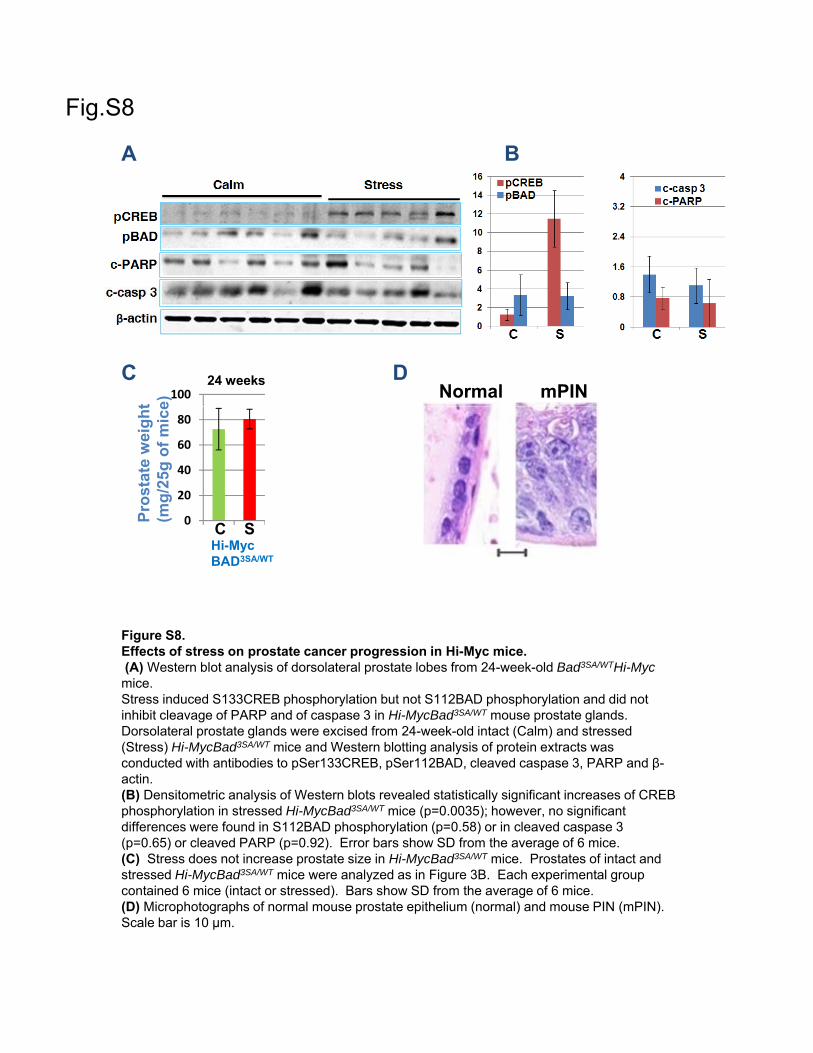
Fig.S8
A B
C
t e)
10024 weeks D
mPINNormal
C S
Pro
stat
e w
eig
ht
(mg
/25g
of
mic
e
0
20
40
60
80
Figure S8.
C SHi-MycBAD3SA/WT
Effects of stress on prostate cancer progression in Hi-Myc mice.(A) Western blot analysis of dorsolateral prostate lobes from 24-week-old Bad3SA/WTHi-Mycmice. Stress induced S133CREB phosphorylation but not S112BAD phosphorylation and did not inhibit cleavage of PARP and of caspase 3 in Hi-MycBad3SA/WT mouse prostate glands. Dorsolateral prostate glands were excised from 24-week-old intact (Calm) and stressed (Stress) Hi-MycBad3SA/WT mice and Western blotting analysis of protein extracts was conducted with antibodies to pSer133CREB pSer112BAD cleaved caspase 3 PARP and β-conducted with antibodies to pSer133CREB, pSer112BAD, cleaved caspase 3, PARP and βactin. (B) Densitometric analysis of Western blots revealed statistically significant increases of CREB phosphorylation in stressed Hi-MycBad3SA/WT mice (p=0.0035); however, no significant differences were found in S112BAD phosphorylation (p=0.58) or in cleaved caspase 3 (p=0.65) or cleaved PARP (p=0.92). Error bars show SD from the average of 6 mice. (C) Stress does not increase prostate size in Hi-MycBad3SA/WT mice. Prostates of intact and stressed Hi-MycBad3SA/WT mice were analyzed as in Figure 3B. Each experimental group contained 6 mice (intact or stressed). Bars show SD from the average of 6 mice.(D) Microphotographs of normal mouse prostate epithelium (normal) and mouse PIN (mPIN). Scale bar is 10 µm.

A
Fig.S9
B
A %
ch
ang
eP
SA
Figure S9Prostate-specific antigen (PSA) secretion in response to adrenaline and stress.(A) Measurement of PSA secretion in serum-free culture medium of LNCaP and C4-2 human prostate cancer cells stimulated with 10 nM adrenaline (adren) and 10 nM synthetic androgen r1881 for 24 hours. 10 nM adrenaline did not stimulate PSA secretion in LNCaP and C4-2 cells. (B) PSA in serum, expressed as percent change, in C4-2 xenograft mice model in calm and stressed conditions at 0 and 48 hours. Stress-induced adrenaline did not change PSA secretion from C42Luc xenografts in blood. Bars show SD from the average of 3 samples.
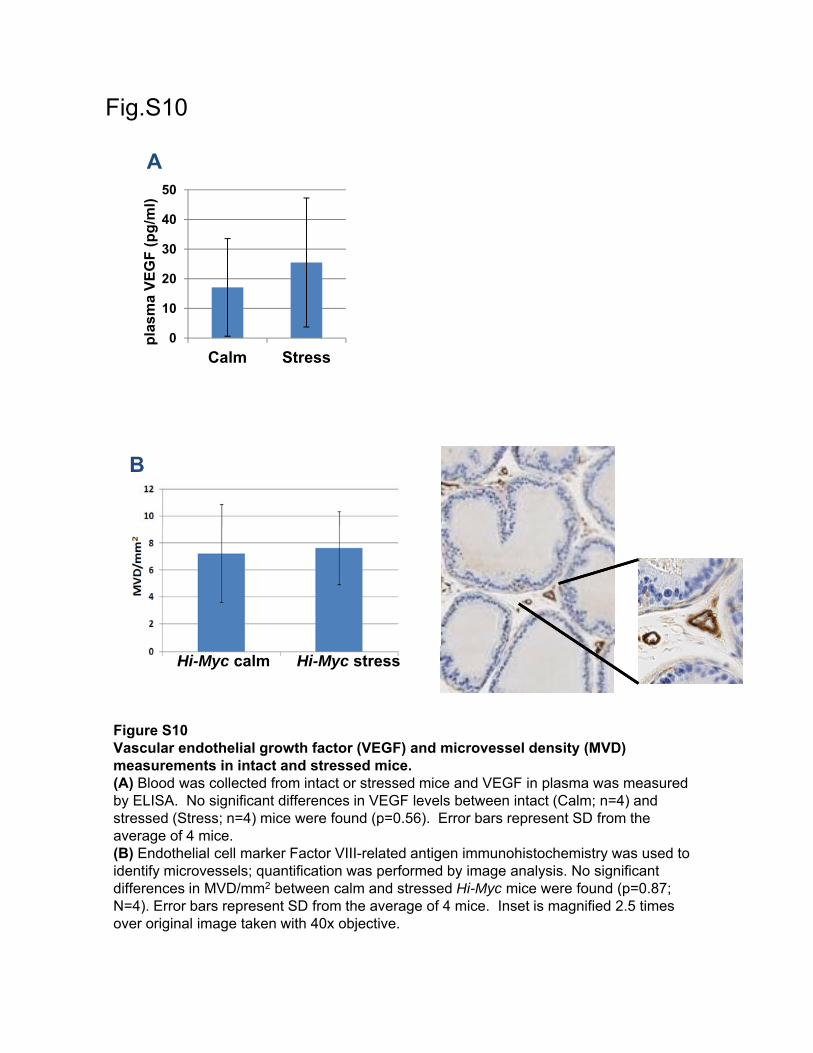
Fig.S10
A
20
30
40
50
VE
GF
(p
g/m
l)A
0
10
Calm Stress
pla
sma
V
B
Figure S10Vascular endothelial growth factor (VEGF) and microvessel density (MVD) measurements in intact and stressed mice
Hi-Myc calm Hi-Myc stress
measurements in intact and stressed mice.(A) Blood was collected from intact or stressed mice and VEGF in plasma was measured by ELISA. No significant differences in VEGF levels between intact (Calm; n=4) and stressed (Stress; n=4) mice were found (p=0.56). Error bars represent SD from the average of 4 mice. (B) Endothelial cell marker Factor VIII-related antigen immunohistochemistry was used to identify microvessels; quantification was performed by image analysis. No significant diff i MVD/ 2 b t l d t d Hi M i f d ( 0 87differences in MVD/mm2 between calm and stressed Hi-Myc mice were found (p=0.87; N=4). Error bars represent SD from the average of 4 mice. Inset is magnified 2.5 times over original image taken with 40x objective.

Fig.S11
Myc
4-2
cells
-AR
nu
llll
s
β2-AR
β-actin
Wt
Hi-
M
C4
β2
ceβ
human prostates mouse prostates
humancancer cells
Figure S11β2-adrenargic receptor (β2-AR) expression in prostate tissues and cells.β2-AR expression was shown in human prostates, mouse prostates and human prostate cancer cells by western blot analysis. β2-AR null ovarian cancer cells A2870 were used
ti t las negative control.
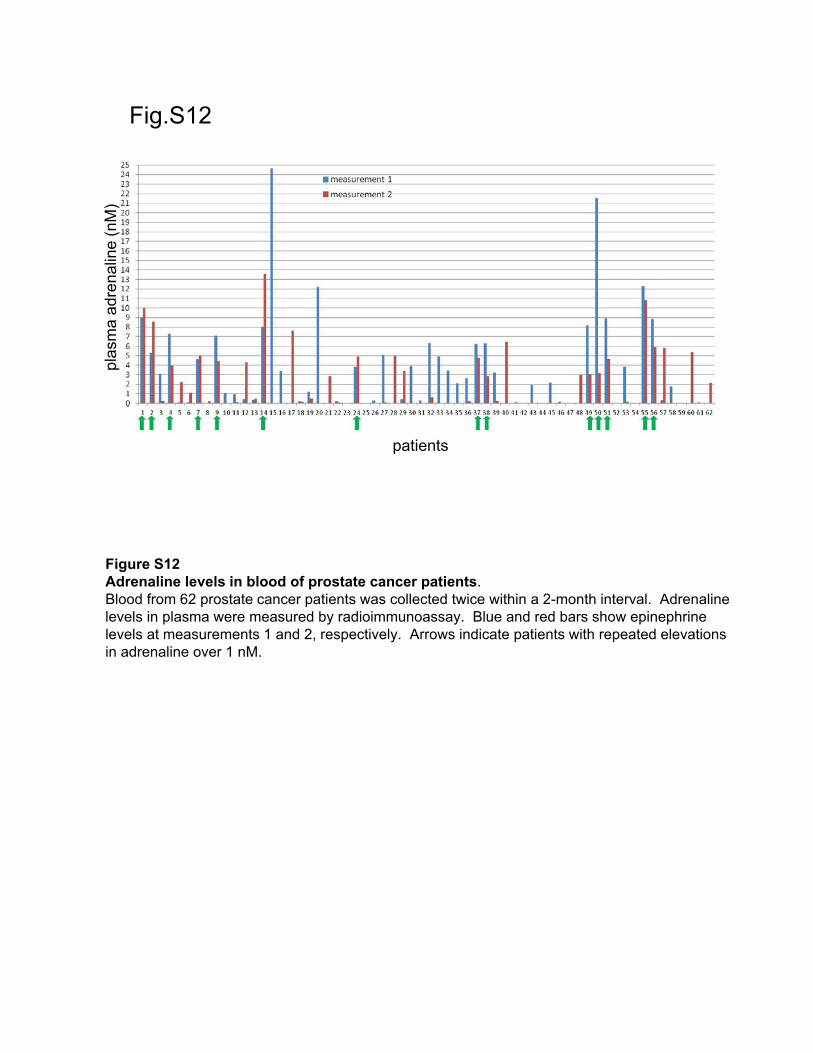
Fig.S12en
alin
e (n
M)
plas
ma
adre
patients
Figure S12 Adrenaline levels in blood of prostate cancer patients. Blood from 62 prostate cancer patients was collected twice within a 2-month interval. Adrenaline levels in plasma were measured by radioimmunoassay. Blue and red bars show epinephrine levels at measurements 1 and 2, respectively. Arrows indicate patients with repeated elevations in adrenaline over 1 nM.