Dynamic Behavior of Elastically Tailored Rotating Blades ...
Demetris Trihinas
JCatascopia: Monitoring Elastically Adaptive Applications in the Cloud
14th IEEE/ACM International Symposium on Cluster, Cloud and Grid Computing (CCGrid 2014)
May 26-29, Chicago, IL, USA
Demetris Trihinas, George Pallis, Marios D. Dikaiakos {trihinas, gpallis, mdd}@cs.ucy.ac.cy
Demetris Trihinas
Presentation Outline
• Elasticity in Cloud Computing
• Cloud Service Monitoring Challenges
• Existing Monitoring Tools and their Limitations
• JCatascopia Monitoring System
• Architecture
• Features
• Evaluation
• Conclusions and Future Work
CCGrid 2014, Chicago, IL, USA, 27 May 2014 2
Demetris Trihinas
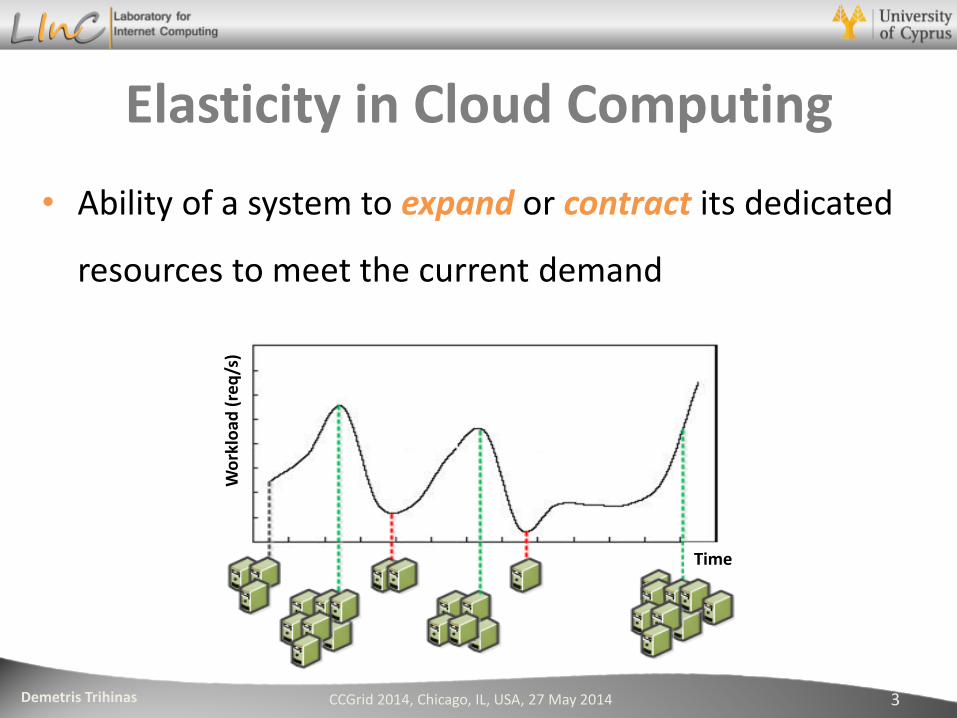
Elasticity in Cloud Computing
• Ability of a system to expand or contract its dedicated
resources to meet the current demand
CCGrid 2014, Chicago, IL, USA, 27 May 2014 3
Wo
rklo
ad (
req
/s)
Time
Demetris Trihinas
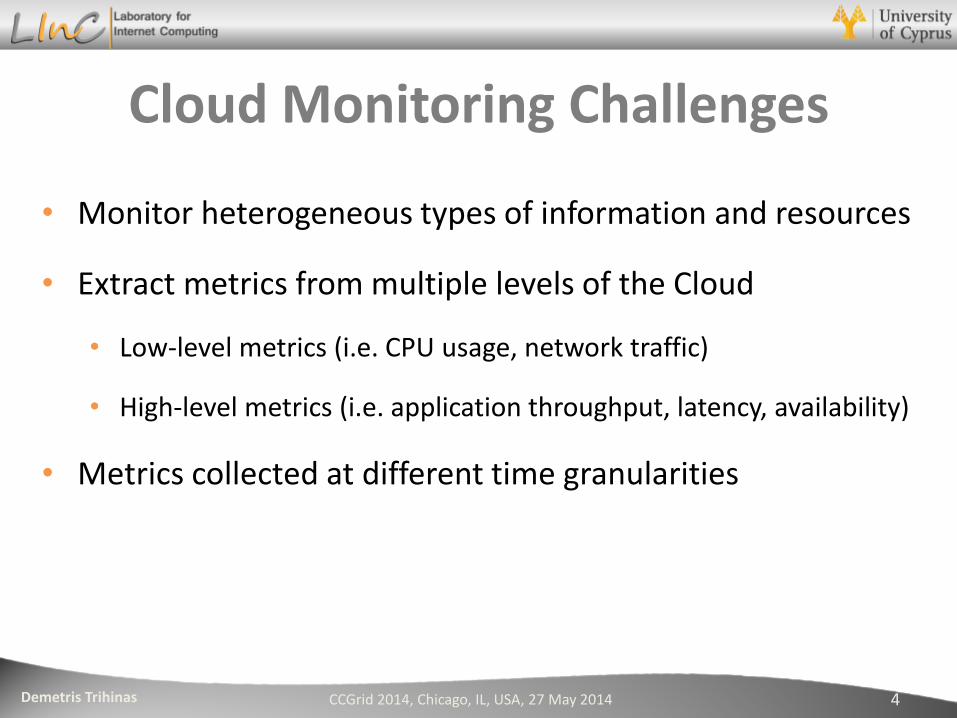
Cloud Monitoring Challenges
• Monitor heterogeneous types of information and resources
• Extract metrics from multiple levels of the Cloud
• Low-level metrics (i.e. CPU usage, network traffic)
• High-level metrics (i.e. application throughput, latency, availability)
• Metrics collected at different time granularities
CCGrid 2014, Chicago, IL, USA, 27 May 2014 4
Demetris Trihinas
Cloud Monitoring Challenges
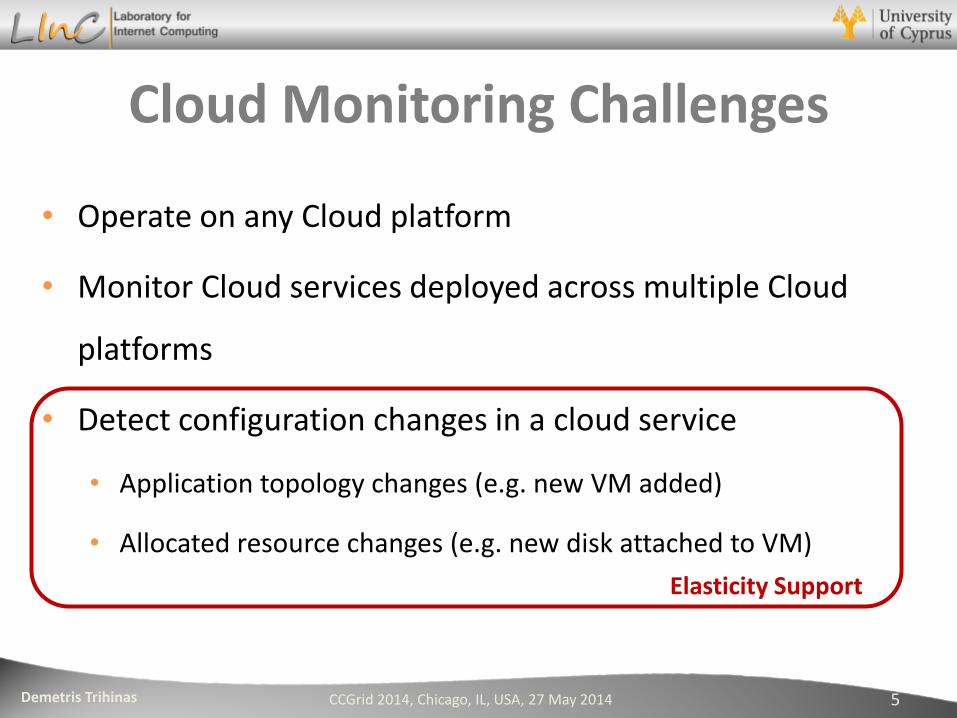
• Operate on any Cloud platform
• Monitor Cloud services deployed across multiple Cloud
platforms
• Detect configuration changes in a cloud service
• Application topology changes (e.g. new VM added)
• Allocated resource changes (e.g. new disk attached to VM)
CCGrid 2014, Chicago, IL, USA, 27 May 2014 5
Elasticity Support
Demetris Trihinas
Existing Monitoring Tools
CCGrid 2014, Chicago, IL, USA, 27 May 2014 6
Demetris Trihinas
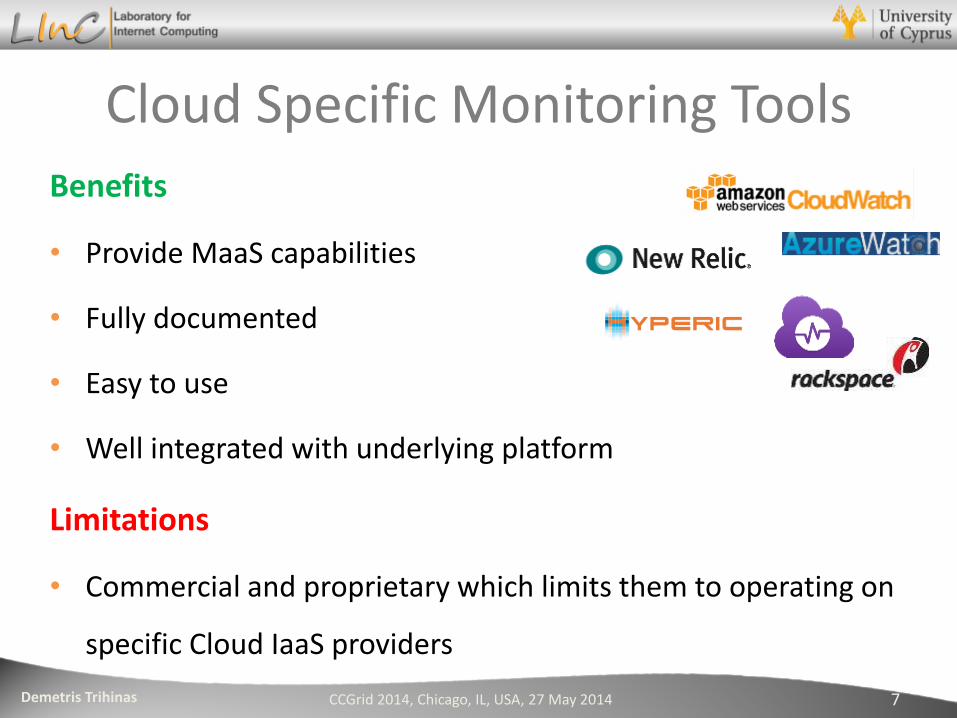
Cloud Specific Monitoring Tools
Benefits
• Provide MaaS capabilities
• Fully documented
• Easy to use
• Well integrated with underlying platform
CCGrid 2014, Chicago, IL, USA, 27 May 2014 7
Limitations
• Commercial and proprietary which limits them to operating on
specific Cloud IaaS providers
Demetris Trihinas
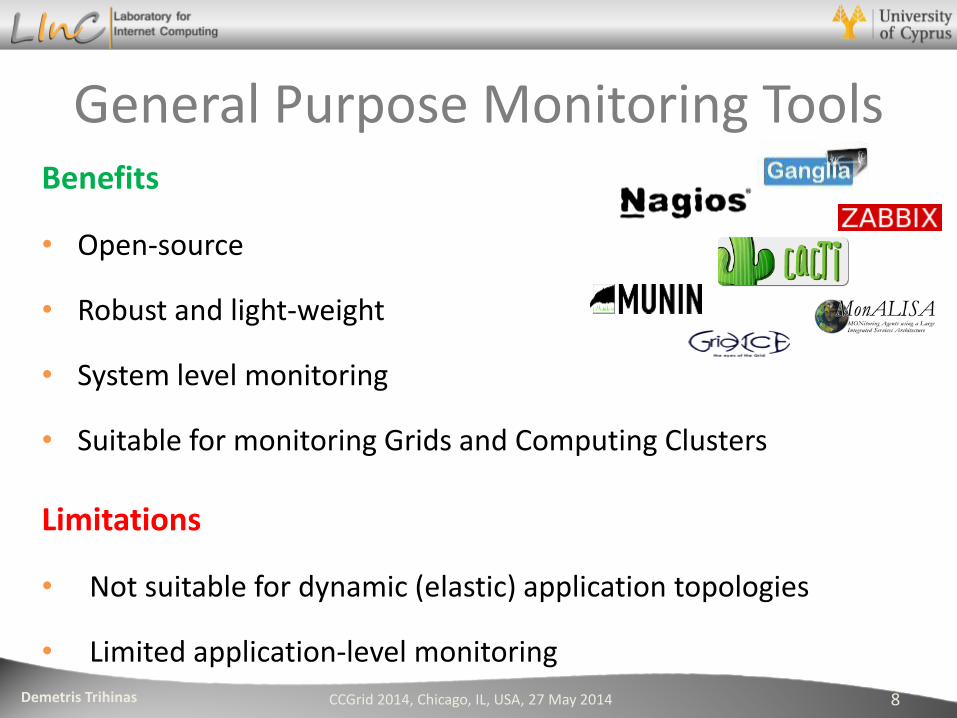
Benefits
• Open-source
• Robust and light-weight
• System level monitoring
• Suitable for monitoring Grids and Computing Clusters
General Purpose Monitoring Tools
CCGrid 2014, Chicago, IL, USA, 27 May 2014 8
Limitations
• Not suitable for dynamic (elastic) application topologies
• Limited application-level monitoring
Demetris Trihinas
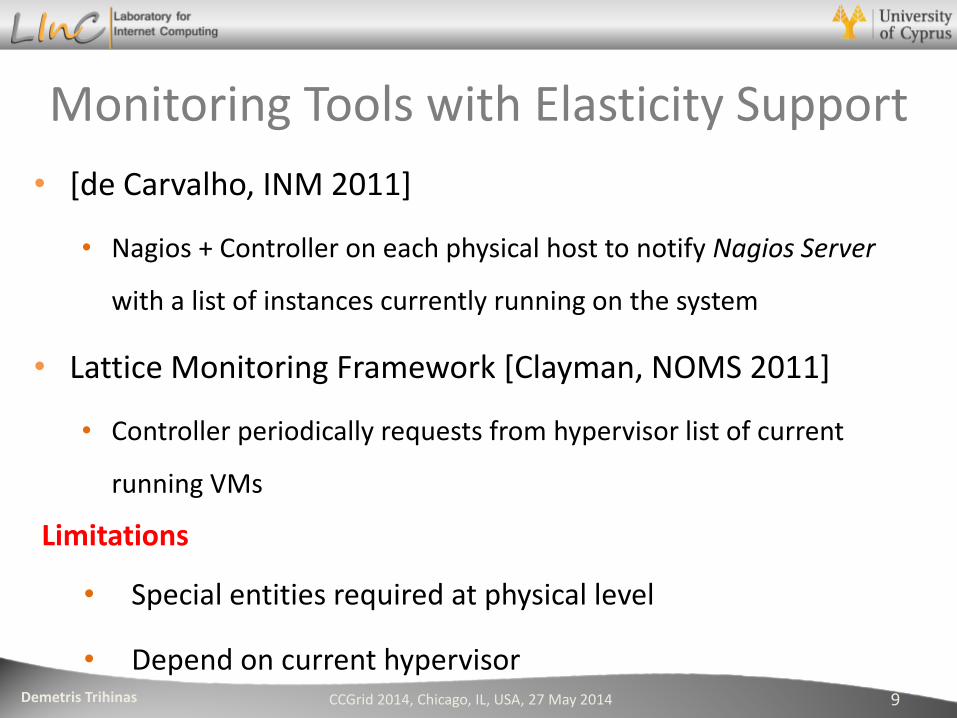
Monitoring Tools with Elasticity Support
• [de Carvalho, INM 2011]
• Nagios + Controller on each physical host to notify Nagios Server
with a list of instances currently running on the system
• Lattice Monitoring Framework [Clayman, NOMS 2011]
• Controller periodically requests from hypervisor list of current
running VMs
CCGrid 2014, Chicago, IL, USA, 27 May 2014 9
Limitations
• Special entities required at physical level
• Depend on current hypervisor
Demetris Trihinas
JCatascopia Monitoring System
CCGrid 2014, Chicago, IL, USA, 27 May 2014 10
Demetris Trihinas
JCatascopia Monitoring System
Open-source
Multi-Layer Cloud Monitoring
Platform Independent
Capable of Supporting Elastic Applications
Interoperable
Scalable
CCGrid 2014, Chicago, IL, USA, 27 May 2014 11

Demetris Trihinas
JCatascopia Architecture
CCGrid 2014, Chicago, IL, USA, 27 May 2014 12
Demetris Trihinas
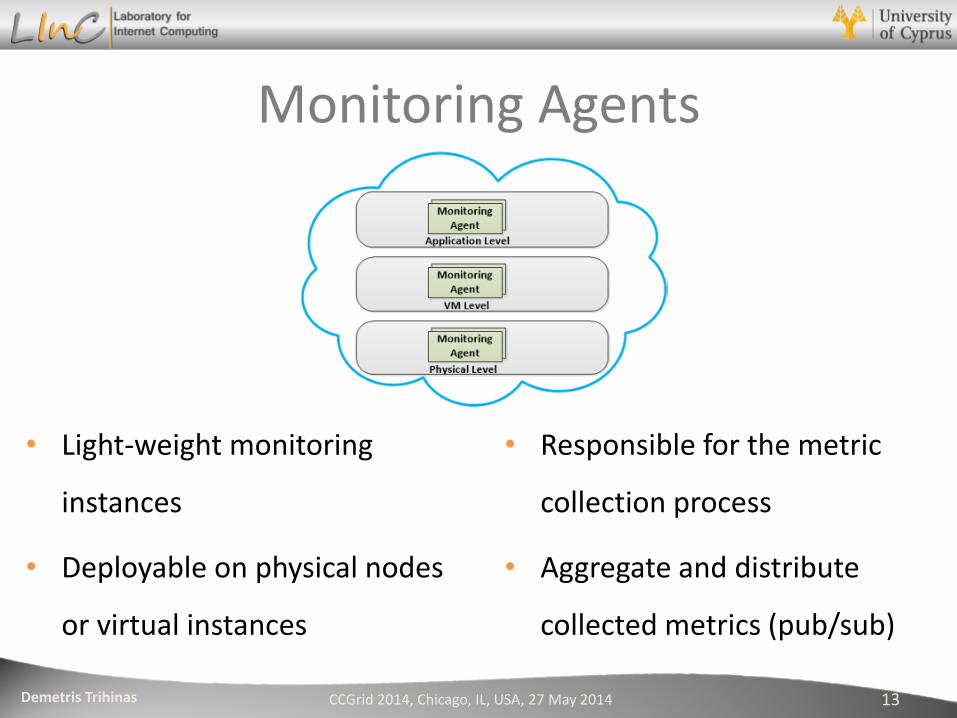
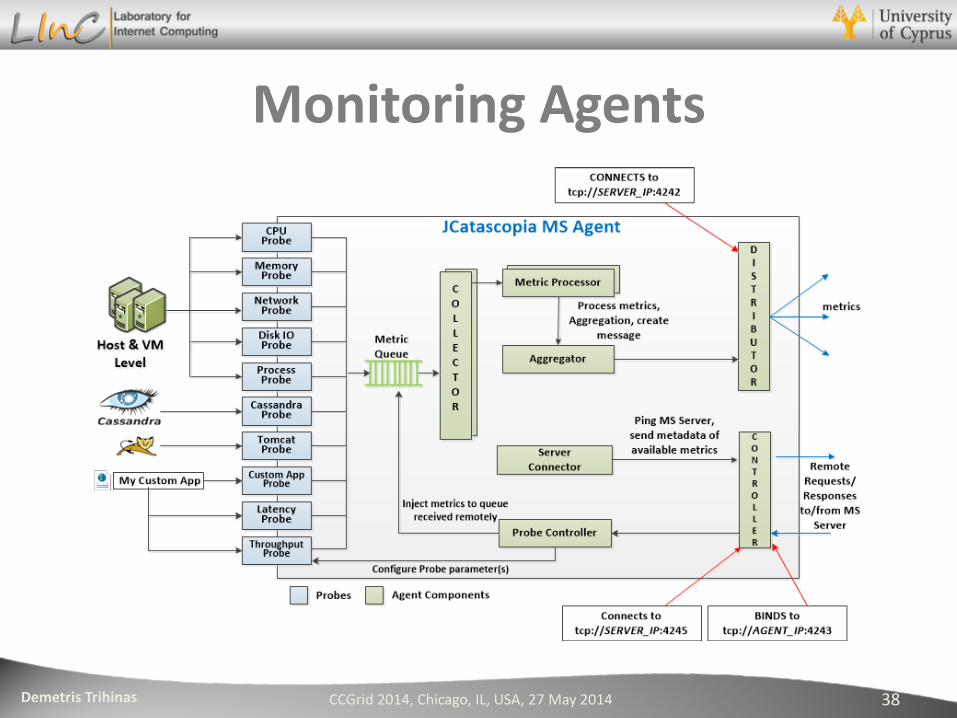
Monitoring Agents
• Light-weight monitoring
instances
• Deployable on physical nodes
or virtual instances
CCGrid 2014, Chicago, IL, USA, 27 May 2014 13
• Responsible for the metric
collection process
• Aggregate and distribute
collected metrics (pub/sub)
Demetris Trihinas
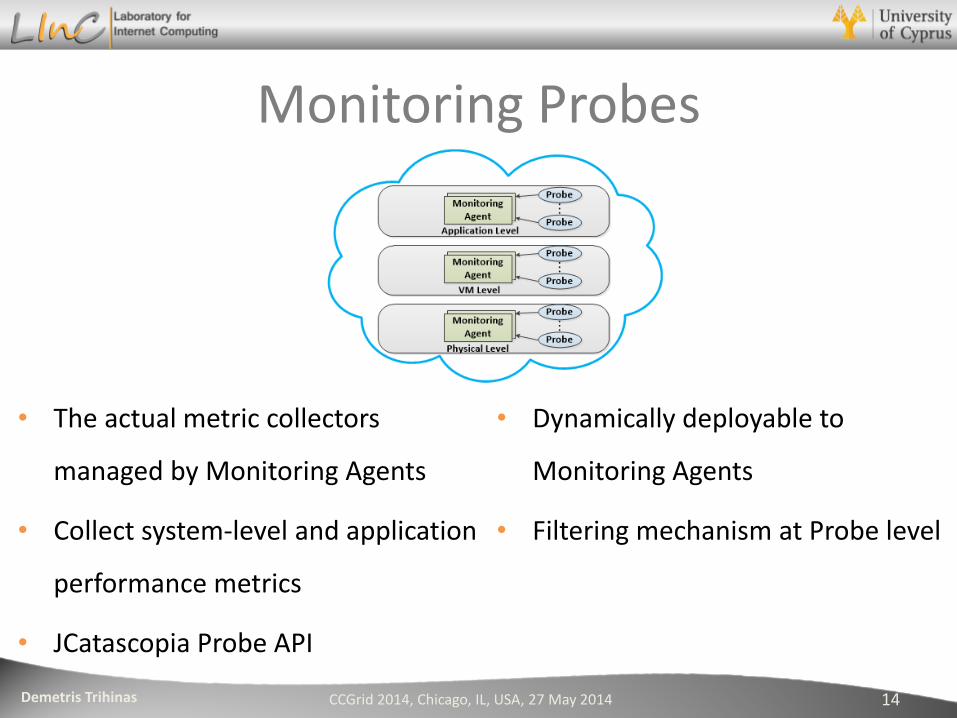
Monitoring Probes
• The actual metric collectors
managed by Monitoring Agents
• Collect system-level and application
performance metrics
• JCatascopia Probe API
CCGrid 2014, Chicago, IL, USA, 27 May 2014 14
• Dynamically deployable to
Monitoring Agents
• Filtering mechanism at Probe level
Demetris Trihinas
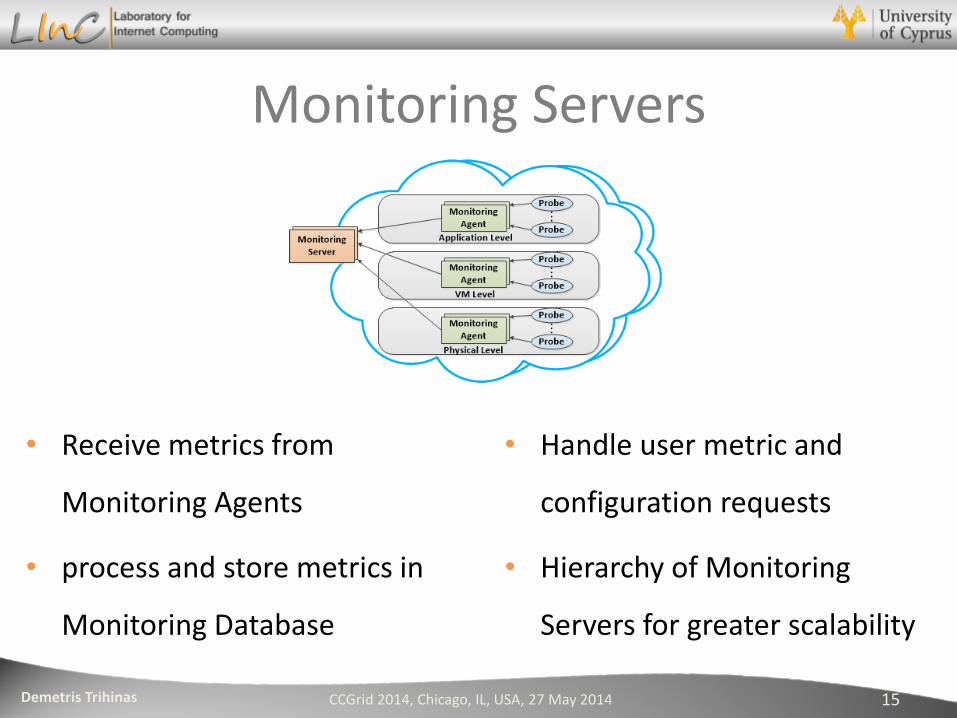
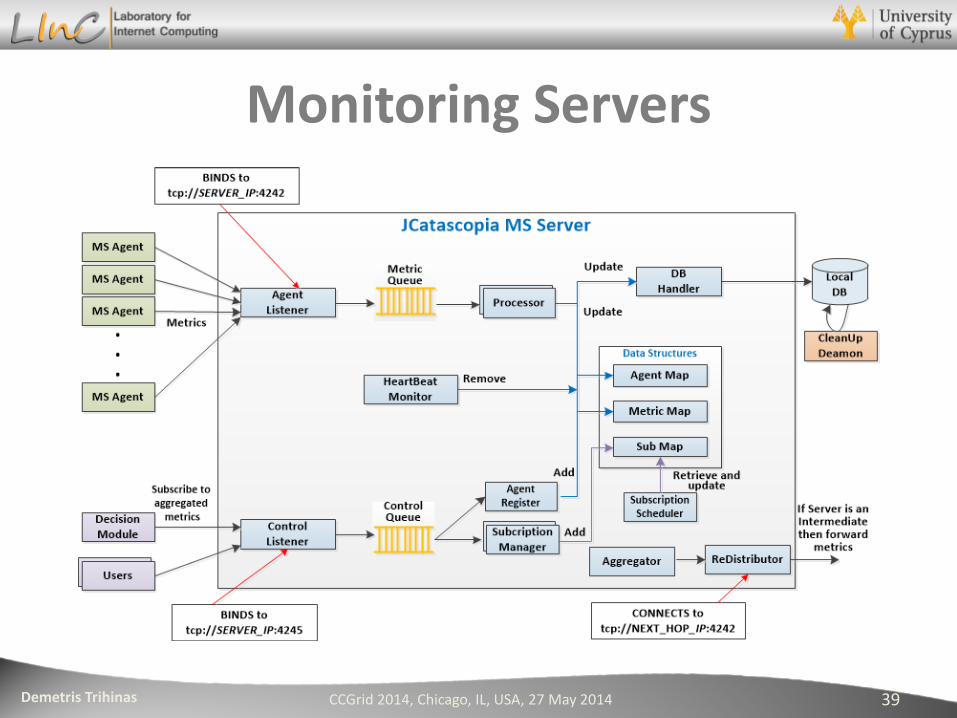
Monitoring Servers
• Receive metrics from
Monitoring Agents
• process and store metrics in
Monitoring Database
CCGrid 2014, Chicago, IL, USA, 27 May 2014 15
• Handle user metric and
configuration requests
• Hierarchy of Monitoring
Servers for greater scalability
Demetris Trihinas
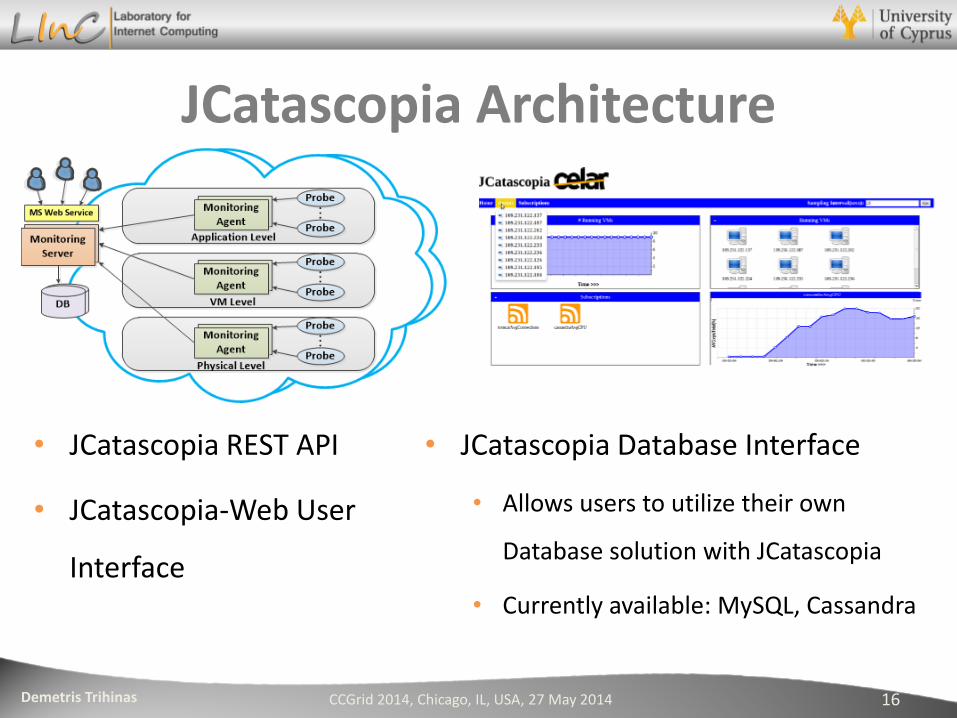
JCatascopia Architecture
CCGrid 2014, Chicago, IL, USA, 27 May 2014 16
• JCatascopia REST API
• JCatascopia-Web User
Interface
• JCatascopia Database Interface
• Allows users to utilize their own
Database solution with JCatascopia
• Currently available: MySQL, Cassandra
Demetris Trihinas
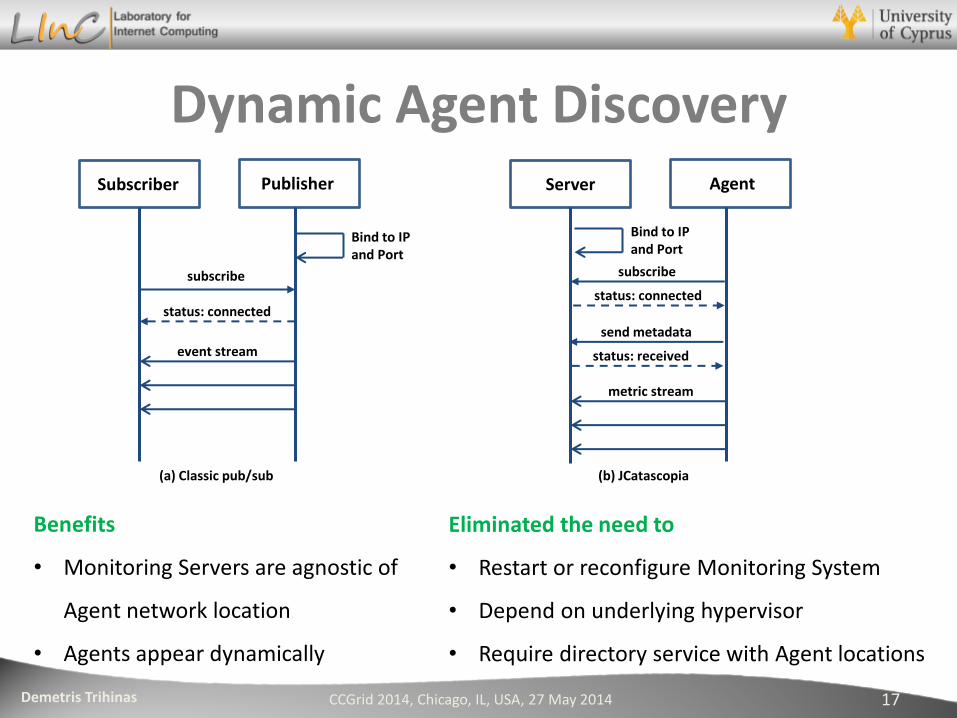
Dynamic Agent Discovery
CCGrid 2014, Chicago, IL, USA, 27 May 2014 17
Subscriber Publisher
Bind to IP and Port
subscribe
status: connected
event stream
Server Agent
Bind to IP and Port
subscribe
status: connected
metric stream
(a) Classic pub/sub (b) JCatascopia
send metadata
status: received
Benefits
• Monitoring Servers are agnostic of
Agent network location
• Agents appear dynamically
Eliminated the need to
• Restart or reconfigure Monitoring System
• Depend on underlying hypervisor
• Require directory service with Agent locations
Demetris Trihinas
Dynamic Agent Removal
• Heartbeat monitoring to detect when Agents:
• Removed due to scaling down elasticity actions
• Temporary unavailable (network connectivity issues)
CCGrid 2014, Chicago, IL, USA, 27 May 2014 18
Demetris Trihinas
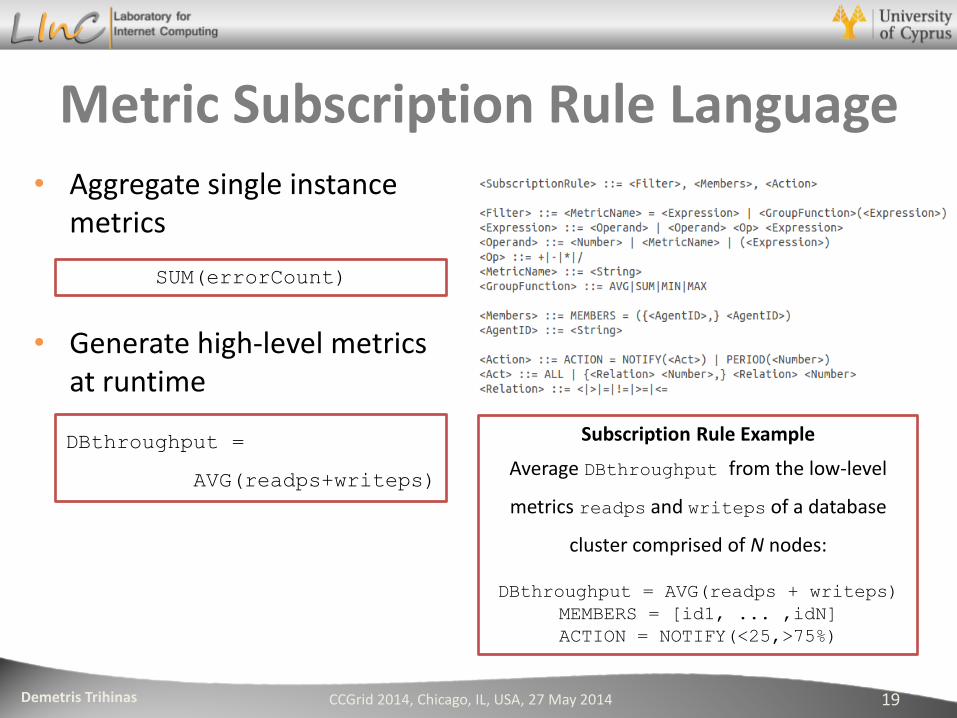
Metric Subscription Rule Language • Aggregate single instance
metrics
• Generate high-level metrics at runtime
CCGrid 2014, Chicago, IL, USA, 27 May 2014 19
SUM(errorCount)
DBthroughput =
AVG(readps+writeps)
Subscription Rule Example
Average DBthroughput from the low-level
metrics readps and writeps of a database
cluster comprised of N nodes:
DBthroughput = AVG(readps + writeps)
MEMBERS = [id1, ... ,idN]
ACTION = NOTIFY(<25,>75%)
Demetris Trihinas
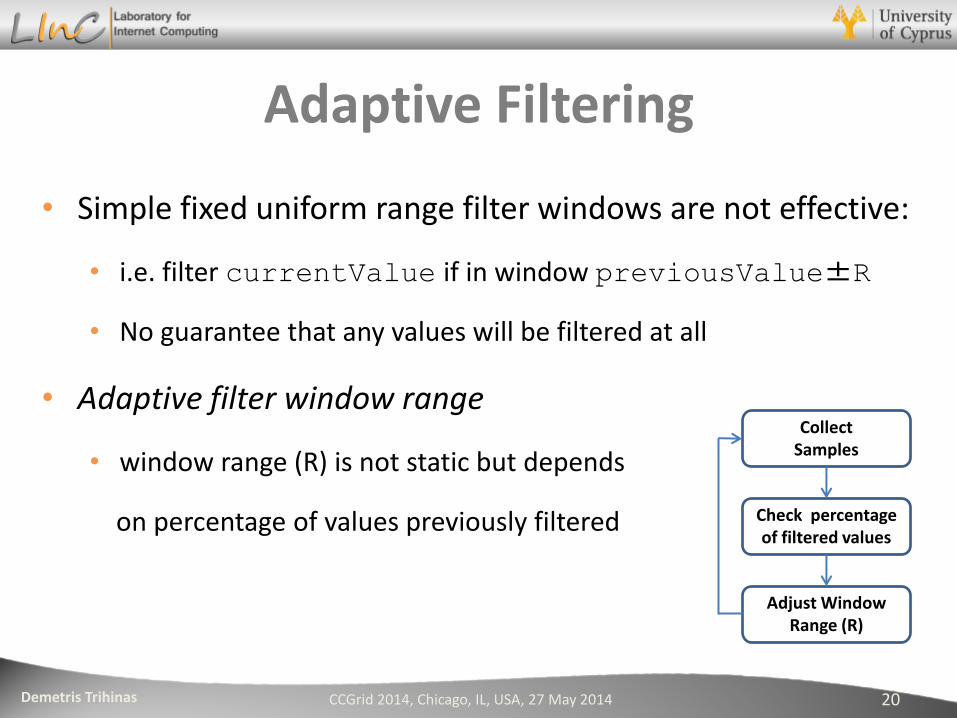
Adaptive Filtering
• Simple fixed uniform range filter windows are not effective:
• i.e. filter currentValue if in window previousValue±R
• No guarantee that any values will be filtered at all
• Adaptive filter window range
• window range (R) is not static but depends
on percentage of values previously filtered
CCGrid 2014, Chicago, IL, USA, 27 May 2014 20
Collect Samples
Check percentage of filtered values
Adjust Window Range (R)
Demetris Trihinas
JCatascopia Evaluation
CCGrid 2014, Chicago, IL, USA, 27 May 2014 21
Demetris Trihinas
Evaluation
• Validate JCatascopia functionality and performance
• Compare JCatascopia to other Monitoring Tools
• Ganglia
• Lattice Monitoring Framework
• Testbed
• Different domains of Cloud applications
• Various VM flavors
• 3 public Cloud providers and 1 private Cloud
CCGrid 2014, Chicago, IL, USA, 27 May 2014 22
Demetris Trihinas
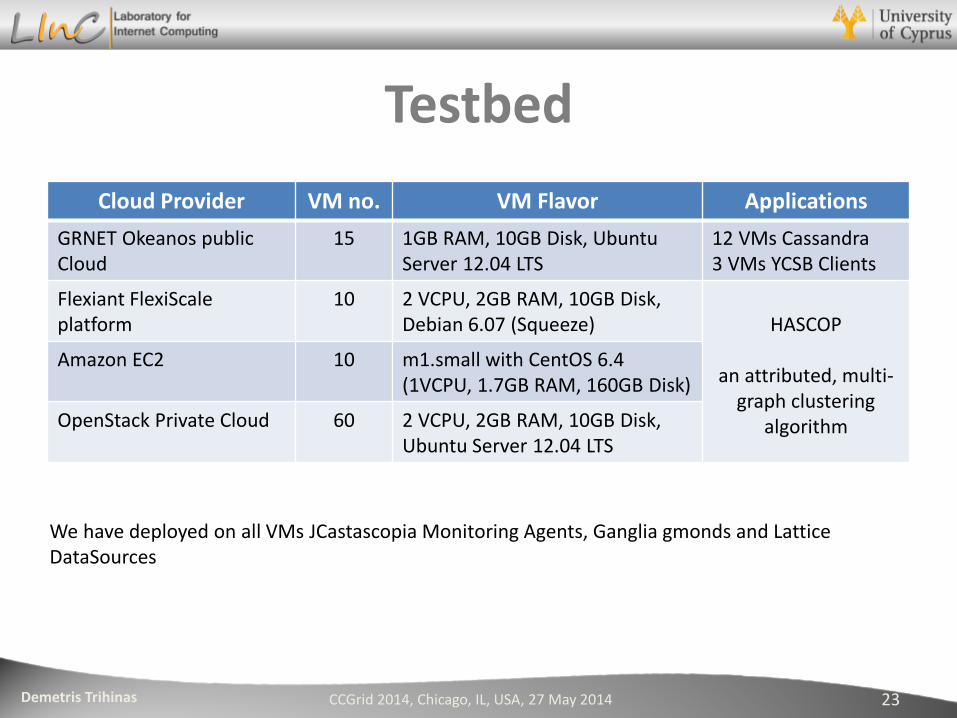
Testbed
Cloud Provider VM no. VM Flavor Applications
GRNET Okeanos public Cloud
15 1GB RAM, 10GB Disk, Ubuntu Server 12.04 LTS
12 VMs Cassandra 3 VMs YCSB Clients
Flexiant FlexiScale platform
10 2 VCPU, 2GB RAM, 10GB Disk, Debian 6.07 (Squeeze)
HASCOP
an attributed, multi-
graph clustering algorithm
Amazon EC2 10 m1.small with CentOS 6.4 (1VCPU, 1.7GB RAM, 160GB Disk)
OpenStack Private Cloud 60 2 VCPU, 2GB RAM, 10GB Disk, Ubuntu Server 12.04 LTS
CCGrid 2014, Chicago, IL, USA, 27 May 2014 23
We have deployed on all VMs JCastascopia Monitoring Agents, Ganglia gmonds and Lattice DataSources
Demetris Trihinas
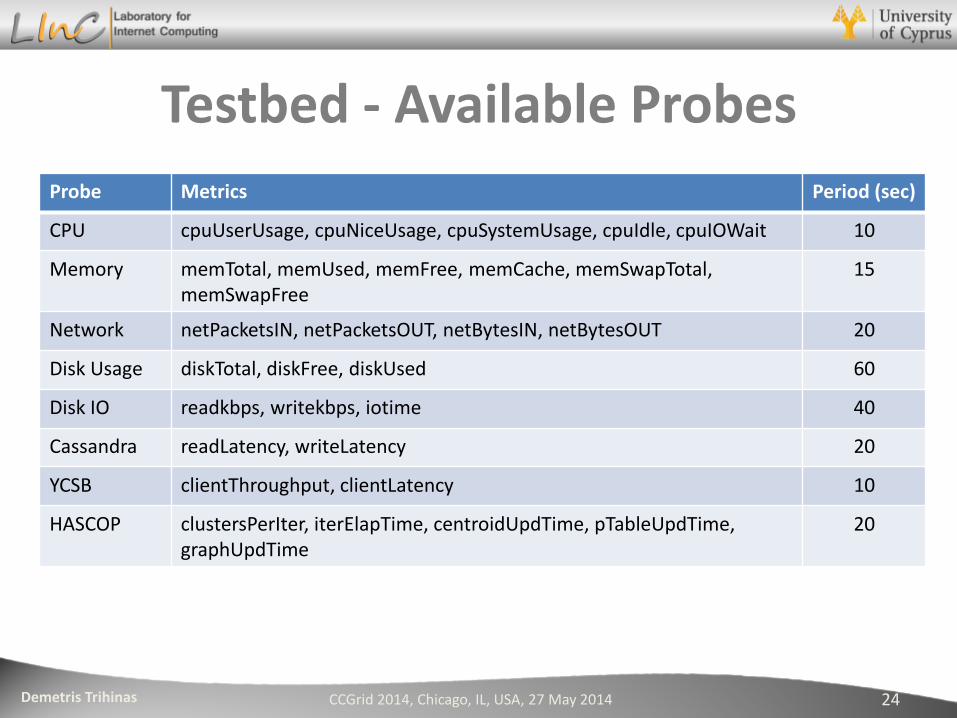
Testbed - Available Probes
Probe Metrics Period (sec)
CPU cpuUserUsage, cpuNiceUsage, cpuSystemUsage, cpuIdle, cpuIOWait 10
Memory memTotal, memUsed, memFree, memCache, memSwapTotal, memSwapFree
15
Network netPacketsIN, netPacketsOUT, netBytesIN, netBytesOUT 20
Disk Usage diskTotal, diskFree, diskUsed 60
Disk IO readkbps, writekbps, iotime 40
Cassandra readLatency, writeLatency 20
YCSB clientThroughput, clientLatency 10
HASCOP clustersPerIter, iterElapTime, centroidUpdTime, pTableUpdTime, graphUpdTime
20
CCGrid 2014, Chicago, IL, USA, 27 May 2014 24
Demetris Trihinas
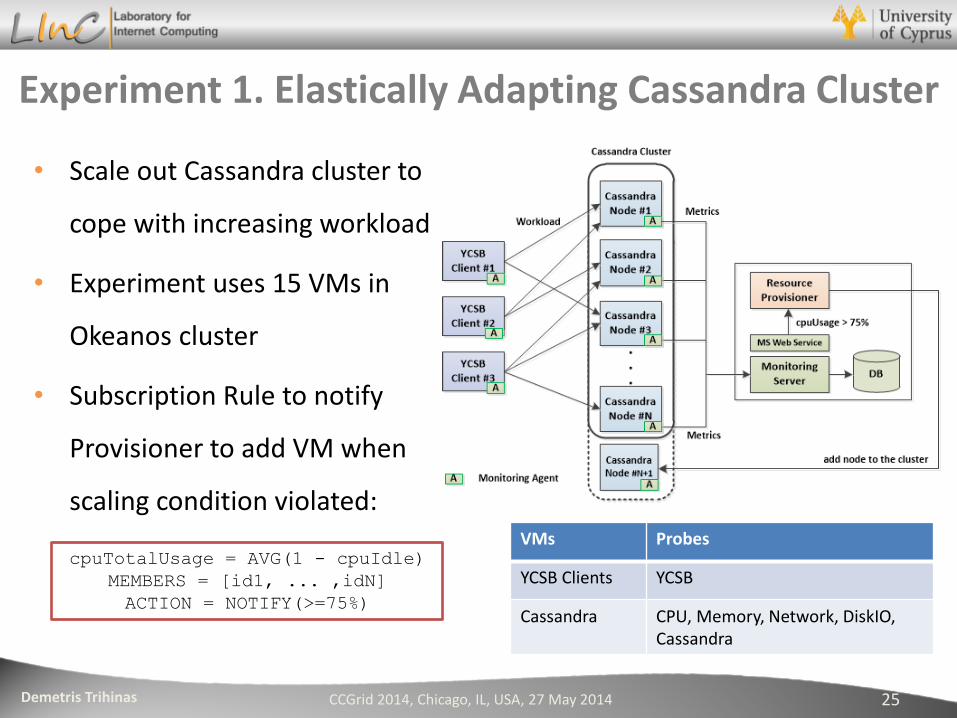
Experiment 1. Elastically Adapting Cassandra Cluster
• Scale out Cassandra cluster to
cope with increasing workload
• Experiment uses 15 VMs in
Okeanos cluster
• Subscription Rule to notify
Provisioner to add VM when
scaling condition violated:
CCGrid 2014, Chicago, IL, USA, 27 May 2014 25
cpuTotalUsage = AVG(1 - cpuIdle)
MEMBERS = [id1, ... ,idN]
ACTION = NOTIFY(>=75%)
VMs Probes
YCSB Clients YCSB
Cassandra CPU, Memory, Network, DiskIO, Cassandra
Demetris Trihinas
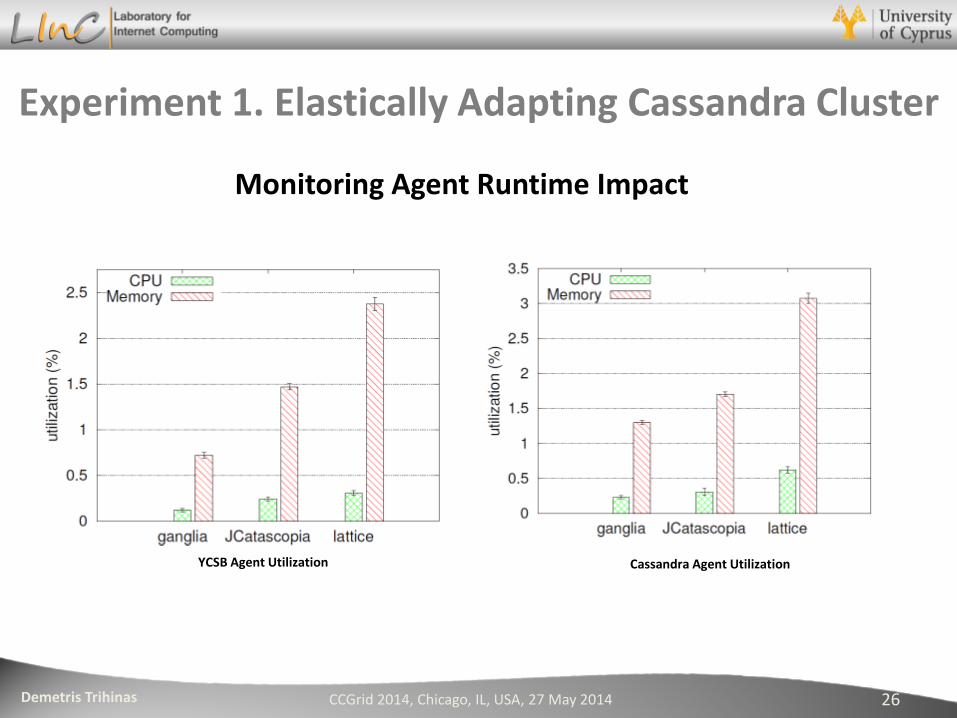
Experiment 1. Elastically Adapting Cassandra Cluster
CCGrid 2014, Chicago, IL, USA, 27 May 2014 26
YCSB Agent Utilization Cassandra Agent Utilization
Monitoring Agent Runtime Impact
Demetris Trihinas
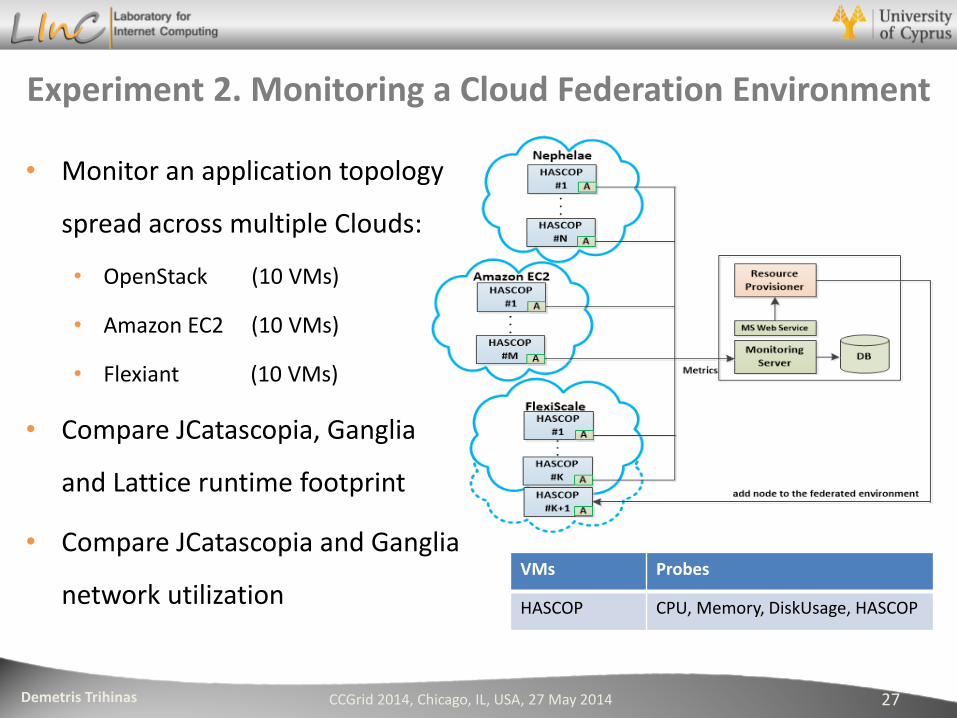
Experiment 2. Monitoring a Cloud Federation Environment
• Monitor an application topology
spread across multiple Clouds:
• OpenStack (10 VMs)
• Amazon EC2 (10 VMs)
• Flexiant (10 VMs)
• Compare JCatascopia, Ganglia
and Lattice runtime footprint
• Compare JCatascopia and Ganglia
network utilization
CCGrid 2014, Chicago, IL, USA, 27 May 2014 27
VMs Probes
HASCOP CPU, Memory, DiskUsage, HASCOP
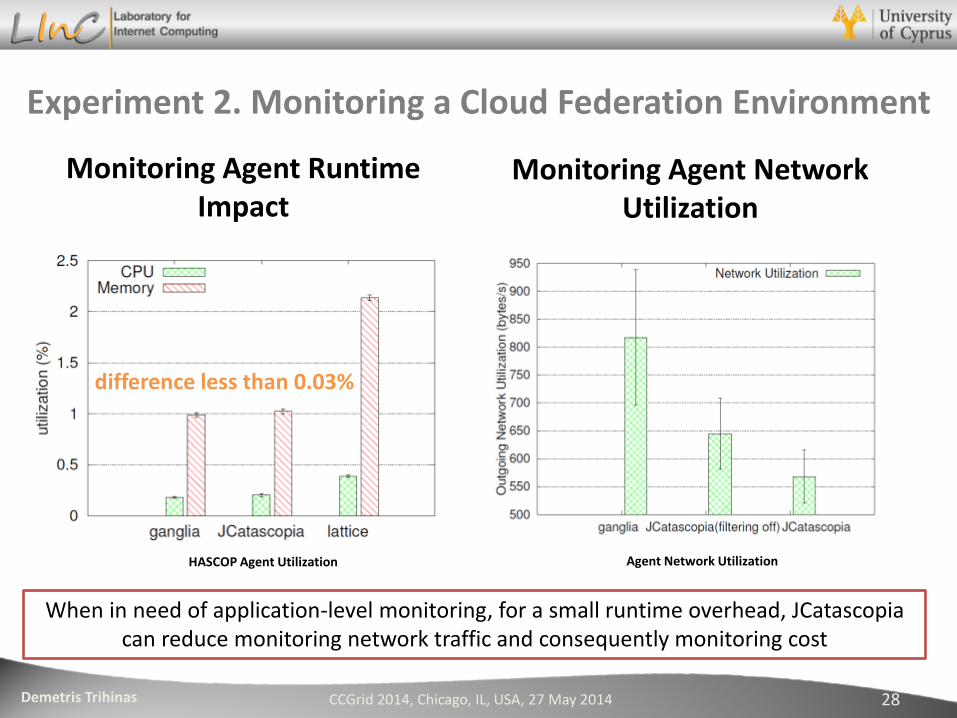
Demetris Trihinas CCGrid 2014, Chicago, IL, USA, 27 May 2014 28
HASCOP Agent Utilization Agent Network Utilization
Experiment 2. Monitoring a Cloud Federation Environment
Monitoring Agent Runtime Impact
Monitoring Agent Network Utilization
difference less than 0.03%
When in need of application-level monitoring, for a small runtime overhead, JCatascopia can reduce monitoring network traffic and consequently monitoring cost
Demetris Trihinas
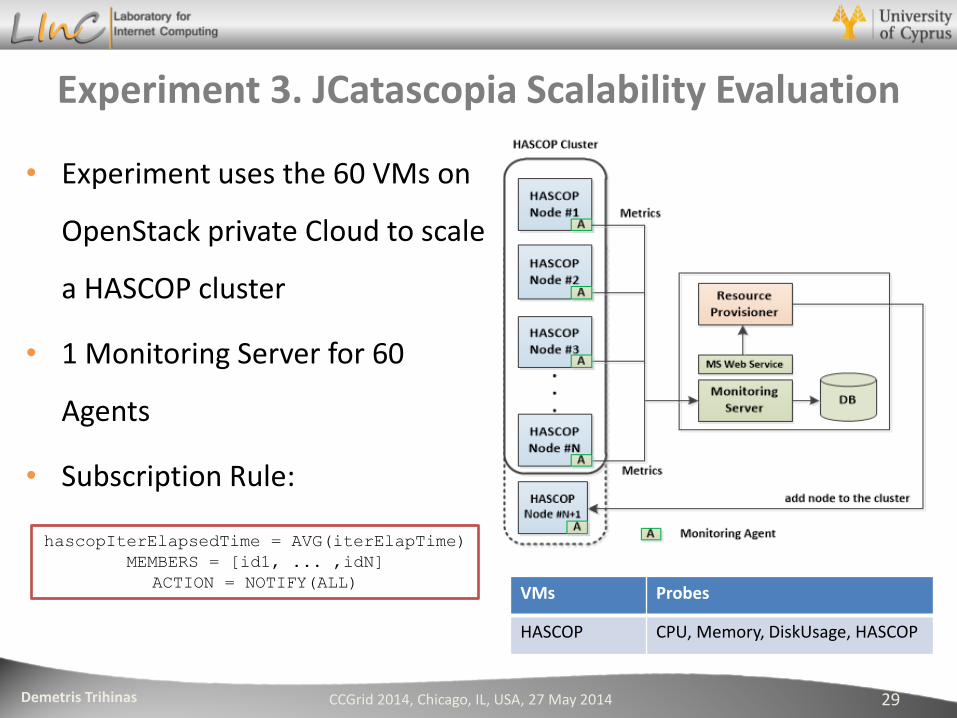
Experiment 3. JCatascopia Scalability Evaluation
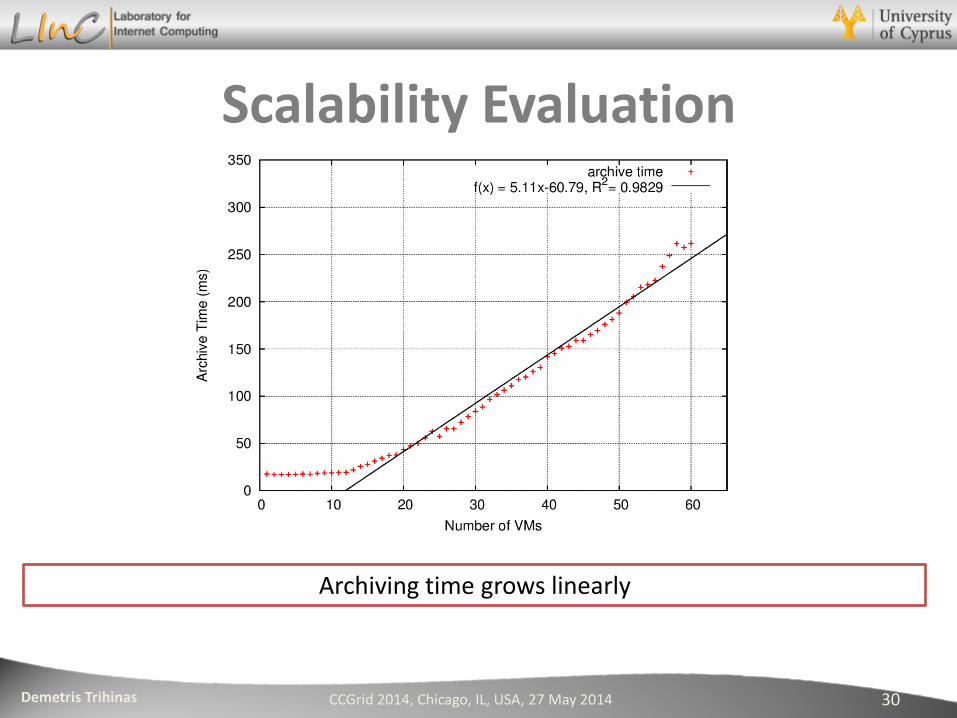
• Experiment uses the 60 VMs on
OpenStack private Cloud to scale
a HASCOP cluster
• 1 Monitoring Server for 60
Agents
• Subscription Rule:
CCGrid 2014, Chicago, IL, USA, 27 May 2014 29
VMs Probes
HASCOP CPU, Memory, DiskUsage, HASCOP
hascopIterElapsedTime = AVG(iterElapTime)
MEMBERS = [id1, ... ,idN]
ACTION = NOTIFY(ALL)
Demetris Trihinas
Scalability Evaluation
CCGrid 2014, Chicago, IL, USA, 27 May 2014 30
Archiving time grows linearly
Demetris Trihinas
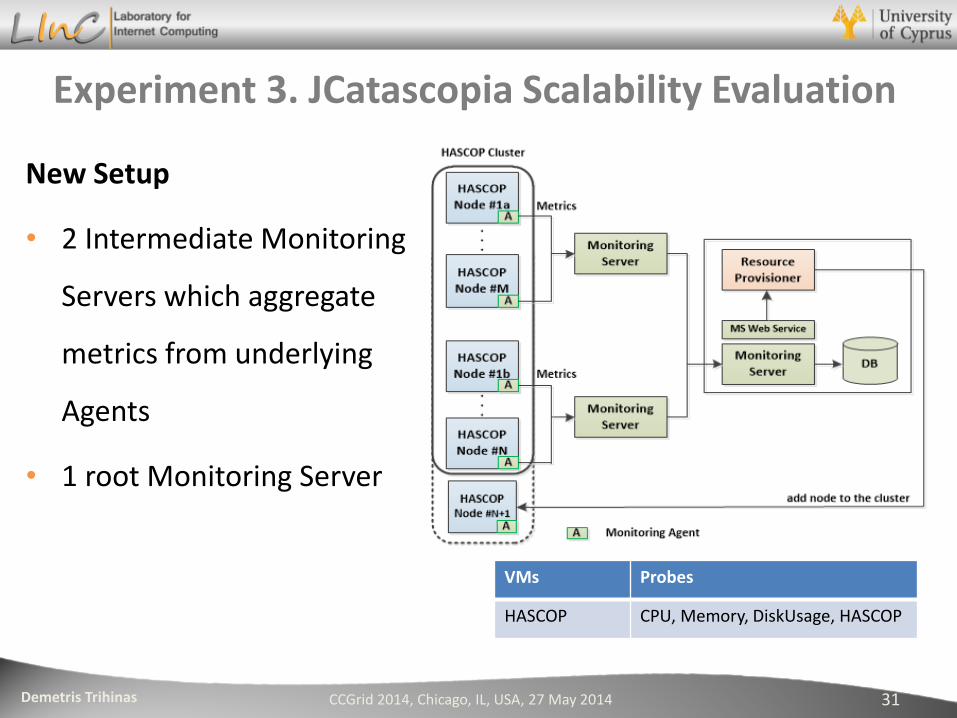
Experiment 3. JCatascopia Scalability Evaluation
New Setup
• 2 Intermediate Monitoring
Servers which aggregate
metrics from underlying
Agents
• 1 root Monitoring Server
CCGrid 2014, Chicago, IL, USA, 27 May 2014 31
VMs Probes
HASCOP CPU, Memory, DiskUsage, HASCOP
Demetris Trihinas
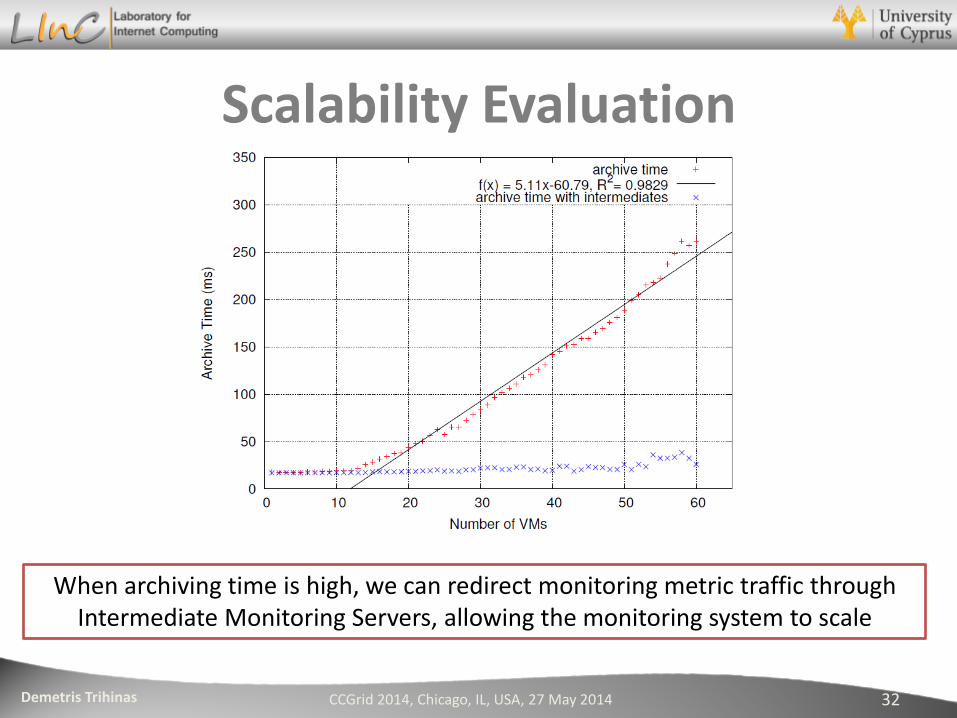
Scalability Evaluation
CCGrid 2014, Chicago, IL, USA, 27 May 2014 32
When archiving time is high, we can redirect monitoring metric traffic through Intermediate Monitoring Servers, allowing the monitoring system to scale
Demetris Trihinas
Conclusions
• Experiments on public and private Cloud platforms show
that JCatascopia is:
• capable of supporting automated elasticity controllers
• able to adapt in a fully automatic manner when elasticity
actions are enforced
• open-source, interoperable, scalable and has a low runtime
footprint
CCGrid 2014, Chicago, IL, USA, 27 May 2014 33
Demetris Trihinas
Future Work
• Further pursue adaptive filtering
• Enhance Probes with adaptive sampling
• Adjust sampling rate when stable phases are detected
• Integrate JCatascopia with cloud cost-evaluation system
CCGrid 2014, Chicago, IL, USA, 27 May 2014 34
Demetris Trihinas
Acknowledgements
CCGrid 2014, Chicago, IL, USA, 27 May 2014 35
www.celarcloud.eu
co-funded by the European Commission
https://github.com/CELAR/cloud-ms

Demetris Trihinas 36 CCGrid 2014, Chicago, IL, USA, 27 May 2014
Laboratory for Internet Computing Department of Computer Science
University of Cyprus
http://linc.ucy.ac.cy

Demetris Trihinas
BACKUP SLIDES
CCGrid 2014, Chicago, IL, USA, 27 May 2014 37
Demetris Trihinas
Monitoring Agents
CCGrid 2014, Chicago, IL, USA, 27 May 2014 38
Demetris Trihinas
Monitoring Servers
CCGrid 2014, Chicago, IL, USA, 27 May 2014 39
Demetris Trihinas
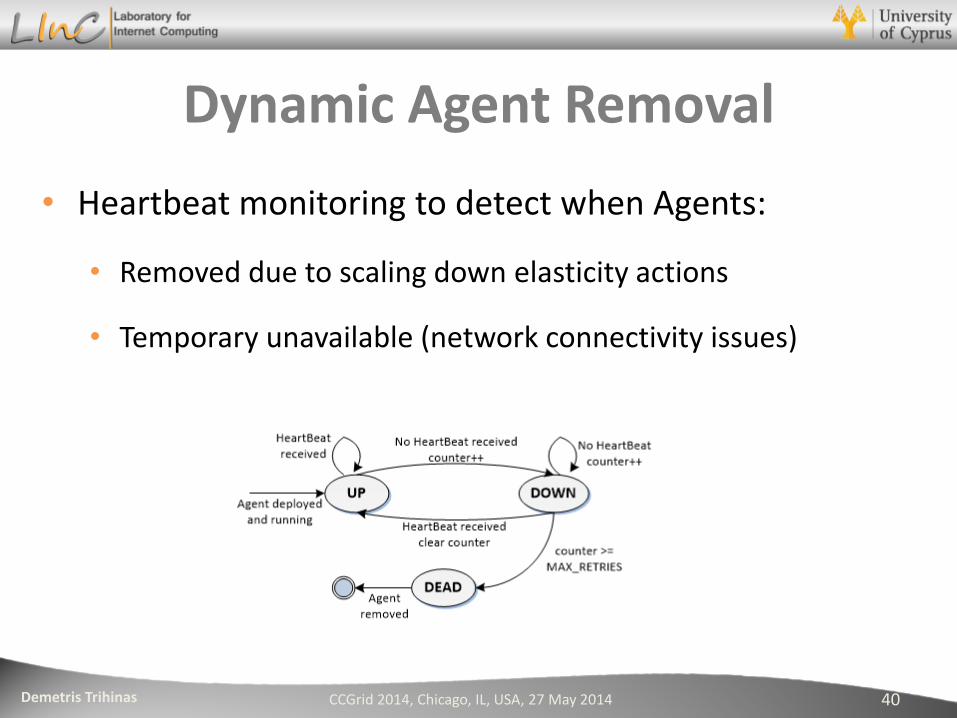
Dynamic Agent Removal
• Heartbeat monitoring to detect when Agents:
• Removed due to scaling down elasticity actions
• Temporary unavailable (network connectivity issues)
CCGrid 2014, Chicago, IL, USA, 27 May 2014 40