Java Performance: Speedup your application with hardware counters
88
@kuksenk0 #JavaPerfAndHWC Java Performance: Speedup your applications with hardware counters Sergey Kuksenko @kuksenk0
-
Upload
sergey-kuksenko -
Category
Software
-
view
674 -
download
1
Transcript of Java Performance: Speedup your application with hardware counters

@kuksenk0#JavaPerfAndHWC
Java Performance: Speedup your applications with hardware counters
Sergey Kuksenko@kuksenk0
@kuksenk0 #JavaPerfAndHWC
The following is intended to outline our general productdirection. It is intended for information purposes only, and maynot be incorporated into any contract. It is not a commitmentto deliver any material, code, or functionality, and should not berelied upon in making purchasing decisions. The development,release, and timing of any features or functionality described forOracle’s products remains at the sole discretion of Oracle.
2/64
@kuksenk0 #JavaPerfAndHWC
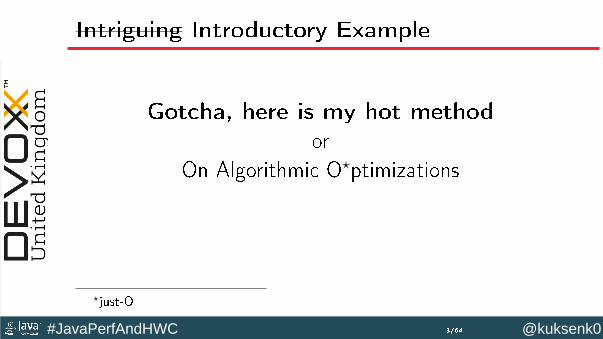
Intriguing Introductory Example
Gotcha, here is my hot methodor
On Algorithmic O⋆ptimizations
⋆just-O
3/64
@kuksenk0 #JavaPerfAndHWC
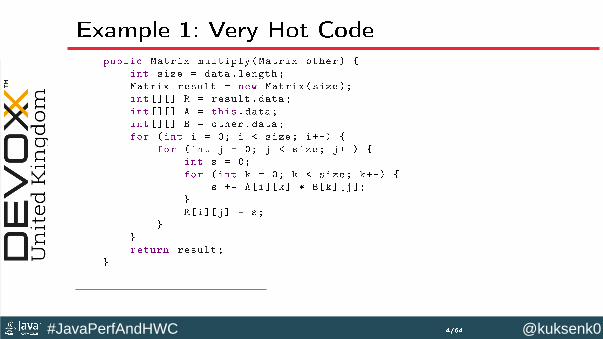
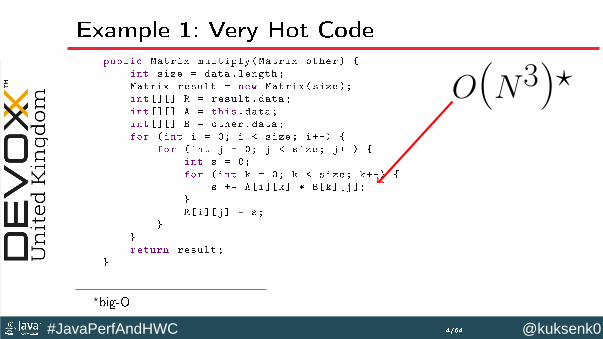
Example 1: Very Hot Codepublic Matrix multiply(Matrix other) {
int size = data.length;
Matrix result = new Matrix(size);
int [][] R = result.data;
int [][] A = this.data;
int [][] B = other.data;
for (int i = 0; i < size; i++) {
for (int j = 0; j < size; j++) {
int s = 0;
for (int k = 0; k < size; k++) {
s += A[i][k] * B[k][j];
}
R[i][j] = s;
}
}
return result;
}
𝑂(𝑁3)⋆
⋆big-O
4/64
@kuksenk0 #JavaPerfAndHWC
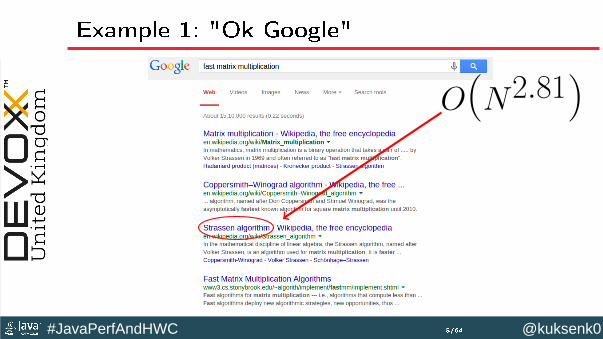
Example 1: "Ok Google"
𝑂(𝑁2.81)
5/64

@kuksenk0 #JavaPerfAndHWC
Example 1: Very Hot Code
N multiply strassen
32 33 𝜇𝑠64 252 𝜇𝑠128 3019 𝜇𝑠 2119 𝜇𝑠256 56 𝑚𝑠 15 𝑚𝑠512 488 𝑚𝑠 111 𝑚𝑠1024 3270 𝑚𝑠 785 𝑚𝑠2048 32 𝑠 6 𝑠4096 309 𝑠 42 𝑠8192 2611 𝑠 293 𝑠
time/op
6/64

@kuksenk0 #JavaPerfAndHWC
Try the other way
7/64
@kuksenk0 #JavaPerfAndHWC
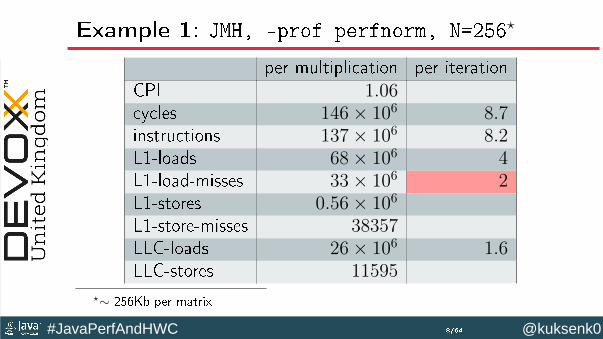
Example 1: JMH, -prof perfnorm, N=256⋆
per multiplication per iterationCPI 1.06cycles 146× 106 8.7instructions 137× 106 8.2L1-loads 68× 106 4L1-load-misses 33× 106 2L1-stores 0.56× 10⁶
L1-store-misses 38357LLC-loads 26× 106 1.6LLC-stores 11595
⋆∼ 256Kb per matrix
8/64

@kuksenk0 #JavaPerfAndHWC
Example 1: Very Hot Code
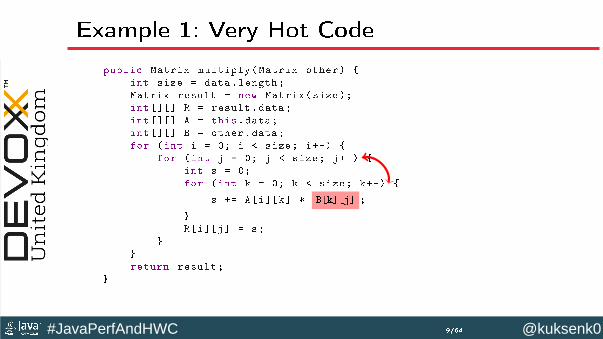
public Matrix multiply(Matrix other) {
int size = data.length;
Matrix result = new Matrix(size);
int [][] R = result.data;
int [][] A = this.data;
int [][] B = other.data;
for (int i = 0; i < size; i++) {
for (int j = 0; j < size; j++) {
int s = 0;
for (int k = 0; k < size; k++) {
s += A[i][k] * B[k][j] ;
}
R[i][j] = s;
}
}
return result;
}
L1-load-misses
9/64
@kuksenk0 #JavaPerfAndHWC
Example 1: Very Hot Code
public Matrix multiply(Matrix other) {
int size = data.length;
Matrix result = new Matrix(size);
int [][] R = result.data;
int [][] A = this.data;
int [][] B = other.data;
for (int i = 0; i < size; i++) {
for (int j = 0; j < size; j++) {
int s = 0;
for (int k = 0; k < size; k++) {
s += A[i][k] * B[k][j] ;
}
R[i][j] = s;
}
}
return result;
}
9/64

@kuksenk0 #JavaPerfAndHWC
Example 1: Very Hot Code
public Matrix multiplyIKJ(Matrix other) {
int size = data.length;
Matrix result = new Matrix(size);
int [][] R = result.data;
int [][] A = this.data;
int [][] B = other.data;
for (int i = 0; i < size; i++) {
for (int k = 0; k < size; k++) {
int aik = A[i][k];
for (int j = 0; j < size; j++) {
R[i][j] += aik * B[k][j];
}
}
}
return result;
}
10/64
@kuksenk0 #JavaPerfAndHWC
Example 1: Very Hot Code
N multIJK strassenIJK multIKJ
strassenIKJ
32 33 𝜇𝑠 13 𝜇𝑠64 252 𝜇𝑠 80 𝜇𝑠128 3019 𝜇𝑠 2119 𝜇𝑠 464 𝜇𝑠256 56 𝑚𝑠 15 𝑚𝑠 4 𝑚𝑠512 488 𝑚𝑠 111 𝑚𝑠 29 𝑚𝑠
25 𝑚𝑠
1024 3270 𝑚𝑠 785 𝑚𝑠 369 𝑚𝑠
192 𝑚𝑠
2048 32 𝑠 6 𝑠 3.4 𝑠
1.4 𝑠
4096 309 𝑠 42 𝑠 25 𝑠
10 𝑠
8192 2611 𝑠 293 𝑠 210 𝑠
73 𝑠
time/op
11/64

@kuksenk0 #JavaPerfAndHWC
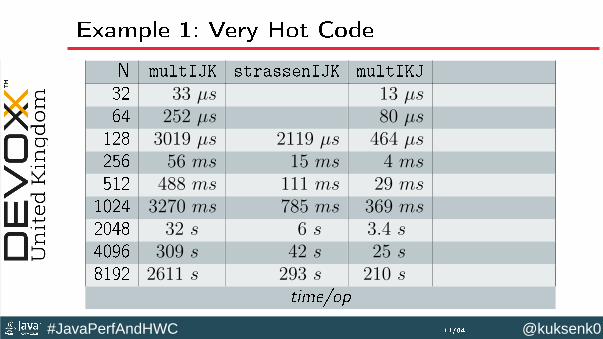
Example 1: Very Hot Code
N multIJK strassenIJK multIKJ strassenIKJ
32 33 𝜇𝑠 13 𝜇𝑠64 252 𝜇𝑠 80 𝜇𝑠128 3019 𝜇𝑠 2119 𝜇𝑠 464 𝜇𝑠256 56 𝑚𝑠 15 𝑚𝑠 4 𝑚𝑠512 488 𝑚𝑠 111 𝑚𝑠 29 𝑚𝑠 25 𝑚𝑠1024 3270 𝑚𝑠 785 𝑚𝑠 369 𝑚𝑠 192 𝑚𝑠2048 32 𝑠 6 𝑠 3.4 𝑠 1.4 𝑠4096 309 𝑠 42 𝑠 25 𝑠 10 𝑠8192 2611 𝑠 293 𝑠 210 𝑠 73 𝑠
time/op
11/64

@kuksenk0 #JavaPerfAndHWC
Example 1: JMH, -prof perfnorm, N=256
IJK IKJmultiply iteration multiply iteration
CPI 1.06 0.51cycles 146× 106 8.7 9.7× 10⁶ 0.6instructions 137× 106 8.2 19× 106 1.1L1-loads 68× 106 4 5.4× 10⁶ 0.3L1-load-misses 33× 106 2 1.1× 10⁶ 0.1L1-stores 0.56× 10⁶ 2.7× 10⁶ 0.2L1-store-misses 38357 8959LLC-loads 26× 106 1.6 0.3× 10⁶
LLC-stores 11595 3532
12/64
@kuksenk0 #JavaPerfAndHWC
Example 1: Free beer benefits!
cycles insts
...
6.42% 5.54% 0x00007ff6591d20c5: vmovdqu %ymm1 ,0x10(%r14 ,%rbx ,4) ;* iastore
9.49% 11.91% 0x00007ff6591d20cc: add $0x8 ,%ebx ;*iinc
0.15% 0.05% 0x00007ff6591d20cf: cmp %r11d ,%ebx
0x00007ff6591d20d2: jl 0x00007ff6591d20b2 ;* if_icmpge
...
Vectorization (SSE/AVX)!
13/64

@kuksenk0 #JavaPerfAndHWC
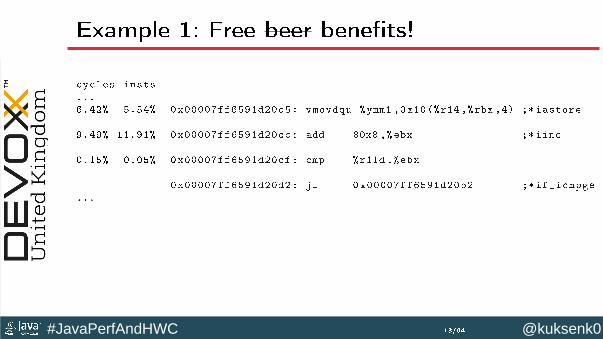
Chapter 1
Performance Optimization Methodology:A Very Short Introduction.
Three magic questions and the direction of the
journey
14/64
@kuksenk0 #JavaPerfAndHWC
Three magic questions
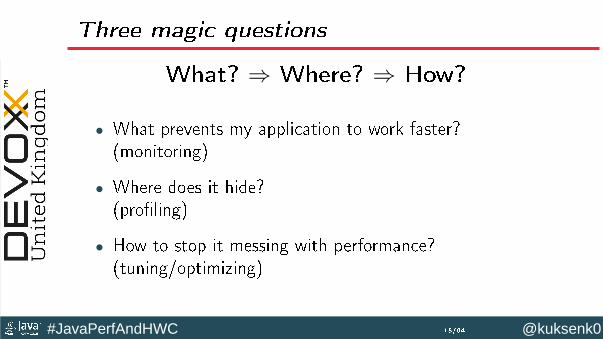
What? ⇒ Where? ⇒ How?
∙ What prevents my application to work faster?(monitoring)
∙ Where does it hide?(profiling)
∙ How to stop it messing with performance?(tuning/optimizing)
15/64
@kuksenk0 #JavaPerfAndHWC
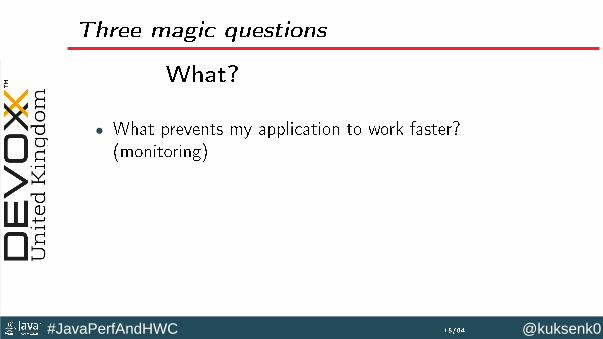
Three magic questions
What?
⇒ Where? ⇒ How?
∙ What prevents my application to work faster?(monitoring)
∙ Where does it hide?(profiling)
∙ How to stop it messing with performance?(tuning/optimizing)
15/64

@kuksenk0 #JavaPerfAndHWC
Three magic questions
What? ⇒ Where?
⇒ How?
∙ What prevents my application to work faster?(monitoring)
∙ Where does it hide?(profiling)
∙ How to stop it messing with performance?(tuning/optimizing)
15/64
@kuksenk0 #JavaPerfAndHWC
Three magic questions
What? ⇒ Where? ⇒ How?
∙ What prevents my application to work faster?(monitoring)
∙ Where does it hide?(profiling)
∙ How to stop it messing with performance?(tuning/optimizing)
15/64

@kuksenk0 #JavaPerfAndHWC
Top-Down Approach
∙ System Level– Network, Disk, OS, CPU/Memory
∙ JVM Level– GC/Heap, JIT, Classloading
∙ Application Level– Algorithms, Synchronization, Threading, API
∙ Microarchitecture Level– Caches, Data/Code alignment, CPU Pipeline Stalls
16/64

@kuksenk0 #JavaPerfAndHWC
Methodology in Essence
http://j.mp/PerfMindMap
17/64

@kuksenk0 #JavaPerfAndHWC
Methodology in Essence
http://j.mp/PerfMindMap
17/64
@kuksenk0 #JavaPerfAndHWC
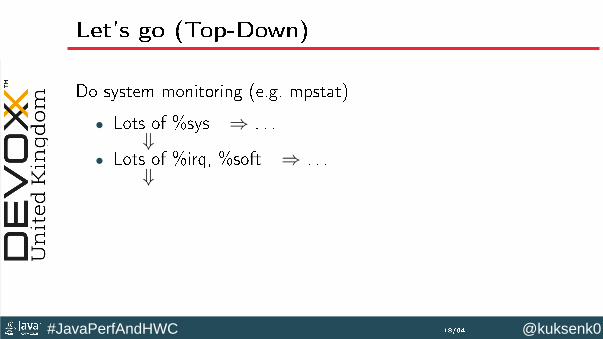
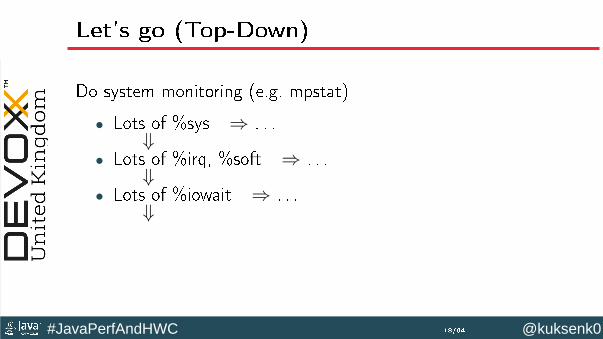
Let’s go (Top-Down)
Do system monitoring (e.g. mpstat)
∙ Lots of %sys ⇒ . . .⇓
∙ Lots of %irq, %soft ⇒ . . .⇓
∙ Lots of %iowait ⇒ . . .⇓
∙ Lots of %idle ⇒ . . .⇓
∙ Lots of %user
18/64
@kuksenk0 #JavaPerfAndHWC
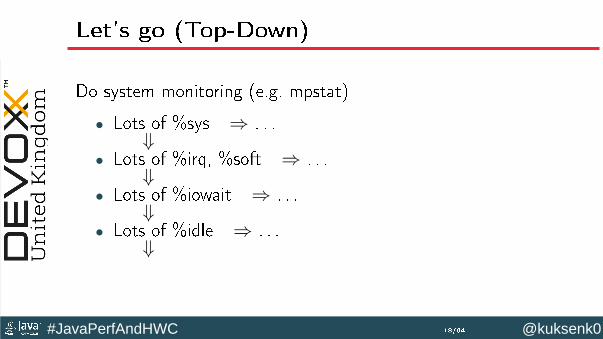
Let’s go (Top-Down)
Do system monitoring (e.g. mpstat)
∙ Lots of %sys ⇒ . . .⇓
∙ Lots of %irq, %soft ⇒ . . .⇓
∙ Lots of %iowait ⇒ . . .⇓
∙ Lots of %idle ⇒ . . .⇓
∙ Lots of %user
18/64
@kuksenk0 #JavaPerfAndHWC
Let’s go (Top-Down)
Do system monitoring (e.g. mpstat)
∙ Lots of %sys ⇒ . . .⇓
∙ Lots of %irq, %soft ⇒ . . .⇓
∙ Lots of %iowait ⇒ . . .⇓
∙ Lots of %idle ⇒ . . .⇓
∙ Lots of %user
18/64
@kuksenk0 #JavaPerfAndHWC
Let’s go (Top-Down)
Do system monitoring (e.g. mpstat)
∙ Lots of %sys ⇒ . . .⇓
∙ Lots of %irq, %soft ⇒ . . .⇓
∙ Lots of %iowait ⇒ . . .⇓
∙ Lots of %idle ⇒ . . .⇓
∙ Lots of %user
18/64
@kuksenk0 #JavaPerfAndHWC
Let’s go (Top-Down)
Do system monitoring (e.g. mpstat)
∙ Lots of %sys ⇒ . . .⇓
∙ Lots of %irq, %soft ⇒ . . .⇓
∙ Lots of %iowait ⇒ . . .⇓
∙ Lots of %idle ⇒ . . .⇓
∙ Lots of %user
18/64

@kuksenk0 #JavaPerfAndHWC
Let’s go (Top-Down)
Do system monitoring (e.g. mpstat)
∙ Lots of %sys ⇒ . . .⇓
∙ Lots of %irq, %soft ⇒ . . .⇓
∙ Lots of %iowait ⇒ . . .⇓
∙ Lots of %idle ⇒ . . .⇓
∙ Lots of %user
18/64
@kuksenk0 #JavaPerfAndHWC
Chapter 2
High CPU Load
and
the main question:
«who/what is to blame?»
19/64
@kuksenk0 #JavaPerfAndHWC
CPU Utilization
∙ What does ∼100% CPU Utilization mean?
– OS has enough tasks to schedule
Can profiling help?
Profiler⋆ shows «WHERE» application time is spent,but there’s no answer to the question «WHY».
⋆traditional profiler
20/64
@kuksenk0 #JavaPerfAndHWC
CPU Utilization
∙ What does ∼100% CPU Utilization mean?– OS has enough tasks to schedule
Can profiling help?
Profiler⋆ shows «WHERE» application time is spent,but there’s no answer to the question «WHY».
⋆traditional profiler
20/64

@kuksenk0 #JavaPerfAndHWC
CPU Utilization
∙ What does ∼100% CPU Utilization mean?– OS has enough tasks to schedule
Can profiling help?
Profiler⋆ shows «WHERE» application time is spent,but there’s no answer to the question «WHY».
⋆traditional profiler
20/64

@kuksenk0 #JavaPerfAndHWC
CPU Utilization
∙ What does ∼100% CPU Utilization mean?– OS has enough tasks to schedule
Can profiling help?
Profiler⋆ shows «WHERE» application time is spent,but there’s no answer to the question «WHY».
⋆traditional profiler
20/64
@kuksenk0 #JavaPerfAndHWC
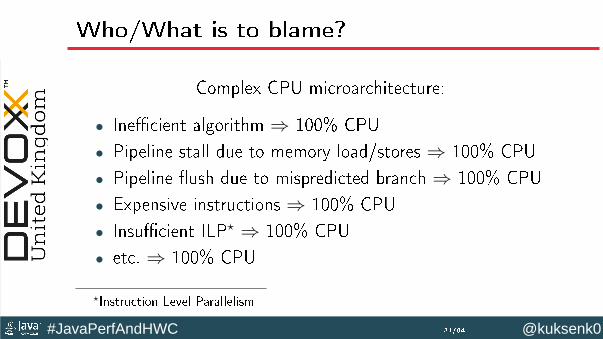
Who/What is to blame?
Complex CPU microarchitecture:
∙ Inefficient algorithm ⇒ 100% CPU
∙ Pipeline stall due to memory load/stores ⇒ 100% CPU
∙ Pipeline flush due to mispredicted branch ⇒ 100% CPU
∙ Expensive instructions ⇒ 100% CPU
∙ Insufficient ILP⋆ ⇒ 100% CPU
∙ etc. ⇒ 100% CPU
⋆Instruction Level Parallelism
21/64

@kuksenk0 #JavaPerfAndHWC
Chapter 3
Hardware Counters
HWC, PMU - WTF?
22/64
@kuksenk0 #JavaPerfAndHWC
PMU: Performance Monitoring Unit
Performance Monitoring Unit - profiles hardware activity,built into CPU.
PMU Internals (in less than 21 seconds) :
Hardware counters (HWC) count hardware performance events(performance monitoring events)
23/64
@kuksenk0 #JavaPerfAndHWC
PMU: Performance Monitoring Unit
Performance Monitoring Unit - profiles hardware activity,built into CPU.
PMU Internals (in less than 21 seconds) :
Hardware counters (HWC) count hardware performance events(performance monitoring events)
23/64
@kuksenk0 #JavaPerfAndHWC
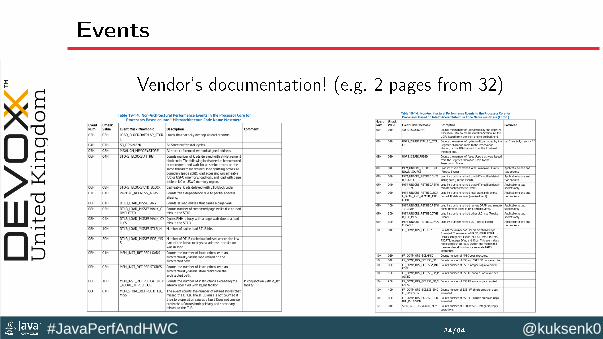
Events
Vendor’s documentation! (e.g. 2 pages from 32)
24/64
@kuksenk0 #JavaPerfAndHWC
Events: Issues
∙ Hundreds of events
∙ Microarchitectural experience is required
∙ Platform dependent– vary from CPU vendor to vendor
– may vary when CPU manufacturer introduces newmicroarchitecture
∙ How to work with HWC?
25/64
@kuksenk0 #JavaPerfAndHWC
HWC
HWC modes:
∙ Counting mode– if (event_happened) ++counter;
– general monitoring (answering «WHAT?» )
∙ Sampling mode– if (event_happened)
if (++counter < threshold) INTERRUPT;
– profiling (answering «WHERE?»)
26/64
@kuksenk0 #JavaPerfAndHWC
HWC: Issues
So many events, so few counters
e.g. “Nehalem”:
– over 900 events
– 7 HWC (3 fixed + 4 programmable)
∙ «multiple-running» (different events)– Repeatability
∙ «multiplexing» (only a few tools are able to do that)– Steady state
27/64

@kuksenk0 #JavaPerfAndHWC
HWC: Issues (cont.)
Sampling mode:
∙ «instruction skid»(hard to correlate event and instruction)
∙ Uncore events(hard to bind event and execution thread;e.g. shared L3 cache)
28/64
@kuksenk0 #JavaPerfAndHWC
HWC: typical usages
∙ hardware validation
∙ performance analysis
∙ run-time tuning (e.g. JRockit, etc.)
∙ security attacks and defenses
∙ test code coverage
∙ etc.
29/64
@kuksenk0 #JavaPerfAndHWC
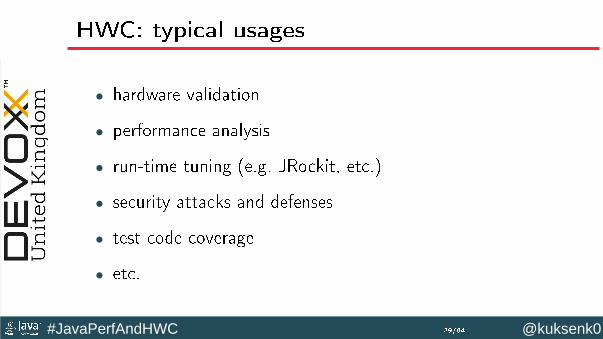
HWC: typical usages
∙ hardware validation
∙ performance analysis
∙ run-time tuning (e.g. JRockit, etc.)
∙ security attacks and defenses
∙ test code coverage
∙ etc.
29/64
@kuksenk0 #JavaPerfAndHWC
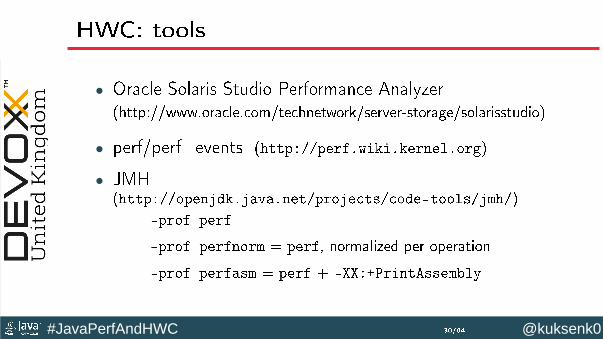
HWC: tools
∙ Oracle Solaris Studio Performance Analyzer(http://www.oracle.com/technetwork/server-storage/solarisstudio)
∙ perf/perf_events (http://perf.wiki.kernel.org)
∙ JMH(http://openjdk.java.net/projects/code-tools/jmh/)
-prof perf
-prof perfnorm = perf, normalized per operation
-prof perfasm = perf + -XX:+PrintAssembly
30/64
@kuksenk0 #JavaPerfAndHWC
HWC: tools (cont.)
∙ AMD CodeXL
∙ Intel Vtune Amplifier XE
∙ etc. . .
31/64
@kuksenk0 #JavaPerfAndHWC
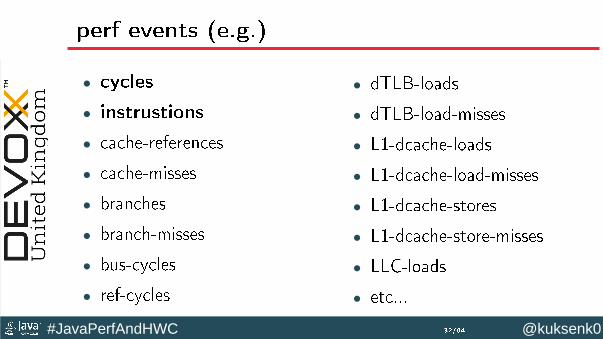
perf events (e.g.)
∙ cycles
∙ instrustions
∙ cache-references
∙ cache-misses
∙ branches
∙ branch-misses
∙ bus-cycles
∙ ref-cycles
∙ dTLB-loads
∙ dTLB-load-misses
∙ L1-dcache-loads
∙ L1-dcache-load-misses
∙ L1-dcache-stores
∙ L1-dcache-store-misses
∙ LLC-loads
∙ etc...
32/64

@kuksenk0 #JavaPerfAndHWC
Oracle Studio events (e.g.)
∙ cycles
∙ insts
∙ branch-instruction-retired
∙ branch-misses-retired
∙ dtlbm
∙ l1h
∙ l1m
∙ l2h
∙ l2m
∙ l3h
∙ l3m
∙ etc...
33/64
@kuksenk0 #JavaPerfAndHWC
Chapter 4
I’ve got HWC data. What’s next?or
Introduction to microarchitecture
performance analysis
34/64
@kuksenk0 #JavaPerfAndHWC
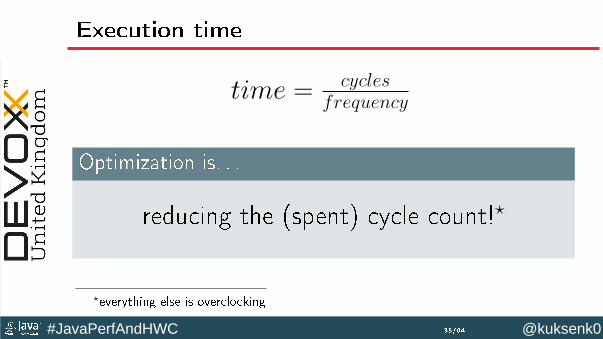
Execution time
𝑡𝑖𝑚𝑒 = 𝑐𝑦𝑐𝑙𝑒𝑠𝑓𝑟𝑒𝑞𝑢𝑒𝑛𝑐𝑦
Optimization is. . .
reducing the (spent) cycle count!⋆
⋆everything else is overclocking
35/64
@kuksenk0 #JavaPerfAndHWC
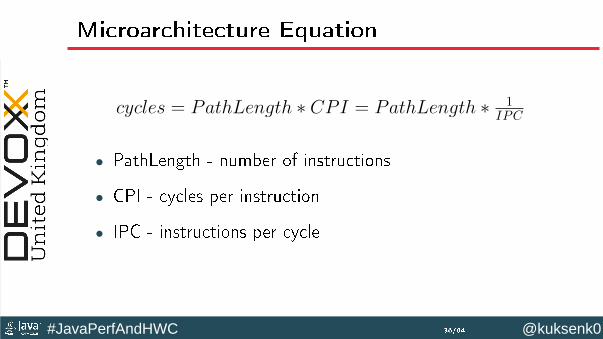
Microarchitecture Equation
𝑐𝑦𝑐𝑙𝑒𝑠 = 𝑃𝑎𝑡ℎ𝐿𝑒𝑛𝑔𝑡ℎ * 𝐶𝑃𝐼 = 𝑃𝑎𝑡ℎ𝐿𝑒𝑛𝑔𝑡ℎ * 1𝐼𝑃𝐶
∙ PathLength - number of instructions
∙ CPI - cycles per instruction
∙ IPC - instructions per cycle
36/64
@kuksenk0 #JavaPerfAndHWC
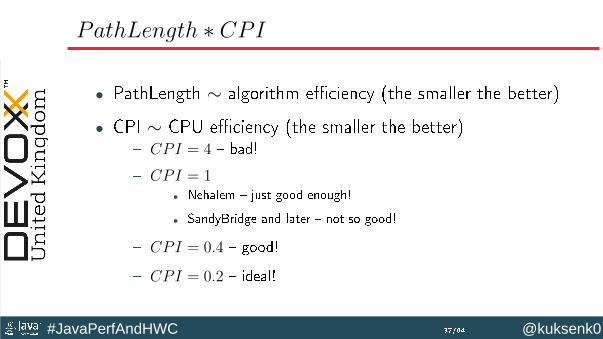
𝑃𝑎𝑡ℎ𝐿𝑒𝑛𝑔𝑡ℎ * 𝐶𝑃𝐼
∙ PathLength ∼ algorithm efficiency (the smaller the better)
∙ CPI ∼ CPU efficiency (the smaller the better)– 𝐶𝑃𝐼 = 4 – bad!
– 𝐶𝑃𝐼 = 1∙ Nehalem – just good enough!
∙ SandyBridge and later – not so good!
– 𝐶𝑃𝐼 = 0.4 – good!
– 𝐶𝑃𝐼 = 0.2 – ideal!
37/64

@kuksenk0 #JavaPerfAndHWC
What to do?
∙ low CPI– reduce PathLength → «tune algorithm»
∙ high CPI ⇒ stalls– memory stalls → «tune data structures»
– branch stalls → «tune control logic»
– instruction dependency → «break dependency chains»
– long latency ops → «use more simple operations»
– etc. . .
38/64
@kuksenk0 #JavaPerfAndHWC
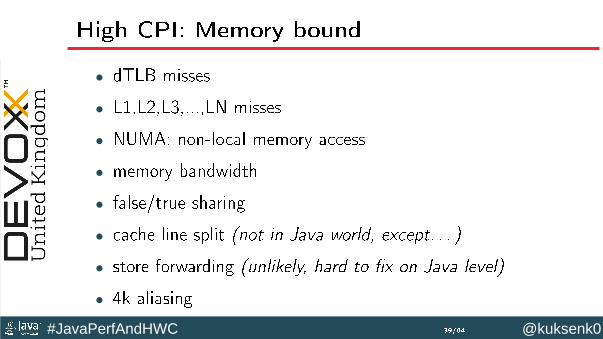
High CPI: Memory bound
∙ dTLB misses
∙ L1,L2,L3,...,LN misses
∙ NUMA: non-local memory access
∙ memory bandwidth
∙ false/true sharing
∙ cache line split (not in Java world, except. . . )
∙ store forwarding (unlikely, hard to fix on Java level)
∙ 4k aliasing
39/64
@kuksenk0 #JavaPerfAndHWC
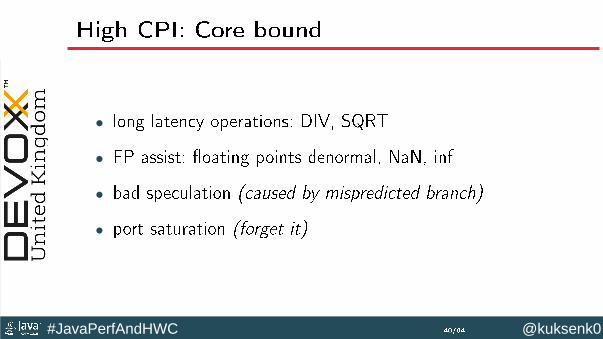
High CPI: Core bound
∙ long latency operations: DIV, SQRT
∙ FP assist: floating points denormal, NaN, inf
∙ bad speculation (caused by mispredicted branch)
∙ port saturation (forget it)
40/64
@kuksenk0 #JavaPerfAndHWC
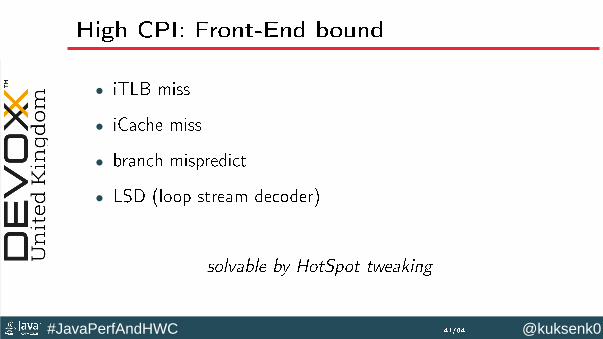
High CPI: Front-End bound
∙ iTLB miss
∙ iCache miss
∙ branch mispredict
∙ LSD (loop stream decoder)
solvable by HotSpot tweaking
41/64
@kuksenk0 #JavaPerfAndHWC @kuksenk0 #JavaPerfAndHWC
Exam
ples

@kuksenk0 #JavaPerfAndHWC
Example 2
Some «large» standard server-sideJava benchmark
43/64
@kuksenk0 #JavaPerfAndHWC
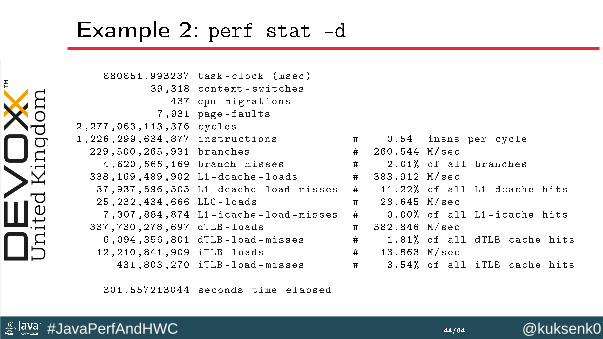
Example 2: perf stat -d
880851.993237 task -clock (msec)
39,318 context -switches
437 cpu -migrations
7,931 page -faults
2 ,277 ,063 ,113 ,376 cycles
1 ,226 ,299 ,634 ,877 instructions # 0.54 insns per cycle
229 ,500 ,265 ,931 branches # 260.544 M/sec
4 ,620 ,666 ,169 branch -misses # 2.01% of all branches
338 ,169 ,489 ,902 L1-dcache -loads # 383.912 M/sec
37 ,937 ,596 ,505 L1-dcache -load -misses # 11.22% of all L1-dcache hits
25 ,232 ,434 ,666 LLC -loads # 28.645 M/sec
7 ,307 ,884 ,874 L1-icache -load -misses # 0.00% of all L1 -icache hits
337 ,730 ,278 ,697 dTLB -loads # 382.846 M/sec
6 ,094 ,356 ,801 dTLB -load -misses # 1.81% of all dTLB cache hits
12 ,210 ,841 ,909 iTLB -loads # 13.863 M/sec
431 ,803 ,270 iTLB -load -misses # 3.54% of all iTLB cache hits
301.557213044 seconds time elapsed
44/64
@kuksenk0 #JavaPerfAndHWC
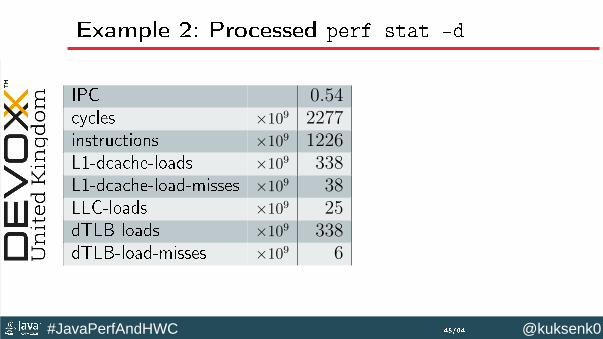
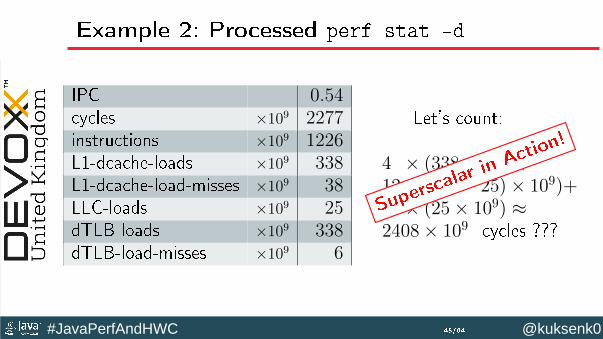
Example 2: Processed perf stat -d
IPC 0.54cycles ×109 2277instructions ×109 1226L1-dcache-loads ×109 338L1-dcache-load-misses ×109 38LLC-loads ×109 25dTLB-loads ×109 338dTLB-load-misses ×109 6
Let’s count:
4
2
× (338× 109)+12× ((38− 25)× 109)+36× (25× 109) ≈2408× 109 cycles ???
Potential Issues?
Supersc
alarin A
ction!
Issue!
45/64

@kuksenk0 #JavaPerfAndHWC
Example 2: Processed perf stat -d
IPC 0.54cycles ×109 2277instructions ×109 1226L1-dcache-loads ×109 338L1-dcache-load-misses ×109 38LLC-loads ×109 25dTLB-loads ×109 338dTLB-load-misses ×109 6
Let’s count:
4
2
× (338× 109)+12× ((38− 25)× 109)+36× (25× 109) ≈2408× 109 cycles ???
Potential Issues?
Supersc
alarin A
ction!
Issue!
45/64
@kuksenk0 #JavaPerfAndHWC
Example 2: dTLB misses
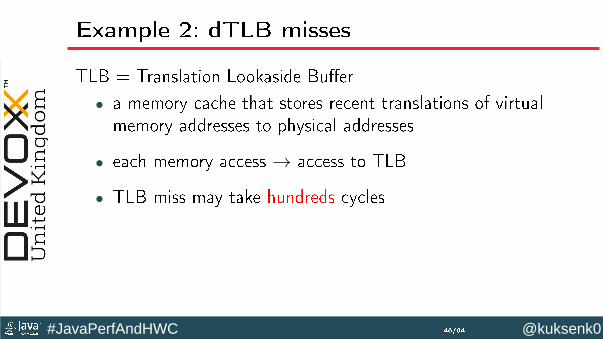
TLB = Translation Lookaside Buffer
∙ a memory cache that stores recent translations of virtualmemory addresses to physical addresses
∙ each memory access → access to TLB
∙ TLB miss may take hundreds cycles
How to check?
∙ dtlb_load_misses_miss_causes_a_walk
∙ dtlb_load_misses_walk_duration
46/64

@kuksenk0 #JavaPerfAndHWC
Example 2: dTLB misses
TLB = Translation Lookaside Buffer
∙ a memory cache that stores recent translations of virtualmemory addresses to physical addresses
∙ each memory access → access to TLB
∙ TLB miss may take hundreds cycles
How to check?
∙ dtlb_load_misses_miss_causes_a_walk
∙ dtlb_load_misses_walk_duration
46/64
@kuksenk0 #JavaPerfAndHWC
Example 2: dTLB misses
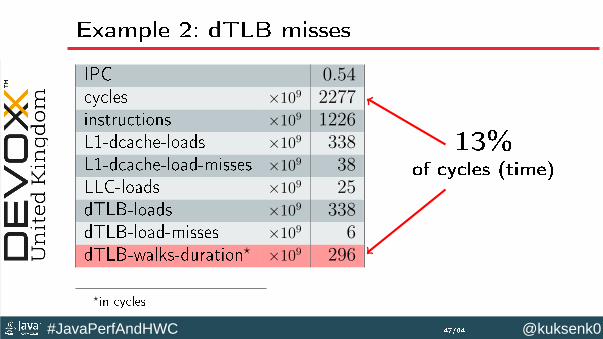
IPC 0.54cycles ×109 2277instructions ×109 1226L1-dcache-loads ×109 338L1-dcache-load-misses ×109 38LLC-loads ×109 25dTLB-loads ×109 338dTLB-load-misses ×109 6dTLB-walks-duration⋆ ×109 296
13%of cycles (time)
⋆in cycles
47/64
@kuksenk0 #JavaPerfAndHWC
Example 2: dTLB misses
Fixing it:
∙ Enable -XX:+UseLargePages
∙ try to shrink application working set
48/64

@kuksenk0 #JavaPerfAndHWC
Example 2: -XX:+UseLargePages
baseline large pages
IPC 0.54 0.64cycles ×109 2277 2277instructions ×109 1226 1460L1-dcache-loads ×109 338 401L1-dcache-load-misses ×109 38 38LLC-loads ×109 25 25dTLB-loads ×109 338 401dTLB-load-misses ×109 6 0.24dTLB-walks-duration ×109 296 2.6
Boost – 20%
49/64

@kuksenk0 #JavaPerfAndHWC
Example 2: normalized per transaction
baseline large pages
IPC 0.54 0.64cycles ×106 23.4 19.5instructions ×106 12.5 12.5L1-dcache-loads ×106 3.45 3.45L1-dcache-load-misses ×106 0.39 0.33LLC-loads ×106 0.26 0.21dTLB-loads ×106 3.45 3.45dTLB-load-misses ×106 0.06 0.002dTLB-walks-duration ×106 3.04 0.022
Boost
50/64

@kuksenk0 #JavaPerfAndHWC
Example 3
«A plague on both your houses»
«++ on both your threads»
51/64
@kuksenk0 #JavaPerfAndHWC
Example 3: False Sharing
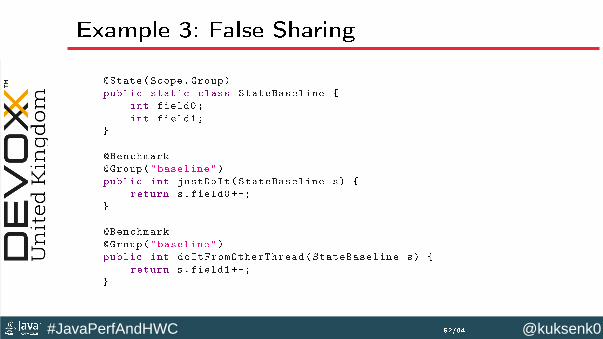
@State(Scope.Group)
public static class StateBaseline {
int field0;
int field1;
}
@Benchmark
@Group("baseline")
public int justDoIt(StateBaseline s) {
return s.field0 ++;
}
@Benchmark
@Group("baseline")
public int doItFromOtherThread(StateBaseline s) {
return s.field1 ++;
}
52/64

@kuksenk0 #JavaPerfAndHWC
Example 3: Measure
resource⋆ sharing paddedSame Core (HT) L1 9.5 4.9Diff Cores (within socket) L3 (LLC) 10.6 2.8Diff Sockets nothing 18.2 2.8
average time, ns/op
⋆shared between threads
53/64

@kuksenk0 #JavaPerfAndHWC
Example 3: What do HWC tell us?
Same Core Diff Cores Diff Socketssharing padded sharing padded sharing padded
CPI 1.3 0.7 1.4 0.4 1.7 0.4cycles 33130 17536 36012 9163 46484 9608instructions 26418 25865 26550 25747 26717 25768L1-loads 12593 9467 9696 8973 9672 9016L1-load-misses 10 5 12 4 33 3L1-stores 4317 7838 7433 4069 6935 4074L1-store-misses 5 2 161 2 55 1LLС-loads 4 3 58 1 32 1LLC-load-misses 1 1 53 ≈0 35 ≈0LLC-stores 1 1 183 ≈0 49 ≈0LLC-store-misses 1 ≈0 182 ≈0 48 ≈0
⋆ All values are normalized per 103 operations
54/64

@kuksenk0 #JavaPerfAndHWC
Example 3: «on a core and a prayer»
in case of the single core(HT) we have to look intoMACHINE_CLEARS.MEMORY_ORDERING
Same Core Diff Cores Diff Socketssharing padded sharing padded sharing padded
CPI 1.3 0.7 1.4 0.4 1.7 0.4cycles 33130 17536 36012 9163 46484 9608instructions 26418 25865 26550 25747 26717 25768CLEARS 238 ≈0 ≈0 ≈0 ≈0 ≈0
55/64
@kuksenk0 #JavaPerfAndHWC
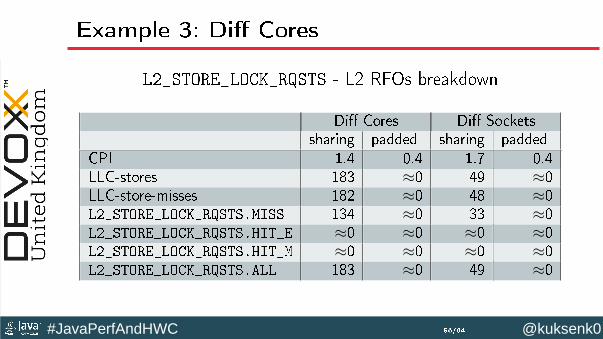
Example 3: Diff Cores
L2_STORE_LOCK_RQSTS - L2 RFOs breakdown
Diff Cores Diff Socketssharing padded sharing padded
CPI 1.4 0.4 1.7 0.4LLC-stores 183 ≈0 49 ≈0LLC-store-misses 182 ≈0 48 ≈0L2_STORE_LOCK_RQSTS.MISS 134 ≈0 33 ≈0L2_STORE_LOCK_RQSTS.HIT_E ≈0 ≈0 ≈0 ≈0L2_STORE_LOCK_RQSTS.HIT_M ≈0 ≈0 ≈0 ≈0L2_STORE_LOCK_RQSTS.ALL 183 ≈0 49 ≈0
56/64

@kuksenk0 #JavaPerfAndHWC
Question!
To the audience
57/64

@kuksenk0 #JavaPerfAndHWC
Example 3: Diff Cores
Diff Cores Diff Socketssharing padded sharing padded
CPI 1.4 0.4 1.7 0.4LLC-stores 183 ≈0 49 ≈0LLC-store-misses 182 ≈0 48 ≈0L2_STORE_LOCK_RQSTS.MISS 134 ≈0 33 ≈0L2_STORE_LOCK_RQSTS.ALL 183 ≈0 49 ≈0
Why 183 > 49 & 134 > 33,but the same socket case is faster?
58/64

@kuksenk0 #JavaPerfAndHWC
Example 3: Some events count duration
For example:
OFFCORE_REQUESTS_OUTSTANDING.CYCLES_WITH_DEMAND_RFO
Diff Cores Diff Socketssharing padded sharing padded
CPI 1.4 0.4 1.7 0.4cycles 36012 9163 46484 9608instructions 26550 25747 26717 25768O_R_O.CYCLES_W_D_RFO 21723 10 29601 56
59/64

@kuksenk0 #JavaPerfAndHWC @kuksenk0 #JavaPerfAndHWC
Sum
mar
y
@kuksenk0 #JavaPerfAndHWC
Summary: Performance is easy
To achieve high performance:
∙ You have to know your Application!
∙ You have to know your Frameworks!
∙ You have to know your Virtual Machine!
∙ You have to know your Operating System!
∙ You have to know your Hardware!
61/64

@kuksenk0 #JavaPerfAndHWC
Summary: «Here be dragons»
To achieve high performance:
∙ You have to know your Application!
∙ You have to know your Frameworks!
∙ You have to know your Virtual Machine!
∙ You have to know your Operating System!
∙ You have to know your Hardware!
61/64
@kuksenk0 #JavaPerfAndHWC
Enlarge your knowledge with these simple tricks!
Reading list:∙ “Computer Architecture: A Quantitative Approach”John L. Hennessy, David A. Patterson
∙ CPU vendors documentation
∙ http://www.agner.org/optimize/
∙ http://www.google.com/search?q=Hardware+
performance+counter
∙ etc. . .
62/64

@kuksenk0 #JavaPerfAndHWC @kuksenk0 #JavaPerfAndHWC
Than
k
you!

@kuksenk0 #JavaPerfAndHWC @kuksenk0 #JavaPerfAndHWC
Q &
A