Jas t 48151322425800
14
J. Agr. Sci. Tech. (2012) Vol. 14: 375-388 375 Centralized Downstream PI Controllers for the West Canal of Aghili Irrigation District A. Montazar 1* , and S. Isapoor 2 ABSTRACT In the face of limited water resources, better utilization and operation of irrigation networks is essential. Use of control systems is considered as one of the most assured ways to achieve the aim. In the course of the present study, two centralized controllers are applied to the west canal of Aghili irrigation district in I. R. Iran. The proposed control algorithms consist of a distant Downstream PI Feedback control (DPIF), and a distant Downstream PI Feedback along with Feedforward control (DPIFF). In the controllers, each water-level regulator is adjusted as based on water levels in all the pools of the canal. The test case canal and flow scenarios are simulated using SOBEK. The controllers are evaluated using the simulation results. The results indicated that both of the proposed controllers possess the considerable needed potential to closely match the discharge (at the cross regulators) with those ordered by water users while properly maintaining the water level throughout the length of the canals of the irrigation system. It is apparent that the DPIFF controller is more effective than DPIF controller in providing a desirable performance. Use of these algorithms makes demand oriented water distribution as well as a better performance of the system possible. The DPIFF controller as the main control system accompanied by a local controller as a backup system can be recommended to present an efficient robust control system for the canal. Keywords: Aghili irrigation system, Centralized control, Control systems, Downstream control, PI controller. _____________________________________________________________________________ 1 Department of Irrigation and Drainage Engineering, Campus of Aburaihan, University of Tehran, Islamic Republic of Iran. * Corresponding author, e-mail: [email protected] 2 Yekom Consolation Engineers, Tehran, Islamic Republic of Iran. INTRODUCTION Water management improvement in irrigation canal systems is widely recognized as an important step in attaining better management at the farm level. Improved operation of irrigation canal systems will improve service to water users, conserve water through increased efficiency, increase delivery flexibility, and provide more prompt responsive reactions to emergencies. Application of control systems is considered as one of the most assured ways to achieve the aim. The demand-oriented operational concept, which bases operations on downstream conditions (Bureau of Reclamation, 1995), provides the needed flexibility in terms of water quantity and timing to achieve improved crop yields as well as water-use efficiency. In the downstream control, water is released in response to the actual water withdrawal demand from the system, and the adjustment of each gate is based on the information downstream from it. Hence, a target water level is immediately maintained at the upstream end of each pool. A wide variety of algorithms for automatic control of water levels in irrigation canals have been proposed (Malaterre et al., 1998). These control algorithms range from the classic Proportional-Integral (PI) controllers,
-
Upload
kamalkhaleghzadeh -
Category
Documents
-
view
234 -
download
0
Transcript of Jas t 48151322425800

J. Agr. Sci. Tech. (2012) Vol. 14: 375-388
375
Centralized Downstream PI Controllers for the West Canal of
Aghili Irrigation District
A. Montazar1∗
, and S. Isapoor2
ABSTRACT
In the face of limited water resources, better utilization and operation of irrigation
networks is essential. Use of control systems is considered as one of the most assured ways
to achieve the aim. In the course of the present study, two centralized controllers are
applied to the west canal of Aghili irrigation district in I. R. Iran. The proposed control
algorithms consist of a distant Downstream PI Feedback control (DPIF), and a distant
Downstream PI Feedback along with Feedforward control (DPIFF). In the controllers,
each water-level regulator is adjusted as based on water levels in all the pools of the canal.
The test case canal and flow scenarios are simulated using SOBEK. The controllers are
evaluated using the simulation results. The results indicated that both of the proposed
controllers possess the considerable needed potential to closely match the discharge (at
the cross regulators) with those ordered by water users while properly maintaining the
water level throughout the length of the canals of the irrigation system. It is apparent that
the DPIFF controller is more effective than DPIF controller in providing a desirable
performance. Use of these algorithms makes demand oriented water distribution as well
as a better performance of the system possible. The DPIFF controller as the main control
system accompanied by a local controller as a backup system can be recommended to
present an efficient robust control system for the canal.
Keywords: Aghili irrigation system, Centralized control, Control systems, Downstream
control, PI controller.
_____________________________________________________________________________ 1 Department of Irrigation and Drainage Engineering, Campus of Aburaihan, University of Tehran, Islamic
Republic of Iran. ∗
Corresponding author, e-mail: [email protected] 2 Yekom Consolation Engineers, Tehran, Islamic Republic of Iran.
INTRODUCTION
Water management improvement in
irrigation canal systems is widely recognized
as an important step in attaining better
management at the farm level. Improved
operation of irrigation canal systems will
improve service to water users, conserve
water through increased efficiency, increase
delivery flexibility, and provide more prompt
responsive reactions to emergencies.
Application of control systems is considered
as one of the most assured ways to achieve
the aim. The demand-oriented operational
concept, which bases operations on
downstream conditions (Bureau of
Reclamation, 1995), provides the needed
flexibility in terms of water quantity and
timing to achieve improved crop yields as
well as water-use efficiency. In the
downstream control, water is released in
response to the actual water withdrawal
demand from the system, and the adjustment
of each gate is based on the information
downstream from it. Hence, a target water
level is immediately maintained at the
upstream end of each pool.
A wide variety of algorithms for automatic
control of water levels in irrigation canals
have been proposed (Malaterre et al., 1998).
These control algorithms range from the
classic Proportional-Integral (PI) controllers,

_______________________________________________________________ Montazar and Isapoor
376
which are extensively employed in the
process-control industry, to heuristic
controllers, and to optimal controllers. A
number of such more sophisticated
controllers as linear quadratic and model
predictive controllers have also been
proposed.
Two main control techniques can be
considered, feedback and feedforward. With
a feedback control algorithm, the controlled
variable is measured and any deviation from
the corresponding set-point value -error- is
fed into the control algorithm to provide for a
corrective action. External disturbances are
indirectly taken into account through their
effects on the output of the system. Using the
error as input, the feedback control algorithm
calculates gate openings or flow rates in real
time to maintain the target values for the
controlled water depth. Examples of feedback
control in water level are Amil, Avis, and
Avio gates, CARDD (Burt, 1983), BIVAL
(Chevereau et al., 1987), Liu et al. (1994),
Durdu (2003 and 2004) as well as Clemmens
and Schuurmans’s works (2004). In
feedforward control, the control action
variables are computed from targeted
variables, disturbance estimations and
process simulation. The control action
variables, also called outputs of the control
algorithm, are variables issued from the
control algorithm and supplied to the
actuators of the check structures. They are
either gate openings or flow rates. Some
feedforward controllers of water level were
evaluated by Liu et al. (1992), Tomicic
(1989), Lin and Manz (1992), as well as by
Baume et al. (1993).
Because of the large delay times that may
be present in irrigation water delivery
systems, feedback control alone may not be
sufficient to provide adequate control. Thus,
many researchers recommend using a
combination of feedforward and feedback
routines to automatically control irrigation
water delivery systems (Clemmens et al.
1997; Malaterre et al., 1998). Two examples
of feedback with feedforward controller in
irrigation canal were presented by Montazar
et al. (2005), and Isapoor et al. (2010). Over
the last few decades, the type of controllers
applied to water systems have evolved from
feedback in combination with feedforward
towards such more advanced control methods
as Model Predictive Control (van Overloop et
al., 2005 and 2007; Qin and Badgwell, 2003).
In this paper, a linear control theory is
applied in the design of two centralized
downstream PI controllers, with feedback
technique as well as feedback+feedforward
technique, for the west canal of Aghili
irrigation district in I.R.Iran. The first order
low pass filter (PIF) and decoupling of the
pools are also taken into consideration.
MATERIAL AND METHODS
Irrigation District and the Study Canal
Aghili irrigation district (AID) is located
in South West Iran, in the North of
Khuzestan Province. AID is a part of
Gotvand irrigation network. The annual
(maximum vs. minimum) air temperatures
and precipitation rates are 53 vs. 3oC, and
582 vs. 152 mm, respectively. The net
cultivated area in AID is about 4000ha. The
annual mean distributed water in the
irrigation area is about 150 MCM.
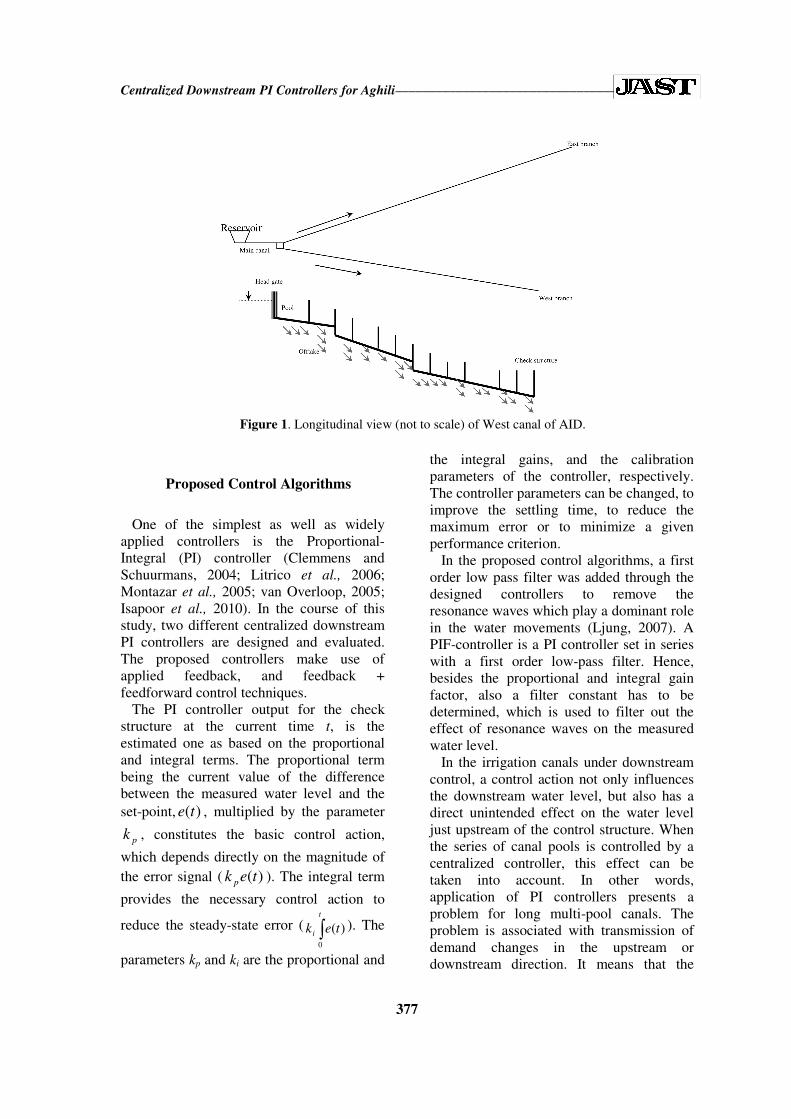
AID includes a short main canal, 2 km
long, along with two subsidiary canals,
west branch at a length of 14.9 km vs. east
branch with an 18.6 km of length. The west
branch of the canal is considered in this
study. This canal includes 12 pools (13 in-
line check structures) and 27 offtakes. All
the check structures are radial gates. The
design discharge capacity of the canal is 7
m3 s
-1. The canal is manually controlled.
The operators deliver the demands of water
users according to their requests (at 8 am
every day). As the demands of the water
users, in terms of flexible delivery, are
increasing, there is an urgent need for
supporting the operators through
automation of the structure operations.
Figure 1 shows a longitudinal view of the
west canal of AID.
Centralized Downstream PI Controllers for Aghili_________________________________
377
Figure 1. Longitudinal view (not to scale) of West canal of AID.
Proposed Control Algorithms
One of the simplest as well as widely
applied controllers is the Proportional-
Integral (PI) controller (Clemmens and
Schuurmans, 2004; Litrico et al., 2006;
Montazar et al., 2005; van Overloop, 2005;
Isapoor et al., 2010). In the course of this
study, two different centralized downstream
PI controllers are designed and evaluated.
The proposed controllers make use of
applied feedback, and feedback +
feedforward control techniques.
The PI controller output for the check
structure at the current time t, is the
estimated one as based on the proportional
and integral terms. The proportional term
being the current value of the difference
between the measured water level and the
set-point, )(te , multiplied by the parameter
pk , constitutes the basic control action,
which depends directly on the magnitude of
the error signal ( )(tek p ). The integral term
provides the necessary control action to
reduce the steady-state error ( ∫t
i tek0
)( ). The
parameters kp and ki are the proportional and
the integral gains, and the calibration
parameters of the controller, respectively.
The controller parameters can be changed, to
improve the settling time, to reduce the
maximum error or to minimize a given
performance criterion.
In the proposed control algorithms, a first
order low pass filter was added through the
designed controllers to remove the
resonance waves which play a dominant role
in the water movements (Ljung, 2007). A
PIF-controller is a PI controller set in series
with a first order low-pass filter. Hence,
besides the proportional and integral gain
factor, also a filter constant has to be
determined, which is used to filter out the
effect of resonance waves on the measured
water level.
In the irrigation canals under downstream
control, a control action not only influences
the downstream water level, but also has a
direct unintended effect on the water level
just upstream of the control structure. When
the series of canal pools is controlled by a
centralized controller, this effect can be
taken into account. In other words,
application of PI controllers presents a
problem for long multi-pool canals. The
problem is associated with transmission of
demand changes in the upstream or
downstream direction. It means that the

_______________________________________________________________ Montazar and Isapoor
378
Figure 2. Centralized downstream feedback (FB) control.
disturbances in one pool influence all the
pools throughout the canal and so the
controlling process is complicated by the
interactions between neighboring pools
(Schuurmans, 1992). To reduce the impacts,
the pools are coupled in the upstream and
downstream direction. Here, this effect is
considered by adding decouplers to the
controller structure. The control actions, as
output, are calculated based on the
magnitude of the water level deviation
which is taken as input to the controller. The
calculated value is added to the upstream
gate directly to make a centralized
controller. In case of distant downstream
feedback control, the water level at the
downstream side of a pool is controlled by
adjusting the gate at the upstream end of the
reach, in reaction to the deviation from the
set point (Figure 2).
In the feedback+feedforward control
system, all the measurements are explicitly
linked to control actions with the
connections between inputs and outputs
within the central control box being
straightforward (Figure 3). All water-level
measurements are the inputs while all the
check structure flow adjustments being
considered as the outputs. In this controller,
each check structure is adjusted as based on
all the pool water levels in the canal. With
centralized control, based on the delivery
schedule, observations and actions are
carried out from a distant site through a
supervisory control and data acquisition
system.
One of the most difficult aspects of
applying automatic control to irrigation
water-delivery systems is the determination
of the correct controller constants, or tuning.
The proposed multiple-model optimization
of PI controllers on canals by Overloop et al.
(2005) was employed for tuning the
controllers. In this technique, a linear
controller is tuned in such a way that it
stabilizes all models (for all sets of flows)
and optimizes an objective function that is a
sum of individual objective functions, each
valid for one of the models from the set. By
applying a multiple model optimization that
minimizes the water-level deviations from
target level in all pools, the tuning of
decentralized PIF controllers on canals may
be done in one design step, without the need
for an extensive trial-and-error procedure.
The tuning rules provide parameters for PI
control, valid for various integrator-delay
(ID) model parameters corresponding to

Centralized Downstream PI Controllers for Aghili_________________________________
379
Figure 3. Centralized downstream feedback (FB)+feedforward (FF) control.
different flow regimes. The ID model
benefits from two properties: a delay time
for flow changes upstream to be felt
downstream and a backwater surface area,
which describes how the downstream water
level changes as a function of a pool’s
inflow–outflow mismatch (Schuurmans et
al., 1999). The parameters of the PIF
controllers are tuned according to the tuning
rules for open channels (Schuurmans, 1997).
Model Setup and Calibration-validation
Process
The model of the West branch side-canal
of AID was simulated with SOBEK
simulation package. In this study, the
Channel Flow (CF) and Real-Time Control
(RTC) modules are employed. Real-time
control is used to adjust the control
structures depending on the actual situation.
The Sobek CF module is the unsteady open-
channel flow simulation portion of Sobek
(Sobek Manual and Technical Reference,
2000). The Sobek RTC module allows the
check gates in Sobek CF to be externally
controlled by MATLAB. The setup
preparation for the Sobek model involves
specifications of canal path, cross-sections,
layout of the canal network, regulators,
upstream and downstream boundary
conditions.
Data on geometry of the canals and
hydraulic structures were collected from the
Authority of Gotvand Irrigation Network.
Based on the real conditions in West and
East branches, the boundary condition at
system source is a constant water level at the
upstream side of the head gate in both
canals. The constant water level at the
source and the real flow hydrographs at
downstream end of the canals and at each
offtake were chosen as upstream and
downstream boundary conditions.
Manning’s roughness coefficient and
discharge coefficients were employed for the
calibration of the model. The Manning’s
roughness coefficient as well as discharged
coefficient are adjusted to obtain the
required water level and discharge.
Model calibration involves checking the
model results with the observed data and
adjusting the parameters until the model
results fall within acceptable range of
accuracy. Calibration of the model was
accomplished by matching the computed
and measured water levels and discharges at
various locations along the canal. For
calibration and validation of the model, we
used one month data out of two month daily
gathered real operation data were taken into
account (April and May 2008). Two sets of
measured data are used for model calibration
and validation (the first 15 days of April
2008 for calibration, and the second 15 days

_______________________________________________________________ Montazar and Isapoor
380
of May 2008 for validation). These data
include measured discharge and water
surface elevation at various locations along
the canal. The data used for calibration of
the model in steady state condition consist of
a set of water levels at crest of AWC check
structure for 80%, and 60% of the design
discharge.
To calibrate the model, an initial run was
made with default global values of
Manning’s roughness coefficient 'n' and
discharge coefficients. Later these
parameters were manually adjusted and the
model rerun. Based on the comparison, the
model parameters were adjusted. This
process was continued until the observed
and simulated values were in close
agreements. To further check the calibration
and validity of the model Nash–Sutcliffe
Efficiency Coefficient (NSEC) and Percent
bias (PBIAS) are calculated. NSEC is a
dimensionless indicator and has been
recommended by ASCE (1993). NSEC
values between 0 and 1.0 are generally
viewed as acceptable levels of performance,
whereas values ≤ 0.0 indicate an
unacceptable performance. NSEC is
calculated as:
−
−
−=
∑
∑
=
=
n
i
t
s
n
i
t
s
t
NSEC
1
2
0
1
2
0
)(
)(
1 (1)
where Q0t represents observed discharges,
while Qst the simulated discharges at time t,
0Q is the mean of the observed data and n
the total number of observations.
PBIAS measures the average tendency of
the simulated data to be either larger or
smaller than their observed counterparts.
The optimal value of PBIAS is zero with
lower values indicating better simulation. A
positive value indicates a tendency of the
model for underestimation while negative
values are indicative of overestimation
(Moriasi et al., 2007). PBIAS is determined
as:
×
−
=
∑
∑ ∑
=
= = 100
1
0
1 1
0
n
t
t
n
t
n
t
t
s
t
Q
PBIAS (2)
The Maximum Error (ME), as a measure
of the maximum error between any pair of
simulated and measured values, the
modeling efficiency (EF), as a measure for
assessing the accuracy of simulations, and
the Coefficient of Residual Mass (CRM), as
an indication of the consistent errors in the
distribution of all simulated values across all
measurements, are also determined (Jabro et
al., 1998).
Simulations
Following the calibration and validation of
the model, it is used for simulation of the
other desired scenarios and for evaluating
control algorithms. The proposed control
algorithms are programmed in MATLAB.
Sobek is of the capacity to be linked with
MATLAB (Matlab users guide, 1998).
Automatic control algorithms can be written
as MATLAB m-files that are then connected
to the Sobek CF module through the Sobek
RTC module. Within Sobek, the user
determines that control is from an external
source and selects the 'm-file' that is to be
used for control from a directory list. The
Sobek RTC passes the various hydraulic
property figures (????)(water depths and
flow rates) from Sobek CF to the controller
code (i.e., m-file). Gate positions and water
levels are available in MATLAB using IDs
defined by Sobek. The controller code uses
this information along with the information
on the canal properties to calculate the
appropriate adjustment to the individual
check gate structure using MATLAB.
Finally, this information is passed back to
Sobek CF through Sobek RTC and the
appropriate control actions implemented.
To evaluate the control algorithms
potential, simulations are done for two
scenarios as follows:

Centralized Downstream PI Controllers for Aghili_________________________________
381
0
0.1
0.2
0.3
0.4
0.5
0.6
0 1 2 3 5 6 7 8 9
10
11
12
13
14
15
16
17
18
19
20
21
22
23
24
25
26
27
28
30
Time (day)
Dis
ch
arg
e (
m3 s
-1)
AWT-06 AWT-11 AWT-17
Figure 4. Discharge schedule of offtakes of AWT-06, AWT-11, and AWT-17 on May 2008.
0
0.05
0.1
0.15
0.2
0.25
0.3
0.35
8:0
0 P
M
2:0
0 A
M
8:0
0 A
M
2:0
0 P
M
8:0
0 P
M
2:0
0 A
M
8:0
0 A
M
2:0
0 P
M
8:0
0 P
M
2:0
0 A
M
8:0
0 A
M
2:0
0 P
M
8:0
0 P
M
2:0
0 A
M
8:0
0 A
M
2:0
0 P
M
8:0
0 P
M
2:0
0 A
M
8:0
0 A
M
2:0
0 P
M
8:0
0 P
M
2:0
0 A
M
8:0
0 A
M
2:0
0 P
M
8:0
0 P
M
Time (h)
Dis
charg
e (
m3 s
-1)
AWT-06 AWT-11 AWT-17
Figure 5. Discharge schedule of offtakes of AWT-06, AWT-11, and AWT-17 on the 6-day simulation
period.
1). The current operation of canal based on
the delivery schedule during May 2008: In
this scenario, the delivery schedule is
changed based on the real operation of the
canal. There are 28 offtakes on the West
canal of AID. As an example, the discharge
schedule of three offtakes of AWT-06,
AWT-11, and AWT-17 on 1st to 30
th May
are shown in Figure 4. Daily operation of the
others to deliver the water demand of the
users is accomplished during this period.
2). The delivery schedule changes from 20
to 40, 40 to 60, and 60 to 80% of the
offtake’s capacity in six steps (the time
period of the steps is 24 hours), either
increasing or decreasing. The 24-hour period
was chosen to reflect the operational
objective of the irrigation authority. For this
scenario, the flow control time step was 5
minutes. The discharge schedule for three
offtakes of AWT-06, AWT-11, and AWT-
17 is presented in Figure 5.
Controllers maintain the water level at
target level (set-point) at the downstream
end of the canal pools. Due to schedule
variation of an offtake for operation
purposes, set-point deviations are taking
place at the end of each pool. The distant
downstream PIF controller calculates a
desired flow change for the check structures
on the upstream side of canal pools on the
basis of the magnitude of deviation and
controller gains.
Performance Indicators
To judge the overall effectiveness of the

_______________________________________________________________ Montazar and Isapoor
382
y = 0.9605x + 7.8924, R2 = 0.9839
199
199.2
199.4
199.6
199.8
200
200.2
200.4
200.6
199 199.2 199.4 199.6 199.8 200 200.2 200.4 200.6
Measured water level (m)
Sim
ula
ted w
ate
r le
vel (m
)
Figure 6. A comparison of measured vs. simulated water levels (the first 3 km of the canal).
Table 2. Controller parameters resulting from system identification.
Pool no. 1 2 3 4 5 6 7 8 9 10 11 12
Kp -1.231 �4.123 -1.363 -0.796 -2.043 -2.385 �1.197 -0.595 -0.592 -0.861 -0.929 -0.656
Ki -0.110 -0.618 -0.093 -0.054 -0.139 -0.163 -0.082 -0.041 -0.044 -0.129 -0.066 -0.045
proposed control algorithms, four
performance indicators presented by
Clemmens et al. (1998) are used. The
indicators include: (1) the Maximum
Absolute Error (MAE) as a measure of the
maximum deviation in water level from the
desired set-point, (2) the Integrated Absolute
Error (IAE) that indicates the speed at which
the water levels return to the desired set-
point, (3) the Steady-state Error (StE) as the
maximum of the average error over the latest
two hours of each 12-h test section, and (4)
the integrated absolute discharge change
(IAQ), which is an indication of the extent
of gate movements required to achieve
control. The indicators are determined for
the controllers for each pool in West canal
of AID in the same period as simulations.
RESULTS AND DISCUSSION
Calibration and Validation of the Model
Table 1 shows the statistical parameters
used for model calibration and validation.
The values of ME, CRM, NSEC, and PBIS
are estimated <0.033, <0.013, <0.93, and
<0.13, respectively. It is evident from the
table that the values of the indicators for
different discharge levels are small, falling
within the acceptable range as discussed
earlier. Therefore, the model is considered
calibrated and validated. The Simulated
Water Level (SWL), matched closely with
the measured water level (MWL), (SWL=
0.9605MWL+7.8924, R2= 0.98) at full
supply discharge within the first 3km of the
canal as shown in Figure 6.
Table 2 shows the optimized PI
parameters of the pools obtained for the PI
controllers. Using these parameters, the
water-level deviations may be minimized
from the target level in all pools.
Controllers’ Comparison
Water level deviation and the controller
requested gate flow deviations are mainly
considered as performace criteria. The

Centralized Downstream PI Controllers for Aghili_________________________________
383
0
0.5
1
1.5
2
2.5
3
8:0
0 A
M
8:0
0 A
M
8:0
0 A
M
8:0
0 A
M
8:0
0 A
M
8:0
0 A
M
8:0
0 A
M
8:0
0 A
M
8:0
0 A
M
8:0
0 A
M
8:0
0 A
M
8:0
0 A
M
8:0
0 A
M
8:0
0 A
M
8:0
0 A
M
8:0
0 A
M
8:0
0 A
M
8:0
0 A
M
8:0
0 A
M
8:0
0 A
M
8:0
0 A
M
8:0
0 A
M
8:0
0 A
M
8:0
0 A
M
8:0
0 A
M
8:0
0 A
M
8:0
0 A
M
8:0
0 A
M
8:0
0 A
M
8:0
0 A
M
8:0
0 A
M
Time (h-day)
Dis
ch
arg
e (
m3 s
-1)
191
191.2
191.4
191.6
191.8
192
192.2
192.4
192.6
192.8
193
Wa
ter
leve
l/C
rest
leve
l (m
)
Discharge Water level
Crest level
1 2 3 4 5 6 7 8 9 10 11 12 13 14 15 16 17 18 19 20 21 22 23 24 25 26 27 28 29 30 31
Figure 7. Discharge, water level upstream and crest level of CHAWC-3105 check structure in pool
no. 4 (DPIF controller-scenario no. 1).
0
0.5
1
1.5
2
2.5
3
8:0
0:0
0 A
M
8:0
0:0
0 A
M
8:0
0:0
0 A
M
8:0
0:0
0 A
M
8:0
0:0
0 A
M
8:0
0:0
0 A
M
8:0
0:0
0 A
M
8:0
0:0
0 A
M
8:0
0:0
0 A
M
8:0
0:0
0 A
M
8:0
0:0
0 A
M
8:0
0:0
0 A
M
8:0
0:0
0 A
M
8:0
0:0
0 A
M
8:0
0:0
0 A
M
8:0
0:0
0 A
M
8:0
0:0
0 A
M
8:0
0:0
0 A
M
8:0
0:0
0 A
M
8:0
0:0
0 A
M
8:0
0:0
0 A
M
8:0
0:0
0 A
M
8:0
0:0
0 A
M
8:0
0:0
0 A
M
8:0
0:0
0 A
M
8:0
0:0
0 A
M
8:0
0:0
0 A
M
8:0
0:0
0 A
M
8:0
0:0
0 A
M
8:0
0:0
0 A
M
8:0
0:0
0 A
M
Time (h-day)
Dis
charg
e (
m3 s
-1)
191
191.2
191.4
191.6
191.8
192
192.2
192.4
192.6
192.8
193
Wate
r le
vel/C
rest le
vel (
m)
Discharge Water level
Crest level
1 2 3 4 5 6 7 8 9 10 11 12 13 14 15 16 17 18 19 20 21 22 23 24 25 26 27 28 29 30 31
Figure 8. Discharge, water level upstream and crest level of CHAWC-3105 check structure in pool
no. 4 (DPIFF controller-scenario no. 1).
deviations of discharge, water level and crest
level of the check structures for the scenario
1 of DPIF and DPIFF centralized controls
for pool no. 4 (at the end of the upstream
pool) are shown in Figures 7 and 8,
respectively. The figures clearly show that
both controllers try to achieve the desired
water levels as promptly as possible. It
should be mentioned that desired the flow
rates of offtakes can be provided when the
desired water levels in the canal are
sufficiently achieved. Based on operation
behavior of the canal, the offtake flows
undergo more changes in the latest 10 days
of the simulated month.
As can be seen from the figures, the
oscillations in DPIF controller are higher
than those in DPIFF controller. The water
level at the upstream side of check
structures, for downstream FB+FF control
with decouplers (Figure 8) renders a smooth
change in water level. By a visual
comparison of the controllers, it is apparent
that the downstream FB+FF controller is
more effective than the downstream FB
controller.
The ability of the controllers to improve
the capacity of the Water Authority to
deliver its water supply service is also
shown by the behavior of the performance
criteria (Table 3). These values demonstrate
that the controllers result in a robust control
system which during the current operation of
the canal could control the water level at the
set-point with relatively small deviation
from the desired set-point. The evaluations

_______________________________________________________________ Montazar and Isapoor
384
Table 3. Performance indicators of the controllers for the pools (scenario no. 1).
DPIF Control DPIFF Control Pool
no. MAE (%) IAE (%) StE (%) IAQ (m3 s-1) MAE (%) IAE (%) StE (%) IAQ (m3 s-1)
1 0.75 0.22 0.11 0.142 0.12 0.18 0.03 0.081
2 0.95 0.17 0.16 0.102 0.58 0.07 0.05 0.092
3 9.89 1.11 1.78 0.216 8.76 0.87 0.23 0.205
4 5.83 1.06 0.71 0.112 3.52 1.02 0.45 0.110
5 2.94 1.72 0.29 0.252 1.01 1.46 0.26 0.120
6 2.58 0.55 0.29 0.135 2.03 0.33 0.16 0.105
7 3.71 0.80 0.70 0.110 3.11 0.62 0.42 0.085
8 0.94 1.62 0.78 0.251 0.87 1.28 0.59 0.212
9 5.57 1.66 0.68 0.216 4.92 1.33 0.22 0.147
10 3.79 0.89 0.28 0.181 3.17 0.83 0.15 0.117
11 7.78 1.37 1.68 0.167 6.06 1.11 0.74 0.109
12 12.84 1.99 3.44 0.273 10.93 1.54 1.10 0.216
indicate that both controllers present
effective control methods for West canal of
AID. The average values of MAE, IAE, StE
and IAQ for DPIFF controller are obtained
3.75%, 0.88%, 0.36 and 0.13 m3 s
-1,
respectively, while these indicators for DPIF
controller are 4.78%, 1.10%, 0.91% and
0.18 m3 s
-1, respectively. The index StE is
computed for the latest remaining 2 hours of
simulation for each pool. This index presents
the ability of controllers to bring the
controlled variables back to set-point fast
and without any constant overshooting. The
values of indicators show that both
controllers could bring the water level to the
set-point.
However, significantly greater oscillations
occur for pool no. 12. For this pool, the
values of MAE, IAE, StE and IAQ for both
control methods are at a maximum. The
values of MAE, IAE, StE and IAQ for DPIF
controller are 12.84%, 1.99%, 3.44% and
0.27 m3
s-1
, respectively. The indicators for
DPIFF controller are 10.93%, 1.54%, 1.10%
and 0.21 m3 s
-1, respectively. This pool has
the smallest delay time value of all the
pools. Because of the smaller length of the
pool, reflecting waves (resonance effects)
may have a dominant influence on the
hydrodynamics.
The simulation results of scenario 2 for
four check structures (CHAWC-1380 at the
end of the upstream pool no. 2, CHAWC-
4650 at the end of the upstream pool no. 4,
CHAWC-6500 at the end of the upstream
pool no. 6, and CHAWC-7955 at the end of
the upstream pool. no. 8) are presented in
Figures 9 and 10. The results of discharge
deviations (Figures 9-a and 10-a), and the
offtake flow change schedule (Figure 5) are
similar. The comparisons show that the
oscillations in DPIF controller are higher
than those in DPIFF controller. As is visible,
the deviations resulting from upward and
downward steps are the same. Figures 9-b
and 10-b show the water-level changes at the
end of the pools for the mentioned tests.
Both the desired flow rates and water levels
are quickly achieved under the modes of
operation. From the simulation results, it can
be seen that the desired flow conditions are
achieved within 86 and 118 minutes of
changing flow rates according to the
schedule for DPIFF and DPIF controllers,
respectively. However, it is noticeable that
the controllers can quickly bring the water
level back to the set-point, with the water-
level fluctuations at the end of the upstream
pool quickly damped.
Table 4 presents the computed
performance indicators for the controllers in
this scenario. The average performance
indicators MAE, IAE, StE and IAQ are
calculated for each pool for a 6-day
simulation period. For all the indicators, the
average value is reported. However,
significantly greater oscillations occur for
pool no. 12. For this pool, the maximum
values of MAE, IAE, and IAQ for DPIF
centralized controller are 21.24%, 0.24%,
1.07% and 0.10 m3 s
-1, respectively. Also,
values of the criteria for DPIFF centralized

Centralized Downstream PI Controllers for Aghili_________________________________
385
(a) (b)
0
0.5
1
1.5
2
2.5
3
3.5
4
4.58
:00
PM
8:0
0 A
M
8:0
0 P
M
8:0
0 A
M
8:0
0 P
M
8:0
0 A
M
8:0
0 P
M
8:0
0 A
M
8:0
0 P
M
8:0
0 A
M
8:0
0 P
M
8:0
0 A
M
8:0
0 P
M
Time (h)
Dis
cha
rge
(m
3 s
-1)
CHAWC_1380
CHAWC_4650
CHAWC_6500
CHAWC_7955
182
184
186
188
190
192
194
196
198
8:0
0 P
M
8:0
0 A
M
8:0
0 P
M
8:0
0 A
M
8:0
0 P
M
8:0
0 A
M
8:0
0 P
M
8:0
0 A
M
8:0
0 P
M
8:0
0 A
M
8:0
0 P
M
8:0
0 A
M
8:0
0 P
M
Time (h)
Wate
r le
vel (m
)
Figure 9. Discharge and water level upstream deviations of check structures (DPIF controller-scenario no. 2).
(a) (b)
0
0.5
1
1.5
2
2.5
3
3.5
4
4.5
8:0
0 P
M
8:0
0 A
M
8:0
0 P
M
8:0
0 A
M
8:0
0 P
M
8:0
0 A
M
8:0
0 P
M
8:0
0 A
M
8:0
0 P
M
8:0
0 A
M
8:0
0 P
M
8:0
0 A
M
8:0
0 P
M
Time (h)
Dis
ch
arg
e (
m3
s-1
)
CHAWC_1380
CHAWC_4650
CHAWC_6500
CHAWC_7955
182
184
186
188
190
192
194
196
198
8:0
0 P
M
8:0
0 A
M
8:0
0 P
M
8:0
0 A
M
8:0
0 P
M
8:0
0 A
M
8:0
0 P
M
8:0
0 A
M
8:0
0 P
M
8:0
0 A
M
8:0
0 P
M
8:0
0 A
M
8:0
0 P
M
Time (h)
Wa
ter
lev
el
(m)
Figure 10. Discharge and water level upstream deviations of check structures (DPIFF controller-scenario no. 2).
Table 4. Performance indicators of the controllers for the pools (scenario no. 2).
DPIF Control DPIFF Control Pool
no. MAE (%) IAE (%) StE (%) IAQ (m3 s
-1) MAE (%) IAE (%) StE (%) IAQ (m
3 s
-1)
1 1.97 0.03 0.57 0.215 1.14 0.03 0.41 0.182
2 8.26 0.03 0.45 0.239 1.28 0.02 0.42 0.174
3 17.82 0.19 0.88 0.360 9.03 0.11 0.61 0.230
4 13.97 0.20 2.20 0.127 11.03 0.13 0.63 0.089
5 18.71 0.12 2.46 0.354 5.03 0.07 0.40 0.294
6 11.77 0.10 3.80 0.331 2.44 0.05 0.18 0.124
7 12.98 0.13 1.30 0.263 4.03 0.09 1.04 0.083
8 15.03 0.20 2.56 0.178 11.19 0.16 2.45 0.129
9 14.84 0.21 1.31 0.081 7.41 0.14 0.71 0.080
10 12.83 0.12 1.97 0.113 6.23 0.10 0.62 0.101
11 14.29 0.19 0.05 0.029 11.94 0.15 0.01 0.004
12 21.24 0.24 1.07 0.104 19.31 0.22 0.87 0.033
controller are obtained as: 19.31%, 0.22%,
0.87% and 0.03 m3 s
-1, respectively.
Discharge deviation of DPIF controller,
compared with DPIFF controller within the
check structures is computed. As an
example, the results during 21 days of the
simulation period, in scenario 1 (day of 8th to
28th), are presented for three check structures
of CHAWC-3105 (at the end of the
upstream pool no. 3), CHAWC-4650, and

_______________________________________________________________ Montazar and Isapoor
386
-0.4
-0.3
-0.2
-0.1
0
0.1
0.2
0.3
0.4
Dis
chagre
devia
tion o
f D
PIF
contr
olle
r
com
pare
to D
PIF
F c
ontr
olle
r
(m3 s
-1)
CHAWC_3105 CHAWC_4650
CHAWC_5700
8 9 10 11 12 13 14 15 16 17 18 19 20 21 22 23 24 25 26 27 28
Time (day)
Figure 11. Discharge deviation of the controllers within three check structures.
CHAWC-5700 (at the end of the upstream
pool no. 5) in Figure 11. The results
demonstrate that the variations range from -
0.25 to +0.33 m3 s
-1. The deviation of the
check structures’ discharge is affected by the
offtake discharge schedule. The value of this
parameter is arisen after day 21st, because of
the changes in offtakes' capacity. The
average values of the parameters during this
period are obtained as -0.051, -0.054, and -
0.064 m3 s
-1 for the gates of CHAWC-3105,
CHAWC-4650, and CHAWC-5700,
respectively. This means that the
underestimation figures of DPIF controller
as compared with DPIFF controller are 2.5,
3.2, and 4.1% of the routine discharge for
the gates of CHAWC-3105, CHAWC-4650,
and CHAWC-5700, respectively.
CONCLUSIONS
Two centralized downstream PI
controllers for on-demand operation of West
canal of Aghili Irrigation District are
proposed. The algorithms (downstream PI
feedback control with decouplers, and
downstream PI feedback+feedforward
control with decouplers) are programmed in
MATLAB and connected to the SOBEK
canal flow module through the SOBEK real
time control module. The results of the
design and tuning of these controllers show
that either of the proposed controllers
benefit from significant potentials to closely
match the discharge at the downstream
check structures with those ordered by water
users, while maintaining the water level
throughout the length of the canal. The
proposed controllers can provide timely
deliveries to local farmers with little wastage
of water under predicted as well as unknown
demands (perturbations). It becomes
apparent that DPIFF controller is more
effective than DPIF in providing a desirable
performance. A comparison of the
performance indicators shows that the
DPIFF as a centralized control is a
satisfactory controller for the canal, but it
may be recommended to implement this
controller, as the main control system, with a
local controller as a backup system.
ACKNOWLEDGEMENTS
The authors would like to thank the
WLDELFT Hydraulic, The Netherlands, for
making the SOBEK software, used in this
study, freely available. The financial support
of Khuzestan Water and Power Authority
(through the research contract KUI86023) is
gratefully acknowledged.
REFERENCES
1. ASCE. 1993. Criteria for Evaluation of
Watershed Models. J. Irrig. Drain. Eng.,
119(3): 429–442.

Centralized Downstream PI Controllers for Aghili_________________________________
387
2. Baume, J. P., Sally, H., Malaterre, P. O. and
Rey, J. 1993. Development and Field-
Installation of a Mathematical Simulation
Model in Support of Irrigation Canal
Management. IIMI–Cemegraf Research
Paper, 89 PP.
3. Bureau of Reclamation Technical
Publication. 1995. Canal System Automation
Manual. United States Department of
Interior, Bureau of Reclamation Water
Resources Services.
4. Burt, C. M. 1983. Regulation of Sloping
Canals by Automatic Downstream Control.
Ph.D., Utah State University, Logan, Utah.
5. Chevereau, G. and Schwartz-Benezeth, S.
1987. BIVAL System for Downstream
Control. Proc. Syrup. on Planning,
Operation, Rehabilitation and Automation of
Irrigation, Water Delivery Systems, ASCE,
New York, NY, PP. 155-163.
6. Clemmens, A. J. and Schuurmans, J. 2004.
Simple Optimal Downstream Feedforward
Canal Controllers: Theory. J. Irrig. Drain.
Eng., 130(1): 26-34.
7. Clemmens, A. J., Bautista, E. and Strand, R.
J. 1997. Canal Automation Pilot Project:
Phase I Report. WCL Rep. No. 22, US
Water Conservation Laboratory, Phoenix.
8. Clemmens A. J., Kacerek, T., Grawitz B.
and Schuurmans, W. 1998. Test Cases for
Canal Control Algorithms. J. Irrig. Drain.
Eng., 124(1): 23–30.
9. Durdu, O. F. 2003. Robust Control of
Irrigation Canals. Ph.D. Dissertation,
Colorado State University, Fort Collins CO.
10. Durdu, O. F. 2004. Regulation of Irrigation
Canals Using a Two-stage Linear Quadratic
Reliable Control. Turkish J. Eng. Environ.
Sci., 28: 111-120.
11. Isapoor, S., Montazar, A., van Overloop, P.
and van Giesen, N. 2010. Designing and
Evaluation Control Systems of the Dez Main
Canal. Irrig. Drain. (in press).
12. Jabro, J. D., Toth, J. D. and Fox, R. H. 1998.
Evaluation and Comparison of Five
Simulation Models for Estimating Water
Drainage Fluxes under Corn. J. Environ.
Quality, 27: 1376–1381.
13. Lin, Z. and Manz, D. H. 1992. Optimal
Operation of Irrigation Canal Systems Using
Nonlinear Programming—dynamic
Simulation Model. In Cemagref–IIMI
International Workshop, October,
Montpellier, PP. 297–306.
14. Litrico, X. and Fromion, V. 2006. Tuning of
Robust Distant Downstream PI Controllers
for an Irrigation Canal Pool, I: Theory. J.
Irrig. Drain. Eng., 132(4): 359-368.
15. Ljung, L. 2007. System Identification Tool
Box 7. The Math Works Inc., Natick, MA,
USA.
16. Liu, F., Feyen, J. and Berlamont, J. 1992.
Computation Method for Regulating
Unsteady Flow in Open Channels. J. Irrig.
Drain. Eng., 118(10): 674-688.
17. Liu, F., Feyen, J. and Berlamont, J. 1994.
Downstream Control Algorithm for
Irrigation Canals. J. Irrig. Drain. Eng.,
120(3): 468–483.
18. Malaterre, P. O., Roggers, D. C. and
Schuurmans, J. 1998. Classification of Canal
Control Algorithm. J. Irrig. Drain. Eng.,
124(1): 3-10.
19. MATLAB user’s Guide, Version 5. 1998.
MathWorks, Natick, Mass.
20. Montazar, A., Overloop, P. J. and van,
Brouwer, R. 2005. Centralized Controller
for the Narmada Main Canal. Irrig. Drain.,
54 (1): 79-89.
21. Moriasi, D. N., Arnold, J. G., van Liew, M.
W., Bingner, R. L., Harmel, R. D. and Veith,
T. L. 2007. Model Evaluation Guidelines for
Systematic Quantification of Accuracy in
Watershed Simulations. Trans ASAE, 50(3):
885–900.
22. Overloop, P. J. van, Weijs, S. and Dijkstra,
S. 2007. Multiple Model Predictive Control
on a Drainage Canal System. Control Eng.
Pract., 15(4): 345-353.
23. Overloop, P. J. van, Schuurmans, J.,
Brouwer, R. and Burt, C. M. 2005. Multiple-
model Optimization of Proportional Integral
Controllers on Canals. J. Irrig. Drain. Eng.,
131(2): 190–196.
24. Qin, S. J. and Badgwell, T. A. 2003. A
Survey of Industrial Model Predictive
Control Technology. Control Eng. Pract.,
11(7): 733–764.
25. Schuurmans, J. 1992. Controller Design for
a Regional Downstream Controlled Canal.
Report No. A668, Laboratory for
Measurement and Control, Delft University
of Technology, Delft, The Netherlands.
26. Schuurmans, J. 1997. Control of Water
Levels in Open-channels. Ph.D. Thesis,
Delft University of Technology, Delft, The
Netherlands.
27. Schuurmans, J., Clemmens, A. J., Dijkstra,
S., Hof, A. and Brouwer, R. 1999. Modeling

_______________________________________________________________ Montazar and Isapoor
388
of Irrigation and Drainage Canals for
Controller Design. J. Irrig. Drain. Eng.,
125(6): 338–344.
28. Tomicic, B. 1989. A General Optimization
Module for Real-time Control of Surface
Water Resources. MSc. Thesis, IHE, Delft,
The Netherlands.
29. WL/Delft Hydraulics. 2000. SOBEK Manual
and Technical Reference. WL/Delft
Hydraulics, Delft, The Netherlands.
براي كانال غربي منطقه آبياري عقيليPIكنترل كننده هاي مركزي از پايين دست
عيسي پور. منتظر و س. ع
چكيده
نظر به محدوديت منابع آب تجديد شونده، بهره برداري مطلوب از شبكه هاي آبياري ضروري مي
در اين . مهم مي باشدبكارگيري سيستم هاي كنترل يكي از مهمترين شيوه هاي دستيابي به اين . نمايد
. تحقيق دو كنترل گرمركزي براي كانال غربي شبكه آبياري عقيلي در ايران مورد بررسي قرار مي گيرند
انتگرالي -دار با تكنيك تناسبي دست فاصله كننده سراسري پايين الگوريتم هاي كنترل شامل كنترل
-دار با تكنيك تناسبي ست فاصلهد كننده سراسري پايين و كنترل) DPIF(كوپلينگ خورد و دي پس
در هر يك از كنترل گرها، . مي باشند) DPIFF(كوپلينگ خورد و دي پيش+ خورد انتگرالي پس
. عمليات تنظيم آب هر سازه تنظيم بر اساس وضعيت سطوح آب كليه بازه هاي كانال انجام مي گيرد
اده از مدل سوبك صورت گرفته و كنترل مدل سازي و شبيه سازي گزينه هاي بهره برداري كانال با استف
نتايج نشان مي دهد كه هر دو . گرها با استفاده از نتايج اين شبيه سازيها مورد ارزيابي قرار گرفتند
الگوريتم كنترل از پتانسيل قابل مالحظه اي در تنظيم شدت جريان سازه ها بر اساس نياز بهره برداران و
در اين رابطه عملكرد كنترل . ياري برخوردار مي باشندكنترل سطح آب در سرتاسر كانال آب
كاربرد الگوريتم هاي كنترل مورد مطالعه . مطلوب تر است DPIF نسبت به كنترل گرDPIFFگر
به منظور . امكان تحقّق توزيع آب تقاضامدار و ارتقاء عملكرد بهره برداري سيستم را فراهم مي نمايد
به عنوان سيستم DPIFF كارا در كانال، اجراي تلفيقي كنترل گردستيابي به يك سيستم كنترل هوشمند
.كنترل اصلي و يك كنترل گر موضعي به عنوان سيستم كنترل پشتيباني پيشنهاد مي گردد