Japanese Bank’s Business Strategy in Asia - fsa.go.jp · 1 Mizuho Financial Group Japanese...
26
Mizuho Financial Group Japanese Bank’s Business Strategy in Asia - Why Focus on Asia? March 8, 2013 Mizuho Corporate Bank, Ltd. Nobuhide Hayashi ADBI-JFSA Joint Conference March 8, 2013 Session 2
Transcript of Japanese Bank’s Business Strategy in Asia - fsa.go.jp · 1 Mizuho Financial Group Japanese...
Mizuho Financial Group
Japanese Bank’s Business Strategy in Asia - Why Focus on Asia?
March 8, 2013
Mizuho Corporate Bank, Ltd.
Nobuhide Hayashi
ADBI-JFSA Joint Conference
March 8, 2013Session 2

Mizuho Financial Group1
Japanese Bank’s Business Strategy in Asia - Why Focus on Asia?
<Agenda>I. The standing point of Japanese banks-the earnings positionII. Changes in the world macro economy and industrial structureIII. Mizuho’s international business strategyIV. Mizuho’s medium-term business plan (One MIZUHO New Frontier Plan)
How can we best contribute to growth in Asia as a Japanese bank?- Both getting back to basics and sustainability are important⇒ Focus on real customer demand (client-orientation) & long term
relationship with local customers Converting to a new business model for Japanese banks based on
global structural changes- Mizuho’s Stepping up to the Next Challenge
Key Points
-P2-P5-P12-P22

Mizuho Financial Group2
I. The standing point of Japanese banks-the earnings position
Mizuho Financial Group3
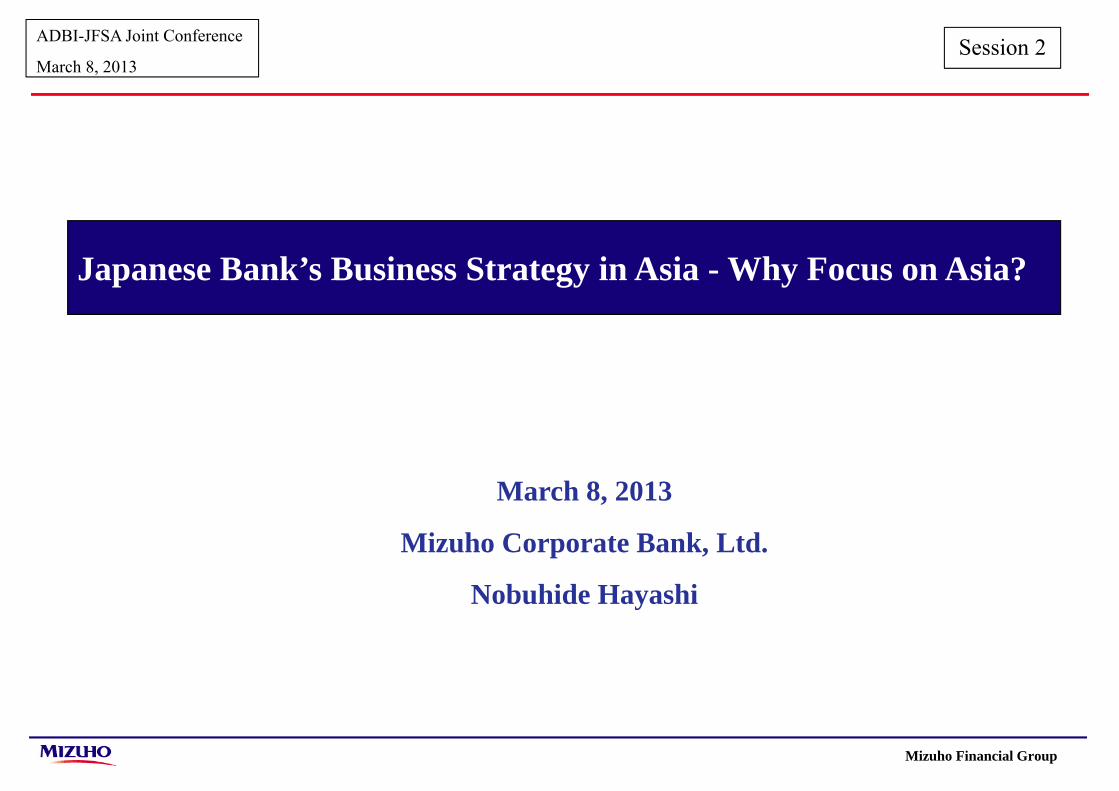
The current performance of Japanese megabanks continues to be strong The presence of international business in overall performance is expanding
I-i The standing point of Japanese banks-the earnings position <Domestic-International Comparison>
[Megabanks: Gross Profit](Domestic Sector/International Sector)
[Megabanks: Interest Income](Domestic Sector/International Sector)
[Megabanks: Fee and Commission Income](Domestic Sector/International Sector)
0.0
0.5
1.0
1.5
2.0
2.5
3.0
1H 2H 1H 2H 1H 2H 1H 2H 1H 2H 1H 2H 1H
2006 2007 2008 2009 2010 2011 2012
0%
5%
10%
15%
20%
25%
30%
35%
40%
International SectorDomestic SectorPercentage of International Sector (right scale)(JPY trillion)
02,0004,0006,0008,000
10,00012,00014,00016,00018,00020,000
1H 2H 1H 2H 1H 2H 1H 2H 1H 2H 1H 2H 1H
2006 2007 2008 2009 2010 2011 2012
0%
5%
10%
15%
20%
25%
International SectorDomestic SectorPercentage of International Sector (right scale)
(JPY 100 million)
0
1,000
2,000
3,000
4,000
5,000
6,000
7,000
1H 2H 1H 2H 1H 2H 1H 2H 1H 2H 1H 2H 1H
2006 2007 2008 2009 2010 2011 2012
0%
5%
10%
15%
20%
25%
30%
35%
40%
International SectorDomestic SectorPercentage of International Sector (right scale)
(JPY 100 million)
(Note) Megabanks: Mizuho Bank, Mizuho Corporate Bank, The Bank of Tokyo-Mitsubishi UFJ, Sumitomo Mitsui Banking CorporationDomestic sector : JPY-denominated transactions of domestic branches (including market transactions) International sector : Foreign currency-dominated transactions of domestic branches and transactions of overseas branches
(Source) Prepared by Mizuho Research Institute from the financial statements of the relevant banks
<Graph 1> <Graph 2> <Graph 3>

Mizuho Financial Group4
Demand for finance in our domestic business unit continues to be weak due to Japan’s prolonged deflation
Domestic interest income is also trending downward due to both decreasing loan balances and narrowing profit margins
I-ii The standing point of Japanese banks-the earnings position <Domestic Unit Performance>
[Megabanks: Trends in Loan Balances] [Megabanks: Domestic Interest Income]
0
50
100
150
200
03/3
04/3
05/3
06/3
07/3
08/3
09/3
10/3
11/3
11/9
12/3
12/9
-8%
-6%
-4%
-2%
0%
2%
4%
6%
8%
Total of the Three MegabanksRate of Increase (yoy; right scale)(JPY trillion)
0
2,000
4,000
6,000
8,000
10,000
12,000
14,000
16,000
1H 2H 1H 2H 1H 2H 1H 2H 1H 2H 1H 2H 1H
2006 2007 2008 2009 2010 2011 2012
(JPY 100 million)
(Note) Megabanks: Mizuho Bank, Mizuho Corporate Bank, The Bank of Tokyo-Mitsubishi UFJ, Sumitomo Mitsui Banking Corporation
(Souces) Summary of Financial Results; prepared by Mizuho Research Institute
<Graph 1> <Graph 2>

Mizuho Financial Group5
II. Changes in the world macro economy and industrial structure

Mizuho Financial Group6
II-i Current Economic Conditions in Asia
Real GDP growth rates in Asia continue to significantly exceed those of developed countries Infrastructure is not yet fully developed in Asia. This means it is necessary to establish electricity
and logistics networks as a platform for business activity and social infrastructure to support urbanization.
Real GDP Growth Quality of Infrastructure in Asian Countries
-6
-4
-2
0
2
4
6
8
10
12
14
00 01 02 03 04 05 06 07 08 09 10 11 12
(%) Major Advanced Economies (G7)
Developing Asia
ASEAN-5
0
1
2
3
4
5
6
7
G7
Average
Asia
Average
Thailand
China
Philippines
India
Indonesia
Vietnam
(MAX = 7)
(Note) Developing Asia : 27 countries (China ,India ,ASEAN (except Singapore) ,etc)(Souce) IMF; prepared by Mizuho Research Institute
(Souce) ADB; prepared by Mizuho Research Institute
<Graph 1> <Graph 2>

Mizuho Financial Group7
Continued pressure of household balance sheet adjustment in the US economy- Consumption is stagnating and economic growth is projected to remain slow European economy taking an incremental approach to addressing its debt problem
- Economic conditions are expected to remain weak
II-ii Continued Economic Weakness and Low Growth in Western Economies
US Household Debt Outstanding as a Percentage of Disposable Income
US Household Debt Outstanding as a Percentage of Disposable Income
(Source) FRB; prepared by Mizuho Research Institute
Trends in Loan to Deposit Ratios of Banks in Japan, the US, and Europe
Trends in Loan to Deposit Ratios of Banks in Japan, the US, and Europe
70
80
90
100
110
120
130
140
73 76 79 82 85 88 91 94 97 00 03 06 09 12
Japan U.S. Eurozone
(%)
(Note) US data have been retroactively revised to reflect a change of accounting rules in April 2010. Eurozone data exclude interbank lending.
(Sources) BOJ, Haver, ECB; prepared by Mizuho Research Institute
60%
80%
100%
120%
140%
160%
180%
89 92 95 98 01 04 07 10
Low income bracketMiddle income bracketHigh income bracketTotal
<Graph 1> <Graph 2>

Mizuho Financial Group8
Asia has high capital needs for its strong fixed investment in the private-sector and infrastructure development
- Long term financing for domestic corporations and infrastructure industries will continue to be needed going forward
II-iii Demand for Finance in Asia
(Note) Seasonally adjusted by TRAMO-SEATS except Korea/Singapore/Thailand(Source) Prepared by Mizuho Research Institute from each country’s statistical data
Investment Trends in Asian Countries (Gross Fixed Capital Formation)Investment Trends in Asian Countries (Gross Fixed Capital Formation)
80
90
100
110
120
130
140
08/3
09/3 10/3 11/3 12/3
KoreaTaiwanSingaporeIndonesia
(2008 = 100)
80
90
100
110
120
130
140
08/3
09/3
10/3
11/3 12/3
ThailandMalaysiaThe PhilippinesIndia
(2008 = 100)
(Note) Seasonally adjusted by TRAMO-SEATS except Korea/Singapore/Thailand(Source) Prepared by Mizuho Research Institute from each country’s statistical data
<Graph 1> <Graph 2>

Mizuho Financial Group9
Japan’s proportion of exports to Asia is rising in association with the change in world demand structure
- Exports to Europe and the US have decreased to just under 30% and exports to Asia have increased to just under 60%
- Excluding China, the proportion of exports to Asia such as the ASEAN region is expected to increase
II-iv The Shift toward Asia of Japan’s Export Structure
Change in Japan’s Export Weight by Destination
(Note) Forecasts by MHRI from FY2012 onward(Source) Ministry of Finance Trade Statistics; prepared by Mizuho Research Institute
0%
20%
40%
60%
80%
100%
95 97 99 01 03 05 07 09 11 13 15 17
EU
USASEAN 5
NIES
CHINA
Forecast
(fiscal year)
<Graph 1>

Mizuho Financial Group10
II-v Emerging Countries are at the Center of World Demand
1. Production Volume Forecast for Japanese Car Manufacturers1. Production Volume Forecast for Japanese Car Manufacturers
2. Local Content Ratio for Japanese Car Manufacturers (2011)2. Local Content Ratio for Japanese Car Manufacturers (2011)
(Source)Prepared by Mizuho Research Institute from manufacturers’ documents
* Emerging countries are at the center of world demand and overseas production bases are shifting toward a “local production for local consumption” model.
* Accelerating local production for local consumption = accelerating local procurement = accelerating “hollowing out” of Japanese industry
3. Building a Production Network in Asia3. Building a Production Network in Asia
* Expanding into emerging markets is effective from the perspective of risk diversification and foreign exchange risk management, in addition to capturing demand.
China
India Japan
・ASEAN/Korea/Taiwan
productsparts
capital
human
parts
capital
human human
productsparts
China Thailand India
Productionvolume
LocalContentratio
Productionvolume
LocalContentratio
Productionvolume
LocalContentratio
TOYOTA 80 95% 51 85% 14 50%
NISSAN 84 90% 19 90% 13 85%
HONDA 62 95% 11 90% 4 70%
SUZUKI 30 50% - - 112 90%
Production volume 2,282 100% 2,944 100%Domestic 963 42% 766 26%Overseas 1,319 58% 2,178 74%
Domestic sales 496 52% 421 55%Export 467 48% 380 50%
Worldwide Demand ForecastDeveloped Countries 3,387 46% 3,934 40%Emerging Countries 3,999 54% 5,878 60%
Results (2010) Estimate (2020)
Emerging Countries are at the Center of World Demand and Acceleration of Local Production for Local Consumption is Unavoidable - “focus on Asia”
<Table 1>
<Table 2>

Mizuho Financial Group11
Losses and Capital Funding Situation of Financial Institutions from 2007 to 2011 Q2
Loss Capital Funding
PublicFunds
Worldwide 2,056 1,598 846
USA 1,326 834 564
Europe 680 610 281
Asia 51 154 1
Losses in the World Financial Crisis Bank Exposure to Asia
II-vi Increasing Expectations for the role of Asian Financial Institutions
The world finance environment has changed significantly as a result of weaker US and Europeanfinancial institutions
- Asian financial institutions and Japanese banks have continued to supply stable financing during this period
0
100
200
300
400
500
600
700
800
900
2005 06 07 08 09 10 11 12
UKEurope (Exc. UK)
USAJapan
(USD billion)
(Year)(Materials) BIS; prepared by Mizuho Research Institute
(USD billion)
<Graph >
<Table >

Mizuho Financial Group12
III. Mizuho’s international business strategy

Mizuho Financial Group13
(USD million)
III-i Mizuho: Expansion of Operations and Growth in Asia
<Graph 2>
Gross Profit from International Business Changes in International Loan Balance (ending balance)
(Managerial Accounting Basis; MHCB Non-consolidated + Overseas Subsidiaries)
Steady expansion of international business andAsia becoming key driver of growth
(USD100 million)
Loans continue to increase, especially in Asia
(Managerial Accounting Basis; MHCB Overseas Branches + Overseas Subsidiaries)<Graph 1>
Gross profit from international business has increased by 52% from FY2009 to FY2011Proportion of international business in Asia: FY2009 - 32% → 1H FY2012 - 43%
2,618
2,182
1,7191,081
806552
32%
37%
41%
0
500
1,000
1,500
2,000
2,500
3,000
FY2009 FY2010 FY2011
20%
25%
30%
35%
40%
45%
50%
Of Which Asia (LH Axis)Asia Proportion (RH Axis)
(+34%)
Loans (ending balance)Asia Proportion
1H FY2012
1,553
674
43%
(+27%)
(+20%)
(+46%)(+34%)
1,278
815
1,025
46%
44%
34%
200
600
1,000
1,400
1,800
FY2009 FY2010 FY2011
25%
30%
35%
40%
45%
50%
55%
1H FY2012
1,402
48%
(+26%)(+25%) (+10%)
Gross Profit (LH Axis)

Mizuho Financial Group14
III-ii Mizuho: Soundness and Efficiency
<Graph 2>
<Graph 1>
International Business Risk-weighted Assets and RORA Quality of International Loans
Efficiently expand profit while controlling expenses
Profit structure not dependent on loans, leveraging RM relationship strength
Gross Profit Expense Ratio and Gross Profit per Employee
Realizing high-quality loan portfolio, mainly to investment grade customers
NPL Ratio Also Down Significantly
(IBU Management Basis; MHCB Branches + MHCB China)
(IBU Management Basis)
Growth in risk-weighted assets controlled by building up highly-rated assets (average increase rate of 6% from FY2009 to FY2011)Significant improvement in profitability by building up ancillary profit
(FY2011 RORA 2.7%)
<Graph 3>
63%
50%
58%
1.2%1.6%2.6%
40%
45%
50%
55%
60%
65%
FY2009 FY2010 FY20110%
2%
4%
6%
Investment Grade (LH Scale)NPLs (RH Scale)
0%
10%
20%
30%
40%
50%
(IBU Management Basis; MHCB Branches + MHCB China)(USD100 million)
2,020
1,571
1,913
886812784
2.7%
2.5%
2.0%
0
500
1,000
1,500
2,000
2,500
FY2009 FY2010 FY20111.6%
1.8%
2.0%
2.2%
2.4%
2.6%
2.8%
3.0%
3.2%
3.4%Loans and Guarantees (LH Axis)
Risk-weighted Assets (LH Axis)RORA (RH Axis)
1H FY2012
2,251
881
3.3%
1H FY2012
1.2%
65%
(USD‘000)
432
378310
37%41%47%
100
200
300
400
500
FY2009 FY2010 FY2011
Gross Profit per Employee (LH Axis)Gross Profit Expense Ratio (RH Axis)
1H FY2012
248
34%
(※)RORA of 1H FY2012 calculates from the gross profit of 1H FY2012 X 2
(※)
(+22%)
(+6%)
(+4%)(+9%)
(+22%)
(+14%)

Mizuho Financial Group15
287376
513
314
0
500
FY09 FY10 FY11 1H FY12
(USD M)
III-iii Super 30 (non-Japanese blue-chip corporations): A foundation of Mizuho’s overseas strategy
(International Banking Unit managerial accounting)
<Super 30> Profitability (RORA)
<Super 30> Gross Profits
Rigorous criteria for selecting key customers(116 customer groups in 4 overseas regional units)
Strengthen relationship at management level Continuous review of overall profitability Promotion of “Deal After Deal” marketing
Loans Trades,Forex, etc.
Capital MarketDeals
(DCM/ECM, etc.)
<Super 30> Basic Concept
Obtaining Core Bank Status
<Super 30> Approx. 30 non-Japanese corporate groups selected as our primary focus in each of 4 overseas regional units
(International Banking Unit managerial accounting)
Steadyincreasein 3 years
*1
*1
International Banking Unit Overall
Super 30
3.4%2.8%2.7%
2.0%
2.5%
3.0%
3.5%
4.0%
3.7%FY20111Q FY2012
1Q FY2012FY2011
(+31%)
(+36%)
Gross profits perone customergroup
(※)calculates from the gross profit of 1H FY2012 X 2
2.7 3.7 4.4 5.4(※)
<Graph 1>
<Graph 2>

Mizuho Financial Group16
Foreign currency-denominated bond bookrunner deals acquired by securities subsidiaries: DCM 46; ECM 1
No.1 on league tables for both lead manager for samurai bond deals through non-Japanese issuers acquired by securities subsidiaries and FA/managing agent for samurai bond deals through non-Japanese issuers acquired by MHCB
III-iv Super30 (Results of Securities Cooperation)
USD/EUR/GBP Bond Bookrunner Deals
Hong Kong IPO Deals POWL Deals
DCM / ECM M&A Advisory – Japanese Corporations
Acquire Securities Business Through Group Securities Subsidiaries using Relationship Management
<Table 3>
<Table 1> <Table 2>
Samurai Bond FA/Managing AgentSamurai Bond Lead Manager
Amount (JPY100m) Number of Deals
1 MHSC 3,822 49
2 Nomura Securities 3,571 36
3 Daiwa Capital Markets 3,141 37
4 MUFJ Morgan Stanley 2,556 33
5 SMBC Nikko Securities 1,727 31Apr 1, 2011 – Mar 31, 2012 Excluding self-issued bonds/private placement bondsSource: Thomson Reuters
1 MHCB 13,387 50
2 Mitsui Sumitomo Bank 5,038 21
3 Bank of NY Mellon 1,000 2
4 Mitsubishi Tokyo UFJ Bank 514 3
Amount (JPY100m) Number of Deals
Source: Thomson Reuters
Apr 1, 2011 – Mar 31, 2012
Syndicated Loans in Asia<Table 4>
No. ofDeals
1 Mizuho Financial Group 4,765.3 102
2 Nomura 4,235.8 103
3 Mitsubishi UFJ Morgan Stanley 3,657.3 93
4 JPMorgan 2,437.7 15
5 Goldman Sachs 2,270.5 272012/4-2012/12、publicly announced deals regarding Japanese corporationsexcluding real estate dealsSource: Thomson Reuters
Proceeds(JPY Bn)
Nat GridGBP 400mil
Joint BookrunnerMay 2012
BPUSD 3,000milJoint Bookrunner
May 2012
AB InbevUSD 7,500milJoint Bookrunner
July 2012
IBMUSD 2,000milJoint Bookrunner
Feb 2013
SABMillerEUR 1,000milJoint Bookrunner
Nov 2012
Proceeds (USD M) Market Share
1 Mizuho Financial Group 4,559.6 6.5%
2 Standard Chartered PLC 4,460.5 6.3%
3 State Bank of India 4,449.1 6.3%
4 HSBC Holdings PLC 3,443.3 4.9%
5 DBS Group Holdings 3,110.6 4.4%
6 Sumitomo Mitsui FG 2,987.7 4.2%
8 Mitsubishi UFJ FG 2,390.3 3.4%Jan.-Dec.2012, bookrunner basis (USD, EUR, JPY, AUD, HKD and SPD) excluding JapanSource: Thomson Reuters

Mizuho Financial Group17
Origination function at project outset Cross-functional response throughout the bank
USD8 trillion infrastructure demand in Asia (2010-20)
Asia Infrastructure Projects
III-v Strategic Moves into Growth Areas(1)
Business Opportunity Main Results
Business Participation in Smart City Project
Integrated environmental township development in Chennai, India
Energy-efficient business and small-scale environmental city development in Tianjin Economic Development Zone, China
Equity Investments Establishment of Japan-China Energy
Saving & Environment Conservation Fund Establishment of Mizuho ASEAN PE Fund
Advisory Power Project in Indonesia Port project in Vietnam
Business Alliances with Non-Japanese Customers Petro Vietnam, Hyflux
Project Finance Lead arranger for a combined-cycle gas
turbine power generation project in Nong Saeng, Thailand
Project Finance Advisory Mandates Closed in Asia Pacific
Increasing expectation of business opportunities (over 30% of companies
recognize this as a business opportunity)
<Table 2><Table 1>
Amount (USD billion)1 Credit Agricole2
Royal Bank of Scotland3
Mizuho Financial Group
4 Macquarie10 SMFG
40.040.012.9
5.7
0.3
Jan 1, 2012 – Dec 31, 2012Source : Project Finance International
Mizuho Financial Group18
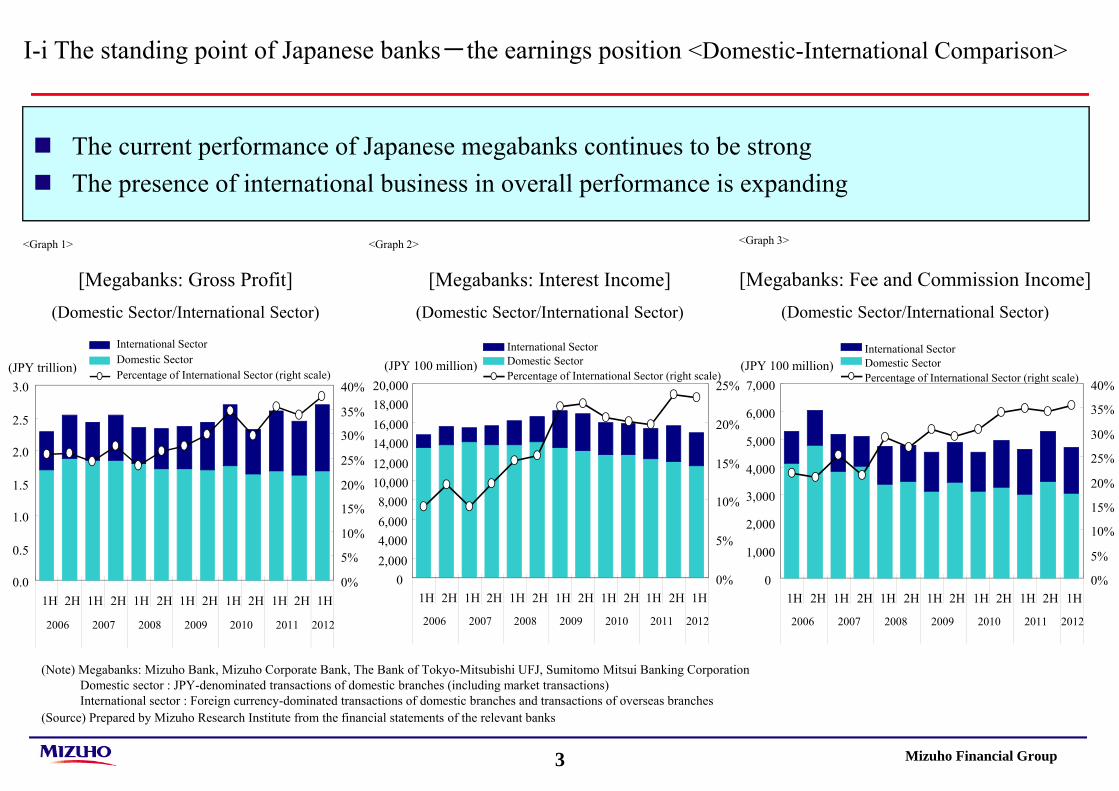
Response to Internationalization of Renminbi
III-v Strategic Moves into Growth Areas(2)
Completed preparations to handle RMB at all overseas offices
* Except India, where regulations prevent this
=> Focus on acquiring deposits/settlements in the US and Europe as well as Asia
Response to increasing RMB trade settlement
Potential to become third reserve currencyCapture business opportunities in RMB
Expanding trade/capital settlements denominated in RMB
due to easing of regulations
1
2
Bank-Securities Cooperation
First Japanese Bank
First Foreign Bank
First Japanese Bank
Response to funding and investment in RMB
Support RMB funding from offshore markets Provide a range of funding instruments
Composed RMB-denominated syndicated loans in Japan and Hong Kong- Auto parts manufacturer, non-bank
Arranged dim sum bonds- Japanese non-bank/lease companies, Taiwanese cement company
FA for RMB-denominated parent-subsidiary loan scheme- Japanese lease company, European non-Japanese company
Appointed lead manager for China Development Bank bond underwriting
Issued RMB-denominated bank debenture in China (CNY1.0 billion)
Obtained approval to invest in the Chinese interbank corporate bond market
Mizuho Financial Group19
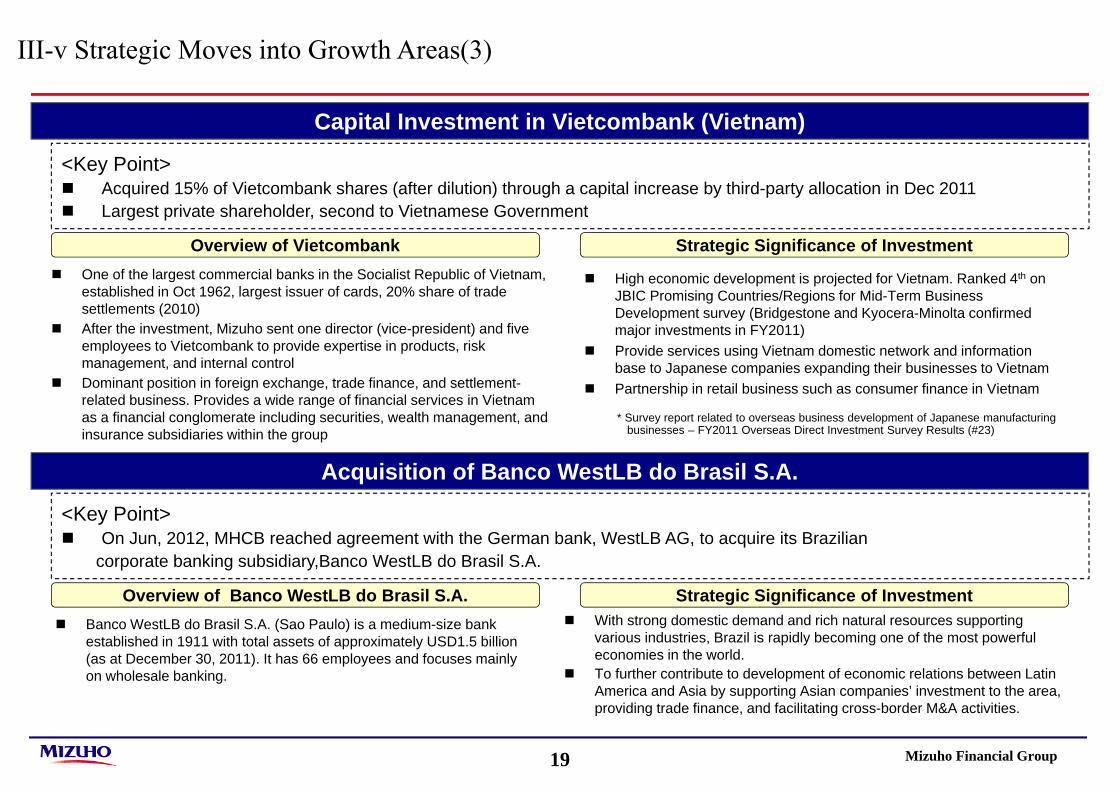
Capital Investment in Vietcombank (Vietnam)
<Key Point> Acquired 15% of Vietcombank shares (after dilution) through a capital increase by third-party allocation in Dec 2011 Largest private shareholder, second to Vietnamese Government
Overview of Vietcombank Strategic Significance of Investment
Acquisition of Banco WestLB do Brasil S.A.
Banco WestLB do Brasil S.A. (Sao Paulo) is a medium-size bank established in 1911 with total assets of approximately USD1.5 billion (as at December 30, 2011). It has 66 employees and focuses mainly on wholesale banking.
With strong domestic demand and rich natural resources supporting various industries, Brazil is rapidly becoming one of the most powerful economies in the world.
To further contribute to development of economic relations between Latin America and Asia by supporting Asian companies’ investment to the area, providing trade finance, and facilitating cross-border M&A activities.
<Key Point> On Jun, 2012, MHCB reached agreement with the German bank, WestLB AG, to acquire its Brazilian
corporate banking subsidiary,Banco WestLB do Brasil S.A.
Overview of Banco WestLB do Brasil S.A. Strategic Significance of Investment
One of the largest commercial banks in the Socialist Republic of Vietnam, established in Oct 1962, largest issuer of cards, 20% share of trade settlements (2010)
After the investment, Mizuho sent one director (vice-president) and five employees to Vietcombank to provide expertise in products, risk management, and internal control
Dominant position in foreign exchange, trade finance, and settlement-related business. Provides a wide range of financial services in Vietnam as a financial conglomerate including securities, wealth management, and insurance subsidiaries within the group
High economic development is projected for Vietnam. Ranked 4th on JBIC Promising Countries/Regions for Mid-Term Business Development survey (Bridgestone and Kyocera-Minolta confirmed major investments in FY2011)
Provide services using Vietnam domestic network and information base to Japanese companies expanding their businesses to Vietnam
Partnership in retail business such as consumer finance in Vietnam
* Survey report related to overseas business development of Japanese manufacturing businesses – FY2011 Overseas Direct Investment Survey Results (#23)
III-v Strategic Moves into Growth Areas(3)
Mizuho Financial Group20
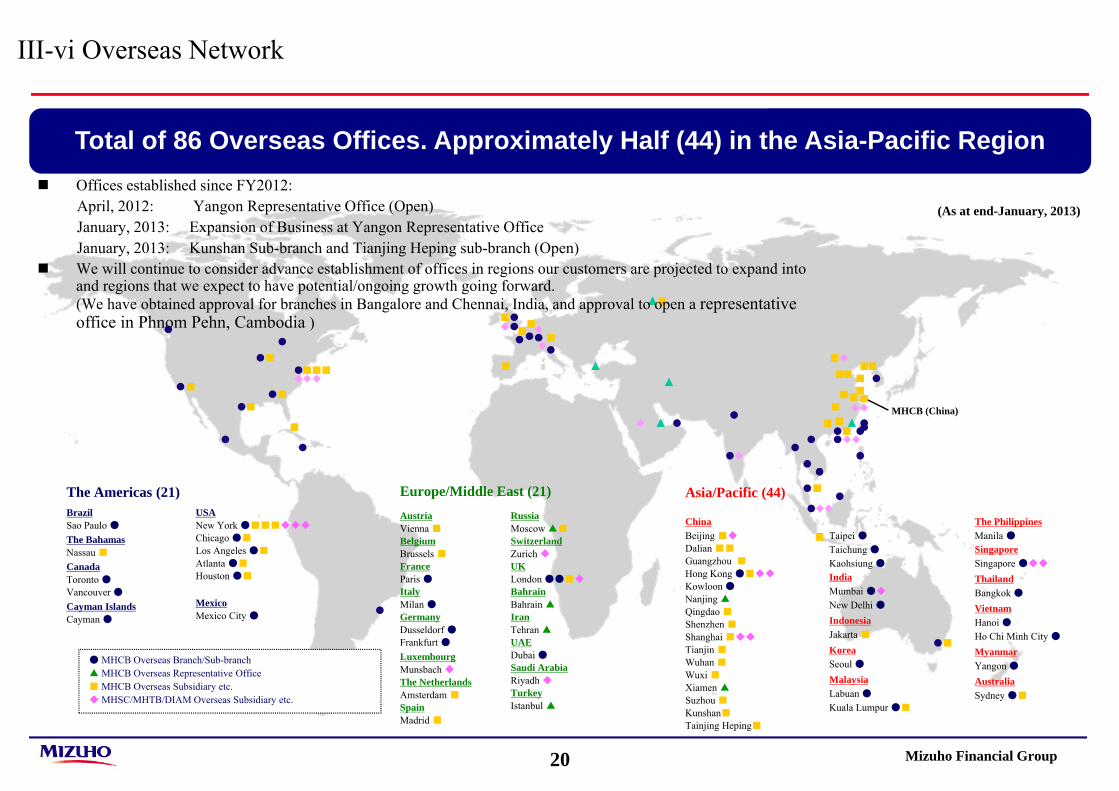
■
■
Asia/Pacific (44)
ChinaBeijing ■◆
Dalian ■■
Guangzhou ■
Hong Kong ●■◆◆
Kowloon ●Nanjing ▲Qingdao ■Shenzhen ■Shanghai ■◆◆
Tianjin ■Wuhan ■Wuxi ■Xiamen ▲Suzhou ■
Kunshan■
Tainjing Heping■
Taipei ●Taichung ●Kaohsiung ●IndiaMumbai ●◆
New Delhi ●IndonesiaJakarta ■KoreaSeoul ●MalaysiaLabuan ●Kuala Lumpur ●■
The PhilippinesManila ●SingaporeSingapore ●◆◆
ThailandBangkok ●VietnamHanoi ●Ho Chi Minh City ●MyanmarYangon ●AustraliaSydney ●■
Europe/Middle East (21)AustriaVienna ■BelgiumBrussels ■FranceParis ●ItalyMilan ●GermanyDusseldorf ●Frankfurt ●LuxembourgMunsbach ◆
The NetherlandsAmsterdam ■SpainMadrid ■
RussiaMoscow ▲■
SwitzerlandZurich ◆
UKLondon ●●■◆
BahrainBahrain ▲IranTehran ▲UAEDubai ●Saudi ArabiaRiyadh ◆TurkeyIstanbul ▲
The Americas (21)BrazilSao Paulo ●The BahamasNassau ■CanadaToronto ●Vancouver ●Cayman IslandsCayman ●
USANew York ●■■■◆◆◆
Chicago ●■
Los Angeles ●■
Atlanta ●■
Houston ●■
MexicoMexico City ●
● MHCB Overseas Branch/Sub-branch▲ MHCB Overseas Representative Office■ MHCB Overseas Subsidiary etc.◆ MHSC/MHTB/DIAM Overseas Subsidiary etc.
III-vi Overseas Network
Total of 86 Overseas Offices. Approximately Half (44) in the Asia-Pacific Region
(As at end-January, 2013)
MHCB (China)
Offices established since FY2012:April, 2012: Yangon Representative Office (Open)January, 2013: Expansion of Business at Yangon Representative OfficeJanuary, 2013: Kunshan Sub-branch and Tianjing Heping sub-branch (Open)
We will continue to consider advance establishment of offices in regions our customers are projected to expand into and regions that we expect to have potential/ongoing growth going forward. (We have obtained approval for branches in Bangalore and Chennai, India, and approval to open a representative office in Phnom Pehn, Cambodia )

Mizuho Financial Group21
III-vii Expanding the Business Portfolio using Strategic Business Alliances
Sberbank of Russia
Standard Bank of South Africa
Mashreq Bank
Itau Unibanco
Raiffeisen Zentralbank
*Alliance partners shaded in black indicate a capital alliance relationship.
USA
BrazilSouth Africa
UAE
Austria
RussiaChina Development Bank
Vietcombank
MaybankHyflux
Tata Group
Korea Development Bank
Balimor Finance
Tisco Bank
China CITIC Bank Shinhan Financial GroupAsiaChina
Vietnam
Korea
Thailand
India
MalaysiaSingapore
Indonesia
State Bank of India
Ascendas
BoA
ANZ Banking Group
Australia
Evercore
BlackRock
Eurekahedge
Mongolia
Trade and Development Bank of Mongolia
The PhilippinesBank of the
Philippine Islands
MexicoBanco Santander (México) S.A.
Turkey
Akbank T.A.Ş
Qatar National Bank
Qatar LaosBanque Pour Le
Exterier Lao Public
Pursue the best mix between organic and alliance strategies, considering market characteristics of countries and regions
Bank Negara Indonesia
Taiwan
Ministry of Economic Affairs

Mizuho Financial Group22
IV. Mizuho’s medium-term business plan (One MIZUHO New Frontier Plan)

Mizuho Financial Group23
Significant changes in environmentsurrounding financial institutions
Necessary elements for “New Frontier of Finance”
(1) Focus on real customer demand(“client-
oriented”)
(3) Globalization
(2) Sophisticated risk-taking and strengthened financial intermediation
Change in Economic Structure
Change in Industrial Structure and Customer
Trend
Change in Financial Industry
Tightening of Regulations
Changes in
Business Environm
ent
At a turning point regarding “what the mission offinancial institutions ought to be”
(4) Abundant liquidity and appropriate capital level
(5) Strong corporate governance supported by strong corporate culture
Global structural changes and financial industry’s roles (Necessary elements for “New Frontier of Finance”)
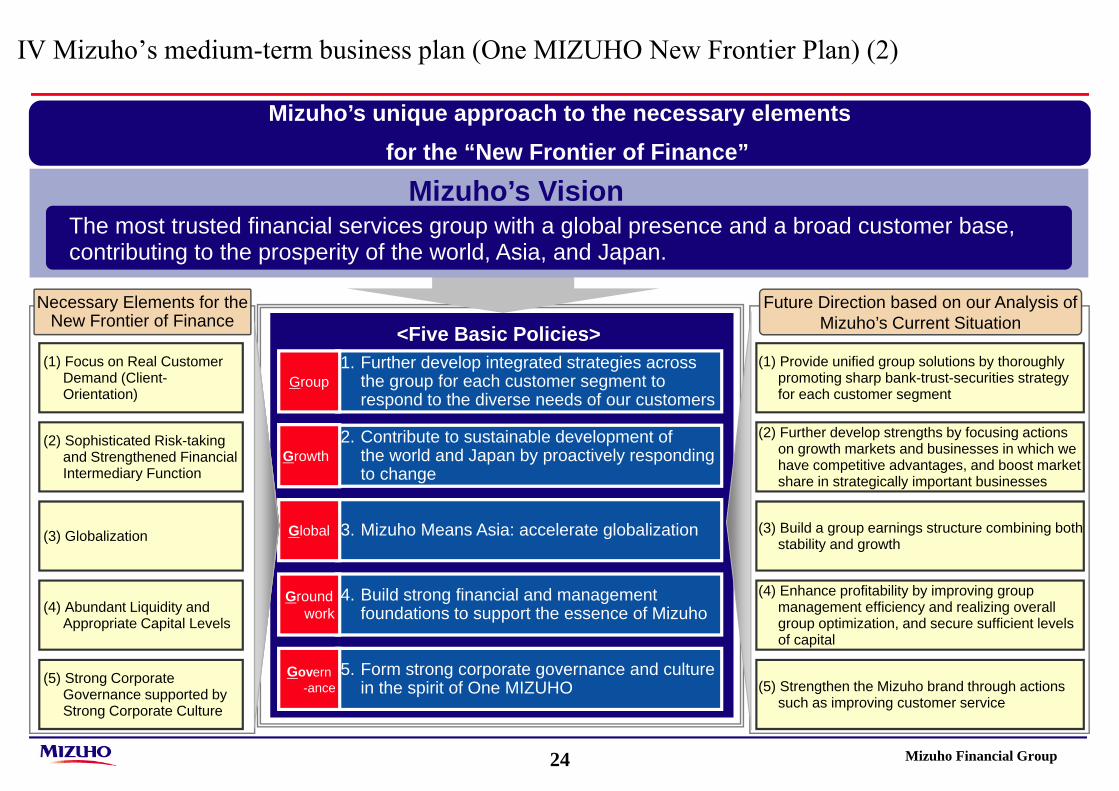
IV Mizuho’s medium-term business plan (One MIZUHO New Frontier Plan) (1)
Mizuho Financial Group24
IV Mizuho’s medium-term business plan (One MIZUHO New Frontier Plan) (2)
Future Direction based on our Analysis of Mizuho’s Current Situation
(2) Sophisticated Risk-taking and Strengthened Financial Intermediary Function
(3) Globalization
(4) Abundant Liquidity and Appropriate Capital Levels
(5) Strong Corporate Governance supported by Strong Corporate Culture
(1) Focus on Real Customer Demand (Client-Orientation)
Necessary Elements for the New Frontier of Finance
<5つの基本方針>
Mizuho’s Vision The most trusted financial services group with a global presence and a broad customer base, contributing to the prosperity of the world, Asia, and Japan.
(2) Further develop strengths by focusing actions on growth markets and businesses in which we have competitive advantages, and boost market share in strategically important businesses
(3) Build a group earnings structure combining both stability and growth
(4) Enhance profitability by improving group management efficiency and realizing overall group optimization, and secure sufficient levels of capital
(5) Strengthen the Mizuho brand through actions such as improving customer service
(1) Provide unified group solutions by thoroughly promoting sharp bank-trust-securities strategy for each customer segment
5. Form strong corporate governance and culture in the spirit of One MIZUHO
Govern-ance
4. Build strong financial and management foundations to support the essence of Mizuho
Groundwork
2. Contribute to sustainable development of the world and Japan by proactively responding to change
Growth
3. Mizuho Means Asia: accelerate globalizationGlobal
1. Further develop integrated strategies across the group for each customer segment to respond to the diverse needs of our customers
Group
Mizuho’s unique approach to the necessary elements for the “New Frontier of Finance”
<Five Basic Policies>
Mizuho Financial Group25
This presentation includes future projections such as business strategy and numerical targets. These projections include assumptions made based on information available at the time of preparation of this presentation and uncertain factors that may impact future projections such as business strategy and numerical targets. These projections and assumptions are not guaranteed to be realized in the future and may significantly differ from actual results. Items related to future projections such as business strategy and numerical targets also reflect our recognition at the time and include certain risks and uncertainties.Except where required under regulations for listed securities stipulated by the Tokyo Stock Exchange etc., Mizuho does not constantly revise or update its future projections such as business strategy and numerical targets in the event of the occurrence of new information or events or for any other reason, nor does it have any responsibility to do so.
Thank You