Japanese and American Direct Investment in Asia :...
36
Hitotsubashi University Repository Title Japanese and American Direct Investment in Asia : A Comparative Analysis Author(s) Kojima, Kiyoshi Citation Hitotsubashi Journal of Economics, 26(1): 1-35 Issue Date 1985-06 Type Departmental Bulletin Paper Text Version publisher URL http://doi.org/10.15057/7895 Right
Transcript of Japanese and American Direct Investment in Asia :...

Hitotsubashi University Repository
TitleJapanese and American Direct Investment in Asia : A
Comparative Analysis
Author(s) Kojima, Kiyoshi
Citation Hitotsubashi Journal of Economics, 26(1): 1-35
Issue Date 1985-06
Type Departmental Bulletin Paper
Text Version publisher
URL http://doi.org/10.15057/7895
Right

Hitotsubashi Joumal of Economics 26 (1985) 1-35. C The Hitotsubashi Academy
JAPANESE AND AMERICAN DIRECT INVESTMENT IN ASIA = A COMPARATIVE ANALYSIS
KIYOSHI KOJIMA
I. In troduction
In order to empirically investigate the differences between "Japanese-type" direct foreign
mvestment (DFI) and "U S -type" DFll (Section II) I have engaged in cases studies of DFI
in Asian developing countries over the last few years. I have focused on the four Asian
Newly IndustLialising Countries (NlCs) (Korea, Hong Kong, Singapore, and Taiwan) and
the four larger ASEAN (Association of Southeast Asian Nations) countries (Indonesia, the
Philippines. Malaysia, and Thailand). While the studies have been hampered by the lack of
data, notably the lack of consistent, internationally comparable direct investment data, some
interesting results have emerged and this paper briefly summarises the more important findings of these studies.
In section 111 it is shown that American DFI exhibits a remarkably uniform pattern across
countries and across time while the pattern of Japanese DFI differs significantly between
countries and over time. This is hypothesised to result from the dominant influence of
multinational corporations (MNCs) on American DFI (Hence it is characterised as "MNC-
type" DFI.) and the Japanese concern with promoting DFI which is consistent with the evolu-
tion of comparative advantage patterns between the host countries and Japan.
In section IV the differences between American and Japanese investment presence are
further explored using a three country (two investing countries, one host country) model of
comparative investment advantage. Major emphasis is on the Taiwanese case here as data
availability is greatest in this case. Here again we observe phenomena which reinforce the
characterisations of Japanese and American DFI in section 111.
Section V investigates the impact of DFI on the balance of trade and the level of GNP
in several host countries as well as notes the difficulties inherent in evaluating the trade orienta-
tion of DFI statistically. Statistical analysis relies on survey information and some econo-
metric analysis. Here it is seen that Japanese DFI's contribution to GNP was generally
greater than that of American DFI and that its effects on trade are generally more pro-
nounced. Furthermore, both American and Japanese DFI generally resulted in improve-ments or no change in the trade balance, contrary to the often heard criticism that DFI results in an increase in the trade deficit. (This is a particularly common criticism of Japa-
nese DFI.) We conclude by observing that, while both American and Japanese DFI have contributed to host countries in these respects, in most cases Japanese DFI appears to have
contributed to the development of the host economies more efficiently.
* These differences were first noted by Kojima (1973) and then detailed in Kojima (1978). The theoretical framework has since been further developed by Kojima (1982) and Kojima and Ozawa (1984).
2
HITOTSUBASHI JOURNAL OF ECONOMICS [ June
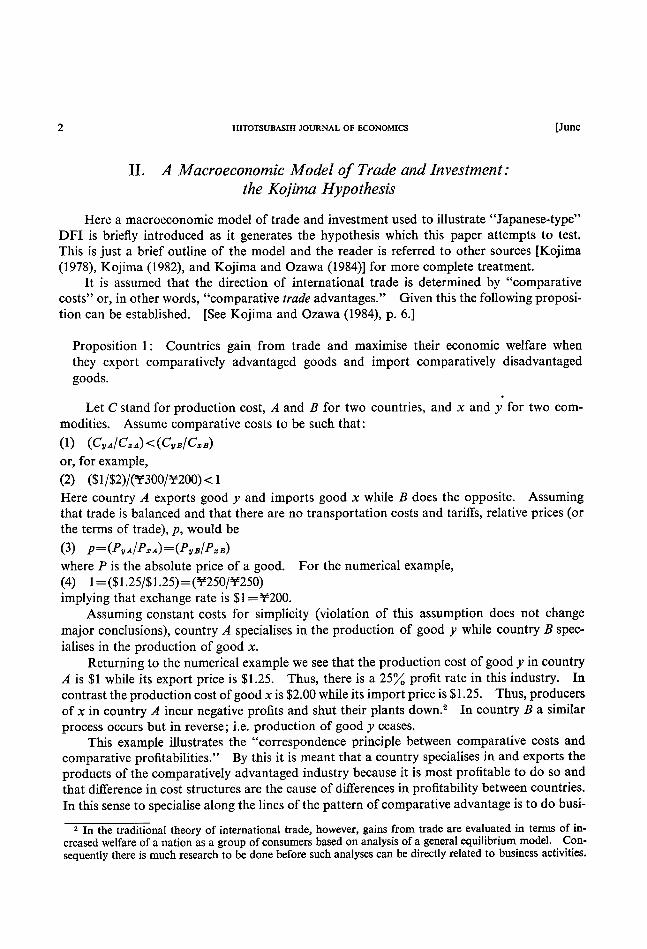
II. A Macroeconomic Model of Trade and Investment: the Kojima Hypothesis
Here a macroeconomic model of trade and investment used to illustrate "Japanese-type"
DFI is briefiy introduced as it generates the hypothesis which this paper attempts to test.
This is just a brief outline of the model and the reader is referred to other sources [Kojima
(1978), Kojima (1982), and Kojima and Ozawa (1984)] for more complete treatment.
It is assumed that the direction of international trade is determined by "comparative
costs" or, in other words, "comparative trade advantages." Given this the following proposi-
tion can be established. [See Kojima and Ozawa (1984), p. 6,]
Proposition I : Countries gain from trade and maximise their economic welfare when
they export comparatively advantaged goods and import comparatively disadvantaged
goods.
Let C stand for production cost, A and B for two countries, and x and y for two com-
modities. Assume comparative costs to be such that:
(1) (Cvd/C*A)<(CvB/C*B)
or, for example,
(2) ($1/$2)/C~~300/~~200) < l
Here country A exports good y and imports good x while B does the opposite. Assuming that trade is balanced and that there are no transportation costs and tariffs, relative prices (or
the terms of trade), p, would be
(3) p=(P2/A/P.A)=(P~fB/P*B)
where P is the absolute price of a good. For the numerical example,
(4) l=($1.25/$1.25)=(~250/~~250) implying that exchange rate is $1 =~~~200.
Assuming constant costs for simplicity (violation of this assumption does not change
major conclusions), country A specialises in the production of good y while country B spe(~
ialises in the production of good x.
Returning to the numerical example we see that the production cost of good y in country
A is $1 while its export price is $1.25. Thus, there is a 25~ profit rate in this industry. In
contrast the production cost ofgood x is $2.00 while its import price is$1.25. Thus, producers
of x in country A incur negative profits and shut their plants down.2 In country B a similar
process occurs but in reverse; i.e. production of good y ceases.
This example illustrates the "correspondence principle between comparative costs and
comparative profitabilities." By this it is meant that a country specialises in and exports the
products of the comparatively advantaged industry because it is most profitable to do so and
that difference in cost structures are the cause of differences in profitability between countries.
In this sense to specialise along the lines of the pattern of comparative advantage is to do busi-
' In the traditional theory of international trade, however, gains from trade are evaluated in terms of in-
creased welfare of a nation as a group of consumers based on analysis of a general equilibrium model. Con-sequently there is much research to be done before such analyses can be directly related to business activities.

1985] JAPANESE AND AMERICAN DIRECT INVESTMENT IN ASIA 3 ness in a manner consistent with the free working of the market (or price) mechanism.
Now let us introduce DFI into the model. It can be established that [Kojima and Ozawa (1984), p. 61] :
Proposition 2: Countries gain even more from expanded trade when superior entreprc-neurial endowments are transferred through corporations from home countries' compara-
tively disadvantaged industries in such a way as to improve the efficiency of the compara-
tively advantaged industries in host countries.
Due to DFI by country A's x industry in country B's x industry comparative costs change
from those given in (1) and (2) to
(5) (CvA/C.A) <(CvB/C**)
where C** stands for the production cost of good x after DFI and it is assumed that C** < C.B.
In our numerical example we get :
(6) ($1/$2)/(~~300/~~l50)<l
If the terms of trade remain the same as given in equation (4), the rate of profit for
country B's x industry increases to 66~ [(~250-~~150)/~~~l50] as compared to 25~~ [(~~250-
~200)/~~200] in the case of no DFI. This rate of profit is asserted to be uniform for all frms
in country B's x industry due to the transfer of technology and other spread effects; thus such
profits accrue to both domestic firms and foreign affliates.
Futhermore, if the decline in costs results in a decline in P*B (and the increase in the
profit rate is thus somewhat smaller) the terms of trade moves in a direction favourable for
A and A will gain from increased imports. This is the case of "offshore sourcing" through
DFI. In addition, ify is an input needed in the production of x, A can also benefit from in-
creased exports of y. In our numerical example we have :
(7) ($ I .25/$ I .OO) = (~250/~~200) = I .25
Thus the profit rate of B's x industry is only 33~~ [(~~200-~~150)/~:150].3
Thus, "a comparative investment advantage" for country A Iies in country B's x industry,
in which production costs are relatively low and can be further reduced through DFI. Fur-
thermore, DFI by A in B's x industry is "trade oriented" DFI, which brings about "dynamic
trade creation." This type of DFI is a complement to international trade, not a substitute
for it. Finally, since such DFI yields greater profits than a case of no DFI, it is consistent
with the free working of market mechanism.
In contrast, if DFI is directed into B's comparatively disadvantaged y industry, com-
parative costs become :
(8) (CvA/C*A)<(Cv*/C.B)
' This latter case is the more usual one. Here competition eliminates "abnormal" profits in the longer run and they wlll thus converge to a "normal" rate This is a crucial element of the correspondence prin-ciple between comparative costs and comparative profitabilities originally presented by Kojima (1973) and recently developed more preclsely by Pyun (1984) The latter (p 22) says, "The significance of Kojima's treaty on "trade-oriented" DFI model lies in his propositions that the market imperfections and monopoly profits are not crucial determinants for DFI and that DFI complements trade under the Heckscher-Ohlin theory."

4 HITOTSUBASHI JOURNAL OF EcoNOMlcs [June where C1*<CyB is assumed. In our numerical example we get:
(9) [($ l/$2)/(~275/~~200)] < l
Even if the terms of trade remain as in (4) no profit can be made in B's y industry as the
cost of production (~275) is still higher than the price (~~250). This is "anti-trade oriented"
DFI which is usually induced by high tariffs and other protectionist measures taken by the
host country. It is thus motivated by the desire of multinational corporations to capture
protected markets. This type of DFI necessarily substitutes for trade.
In this paper we will show that Japanese DFI is the "trade oriented type" and, while
American DFI in the Asian countries studied here cannot be characterised as "anti trade
oriented," we will show that, in general, it is not as trade oriented as Japanese DFI. As a
result it will be seen that Japanese DFI has generally been efficient in promoting the growih
and development of host economies.
III. MNC-type versus Japanese-type DFI
III.1. Materials and Methodology
Through country studies using host country data it was recognised that there is a sub-
stantial difference between American and Japanese DFI in the eight Asian countries studied.
Here an attempt to systematically identify some of these differences is made using investing
country data. Here we rely on data contained in the U.S. Department ofCommerce's Survey,
U.S. Direct Investment Abroad, 1977 and figures on approved Japanese DFI pub]ished by the
Japanese Ministry of Finance annually.
From these sources we can easily obtain the value of DFI abroad, V,,hA where A stands
for the investing country, the U.S.A., h for the host country of concern, and i for the industry
invested in. From this we can obtain the American investmentpattern by analysing the fol-
lowing index for all i:
(lO) Vi.hA/~* VihA
where the denominator is the total amount of A's DFI in country ll. The investment pattern
can also be illustrated by a simple industry-wise ranking of DFI in the host country of concern.
Similarly, we can also analyse the Japanese investment pattern for each host country h using:
(11) Vi,hJ / ~_* Vi.hJ
lll.2. The Pattern of American DFI
Table I gives American DFI in the world, various regions, and certain countries by sector
of investment. The table refers to the total assets accumulated by American firms at the end
of calender 1977. As such this table varies somewhat from the tables on the "U.S. Direct
Investment Position Abroad" published in the survey and annually in the Survey of Current
Business although the investment pattern observed is quite similar in all sources.

JAPANI…SE^ND AMl…RlCAN D1R旧CT1NVI…STMENT1N AS㎜19851
.(冨α一.肩-o<月oo’23目o)NN、、吋冒§“、、ミ“§、竃とミも“企Q.りS、①9Φ自-畠60』o-目⑭冒肩o旦o(□.ω.自・.}皇曽δ
.寄逗§-雪曽参O毫畠自O目茗目雪Φ昌霧』O血冒O岩遅S壱目-ρ
.吻遣着晶お{◎方塞昌葛目お竃OO.運5毛匡弓冨倉8-畠.O自占冒葛<さ
.O}}O宙{一一目Oω〇一-弓目d弓自宙『ON”婁O之.宙}弓w-一固目<.畠討0討HεO目-弓目-O■臼 “
一〇〇旧.いい oo㈹い.一寸
N0卜.〔〇一 一寸寸.N寸N
〔尋.“トい
ト毫.aoo
N〔旧N寸oo,ooooい[一ト寸0Nトひ 一 べ一 一一一一一一N 一い
トoooo
oo8
ひ碧
[ひ○
冒ρ
oo茗
ひαト
い寸ト
○トooト
sm.N
N0ト.[
oo9、
畠m.㈹
mo・い.=
s①.s
oos.害
N寸〔oトo,o0Nいoトーoいm旧ooo、寸 一 一一一べ一一一一一一ひs
尋○いN
=ト冒
ρo【
NいN
竃蟹寸
いs、一
寸NN尋
トN寸
冨寸
。os.一
〇〇い.N
尋ト.一
い◎一.o
寸8.8
N寸〔トいooo〇一ひN冊o寸いトooo、〇 一 一 一一一一一一一一【
ρい箒
ρ旨n
8ト
いoト
oo写
=N.H
卜竃、一
s卜.N
旧黒.べ
等卜.n
ひ等.n
s寸.N
0尋.寸
os.n
門s.卜
8m.旧
o.oひ.ト
邊ひ.n昌
一NNNN寸〔いトーoOOひOnNト寸いOOOα〇 一 一一一一一一一一一べ寸蟹
いトm
ρ9い
;α
8o.一
寸ト寸
Ns.-
さい.一
ト湯.n
睾o.寸
写O.O
$い.寸
寸8.㈹
ひ蟹.い
○卜①.ト
旧竃.s
ひ。o-.o〇
一8.。0N
ミト.m3
Nm寸トいooooo、一【寸〔いトoooひ〇 一 一一一一一一一一一【oo.o寸.-
寸s,N
ρ一尋.N
い篶.べ
=寸、N
尋一.い
ト$.寸
Nト門.o
ひooo.昌
N蓄、竈
○ま.s
トいoo.害
。o菖.8
〔卜。。、潰
○冒.冒
トs.o・N
Nま.卜寸
oo$.津
ト富.冨N
N〔寸いoトooo、〇一【〔寸いoトooひ〇 一一一一一一一一一一NN.o
〔.o
[.o
寸.o
寸.o
寸.o
卜.o
oo.o
ひ.o
卜.一
〇.N
N.N
旧.N
寸.n
ひ.n
一.寸
ト.寸
oo.o
oo.二
一.oい
一。OO.一
蟹m.-
s卜.一
ひs.N
8卜.べ
○蟹.N
等n.〔
s寸.〔
い6.旧
ひトN.o
○トoo.ト
○ト一.ミ
oo二.ト一
〇〇〇N.o〇一
旧尋.冒
sn.ooN
s一.s
ξト.竃
N.oト.。。n
s一.湯
一〇〇・.寸二
宗い.3寸
自o目ヨω胃一目{亀団目o目--{
ω一〇コOO占O垣竃一{ωコOΦ口d目山02凄
轟」ヨー名』
毫O』-岩目』口』.iOO奏.-Oρ目自■
血-〇一」「oo-{ω吻d-{)
閉O』一コーO魯ヨ富-〉HOOO尉OO」[
昌o目午目-一〇遅目目討;-〇一-◎
0も5昌O毫着O目δ。姦O.習Oあ
一〇畠oo<オ血-o目oo占小-o■o』ピ
ω-o’-io』~口oo-宙-o‘喝ω-日【o昌』-ω一--
閉-o目oo占』ω(}h-コ{
ω一〇目oo』{oo筥『て勾-o旦由{
o-O目、O占OOセ目蟹ゼ弓OO■
-oo冒』q-コdm口o}目o--oo-血[屯o}』-oo-口
自o月月妻
{竜凄弓g遣お奮h冨月占
-向U---o〇一回[-ooo■口、、-oo垣oo暑
一目o自-o-目冨目oo司’』ooo目宙-』ド
..血o}』-閉80目-』ω一□-()
血-oコoo-{弓o}目一、亀咀ヨ頸U唱〇一,o
oo雪H
-目ヨー〇一〇】一〇{
g垣苗『①■
唱Φo肩d』目ω目-.oo目宙目}』.凶冒}占肩討m【
一NNo,ペパイ■6ト1おdd■べ■寺■6■66d
一一一一一一一一一一N.一
一畠- .昌帥
一目雪 .g明
一目雪 .昌明
一目雪 .昌的
一昌- .昌明
老昌 × .昌船
○圭吻
○討o宙- 讐由-血<
s巾5昌<
{岩■
吻…=』-一臼目oo
』o目-oo-o≒o(□
吻…・--一一】目oo
oooo-o>o〔□
…曽参
(卜卜α一-◎02臼)ω<臼蟹<■吻◎■■z畠四』』-oz-H{(□z<o-由凹妻<匹◎02-】2<曽oz<↑zpo妻<■<40■〇四〇〇 .一巴臼<↑
6
HITOTSUBASHI JOURNAL OF ECONOMICS
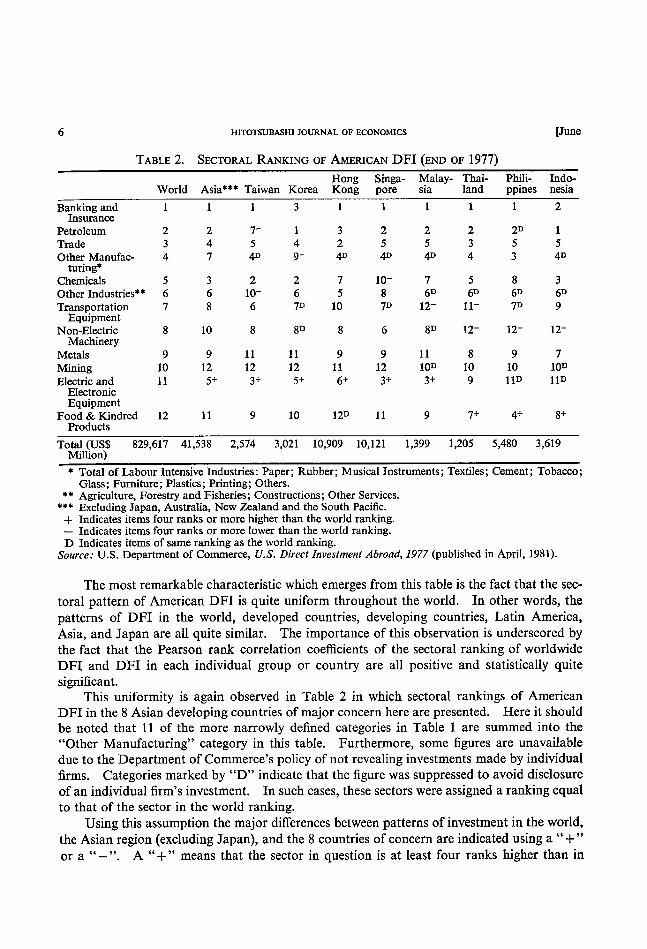
TABLE 2. SECTORAL RANKING OF AMERJCAN DFI (END OF 1977)
[ June
Hong Singa- Malay- Thai- Phili- Indo-sra land ppines nesia World Asia*** Taiwan Korea Kong pore '
Banking and 1
Insurance Petroleum 2
Trade 3
Other Manufac- 4
turing$
Chemicals 5
Other Industries*$ 6 Transportation 7
Equi pment
Non-Electric 8 Machinery
Metals 9
Mining 10
Electric and 11
Electronic Equi pment
Food & Kindred 12 Products
1
3
2
2
3
5
5
2
4D 41) 4D 4D
lO- 7
5
7
6D 8
6D 5
12-10 11-7D
6
12-8
8
8
9
11 9
9
10 10 ll 12 12
11D 9
6+ 3+ 5+
11 9
lO 12D Il 9
7+ 4+ 8+
Total (US$ 829,617 41,538 2,574 3 021 10 909 10 121 1 399 1 205 5 480 3 619 Million)
* Total of Labour Intensive Industries : Paper ; Rubber ; Musical Instruments ; Textiles ; Cement ; Tobacco ;
Glass ; Furniture; Plastics; Printing; Others.
** Agriculture. Forestry and Fisheries ; Constructions ; Other Services.
$** Excluding Japan, Australia, New Zealand and the South Pacific. + Indicates items four ranks or more higher than the world ranking. - Indicates items four ranks or more lower than the world ranking. D Indicates items of same ranking as the world ranking.
Source: U.S. Department of Commerce, U.S. Dtrect Investment Abroad, 1977 (published in April, 1981).
The most remarkable characteristic which emerges from this table is the fact that the sec-
toral pattern of American DFI is quite uniform throughout the world. In other words, the
patterns of DFI in the world, developed countries, developing countries, Latin America,
Asia, and Japan a]'e au quite similar. The importance of this observation is underscored by
the fact that the Pearson rank correlation coefficients of the sectoral ranking of worldwide
DFI and DFI in each individual group or country are all positive and statistically quite
significant.
This uniformity is again observed in Table 2 in which sectoral rankings of American
DFI in the 8 Asian developing countries of major concern here are presented. Here it should
be noted that 1 1 of the more narrowly defined categories in Table I are summed into the
"Other Manufacturing" category in this table. Furthermore, some figures are unavailable
due to the Department of Commerce's policy of not revealing investments made by individual
frms Categones marked by "D" indicate that the figure was suppressed to avoid disclosure
of an individual firm's investment. In such cases, these sectors were assigned a ranking equal
to that of the sector in the world ranking.
Using this assumption the major differences between patterns of investment in the world,
the Asian region (excluding Japan), and the 8 countries of concern are indicated using a " + "
- . A "+" means that the sector In question rs at least four ranks higher than m or a " "

1985] JAPANESE AND AMERICAN DIRECT INVESTMENT IN ASIA 7 the world pattern and a "-" means that it is at least four ranks lower. The relative lack of
these marks in the table leads one to conclude that the pattern of US investment is relatively
uniform in the Asian region as well.
The most notable exceptions to this observation are found in countries where the rank-
ing of electric and electronic equipment is markedly more important than in the world rank-
ing (Taiwan, Korea, Hong Kong, Singapore, and Malaysia). It is significant that most of
these countries are resource-poor and have thus found it advantageous to emphasise labour-
intensive industries. Investment in this sector depends heavily on the availability of cheap
labour and reflects the tendency towards the "international division of the production pro-
cess" discussed below.
The Pearson rank correlation coefficient was calculated for the world and each host
country as well as for each pair of countries. In all 36 coefficients were calculated and all
were positive. The coefficients were statistically significant at the 1~~ Ievel in 17 cases and at
the 5~~ level in 13 cases. Furthermore, the 6 cases which generated coefficients not significant
at the 5~ Ievel or better (Taiwan and Thailand, Taiwan and the Philippines, Taiwan and
Indonesia, Korea and the Philippines, Singapore and the Philippines, and Singapore and
Indonesia) involve pairs of economies with drastically different resource endowments. In
short, these results give strong support to the conclusion that the American pattern of DFI
is uniform irrespective of host country in Asia.
Turning to Table 3 the evolution of the pattern of American DFI can also be analysed.
This table utilises the annually published data on the (net) direct investment position abroad
at the end of each year in question mentioned above and thus the rankings are slightly dif-
ferent than in the first 2 tables. In examining this table it is noticed that the ranks of "chemi-
cals" and "non-electric machinery" have increased somewhat since 1966 and that of "mining"
has fallen significantly. However, one cannot help being impressed by the relative uniformity
of the pattern over time. In fact this pattern has remained quite uniform since soon after
the last World War. Here it should also be noted that this uniformity over time is observed
in all the regions and countries mentioned above to the extent that data is available.
To sum up, it can be said that the pattern of American DFI is remarkably uniform in
TABLE 3. OVERTIME CHANGES IN SECTORAL RANKlNGS OF AMERICAN DFI IN THE WORLD
Petroleum Banking & Insurance
Trade Other manufacturing
Chemicals Non*electric equipment
Other industries
Transportation equipment Food & kindred products Electric & electronic equipment
Mining Metals
1966
1 3 4 2 8 9
7
11
lO 6
12
1977
1 2 3 4 5 6 8 7
lO 11
9
12
1982
1 2 3 4 5 6 7 8 9
10 11
12
Source: Survey of Current Business, February 1981, August 1983. US Direct Investemnt Abroad 1977.

8 HITOTSUBASHI JOURNAL OF ECONOMICS [June different countries, regions, and the world. Furthermore, this pattern is uniform with re-
spect to time as well. What does this uniformity mean?
First of all, one could conclude that American DFI is undertaken without consideration
of the comparative trade advantage positions of the U.S, or the host country involved. If
this statement were not true we would expect the pattern of American DFI to differ between
countries and over time because comparative trade advantage positions diff;er between coun-
tries and are changing over time. As will be detailed below there is considerable variation
in the Japanese pattern between countries and across time.
Secondly, one might be able to conclude that the pattern of American DFI is determined mainly by the microeconomic interest df the MNCS involved. The most important category
of Amencan DFI Is "finance" followed by "oil and oil refinmg " "trade chemicals (includ-, ,,, '' ing pharmaceuticals)," "transportation equipment (mainly automobiles)," "non electnc
machinery," "me+,als " "mmmg " "electric and electronic equipment," and "food (mainly companies such as Coca-Cola, MacDonald's, etc.)." It is notable that the important catego-
ries in this pattern are those dominated by large MNCs. It is further significant that the top
categories in this ranking are those industries in which large MNCS find it most profitable to
operate by exploiting their worldwide networks. These are oligopolistic industries which
specialise in the production of differentiated products and in which the gains from transaction
and market internalisation are pronounced. Finally, it should be noted that the structure
of these industries has not changed much over the years and thus the investment patterns of
the firms involved has changed little as well.
In short, the uniformity of the American investment pattern seems to reflect the fact
that, in general, the same MNCS have dominated American DF14 in all regions of the world
and that the interests of dominant firms have changed little over time. Thus, American DFI
can be classified as the "MNC-type" of DFI.
III.3. The pattern of Japanese DFI
How about the pattern of Japanese DFI? Table 4 provides information for Japanese DFI similar to that given for American DFI. Columns A provide figures covering the cumulative total of approved investments through the end of fiscal 1972 (March, 1973) and
columns B give the same information through the end of fiscal 1982 (March, 1983). These
approval figures are different than the American ones in that they also include direct loans,
expatriate offices, and real estate, although the last two items are of very limited importance.
Despite the differences between the data sets it is still instructive to analyse the patterns of
DFI which emerge.
In contrast to the American case described above, a marked difference in Japanese DFI
patterns between countries is observed in Table 4. This dissimilarity is illustrated by the
relative lack of significant Pearson rank correlation coefficients in Table 5. Table 5 gives
coefficients for pairs of Asian countries using March, 1983, figures. (Those obtained using
March, 1973, figures are omitted for simplicity.) Table 4 also shows that some significant
' There is certainly some small, non-MNC investment made by American firms. Therefore, it would be worthwhile to analyse the proportion of American DFI made by firms listed in Fortune's top SOO in dif-ferent countries. Chung H. Lee (1980) does differentiate major and non-major American corporations. He then compares American DFI with Japanese DFI and finds evidence supporting Kojima's hypothesis.

9JAPANl≡S1…AND^Ml≡RIC^N DIRECT lNVESTMI…NT1N ASIA
.〔OO①-..OO(□O目宙門トひ一..-旦Oω.O§O、““ミ昌き、肖-“O-ミ.OO自宙冒}』』Oト』-閉}目「妻・。~O』茗Oり
○寸.冨
いN.〔N 旧ひ.寸□
トい.いN
○寸.冨
OOO.鶉
o-、oべ いo、〇一
oN.0N
8.NN
(x)o-宙■二}きo』{)□宙コ自目’、
oo旨、ト
〔卜寸
貢ト
冒い
oooo ①s
一N卜
い.いト
〔。。〔.一
○ひ
いNoo.一 N一n、一
〇.ひひ トON
①卜寸
oooF s
い.茗
○亀.口
一二、竃
。・トト.o
<曽
(竃O冒這易∋ごεO↑
寸、ooい一い〇一moo卜NN0、トo寸
○寸、oい一いN〔N0、トト〔o一寸oo
o,oトー一いいo、卜N寸N門m寸ooo
o,N,oo一い〇一寸いoo門ト寸〔卜N
寸一トoいoo〔N一寸oト〔旧oo,N
NNト、oooo〔門一い一寸oo、い寸ト
一〇、卜、o【卜o寸noいい寸N一〔oo
、oい1-1n一〇〇〔トひN0寸n寸トoい
○い、o【トNトー〔寸ooひい〇一〇寸
いい、o寸ト〇一〇〇〇、ト0N〔一い寸d
N卜、oo寸一N〔寸一〇〔ooトいひ旧
○い、oo、N一〔寸N-oooトト寸〔い
一1N卜O、〇一寸n〔旧ooい寸0Nト岨
○トo〔Nooい一一寸o[N0、いト寸
一〇いo〔寸oひトいN卜〇一〇〇寸【n
ooトい一○卜旧寸NN0ひ一〇寸いn
寸Nトo一N00寸い〔㈹トーいo,oo
一〇〇、o卜一〇〇いN〔いトnN0、寸寸
寸□∩ト㌧o一Nm寸o〔oo旧卜①ψ一【
寸、no卜一Nm寸いoトooo、◎一dm
一-O--O目--晒E[On)
眈ω-』⑭一一閉-臼
き-血o-o』叱④-ヨ;コo-H0呵<
占oo-』自一0d』ヨ自d;℃oo』
ωω---㎝日□o‘』-
昌o目}-目一〇掴コ目d妻』Φ一-◎
-宙-Φ目o巾).{』ΦE-’o宙量
閉口由o--口〇一〔)
-筥〇一』』o旧目dm□目oo宙--oo血竈旬-』ド
曽o自-’o討妻o…-一〇Φ-血【
ω-討一〇妻o目o』-o』.冒oz句-o〇一吻
閉o-宙-血口一宙o‘南閉o}』由}で-閉〔=昌m…
旦-目{オーoρ自-}』ド
ωo=一■o」[
ΦU己□宙』ヨー閉’』-勾⑭uo[由日-^』
8』9口εOO
閉ΦU->』o吻-〇一-()
目o石石妻
因 <
討旧蜆ωE0i目-
臼 < 因 <
ω凹目}qo=-二{ 、昌=宙‘』い
臼 <
宙-閉、宙-宙妻
因 < 葭 <
O』O急ぎあ目O昌急昌O
日 <
由習O】
閏 <
目…皇由↑
<
逗ω<
因 <
雪ε参
』◎(,Z臼“m□吻z室「口■OO、[トひ一
(巾ooひ一 .=o生<;
、=o‘‘≧』o(乏円一<ωz妻P■oO)H』ρ臼窒Z<{<H』oO…】2<{■<‘o↑〇四吻
.寸日臼<↑
1985]

lO HITOTSUBASHI JOURNAL OF EcoNoMlcs [June
TABLE 5. RANK CORRl3LATION COEFFICIENTS OF JAPANESE DIRECT INVESTMENT BETWEEN IN ASIAN DEVELOPlNG COUNTRIES (AS END OF MARCH, 1 983)
Korea
Taiwan 0.7206** Korea Singapore
Hong Kong Thailand
Malaysia Philippines
Smgapore Hongkong Thailand Malaysia Philippines Indonesia
0.7230** 0.0515 0.7181* 0.2647
0.2108
0.4338* 0.3750 0.4632* 0.4093$ 0.441 2* O. 1 373
O.2328 -0.0294 0.2745
-0.0564 -0.0392 0.2794 O. 1 544 0.0098 -0.1912
-0.2157 -0.0809 0.2868 0.2132 O. 5 73 1 * * 0.7034* *
0.7647**
** Statistically significant at l~ Ievel.
* Statistically siguificant at 5~ Ievel.
Source: Calculated from Table 4.
changes in investment patterns in each country occurred between March, 1973, and March
1983. In short, the Japanese DFI pattern varies depending on the host country involved and
over time.
Particularly important in this respect is the Japanese practice of considering the impact
of its DFI on the pattern of comparative trade advantage. In order to be consistent with
the free operation of the market mechanism Japan makes a noticeable effort to develop an
investment strategy which promotes the development of industries which have or are gaining
comparative trade advantages in the host country concerned.
In this respect it is instructive to examine the pairs of countries in which patterns of Japa-
nese DFI are relatively similar. First of all, patterns ofDFI in the resource scarce economies
of Korea, Singapore, and Taiwan are all similar as illustrated by the positive and significant
correlation coefficients. This is to be expected as all these countries are resource scarce and
Japanese DFI in these countries, especially that in export processing zones (EPZs), is often
undertaken as a part of international division of the production process.
Secondly, it is noticed that patterns of DFI in the resource abundant countries of Indo-
nesia, Malaysia, and the Philippines are relatively similar. Here again correlation coefficients
are positive and significant. Yet, the correlation coefficients between these two groups of
countries are generally not significant (The one exception is that of Korea and Malaysia.) and
often negative; thus, one can conclude that the patterns of investment in these two groups of
economies are dissimilar.
Thirdly, it might be expected that the DFI pattern in Hong Kong would resemble that
in the resource scarce group but the pattern is actually quite different due to the importance
of commerce, finance, and light manufacturing industries in the Hong Kong economy and
in the Japanese DFI pattern. Finally, it is interesting to note that the pattern of DFI in
Thailand is more similar to that in the resource scarce group than that in the resource rich
grou p.
lll.4. Conclusion
It has become clear that there is a distinctive difference between the patterns of American
and Japanese DFI. American DFI can be classified as the MNC type of DFI and its pattern is remarkably uniform across host countries or regions and across time. This type of DFI

1985] JAPANESE AND AMERICAN DIRECT INVESTMENT IN ASIA 11
is motivated by the profit seeking interests of MNCS and is well explained by the "inter-
national business approach" to DFI. In contrast, the pattern of Japanese DFI varies between
countries or regions and over time. Particularly important is the fact that the effect of DFI
on the patterns of comparative trade advantage and their evolution over time is taken into
account in the investment decision. In this respect it is necessary to develop a macro-eco-
nomic theory of DFI to explain Japanese type DF15 as is briefly outlined in section II. In
addition to describing the differing patterns of Japanese and American DFI, it is also im-
portant to explain how the behaviour and sources of firm competitiveness for Japanese and
American firms differ. This is the topic of the next section.
IV. American and Japanese Investment Presence Compared
IV.1. Comparative Investment Advantage Analysis
In a well known work G.D.A. MacDougall (1951) attempted to test the validity of the
comparative cost trade theory using a three country model in which American and British
exports to the rest of the world were compared.6 Defining X as exports to the rest of the
world, US as a superscript indicating American activity, Br as a superscript indicating British
activity, and i (i= 1,2,...n) as a subscript indicating commodity category, an index of relative
export shares was calculated.
(12) XfUS XtB' ~ XiUS ~ XiB' i=1 ,=1
This index was asserted to reveal industries in which the two countries had a comparative
trade advantage or a competitive edge. Thus, this index was later named the index of "re-
vealed comparative advantage." In order to test the comparative cost theory ofinternational
trade this index was then correlated with the following index of labour productivity.
(13) LiUs/LiB'
Here L is labour productivity with superscripts and subscripts as defined above. A high (and
statistically significant) correlation was taken as evidence supporting the comparative cost
theory of international trade.
In a similar way we can develop an index of "revealed comparative investment advantage"
* Here it should be emphasised that "Japanese type" and "MNC type" DFI are abstract concepts and that they are used as such. The above discussion should not be interpreted as meaning that all Japanese DFI is "Japanese type" DFI or that all American (and European) DFI is "MNC-type" DFI. Rather it is asserted that the majority of Japanese DFI is "Japanese type" and that the majority of American (and Euro-
pean) DFI is "MNC type." See Arndt (1974, p. 31) and Buckley (1983, p. 97) for some comments in this res pect .
' See also Kojima (1970). Bilateral trade between the US and Britain was excluded because it was dis-torted by tariffs and other trade barriers and thus comparative costs were not a major determinant of ob-served trade flows making analysis of such trade flows meaningless in this context. However, it was mean-ingful to compare export performances in third markets as American and British firms faced a common en-vironment in this case.

12 HITOTSUBASHI JOURNAL OF EcoNoMlcs [June between American and Japanese investment in a given host country. This is obtained by
using the definitions of investment patterns given in (10) and (11) above. We obtain
(14) h(A/J)= ~Vt.hA Vi.hJ ~ Vi,hA ~ Vi.hJ
i=] i=1 This is the li-index and refiects the relative presence of the two types of investment. If the
index is greater than I this indicates a larger American presence and thus reveals a com-
parative investment advantage for American firms in the industry in question. If the index
is less than I a larger Japanese presence is indicated revealing a comparative investment
advantage for Japanese firms in the industry in question.
Recalling the fact that the pattern of American DFI is quite uniform throughout the
world while the pattern of Japanese DFI varies from country to country, it then follows that
the li-indices for a country will vary in accordance with the pattern of Japanese DFI.
Having defined the It-index the next task is to describe its determinants; in short an at-
tempt to describe the determinants of comparative investment advantage is made. The most
important direct determinant should be the profitability of the DFI in question. Let Pi
denote the rate of profit in industry i; then:
(15) Pi(A/J)=PiA/PiJ
shows the relative profitability of American DFI in industry i as compared to that of Japanese
DFI in that industry in a given host economy. We then write :
(16) Ii--f(Pi); where (dli/dPi) >0 is postulated.
This hypothesis means that American and Japanese firms invest in industries in which their
relative (to the other country's firms) profitability is high. This hypothesis will be tested in
the Taiwanese case below by using simple regression analysis. Examination of the industry
rank correlation coefficients between of It and Pi will also be used to evaluate this hypothesis;
if the regression and rank correlation coefficients are positive and statistically significant this
can be taken as evidence that the hypothesis is correct.
This type of investigation also sheds light on the Kojima theorem of the "correspondence
between comparative costs and comparative profit rates," which was briefly outlined in
Section II. Here it should be remembered that "trade oriented" DFI, which is consistent wrth
the workings of the market mechanism and results in an increased divergence between com-
parative costs in the two countries concerned, makes greater profits than "anti-trade oriented"
DFI. Indeed the latter type of DFI could result in negative profits.
Furthermore, it is hypothesised that Pi depends on factors which affect the competitive-
ness of the firm. Some of these factors are size, the ownership share, and the capital/labour
ratio of the operation abroad. Define S as size, O as ownership share, and K as the capital/
labour ratio and then relative size, relative ownership shares, and relative capital/labour ratios
in industry i can be defined as follows:
(17) Si(A/J)=S,A/SiJ
(18) O,(A/J)=0iAIOiJ
(19) Kt(A/J)=KiA/K.J

1985] JAPANESE AND AMERICAN DIRECT INVESTMENT IN ASIA 13
Then we assume:
(20) Pi=g(Si, Oi, Kf) where (api/aSi)>0, (api/aOt)>0, and (api/aKi)>0 are postulated.
In other words, relative profit rates are an increasing function of relative size, relative owner-
ship shares, and relative capital/]abour ratios because larger size, greater ownership shares,
and higher capital intensity (implying the use of more sophisticated technology and manage-
ment techniques) are factors assumed to strengthen competitiveness and thus facilitate greater profits.
We can then substitute St, Oi, and Kt for Pi in equation (16) to obtain:
(21) It=h(St, Oi, Kt) where (ali/aSi)>0, (ali/aOi)>0, and (ali/aKi)>0 are postulated.
Here we will also calculate the rank correlation coefficients between these variables to
shed light on our hypothesis.
IV.2. A Case Study of DFI in Taiwan
Empirical research dealing with DFI is hampered by a lack of consistent data. The five
indices we need to pursue the type of analysis outlined above can only be obtained from sur-
veys conducted by investing or host country governments. Unfortunately, American and Japanese surveys are incomplete in many respects and thus host government surveys must be
relied upon. The Investment Commission (Ministry of Economic Affairs) of the Republic
TABLE 6. AMERICAN AND JAPANESE DIRECT INVESTMENT IN TAIWAN (AS OF END
I-index revealed comparative investment advantage
1. Trade A 2. Transportation A 3. Pulp, paper & products 9.000 4. Non*metallic minerals 4.875 5. Chemicals 3.292 6. Services 2.533
7. Food & beverage processing I .909
8. Others 1 . 146
9. Electronic & electric 0.813 appliances
10. Machinery equipment 0.748 & instrument
1 1 . Textiles 0.587
12. Leather & fur products 0,500 13. Garment & footwear 0.400 14. P]astic & rubber products 0.340
15. Basic metals & metal O. 306
products
16. Lumber & bamboo J products
(Weighted average)
Source :
(1.000)
pA
~;
0.04
-0.74 3.46
l.84
6.60
16.35
6.62
7.66
13.01
- I I .93
0.35
-0.26 1.82
5.16
7. 55
(3 .42)
PJ Rate of profit
~
l . 27
2.31
3.68
3.66
7,42
4.70
2.84
2.61
3.36
1 .71
0.38
-1.56 1 .03
4. 1 2
(2.30)
P=PA/P/ S-index relative relative profit- size of
ability frms
A A 2.724
0.797
l.793
4.467 O. 892
1 . 630
4. 581
O. 820
O. 104
0.132
4.789
4. 308
7.330
J
(1.487)
A A 8.992
86.180
3.385
0.941
l.556 2. 1 62
0.822
9.985
3 1 . 203
O. 849
4. 366
4.745
1.514
J
(2.671)
1982)
O-index relative
ownershi p share
A A 1.021
0.356
2.413
3.312
l.452
1.405
1.971
0.233
0.740
1.887
0.186
1 .069
1 .045
J
(1.006)
K-index relative ca pital
intensity
A A 1 . 800
23.288
1.649
0,796
2.029
0.520
0.806
3.007
l.538
0.303
l.951
1.886
l.058
J
(1.581)
Investment Comrnission. Taiwan, A Survey Report on Foreign Direct Investment in Taiwan for 1982.

14 HrroTsul3Asru JOURNAL OF EcoNoMlcs [June of China (Taiwan) conducts such surveys annually and publishes the results in a publication
called A Survey Report on Foreign Direct Investment in Taiwan. Table 6 was produced from
the 1982 edition ofthis report.7 We would like to detail this case as an example ofthe country
studies undertaken.8
According to the survey report American DFI (Here DFI is defined as the foreign con-
tribution of capital to American or Japanese firms in Taiwan.) amounted to NT$ 1 1,1 14 mil-
lion (about USS 279 million at 1982 exchange rates) and Japanese DFI NT$ 12,644 million
(about US$ 317 million) at the end of 1982.9
(1) The difference in investment patterns is revealed in the li-indices. An "A" means
that only American firms invested in the industry and "J" means that only Japanese firms
invested in the industry. Two industries, "agriculture and forestry" and "mining" are omitted
from the table as no American or Japanese investment was recorded in these sectors.
From the li-indices it can be seen that there is a greater American presence (and thus
revealed comparative investment advantage for U.S.) in industries such as "trade," "trans-
" " " "non-metauic minerals chemicals portation, pulp, paper & products, ," " ," "servrces," "food & beverages," and "others (musical instruments, publishing, printing, etc.)." In
"electronic and electric appliances" and "machinery equipment (mainly automobiles)" both
the US and Japan invest heavily and competition between firms from the two countries is ex-
tensive. It should be remembered that the above industries are typical areas of MNC opera-
tion.
In contrast, Japanese DFI exhibits a significantly greater presence in industries such as
"lumber and bamboo products," "basic metals (mainly steel)," "plastic and rubber products,"
"garments and footwear," "leather and fur products," and "textiles." In other words, Iabour
intensive, Iight industries such as "textiles," as well as "machinery equipment" and "electronic
and electric appliances" mentioned above, tend to be the major object of Japanese DFI.
Thus, a clear difference between MNC-type and Japanese-type DFI emerges in Taiwan.
(2) Turning to the relationship between It and Pi we see that the Pearson rank-correla-
tion coefficient between the L and Pi indices is 0.51 and significant at the I ~ Ievel, a fact which
supports the hypothesis that I, is an increasing function of Pt. (See Table 7, part (1).) This
hypothesis is further supported by simple regression analysis (See Fig. 1). We obtain:
(22) Iog (e) (Ii)=0.652987+0.563402 Iog (e) (Pi) AdjR2=0.450188
(2.634575)* (2.747805)* F=7.550432* (*-significant at 5~~ Ievel) (DW=0.85183)
Here a sample of 9 industries from Table 6 was used. "Trade," "transportation," and
"lumber & bamboo products" are omitted as indices could not be calculated for these cate-
gories. In addition, several outliers, "electronic & electric appliances," "garments & foot-
wear plastic & rubber products," and "basic metals and metal products" are also excluded. ',, ''
7 This survey is based on questionnaires submitted by a total of 819 frms. (1072 were sent out.) 370 were submitted by Japanese firms, 121 by American frms, 251 by Overseas Chinese firrns, and 77 from other
frms . 8 Country Studies are reprinted in detail in Kojima (1985). ' These figures are significantly different than the approved investment figures published by the Investment
commission in the 1983 edition of Statistics on : overseas Chinese and Foreign Investment. Technical coopera-tion, Outwa'd Invest,nent. Outward Technical Cooperation. The Republic of China. In that publication total approved foreign investment for 1952-1983 was put at uS$ 1,152 minion tor the U.S. (the 1952-1982 total is calculated to be US$ l,056 million) and US$ 871 million for Japan (us$ 674 million for 1952-1982).
JAPANESE AND AMERICAN DIRECT INVESTMENT IN ASIA
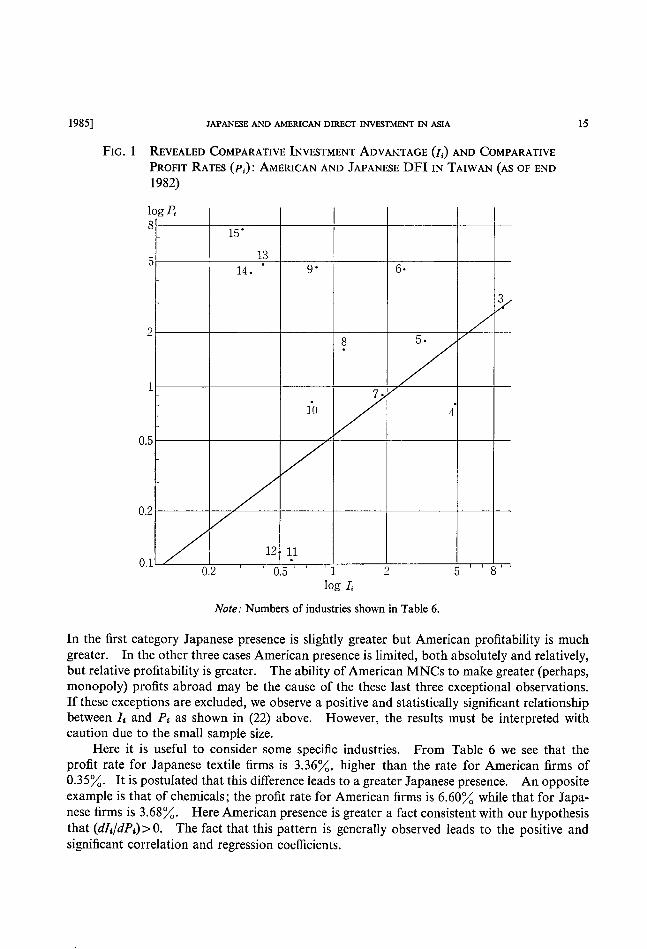
FIG. I REVEALED COMPARATIVE INVESTMENT ADVANTAGE (Ii) AND COMPARATIVE PROFIT RATES (Pi): AMERICAN AND JAPANESE DFI IN TAIWAN (AS OF END 1982)
log P<
S
5
2
l
o.5
o.2
1
2
0.5
10g I,
Note: Numbers of industries shown in Table 6.
In the first category Japanese presence is slightly greater but American profitability is much
greater. In the other three cases American presence is limited, both absolutely and relatively,
but relative profitability is greater. The ability ofAmerican MNCS to make greater (perhaps,
monopoly) profits abroad may be the cause of the these last three exceptional observations.
If these exceptions are excluded, we observe a positive and statistically significant relationship
between I, and Pi as shown in (22) above. However, the results must be interpreted with
caution due to the small sample size.
Here it is useful to consider some specific industries. From Table 6 we see that the
profit rate for Japanese textile firms is 3.36~~, higher than the rate for American firms of
0.35~・ It is postulated that this difference leads to a greater Japanese presence. An opposite example is that of chemicals; the profit rate for American firms is 6.60~; while that for Japa-
nese firms is 3.68~・ Here American presence is greater a fact consistent with our hypothesis that (dlt/dPi)>0. The fact that this pattern is generally observed leads to the positive and
significant correlation and regression coefficients.
og Pi
15 '
13
14 . 9' 6.
3
8
5.
7. fo
4
12 11

16 HrroTSUBASHI JOURNAL OF EcoNOMrcs [June However, there are some notable exceptions to the overall pattern. Of particular concern
are the negative profit rates observed for American firms in "machinery equipment (mainly
automobiles)," "transportatlon " and "leather and fur products " and for Japanese firms m
"plastic and rubber products." The most significant of these is the large negative rate for
American firms in the "mach,inery equipment" sector due mainly to the performance of Ameri-
can automobi]e firms in Taiwan. This might well be a case of anti-trade-oriented DFI where
the American MNCS involved have set up factories with capacity too large for the domestic
market but which do not produce competitive exports. If so this could be called "DFI dumping" in the sense that imports from the investing country (or a third country) would be
more efficient than production in the host country.ro In fact General Motors pulled out of
Taiwan soon after the survey was published causing concern among Japanese firms consider-
ing similar investments in Taiwan. Furthermore. Toyota has since dropped plans for invest-
ment in Taiwan while Nissan is still negotiating about a potential new investment project.
(3) From Table 7, part (1) it can also be seen that the rank-correlation coefficients be-
tween li. P, St, Ot, and Ki are positive and significant at the 5~~ Ievel or better in most cases.
This reflects the fact that both Japanese and American firms attempt to strengthen competi-
tiveness by increasing size, ownership shares, and the capital/1abour ratio. It is interesting to
TABLE 7. RANK CORRELATION COEFFICIENTS OF U.s./JAPAN COMPARATIVE INVESTMENT ADVANTAGE INDICES
(1)
(2)
(3)
(4)
(5)
(6)
(7)
US/Japan DFI in Taiwan (as of end 1982)
I 0.5059* 0.7529** 0.7559** 0.6971** 0.4853* 0.7147**
0.4441*
US/Japan DFI in Hong Kong (as of end 1981)
I 0.9316** 0.8614** 0.9088** S 0.7949** 0.9474* * US/Japan DFI in Korea (as of October 1981)
I 0.8713** 0.8430**
S 0.9119** US!Japan DFI in Indonesia (as of September 1983) S
O
I 0.9649** 0.9456** O. 9456** S
US/Japan DFI in Taiwan (Cumulative approvals for 1952-1983) I :S=0.7564**
US/Japan DFI in Singapore (as of end 1978)
I:S=0.9314** US/Japan DFI in the Philippines (Around 1980)
I :S=0.9643**
** Statistically significant at 1~( Ievel.
' Statistically signtficant at 5~~ Ievel.
IQ Here it should be noted that 1982 was a recession year in which the automobile industry was especially
hard hit worldwide.

1985] JAPANESE AND AMERICAN DIRECT INVESTMENT IN ASIA 17 note that some Japanese firms are relatively large and capital intensive although American
firms maintain a relatively larger ownership share in "electronic and electric appliances."
This reflects the fact that American MNCS invested in Taiwan earlier than their Japanese
counterparts and thus the latter set up bigger, more capital intensive (thus utilising more
sophisticated technology and management) factories in order to out-compete the former.
(4) Finally, the dominance of MNC-type DFI in the American pattern is illustrated by
the fact that, using a weighted (by the foreign share of total assets) average of all industries,
the profit rate of American firms is larger (3.42~;) than Japanese firms (2.30~)・ This is per-haps due to the dominance of investment in oligopolistic or monopolistic industries. Ameri-
can firms are 2.7 times larger than Japanese firms, American firms are 1.6 times more capital
intensive, and, although the ownership share appears the same in Table 6, wholly-owned sub-
sidiaries account for 48~; of the 121 American firms but only 23~~ of the 370 Japanese firms.
On the other hand, minority ownership, Iess than 49~, joint ventures account for 21~ of
American firms and 42~ of Japanese firms.
IV.3. Studies of DFI in other Asian Economies
Studies similar to that conducted for Taiwan have been made of DFI in several other
Asian economies. Original data (similar to that in Table 6) for these studies is omitted here
but the rank correlation coefficients calculated are presented in Table 7, parts (2)-(4) and
(6~(7). A few remarks regarding each case are made below.
Hong Kong The Industry Department of Hong Kong kindly provided us with detailed survey data
which, in conjunction with the publication "Overseas Investment in Hong Kong's Manu-facturing Industry," provides the basis for the calculations made in Table 7, part (2). Data
covers investment made through the end of 1981 and is limited to DFI in manufacturing.
American DFI amounted to HK$ 3,062 mil]ion or 43.7~ of the total (HK$ 7,013 million)
while Japanese DFI amounted to HK$ 2,213 million or 31 .6~~ of the total.
Pi, the re]ative profitability index, is not available in this case. However, the rank cor-
relation coefficients between the other indices, Ii, Si, Ot, and Ki are all positive and statistically
significant at the I ~~ level.
. (1). The It index shows that American firms have a relative investment advantage in
mdustnes such as "transportatron equrpment " "furmture and fixtures*," "toys, jade and ,, ''
jewelry ' " " " "metal products," "food and beverages electronic prod-"', chemical products, ',, ''
ucts," and "paper products," where an asterisk (*) indicates relatively unimportant industries.
In contrast, Japanese firms have an advantage in the following industries (in ascending
order ofthel, index) "optics and photographics metal ro]ling, extraction and fabrication," ,, '' ,
' "printing and publishing," " " " leather products ' * " "plastic products, watches, clocks and
accessories, non-electrical machinery," "miscellaneous manufactures " " ,, '' , electrical prod-ucts," and "textiles and garments" and "yarns and fabrics," and American advantage is seen
in the former group but there is no American presence in the latter group.
In short, the distinction between the MNC-type pattern of American DFI and the pat-
tern of Japanese DFI is very clear in Hong Kong manufacturing.
(2) In the seven industries in which an American advantage is revealed, this advantage

1 8 HrroTSUBASHI JOURNAL OF EcoNoMlcs [June is due to larger size and greater capital intensity. For example, American presence is larger
in "electronic products" while Japanese presence is much larger in "electrical products". In
"electronic products" and "paper products" Japanese and American firms compete. Ameri-
can firms are larger in the latter category but about the same size in the former. However,
they are less capital intensive in both industries. These observations reflect the fact that,
as in Taiwan, Japanese firms entered Hong Kong later than American ones but brought in
more sophisticated technology and management. (3) Due to Hong Kong's liberal policy toward DFI, overall ownership shares (calcu-
lated as a weighted average of all industries) are approximately equal for American firms
(92.6~~) and Japanese firms (87.6~;)・ However, there are some pronounced differences in some mdustnes, especrally, "toys," "food and beverages," and "textiles and garments" where
American shares are much larger than Japanese ones.
Korea According to the Ministry of Finance approved American DFI amounted to US$ 427
million (24.3~~ of the total) and approved Japanese DFI amounted to US$ 966 million (55.0~
of the total) for the 1962-1981 period. [See Koo (1983), p. 17.] An unpublished study, A
Survey of Foreign Direct Investment in Korea undertaken by the Economic Planning Agency
is the only source giving a list of foreign companies, their equity, and total assets. From this
information DFI in 22 sectors (defined in an unavoidably arbitrary fashion) was calculated as
of October 30, 1981. According to this source American equity DFI amounted to US$ 535
million and Japanese equity DFI to US$ 543 million. Thus, there is a large difference between
approved and equity base figures.
(1) Here again the It-index indicates that American DFI has a stronger comparative
investment advantage in those industries dominated by strong MNC interests. An American
advantage is revealed in "petroleum refining computers and related products," "food and ,', ''
beverages pharmaceuticals, industrial electronics," "technology services," "finance," ,, '' ',' ''
"transportation chemrcals " and "other industries," with the li-index descending in that '', '' , order.
In contrast, Japanese DFI has a stronger advantage in "other services," "hotels and tour-
ism," "elec+*rical h*ome applrances " "textiles " "pottery and porcelain, construction," ,, ''
"garments miscellaneous manufactures," "agriculture and forestry*," "metals," and ',, ''
"general machinery," where an asterisk again indicates that DFI in that sector is minor.
(2) The rank-correlation coefficients between L, Si, and Oi are positive and significant
at the 1~ Ievel as shown in Table 7, part (3).
(3) Using a weighted (by the share of joint equity) average of all firms it is seen that
the size of American frms (US$ 7.4 million) is larger than that of Japanese firms (US$ 2.4
million). Furthermore, the ownership share of American firms (60.1~) is also larger than
that of Japanese firms (48.9~;)・ Here it should be noted that, in addition to the differences between the MNC-type pattern of American DFI and the pattern of Japanese DFI, Korea's discriminate and restrictive policy toward DFI may also account for some of the observed dif-
ferences in size and ownership.
Singapore In the cases of Singapore and the Philippines only the li and Si indices are available.
However, analysis of only these two indices is asserted to be a meaningful proxy for the more

JAPANESE AND AMERICAN DIRECT INVESTMENT lN ASIA
complete analysis conducted above. As an example consider Table 7, part (5) which deals
with the Taiwanese case. Using approval figures for the 1952-1983 period only li and St
can be calculated. Yet, analysis based on the rank correlation coefficient here would be quite
consistent with, and thus could be used as a proxy for, the more full analysis given in Section
IV.2 above. Thus, a positive correlation coefficient between It and Si is also taken as evidence
that DFI is made in a way consistent with the free working of the market mechanism.
In the case of Singapore, a high]y positive and significant rank correlation coefficient is
observed as shown in Table 7, part (6). The calculation is based on unpublished data of
Singapore's Department of Statistics as given by Fong (1982). The data is a bit old as it
covers DFI as of 1978. Furthermore, only the manufacturing sector is covered and oil refin-
ing, a very important activity of American firms, is excluded. Consequently American DFI
(defined as gross fixed assets at the end of the year) (SP$ 450 million) appears smaller than
Japanese DFI (SP$ 713 million). Japanese and American DFI patterns are again different:
American presence is larger in MNC dominated activities such as "rubber products," "furni-
ture," "radios " "metal gnllmg " and "other manufactunng " while Japanese presence rs larger in more sophisticated industries such as "precision instruments paper and printing," ,,, ''
"computers " and "transportation equrpment (pnmarily shrpbuildmg and repalnng)." Firms from the two countries compete in "textiles and garments."
It should also be noted that, on average, the size of Japanese firms (SPS 8 million) is
greater than that of American firms (SP$ 6 million). The difference is especially pronounced
in those industries in which Japanese firms have a revealed comparative investment advantage.
These differences have resulted from the fact that American DFI in Singapore has been heavily
concentrated in "oil refining" and "finance," and to a lesser degree in older manufacturing
activities while Japanese firms, as late comers, mainly invested in more sophisticated manu-
facturing sectors.
The Pllilippines
In this case data sources are not the same and thus data is not entirely consistent. Ameri-
can DFI figures are compiled from the American Chamber of Commerce in Manila, American
National Corporation in Sec-Business Day, Top 1.000 by Sector, Nationality and Percentage
of Foreign Equity, Manila, 1982. Only 168 Iarger firms are covered here. Japanese DFI
figures are taken from JETRO, Manila, A SurveJ' of Japanese Firms in the Phi!ippines. 1981.
658 firms are covered accounting for almost all Japanese firms in the Philippines. In addition,
Board of Investment figures show that American DFI accounted for 28.8~~ and Japanese DFI
20.1~~ of total DFI approved under P.D. 1789 and P.D. 218 during the 1968-1981 period.
The Philippines is a resource abundant country and the pattern of the It-index is signifi-
cantly different than in the resource scarce countries analysed above. Yet, here again Ameri-
can firms have a comparative investment advantage in MNC dominated sectors such as "petroleum and coal " "sugar rubber " "food and beverages non-electncal machinery," ' ,,' '' ' , ', '' "paper and its products," "transportation and communication," "leather and its products,"
"chemicals," and "electric and electronic apparatus." On the other hand, a comparative
advantage for Japanese firms is revealed in "textiles" as well as other labour intensive manu-
factures, "mining" as well as other resource based industries, and "construction," "com-
merce," as well as other services.
Here again the correlation between the St and li indices is very highly positive and statis-
20 HITOTSUBASHI JOURNAL OF ECoNoMlcs [June tically significant as shown in Table 7, part (7). The size of firms differs significantly : using a
weighted average American firms are 10 times the size of Japanese ones. Wholly owned subsidiaries account for 45.8~; of American firms but only 2.6~ of Japanese firms. Industry
wise dlfferences are not known inthis case. These differences in observed size and ownership
structure are partially due to the exclusion of smaller American firms from the sample but the
latter phenomenon is mainly due to the Philippine policy of restricting ownership shares of
non-American foreign firms.
Ind onesia
BKPM (the Indonesian Investment Adjustment Board) kindly provided us with detailed
information which could be used to calculate li, Si, and Oi indices. As shown in Table 7,
part (4) the rank correlation coefficients of these three indices are highly positive and sig-
nificant at the l~ Ievel. However, data refers only to DFI in the manufacturing sector.
Thus, Iarge American investments in the petroleum and related industries are omitted and,
as a result, the American DFI total as of September, 1983 appears far smal]er than the Japa-
nese total when it may in fact be substantial]y larger. [See Wie, (1984a).] Because the pattern of the li index is more or less similar to that in the Philippine case detailed explanation
is skipped here.
V. The Dynanlic Effects ofDFI on Host Economies in Asia
V. I . Introduction
DFI is different from other capital inflows in that financial capital (foreign exchange) is
not the onlv item involved. DFI is also associated with the transfer of resources such as
physical capital, technology, and managerial skill. These unique characteristics allow DFI
to be a catalyst to the creation of new industries in the host country, improvements in pro-
ductivity, and export growth. As a result DFI's impact on structural change, trade and
growth can be significant. This catalytic function is the most important contribution DFI
can make to a host economy. Although there are numerous effects of interest imparted by DFI on host economies our
discussion here will be limited to effects on trade and total output (GNP) and related structural
changes. Here it should be emphasised that DFI is asserted to affect output structure first.
Then, as a result of these impacts on output structure, total output, trade volume, and trade
structure are affected,n In the next section the effects of American and Japanese DFI on
trade volumes with special reference to effects on the balance of trade are analysed utilising
firm sales and purchase data as we]1 as a simple regression approach. Then the third section
reinterprets these results in an attempt to analyse impacts on trade orientation. It also tries
to clarify what is meant by "trade orientation" in relation to the empirical evaluation of DFI's
effects. Finally, effects of American and Japanese DFI on output are analysed utilising a
multiple regression framework.
** An ana]ysis of these structural changes is skipped here because of space constraints and will be under-
taken in a separate paper.

1985] JAPANESE AND AMERICAN DIREcr lNVESTMENT IN ASIA
V.2. Effects on the Balance Of Taade
21
In this subsection the focus is the impact of DFI on the balance of trade as Japanese DFI
has often been criticised as leading to a deterioration in a host country's trade balance or net
foreign exchange earnings. Here it should be emphasised that this type of analysis is concep-
tually quite different than analysis of trade orientation, a topic taken up in more detail in the
next subsection. Much of the empirical analysis in this subsection will be used in the evalu-
ation of trade orientation as well but it is crucial that the two types of analysis be kept distinct
to avoid confusion.
Two types of empirical analyses are particularly useful in this respect. First of all, one
can analyse the trade data of foreign firms operating in a given country or region. Such data
can be gathered from surveys conducted by investing or host governments. Here we will analyse data provided in Japanese and Taiwanese surveys as they are the only ones facilitat-
ing analysis of balance of trade impacts.12 Japanese data wiu permit analysis of effects on
both multilateral and bilateral (with Japan) trade balances while Taiwanese data will only
permit analysis of effects on the multilateral trade balance. Secondly, a structural model
specifying trade fiows as a function of DFI can be constructed. Then [d (export flow)/d (DFI
flow)] and [d (import flow)/(d(DFI flow)] can be estimated and compared. This is done for
four countries, Korea, the Philippines, Taiwan, and Thailand. Here we will only analyse
impacts on trade with Japan and the U.S.
Analysis of Japanese Survey Data
Before examining Japanese survey data it is important to realise that many host countries
consider adverse balances of trade to be major problem and that the adverse balance of trade
with Japan is often asserted to be a major element of this problem. Here it is instructive to
look at host country export/import (X/M) ratios for trade between the countries concerned
and Japan for 1975 and 1983. Two groups of economies can be identified, those in which
the balance of trade with Japan improved in the 1975-1983 period and those in which it
deteriorated. The (X/M) ratios for the countries for 1975 and 1983 respectively in the
former group are as follows: Indonesia, 1.855 & 2.817; Brazil, 0.952 & 2.261 ; Korea, 0.582
& 0.667; Taiwan. 0.446 & 0.574; and Singapore, 0.263 & 0.330. The ratios for the latter
group were: Australia, 2.392 & 1.520; Malaysia, 1.221 & 1,130; the Philippines, 1.092 &
0.749; the U.S., 1.042 &0.575; Thailand 0.755 & 0.406; and Hong Kong, 0.178 & 0.127. (The
Australian, Brazilian and American cases are added for reference.)
While it is impossible to draw any direct connection between these figures and the impact
of DFI it is clear that trade deficits with Japan have been significant and increasing in some
cases. This has led to severe criticism of Japanese DFI among other things. However, it
does seem significant that these deficits have been shrinking in most more mature economies
(Taiwan, Korea, and Singapore) while increasing in most less mature ones (Malaysia, the
Philippines, and Thailand). Correspondingly Japan's DFI is more mature and thus more likely to have a pronounced positive effect on exports in the former group. The fact may be a
cause of observed differences and may be an indication that less mature DFI Ieads to trade
1: American and Singaporean surveys provide information about export and sales activity but not about input purchases and imports ; A Korean survey provides necessary information for all foreign frms but data facilitating comparison of American and Japanese frms are unavailable from known sources.
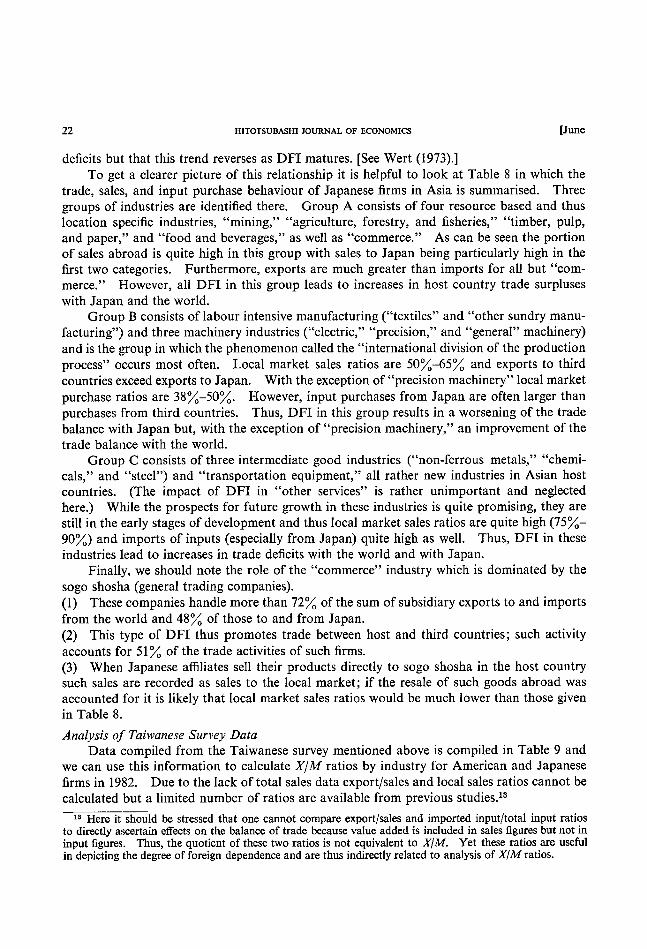
22 HITOTSUBAsm JOURNAL OF EcoNoMlcs [June deficits but that t]xis trend reverses as DFI matures. [See Wert (.1973).]
To get a clearer picture of this relationship it is helpful to look at Table 8 in which the
trade, sales, and input purchase behaviour of Japanese firms in Asia is summarised. Three
groups of industries are identified there. Group A consists of four resource based and thus ,, '' location specific industries "mining agriculture forestry, and fisheries, timber, pulp, , ,,, '' '
and paper," and "food and beverages," as well as "commerce." As can be seen the portion
of sales abroad is quite high in this group with sales to Japan being particularly high in the
frst two categories. Furthermore, exports are much greater than imports for all but "com-
merce." However, all DFI in this group leads to increases in host country trade surpluses
with Japan and the world.
Group B consists of labour intensive manufacturing ("textiles" and "other sundry manu-
facturing") and three machinery industries ("electric," "precision," and "general" machinery)
and is the group in which the phenomenon called the "international division of the production
process" occurs most often. Local market sales ratios are 50~-65~~ and exports to third
countries exceed exports to Japan. With the exception of "precision machinery" Iocal market
purchase ratios are 38~-50~・ However, input purchases from Japan are often larger than purchases from third countries. Thus, DFI in this group results in a worsening of the trade
balance with Japan but, with the exception of "precision machinery," an improvement of the
trade balance with the world.
Group C consists of three intermediate good industries ("non-ferrous metals, chemi-,' ''
cals," and "steel") and "transportation equrpment," all rather new mdustnes in Asran host
countries. (The impact of DFI in "other services" is rather unimportant and neglected
here.) While the prospects for future growth in these industries is quite promising, they are
still in the early stages of development and thus local market sales ratios are quite high (75~-
90~) and imports of inputs (especially from Japan) quite high as well. Thus, DFI in these
industries lead to increases in trade deficits with the world and with Japan.
Fmally we should note the role of the "commerce" industry which is dominated by the
sogo shosha (general trading companies).
(1) These companies handle more than 72~ of the sum of subsidiary exports to and imports
from the world and 48~ of those to and from Japan.
(2) This type of DFI thus promotes trade between host and third countries; such activity
accounts for 5 1 ~ of the trade activities of such firms.
(3) When Japanese affiliates sell their products directly to sogo shosha in the host country
such sales are recorded as sales to the local market ; if the resale of such goods abroad was
accounted for it is likely that local market sales ratios would be much lower than those given
in Table 8.
Analysis of Taiwanese Survey Data
Data compiled from the Taiwanese survey mentioned above is compiled in Table 9 and
we can use this information to calculate X/M ratios by industry for American and Japanese
firms in 198・_. Due to the lack of total sales data export/sales and local sales ratios cannot be calculated but a limited number of ratios are available from previous studies.13
*3 Here it should be stressed that one cannot compare export/sales and imported input/total input ratios to directly ascertain effects on the balance of trade because value added is included in sales figures but not in
input figures. Thus, the quotient of these two ratios is not equivalent to X/M. Yet these ratios are useful
in depicting the degree of foreign dependence and are thus indirectly related to analysis of X/M ratios.

η』APANl…S旧AND AMERlCAN DIR喧CT lNV正STMl…NT lN^S1^1985
.〔oo2
、ミミミー§§句塞ミ§念Q“竃§ミ§さ姜6ミり§ミ碧§δて.昌-暑ζu§亀
卜門o.一
卜N卜、寸s、〔二。。.。・萬.門
○寸門.[
卜冨.富〔.一寸;.soo.一
oo.卜向 門.ooN
①.鶉
o、寸N い.o門
ひ.寸可
-壇o↑
卜竃.寸一
8N.0
NooN.o
㎞oo寸.0
8い.o
岨oo門
等.ま
二ひ、$
s寸.卜o
寸〇一.on
鶉N、一
ひトい.貫
卜寸卜.9
◎。oo.s
so.当
いo-.喜
○いO.◎
$N.o
鶉寸.o
oo〇一.o
竃湯寸.蟹
トいト、oい
冨旧.専
N8.3
sN、一
い毫.寸
。oトo、二
門on.9
賢ト.一
o,o
O.〇
一.ON
oo.3
・[.ト㈹
o.[
一、s
[、鶉
oo.om
一.寄
o.ひひ
N.oo門
o,0N
㈹.竃
o.◎N
一.o
n.oo
旧.寸
一.ゆ
oo.NN
oo.い
σ.一
一.〇一
ひ.oo
o,N
一.寸σ
ト.αoo
寸.いoo
o.旧oo
い.寸卜
轟2≧2宕{◎
着o∈o冒冒
一8身冨占
-8あ
吻-S-昌o’0
25o∈
血目O』-些.目O之
.2
.茗
.2
.s
.箒 (O
冨N.一
寸:.一
3o.一
旧竜.◎
os.一
sい.湯
等ひ.o3
s。・.門s
寸畠.睾
。oま、二【
0N0、等
3一.oo当
菖。。、一二
。。s、等
い=.菖m
o0N.o
○寸N.O
oo寸o[.o
ト2.o
os.o
象o.竃
漂[.Nト
まひ、トい
。oヌ.$
等。・.塞一
寸oN.ト
等門、ト一
べ。〇一、8
いa.〇一
一トoo.。o昌
卜.o
oo.冨
o.冨
o.8
寸.寸
oo、寸い
〔、瓜N
oo.卜N
oo、寸卜
o,o寸
い.寸マ
ひ.oo[
い.◎寸
一.N一
〇.ひ寸
o.ひN
ひ.寸〔
一.竃
卜.寸n
一、s
い.い
o、寸
o.岨
「ひ
N、畠
い.い〇
一.毫
ひ.oo
〔.oい
o.「い
首昌茗o昌-
-雪o畠o
3…巻↑
則昌自も遅ヨ冨冒
、甘昌二婁◎
き昌;竃昌
EO-ω-U⑭-{
首畠遣畠昌
o-お8司
、o卜ooo,o(雪
一s.寸
鶉o.[
寸No.一
寸ooo.o〇一
〇冨.寸一
尋旧.二
s[.い
s〔.専門.N
いトい.[
【寸m
sい.ト寸
鶉[.雪
蟹門.一尋、N
ニト.賢
8o.い
ひ寸N.N[
ひNoo,0N
;一.N
ひべo.o〇一
〇〇〇〔.彗
oo寸ト
冨N
s寸.等ト
ト尋.一
N寸n
s一、黄
亀旧.卜
蓄ト.葦い.一
寸。oい.貫
寸5.寸
o.門N
o、竃
oo.卜寸
N.一
〇.◎
o.一
〇〇.一
い.NN
門.二
〇〇.o寸
寸.いト
N.いo
oo、賢
い.卜oo
N、鶉
〔、8
o.嵩
o.蟹
oo.ひ
ひ.N
N.o門
oo.o向
ひ.寸寸
〔.[oo
ひ.いひ
い.◎寸
一.竃
い.「巾
靹.o
N.一
血毘雪掌3
亀ooo匹
-巴邑幻
皇己.-3昌百
8旨昌昌oo
首岩唱、ξ§ε
.Φ自…o昆<
目o目…妻
.べ6寸o(<
…旨≧ ヨ8≧
昌oと o-
閉一-OO昌- 吻一』OO■臼
{ミ、ミ 圭ミ ミ
(冨、.昌)(冨曼h.iε雪ε奏
冨き□ 畠急-
εo占 o-
雀aε- 署o身囚
、ミ、ξ 、ミ ミ
(目呉8…冒)畠急『
竃;目コoo ぢ一畠目
o-;↑冨急- 奄o■
(x)竈竃{-星
』o目o遣吻邑目oo
肋Φ;昌8 至畠冒
℃-;H冨3↓ 一雪o■
(x)
咀壱竃o8…ωg昌oo
z-
竃乏<串妻oO
○胃≦昌匿<男墨<婁「四=↑◎↑
>■↑〇四生-〇四D0旨畠o{室Hoz<
(冨2雪婁妻8睾)姜<
旨き婁国、竃竃雪彗{、竃皇oo
.oo日饒<↑

24
TABLE 9.
HrroTSUBASHI JOURNAL OF ECoNoMlcs [June
EXPORTS AND IMPORTS OF TAIWAN DUE TO AMERICAN AND JAPANESE FIRMS (AS OF END 1982: MILLION N.T. DOLLAR)
X
Direct
exports to world
American Firms
M xa
Ratio Im-of X ports to total of sales in puts
from ~~ world
i~~
Ratio of I~
to total in puts
~~
X/M Rat i o
X
Direct
exports to world
Japanese Firms xb M j~~ X/M
Ratio Im- Ratio Ratio of X ports of 1~~ to of to total inputs total sales from inputs ~ world ~
2. 3.
4. 5. 6.
7. 8. 9.
lO.
11.
12.
13.
1 4.
l 5.
1 6.
Trade Trans portation
Pulp, paper & products
Non-metallic minerals
Chemicals Services
Food & beverage Others Electronic & electric
a ppliances
Machinery equipment & instrument
Textiles
Loather & fur products
Garment & footwear Plastic & rubber
products
Basic metals & metal products
Lumber & bamboo products
578 43 1
1 99
l,412
5,660
3 46
4,627
26,243
15,570
10,069
255
l,737
514
617
19.2
0.0
22.0
l.5
(9 1 . 6)-
92.8
25.3
96.7
IOO.O
IOO.O
56.2
44. 6
200 175
194
303
3,742
54 2,258
l,699
18,780
5,248
5 ,03 7
578 48 7
586
25.6
89.4
33.4
16.6
34. 1
79.5
55.6
52.0
74. 5
44.6
71.7
60, l
57.3
51 .8
2 . 90
2.47
l .03
4. 59
1.51
6.36
0.001
2.72
l.40
2.97
2.00
oo
3.01
1 . 05
l .05
20
818
5,22)
1 47
713
3,795
49,372
6,636
7,488
331
l ,032
4,022
2,634
355
21.8 16
62.4 I13 39.3 3,403
ll2
45.2 32 (72.4)・ 1,d41
51.1 25,357
69.6
81.l
99.0
97.4
90.4
44. 5
lOO.O
4,420
2,902
ll8
89
690
2,459
98
19.9
43 . 3
50 . 5
19.9
3.0
56.7
54.9
46.4
41.6 62 . 8
21.3
27.5
64.4
44.7
1 . 24
7.23
1.53
1.31
22.07
2.63
1.95
l . 50
2.58
2.79
ll.57
5.83
1 . 07
3.64
Total (Weighted Average) 68,261 (62 8)d 39 346 (57 2) (1 73) 82,585 (57.5)d 41,250 (50.8) (2.00)
Source .' Investment Comrnission, Taiwan, A Survey Report on Foreign Direct Investment in Taiwan for 1982. a: Investment Commission Survey Date for 1978 as cited in Wu, et al b : Investment Commission Survey Data for 1979 as cited in Liu, et al c : Other manufacturing. d: Weighted average ofall manufacturing.
. (1980), p. 124.
. (1983), p. Ill.
(1) Imported inputs (raw materials, parts, and components) accounts for an (weighted)
average 57.2~~ ofinput purchases by American firms but only 50.8~ for Japanese firms. The
Japanese ratio was slightly lower (46.4~~ than the American one (49.8~) in 1981 and both
ratios were almost equal in 1979 and 1980 (about 47.5~; and 50.0~~ respectively). [1979-1981
ratios are from Liu, et al. (1983), pp. 153-154.] This is surprising in view of the fact that
Japanese firms are often crlticised for purchasing "too many" foreign (especially Japanese) in puts.
(2) Using a weighted average of export/sales ratlos we see that the American ratio
ranged between 59.7~~ and 68.0~~ in the 1974-1978 period with the 1978 ratio being 62.8~(-
[See Wu, et al., p. 124.] The Japanese ratio was 57.5~ in 1979 and 56.9~~ in 1980. [See
Liu, et al., p. 1 1 1.] While not directly comparable we see that Japanese ratios have probably
tended to be slightly lower than American ones and surmise that this pattern has not change
1985] JAPANESE AND AMERICAN DIRECT INVESTMENT IN ASIA 25
much since.
(3) The 1982 X/M ratio was 1.73 for American firms and 2.00 for Japanese frms. The
American ratios were 1.68, 1.37, and 1.66 while Japanese ratios were 1.97, 1.85, and 2.02 for
1979, 1980, and 1981 respectively;4 Thus, both types of DFI would seem to result in im-
provements in the trade balance with the Japanese contribution slightly larger here.
(4) "Food and beverages" is an interesting example where American firms import a large portion of inputs (55.6~~) and export virtually nothing while the pattern is reversed for
the Japanese firms in that industry. This refiects the fact that American DFI in this sector
is dominated by MNC-type DFI such as Coca-Cola whereas Japanese DFI in this sector is the
offshore sourcing type of DFI.
(5) Another interesting example is the "electronic and electric appliances" sector where
American and Japanese firms compete fiercely with each other. Here American firms im-
port 74.5~~ of their inputs while the Japanese import only 54.9~ of theirs and export/sales
ratios are very high for American firms (92.8~O but moderate for Japanese firms (51,1~~-
Here we can see the "international division of the production process" at work in the Ameri-
can firms. Yet, X/M ratios are lower in American firms (1.40 versus 1.95) in this industry.
(6) Another example where the "international division of the production process" is
observed is "textiles." Here American firms procure 71.7~ of their inputs abroad and 96.7~~ of their sales are exports. Corresponding figures for Japanese firms are 41.6~ and
81.1~~ respectively. X/M ratios are 2.00 for American firms and 2.58 for Japanese firms.
Econometric Analysis
In that the theoretical framework constructed above allows one to view trade flows as a
function of DFI, it should be possible to econometrically estimate a coefficient which reveals
the impact of a DFI flow on trade flows. The primary advantage of this approach is that
all indirect impacts of DFI on trade, as well as the direct impacts which are measured in
survey data, will be accounted for in the estimation. In other words, survey data usually
measures only the direct exports and imports of foreign firmsl5 but this measurement alone is
incomplete as DFI indirectly affects trade through its transfer of technology to loca] firms, its
stimulation of increased (or possibly decreased) competition, and complex input-output rela-
tionships.
Here it is possible to specify two types of trade functions, multilateral or bilateral. In
this section we limit ourselves to bilateral trade functions where trade with country A is viewed
as a function of DFI from the country. The assumption underlying this specification is that
trade with country A depends only on DFI from that country. This assumption provides an interesting starting point for analysis although it should be stressed that there are several
problems with this approach which lead to qualifications on the estimated coefficients as will
be seen below. Thus, the estimations described below should be viewed as initial trials.
Formally, the functions to be estimated are as follows:
(23) Iog (e) (XJ) =constant+(xJ) Iog (e) (IJ_D
(24) Iog (e) (MJ)=constant+(mJ) Iog (e) (IJ_1)
*4 1979-1981 ratios were calculated using export figures from the 1982 Investment Commission survey and import figures from Liu, et al., pp. 153-154.
1* The Taiwanese survey identifies some "indirect" exports although these are defined as "direct" exports in this context.

26 HITOTSUBASHI JOURNAL OF EcoNoMlcs [June (25) Iog (e) (XA)=constant+(xA) Iog (e) (IA_1)
(26) Iog (e) (MA)=constant+(mA) Iog (e) (IA_1)
where XJ =host country exports to Japan
MJ = host country imports from Japan
XA = host country exports to the US
MA=host country imports from the US
IJ =Japanese DFI IA =American DFI - I =a time subscript indicating year t-1 ; no subscript indicates year t (this is omitted in
the Thai case.)
xJ,,11J,xA,mA=coefficients to be estimated; as this is a double log function these are
elasticities of the relevant trade flow with respect to the relevant DFI
flow (superscripts are used to indicate the country involved in the test;
T=Taiwan. P=Philippines, K=Korea, and Th=Thailand)
The results of ordinary least square estimations are shown in Table 10 for four coun-
tries, Taiwan, the Philippines, Korea, and Thailand.16 Here it should be noted that a single
term, one year lag of the independent variable was utilised in the first three countries because
estimations are based on DFI approval data. Due to the lag between the time of approval
and actual investment such a lag was hypothesised to exist. In the Thai case this is not
done, however, because actual (net) inflow data was used in the estimation.
In evaluating the impact of DFI on the balance of trade it is useful to compare XJ and
mJ and XA and mA. If the export elasticity is larger then it can be concluded that the DFI
flow in question leads to an improvement in the balance of trade while the opposite can be
concluded if the import elasticity is larger.
(1) In Taiwan we see that XJ>mJ and XA >mA ; thus, both Japanese and American DFI
lead to an improvement in the trade balance.
(2) In the Philippines we observed the opposite phenomenon; here XJ<mJ and XA <mA.
Thus, both types of DFI Iead to deterioration of the trade balance.
(3) In Korea and Thailand we see that XJ>mJ in both countries. We also observe XA > mA in both countries but XA and mA are not significantly different from O (at the 5~~ Ievel).
Thus, Japanese DFI Ieads to an improvement of the trade balances in these countries and
American DFI appears to have no impact on theml7 at the 5~; significance level.
Thus, we can see that Japanese DFI has worked to improve trade balances in three coun-
tries and to deteriorate it in one. On the other hand, American DFI has stimulated improve-
ment in one country and deterioration in one with effects in two others not statistically sig-
nificant. This lack of impact on trade may reflect the fact that American influence is more
limited in Thailand and Korea than in the other two countries or it may be a result of smaller
degree of trade orientation than observed in the case of Japanese DFI.
However, before turning to analysis of trade orientation two qualifications should be
*' The econometric approach toward evaluating the impact of DFI on trade and output (see the next sub-section) should be further developed. I am grateful to Eric Ramstetter, visiting Ph.D. candidate from the University of Colorado, Boulder, who col]ected statistical data and performed the estimations.
*' It is interesting to note the Thai case here; Thailand's balance of trade deficit with Japan is significant
and has been growing during this period. Yet, the above estimates suggest that Japanese DFI has not been a cause of this phenomenon ; rather it has worked to improve the trade balance.

1985] JAPANESE AND AMERICAN DIREcr INvrsTMENT IN
TABLE lO. DFI-TRADE FUNCTIONS
ASIA 27
Taiwan: 1967-1982 with one year lag
(1) Ioge X]=3.61478+0.90561 Ioge IJ_1 (4,91245)** (4.04748)**
(2) Iog e M!=4'68747+0.85991 Iog e IJ_l (7.96980)*t (4.80829)**
(3) Iog e XA=2.88683+1.21451 Ioge IA_l (2.12603) (3.44057)**
(4) Iog e MA=3.10234+1.04362 Iog e IA_l (2.52793)* (3.27112)**
Philippines: 1969-1981 with one year lag
(5) Iog e X]=6.12523+0.22678 Iog e IJ_l (47.5594)** (4.32451)**
(6) Iog e MJ=6.18550+0.29155 IogelJ_l (49.2024)** (5.69565)**
(7) IogeXA=4.75456+0.62726 Iog e IA_1 (6.20296)** (2.57044)*
(8) Iog e MA=4.32450+0.74031 Iog e IA_l (5.04792)** (2.71377)*
Korea: 1966-1981 with one year lag
(9) Iog e X!=3'91729+0.76521 Iog e IJ_1 (6.28810)** (4.49348)**
(lO) Iog e MJ=5.72982+0.51632 Iog e IJ_i (12.2723)** (4.05207)**
(11) IogeXA=5.22836+0.61110 Iog e IA_1 (4.47172)** (1.50705)
(12) IogeMA=5.62881+0.53808 Iogel4_l (6.53993)** (1.80265)
Thailand: 1966-1982 with no lag
(13) Ioge XJ=3.07245+0.95608 Iage I! (4.33709)** (4.23475)**
(14) Iog e MJ=4.19326+0.83908 Iog e l/ (7.63741)** (4.79529)**
(15) Iog e XA=3.29310+0.65463 IogelA (2.69716)* (1.78778)
(16) Iog e MA=4.224J)5+0.55038 Iog e IA (4.28698)** (1.86251)
** statistically significant at 1~ Ievel.
* statistically significant at 5~( Ievel. (for DW:
R2 0.50629
0.59590
0.41945
0.39272
0.59598
0.72376
0.31846
0.34657
0.5613
0.5069
0.078 l
O. 1 304
O*51466
O.57889
O. 1 2069
0,13368
F 16.3821**
23.1197**
l I . 8374* *
10.7002**
18.7013**
32.4403**
6.60714*
7.36453*
20.191
16.419
2.271
3 . 249
17.9331**
22.9948**
3.19614
3.46894
DW 1 . 1 328
1.1602
0.4951*
0.4284*
1.4101
1.3599
1 . I 040
0.9898*
O. 5052*
O.3514*
0.4147*
0.4284*
l . 1 723
l .0929*
0.3209*
O.3539*
DW~dl or DW~~4-dl at 5~~.)
noted. First of all, it is clear that these are not normal trade functions in that price and in-
come variables usually present are not included. If possible extensions to include such
variables (among other possibilities) should be considered. Secondly, exclusion of American
(and other) DFI from the Japanese trade functions and exclusion of Japanese (and other)
DFI from the American trade functions may have led to an omitted variable problem and resulted in biased coefficients. This problem seems particularly relevant in the Philippine and
Taiwanese cases where Japanese firm exports to the US are significant and may explain why
the American coefficients are larger than the Japanese ones,18
*8 In addition, several equations exhibit frst order autocorrelation and the loss of efficiency may be re-
sponsible for the insignificant coefficients on American DFI in Thailand and Korea. This problem is closely related to the specification of the lag structure used and further work in this area is necessary as well.
28 HITOTSUBASHI JOURNAL OF ECONOMICS [ June
V.3. Effects on Trade Orientation
In the previous section we were concerned with the effects of DFI on the balance of
trade. One indicator used to analyse this effect was the (multilateral or bilateral) X/M ratios
of foreign firms in a given host country and another was whether the export elasticity of DFI
was greater than or less than the import elasticity. In this section the focus is on trade orienta-
tion or trade creation due to DFI. We shall first reinterpret the results ofthe previous section
in this light and then attempt to clarify the concept involved with a theoretical explanation of
what is meant by trade orientation.
Empirical Results Reinterpreted
As in the previous section we have two tools, foreign firm survey data and econome-
trically estimated elasticities, with which to evaluate the trade orientation of DFI. With
regard to the former, the focus shifts from various X/M ratios to export/sales and imported
input/total input ratios. Here it must be emphasised that both ratios should be used if the
goal is to evaluate overall trade orientation. Larger ratios indicate a greater degree of ex-
port and import orientation of the DFI involved respectively. However, as these ratios
always vary between O and l, it is impossible to distinguish between anti-export (or anti-
import) oriented DFI and export (or import) oriented DFI using this tool. Furthermore,
adding these ratios is not meaningful and this fact means that these ratios cannot be added
to construct a meaningful index of overall trade orientation. However, these ratios are use-
ful in comparing the export and import orientation of two types of DFI and thus shed light
on the relative trade orientation of the types of DFI involved.
Using the Japanese data given in Table 8 this kind of comparison is impossible. Using
the Taiwanese data given in Table 9 we can analyse American and Japanese import orienta-
tion in 1982 but analysis of export orientation is impossible. However, there are several
other studies giving information which can be used to compare the sales and input purchase
practices of American and Japanese firms in Taiwan and the most recent information was
noted in section V.2 above. It will be recalled that export/sales ratios were consistently higher
(though byasmall margin inmostcases)forAmericanfirms. Unfortunately, we must compare ratios from different years. Imported input/total input ratios were almost equal in 1979 and
1980 while the Japanese ratio was slightly hjgher in 1981 and somewhat lower in 1982.
Thus, American DFI appears slightly more export oriented here (although the difference ob-
served is quite small in most cases) and no consistent difference in import orientation emerges.
Looking at the econometric analyses we can compare the sizes of XJ+mJ and XA +mA to get another indication of trade orientation. Furthermore, these elasticities can be nega-
tive;ifthis is the case then DFI can be identified as anti-trade oriented. In fact all elasticities
were positive or not different from O at the 5~~ Ievel.
In the Philippines and Taiwan both xA>xJ and mA>mJ are observed. Thus, American DFI appears more trade oriented and this may be a result of America's strong ties with
these economies. However, as pointed out above, the failure to account for trade with the
US by Japanese firms may have led to an overestimate of XA and mA in these cases.
In Korea and Thailand the reverse was true; xJ>xA and mJ>mA Were observed. In addition the estimates of XA and mA Were statistically insignificant at the 5~~ Ievel. This
indicates that Japanese DFI was more trade oriented in these countries.
1985] JAPANESE AND AMERICAN DIRECT INVESTMENT IN ASIA 29
The Concept of Trade Oriented DFI Revisited
Here it seems desirable to review the concept of trade oriented DFI and possible ways
of measuring it empirically as the concept does not appear to be well understood yet. First
of all, it must be stressed that this is dynamic concept dealing with the gains from trade over
time which result from a given investment. Trade oriented investment is that investment
which results in the outward movement of a country's production possibility frontier and a
subsequent increase in the production of good in which the country has a comparative ad-
vantage in relation to the investing country.19 The international price ratio is given and it
is assumed that there are no permanent tariffs or other protective measures although transi-
tional ones may be necessary in the case of infant industries.
Two types of trade-oriented DFI can be considered here; investment in a sector in which
a comparative advantage already exists or investment in a "promising infant industry" in
which the country is likely to develop a comparative advantage in the future. It is this latter
case which is of particular interest in the context of developed country DFI in a developing
country. In contrast, "anti-trade oriented DFI" or "DFI dumping" are phrases referring to investment in "faulty" infant industries in this context; these are industries which require
permanent trade protection for survival.
To measure the degree to which DFI is trade oriented it is useful to distinguish between
import-substitution and export-expansion stage of economic development. The promising
infant industry grows successfully from the first to the second stage. In the following AX
and AM stand for incremental change in exports and imports of the host country respectively.
(1) In the import substitution stage, production, Yq, of industry q increases as a result
of DFI. Mq, imports of the good involved, are assumed to remain at O but M., imports of inputs required in the industry increase. Xq, exports of the good are non-existent at this
stage. In other words, AYq>0, AMq=0, AM.>0, and AXq=0. Consequently, the change in the value of total imports is positive
(27) AM=AM.>0 and the change in the value of total trade is also positive.
(28) AX+AM=AM.>0 Therefore, this is trade oriented DFI despite the fact that the effect on the trade balance is
definitely negative.
(29) AX-AM= -AM.<0 Thus, in the import substitution stage, the effects of trade oriented DFI on overall trade
volumes are positive (This is trade creation.) and the effects on the balance of trade are clearly
negative. Furthermore, the sales of the firm involved are directed entirely to the domestic
market.ao Therefore, it may be more relevant to analyse the contribution of DFI to output
of the industry involved or of the entire economy in this context.
19 This type of DFI is illustrated diagramatically and explained in Kojima and Ozawa (1984) ; see figure 2 and relevant explanations.
ro Japanese firms in Indonesia, Thailand, and other countries are often condemned for being involved mainly in import substituting manufacturing industries. Consequently. DFI is never "export creating" for the host countries at this stage of development. On the other hand, Japanese exports of inputs to such countries may grow rapidly leading to further criticism.

30 HrroTSUBASHI JOURNAL OF ECONOMICS [June (2) As the industry in question matures output increases, AYq>0, exports begin AXq>0,
imports of the good are non-existent, AMq=0 and imports of inputs continue to increase,
AM.>0. Thus trade volume increases.
(30) AX+AM=AXq+AM.>0 However, the change in the trade balance is ambiguous as the sizes of export and import
increases are not clear.
(31) AX-AM=AXq-AM. Consequently, even in the export expansion stage, it is not clear whether DFI Ieads to an
improvement in the trade balance. Yet, our analysis above suggests that Japanese DFI
did lead to improvements in the blance of trade as it matured.
(3) Special attention must be paid to the effects of DFI on the production of inter-
mediate goods. DFI in an intermediate good industry can lead to increases in production
of the intermediate good. Y., and reduction of similar imports, M.. Yet, this DFI may be trade oriented21 if the host country has a comparative advantage in the production of this
intermediate good in that the availability of cheaper and/or better inputs can lead strengthen
comparative advantage in a final good sector where expanded production is stimulated. In
this way exports could possibly expand more than otherwise.
Assume that
(32) AXq=AM.+AY.+AWq where Wq is wages (and other primary factor payments) earned in final good industry q.
Now suppose wages are constant, final good exports increase, input imports decline or remain
constant and that input production increases. Then
(33) AX+AM=AXq+AM. is ambiguous unless input imports remain constant. In thls case this type of DFI is clearly
trade oriented. Finally, the effect of this type of DFI on the balance of trade is clearly
favourable.
(34) AX-AM=AXq-AM.>0. Here it should be pointed out that greater economic growth results the smaller the in-
crease in imported inputs. M., and the greater the increase in exported output. Consequently,
expansion of exports through increased domestic production of inputs, Y., and increases in
value added. Wq, is more desirable than expansion of exports relying on large increases in
imports of inputs, M.. Here we see that greater trade orientation, AX+AM>0, may not
always lead to greater increases in total output. Consequently, here again, measuring
effects on total output AY, is more relevant.
In fact DFI in areas where the "international division of the production process" is
observed often leads to heavy dependency on imported inputs and very high export/sales
ratios. This is often observed in export processing zones (EPZs). Consequently, it takes
21 In Hong Kong a Japanese frm established a large spinning mill (whereas no American frm did). As the output was sold on the domestic market Japanese DFI was condemned as being more domestic market oriented in this respect. However, such DFI may well have been trade-oriented for the reason described
here. See Lim and Mok (1983).

1985] JAPANESE AND AMERICAN DIRECT INVESTMENT IN ASIA 3 1
as much as a 3~~ increase in exports to generate a l~~ increase in GNP. It seems necessary
to reexamine the promotion of this type of DFI and export led growth strategies in this
respect. The focus should be shifted to promoting DFI which results in greater increases in
value added and local inputs. An important element of this process is the promotion of
intermediate good production, either through DFI or domestic investment policies. How-
ever, to repeat, only promising infant industries of this type should be promoted and care
must be taken to insure that such investment projects are economically competitive and
careful cost-benefit analyses of individual projects are crucial in this respect.
To sum up we emphasise the following points. First of all, if DFI stimulates increases
in exports, AX>0, directly or indirectly, it is trade oriented or trade creating. Secondly,
even if DFI results in increases of input imports, AM>0, it is still trade oriented, despite the
fact that such imports may lead to a deterioration of the trade balance. Thirdly, the sum of
DFI-trade elasticities, XJ +mJ or XA +mA, indicates the degree of trade orientation.22 Lastly,
however, it should be reemphasised that greater trade orientation does not necessarily result
in a greater contribution of DFI to the development of the host country. Thus, we now turn
to econometric analysis of DFI's contribution to GNP.
V.4. DFI's Contribution to GNP
DFI contributes to increases in the GNP of host countries in several ways. First of all,
a gross or net contribution to domestic capital formation may result and thus affect growth.
In addition, there are many qualitative effects; examples are the stimulation of new industries,
stimulation of structural changes in output, stimulation of productivity increases, technology
transfer, and export expansion. These factors all represent potential contributions of DFI
which would be non-existent in a hypothetical case where DFI did not occur, Unfortunately,
we cannot evaluate the hypothetical case of no DFI and this makes evaluation of DFI's con-
tribution somewhat difficult. However, we can compare the contributions of American and Japanese DFI in a certain country.
Here again one can focus on the impact of DFI on changes in output structure to view
GNP as a function of DFI. In other words, changes in output levels result from changes in
output structure induced by DFI in a manner similar to the way in which changes in trade
structure and levels result. Thus, the following function is specified and estimated by
ordinary least squares for Taiwan, the Philippines, Korea, and Thailand. Here again the
one year lag is omitted in the Thai case.
(35) Iog (e) (GNP)=constant+(yA) Iog (e) (IA_D+(yJ) Iog (e) (IJ_1)
Here again this exercise is intended, as an initial trial and the results are subject to the
same qualifications as the trade functions estimated earlier. Furthermore, comparisons of
coefficients estimated for different host countries are thought to be meaningless as there are
marked differences in economic structures of the countries involved which are likely to be
reflected in the estimates.
It is anticipated that the per unit contribution of Japanese DFI (as represented by its
2' The export/total sales ratio and the imported input/total input ratio can viewed as limited proxies for these elasticities. However, information contained in these ratios is quite different and they cannot be added
to get an indicator of overall trade orientation.
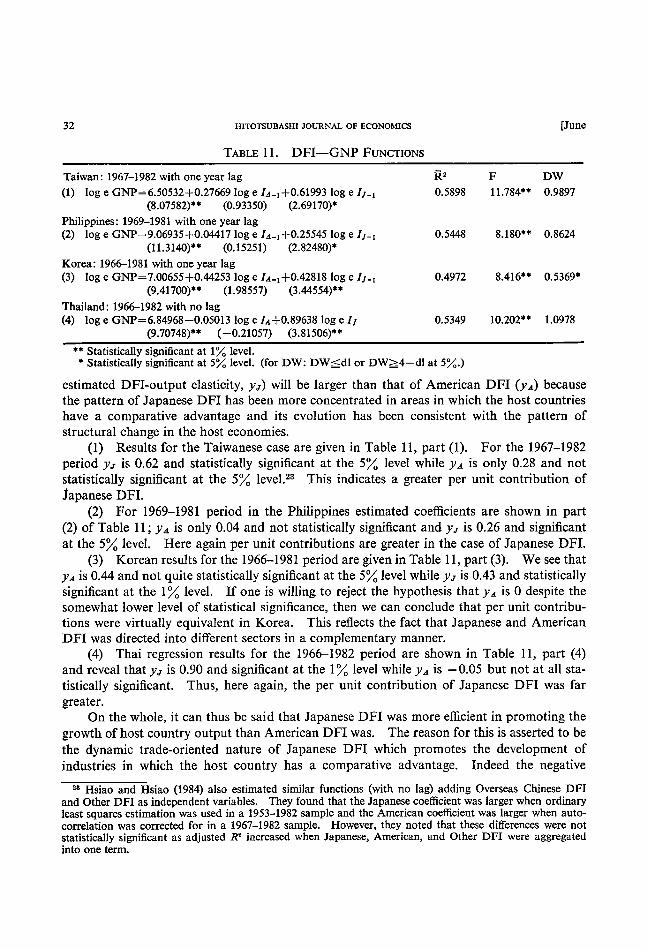
32 HITOTSUBASHI JOURNAL OF ECoNOMlcs
TABLE 1 1 . DFI-GNP FUNCTIONS
Taiwan : 1967-1982 with one year lag
(1) Ioge GNP=6.50532+0.27669 Ioge 14_1+0.61993 Iogel!-l (8.07582)*' (O 93350) (2 69170)$
Philippines: 1969-1981 with one year lag
(2) Iog e GNP=9.06935+0.04417 Iog e IA_1+0'25545 Iog e IJ_l
(11.3140)** (O 15251) (2 82480)
Korea: 1966-1981 with one year lag
(3) Iog e GNP=7.00655+0.44253 Iog e IA_1+0'42818 Iog e I!-1
(9.41700)$* (1 98557) (3 44554)$$
Thailand: 1966L1982 with no lag
(4) Iog e GNP=6.84968-0.05013 Iog e IA+0.89638 Iog e IJ (9.70748) ** ( -0.21 057) (3 8 1 506)* *
[ June
F
0.5898 11.784** 0.9897
o. 5448 8. 1 80* * O. 8624
0.4972 8.416** 0.5369$
0.5349 l0.202** 1.0978
** Statistically significant at 15~ Ievel.
* Statistically significant at 5~~ Ievel. (for DW: DW~dl or DW~4-dl at 5~.)
estimated DFI-output elasticity, yJ) will be larger than that of American DFI (yA) because
the pattern of Japanese DFI has been more concentrated in areas in which the host countries
have a comparative advantage and its evolution has been consistent with the pattern of
structural change in the host economies.
(1) Results for the Taiwanese case are given in Table I l, part (1). For the 1967-1982
period yJ is 0.62 and statistically significant at the 5~ Ievel while yA is only 0.28 and not
statisticahy significant at the 5~ Ievel.23 This indicates a greater per unit contribution of
Japanese DFI.
(2) For 1969-1981 period in the Philippines estimated coefficients are shown in part
(2) of Table I I ; yA is only 0.04 and not statistically significant and yJ is 0.26 and significant
at the 5~ Ievel. Here again per unit contributions are greater in the case of Japanese DFI.
(3) Korean results for the 1966-1981 period are given in Table 1 1, part (3). We see that
yA is 0.44 and not quite statistically significant at the 5~~ Ievel while yJ is 0.43 and statistically
significant at the 1~ Ievel. If one is willing to reject the hypothesis that yA is O despite the
somewhat lower level of statistical significance, then we can conclude that per unit contribu-
tions were virtually equivalent in Korea. This reflects the fact that Japanese and American
DFI was directed into different sectors in a complementary manner.
(4) Thai regression results for the 1966-1982 period are shown in Table I l, part (4)
and reveal that yJ is 0.90 and significant at the 1~~ level while yA is -0.05 but not at all sta-
tistically significant. Thus, here again, the per unit contribution of Japanese DFI was far
greater.
On the whole, it can thus be sai d that Japanese DFI was more efiicient in promoting the
growth ofhost country output than American DFI was. The reason for this is asserted to be
the dynamic trade-oriented nature of Japanese DFI which promotes the development of industries in which the host country has a comparative advantage. Indeed the negative
28 Hsiao and Hsiao (1984) also estimated similar functions (with no lag) adding Overseas Chinese DFI and Other DFI as independent variables. They found that the Japanese coefflcient was larger when ordinary least squares estimation was used in a 1953-1982 sample and the American coefficient was larger when auto-correlation was corrected for in a 1967-1982 sample. However, they noted that these differences were not statistically significant as adjusted R' increased when Japanese. American, and Other DFI were aggregated
into one term.

19851 JAPANrsE AND AMERICAN DIRJ3CT INVESTMENT IN ASIA 33
coefficient in Thailand could be an indication of anti-trade orientation on the part of American
DFI in that country. However, it is clear that, with the possible exception of Korea, the con-
tribution of American DFI to host country GNP has not been statistically significant. This
is a likely result of MNC-type DFI which can lead to disregard of comparative advantage
and the macroeconomic impacts of DFI.
VI. Conclusion
In this paper two facts of importance are highlighted. First of all, it is shown that the
patterns of Japanese and American DFI are quite different and that these differences can be
largely explained by differences in the behaviour of American and Japanese frms. The micro-
economic interests of MNCS dominate America's DFI and as a result macroeconomic im-pacts, such as the impact of DFI on pattems of comparative advantage, are largely ignored.
On the other hand, the pattern of Japanese DFI has been characterised as the "trade oriented
type" in which macroeconomic impacts, such as the impact on patterns of comparative ad-
vantage, have been considered either explicitly or implicitly. As a result Japanese DFI
differs considerably between countries and over time.
Secondly, we have seen that Japanese DFI has contributed to the development of host
countries with more efficiency than American DFI has in most cases. Here our analysis
was limited to impacts on trade and GNP and thus more comprehensive analysis is desirable
in this respect.
Furthermore, we have limited ourselves to investigation of impacts of developed country
(Japan and U.S.) DFI in developing countries in Asia. There is reason to believe that a
change in the sample, for example investigation of DFI among developed countries, would
lead to consideration of different issues and mandate the development of new theoretical tools.
It is thus our next task to tackle such issues.
EMERITUS PROFESSOR OF HITOTSUBASHI UNIVERSITY AND
INTERNATIONAL CHRISTIAN UNIVERSITY
REFERENCES
American Chamber of Commerce in Manila (1982). American National Corporations in Sec-
Business Day Top 1.000 by Sector. Nationality and Percentage ofForeign Equity.
Arndt, H. W. (1974), "Professor Kojima on the Macroeconomics of Foreign Direct Invest-
ment," Hitotsubas/1i Journal ofEconomics 15, (no. 1, June).
Buckley, Peter J. (1983), "Macroeconomic versus International Business Approach to Direct
Foreign Investment: A Comment on Professor Kojima's Interpretation," Hitotsubashi
Journa/ ofEconomics 24, (no. l, June). .
Dunnmg John H (1980) "A Note on Intra mdustry Foreign Drrect Investment," Banca Nazionale del Lavoro ~uarterly Review (December).
Fong, Pang Eng (1982), "Foreign Indirect Investment in Singapore," mimeo, OECD De-velopment Centre, Paris (January).

34 HITOTSUBASHI JOURNAL OF EcoNoMlcs [June Hong Kong, Industry Department (1982), "Overseas Investment in Hong Kong's Manufactur-
ing Industry, 1981."
Hoffman, Lutz & Ee, Tan Siew (1980), Industria/ Growth, Employment and Foreign Investment
in Peninsular Malaysia, Kuala Lumper: Oxford University Press.
Hsiao, Frank S. T. & Mei-chu, W. (1984), "Direct Foreign Investment and Economic Devel-
opment-The Taiwanese Experience," mimeo, (August). Indonesia, Badan Koordinasi Penanaman Madel (The Investment Coordinating Board),
A Guide for Investors 1983, Jakarta.
JETRO, Manila, A Survey of Japanese Firms in the Philippines 1981. Kojima, Kiyoshi (1970), "Structure of Comparative Advantage in Industrial Countries: A
Verification of the Factor-Proportions Theorem," Hitotsubashi Journal of Economics
11, (no. l, June).
Kojima, Kiyoshi (1973). "A Macroeconomic Approach to Foreign Direct Investment," Hitotsubashi Journal of Economics 14, (no. I , June).
Kojima, Kiyoshi (1978), Direct Foreign Investment.' A Japanese Model of Multinational Busi-
ness Operations, Croom Helm, London. Kojima, Kiyoshi (1982), "Macroeconomic versus International Business Approach to Direct
Foreign Investment," Hitotsubashi Journal oj'Economics 23, (no. l, June).
Kojima, Kiyoshi & Ozawa, Terutomo (1984), "Micro- and Macro-economic Models of Direct Foreign Investment: Toward a Synthesis," Hitotsubashi Journa/ of Economics
25, (no. 1, June).
Kojima, Kiyoshi (1985), Nihon-no Kaigai Chokusetsu To-shi (Japanese Direct Investment
Abroad: An Economic Analysis), (in Japanese), Bunshindo, Tokyo. Koo, Bohn-Young (1982), "Status and Changing Forms of Foreign Investment in Korea,"
(March) OECD Development Centre. Paris, pp. 15-19. Koo, Bohn-Young (1 983), "Role of Foreign Direct Investment in Korea's Economic Growth,"
(September) Presented at International Forum on Trade Promotion and Industrial Ad-
justment, Seoul, Korea, pp. 6-15.
Lee, Chung H. (1980a), "United States and Japanese Direct Investment in Korea: A Com-
parative Study," Hitotsubaslli Journal ofEconomics 20, (no. 2, February).
Lee, Chung H. (1980b), "Direct Foreign Investment and Its Economic Effects : A Review,"
Journal ofEconomic Development 5, (no. 2, December).
Lee, Chung H. (1983), "International Production of United States and Japan in Korean Manufacturing Industries: A Comparative Study," Weltwirtscllaftliches Archiv, Band
119. Heft 4.
Lee, Chung H. (1984a), "Transfer of Technology from Japan and the United States to Korean
Manufacturing Industries : A Comparative Study," Hitotsubashi Journal of Economics
25, (no. 2, December). Lee, Chung H. (1984b), "On Japanese Macroeconomic Theories of Direct Foreign Invest-
ment," Economic Development and Cultural Change 32, (no. 4, July).
Lim, Chee Pong & Ping, Lee Poh (1979), Japanese Direct Investment in Malaysia, Tokyo,
Institute of Developing Economies. Lin, Tzong-biau & Mok Vrctor (1983) "Trade Forelgn Investment and Development m
Hong Kong," mimeo, (January). Linsey, Charles W. & Valencia, Ernesto M. (1982), "Foreign Direct Investment in the Philip-
19851 JAPANEsE AND AMI…1uc^N DlRl…cT INvI…sτM1…NT lN^s1^ 35
pines:A Review ofthe Literature,”PIDS Working Paper.
Liu,T.Y.&Chjen,C.C.with Chang,P.W.,Chua㎎,C.J.&Chiu,J.H.(1983),凧θ助伽
qブJαμηωε1洲ε∫舳ε〃o〃肋θWα〃o〃α1及o〃o閉γ,Taipei,Taiwan Institute of Economic
Research,(in Chinese)。
MacDouga1l,G.D.A.(1951),“British and American Export:A Study Suggested by the
Theory of Comparative Cost,”Z加肋o〃o〃c.1o〃閉α161,(no.244,December).
Mason,R.Ha1(1980),“A Comment on Pro胎ssor K句ima’s‘Japanese Type versus American
Type of Technology Trans胎r’,”∬〃o1〃ゐ伽〃■o〃〃α1ρ/万co〃o柳た320,(no.2,Febmary).
MITI(1983),∠Co仰肥加〃∫加ε8〃昭γo〃〃ρ伽εκ〃肥α肋昭3’〃2〃〃〃o〃,(in Japanese:
Kaigai Toshi Tokei So-ran-Dai-ikai Kaigai Jigyo Katsudo Kihon Chosa),Toyo
Hohki Shuppan,Tokyo.Oman,Charles(1984),W〃月07㎜∫gグ1〃θ閉α〃o〃α〃〃ソ23肋θ〃加1)θソε1op肋g Co〃〃〃ω,Deve1-
opment Centre Studies,0ECD,Paris.
Park,Chin Keun(1978),“E価ects of the Japanese Direct Investment on Emp1oyment,Labor
Prod1』ctivity and Labor Income in the De▽eloping Host Economy with Special Re胎rence
to The Case ofKorea,”CAMS,Discussion Paper Series,(no.78_15,August).
Py㎜,C.S.(1984),“An Integration of the Kojima Hypothesis with a Multinationa1Invest-
ment Model,”mimeo,Menphjs State University(July).
Ranis,Gustav&Scl■ive,Chi(1982),“Direct Foreign Investment in Taiwan’s Development,”
mimeo,(D㏄ember).
Singapore,Economic Development Board,ノ〃舳α1地ρo〃1982/83-
Singapore,Department ofStatistics,地ρo舳o〃加α〃舳3ρグ〃励3’〃α1〃o〃αfo〃1976_1982.
Taiwan,Il1vestment Commission(1983a),αα眺〃ωo〃0比rκωC〃雌舵α〃月oκな〃1〃ω‘一
朋2〃,rεc伽たα1Cooραα〃o”,0〃wα〃1;”ソω’〃θ〃,0〃w〃♂刀θc加たα1Cooρぴα〃o〃,τ加
R%必1たψC〃〃α.
Taiwan,Investment Commission(1983b),ノ8〃ソθγR印o〃o〃月or確κ1)加α1〃ε∫伽8〃肋 τ〃wα〃,1982,(in Chinese)。
Tambunlertchai,Somsak(1977),J〃α肥κα〃■㎜ε〃c伽1〃ソε3伽θ〃3肋〃α肋〃必〃α〃〃一
伽伽晦〃舳伽一・加ε8∫舳〃ψ〃8か地肋1・ε及0・0〃CC0〃泌〃0〃0伽H03’ Co”〃rγ,Tokyo:Institute of Developing Economies.
Wert,Frank S.(1973),“A Product Cycle Model ofthe Balance ofPayments Impact ofU.S.
Based Multinationalism,”∫o凹閉o1ψ〃召閉αガo〃α1ム〃3加∫3∫〃伽∫4,(no.2,Fa1l)。
Wie,Thce Kian(1984a),“Japanese Direct Investment in Indonesian Manu胞cturing,”肋ム
1θ伽ρブ1〃o〃ε∫’α〃及o〃o〃c8伽”ω20,(no.2,August),pp.90一一106.
Wie,Thee旧an(1984b),“Japanese and American Direct Investment in Indonesian Mam-
facturi㎎Compared,”凧o〃o〃ゐ〃Kε〃α〃gα〃〃o〃3曲32,(no.1,March).
Wu,J.I.,Wa㎎,L.C.H.,Chou,T.C.,&Li,C,K。(1980),乃ε助伽ψσH舳3舳ε〃o〃
1加州o〃o〃o1及o〃o㎜γ,Taipei:Institute of American Culture,Academica Sinica,(in
Chinese).