
APPENDICESgwweb.jica.go.jp/km/FSubject1101.nsf...DEAT Japan International Cooperation Agency (JICA)...
25
The Study on Tourism Promotion and Development Plan in the Republic of South Africa Final Report Appendices APPENDICES
Transcript of APPENDICESgwweb.jica.go.jp/km/FSubject1101.nsf...DEAT Japan International Cooperation Agency (JICA)...

The Study on Tourism Promotion and Development Plan in the Republic of South Africa Final Report Appendices
APPENDICES

The Study on Tourism Promotion and Development Plan in the Republic of South Africa Final Report Appendix A
APPENDIX A Study Work Flow

The Study on Tourism Promotion and Development Plan in the Republic of South Africa Final Report Appendix A
A-1
STUDY ORGANIZATION AND MEMBERS
Study Organization
Government of South Africa Government of Japan
DEAT
Japan International Cooperation Agency
(JICA)
JICA Study Team
Advisory Committee
SATourismSteering Committee
Agreement of Scope of Work on 20 December 2000
Related Agencies and Organizations Counterpart Agency
to the Study Team
(1) Japan International Cooperation Agency (JICA)
JICA Advisory Committee:
Mr. Hiroshi TSUTSUI Leader/Tourism Promotion
Executive Director, Japan Highway Authority
Mr. Yoshimune NAKAMURA Tourism Administration and Policy
Deputy Manager, Tourism Bureau, Ministry of Land and Transport
JICA Headquarters
Mr. Toshio HIRAI Director, First Development Study Division, Social Development Study Department, JICA
Mr. Kenshiro TANAKA First Development Study Division, Social Development Study Department, JICA
JICA South Africa Office
Mr. Yoshiyuki TAKAHASHI Resident Representative of JICA South Africa Office
Mr. Koichi KITO Assistant Resident Representative of JICA South Africa Office

The Study on Tourism Promotion and Development Plan in the Republic of South Africa Final Report Appendix A
A-2
(2) Steering Committee
Members of DEAT
Mr. Patrick MATLOU Deputy Director General Department
Mr. Moeketsi MOSOLA Chief Director, Tourism Development (until July 2001)
Mr. Sugen PILLAY Director Tourism Research and Development
Mr. Baldwin NETSHIFHEFHE Assistant Director Tourism Research and Development
Mr. Mike NKOSI Assistant Director Tourism Research and Development
Ms. Kgomotso MOKGOKO Deputy Director, Tourism Communication
Ms. Philla MAGWUGZA Senior Administration Officer, Tourism and Research
Members of South African Tourism
Ms. Didi MOYLE Special Advisor: Communication Office of the Minister
Mr. Peter MKHUCHANE Manager, Marketing Service (until August 2001)
Members of Related Organizations and Private Sector
Mr. Sibusiso MDLALOSE Airport Company of South Africa
Mr. Erin HEATH University of Pretoria
Mr. Jomes SYMORE Tourism Kwazule Natal
Mr. Kamil KARRIM Southern Sun International
Mr. Sechaba NKOMO Statistic South Africa
Mr. G.Z. LANGA Human Science Research Council (HSRC) (until August 2001)
Mr. J. STRUWIG Human Science Research Council (HSRC) (until August 2001)
Ms. S’bonisile ZAMA Human Science Research Council (HSRC) (until August 2001)
Mr. Stephen RULE Human Science Research Council (HSRC) (until August 2001)
Mr. Mike FALBRICIUS Western Cape Tourism Board (until August 2001)
Mr. M. SAAYMOR Potch University (until August 2001)
Mr. Lindisizwe MAGI CRT University Zululand (from February 2002)
Ms. Tasniem PATEL Gauteng Tourism Authority (from February 2002)
Ms. Lisa GORDON-DAVIS South African Tourism Institute (from February 2002)
Mr. Eddy RUSSELL United Nations Development Programme (UNDP) (from February 2002)
The Study on Tourism Promotion and Development Plan in the Republic of South Africa Final Report Appendix A
A-3
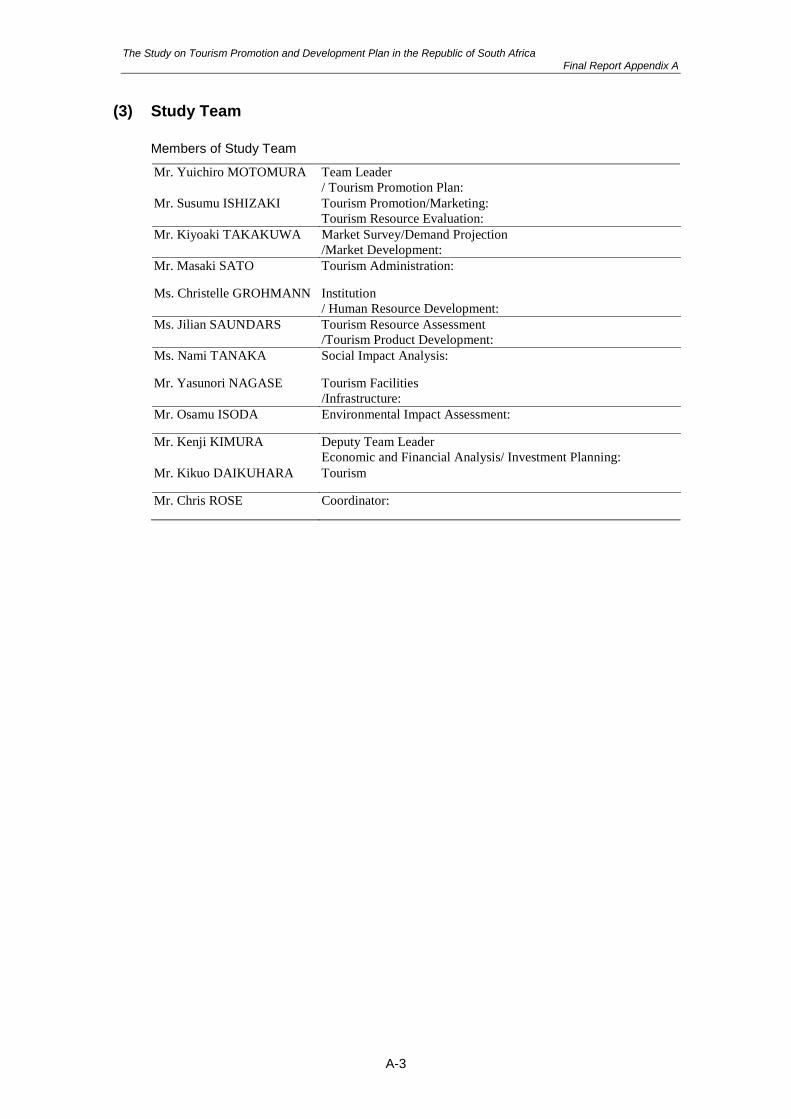
(3) Study Team
Members of Study Team
Mr. Yuichiro MOTOMURA Team Leader / Tourism Promotion Plan:
Mr. Susumu ISHIZAKI Tourism Promotion/Marketing: Tourism Resource Evaluation:
Mr. Kiyoaki TAKAKUWA Market Survey/Demand Projection /Market Development:
Mr. Masaki SATO Tourism Administration:
Ms. Christelle GROHMANN Institution / Human Resource Development:
Ms. Jilian SAUNDARS Tourism Resource Assessment /Tourism Product Development:
Ms. Nami TANAKA Social Impact Analysis:
Mr. Yasunori NAGASE Tourism Facilities /Infrastructure:
Mr. Osamu ISODA Environmental Impact Assessment:
Mr. Kenji KIMURA Deputy Team Leader Economic and Financial Analysis/ Investment Planning:
Mr. Kikuo DAIKUHARA Tourism
Mr. Chris ROSE Coordinator:
The Study on Tourism Promotion and Development Plan in the Republic of South Africa Final Report Appendix A
A-4
STUDY SCHEDULE
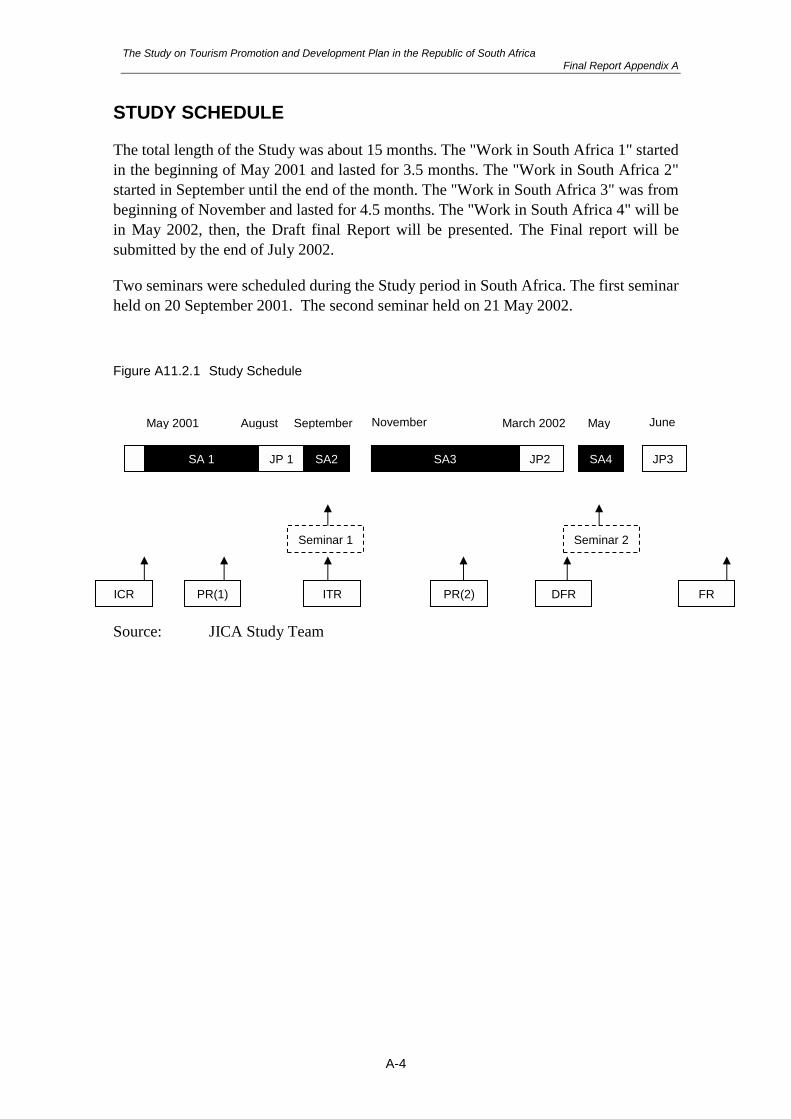
The total length of the Study was about 15 months. The "Work in South Africa 1" started in the beginning of May 2001 and lasted for 3.5 months. The "Work in South Africa 2" started in September until the end of the month. The "Work in South Africa 3" was from beginning of November and lasted for 4.5 months. The "Work in South Africa 4" will be in May 2002, then, the Draft final Report will be presented. The Final report will be submitted by the end of July 2002.
Two seminars were scheduled during the Study period in South Africa. The first seminar held on 20 September 2001. The second seminar held on 21 May 2002.
Figure A11.2.1 Study Schedule
Source: JICA Study Team
November June May 2001 September March 2002 May
SA 1 JP 1 SA3 JP2 JP3
Seminar 1 Seminar 2
FR
SA2 SA4
ITR PR(2) DFR PR(1) ICR
August

The Study on Tourism Promotion and Development in the Republic of South Africa Final Report Appendix A
A-5
2001
Study Work
S/CMeetings
Reporting
Jul Aug Sep NovOctMar Apr May Jun
Pre.Work in South Afrca 1
1
1-2 Metods &Approaches
1-3IC/R
2-1 Confirm S/C
2-2IC/R
2-3Questionnaire
5-1Formulation of the Dfor Focus Areas・Basic Policies・Tourism Demand ・Infrastructure & F・IEE・Tourism Promotio・ Human Resource・Socio-economic Im・Selection of Priori
2-4Tourism Sectors' Conditions・South African Conditions:- Socio-economic- Natural・Tourism Secotors' :- Reports & Materials- Development Plans- Adminitsrations, Policy, &Legislations- Promotion & Marketing- Resources, Facilities, &Services- Investment- Socio-economic Impacts- Infrastructure- Human Resource Dev.- Environmental Conservation- Stake Holder Analysis
4-1IT/R
2-6PR1/R
2-6PR1/R
1-1 CollectionData & Infor.
2-7 Marketing Survey 5-1 Socio-economic Impact Survey
3-1Examination of theActionPlan
3-2IT/R
2-7Assessment of TourismMarket & Selection ofFocus Areas・Tourism Market- Trend Analysis- ComplementaryMarketing Survey・Focus Areas Selection・Formation of TourismDevelopment Policy forFocus Areas
2-8Action Plan for EastAsia/Japan TouristPromotion・Basic Strategy・Promotion &Marketing Strategies
5-2SATOUR WebsiteImprovement
2-5Overall Evaluation
4-2Seminar 1
2
2002
JulyMarFebDec Jan May JunApr
Work in South Africa 3
Development Plans
ForcastFacilities
on Plan & Institution
mpactsity Projects
5-3PR2/R
6-2DF/R
7-1DF/R
7-2Seminar 2
Work inSouth Africa
Work inJapan
Sub-contructed
42
8-2F/R
5-3PR2/RPT2/R
5-4 EIA
6-1OverallEvaluation
5-4F/S of Priority Projects・Conceptual Design & CostEstimation・Implementation Program・Economic & Financial Evaluation・EIA
8-3 Video
8-1 Exam.Comments
Information Dissemination
3
The Study on Tourism Promotion and Development in the Republic of South Africa Final Report Appendix B
APPENDIX B Tourism Institutional Framework

The Study on Tourism Promotion and Development in the Republic of South Africa Final Report Appendix B
B-1
TOURISM INSTITUTIONAL FRAMEWORK
National MIPTEC:
Minister InterProvincial Technical
Committee ofOccials
Department ofEnvironmental
Affairs andTourism(DEAT)
South AfricanTourism
(SA Tourism)
TourismBusinessCouncil of
South Africa(TBCSA)
Provincial
The NationalTourismForum
ProvincialGovernment
Dept. of Tourism
ProvincialTourism
Agency(Board)
TBCSAProvincial
Co-ordinatorsCommittee
Regional
MECresponcible for
Tourism
Local LTO/
MUnicipality
LTO/MUnicipa
lity
LTO/MUnicip
ality
LTO/MUnicipa
lity
LTO/MUnicip
ality
Reoginal TourismOrganization
Reoginal TourismOrganization
Reoginal TourismOrganization
Reoginal TourismOrganization
Government Private
SA TourismMarketing
PartnershipCommitte
Other GovernmentDepartment
Marketing Committee
RTO SteeringCommittee
MINMEC:Tourism(forum of
national Ministerand MEC's

The Study on Tourism Promotion and Development in the Republic of South Africa Final Report Appendix C
APPENDIX C Map of Tourism Resources

The Study on Tourism Promotion and Development in the Republic of South Africa Final Report Appendix C
C-1
KPMG INFRASTRUCTURE STUDY – MAP OF TOURISM RESOURCES
Source: DEAT & KPMG
The Study on Tourism Promotion and Development in the Republic of South Africa Final Report Appendix D
APPENDIX D South African Marketed
Tourism Resources

The Study on Tourism Promotion and Development in the Republic of South Africa Final Report Appendix D
D-1

The Study on Tourism Promotion and Development in the Republic of South Africa Final Report Appendix D
D-2

The Study on Tourism Promotion and Development in the Republic of South Africa Final Report Appendix D
D-3
KWAZULU- EASTERN NORTERN NORTHERN NORTH WESTERN
NATAL GAUTENG FREE STATE CAPE CAPE PROVINCE WEST CAPE MPUMALANGA
Game/Wildlife 27 7 13 18 4 48 6 10 32 165Nature Attractions - Fauna & Flora 83 64 54 62 27 36 20 135 44 525Nature Attractions - Scenic 48 4 6 26 14 17 4 23 25 167Adventure 133 35 32 112 22 33 36 134 87 624Water - Sea Attractions 86 0 0 57 0 0 0 29 0 172Water - Inland Dams/Rivers Attractions 28 26 43 26 8 31 11 39 40 252Historical/Museum 80 117 83 73 51 39 49 86 33 611Cultural 14 6 1 3 0 3 8 5 7 47Arts/Crafts 16 15 16 9 7 8 4 5 11 91Shopping Attractions 9 5 1 3 0 0 0 7 0 25Beaches 30 0 0 28 0 0 0 16 0 74Entertainment 3 19 0 3 2 0 2 8 3 40Special Interest Attractions 2 2 0 1 2 4 0 5 6 22Golfing 7 2 1 1 0 0 2 2 1 16Health 1 0 0 1 0 2 1 3 0 8Wine, Drink & Food Attractions 0 1 3 11 6 3 3 260 0 287Natural/Cultural Heritage 10 8 35 8 18 8 6 4 0 97TOTAL 1144 614 541 876 304 456 298 1538 578 6349
18% 10% 9% 14% 5% 7% 5% 24% 9% 100%
TOURISM RESOURCES BY TYPE& MAJOR CATEGORY:
MATRIX 2 - SOUTH AFRICAN MARKETEDMARKETEDMARKETEDMARKETED TOURISM RESOURCES(SUMMARY)
TOTALTOTALTOTALTOTALSOUTHSOUTHSOUTHSOUTHAFRICAAFRICAAFRICAAFRICA

The Study on Tourism Promotion and Development Plan in the Republic of South Africa Final Report Appendix E
APPENDIX E Tourism Employment

The Study on Tourism Promotion and Development Plan in the Republic of South Africa Final Report Appendix E
E-1
TOURISM EMPLOYMENT
TABLES
1. Hospitality – Occupational Categories & Estimated Employee Numbers, 2000
2. Travel & Tourism Services – Occupational Categories & Estimated Employee Numbers, 2000
3. Hospitality – Management by Gender and Race
4. Travel and Tourism Services – Management by Gender and Race
5. Hospitality – Employment by Gender and Race
6. Travel and Tourism Services – Employment by Gender and Race
7. Hospitality – Employment by Race
8. Hospitality – Percentage Employed by Gender and Race per Occupational Category
9. Hospitality – Disability and Occupational Category
10. Travel and Tourism Services – Employment by Race
11. Travel and Tourism Services – Percentage Employed by Gender and Race per Occupational Category
12. Hospitality – Employment by Type of Employment
13. Travel and Tourism Services – Employment by Type of Employment
14. Hospitality – Employees with Relevant Qualifications/s
15. Travel and Tourism Services – Employees with Relevant Qualification
The Study on Tourism Promotion and Development Plan in the Republic of South Africa Final Report Appendix E
E-2
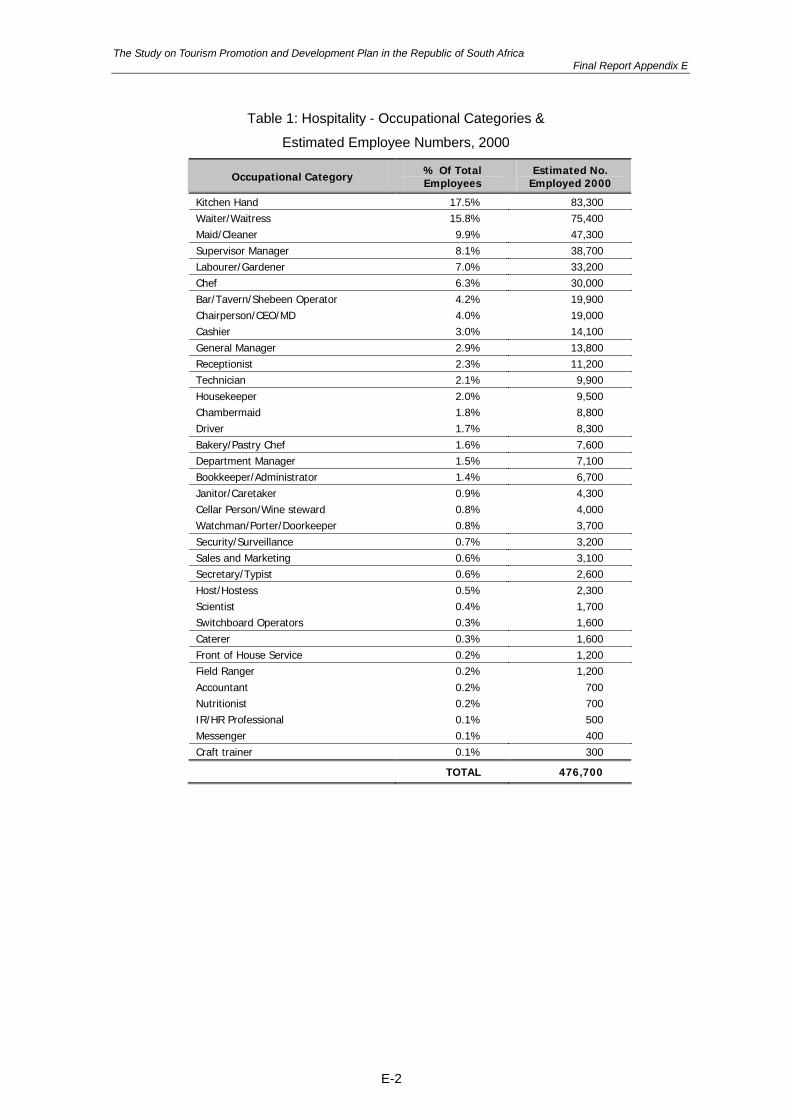
Table 1: Hospitality - Occupational Categories &
Estimated Employee Numbers, 2000
Occupational Category % Of Total Employees
Estimated No. Employed 2000
Kitchen Hand 17.5% 83,300 Waiter/Waitress 15.8% 75,400 Maid/Cleaner 9.9% 47,300 Supervisor Manager 8.1% 38,700 Labourer/Gardener 7.0% 33,200 Chef 6.3% 30,000 Bar/Tavern/Shebeen Operator 4.2% 19,900 Chairperson/CEO/MD 4.0% 19,000 Cashier 3.0% 14,100 General Manager 2.9% 13,800 Receptionist 2.3% 11,200 Technician 2.1% 9,900 Housekeeper 2.0% 9,500 Chambermaid 1.8% 8,800 Driver 1.7% 8,300 Bakery/Pastry Chef 1.6% 7,600 Department Manager 1.5% 7,100 Bookkeeper/Administrator 1.4% 6,700 Janitor/Caretaker 0.9% 4,300 Cellar Person/Wine steward 0.8% 4,000 Watchman/Porter/Doorkeeper 0.8% 3,700 Security/Surveillance 0.7% 3,200 Sales and Marketing 0.6% 3,100 Secretary/Typist 0.6% 2,600 Host/Hostess 0.5% 2,300 Scientist 0.4% 1,700 Switchboard Operators 0.3% 1,600 Caterer 0.3% 1,600 Front of House Service 0.2% 1,200 Field Ranger 0.2% 1,200 Accountant 0.2% 700 Nutritionist 0.2% 700 IR/HR Professional 0.1% 500 Messenger 0.1% 400 Craft trainer 0.1% 300
TOTAL 476,700

The Study on Tourism Promotion and Development Plan in the Republic of South Africa Final Report Appendix E
E-3
Table 2: Travel &Tourism Services - Occupational Categories &
Estimated Employee Numbers, 2000
Occupational Category % Of Total Employees Estimated No.
Employed 2000
Part-time Assistance with Functions 31.2% 12,000 Supervisor Manager 11.0% 4,200 Travel Consultant/Organiser 9.8% 3,800 Bookkeeper/Administrator 5.3% 2,100 Chairperson/CEO/MD 5.0% 1,900 General Manager 4.9% 1,900 Department Manager 3.9% 1,500 Driver 3.4% 1,300 Tour Guide 3.5% 1,300 Sales and Marketing 3.2% 1,200 Maid/Cleaner 3.2% 1,200 Technician 2.9% 1,100 Accountant 2.1% 800 Receptionist 2.0% 800 Secretary/Typist 1.6% 600 Switchboard Operators 1.5% 600 Cashier 1.0% 400 Security/Surveillance 1.1% 400 Tour Broker 1.0% 400 Public Relations 0.8% 300 IR/HR Professional 0.6% 200 Messenger 0.6% 200 Janitor/Caretaker 0.4% 100
TOTAL 38,600
Table 3: Hospitality - Management by Gender and Race
Managers by Gender and Race % of Gender % of Race % of Managers % of Total
Employees
Male Managers 17% 55% 8%
Black Managers 11% 4% 19% 3%
White Managers 6% 19% 35% 5%
Female Managers 13% 45% 7%
Black Managers 4% 3% 12% 2%
White Managers 9% 18% 33% 5%
% Managers to Total Employees 15%

The Study on Tourism Promotion and Development Plan in the Republic of South Africa Final Report Appendix E
E-4
Table 4: Travel and Tourism Services - Management by Gender and Race
Managers by Gender and Race % of Gender % of Race % of Managers % of Total
Employees
Male Managers 17% 54% 8%
Black Managers 4% 4% 13% 2%
White Managers 13% 11% 41% 6%
Female Managers 13% 46% 7%
Black Managers 6% 7% 20% 3%
White Managers 7% 7% 26% 4%
% Managers to Total Employees 15%
Table 5: Hospitality - Employment by Gender and Race
Gender/Race % of Total Employees
Females 53%
White Females 16%
Black Females 37%
Males 47%
White Males 12%
Black Males 35%
Table 6: Travel and Tourism Services - Employment by Gender and Race
Gender/Race % of Total Employees
Females 54%
White females 34%
Black females 19%
Males 46%
White males 20%
Black males 26%
Table 7: Hospitality - Employment by Race
Type of Employment by Race % of Total Employees
Black Employees 72%
Male 35%
Female 37%
White Employees 28%
Male 12%
Female 16%
The Study on Tourism Promotion and Development Plan in the Republic of South Africa Final Report Appendix E
E-5
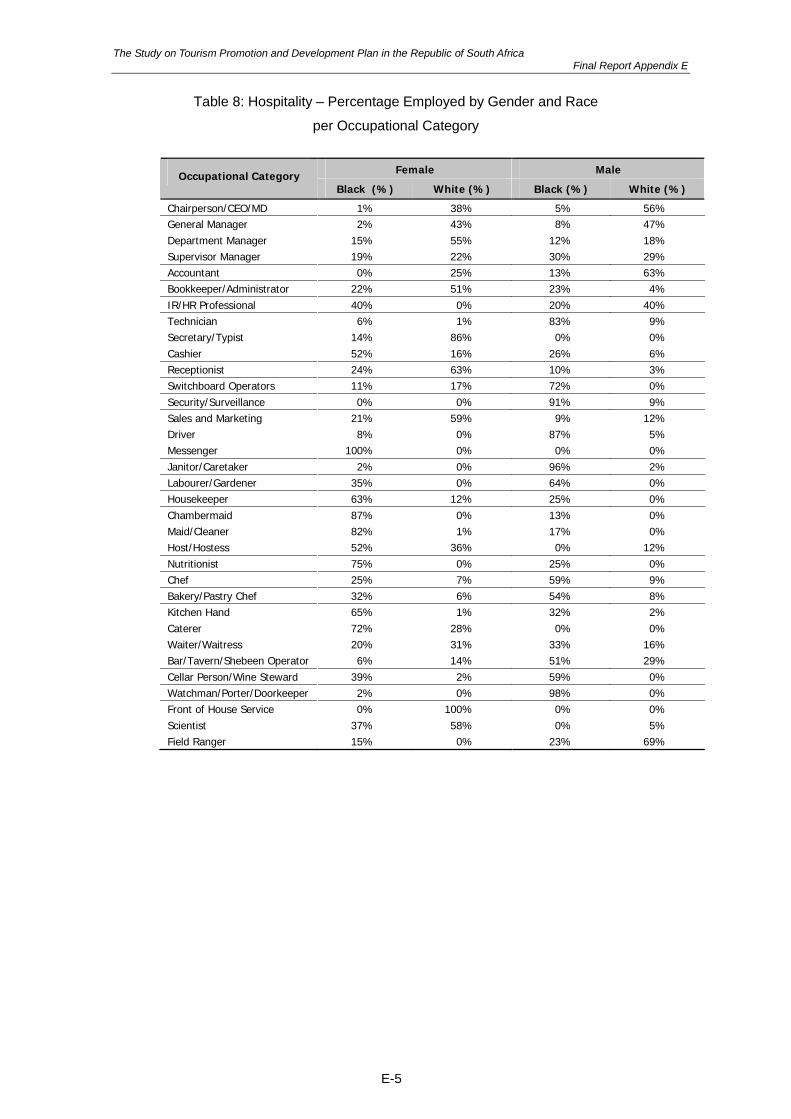
Table 8: Hospitality – Percentage Employed by Gender and Race
per Occupational Category
Female Male Occupational Category Black (%) White (%) Black (%) White (%)
Chairperson/CEO/MD 1% 38% 5% 56% General Manager 2% 43% 8% 47% Department Manager 15% 55% 12% 18% Supervisor Manager 19% 22% 30% 29% Accountant 0% 25% 13% 63% Bookkeeper/Administrator 22% 51% 23% 4% IR/HR Professional 40% 0% 20% 40% Technician 6% 1% 83% 9% Secretary/Typist 14% 86% 0% 0% Cashier 52% 16% 26% 6% Receptionist 24% 63% 10% 3% Switchboard Operators 11% 17% 72% 0% Security/Surveillance 0% 0% 91% 9% Sales and Marketing 21% 59% 9% 12% Driver 8% 0% 87% 5% Messenger 100% 0% 0% 0% Janitor/Caretaker 2% 0% 96% 2% Labourer/Gardener 35% 0% 64% 0% Housekeeper 63% 12% 25% 0% Chambermaid 87% 0% 13% 0% Maid/Cleaner 82% 1% 17% 0% Host/Hostess 52% 36% 0% 12% Nutritionist 75% 0% 25% 0% Chef 25% 7% 59% 9% Bakery/Pastry Chef 32% 6% 54% 8% Kitchen Hand 65% 1% 32% 2% Caterer 72% 28% 0% 0% Waiter/Waitress 20% 31% 33% 16% Bar/Tavern/Shebeen Operator 6% 14% 51% 29% Cellar Person/Wine Steward 39% 2% 59% 0% Watchman/Porter/Doorkeeper 2% 0% 98% 0% Front of House Service 0% 100% 0% 0% Scientist 37% 58% 0% 5% Field Ranger 15% 0% 23% 69%

The Study on Tourism Promotion and Development Plan in the Republic of South Africa Final Report Appendix E
E-6
Table 9: Hospitality - Disability and Occupational Category
Occupational Category % of Disabled Employees
Porter 21%
Kitchen Assistant 16%
Owner/Director 16%
Barman 11%
Senior Manager 9%
Switchboard Operator 5%
Receptionist 5%
Housekeeper 5%
Labourer 5%
F&B assistant 5%
Table 10: Travel and Tourism Services - Employment by Race
Type of Employment by Race % of Total Employees
Black Employees 46%
Male 26%
Female 19%
White Employees 54%
Male 20%
Female 34%

The Study on Tourism Promotion and Development Plan in the Republic of South Africa Final Report Appendix E
E-7
Table 11: Travel and Tourism Services
- Percentage Employed by Gender and Race per Occupational Category
Female Male Occupational Category
Black (%) White (%) Black (%) White (%)
Chairperson/CEO/MD 0% 23% 7% 69% General Manager 6% 30% 8% 56% Department Manager 18% 34% 23% 26% Supervisor Manager 16% 11% 9% 63% Accountant 0% 90% 0% 10% Bookkeeper/Administrator 32% 63% 0% 5% IR/HR Professional 0% 64% 0% 36% Technician 0% 0% 62% 38% Secretary/Typist 23% 77% 0% 0% Cashier 37% 16% 47% 0% Receptionist 43% 57% 0% 0% Switchboard Operators 34% 62% 0% 3% Security/Surveillance 0% 0% 100% 0% Public Relations 33% 53% 0% 13% Sales and Marketing 38% 12% 3% 43% Driver 0% 0% 84% 16% Messenger 42% 0% 58% 0% Janitor/Caretaker 0% 0% 100% 0% Tour Broker 68% 32% 0% 0% Travel Consultant/Organiser 20% 72% 1% 8% Tour Guide 6% 48% 8% 38% Maid/Cleaner 70% 2% 28% 0% Part-time Functions Assistance 19% 32% 49% 0%
Table 12: Hospitality - Employment by Type of Employment
Type of Employment % of Total Employees
Permanent Full-time Employees 84%
Permanent Part-time Employees 9%
Casual Employees 7%
Table 13: Travel and Tourism Services - Employment by Type of Employment
Type of Employment % Of Total Employees
Permanent Full-time Employees 70%
Permanent Part-time Employees 11%
Casual Employees 19%
The Study on Tourism Promotion and Development Plan in the Republic of South Africa Final Report Appendix E
E-8
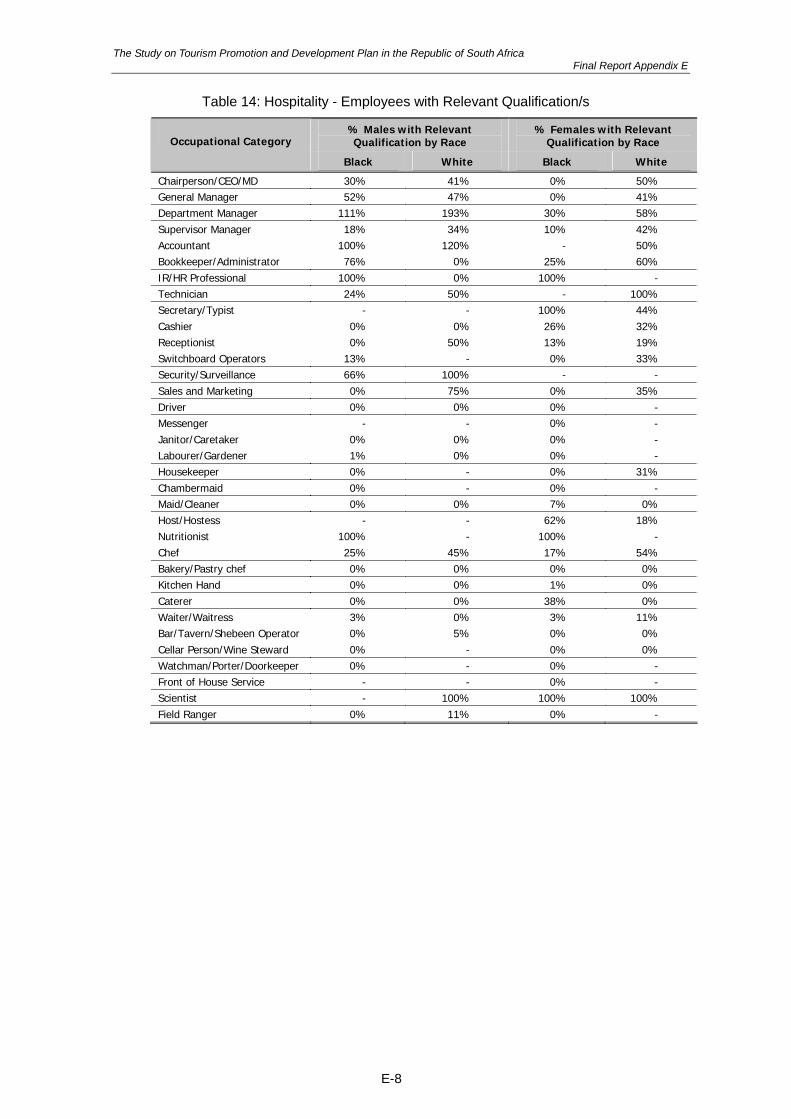
Table 14: Hospitality - Employees with Relevant Qualification/s
% Males with Relevant Qualification by Race
% Females with Relevant Qualification by Race Occupational Category
Black White Black White
Chairperson/CEO/MD 30% 41% 0% 50% General Manager 52% 47% 0% 41% Department Manager 111% 193% 30% 58% Supervisor Manager 18% 34% 10% 42% Accountant 100% 120% - 50% Bookkeeper/Administrator 76% 0% 25% 60% IR/HR Professional 100% 0% 100% - Technician 24% 50% - 100% Secretary/Typist - - 100% 44% Cashier 0% 0% 26% 32% Receptionist 0% 50% 13% 19% Switchboard Operators 13% - 0% 33% Security/Surveillance 66% 100% - - Sales and Marketing 0% 75% 0% 35% Driver 0% 0% 0% - Messenger - - 0% - Janitor/Caretaker 0% 0% 0% - Labourer/Gardener 1% 0% 0% - Housekeeper 0% - 0% 31% Chambermaid 0% - 0% - Maid/Cleaner 0% 0% 7% 0% Host/Hostess - - 62% 18% Nutritionist 100% - 100% - Chef 25% 45% 17% 54% Bakery/Pastry chef 0% 0% 0% 0% Kitchen Hand 0% 0% 1% 0% Caterer 0% 0% 38% 0% Waiter/Waitress 3% 0% 3% 11% Bar/Tavern/Shebeen Operator 0% 5% 0% 0% Cellar Person/Wine Steward 0% - 0% 0% Watchman/Porter/Doorkeeper 0% - 0% - Front of House Service - - 0% - Scientist - 100% 100% 100% Field Ranger 0% 11% 0% -

The Study on Tourism Promotion and Development Plan in the Republic of South Africa Final Report Appendix E
E-9
Table 15: Travel and Tourism Services - Employees with Relevant Qualification/s
% Males with Relevant Qualification by Race
% Females with Relevant Qualification by Race Occupational Category
Black White Black White
Chairperson/CEO/MD 100% 83% - 109% General Manager 186% 163% 250% 182% Department Manager 71% 105% 108% 124% Supervisor Manager 89% 97% 109% 243% Accountant - 100% - 100% Bookkeeper/Administrator - 60% 109% 86% IR/HR Professional - 100% - 86% Technician 94% 100% - - Secretary/Typist - - 143% 96% Cashier 0% - 0% 0% Receptionist - - 81% 100% Switchboard Operators - 0% 50% 61% Security/Surveillance 0% - - - Public Relations - 0% 100% 100% Sales and Marketing 100% 50% 96% 122% Driver 2% 0% - - Messenger 0% - 0% - Janitor/Caretaker 0% - - - Tour Broker - - 69% 117% Travel Consultant/Organiser 100% 200% 154% 186% Tour Guide 40% 60% 125% 194% Maid/Cleaner 0% - 0% 0% Part-time Functions Assistance 0% - 0% 0%


![[Guajrati] - JICA](https://static.fdocuments.in/doc/165x107/61e11e2b440fb31d77387e57/guajrati-jica.jpg)


