JAPAN AIRLINES Co., Ltd. Financial Results 1st … AIRLINES Co., Ltd. Financial Results 1st Quarter...
34
JAPAN AIRLINES Co., Ltd. Financial Results 1 st Quarter Mar/2018(FY2017) July 31, 2017
Transcript of JAPAN AIRLINES Co., Ltd. Financial Results 1st … AIRLINES Co., Ltd. Financial Results 1st Quarter...

JAPAN AIRLINES Co., Ltd. Financial Results 1st Quarter Mar/2018(FY2017)
July 31, 2017

P.1
P.4~
P.6~
Today’s Topics
P.2
P.3
P.15~

22.0
24.7
14.7
19.5
6%
7%
8%
9%
10%
11%
12%
0
5
10
15
20
25
30
297.2
314.8
260
300
340
1
(JPY Bn) ( OP Margin )
Operating Revenue Operating profit・Net profit
(JPY Bn)
1st Quarter
Mar/17
1st Quarter
Mar/18 y/y
Singapore Kerosene (USD/bbl)
50.7 62.2 +22.7%
Dubai Crude Oil (USD/bbl)
39.5 51.3 +29.9%
FX Rate (JPY/USD) 110.3 111.0 +0.6%
Fuel/FX Markets
Overview of Financial Results for 1st Quarter Mar/18
Operating Profit
+17.6Bn (+5.9%)
1st Quarter Mar/18 (FY2017)
1st quarter resulted in an increase in both revenue and profit compared to the previous year.
Net Profit
(1)
Operating Profit Margin
7.4%
7.9%
1 Profit attributable to owners of parent.
1st Quarter
Mar/17
1st Quarter
Mar/18
1st Quarter
Mar/17
1st Quarter
Mar/18
+2.6Bn (+12.0%)
+4.8Bn (+32.9%)
Now, I will present an overview of the first-quarter financial results for the fiscal year ending
March 31, 2018.
Operating revenue increased 17.6 billion yen, up 5.9% year-on-year, to 314.8 billion yen.
Operating profit increased 2.6 billion yen, up 12.0% year-on-year, to 24.7 billion yen, and net
profit was 19.5 billion yen, up 32.9% from a year ago. Thus, operating profit margin was 7.9%.
1-S

142.0
153.0
100.0
108.0
0%
5%
10%
15%
20%
75
100
125
150
175
Upward Revision for Operating Profit & Net Profit Forecast
An upward revision has been made based on the 1st quarter results.
1 Profit attributable to owners of parent.
Operating profit・Net profit
(Operating Profit Margin, ROIC) ( JPY Bn )
Revised Consolidated Financial Forecast for Mar/18
(JPY Bn) Previous Forecast
New Forecast
Diff.
Operating Revenue
1,339.0 1,348.0 +9.0
Operating Profit
142.0 153.0 +11.0
Net Profit (1) 100.0 108.0 +8.0
・Int’l Passenger (+1.0) ・Doms Passenger (+4.0) ・Cargo and Mail (+2.0) etc.
・Fuel (+2.0) ・Other Costs (0)
Expenses Revenue
142.0
153.0
+9.0
+2.0
Operating Profit
Change in operating profit
( JPY Bn )
+11.0Bn (+7.7%)
2
Net Profit (1)
Operating Profit Margin
ROIC (2)
OP Profit +11.0Bn
Previous Forecast
(Announced on APR 28, 2017)
New Forecast
10.6%
8.1%
8.8%
11.4%
Previous
Forecast
New
Forecast
Net Profit +8.0Bn
Fixed Asset (incl. Future Rental Expenses under Operating Leases)
NOPAT 2 ROIC(%) =

2-S
Given our first quarter results, we have revised FY2017 earnings forecast to announce today.
We have revised upward operating revenue by 9 billion yen to 1,348 billion yen, operating profit
by 11 billion yen to 153 billion yen, and net profit by 8 billion yen to 108 billion yen, respectively.

94
90
96
Dividend forecast
FY2016 Results
Previous Forecast (APR 28)
New Forecast
Net Profit (1)
164.1 100.0 108.0
Income Tax-Deferred ▲31.6 5.0 5.0
Income available for dividends
132.5 105.0 113.0
Total amount for dividends 33.2 31.8 33.9
Total number of shares issued(excl. Treasury shares)
353,579 353,579 353,579
Dividends per share 94 (Total)90 (Total)96
Interim Dividends (2) - 45 48
Year-End Dividends 94 45 48
Revised Dividend Forecast
3
FY2017 Previous Forecast (APR 28)
FY2016 Results
1 Profit attributable to owners of parent. 2 To be resolved at the Board of Directors Meeting to be held on Oct 31, 2017.
Dividends per share
FY2017 New
Forecast
(JPY)
(JPY Bn)
(JPY Bn)
(‘000)
(JPY)
× 25% × 30% × 30%
(JPY Bn)
(JPY Bn)

Together with the upward revision in earnings forecast, we have also revised dividend forecast.
The interim and year-end dividends will be 48 yen each, which in total will become 96 yen per
share.
We will continue our best efforts to further increase the dividends.
3-S
Int’l
Recent Topics
4
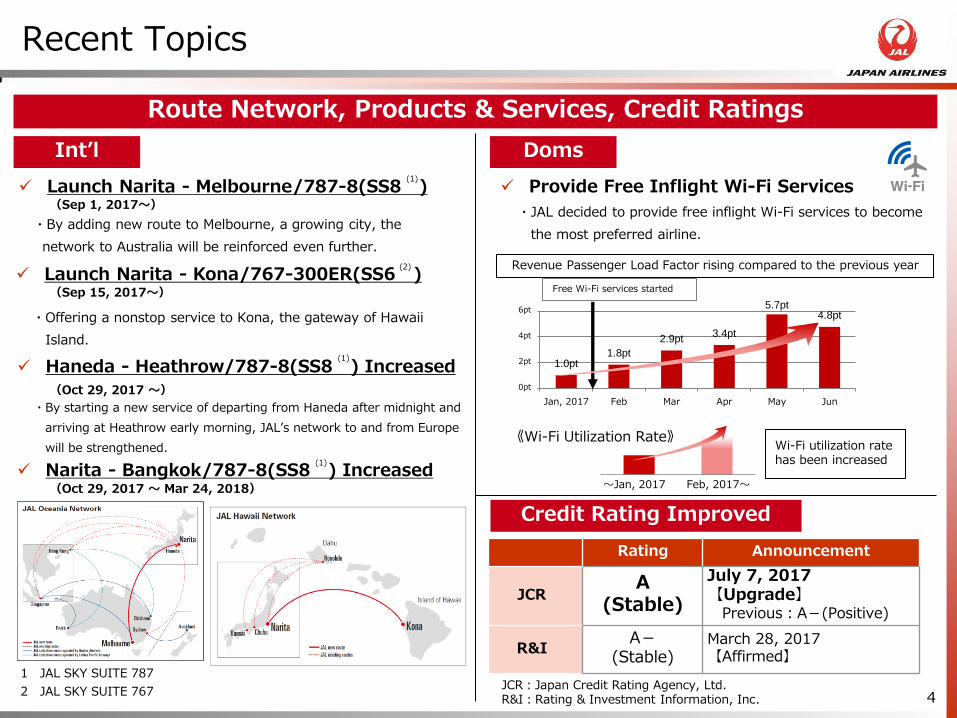
Route Network, Products & Services, Credit Ratings
Launch Narita - Melbourne/787-8(SS8 )
Doms
Provide Free Inflight Wi-Fi Services
・JAL decided to provide free inflight Wi-Fi services to become
the most preferred airline.
Rating Announcement
JCR A
(Stable)
July 7, 2017 【Upgrade】 Previous:A-(Positive)
R&I A-
(Stable) March 28, 2017 【Affirmed】
Credit Rating Improved
・By adding new route to Melbourne, a growing city, the
network to Australia will be reinforced even further.
・Offering a nonstop service to Kona, the gateway of Hawaii
Island.
・By starting a new service of departing from Haneda after midnight and
arriving at Heathrow early morning, JAL’s network to and from Europe
will be strengthened.
Launch Narita - Kona/767-300ER(SS6 )
Haneda - Heathrow/787-8(SS8 ) Increased
Narita - Bangkok/787-8(SS8 ) Increased
JCR:Japan Credit Rating Agency, Ltd. R&I:Rating & Investment Information, Inc.
(Sep 1, 2017~)
(Sep 15, 2017~)
(Oct 29, 2017 ~)
(Oct 29, 2017 ~ Mar 24, 2018)
《Wi-Fi Utilization Rate》
1.0pt 1.8pt
2.9pt 3.4pt
5.7pt 4.8pt
0pt
2pt
4pt
6pt
Jan, 2017 Feb Mar Apr May Jun
Free Wi-Fi services started
~Jan, 2017 Feb, 2017~
Wi-Fi utilization rate has been increased
Revenue Passenger Load Factor rising compared to the previous year
1 JAL SKY SUITE 787
2 JAL SKY SUITE 767
(1)
(1)
(1)
(2)

On this page, I am going to show some of our management topics.
For our international routes, we will launch Narita-Melbourne services on September 1st, and
Narita-Kona on September 15th, respectively. We will also increase frequencies on both routes of
Haneda-London and Narita-Bangkok on October 29th.
For our domestic routes, we have decided that our inflight Wi-Fi services be permanently free of
charge in order to become a more preferred airline by customers.
In addition, JAL’s credit rating has been upgraded to A “flat” from A “minus” by Japan Credit
Rating Agency (JCR).
4-S
-4.0 -4.0
▲7.0
▲16.0 ▲2.5
▲2.5
-300
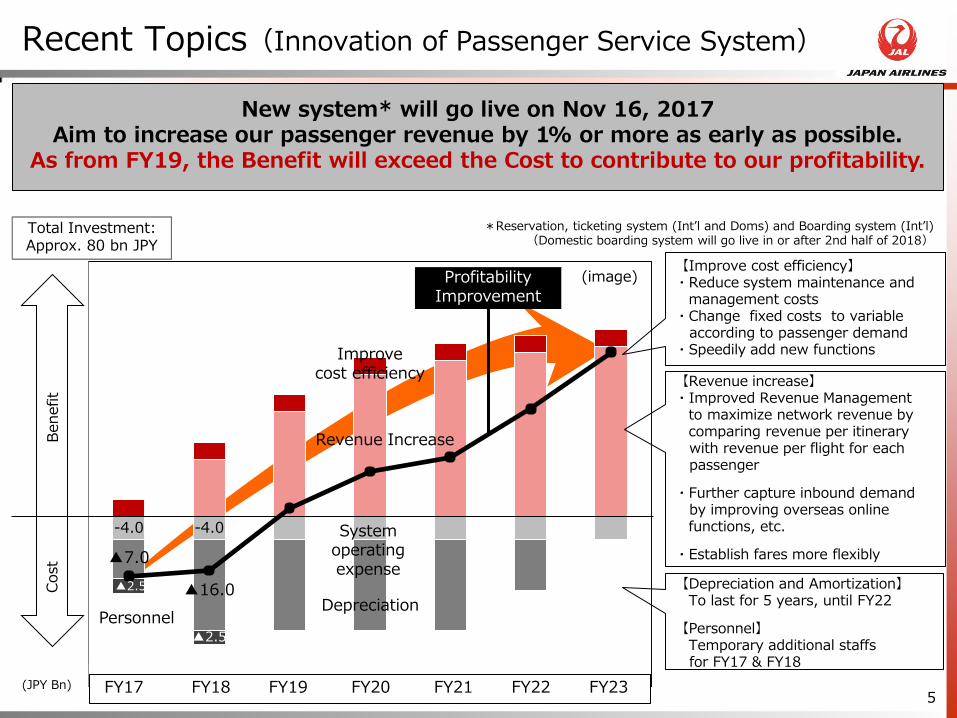
Recent Topics(Innovation of Passenger Service System)
5 FY17 FY18 FY19 FY20 FY21 FY22 FY23
System operating expense
Depreciation Personnel
New system* will go live on Nov 16, 2017 Aim to increase our passenger revenue by 1% or more as early as possible.
As from FY19, the Benefit will exceed the Cost to contribute to our profitability.
【Revenue increase】 ・Improved Revenue Management to maximize network revenue by comparing revenue per itinerary with revenue per flight for each passenger
・Further capture inbound demand by improving overseas online functions, etc.
・Establish fares more flexibly
(JPY Bn)
【Improve cost efficiency】 ・Reduce system maintenance and management costs ・Change fixed costs to variable according to passenger demand ・Speedily add new functions
Total Investment: Approx. 80 bn JPY
【Depreciation and Amortization】 To last for 5 years, until FY22
【Personnel】 Temporary additional staffs for FY17 & FY18
*Reservation, ticketing system (Int’l and Doms) and Boarding system (Int’l) (Domestic boarding system will go live in or after 2nd half of 2018)
Improve cost efficiency
Revenue Increase
Profitability Improvement
(image)
Cost
Benefit

This explains the effects by innovating our Passenger Service System.
After spending 5 years of time and approximately 80 billion yen for its development , the new
system will go live on November 16, 2017.
Although relevant expenses are expected to increase due to depreciation and staff trainings for
FY2017 and FY2018, we aim to increase our passenger revenue by 1% or more as early as
possible by utilizing enhanced revenue management and website as well as by establishing
passenger fares more flexibly.
The new system will become a platform to maximize our profit and support our sustainable
growth in the future.
5-S
(JPY Bn) 1st Quarter
Mar/17
1st Quarter
Mar/18 Diff. y/y
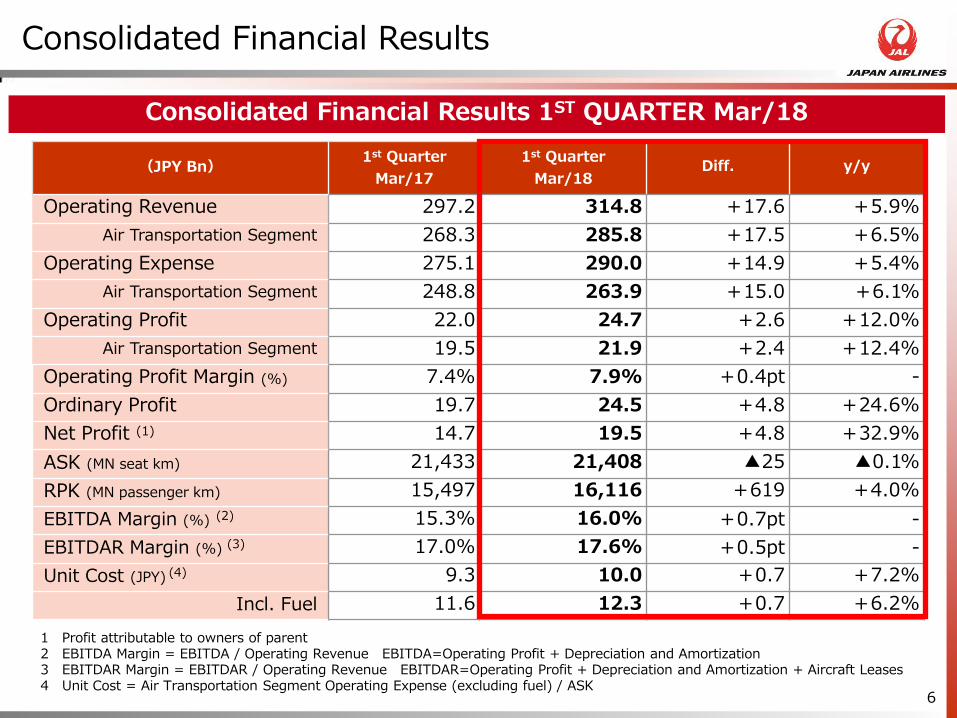
Operating Revenue 297.2 314.8 +17.6 +5.9%
Air Transportation Segment 268.3 285.8 +17.5 +6.5%
Operating Expense 275.1 290.0 +14.9 +5.4%
Air Transportation Segment 248.8 263.9 +15.0 +6.1%
Operating Profit 22.0 24.7 +2.6 +12.0%
Air Transportation Segment 19.5 21.9 +2.4 +12.4%
Operating Profit Margin (%) 7.4% 7.9% +0.4pt -
Ordinary Profit 19.7 24.5 +4.8 +24.6%
Net Profit (1) 14.7 19.5 +4.8 +32.9%
ASK (MN seat km) 21,433 21,408 ▲25 ▲0.1%
RPK (MN passenger km) 15,497 16,116 +619 +4.0%
EBITDA Margin (%) (2) 15.3% 16.0% +0.7pt -
EBITDAR Margin (%) (3) 17.0% 17.6% +0.5pt -
Unit Cost (JPY) (4) 9.3 10.0 +0.7 +7.2%
Incl. Fuel 11.6 12.3 +0.7 +6.2%
Consolidated Financial Results 1ST QUARTER Mar/18
Consolidated Financial Results
6
1 Profit attributable to owners of parent 2 EBITDA Margin = EBITDA / Operating Revenue EBITDA=Operating Profit + Depreciation and Amortization 3 EBITDAR Margin = EBITDAR / Operating Revenue EBITDAR=Operating Profit + Depreciation and Amortization + Aircraft Leases 4 Unit Cost = Air Transportation Segment Operating Expense (excluding fuel) / ASK

INTENTIONALLY LEFT BLANK

“Aircraft” includes Aircraft Depreciation, Aircraft Leases, Aviation Insurance Premium, etc.
( JPY Bn )
Fuel Other Revenues
Other Expenses
Maintenance
Cargo & Mail Domestic Passenger
Int’l Passenger
24.7
+6.7
▲3.7
▲5.7
+6.0
22.0
+2.4
+6.1%
+6.1%
+12.9%
+3.5%
▲1.9%
▲26.9%
Aircraft
▲1.4
▲5.8%
Personnel
▲3.0
▲4.8%
▲0.9
1st Quarter Mar/17
1st Quarter Mar/18
“Other Expenses” include Expenses of travel agency, Services, etc.
+2.6Bn (+12.0%)
+2.4
▲4.4%
Impact from Currency Market ▲0.9Bn Revenue ▲0.6Bn Cost ▲0.3Bn Fuel ▲0.3Bn Ex. Fuel ▲0.0Bn
ASK y/y : ▲0.1% RPK y/y : +4.0%
FSC* Total +2.4 FX Total ▲0.6 (Total) +1.8
FSC* +0.7 FX ▲0.1 (Total) +0.6
FSC* +1.7 FX ▲0.5 (Total) +1.2
*FSC=Fuel Surcharge
Revenues +17.6 Expenses ▲14.9 7
Changes in Operating Profit( Revenues / Expenses )
1st Quarter Mar/18 + stands for profit increase (revenue increase, cost reduction) ▲ stands for profit decrease (revenue decrease, cost increase)
“Other Revenues” include Sales of travel agency, etc.

Now, I will explain about the changes in operating profit.
Revenue from International Passenger increased by 6.0 billion yen due to strong high yield
demand out of Japan as well as more fuel surcharge revenues and such. Revenue from
Domestic Passenger increased 6.7 billion yen year on year, because passenger demand surged
thanks to free inflight Wi-Fi services while revenue per passenger declined due to price
competitions with other airlines as well as increased demand for promotional fares.
As for expenses, maintenance costs increased 3.7 billion yen compared to the previous year due
to an increase in engine maintenance among others and personnel costs also increased 3.0
billion yen due to temporary additional staffs for introducing the new passenger system.
Expenses in total rose by 14.9 billion yen compared to the year earlier.
7-S

FX excl. Fuel
24.7
22.0
▲0.6
+15.8
FSC*
24.0
Revenue increase
Cost increase
(▲90)
Fuel (excl.Hedging)
▲7.4
+7.5
+2.4
Market impact +1.9 Others +0.7
+2.6Bn (+12.0%)
1st Quarter Mar/17
1st Quarter Mar/18
Int’l Passenger
+1.7
Int’l Cargo +0.7
Total +2.4
Int’l Passenger
+4.9
Domestic Passenger
+6.7
Cargo/Mail +1.8
Other +2.4
Total +15.8
Hedging
FX ▲0.3
Market ▲7.1
Total ▲7.4
*FSC=Fuel Surcharge
Revenue ▲0.6
Cost excl. Fuel
▲0.0
Total ▲0.6
8
Changes in Operating Profit( Market / Others )
( JPY Bn )
1st Quarter Mar/18
▲15.1
Maintenance ▲3.7
Services ▲0.9
Aircraft ▲1.4
Personnel ▲3.0 Expenses of travel agency ▲1.2
Other ▲4.9
Total ▲15.1
+ stands for profit increase (revenue increase, cost reduction) ▲ stands for profit decrease (revenue decrease, cost increase)

This page explains changes in operating profit from the viewpoints of market impact and others.
Despite fuel cost increase for higher fuel prices, fuel surcharge revenue and the hedging effect
contributed to increase operating profit by 1.9 billion yen against the previous year.
Apart from Market impact, operating profit rose by 0.7 billion yen, year on year, because
revenue increase outpaced cost increase.
8-S
1st Quarter Mar/17
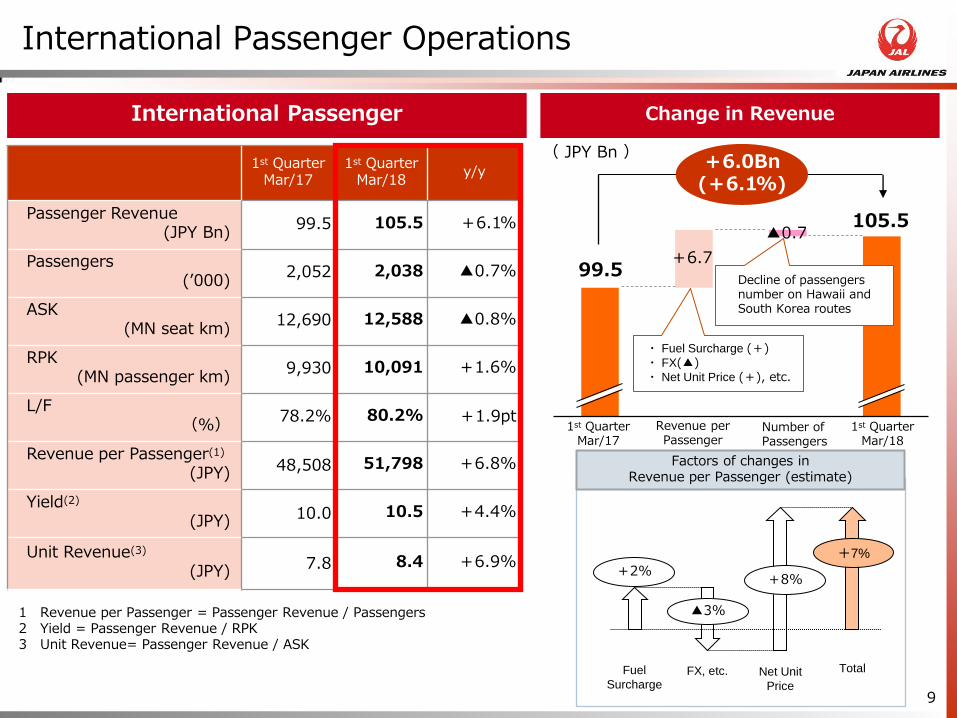
1st Quarter Mar/18
y/y
Passenger Revenue (JPY Bn)
99.5 105.5 +6.1%
Passengers (’000)
2,052 2,038 ▲0.7%
ASK (MN seat km)
12,690 12,588 ▲0.8%
RPK (MN passenger km)
9,930 10,091 +1.6%
L/F (%)
78.2% 80.2% +1.9pt
Revenue per Passenger(1)
(JPY) 48,508 51,798 +6.8%
Yield(2)
(JPY) 10.0 10.5 +4.4%
Unit Revenue(3)
(JPY) 7.8 8.4 +6.9%
1 Revenue per Passenger = Passenger Revenue / Passengers 2 Yield = Passenger Revenue / RPK 3 Unit Revenue= Passenger Revenue / ASK
International Passenger Change in Revenue
・ Fuel Surcharge (+) ・ FX(▲) ・ Net Unit Price (+), etc.
Decline of passengers number on Hawaii and South Korea routes
Number of Passengers
Revenue per Passenger
99.5
105.5
+6.7
▲0.7
International Passenger Operations
1st Quarter Mar/18
1st Quarter Mar/17
9
( JPY Bn ) +6.0Bn (+6.1%)
Fuel
Surcharge FX, etc. Total
+8%
Factors of changes in Revenue per Passenger (estimate)
Net Unit
Price
+2%
▲3%
+7%

On international routes, number of passengers decreased 0.7% year on year as a result of less
capacity with expanding JAL SKY SUITE products, however, revenue per passenger rose by
6.8% year on year for our revenue management initiatives and such.
As a result, international passenger revenue stood 105.5 billion yen, up 6.1% from the year
before.
9-S

( JPY Bn )
109.4
116.1
▲2.0
+8.7
Domestic Passenger Operations
Domestic Passenger Change in Revenue
1st Quarter Mar/17
1st Quarter Mar/18
y/y
Passenger Revenue (JPY Bn)
109.4 116.1 +6.1%
Passengers (’000)
7,465 8,070 +8.1%
ASK (MN seat km)
8,743 8,820 +0.9%
RPK (MN passenger km)
5,567 6,025 +8.2%
L/F (%)
63.7% 68.3% +4.6pt
Revenue per Passenger(1)
(JPY) 14,658 14,391 ▲1.8%
Yield(2)
(JPY) 19.7 19.3 ▲1.9%
Unit Revenue(3)
(JPY) 12.5 13.2 +5.2%
10
+6.7Bn (+6.1%)
・Competition with other airlines (▲) ・Demand increase for promotional fares (▲)
・Increase in individual passengers (+) ・Recovery from a plunge in demand by the 2016 Kumamoto Earthquakes (+)
Number of Passengers
Revenue per Passenger
1st Quarter Mar/18
1st Quarter Mar/17
1 Revenue per Passenger = Passenger Revenue / Passengers 2 Yield = Passenger Revenue / RPK 3 Unit Revenue= Passenger Revenue / ASK

Next, on domestic routes.
While number of passengers increased 8.1% year on year thanks to more group passengers due
to the recovery from a plunge in demand by the 2016 Kumamoto Earthquakes and increased
individual passengers mainly with promotional fares, revenue per passenger decreased 1.8%
year on year due to price competitions with other airlines and increased demand for
promotional fares.
As a result, domestic passenger revenue ended at 116.1 billion yen, up 6.1% from a year ago.
10-S
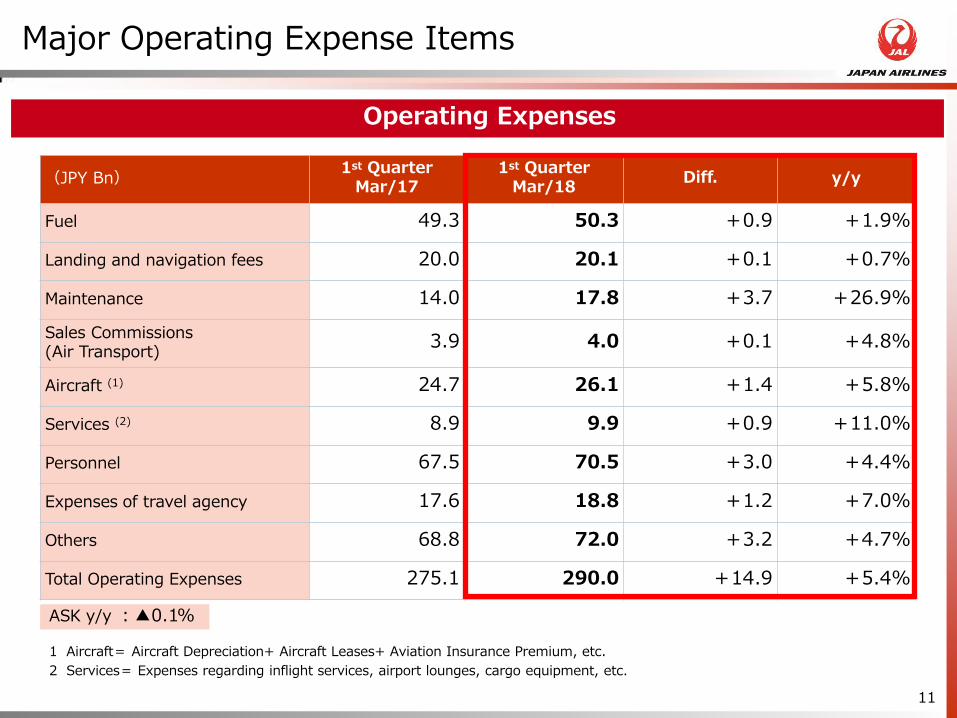
(JPY Bn) 1st Quarter
Mar/17 1st Quarter
Mar/18 Diff. y/y
Fuel 49.3 50.3 +0.9 +1.9%
Landing and navigation fees 20.0 20.1 +0.1 +0.7%
Maintenance 14.0 17.8 +3.7 +26.9%
Sales Commissions (Air Transport)
3.9 4.0 +0.1 +4.8%
Aircraft (1) 24.7 26.1 +1.4 +5.8%
Services (2) 8.9 9.9 +0.9 +11.0%
Personnel 67.5 70.5 +3.0 +4.4%
Expenses of travel agency 17.6 18.8 +1.2 +7.0%
Others 68.8 72.0 +3.2 +4.7%
Total Operating Expenses 275.1 290.0 +14.9 +5.4%
ASK y/y :▲0.1%
1 Aircraft= Aircraft Depreciation+ Aircraft Leases+ Aviation Insurance Premium, etc.
2 Services= Expenses regarding inflight services, airport lounges, cargo equipment, etc.
Major Operating Expense Items
11
Operating Expenses

Please refer to page 11 for major operating expense items, which stood almost as planned.
We will continue to make utmost efforts to control our costs.
We continuously aim to maximize our profit as well as improve our corporate value by realizing
the JAL VISION of “transforming JAL into a true global airline”, “creating new values one step
ahead of competitors” and “continuous sustainable growth”.
11-S
0
20
40
60 FX Market
50.3
Volume increase/ Hedging
▲6.4
49.3
+7.1
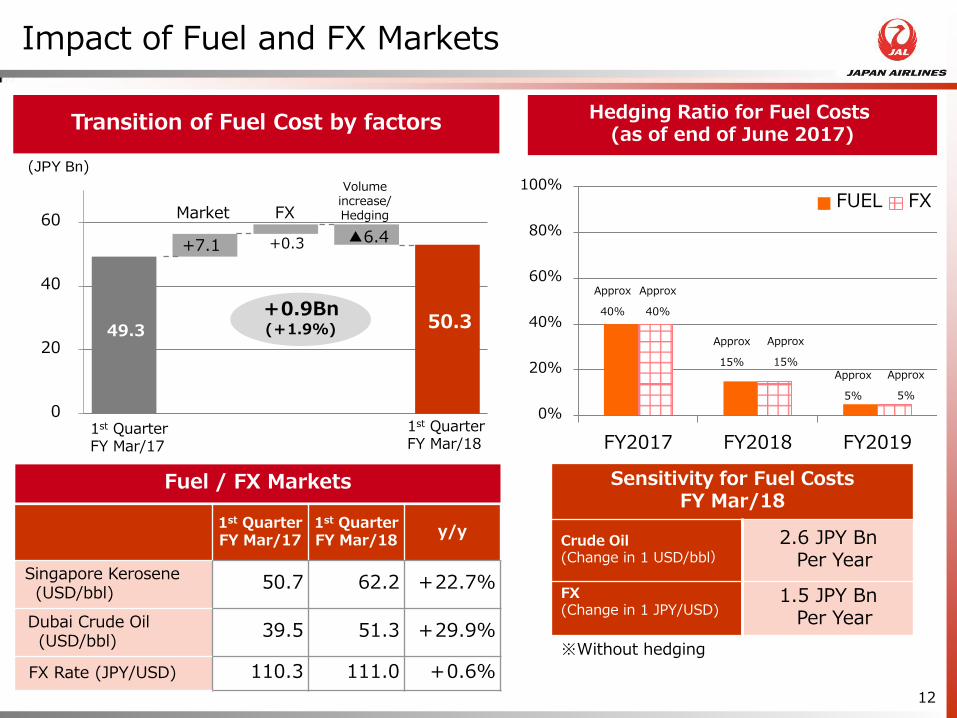
Hedging Ratio for Fuel Costs (as of end of June 2017)
Fuel / FX Markets Sensitivity for Fuel Costs FY Mar/18
Crude Oil (Change in 1 USD/bbl)
2.6 JPY Bn Per Year
FX (Change in 1 JPY/USD)
1.5 JPY Bn Per Year
Transition of Fuel Cost by factors
(JPY Bn)
+0.3
1st Quarter FY Mar/17
1st Quarter FY Mar/18
y/y
Singapore Kerosene (USD/bbl)
50.7 62.2 +22.7%
Dubai Crude Oil (USD/bbl)
39.5 51.3 +29.9%
FX Rate (JPY/USD) 110.3 111.0 +0.6%
1st Quarter FY Mar/17
Approx
40%
Approx
15% Approx
5%
Approx
40%
Approx
15% Approx
5%
0%
20%
40%
60%
80%
100%
FY2017 FY2018 FY2019
FUEL FX
Impact of Fuel and FX Markets
※Without hedging
+0.9Bn (+1.9%)
12
1st Quarter FY Mar/18

INTENTIONALLY LEFT BLANK

(JPY Bn) End of Mar/17
2017/3/31
End of 1st Quarter
Mar/18 2017/6/30
Diff.
Total Assets 1,728.7 1,731.3 +2.5
Cash and Deposits (1) 404.0 388.6 ▲15.4
Balance of Interest-bearing Debt (2) 116.0 107.0 ▲9.0
Future Rental Expenses under Operating Leases
76.4 72.0 ▲4.4
Shareholders’ Equity 972.0 959.3 ▲12.6
Shareholders’ Equity Ratio(%)
56.2% 55.4% ▲0.8pt
D/E Ratio(x) (3) 0.1x 0.1x ▲0.0x
Consolidated Balance Sheet Summary as of end of 1st Quarter Mar/18
Major Balance Sheet Items
13
1 Certificate of Deposits included 2 Accounts Payable-installment Purchase included 3 D/E ratio = On-balance sheet Interest-bearing Debt / Shareholders' Equity

(JPY Bn) 1st Quarter
Mar/17
1st Quarter
Mar/18 Diff.
Profit before income taxes 20.2 25.2 +4.9
Depreciation and Amortization 23.4 25.5 +2.1
Other 17.2 19.0 +1.8
Cash Flow from Operating Activities 60.9 69.9 +8.9
Capital Expenditure(1) ▲73.9 ▲50.5 +23.4
Other 8.1 8.6 +0.5
Cash Flow from Investing Activities (2) ▲65.7 ▲41.8 +23.9
Free Cash Flow (3) ▲4.8 28.1 +32.9
Repayment of Interest-bearing Debt (4) ▲12.4 ▲9.0 +3.3
Cash dividend, and Other ▲44.2 ▲34.3 +9.9
Cash Flow from Financing Activities ▲56.6 ▲43.3 +13.2
Total Cash Flow (5) ▲61.5 ▲15.2 +46.2
EBITDA 45.5 50.3 +4.8
EBITDAR 50.5 55.2 +4.6
Major Cash Flow Items
14
1 Expenditures for purchasing fixed assets
2 Excluding deposits and withdrawals from deposit accounts 3 Cash Flow from Operating Activities + Cash Flow from Investing Activities 4 Repayment of Loans + Repayment of Lease Obligations 5 Cash flow from Operating Activities + Cash Flow from Investing Activities + Cash Flow from Financing Activities
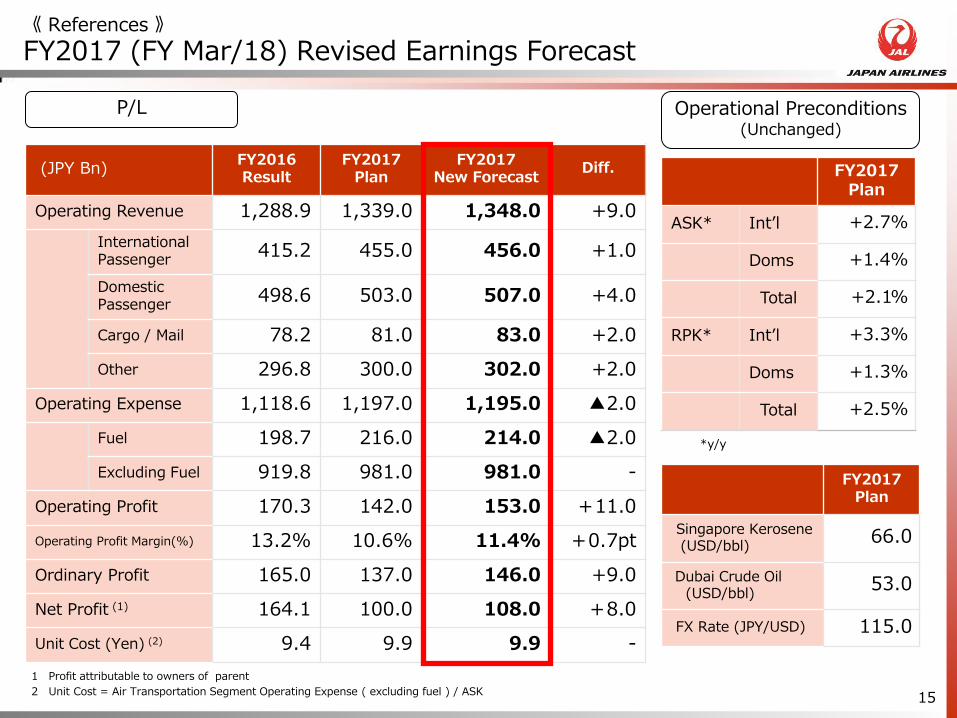
FY2017 Plan
ASK* Int’l +2.7%
Doms +1.4%
Total +2.1%
RPK* Int’l +3.3%
Doms +1.3%
Total +2.5%
Operational Preconditions (Unchanged)
FY2017 Plan
Singapore Kerosene (USD/bbl)
66.0
Dubai Crude Oil (USD/bbl)
53.0
FX Rate (JPY/USD) 115.0
*y/y
(JPY Bn) FY2016 Result
FY2017 Plan
FY2017 New Forecast
Diff.
Operating Revenue 1,288.9 1,339.0 1,348.0 +9.0
International Passenger
415.2 455.0 456.0 +1.0
Domestic Passenger
498.6 503.0 507.0 +4.0
Cargo / Mail 78.2 81.0 83.0 +2.0
Other 296.8 300.0 302.0 +2.0
Operating Expense 1,118.6 1,197.0 1,195.0 ▲2.0
Fuel 198.7 216.0 214.0 ▲2.0
Excluding Fuel 919.8 981.0 981.0 -
Operating Profit 170.3 142.0 153.0 +11.0
Operating Profit Margin(%) 13.2% 10.6% 11.4% +0.7pt
Ordinary Profit 165.0 137.0 146.0 +9.0
Net Profit (1) 164.1 100.0 108.0 +8.0
Unit Cost (Yen) (2) 9.4 9.9 9.9 -
《 References 》
FY2017 (FY Mar/18) Revised Earnings Forecast
15
1 Profit attributable to owners of parent
2 Unit Cost = Air Transportation Segment Operating Expense ( excluding fuel ) / ASK
P/L

(JPY Bn) End of FY2016
Results End of FY2017
Previous Forecast End of FY2017 New Forecast
Diff.
Total Assets 1,728.7 1,793.0 1,803.0 +10.0
Balance of Interest-bearing debts 116.0 133.0 133.0 -
Shareholders’ Equity 972.0 1,031.0 1,038.0 +7.0
Shareholders’ Equity Ratio (%) 56.2% 57.5% 57.6% +0.1pt
ROIC (%) (1) 10.7% 8.1% 8.8% +0.7pt
ROE (%) (2) 18.1% 10.0% 10.7% +0.8pt
ROA (%) (3) 10.3% 8.1% 8.7% +0.6pt
(JPY Bn) FY2016 Results FY2017
Previous Forecast FY2017
New Forecast Diff.
Cash Flow from Operating Activities 253.1 231.0 242.0 +11.0
Cash Flow from Investing Activities (4) ▲215.5 ▲210.0 ▲210.0 -
Free Cash Flow (4) 37.5 21.0 32.0 +11.0
Cash Flow from Financing Activities ▲53.5 ▲35.0 ▲36.0 ▲1.0
EBITDA 266.1 254.0 265.0 +11.0
EBITDAR 286.2 271.0 282.0 +11.0
Balance Sheet
Cash Flow
《 References 》
FY2017 (FY Mar/18) Revised Earnings Forecast
16
1 Return on invested capital gives a sense of how well a company is using its money to generate returns 2 (Profit attributable to owners of parent)/(average of shareholder’s equity at beginning and end of fiscal year) 3 (Operating profit ) / (average of total assets at beginning and end of fiscal year) 4 Excluding deposits and withdrawals from deposit accounts
Fixed Asset (incl. Future Rental Expenses under Operating Leases)
NOPAT ROIC(%) =

《 References 》
Revenue of International Routes by Geographic Segment
17
(%) y/y
1Q Mar/18
America +12.3%
Europe +14.8%
Asia/Oceania +0.1%
China +0.6%
Hawaii/Guam +3.1%
Total +6.1%
(MN seat km) 1Q Mar/17 1Q Mar/18 y/y
America 3,544 3,727 +5.2%
Europe 1,901 1,963 +3.2%
Asia/Oceania 4,467 4,264 ▲4.5%
China 864 821 ▲4.9%
Hawaii/Guam 1,913 1,810 ▲5.3%
Total 12,690 12,588 ▲0.8%
Passenger Revenue
ASK
RPK
Revenue Passengers Carried
Load Factor for Revenue Passengers
Component Ratios
1Q Mar/17 1Q Mar/18
27% 28%
15% 16%
35% 33%
10% 10%
13% 13%
100% 100%
(MN passenger km) 1Q Mar/17 1Q Mar/18 y/y
America 2,776 2,988 +7.7%
Europe 1,448 1,639 +13.2%
Asia/Oceania 3,506 3,451 ▲1.6%
China 614 575 ▲6.4%
Hawaii/Guam 1,583 1,435 ▲9.3%
Total 9,930 10,091 +1.6%
(%) 1Q Mar/17 1Q Mar/18 Diff.
America 78.3% 80.2% +1.8pt
Europe 76.2% 83.5% +7.3pt
Asia/Oceania 78.5% 80.9% +2.4pt
China 71.1% 70.0% ▲1.1pt
Hawaii/Guam 82.8% 79.3% ▲3.5pt
Total 78.2% 80.2% +1.9pt
(‘000) 1Q Mar/17 1Q Mar/18 y/y
America 291 312 +7.0%
Europe 159 182 +14.2%
Asia/Oceania 997 983 ▲1.4%
China 329 308 ▲6.3%
Hawaii/Guam 273 251 ▲8.0%
Total 2,052 2,038 ▲0.7%

End of Mar/17 (2017/3/31)
End of 1st quarter Mar/18 (2017/6/30) Diff.
Owned Leased Total Owned Leased Total
Boeing 777-200 12 0 12 12 0 12 -
Boeing 777-200ER 11 0 11 11 0 11 -
Boeing 777-300 4 0 4 4 0 4 -
Boeing 777-300ER 13 0 13 13 0 13 -
Large-sized Total 40 0 40 40 0 40 -
Boeing 787-8 25 0 25 25 0 25 -
Boeing 787-9 8 0 8 8 0 8 -
Boeing 767-300 6 0 6 6 0 6 -
Boeing 767-300ER 29 2 31 30 1 31 -
Middle-sized Total 68 2 70 69 1 70 -
Boeing 737-400 11 0 11 10 0 10 ▲1
Boeing 737-800 26 27 53 28 26 54 +1
Small-sized Total 37 27 64 38 26 64 -
Embraer 170 17 0 17 17 0 17 -
Embraer 190 5 0 5 7 0 7 +2
Bombardier CRJ200 5 0 5 5 0 5 -
Bombardier D8-400 7 2 9 6 2 8 ▲1
Bombardier D8-400CC 4 0 4 4 0 4 -
SAAB340B 12 0 12 11 0 11 ▲1
Bombardier D8-300 1 0 1 1 0 1 -
Bombardier D8-100 2 0 2 1 0 1 ▲1
ATR42-600 1 0 1 1 0 1 -
Regional Total 54 2 56 53 2 55 ▲1
Total 199 31 230 200 29 229 ▲1
《 References 》
Number of Aircraft
18

Fly into tomorrow.
Finance & Investor Relations, Japan Airlines

Disclaimer
This contents contains descriptions of the future expectations, outlooks, objectives and plans etc. of Japan Airlines Co., Ltd. (hereafter “the company”) and related Group companies (hereafter “the Group”). These are based on information available at the time when these materials were created by the company (or as otherwise specified), and are created based on the forecasts at such time. These statements were created based on certain assumptions. These statements and assumptions include the subjective projections and judgments of our management, and due to various risks and uncertainties, these may be found to be inaccurate or unrealized in the future. Therefore, the actual results, earnings and financial conditions, etc. of the Group may differ from the projections of the company. These risks and uncertainties include, but are not limited to, the economic and social conditions of Japan and other countries and regions, soaring fuel costs, changes in the exchange rates between the yen and the dollar or other currencies, terrorist attacks or wars, infectious disease outbreaks, and various other risks related to the aviation business. Statements on this contents regarding future information are, as mentioned above, valid at the time of creation (or as otherwise specified), and our company has no obligation to ensure that this information is updated with the latest available information. The information contained in this contents is for informational purposes only, and is not intended as a recommendation, solicitation or request for the purchase of or trade in any securities or financial products. Although every effort has been made to ensure that the information posted on this contents regarding the Group is correct, it includes unaudited financial information for which we provide no guarantee of its accuracy, completeness, fairness or reliability. The Company does not have any responsibility for any damages resulting from the use of this contents. It should be noted that all rights with this contents and other copyright of this material belongs to Japan Airlines Co., Ltd.