January - September
54
2014 Interim Report January - September
Transcript of January - September

2014
Interim ReportJanuary - September

1 U PDATED I N FORMATION 6 I NTER IM MANAGEMENT R EPORT
20 B RAN DS AN D BUSI N ESS F I ELDS
25 I NTER IM CONSOLI DATED FI NANC IAL STATEMENTS (CON DENSED)
1 Key Facts
2 Key Events
6 Volkswagen Shares 7 Business Development 15 Results of Operations, Finan- cial Position and Net Assets 19 Outlook
25 Income Statement 26 Statement of Comprehensive Income 29 Balance Sheet 30 Statement of Changes in Equity 32 Cash Flow Statement 33 Notes to the Interim Consolidated Financial Statements 51 Review Report
VO L K SWA G E N G R O U P
Q 3 Q 1 – 3
Volume Data1 2014 2013 % 2014 2013 %
Deliveries to customers ('000 units) 2,476 2,386 + 3.8 7,542 7,183 + 5.0
of which: in Germany 302 278 + 9.0 929 874 + 6.3
abroad 2,174 2,108 + 3.1 6,613 6,309 + 4.8
Vehicle sales ('000 units) 2,439 2,368 + 3.0 7,646 7,241 + 5.6
of which: in Germany 295 265 + 11.4 938 882 + 6.4
abroad 2,144 2,103 + 2.0 6,708 6,359 + 5.5
Production ('000 units) 2,404 2,347 + 2.4 7,638 7,232 + 5.6
of which: in Germany 585 570 + 2.5 1,898 1,823 + 4.1
abroad 1,819 1,777 + 2.4 5,740 5,409 + 6.1
Employees ('000 on Sept. 30, 2014/Dec. 31, 2013) 590.8 572.8 + 3.1
of which: in Germany 269.1 260.4 + 3.3
abroad 321.8 312.4 + 3.0
Q 3 Q 1 – 3
Financial Data (IFRSs), € million 2014 2013 % 2014 2013 %
Sales revenue 48,910 46,985 + 4.1 147,718 145,673 + 1.4
Operating profit 3,230 2,777 + 16.3 9,416 8,557 + 10.0
as a percentage of sales revenue 6.6 5.9 6.4 5.9
Profit before tax 3,713 2,780 + 33.6 11,490 9,399 + 22.2
as a percentage of sales revenue 7.6 5.9 7.8 6.5
Profit after tax 2,971 1,909 + 55.6 8,687 6,702 + 29.6
Profit attributable to Volkswagen AG shareholders 2,928 1,856 + 57.7 8,509 6,714 + 26.7
Cash flows from operating activities 5,171 5,613 – 7.9 8,515 10,597 – 19.6
Cash flows from investing activities attributable to operating activities 3,908 3,090 + 26.5 10,144 8,859 + 14.5
Automotive Division2
EBITDA3 5,794 4,888 + 18.5 16,746 15,003 + 11.6
Cash flows from operating activities 6,556 6,281 + 4.4 14,942 14,713 + 1.6
Cash flows from investing activities attributable to operating activities4 3,929 3,063 + 28.3 9,398 10,264 – 8.4
of which: capex 2,904 2,512 + 15.6 6,482 6,436 + 0.7
as a percentage of sales revenue 6.8 6.0 5.0 5.0
capitalized development costs5 1,003 923 + 8.8 3,399 2,558 + 32.9
as a percentage of sales revenue 2.4 2.2 2.6 2.0
Net cash flow 2,627 3,218 – 18.4 5,544 4,449 + 24.6
Net liquidity at September 30 16,785 16,649 + 0.8
1 Volume data including the unconsolidated Chinese joint ventures. These companies are accounted for using the equity method. All figures shown are rounded, so minor discrepancies may arise from addition of these amounts. 2013 deliveries updated to reflect subsequent statistical trends.
2 Including allocation of consolidation adjustments between the Automotive and Financial Services divisions. 3 Operating profit plus net depreciation/amortization and impairment losses/reversals of impairment losses on property, plant and equipment, capitalized development costs, lease
assets, goodwill and financial assets as reported in the cash flow statement. 4 Excluding acquisition and disposal of equity investments: Q3 €3,845 million (€3,259 million), Q1–3 €9,694 million (€8,624 million). 5 See table on page 36.
Key Figures

U P D AT E D I N F O R M AT I O N
Key Facts
1
> Volkswagen Group increases deliveries to customers by 5.0% year-on-year to 7.5 million vehicles; continued growth in China and Europe
> Group sales revenue rises to €147.7 billion (€145.7 billion), impacted by negative exchange rate effects in particular in the first half of the year
> Operating profit improves by €0.9 billion to €9.4 billion in an ongoing difficult market environment
> Earnings before tax of €11.5 billion, €2.1 billion higher than in the previous year
> Cash flows from operating activities in the Automotive Division up €0.2 billion year-on-year at €14.9 billion; ratio of capex to sales revenue is 5.0% (5.0%)
> Net liquidity in the Automotive Division at €16.8 billion; acquisition of Scania shares and capital increase at Financial Services Division reduce liquidity, while capital increase from issuing new preferred shares and successful placement of hybrid notes strengthen Automotive Division’s capital base
> Enthusiastic reception for Group models by customers worldwide:
- Volkswagen Passenger Cars presents the eighth generation of the Passat for the first time; world premiere of the plug-in hybrid version at the Paris Motor Show
- Audi showcases the efficient A6 ultra and the TT Sportback concept study in Paris
- ŠKODA celebrates the debut of the new Fabia and the new Fabia estate
- SEAT unveils the all-wheel drive Leon X-PERIENCE
- Porsche presents the new Cayenne S E-Hybrid – the first premium SUV with a hybrid drive
- Bentley impresses with its new Mulsanne Speed flagship
- Volkswagen Commercial Vehicles offers a glimpse into the new generation of the Multivan/Transporter with the TRISTAR study at the IAA Commercial Vehicles show in Hanover
- Scania focuses on sustainability and services in Hanover
- MAN presents the top-of-the-range TGX D38 with efficiency technologies
Key Facts

U P D AT E D I N F O R M AT I O N
Key Events
2
M OTO R S H O W S A N D E V E N T S
The Volkswagen Group brands presented a wide range of models at
the motor shows in Hanover and Paris in the third quarter and the
beginning of the fourth quarter of 2014. The highlight was the
world premiere of the new Passat in Potsdam.
World premiere of the new Passat
The Passat is one of the most popular mid-range models worldwide
and the most successful company car in Europe. In July, the
Volkswagen Passenger Cars brand unveiled the eighth generation
of the bestseller, which is again available as a saloon and an estate,
at the Volkswagen Design Center in Potsdam. This Passat heralds a
new era for design, engines and drive systems, infotainment and assistance systems, as well as safety, convenience and driving
pleasure. Its proportions are more dynamic than its predecessor’s,
with a lower body, longer wheelbase and larger wheels. Its weight
has been reduced by up to 85 kilograms, helping make this new
generation up to 20% more economical to drive. The efficient
direct injection turbocharged petrol and diesel engines cover a range from 88 kW (120 PS) to 206 kW (280 PS). For the first time,
the Passat is being offered with a plug-in hybrid drive with a system
power output of 160 kW (218 PS). The interior boasts a fully digital
Active Info Display and a head-up display, which displays infor-
mation in the driver's line of vision. The new Passat also marks the
debut of the innovative Trailer Assist feature, which automatically controls lateral guidance when reversing with a trailer. Volkswagen
is the world’s first automobile manufacturer to offer this function.
Front Assist with City Emergency Braking and pedestrian recog-
nition, Emergency Assist (vehicle stops in an emergency) and
Traffic Jam Assist round off the range of assistance systems offered.
IAA Commercial Vehicles show in Hanover
“Work. Life. Solutions.” was the exhibition slogan chosen by Volks-
wagen Commercial Vehicles for the show. The brand presented its
full range of light commercial vehicles based on the Amarok, Caddy,
Crafter and Multivan/Transporter series, which offers an unrivaled
variety of mobility solutions for goods and passenger transport. Volkswagen Commercial Vehicles presented innovations in all
model series with an emphasis on powerful drive systems with the
highest possible fuel economy. The brand’s first model in the
electrification of its portfolio, the e-Load up!, attracted particular
interest. This vehicle is especially suited to courier or service traffic
on routes of up to 100 km. Visitors were also given an insight into the numerous passenger and goods transport solutions that will be
offered by the next generation of Multivans/Transporters with the
TRISTAR. The concept vehicle represents a successful combination
of the best features of the current T model series. Its extreme off-road capability combined with flexible transport and storage
solutions make the TRISTAR the perfect service, transport, or
surfing vehicle.
The Scania brand’s exhibition centered on sustainable inno-
vations and new services and demonstrated how truck and bus
companies can improve their profitability. Highlights included the economical 13-liter engine with SCR (selective catalytic reduction)
exhaust gas aftertreatment and the improved Scania retarder (a key
component of the integrated braking system) with a new fuel-saving
freewheeling function. Buses and trucks can also save fuel with the
new version of Scania’s Eco-roll system, which now selects gears
even more intelligently on downward slopes. Scania also demon-strated the further savings potential offered by the use of new low-
viscosity oils with unique lubricating qualities. In the bus segment,
visitors were particularly interested in the Scania Citywide LE
featuring Scania’s own hybrid technology. The brand’s showing was
rounded off by numerous new and improved services intended to
enhance customers’ overall profitability. MAN also focused on efficiency technologies. The new MAN TGX
EfficientLine, which is designed to reduce fuel consumption, is
equipped with the GPS-based cruise control system EfficientCruise,
offering fuel savings of up to 6%. The MAN TGM with a 206 kW
(280 PS) CNG engine provided an insight into the potential offered
by economical natural gas-powered engines in trucks. MAN cele-brated the world premiere of its flagship TGX D38 with up to 471 kW
(640 PS), which offers superior performance with low overall
running costs thanks to its efficiency technologies. MAN also showed
visitors the variety of drive systems available for buses, exhibiting
the MAN Lion’s City with CNG, hybrid and Euro 6 diesel engines.
MAN Solutions, which focuses on the interweaving of services that provide the customer with valuable opportunities to reduce costs,
also presented a host of innovations at the IAA Commercial Vehicles
show.
Mondial de l’Automobile in Paris
After unveiling the eighth generation Passat in July 2014, the Volkswagen Passenger Cars brand exhibited the new Passat GTE
with a plug-in hybrid system for the first time at the Paris Motor
Show. A 115 kW (156 PS) 1.4 l TSI engine and an 85 kW (115 PS)
electric motor combine to generate system power of 160 kW
(218 PS). In all-electric driving, it can cover over 50 km, with a total
range of more than 1,000 km. The premiere of the XL Sport study also caught visitors’ attention. Powered by the world’s most
powerful two-cylinder engine with 147 kW (200 PS) from Ducati,
this highly efficient sports car, which was designed based on the
Key Events

U P D AT E D I N F O R M AT I O N
Key Events
3
aerodynamic XL1, can reach a maximum speed of 270 km/h. The
XL Sport is also the 200 millionth car to be produced by the Volks-wagen Group. Paris also saw the debuts of the robust Golf Alltrack
and sporty Polo GTI.
Audi impressed visitors in Paris with its Audi TT Sportback con-
cept. Its high-performance 294 kW (400 PS) 2.0 TFSI engine takes
the car from 0 to 100 km/h in less than 4 seconds. Inside, the Audi
virtual cockpit – a 12.3-inch screen that replaces the traditional instruments and the MMI display – dominates. The brand also
exhibited the efficiency champion of the premium class, the new
Audi A6 ultra. It delivers the perfect combination of efficiency and
performance: a powerful 140 kW (190 PS) engine, average fuel con-
sumption of just 4.2 l over 100 km and low CO2 emissions of
109 g/km. The brand’s showing was rounded off by the new TTS
Roadster. The two seater features an output of 228 kW (310 PS),
making it 14% more powerful than its predecessor, and techno-
logical highlights such as matrix LED headlights.
The world premieres of the new generation Fabia and Fabia
estate models were the highlight of the ŠKODA stand. The small car
has been completely redeveloped for its third edition, which is most apparent in the design concept. Among other features, it is now
possible to connect to the car’s infotainment system with a smart-
phone. The new Fabia is also equipped with innovative assistance
systems such as the multi-collision brake.
SEAT celebrated the debut of the Leon X-PERIENCE, a new and
robust member of the Leon family, in Paris. Permanent all-wheel drive, powerful yet efficient TDI and TSI engines with up to 135 kW
(184 PS) and a variety of assistance systems guarantee driving plea-
sure on any road.
Bentley showcased its new flagship model, the Mulsanne Speed,
which is the very epitome of luxury and performance. The selectable
sport mode and 395 kW (537 PS) performance offer drivers a par-ticularly dynamic experience. The 6.75 l V8 engine takes the vehicle
from 0 to 100 km/h in 4.9 seconds. Its top speed is 305 km/h.
Lamborghini presented its first concept car with plug-in hybrid
technology, the Asterion LPI 910-4. Its 449 kW (610 PS) V10 engine,
together with three electric motors with a combined output of
220 kW (300 PS), guarantee an exciting driving experience. The car’s CO2 emissions are a low 98 g/km and it can cover 50 km in all-
electric city driving with zero emissions.
Porsche revealed its Cayenne S E-Hybrid to the world for the
first time. It is the first premium SUV and the brand’s third series
model with a plug-in hybrid drive. The electric motor’s output is
more than twice that of the earlier Cayenne S Hybrid, up from 34 kW (47 PS) to 70 kW (95 PS). Total consumption has been reduced
by almost 60% – from 8.2 l to 3.4 l per 100 km – and CO2 emissions
have been brought down from 193 g/km to 79 g/km.
Bugatti celebrated the conclusion of its “Les Légendes de
Bugatti” edition, presenting the Veyron 16.4 Grand Sport Vitesse
“Ettore Bugatti”, which is dedicated to the automotive pioneer and
company founder. The body of the vehicle is made of hand-polished
aluminum and dark blue exposed carbon, while the interior is finished with platinum.
Ducati showcased its new retro bike in the French capital. The
Scrambler model is available in four versions: Icon, Urban Enduro,
Classic and Full Throttle. The motorcycle has an 803 cc engine that
delivers 55 kW (75 PS).
AWA R D S
Volkswagen celebrated a double victory at the Silvretta E-Auto
Rally: the e-Golf was named overall winner for the third time, while
the e-up! came first in the demanding efficiency rating for the
second time in a row. In high alpine terrain, the Volkswagen
Passenger Cars brand’s electric cars proved their suitability for everyday use with a daily performance range of up to 134 kilometers.
Audi took first place in several categories in the first ever survey
conducted by “auto motor und sport” and “CHIP”, in which more
than 42,500 readers chose the best connectivity features. The par-
ticipants were particularly impressed by the Audi MMI navigation
plus system, the Audi phone box and the Bang & Olufsen Sound System in the Audi S3. The Audi TT also took the prize for the best-
connected car in the “Connected Cars” category. Connectivity is fast
becoming a megatrend and describes the communication between
a car and its environment – drivers, the Internet, infrastructure and
other vehicles.
The Touran came out top in the van category in the reader road test organized by specialist journal “auto TEST”. After three days of
intensive testing, independent readers crowned the Touran the
winner due to its flexibility, comfort and superior drive system,
among other features.
The Golf was awarded the maximum rating of five stars in the
Korean NCAP crash test. In addition to its crash performance in front, side and rear collisions, Volkswagen’s bestseller also
impressed with regard to pedestrian protection, rollover resistance
and braking performance. Additional points were given for the
seatbelt reminder system for drivers and passengers. The Audi A6
was also awarded the highest rating of five stars.
In August 2014, two Volkswagen Group brands won awards in the communication design category of the internationally renowned
“Red Dot Awards” design competition. Volkswagen received the
prize for the “Das Auto.Magazin” print publication and app, and
the film “Paralympics”. Audi also impressed the jury with its “Audi
eKurzinfo” logbook app. This application allows customers to find
operating information for their Audi using their smartphone. Every year, the readers of “auto motor und sport” award the
best new car design of the past twelve months with the “autonis”
prize. This year, the Golf Sportsvan beat the competition in the vans
category by a long way. The all-rounder, which has been available in
Germany since the end of May, impressed with its space-oriented
vehicle concept and sporty proportions.

U P D AT E D I N F O R M AT I O N
Key Events
4
Audi was voted the most sustainable company in the “Sustainability
Image Score” sustainability rankings produced by consultancy Facit Research. The annual study is based on a survey of German con-
sumers. In 2014, a representative sample of more than 8,000
consumers rated 104 companies in 16 industries. Audi led the
rankings in all three aspects of sustainability – economic, environ-
mental and social.
The Volkswagen Passenger Cars brand was also acknowledged for its economic, environmental and social responsibility, receiving
the “Nachhaltigkeitspreis 2014” (Sustainability Prize 2014) with
a “Gold” rating. The Germany-wide survey was conducted by
“DEUTSCHLAND TEST”, “FOCUS MONEY” and the consultancy Fak-
tenkontor. Volkswagen received the highest rating of 37 automobile
brands. It scored particularly highly for economic responsibility, meaning commitment to economic success and hence stable
employment.
Volkswagen Passenger Cars’ “Think Blue. Factory.” environ-
mental program won the “National Energy Globe Award Germany”
in July 2014. The careful use of resources in production was one of
the key factors in the program being voted the country’s best environmental project. Since 1999, the annual prize has been
awarded to regional, national and international environmental
projects.
The Eastern Cape Exporters Club awarded Volkswagen Group
South Africa its highest environmental prize, the “SJM Flex Envi-
ronmental Award”, for the third consecutive year. The continuous reduction of its carbon footprint and the considerable decline in the
waste produced by the paint shop in Uitenhage helped Volkswagen
Group South Africa stand out against other exporters.
The MAN Lion’s City GL CNG received the “Bus of the Year 2015”
award in the Bus Euro Test. The low-pollution, climate-friendly
articulated bus with Euro 6 technology impressed the jury of European trade journalists. Fueled by biogas or e-gas, operation of
the bus is almost carbon neutral. The vehicle concept also con-
tributed to its high rating: as the only five-door on the market, it
ensures optimal passenger flow and short stop times.
Volkswagen Commercial Vehicles won the “Deutscher Nutz-
fahrzeugpreis 2014” (German Commercial Vehicle Prize 2014) for the Amarok. The jury, which consisted of business- and trades-
people, compared the pickups available in Germany. Their eval-
uation took into account numerous factors, such as the driver’s cab,
load bed, environmental impact, workmanship, operation and
safety.
A N N I V E R S A R I E S
The Volkswagen Group celebrated a special anniversary at the Paris
Motor Show: the production of its 200 millionth vehicle. As the
anniversary vehicle, the XL Sport study was presented for the first
time. Volkswagen is one of the few automobile manufacturers in the
world to reach this impressive figure. Since 1999, the Group has doubled the number of vehicles it has produced.
On July 11, 2014 the world’s six millionth Audi with quattro tech-
nology left the production facilities in Ingolstadt. Permanent all-wheel drive was launched in 1980 with the legendary Ur-quattro
and has been a focus of the brand’s success ever since. Today,
almost every second Audi produced is fitted with quattro technol-
ogy, which is available across all models. With around 170 quattro
variants, Audi now offers the biggest selection of all-wheel drives of
any premium manufacturer. The world’s two millionth Golf estate rolled off the production
line in Zwickau on August 11, 2014. In 1993, production of the
popular model variant started in Wolfsburg and Osnabrück with the
third-generation Golf. The model also went into production in
Bratislava and Puebla in the years that followed. Since 2013, the
latest generation of the Golf estate has been produced exclusively in Zwickau.
Audi celebrated a special anniversary in September 2014:
25 years since the brand with the four-ring emblem first presented
a TDI engine at the IAA in Frankfurt am Main. This efficiency tech-
nology was a pioneering achievement and has been a huge success
on the road and racetrack since 1989. To date, Audi has sold around 7.5 million vehicles with TDI engines. At the legendary 24 Hours of
Le Mans race, Audi cars with TDI engines have already crossed the
finish line victorious eight times since 2006. Audi is continuously
developing the TDI engine and is taking its next major step with the
electrification of the drive system: thanks to the combination of a
twin turbocharged V6 TDI engine and an additional electric turbocharger, the current Audi RS 5 TDI delivers an output of
283 kW (385 PS). The electric turbocharger builds power excep-
tionally quickly and smoothly even at low revs.
On September 22, 2014 the Wolfsburg production line deliv-
ered its 42 millionth vehicle since production began in 1945. The
anniversary model was a Golf GTE with a plug-in hybrid drive system. The Golf, Golf Sportsvan, e-Golf, Golf GTE, Touran and
Tiguan models are currently produced in Wolfsburg.
The SEAT brand is celebrating a special anniversary this year:
the Ibiza is turning 30. This first car to be completely developed by
SEAT debuted in 1984 and brought the brand worldwide fame.
Since the compact model’s market launch, around five million vehicles have been sold worldwide across four generations. The
Ibiza is now available in three body types: the sporty three-door SC,
the five-door all-rounder and the elegant ST estate.
C A PA C I T I E S A N D C A PA B I L I T I E S
The Volkswagen Group will expand its production capacities in China with the construction of two new plants in Qingdao and
Tianjin. Together with our Chinese joint venture partner FAW we
are investing around €2 billion in the new factories, which will help
meet customer demand locally. The highly qualified workforce and
the existing infrastructure in the region were key factors in
choosing the cities, which are located on the east coast.

U P D AT E D I N F O R M AT I O N
Key Events
5
Due to the significant demand for the Porsche Cayenne, Volks-
wagen’s Osnabrück plant will take over part of the final assembly of this model starting in summer 2015. The Cayenne is currently
finished exclusively in the Leipzig plant. Relocating part of the final
assembly from Leipzig to Osnabrück will optimize plant capacity
utilization throughout the Group’s production network.
At the end of 2016, the new midsize Volkswagen SUV developed
specially for the North American market will start production at the Chattanooga location in the USA as the second model alongside the
US Passat. The new vehicle, which is based on the CrossBlue study,
will play a key role in the Volkswagen Group’s presence in the USA.
Volkswagen Group of America is investing a total of around USD 900
million in the construction of the additional production line and the
establishment of an independent National Research & Develop-ment and Planning Center in Chattanooga. This will create 2,000
new jobs. The location will be further strengthened by around 200
qualified engineers, who will be responsible for project manage-
ment for the North American market, ensuring customers’ needs
are optimally met.
Volkswagen India is investing €30 million in a new assembly line for a TDI engine specially developed for the Indian market at
the Pune plant. The investment will create more than 260 jobs.
Production, which will further improve the local value added, is due
to start at the end of 2014.
To further expand its expertise and capabilities in the field of
vehicle connectivity, the Volkswagen Group acquired BlackBerry’s European research and development center in Bochum and estab-
lished Volkswagen Infotainment GmbH in July 2014. Connectivity
between vehicles, with infrastructure, drivers and the Internet will
be a key feature of the car of the future, particularly where conve-
nience and driving safety are concerned.
The Audi brand opened its high-tech complex in Neuburg an der Donau in August 2014, after a construction period of two years.
The complex accommodates the Motorsport Competence Center,
the Audi driving experience center and some of the brand’s
Technical Development functions under one roof.
VO L K SWA G E N ’ S R AT I N G U P G R A D E D
On September 23, 2014, rating agency Standard & Poor’s raised its
short-term and long-term ratings for Volkswagen AG, Volkswagen
Financial Services AG and Volkswagen Bank GmbH by one notch to
A-1 (previously A-2) and A (previously A-). The outlook for all three
companies is “stable”. The upgrade reflects the ongoing improve-
ment forecast in debt metrics, buoyed by higher profitability and rising cash flows in the Automotive Division. A stable rating,
underpinned by solid financial key performance indicators, is
essential to Volkswagen’s financial flexibility in obtaining external
financing in the capital markets.
VO L K SWA G E N L I ST E D I N D O W J O N E S S U STA I N A B I L I T Y I N D I C E S
In its annual review of its sustainability rankings, rating agency
RobecoSAM again selected the Volkswagen Group for listing in the
Dow Jones Sustainability Index (DJSI) World and the DJSI Europe.
Apart from Volkswagen, only one other automotive company quali-fied for both indices. In the industrial engineering sector, MAN is
the only German company to be represented in the DJSI World and
DJSI Europe for the third consecutive year. In this year’s rankings,
MAN improved its performance with regard to social factors and
scored particularly highly in the areas of environmental manage-
ment, risk management and compliance. The DJSI is an important benchmark on the performance of the most sustainably run com-
panies worldwide.
D E C L A R AT I O N O N I N C L U S I O N A D O P T E D
The Volkswagen Group’s Board of Management, Works Council and
the Representative Body for Disabled Employees signed a joint declaration on inclusion in July 2014, which lays out the objectives
for the Group in Germany. Inclusion is thus now firmly anchored in
the corporate culture. The valuable contribution that employees with
restrictions on their ability to work make to our everyday activities is
given equal recognition. Among other things, the agreement aims
to ensure that people with disabilities are given tasks that allow them to make optimal use of their strengths and extend their capabilities.
In addition, the training opportunities available to disabled young
people within the Volkswagen Group are to be increased, so
barriers in the application process are being further reduced.
Volkswagen invests continuously in accessibility, with new
buildings generally constructed to ensure they are accessible to everybody. If necessary, buildings are remodeled and accessible
workplaces are created.
G R O U P B OA R D O F M A N A G E M E N T M E M B E R F O R P R O D U C T I O N
L E AV E S VO L K SWA G E N
As of August 1, 2014 Dr. Michael Macht stepped down from his position as member of the Board of Management of Volkswagen
Aktiengesellschaft with responsibility for Production by mutual
agreement with the Supervisory Board of Volkswagen Aktiengesell-
schaft. Mr. Thomas Ulbrich, member of the Board of Management
with responsibility for Production at the Volkswagen Passenger Cars
brand, has taken over the responsibilities temporarily until a succes-sor is appointed. Dr. Macht was appointed as member of the Group
Board of Management with responsibility for Production in 2010.
The Group Board of Management wishes to thank him for his service.

I N T E R I M M A N A G E M E N T R E P O R T
Volkswagen Shares
6
After a mixed first six months, international equity markets remained volatile overall in the third quarter of 2014 in light of the
conflict between Russia and Ukraine and the tensions in the Middle
East. Buoyed by positive labor market data from the USA and hopes
that the European Central Bank would continue its expansionary
monetary policy, prices initially rose for a short time, with the DAX
reaching a new high at the beginning of July. Fears that the crisis in Ukraine and political tensions in the Middle East would escalate
then led to a strong downward trend until mid-August. Capital
market participants were also unsettled by concerns about payment
problems at Portuguese banks and negative economic indicators
from Europe. Prices were supported by hopes that the Federal
Reserve would keep monetary policy loose; this combined with healthy corporate data from the USA to bring about a temporary
recovery. Towards the end of the reporting period, weaker-than-
expected macro data from the USA caused prices to fall.
The DAX closed at 9,474 points on September 30, 2014, down
0.8% on the 2013 year-end level. The EURO STOXX Automobiles &
Parts closed at 435 points, down 5.4% on the level at the end of 2013.
Volkswagen AG’s preferred and ordinary share prices mirrored
the volatile performance of the market as a whole in the third
quarter of 2014. The price of ordinary shares grew at a faster pace
than the preferred shares. Reports of slower economic growth in China and concerns that the economic recovery in Europe was
coming to an end unnerved investors in the automotive industry,
causing share prices to fall sharply until the beginning of August.
Volkswagen shares rose as August progressed in line with the
market trend. However, both classes of share fell again towards the
end of the reporting period, underperforming the market as a whole, which also declined.
Volkswagen’s preferred shares reached their highest daily
closing price of the reporting period (€203.35) on January 17, 2014.
They ended the first nine months at their low for the period of
€164.40, down 19.5% on the 2013 closing price. Volkswagen AG’s
ordinary shares also hit their highest closing price in the first nine months of 2014 (€197.35) on January 17, 2014 and their lowest
closing price (€164.25) on September 29, 2014. The ordinary shares
ended the reporting period at €164.30, down 16.6% on the price at
the end of 2013.
Information and explanations on earnings per share can be
found in the notes to the interim consolidated financial statements. Additional Volkswagen share data, plus corporate news, reports
and presentations can be downloaded from our website at
www.volkswagenag.com/ir.
D J F M A M J J A S
70
80
90
100
110
70
80
90
100
110
Volkswagen ordinary sharesVolkswagen preferred shares
DAXEURO STOXX Automobiles & Parts
Volkswagen ordinary sharesVolkswagen preferred shares
DAXEURO STOXX Automobiles & Parts
S H A R E P R I C E D E V E L O P M E N T F R O M D E C E M B E R 2 0 1 3 T O S E P T E M B E R 2 0 1 4
Index based on month-end prices: December 31, 2013 = 100
Volkswagen Shares
I N T E R I M M A N A G E M E N T R E P O R T
Business Development
7
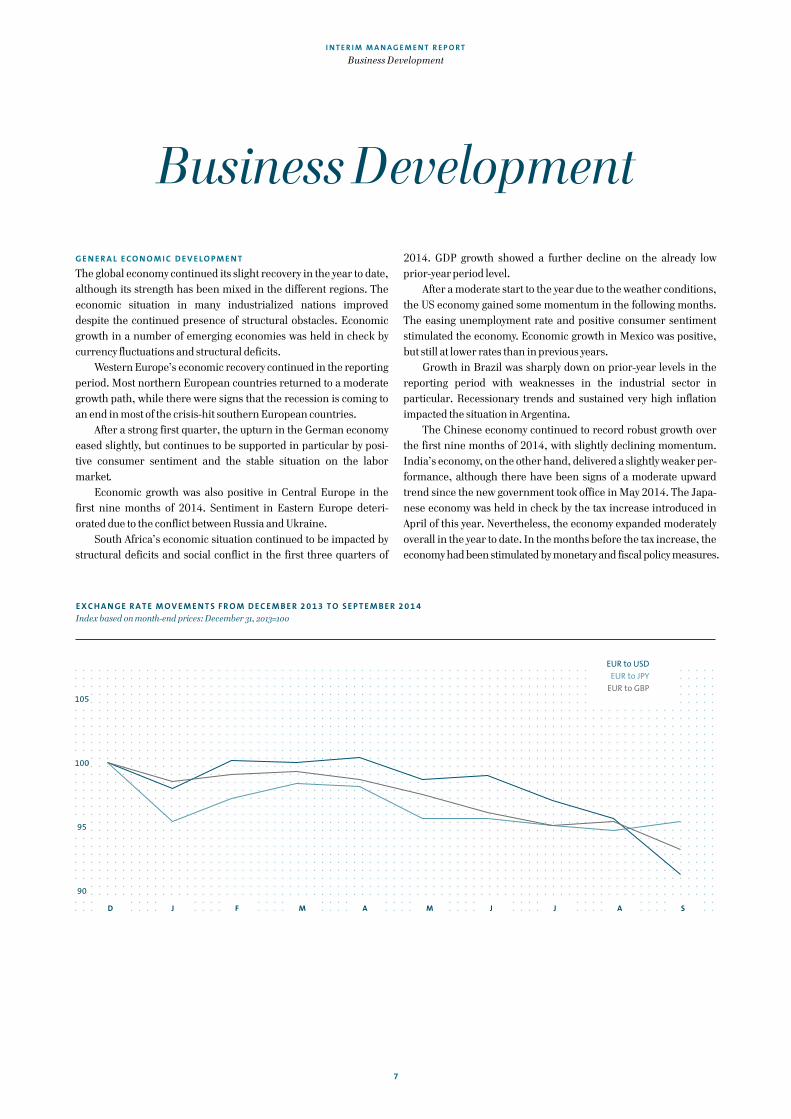
G E N E R A L E CO N O M I C D E V E L O P M E N T
The global economy continued its slight recovery in the year to date,
although its strength has been mixed in the different regions. The
economic situation in many industrialized nations improved
despite the continued presence of structural obstacles. Economic
growth in a number of emerging economies was held in check by
currency fluctuations and structural deficits. Western Europe’s economic recovery continued in the reporting
period. Most northern European countries returned to a moderate
growth path, while there were signs that the recession is coming to
an end in most of the crisis-hit southern European countries.
After a strong first quarter, the upturn in the German economy
eased slightly, but continues to be supported in particular by posi-tive consumer sentiment and the stable situation on the labor
market.
Economic growth was also positive in Central Europe in the
first nine months of 2014. Sentiment in Eastern Europe deteri-
orated due to the conflict between Russia and Ukraine.
South Africa’s economic situation continued to be impacted by structural deficits and social conflict in the first three quarters of
2014. GDP growth showed a further decline on the already low prior-year period level.
After a moderate start to the year due to the weather conditions,
the US economy gained some momentum in the following months.
The easing unemployment rate and positive consumer sentiment
stimulated the economy. Economic growth in Mexico was positive,
but still at lower rates than in previous years. Growth in Brazil was sharply down on prior-year levels in the
reporting period with weaknesses in the industrial sector in
particular. Recessionary trends and sustained very high inflation
impacted the situation in Argentina.
The Chinese economy continued to record robust growth over
the first nine months of 2014, with slightly declining momentum. India’s economy, on the other hand, delivered a slightly weaker per-
formance, although there have been signs of a moderate upward
trend since the new government took office in May 2014. The Japa-
nese economy was held in check by the tax increase introduced in
April of this year. Nevertheless, the economy expanded moderately
overall in the year to date. In the months before the tax increase, the economy had been stimulated by monetary and fiscal policy measures.
90
95
100
105
D J F M A M J J A S
90
95
100
105
EUR to USDEUR to JPY
EUR to GBP
EUR to USDEUR to JPY
EUR to GBP
E X C H A N G E R A T E M O V E M E N T S F R O M D E C E M B E R 2 0 1 3 T O S E P T E M B E R 2 0 1 4
Index based on month-end prices: December 31, 2013=100
Business Development

I N T E R I M M A N A G E M E N T R E P O R T
Business Development
8
T R E N D S I N T H E PA S S E N G E R C A R M A R K E T S
Global demand for passenger cars was higher year-on-year in the period from January to September 2014, but weakened slightly in
the course of the year. The primary growth drivers were the Asia-
Pacific region, North America, Western Europe and Central Europe.
In South America and Eastern Europe, new passenger car regis-
trations were much lower than in the prior-year period.
The passenger car market in Western Europe continued to sta-bilize in the first nine months of 2014, although market volumes
were still down substantially on pre-crisis levels. While new passen-
ger car registrations rose sharply in the United Kingdom, due
mainly to sustained high demand from private customers, and in
Spain, due in particular to the continuation of its government
purchase incentive program, demand in France and Italy increased only slightly compared with the weak prior-year level.
In Germany, new passenger car registrations in the reporting
period were up on the low prior-year figure. In addition to the posi-
tive economic environment, the slight growth was buoyed mainly by
the sharp increase in demand for vehicles for business use.
In Central and Eastern Europe, market volumes in the period from January to September 2014 were noticeably lower than in the
previous year. However, trends in the individual markets were
mixed: while the sharp fall in Eastern Europe was attributable to
poor sales in Russia and Ukraine due to the current political crisis,
new passenger car registrations in Central Europe rose sharply
overall. The South African passenger car market is still suffering from a
period of weakness primarily attributable to the economic down-
turn and higher mobility costs.
In North America, the reporting period saw a further rise in
sales compared with the prior-year figure. After weak sales caused
by the extreme weather conditions at the start of the year, the US market for passenger cars and light trucks almost reached the high
volumes seen before the economic and financial crisis began,
achieving its best sales performance since 2006. The positive trend
was supported in particular by backlog effects, higher discounts
and the robust state of the US economy. Demand was particularly
strong for models in the SUV and pickup segments. The Canadian automotive market also recorded an increase and posted a sales
record for the period from January to September. Market volumes
in Mexico rose moderately due in particular to a positive trend in
demand in the third quarter.
South America recorded the sharpest absolute market decline
worldwide in the first nine months of 2014. In Brazil, new passen-ger car registrations decreased for the second consecutive year and
were at the lowest level since 2008. In addition to the poor state of
the economy, the weak demand was due mainly to the significant
decline in consumer confidence. The market slump in Argentina
compared with the record volumes in the prior-year period was
mainly attributable to the tax increase on higher-value passenger
car purchases at the beginning of the year, together with buyer
reluctance due to decreasing real incomes and sharp increases in interest rates.
New passenger car registrations in the Asia-Pacific region rose
sharply in the period from January to September 2014. The positive
trend was buoyed by a double-digit rise in sales in the Chinese
passenger car market. The world’s largest automotive market
recorded by far the largest absolute increase in passenger car market volumes. The primary contributor to the new record was the
increase in sales of models in the SUV segment, which has been
above average for a number of years. Passenger car sales in India
were up slightly year-on-year. The recovery in the automotive market
from May 2014 onwards was supported mainly by the cut in excise
tax rates – for vehicles, among other things – which has been extended until the end of the year. In Japan, demand for passenger
cars was higher year-on-year in the first nine months of 2014.
However, the automotive market cooled noticeably from the second
quarter onwards due to the VAT increase effective April 1, 2014.
T R E N D S I N T H E M A R K E T S F O R CO M M E R C I A L V E H I C L E S
Global demand for light commercial vehicles rose modestly year-
on-year in the period from January to September 2014.
The light commercial vehicles market in Western Europe was
up on the prior year in the period under review on the back of eco-
nomic stabilization.
In Central and Eastern Europe, demand for light commercial vehicles in the first nine months of 2014 was weaker than in the
previous year, although this varied from region to region. Demand
declined in Russia and Ukraine due to political tensions and their
economic impact.
In North America, the number of new registrations for light
commercial vehicles rose year-on-year in the first nine months of 2014.
South America saw lower demand for light commercial vehicles
amid ongoing difficult economic conditions. However, Brazil
exceeded the 2013 figure thanks to higher demand for new SUVs,
which are included in light commercial vehicles in this market.
Despite the rise in the number of new SUVs registered in Argentina, demand for light commercial vehicles declined significantly as a
result of the tax hike on higher-value vehicles at the beginning of
the year.
Demand in China, the dominant market for light commercial
vehicles in the Asia-Pacific region, rose significantly year-on-year.
India suffered the effects of persistently high inflation, which eased slightly over the course of the year; demand was down significantly
on the previous year. In Japan, pull-forward effects from a VAT
increase as of April 1, 2014 saw demand increase as against the
prior-year period. Sales were mixed in the ASEAN region: While a
number of small markets saw strong growth, demand in Thailand
declined significantly after government incentive programs expired.

I N T E R I M M A N A G E M E N T R E P O R T
Business Development
9
In the first three quarters of 2014, global demand for mid-sized and
heavy trucks with a gross weight of more than six tonnes was down on the previous year.
New vehicle registrations in the Western European market
were down slightly year-on-year. Among other things, this was due
to purchases pulled forward ahead of the introduction of the Euro 6
emission standard, which had lifted the prior-year figure.
Germany, the largest market in Western Europe, recorded an appreciable increase in new vehicle registrations in the period from
January to September. New truck registrations in the period under
review were lifted by the tangible increase in investment in
machinery and equipment since January and the clearing of the
investment backlog from 2013.
Demand for vehicles in the Central and Eastern European market declined significantly as against the previous year. This was
mainly due to the still weak ruble and the more difficult financing
conditions in Russia, the region’s largest market, as a result of the
tense political situation. A scrapping bonus was introduced again in
the Russian truck market in September 2014.
In North America, in particular in the USA, new vehicle regis-trations significantly exceeded the prior-year figure in the first nine
months of 2014. Momentum in the construction and energy sector,
the labor market and ongoing high demand for replacement
vehicles in the heavy truck segment led to higher demand in the
truck market.
Sales in South America were much weaker in the first three quarters of 2014 than in the previous year. The negative trend in
the Brazilian truck market was compounded by the further deteri-
oration of the macroeconomic environment and more restrictive
financing conditions. The high inflation and the recessionary
trends in Argentina also contributed to the decline in new vehicle
registrations. Demand for mid-sized and heavy trucks in the Asia-Pacific
region – excluding the Chinese market – declined slightly in the
period under review. The Indian truck market was down signifi-
cantly year-on-year on the back of weak economic growth, high
interest rates, low industrial output and delays in implementing
infrastructure projects. However, there have been signs of an increase in infrastructure projects since the new government took
office.
Demand in the world’s largest truck market, China, was signif-
icantly lower than in the previous year due to slower economic
growth and the diminishing pull-forward effects seen previously
from the successive introduction of the latest emission standard. New bus registrations worldwide were down on the prior-year
figure in the first three quarters of 2014.
T R E N D S I N T H E M A R K E T S F O R P O W E R E N G I N E E R I N G
The markets for power engineering are subject to differing regional
and economic factors. Consequently, their business growth trends are generally independent of each other.
In the first three quarters of 2014, the market situation for large
merchant ships – such as container and freight ships – continued to be tense due to overcapacity. Demand for four-stroke engines for
merchant and special ships remained stable. Overall, the market
for marine engines saw a slightly positive trend compared with the
same period of the previous year.
In particular in developing countries and emerging markets,
the need for energy generation facilities remained high, with a strong trend towards greater flexibility and decentralized avail-
ability. The global trend towards using gas as a fuel continued.
Order placements were delayed for larger projects in particular,
due to exchange rate fluctuations and difficult financing conditions
for customers. Compared with the prior-year period, the market for
power generation as a whole was stable. The turbomachinery market is mainly dominated by contracts
awarded in connection with global investment projects in oil and
chemical facilities. Project volumes remained high in the oil and
gas industry; however, competitive pressure rose as a result of the
weak US dollar in the first half of the year and the devaluation of the
Japanese yen. Demand for turbomachinery in the processing industry remained at a low level in the reporting period, further
increasing the already strong competitive pressure due to currency-
related factors. Overall, the market for turbomachinery declined
slightly compared with the same period of the previous year.
D E M A N D F O R F I N A N C I A L S E RV I C E S
Global demand for automotive-related financial services remained
strong in the first nine months of 2014.
Business with financial services products was buoyed by the
good overall performance in Germany and the signs of recovery in
Western and Central Europe. This compensated for declining
demand on the back of lower vehicle sales in Eastern Europe. In North America, demand for financial services was up slightly
on the previous year.
Sales volumes for financial services were down moderately on
the prior-year level in the declining South American automotive
markets.
Demand for financial services in the Asia-Pacific region, and in China in particular, was higher than in the previous year – in some
areas significantly so.
In the truck and bus business, demand for financial services
products rose year-on-year despite lower deliveries. Positive busi-
ness growth in Europe offset the significant decline in truck and bus
sales in South America, in particular in the key Brazilian market, which had a corresponding negative effect on demand for financial
services.

I N T E R I M M A N A G E M E N T R E P O R T
Business Development
10
VO L K SWA G E N G R O U P D E L I V E R I E S
The Volkswagen Group delivered 7,541,982 vehicles in the period from January to September 2014, exceeding the prior-year figure
by 358,993 units or 5.0%. The delivery figures were higher in all
nine months of 2014 than in the same months of the previous year.
Separate details of deliveries of passenger cars and commercial
vehicles are provided in the following.
VO L K SWA G E N G R O U P D E L I V E R I E S
F R O M J A N UA RY 1 TO S E P T E M B E R 3 0 *
2014 2013 %
Passenger cars 7,075,013 6,690,454 + 5.7
Commercial vehicles 466,969 492,535 – 5.2
Total 7,541,982 7,182,989 + 5.0
* Deliveries for 2013 have been updated to reflect subsequent statistical trends. Includes the Chinese joint ventures. The Saveiro model is reported as a passenger car retrospectively as of January 1, 2013.
PA S S E N G E R C A R D E L I V E R I E S W O R L D W I D E
The Volkswagen Group delivered 7,075,013 passenger cars to
customers in the first three quarters of the year, exceeding the record prior-year level by 5.7%. The Volkswagen Passenger Cars
(+ 3.0%), Audi (+ 10.0%), ŠKODA (+13.0%) and Porsche (+ 13.3%)
brands recorded new highs. Since the market as a whole only grew
by 4.2% in the same period, we were able to extend our market
position and gain additional market share. Demand for Volkswagen
Group passenger cars grew particularly in the Asia-Pacific region and in Western Europe.
The table on the next page provides an overview of passenger
car deliveries to customers by market in the reporting period.
Sales trends in the individual markets are as follows.
Deliveries in Europe/Other markets
We delivered 2,210,559 vehicles in the growing passenger car
market in Western Europe in the period from January to September
of this year. This corresponds to an increase of 7.3% compared
with the previous year. Demand for Group models was up year-
on-year in all major markets in this region. The Polo, Golf, Tiguan,
Audi A3 and ŠKODA Octavia models were particularly popular. The Volkswagen Group increased its share of the passenger car market
in Western Europe to 25.0% (24.7%).
On the German passenger car market, the Volkswagen Group
sold 6.3% more vehicles in the reporting period than in the
previous year; the market as a whole grew by 2.9% in the same
period. The Golf estate, Audi A3 Cabrio and ŠKODA Rapid models recorded encouraging growth rates. Seven Group vehicles led the
Kraftfahrtbundesamt (KBA – German Federal Motor Transport
Authority) registration statistics in their respective segments: the
up!, Polo, Golf, Passat, Audi A6, Touran and Tiguan. Once again, the
Golf was the most popular passenger car in Germany in terms of
registrations in the first nine months of 2014.
The number of Volkswagen Group passenger cars delivered in
Central and Eastern Europe in the reporting period was up 2.6% on the prior-year figure. While we recorded significant growth in
Poland and the Czech Republic, among other areas, sales in Russia
and Ukraine declined as a result of the political conflict. Demand for
the Golf estate, Audi A3, ŠKODA Rapid, ŠKODA Superb and SEAT
Leon models recorded particularly positive growth. The Group
increased its share of the passenger car market to 17.6% (15.6%). We sold fewer vehicles in the declining passenger car market in
South Africa in the period from January to September 2014 than in
the previous year (– 5.5%). However, the Golf, Audi A3 and Audi Q3
models recorded increased demand.
Deliveries in North America
In North America, the number of Volkswagen Group vehicles deliv-
ered in the reporting period was down 1.8% year-on-year; the
Group’s market share was 4.5% (4.8)%. The Jetta remained the
Group’s bestselling model in North America.
The market as a whole in the USA grew by 5.5% in the first nine
months of 2014. This increase mainly took place in the SUV seg-ment, while most other segments stagnated. The Volkswagen Group
delivered 5.1% fewer vehicles to customers than in the comparable
prior-year period. Demand for the Audi Q5, Audi A6, Audi Q7,
Porsche 911 Coupé and Porsche Panamera models recorded posi-
tive growth.
After a decline in the first quarter of 2014, our deliveries to cus-tomers in the Canadian market increased significantly, exceeding
the prior-year figure in the reporting period by a total of 10.2%. The
Tiguan and Audi A3 models recorded the strongest growth.
Group sales in Mexico exceeded the prior-year figure by 3.5%
in the first nine months of 2014. Demand for the Gol, Audi A3, SEAT
Leon and SEAT Toledo models and for the newly launched Vento was very encouraging.
Deliveries in South America
Conditions in the highly competitive South American markets
increasingly deteriorated in the first nine months of 2014. Deliv-
eries made to Volkswagen Group’s customers decreased by 18.6% in this period compared with the previous year. The Volkswagen
Group’s share of the passenger car market in this region was 17.7%
(19.0%).
In the Brazilian market, demand for Group vehicles fell by
12.8% year-on-year in the period from January to September 2014.
The Saveiro, Golf, Audi A3 and Audi Q3 models saw increases. The up! was successfully launched in the market. The Gol remained the
bestselling passenger car model in Brazil.
The Group’s sales in Argentina were down 42.2% year-on-year
in the reporting period. The Gol continued to record high demand.

I N T E R I M M A N A G E M E N T R E P O R T
Business Development
11
Deliveries in the Asia-Pacific region
In the Asia-Pacific region, we delivered 13.9% more passenger cars to customers in the period from January to September of this year
than in the same period of 2013. Since the market as a whole grew
by a mere 8.2%, the Group’s market share in this region increased
to 13.4% (12.8%).
The Chinese passenger car market remained the growth driver
in the Asia-Pacific region. The Volkswagen Group delivered 15.2% more vehicles to customers there in the reporting period than in the
previous year. The Golf, Santana, Gran Lavida, Audi Q3 and ŠKODA
Rapid models recorded the highest growth rates compared with the
previous year. In Japan, we delivered 5.7% more vehicles to customers in the
period from January to September of this year than in 2013. The
passenger car market as a whole grew by 5.8% during this period.
The Polo, Golf, and Audi A3 models in particular saw increases.
In the declining Indian passenger car market, the Volkswagen
Group sold 28.3% fewer vehicles in the reporting period than in the previous year. The most sought-after Group model was the Polo; the
Vento, Audi Q3 and ŠKODA Rapid models were also popular.
PA S S E N G E R C A R D E L I V E R I E S TO C U STO M E R S B Y M A R K E T F R O M J A N UA RY 1 TO S E P T E M B E R 3 0 *
D E L I V ER I E S ( U N I T S) C H A N G E
2014 2013 (%) Europe/Other markets 2,939,653 2,789,116 + 5.4
Western Europe 2,210,559 2,060,124 + 7.3
of which: Germany 823,411 774,933 + 6.3
United Kingdom 405,329 361,443 + 12.1
France 183,955 181,870 + 1.1
Spain 157,463 133,776 + 17.7
Italy 145,456 133,946 + 8.6
Central and Eastern Europe 453,306 441,800 + 2.6
of which: Russia 187,273 214,530 – 12.7
Czech Republic 75,137 60,088 + 25.0
Poland 72,852 55,215 + 31.9
Other markets 275,788 287,192 – 4.0
of which: Turkey 84,306 88,666 – 4.9
South Africa 76,430 80,903 – 5.5
North America 649,212 661,395 – 1.8
of which: USA 439,576 463,186 – 5.1
Mexico 136,511 131,831 + 3.5
Canada 73,125 66,378 + 10.2
South America 508,378 624,444 – 18.6
of which: Brazil 406,871 466,784 – 12.8
Argentina 72,907 126,079 – 42.2
Asia-Pacific 2,977,770 2,615,499 + 13.9
of which: China 2,715,138 2,357,228 + 15.2
Japan 76,937 72,784 + 5.7
India 50,667 70,688 – 28.3
Worldwide 7,075,013 6,690,454 + 5.7
Volkswagen Passenger Cars 4,563,260 4,430,669 + 3.0
Audi 1,298,643 1,180,748 + 10.0
ŠKODA 774,062 684,946 + 13.0
SEAT 294,014 266,115 + 10.5
Bentley 7,786 6,516 + 19.5
Lamborghini 1,570 1,688 – 7.0
Porsche 135,642 119,747 + 13.3
Bugatti 36 25 + 44.0
* Deliveries for 2013 have been updated to reflect subsequent statistical trends. Includes the Chinese joint ventures. The Saveiro model, which is sold mainly in South America, is reported in the Volkswagen Passenger Cars brand retrospectively as of January 1, 2013.

I N T E R I M M A N A G E M E N T R E P O R T
Business Development
12
CO M M E R C I A L V E H I C L E D E L I V E R I E S
The Volkswagen Group delivered a total of 466,969 commercial
vehicles worldwide in the first nine months of 2014, 5.2% fewer
than in the prior-year period. Of this figure, 127,372 units (–6.9%) were trucks and 14,499 units (–16.2%) were buses. Sales by the
Volkswagen Commercial Vehicles brand were down 3.9% on the
prior-year figure, with 325,098 vehicles delivered. Scania delivered
56,193 vehicles to customers in the period from January to Sep-
tember, remaining on a level with the previous year. At MAN, the
figure was 85,678 vehicles, 12.5% fewer than in the prior-year period.
The Volkswagen Group increased its deliveries in the Western
European market by 5.2% in the first three quarters of 2014, to
260,759 commercial vehicles. This was due to the continued
improvement in the economic environment. A total of 213,161 light
commercial vehicles and 45,154 trucks were sold. The Caddy and the Transporter were in particularly high demand.
In Central and Eastern Europe, Volkswagen Group sales
amounted to 46,214 units (–2.8%); of these, 27,827 were light
commercial vehicles and 17,927 were trucks. Demand for the
Transporter and the Caddy was also highest here. At 16,701 units
(–18.3%), deliveries to customers in Russia were down on the prior-year period as a result of the political tensions.
In the Other markets, demand for Volkswagen Group commercial
vehicles slightly exceeded the prior-year level, at 50,592 units.
32,872 light commercial vehicles, 15,888 trucks and 1,832 buses
were delivered. In North America, we delivered 1,532 more units to customers
in the reporting period, a total of 5,932: 4,396 light commercial
vehicles, 280 trucks and 1,256 buses.
The figure for deliveries of the Group’s commercial vehicle
brands in the South American market fell by 34.9% to a total of
77,948 units; of these, 30,022 were light commercial vehicles, 40,930 were trucks and 6,996 were buses. However, demand for
the Amarok increased – an encouraging development. In Brazil,
demand for commercial vehicles was negatively impacted by the
further deterioration of the macroeconomic environment and the
more difficult financing conditions. Sales there dropped by 38.1%
to 56,683 units; of this figure, 13,889 were light commercial vehicles, 36,874 were trucks and 5,920 were buses.
In the Asia-Pacific region, the Group sold 25,524 commercial
vehicles (+12.6%), of which 16,820 were light commercial vehicles
and 7,193 were trucks. The Amarok and the Transporter were the
most sought-after Group models.
500
600
700
800
900
1,000
500
600
700
800
900
1,000
J F M A M J J A S O N D
2014201320142013
V O L K S W A G E N G R O U P D E L I V E R I E S B Y M O N T H
Vehicles in thousands

I N T E R I M M A N A G E M E N T R E P O R T
Business Development
13
CO M M E R C I A L V E H I C L E D E L I V E R I E S TO C U STO M E R S B Y M A R K E T F R O M J A N UA RY 1 TO S E P T E M B E R 3 0 *
D E L I V ER I E S ( U N I T S) C H A N G E
2014 2013 (%)
Europe/Other markets 357,565 345,726 + 3.4
Western Europe 260,759 247,921 + 5.2
Central and Eastern Europe 46,214 47,541 – 2.8
Other markets 50,592 50,264 + 0.7
North America 5,932 4,400 + 34.8
South America 77,948 119,744 – 34.9
of which: Brazil 56,683 91,520 – 38.1
Asia-Pacific 25,524 22,665 + 12.6
of which: China 4,823 3,575 + 34.9
Worldwide 466,969 492,535 – 5.2
Volkswagen Commercial Vehicles 325,098 338,429 – 3.9
Scania 56,193 56,224 – 0.1
MAN 85,678 97,882 – 12.5
* Deliveries for 2013 have been updated to reflect subsequent statistical trends. The Saveiro model, which is sold mainly in South America, is reported in the Volkswagen Passenger Cars brand retrospectively as of January 1, 2013.
D E L I V E R I E S I N T H E P O W E R E N G I N E E R I N G S E G M E N T
Orders in the Power Engineering segment are usually part of major
investment projects. Lead times typically range from just under one
year to several years, and partial deliveries as construction
progresses are common. Accordingly, there is a time lag between
incoming orders and sales revenue from the new construction
business. In the first nine months of 2014, sales revenue in the Power
Engineering segment was largely driven by Engines & Marine
Systems and Turbomachinery, which together generated a good
two-thirds of overall sales revenue.
G R O U P F I N A N C I A L S E RV I C E S
Demand for Volkswagen Financial Services’ products and services
remained strong in the reporting period. The financial services
business of MAN Finance International GmbH has also been
included in this division since January 1, 2014; the prior-year
figures were adjusted accordingly. The number of new financing,
leasing, service and insurance contracts signed worldwide rose to 3.6 million, exceeding the comparable prior-year figure by 17.4%.
The total number of contracts grew to 12.0 million as of September
30, 2014, 14.6% higher than at the reporting date in the previous
year.
In Europe, 2.5 million new contracts were signed in the first
nine months of the year. This corresponds to an increase of 20.9%
compared with the prior-year period. At the end of September, the total number of contracts signed was 8.2 million (+11.0%), with
customer finance and leasing contracts accounting for 4.6 million
of this figure (+8.6%).
The number of contracts in North America grew by 15.3% year-
on-year to 2.0 million as of the end of the third quarter of 2014. Of
this figure, 1.5 million were customer finance and leasing contracts (+10.9%). At 597 thousand, the number of new contracts signed
exceeded the prior-year figure by 9.3%.
In South America, the number of new contracts in the reporting
period dropped by 58.8%, to 113 thousand; this resulted in partic-
ular from lower sales figures in Brazil. In addition, higher interest
rates there had a negative impact on customer financing. At 0.8 mil-lion, the total number of contracts as of September 30, 2014 was
down 0.2% on the prior-year reporting date. The contracts were
mainly attributable to the Customer Financing/Leasing area.
In the period from January to September 2014, 433 thousand
(214 thousand) new contracts were signed in the Asia-Pacific region,
more than double the prior-year figure. The total number of con-tracts grew by 79.1% to 1.0 million at the end of the third quarter of
2014. The Customer Financing/Leasing area accounted for 799
thousand contracts (+70.8%).

I N T E R I M M A N A G E M E N T R E P O R T
Business Development
14
S A L E S TO T H E D E A L E R O R G A N I Z AT I O N
In the reporting period, the Volkswagen Group’s unit sales to the dealer organization – including the Chinese joint ventures –
amounted to 7,645,947 vehicles, exceeding the prior-year figure by
5.6%. As a result of the high demand for Group models in China
and in other European countries, the number of vehicles sold out-
side Germany rose by 5.5%. In the German market, sales climbed
by 6.4%; vehicles sold in Germany as a proportion of overall sales slightly exceeded the prior-year figure, at 12.3% (12.2%).
P R O D U C T I O N
The Volkswagen Group produced 7,638,082 vehicles in the period
from January to September of this year, surpassing the prior-year
figure by 5.6%. 1,898,189 vehicles were produced in Germany, exceeding the figure for the same period in the previous year by
4.1%. The proportion of vehicles produced in Germany declined to
24.9% (25.2%).
I N V E N TO R I E S
Global inventories at Group companies and in the dealer organi-zation were higher on September 30, 2014 than at year-end 2013
and at September 30, 2013.
N U M B E R O F E M P LOY E E S
At the end of the third quarter of 2014, the Volkswagen Group had
564,590 active employees; a further 7,671 employees were in the passive phase of their partial retirement. An additional 18,553
young people were in vocational traineeships. The Volkswagen
Group had a total of 590,814 employees worldwide at the end of
September 2014, up 3.1% on the number as of December 31, 2013.
The expansion of the workforce is a result of increased production
and the recruitment of specialists and experts. The number of employees in Germany was 269,051, up 3.3% on the end of 2013.
At 45.5%, the proportion of employees in Germany was at the same
level as the previous year.

I N T E R I M M A N A G E M E N T R E P O R T
Results of Operations, Financial Position and Net Assets
15
On March 14, 2014, Volkswagen AG made a voluntary tender offer to Scania for all shares not previously held by Volkswagen either
directly or indirectly. 36.93% of all Scania shares were acquired on
the successful completion of the offer. Volkswagen held 99.57% of
Scania’s share capital at the end of the reporting period; this corre-
sponded to 99.66% of the voting rights. Volkswagen has initiated a
squeeze-out for the remaining Scania shares. The transaction reduced equity by €6.7 billion. €6.5 billion was paid for the shares
acquired in 2014; a liability was recognized in the balance sheet
without affecting profit or loss for the shares to be acquired in the
squeeze-out.
To partially fund the transaction, the Company resolved and
implemented a capital increase in June 2014, under which new preferred shares were issued from authorized capital against cash
contributions, while disapplying shareholders’ preemptive rights.
This increased the share capital by a notional €26.8 million and
generated gross proceeds totaling €2.0 billion.
R E S U LT S O F O P E R AT I O N S O F T H E G R O U P
The Volkswagen Group generated sales revenue of €147.7 billion in
the first nine months of this year, slightly exceeding the prior-year
figure (€145.7 billion). The clearly negative exchange rate effects
seen in the first half of the year in particular were offset by higher
volumes and improvements in the mix. The proportion of sales
revenue generated outside of Germany was 80.1% (80.7%). Gross profit in the reporting period was €0.1 billion higher
than in the previous year, at €27.2 billion. The gross margin was
18.4% (18.6%). While optimized product costs had a positive impact,
exchange rate deterioration, increased depreciation charges
resulting from significant capital expenditures and higher upfront
investments in new products weighed on profit. Prior-year profit was impacted by contingency reserves.
The Volkswagen Group’s operating profit for the period from
January to September 2014 was €9.4 billion, €0.9 billion higher
than a year earlier. The operating return on sales was 6.4% (5.9%).
Profit before tax rose by 22.2% year-on-year to €11.5 billion.
Profit after tax was €2.0 billion higher than in 2013, at €8.7 billion.
R E S U LT S O F O P E R AT I O N S I N T H E AU TO M OT I V E D I V I S I O N
The Automotive Division generated sales revenue of €129.6 billion
(€129.2 billion) in the first three quarters of 2014. The clearly
negative exchange rate effects seen in the first half of the year in
particular were offset by positive volume and mix effects. Sales
revenue exceeded the prior-year figure in the Passenger Cars
Business Area while declining in the Commercial Vehicles/Power Engineering Business Area, mainly due to the difficult conditions in
South America. As our Chinese joint ventures are accounted for
using the equity method, the Group’s positive business growth in
the Chinese passenger car market is mainly reflected in the Group’s
sales revenue only by deliveries of vehicles and vehicle parts.
Gross profit in the Automotive Division was slightly lower than a year earlier at €23.1 billion (€23.3 billion). It was depressed by
unfavorable exchange rate trends, increased depreciation charges
as a result of high capital expenditures, greater fixed costs due to
growth factors and higher research and development costs, in par-
ticular for new drive concepts. Improved product costs had a positive
effect. The prior year had been impacted by contingency reserves in the areas of passenger cars and power engineering.
Distribution expenses increased by 3.2% in the reporting period.
The ratio of distribution expenses to sales revenue also rose slightly.
Administrative expenses and the ratio of administrative expenses to
sales revenue were on a level with the prior-year period. Other
operating income improved year-on-year to €2.8 billion (€1.4 bil-lion), mainly due to currency-related factors.
The Automotive Division posted an operating profit of €8.0 bil-
lion for the first nine months of 2014. This represented a year-on-
year increase of €0.8 billion, while profit was reduced in the first
half of the year by negative exchange rate effects. The operating
return on sales was 6.2% (5.6%). Since the profit recorded by the joint venture companies is accounted for in the financial result
using the equity method, the positive business growth of our
Chinese joint ventures is mainly reflected in the Group’s operating
profit only by deliveries of vehicles and vehicle parts as well as
license revenue.
The financial result rose by €1.3 billion to €2.0 billion. The rise was due primarily to income from the measurement of derivative
financial instruments at the reporting date, as well as income from
the Chinese joint ventures, which was up on the high prior-year
figures. In addition, the previous year was impacted by expenses in
connection with the control and profit and loss transfer agreement
with MAN SE.
Results of Operations, Financial Position and Net Assets

I N T E R I M M A N A G E M E N T R E P O R T
Results of Operations, Financial Position and Net Assets
16
R E S U LT S O F O P E R AT I O N S I N T H E PA S S E N G E R C A R S B U S I N E S S A R E A
A N D CO M M E R C I A L V E H I C L E S / P O W E R E N G I N E E R I N G B U S I N E S S
A R E A F R O M J A N UA RY 1 TO S E P T E M B E R 3 0
€ million 2014 2013
Passenger Cars
Sales revenue 105,152 103,849
Gross profit 19,318 19,976
Operating profit 7,295 6,835
Operating return on sales (%) 6.9 6.6
Commercial Vehicles/Power Engineering
Sales revenue 24,467 25,321
Gross profit 3,812 3,296
Operating profit 685 390
Operating return on sales (%) 2.8 1.5
R E S U LT S O F O P E R AT I O N S I N T H E F I N A N C I A L S E RV I C E S D I V I S I O N
Mainly as a result of higher business volumes, sales revenue in the
Financial Services Division was up 9.7% on the 2013 figure to
€18.1 billion in the period from January to September 2014.
Gross profit rose by €0.3 billion year-on-year to €4.0 billion.
The higher volumes and compliance with regulatory require-ments pushed up distribution and administrative expenses in the
reporting period. While the ratio of administrative expenses to sales
revenue increased, the ratio of distribution expenses to sales reve-
nue declined.
Operating profit was 7.8% higher than in the previous year at
€1.4 billion and the operating return on sales stood at 7.9% (8.1%).
F I N A N C I A L P O S I T I O N O F T H E G R O U P
The Volkswagen Group’s gross cash flow in the reporting period was
€1.2 billion higher than a year earlier at €20.0 billion. Funds tied up
in working capital increased by 40.6% to €11.4 billion due to
volume-related factors and a stronger performance by the financial
services business. Cash flows from operating activities amounted to €8.5 billion (€10.6 billion).
The Volkswagen Group recorded investing activities attrib-
utable to operating activities of €10.1 billion in the first three quar-
ters of 2014, an increase of €1.3 billion on the previous year. Both
capex (investments in property, plant and equipment, investment
property and intangible assets, excluding capitalized development costs) and, in particular, capitalized development costs rose.
Cash inflows from financing activities amounted to €1.2 billion
(€6.8 billion). Net liquidity was increased by the hybrid notes
successfully placed in March 2014 (€3.0 billion) and the capital
increase implemented in June 2014 by issuing new preferred
shares in the amount of €2.0 billion. Dividend payments and the increase in the interest in Scania, on the other hand, resulted in a
cash outflow.
The Group’s net liquidity amounted to €– 92.4 billion as of
September 30, 2014; at year-end 2013, it was €– 82.3 billion.
F I N A N C I A L P O S I T I O N I N T H E AU TO M OT I V E D I V I S I O N
The gross cash flow generated by the Automotive Division in the
period from January to September 2014 was €0.7 billion higher
than in the previous year, at €15.2 billion, due to earnings-related
factors. Funds tied up in working capital amounted to €0.3 billion,
whereas in the previous year funds of €0.1 billion were released
from working capital. Cash flows from operating activities climbed to €14.9 billion (€14.7 billion).
O P E R A T I N G P R O F I T B Y Q U A R T E R
Volkswagen Group in € million
Q1 Q2 Q3 Q4
0
500
1,000
1,500
2,000
2,500
3,000
3,500
20142013
0
500
1,000
1,500
2,000
2,500
3,000
3,500
20142013

I N T E R I M M A N A G E M E N T R E P O R T
Results of Operations, Financial Position and Net Assets
17
F I N A N C I A L P O S I T I O N I N T H E PA S S E N G E R C A R S B U S I N E S S A R E A
A N D T H E CO M M E R C I A L V E H I C L E S / P O W E R E N G I N E E R I N G B U S I N E S S
A R E A F R O M J A N UA RY 1 TO S E P T E M B E R 3 0
€ million 2014 2013
Passenger Cars
Gross cash flow 13,715 12,996
Change in working capital 1,253 495
Cash flows from operating activities 14,968 13,490
Cash flows from investing activities – 8,676 – 9,407
Net cash flow 6,292 4,083
Commercial Vehicles/Power Engineering
Gross cash flow 1,518 1,576
Change in working capital – 1,544 – 354
Cash flows from operating activities – 26 1,222
Cash flows from investing activities – 723 – 857
Net cash flow – 749 365
Investing activities attributable to operating activities were down
year-on-year to €9.4 billion (€10.3 billion) in the reporting period. Capex increased slightly to €6.5 billion (€6.4 billion); the capex
ratio was 5.0% (5.0%). We invested primarily in our production
facilities and in models to be launched in 2014 and 2015, as well as
in the ecological focus of our model range. Capitalized development
costs rose to €3.4 billion (€2.6 billion). Investment activities in the
first nine months of 2014 included the sale of MAN Finance Inter-national GmbH to Volkswagen Financial Services AG by MAN SE; in
the previous year, they included the intragroup acquisition of the
interest in LeasePlan Corporation N.V.
The Automotive Division’s net cash flow was up €1.1 billion on
the prior-year figure to €5.5 billion in the reporting period.
Cash outflows from financing activities amounted to €6.5 bil-lion, of which €1.9 billion was attributable to the dividend paid out
to the shareholders of Volkswagen AG. A capital increase carried out
by Volkswagen AG at Volkswagen Financial Services AG at the
beginning of the year in order to finance the growth in business
volumes and meet regulatory capital requirements resulted in out-
flows of €2.3 billion. The purchase price for the Scania shares acquired – reported as a capital transaction with noncontrolling
interests – was recognized in the amount of €6.5 billion. The suc-
cessful placement of dual-tranche hybrid notes with an aggregate
principal amount of €3.0 billion via Volkswagen International
Finance N.V. in March resulted in a cash inflow. They consist of a
€1.25 billion note that carries a coupon of 3.75% and has a first call
date after seven years, and a €1.75 billion note that carries a coupon
of 4.625% and has a first call date after twelve years. Both tranches are perpetual and increase equity by the full amount, net of
transaction costs. €3.0 billion of the hybrid notes was classified as a
capital contribution, which increased net liquidity. The capital
increase implemented in June by issuing new preferred shares in
the amount of €2.0 billion also had a positive impact.
The Automotive Division recorded net liquidity of €16.8 billion as of September 30, 2014; at year-end 2013, it had amounted to
€16.9 billion.
F I N A N C I A L P O S I T I O N I N T H E F I N A N C I A L S E R V I C E S D I V I S I O N
Gross cash flow in the Financial Services Division was €0.6 billion
higher than a year earlier at €4.7 billion in the reporting period. Funds tied up in working capital climbed to €11.1 billion (€8.3
billion) due to growth in business volumes. Mainly because of the
intragroup acquisition of MAN Finance International GmbH from
MAN SE, investing activities attributable to operating activities
recorded a cash outflow of €0.7 billion. In the previous year, the
sale of the interest in LeasePlan to Volkswagen AG had led to a cash inflow.
The Financial Services Division’s negative net liquidity, which
is common in the industry, amounted to €– 109.2 billion at the end
of September 2014, after €– 99.2 billion at December 31, 2013.
CO N S O L I DAT E D B A L A N C E S H E E T ST R U C T U R E
The Volkswagen Group’s total assets amounted to €347.3 billion at
the end of the third quarter of this year, an increase of 7.1% on the
2013 year-end figure. The Group’s equity was up slightly on the
figure as of December 31, 2013 to €91.0 billion (€90.0 billion). The
equity ratio declined to 26.2% (27.8%).
Noncontrolling interests declined to €0.2 billion (€2.3 billion) following the increase in the interest in Scania; these are now
largely attributable to shareholders of RENK AG and AUDI AG.
AU TO M OT I V E D I V I S I O N B A L A N C E S H E E T ST R U C T U R E
As of September 30, 2014, intangible assets and property, plant and
equipment in the Automotive Division were slightly higher than at December 31, 2013. The equity-accounted investments contained
in the other noncurrent assets item increased, partly as a result of
the positive business growth of the Chinese joint ventures. Non-
current assets rose by a total of 2.8% compared with the 2013 year-
end figure. Current assets were 6.4% higher than at the end of
December 2013 due to the growth in business and the related rise in inventories and trade receivables. Cash and cash equivalents in
the Automotive Division amounted to €19.6 billion (€20.5 billion) at
the reporting date.

I N T E R I M M A N A G E M E N T R E P O R T
Results of Operations, Financial Position and Net Assets
18
B A L A N C E S H E E T ST R U C T U R E I N T H E PA S S E N G E R C A R S B U S I N E S S
A R E A A N D T H E C O M M E R C I A L V E H I C L E S / P O W E R E N G I N E E R I N G
B U S I N E S S A R E A
€ million Sept. 30, 2014 Dec. 31, 2013
Passenger Cars
Noncurrent assets 98,892 94,873
Current assets 55,558 50,146
Total assets 154,450 145,019
Equity 58,567 60,494
Noncurrent liabilities 54,317 52,900
Current liabilities 41,567 31,625
Commercial Vehicles/Power Engineering
Noncurrent assets 26,944 27,565
Current assets 17,120 18,174
Total assets 44,064 45,739
Equity 15,087 15,490
Noncurrent liabilities 11,495 12,390
Current liabilities 17,482 17,859
All of the outstanding Scania shares – with the exception of 0.43%
of the share capital – were acquired following the fulfillment of all of
the conditions for Volkswagen AG’s voluntary tender offer to acquire all Scania shares in May. The transaction reduced equity by €6.7 bil-
lion. €6.5 billion was paid for the Scania A and B shares already
acquired; a liability was recognized for the shares to be acquired in
the squeeze-out. This did not affect liquidity. The noncontrolling
interests are mainly attributable to RENK AG and AUDI AG. These
were lower overall than the noncontrolling interests attributable to the Financial Services Division, so the figure for the Automotive
Division, where the deduction was recognized, was negative.
The Automotive Division’s equity was €73.7 billion at the end of
September 2014, 3.1% lower than at year-end 2013. It was pushed
up by healthy earnings growth, the hybrid notes issued in March
and the capital increase implemented in June by issuing new preferred shares from authorized capital. The reduction in equity
as a result of the acquisition of all outstanding Scania shares, higher
actuarial losses from the measurement of pension provisions and
the dividend paid out to the shareholders of Volkswagen AG had an
offsetting effect. The equity increase implemented in the Financial
Services Division also decreased equity in the Automotive Division, where the deduction was recognized.
Within noncurrent liabilities, which were on a level with
December 31, 2013, pension provisions increased due to the
change in the discount rate. Reclassifications from noncurrent to
current liabilities, in particular due to shorter remaining maturities, led to an increase in current financial liabilities. Overall, current
liabilities rose by 19.3% compared with year-end 2013. The figures
for the Automotive Division also contain the elimination of intra-
group transactions between the Automotive and Financial Services
divisions. As the current financial liabilities for the primary Auto-
motive Division were lower than the loans granted to the Financial Services Division, a negative amount was disclosed for the reporting
period. The item “Put options and compensation rights granted to
noncontrolling interest shareholders” primarily comprises the lia-
bility for the obligation to acquire the shares held by the remaining
free float shareholders of MAN and the Scania shares to be acquired
in the squeeze-out. At €198.5 billion, the Automotive Division’s total assets as of
September 30, 2014 were higher than at December 31, 2013
(€190.8 billion).
F I N A N C I A L S E RV I C E S D I V I S I O N B A L A N C E S H E E T ST R U C T U R E
At €148.8 billion, the Financial Services Division’s total assets at the end of September exceeded the 2013 year-end figure by 11.4%.
Noncurrent assets rose by 11.9% compared with December 31,
2013 due mainly to the increase in lease assets and noncurrent
financial services receivables resulting from business growth. The
10.6% rise in current assets was also attributable to higher volumes.
The Financial Services Division accounted for approximately 42.8% of the Volkswagen Group’s assets at the end of the reporting period.
The Financial Services Division’s equity was 23.4% higher than
at year-end 2013 at €17.3 billion due to earnings-related factors
and in particular the capital increase carried out by Volkswagen AG
at the beginning of the year in order to finance the growth in busi-
ness and meet regulatory capital requirements. The equity ratio was 11.7% (10.5%). Noncurrent liabilities increased by 20.1% due
mainly to higher noncurrent financial liabilities entered into to
fund the growth in volumes. Overall, current liabilities rose by 2.6%
compared with December 31, 2013.
Deposits from direct banking business increased to €25.4
billion (€23.3 billion); of this figure, €23.5 billion was attributable to the direct banking operations of Volkswagen Bank.
R E P O RT O N E X P E C T E D D E V E L O PM E N T S, R I S K S
A N D O P P O RT U N I T I E S
In the reporting period, there were no significant changes com-
pared with the disclosures on the Volkswagen Group’s expected development in fiscal 2014 in the “Report on Expected Develop-
ments” and “Report on Risks and Opportunities” chapters of the
2013 Annual Report.

I N T E R I M M A N A G E M E N T R E P O R T
Outlook
19
The global economy continued its slight recovery in the first nine months of 2014, although its strength has been mixed in the
different regions. The Volkswagen Group’s Board of Management
expects the global economy to record slightly stronger growth in
2014 than in the previous year, despite some uncertainties. The
financial markets still entail risks resulting above all from the
strained debt situation of many countries. In addition, growth prospects are being hurt by geopolitical tensions and conflicts.
While the industrialized nations will probably record moderate
rates of expansion, we continue to anticipate that growth will be
strongest in the emerging economies of Asia.
Global demand for passenger cars continued to rise in the
reporting period, albeit at a slightly slower pace; however, the markets varied from region to region. We expect trends in the
passenger car markets in the individual regions to again be mixed
in fiscal year 2014. Overall, growth in global demand for new
vehicles will probably be somewhat slower than in 2013. We
anticipate a slight recovery in demand for automobiles in Western
Europe, and volumes in the German market are also likely to increase again somewhat in 2014. The passenger car markets in
Central and Eastern Europe will be clearly below the prior-year
level. The upward trend in North America will probably weaken,
while the South American passenger car markets will be down
significantly on the previous year. We anticipate further growth in
2014 for the markets in the Asia-Pacific region that are strategically important for the Volkswagen Group, although momentum there is
expected to be lower than in the previous year.
The global markets for light commercial vehicles will probably
experience slight growth overall in 2014, with the individual
regions recording mixed trends.
We anticipate that the overall volume in the markets for trucks and buses that are relevant for the Volkswagen Group will see a
decrease in 2014 as against the previous year due to the increas-
ingly difficult conditions in South America and Eastern Europe.
We expect demand for automotive financial services to grow
worldwide again in 2014.
The Volkswagen Group is well positioned to deal with the mixed developments in the automotive markets. Our strengths include our
unique brand portfolio covering almost all segments, from motor-
cycles through subcompact cars to heavy trucks and buses, our
steadily growing presence in all major world markets and our
wide range of financial services. We offer an extensive range of
environmentally friendly, cutting-edge, high-quality vehicles for all markets and customer groups that is unparalleled in the industry.
The Volkswagen Group will continue to press ahead with its product
initiative across all brands in the remaining months of 2014, and
we will modernize and expand our offering by introducing attrac-
tive new vehicles. We are pursuing the goal of offering all customers
the mobility and innovation they need, sustainably strengthening our competitive position in the process.
We expect that the Volkswagen Group will moderately increase
deliveries to customers year-on-year in 2014 in a still challenging
market environment.
Challenges for the Volkswagen Group will come from the
difficult market environment and fierce competition, as well as interest rate and exchange rate volatility and fluctuations in raw
materials prices. The modular toolkit system, which we are con-
tinuously expanding, will have an increasingly positive effect on the
Group’s cost structure.
Depending on the economic conditions, we expect 2014 sales
revenue for the Volkswagen Group and its business areas to move within a range of 3% around the prior-year figure.
In terms of the Group’s operating profit, we are expecting an
operating return on sales of between 5.5% and 6.5% in 2014 in
light of the challenging economic environment, and the same range
also applies to the Passenger Cars Business Area. The Commercial
Vehicles/Power Engineering Business Area is likely to moderately exceed the 2013 figure. The operating return on sales in the
Financial Services Division is expected to be between 8.0% and
9.0%. Disciplined cost and investment management and the
continuous optimization of our processes remain integral elements
of the Volkswagen Group’s Strategy 2018.
This report contains forward-looking statements on the business development of theVolkswagen Group. These statements are based on assumptions relating to thedevelopment of the economic and legal environment in individual countries andeconomic regions, and in particular for the automotive industry, which we have made onthe basis of the information available to us and which we consider to be realistic at thetime of going to press. The estimates given entail a degree of risk, and the actualdevelopments may differ from those forecast. Consequently, any unexpected fall indemand or economic stagnation in our key sales markets, such as Western Europe (andespecially Germany), the USA, Brazil, China, or Russia will have a corresponding impact onthe development of our business.
The same applies in the event of a significant shift in exchange rates, mostly against the euro and primarily in Australian dollars, Brazilian real, sterling, Chinese renminbi, Japanese yen, Canadian dollars, Mexican pesos, Polish zloty, Russian rubles, Swedish kronor, Swiss francs, South African rand, South Korean won, Czech koruna, Hungarian forints and US dollars. In addition, expected business development may vary if the assessments of the factors influencing sustainable value enhancement, as well as risks and opportunities presented in the 2013 Annual Report develop in a way other than we are currently expecting, or additional risks and opportunities or other factors emerge that affect the development of our business.
Outlook

B R A N D S A N D B U S I N E S S F I E L D S
20
S A L E S R E V E N U E A N D O P E R AT I N G P R O F I T B Y
B R A N D A N D B U S I N E S S F I E L D
The Volkswagen Group generated sales revenue of €147.7 billion
(€145.7 billion) between January and September 2014, a slight
increase on the prior-year figure (+1.4%). Exchange rate effects had
a negative impact, especially in the first half of the year. At €9.4 bil-
lion, operating profit was up 10.0% year-on-year. Unit sales by the Volkswagen Passenger Cars brand were down
3.2% year-on-year in the reporting period, at 3.4 million vehicles.
This decrease was primarily due to the declining South American
markets. There was increased customer demand for the Golf, Golf
estate and up! models. Sales revenue decreased by 1.1% to €73.4
billion as a result of lower sales figures and negative exchange rate effects. Operating profit decreased by €421 million year-on-year to
€1.7 billion. Lower volumes, negative exchange rate effects in the
first half of the year, as well as higher upfront expenditures for new
technologies had a negative impact, while lower material costs and
mix had a positive effect.
The Audi brand sold 1.1 million vehicles worldwide in the first nine months of 2014, 7.8% more than in the previous year. In
addition, a further 373 thousand (309 thousand) Audi vehicles were
sold by the FAW-Volkswagen Chinese joint venture. The A3 family,
the luxury A8 model and the Q5 and Q3 SUV models in particular
recorded growth in demand. Audi saw a significant increase in unit
sales volumes, primarily in Asia and North America. As a result, sales revenue rose by 6.3% to €39.3 billion. At €3.8 billion,
operating profit exceeded the prior-year figure by 2.3%. The
increased volumes and lower material costs had a positive impact on earnings growth, while high upfront investments in new
products and technologies, as well as in the expansion of the
international production network, had an adverse effect. The finan-
cial key performance indicators for the Audi brand also include the
Lamborghini and Ducati brands. Unit sales for the Ducati brand
amounted to 38,347 motorcycles in the reporting period (+0.3%). The ŠKODA brand lifted unit sales by 16.7% to 612 thousand
vehicles in the first three quarters of 2014. Demand increased for
the Octavia family, the Rapid and the Yeti models. At €8.8 billion,
sales revenue exceeded the prior-year figure by 19.3%. Positive
volume and mix effects were the key drivers behind the increase in
operating profit, which rose by 75.5% to €651 million. The SEAT brand sold 365 thousand vehicles between January
and September 2014, up 9.0% year-on-year. This figure includes
the Q3 manufactured for Audi. Demand for the Leon family and the
Alhambra model was very encouraging. Sales revenue rose by
12.1% year-on-year to €5.6 billion. Positive effects from mix,
volume and product costs helped the operating loss narrow by 11.3% to €82 million. Increased development costs for new prod-
ucts had a negative impact.
Unit sales by the Bentley brand increased by 22.1% to 8,026
vehicles in the reporting period, and sales revenue rose by 17.7%
year-on-year to €1.3 billion. The increased sales figures more than
offset the negative effects of exchange rates and mix, and as a result operating profit rose by 27.8% to €125 million.
VO L K SWA G E N G R O U P
Division Automotive Financial Services
Brand/ Business Field
Volkswagen Passenger Cars
Audi ŠKODA SEAT Bentley Porsche Volkswagen Commercial Vehicles
Scania MAN Other Dealer and customer financing Leasing Direct bank Insurance Fleet business Mobility offerings
Brands and Business Fields

B R A N D S A N D B U S I N E S S F I E L D S
21
The Porsche brand sold 134 thousand vehicles worldwide in the
first three quarters of the year, an increase of 17.2% compared with the prior-year period. The brand’s sales revenue amounted to
€12.2 billion, up 17.5% year-on-year. The higher volume provided
a boost to operating profit, which rose by 1.8% to €1.9 billion. By
contrast, increased development costs and higher fixed costs from
the development of structures for the Macan had a negative impact.
There was strong customer demand for the new Macan and the Panamera in particular.
At 325 thousand (325 thousand) vehicles, unit sales at Volks-
wagen Commercial Vehicles between January and September 2014
remained level with the previous year. Customer demand for the
Multivan/Transporter was very encouraging. Sales revenue
amounted to €7.0 billion (€7.0 billion). Operating profit was up 10.5% to €378 million on the back of lower material costs and
positive mix effects.
The Scania brand sold 56 thousand (56 thousand) trucks and
buses in the reporting period (–0.1%). Demand for services
increased in comparison with the prior-year period. Scania
Financial Services recorded healthy business growth. Sales revenue increased by 2.0% to €7.5 billion. Operating profit rose by 1.4% to
€700 million.
The MAN brand sold 86 thousand vehicles in the first nine
months of 2014, down 12.5% year-on-year. Sales revenue declined
by 9.9% to €10.2 billion. MAN generated an operating profit of
€304 million, compared with €47 million in the prior-year period. The improvement is largely attributable to the Power Engineering
segment, which had recognized project-specific contingency
reserves in the previous year.
Operating profit at Volkswagen Financial Services increased to
€1.2 billion between January and September 2014, up 7.9% year-
on-year. The growth in volumes, particularly in Europe and China, more than compensated for the increased costs of compliance with
regulatory requirements.
K E Y F I G U R E S B Y B R A N D A N D B U S I N E S S F I E L D F R O M J A N UA RY 1 TO S E P T E M B E R 3 0 1
V E H I C L E SA L E S S A L E S R E V EN U E
S A L E S T O T H I R D
P A R T I E S O P E R A T I N G R E S UL T
thousand units/€ million 2014 2013 2014 2013 2014 2013 2014 2013
Volkswagen Passenger Cars 3,388 3,499 73,390 74,233 50,643 53,899 1,696 2,117
Audi 1,083 1,004 39,300 36,965 26,305 25,554 3,831 3,743
ŠKODA 612 524 8,784 7,365 4,459 3,694 651 371
SEAT 365 335 5,622 5,017 2,455 2,211 – 82 – 93
Bentley 8 7 1,259 1,069 823 691 125 98
Porsche2 134 115 12,241 10,419 11,289 9,647 1,927 1,893
Volkswagen Commercial Vehicles 325 325 6,976 7,011 3,510 3,525 378 342
Scania2 56 56 7,511 7,365 7,511 7,365 700 691
MAN3 86 98 10,214 11,342 10,091 11,253 304 47
VW China4 2,697 2,294 – – – – – –
Other – 1,109 – 1,017 – 33,637 – 29,370 16,013 14,756 – 1,3295 – 1,7775
Volkswagen Financial Services3 – – 16,058 14,258 14,619 13,078 1,215 1,126
Volkswagen Group 7,646 7,241 147,718 145,673 147,718 145,673 9,416 8,557
Automotive Division 7,646 7,241 129,619 129,171 131,227 130,507 7,980 7,225
of which: Passenger Cars Business Area 7,179 6,761 105,152 103,849 110,541 109,070 7,295 6,835
Commercial Vehicles/Power Engineering Business Area 467 480 24,467 25,321 20,687 21,437 685 390
Financial Services Division – – 18,099 16,502 16,491 15,166 1,436 1,333
1 All figures shown are rounded, so minor discrepancies may arise from addition of these amounts. 2 Including financial services. 3 MAN Finance International GmbH has been reported within Volkswagen Financial Services since its acquisition by Financial Services AG as of January 1, 2014. The prior-year figures
have not been adjusted. 4 The sales revenue and operating profit of the joint venture companies in China are not included in the figures for the Group. The Chinese companies are accounted for using the equity
method and recorded an operating profit (proportionate) of €3,920 million (€3,530 million). 5 Mainly intragroup items recognized in profit or loss, in particular from the elimination of intercompany profits; the figure includes depreciation and amortization of identifiable assets
as part of purchase price allocation for Scania, Porsche Holding Salzburg, MAN and Porsche.

B R A N D S A N D B U S I N E S S F I E L D S
22
U N I T S A L E S A N D S A L E S R E V E N U E B Y M A R K E T
We recorded a 6.0% increase in unit sales in the Europe/Other markets region to 3.3 million vehicles in the period from January to
September 2014. Sales revenue rose by 4.7% to €90.5 billion due to
volume-related factors; deteriorations in exchange rates had an
offsetting effect.
Volkswagen Group sales in the North American market
decreased by 4.3% year-on-year to 633 thousand vehicles. Sales revenue declined by 3.3% to €19.7 billion; positive mix effects were
more than offset by a decline in volumes and negative exchange rate
effects.
The highly competitive South American markets saw a con-
tinuation of the significant negative trend in demand in the first
nine months of the year. The Volkswagen Group sold 575 thousand
vehicles, a decrease of 21.8% year-on-year. The lower sales and negative exchange rate effects are reflected in sales revenue, which
dropped 23.3% to €10.1 billion.
The Volkswagen Group was able to benefit disproportionately
from the healthy market growth in the Asia-Pacific region.
Including the Chinese joint ventures, 3.1 million vehicles were sold
between January and September 2014, 14.9% more than in the prior-year period. Sales revenue increased by 6.9% to €27.5 billion
due to volume-related factors. This figure does not include our
Chinese joint ventures, which are accounted for using the equity
method.
K E Y F I G U R E S B Y M A R K E T F R O M J A N UA RY 1 TO S E P T E M B E R 3 0 1
V E H I C L E SA L E S S A L E S R E V EN U E
thousand units/€ million 2014 2013 2014 2013
Europe/Other markets 3,295 3,109 90,451 86,431
North America 633 661 19,670 20,330
South America 575 735 10,148 13,233
Asia-Pacific2 3,143 2,736 27,450 25,678
Volkswagen Group2 7,646 7,241 147,718 145,673
1 All figures shown are rounded, so minor discrepancies may arise from addition of these amounts. 2 The sales revenue of the joint venture companies in China is not included in the figures for the Group and the Asia-Pacific market.

B R A N D S A N D B U S I N E S S F I E L D S
23
VO L K SWA G E N F I N A N C I A L S E RV I C E S
The period from January to September 2014 saw continued strong customer demand for Volkswagen Financial Services’ innovative
products along the automotive value chain.
Volkswagen Finance China marked its tenth anniversary in
September 2014, giving it an opportunity to look back on a decade
of successful growth. This wholly-owned subsidiary of Volkswagen
Financial Services AG was established in 2004 and provides cus-tomers and dealers with tailored financial services for Volkswagen
Group brands. Customer demand for vehicle financing in partic-
ular is increasing in China.
Long-term partners Volkswagen Financial Services AG and the
German Nature and Biodiversity Conservation Union (NABU)
joined forces for the fifth time in September to present the “GRÜNE FLOTTE” environmental prize, which recognizes particularly
environmentally-friendly fleet management among businesses of
varying sizes from a range of industries. At the awards ceremony,
both partners’ commitment to sustainability was also acknowledged
for their protection of wetlands: the environmental program
received the “United Nations Decade on Biodiversity” award, pre-sented by the United Nations to projects that confront the decline in
biodiversity.
The diversified funding strategy employed by Volkswagen
Financial Services comprises in particular unsecured bonds placed
on the capital markets, deposits from direct banking business and
auto asset-backed securities (ABS) transactions. Volkswagen Finan-cial Services Korea Limited placed its first bond on the South
Korean capital markets in July 2014, with a volume equivalent to
approximately €72 million. The business has grown successfully
since its market entry in 2010, and the placement of its first bond
will provide sustainable support for this process. It met with consid-
erable investor demand. Also in July 2014, Volkswagen Financial Services completed its
first sale of securitized Chinese auto loans, with a volume equiva-
lent to around €96 million. The Driver China One ABS transaction
expanded the ABS program into a new currency area, and also
provided a new refinancing source for the rapidly expanding
business in China. China is the eleventh country where Volkswagen Financial Services has placed ABS transactions.
Volkswagen Financial Services placed the Driver UK two securitized
transaction in September 2014, with a volume equivalent to approximately €1.5 billion. The second sterling-denominated ABS
transaction is also currently the largest placement in this currency,
and demand among investors was high. It underscored Volkswagen
Financial Services’ leading position in the European auto ABS
market.
MAN Financial Services presented its leasing portfolio for long-haul and distribution transport at IAA Commercial Vehicles show
2014. The portfolio is based on short- and long-term leasing of
tractor units, semitrailers/trailers, and distribution and specialist
vehicles. It also includes service components such as ProTelematik.
MAN Financial Services takes into consideration the fact that the
transport and logistics industry is increasingly in need of flexible, segment-specific and price-efficient mobility solutions. For this
reason, the focus remains on total cost of ownership, the lowest
possible CO2 emissions and cutting-edge telematics solutions.
The number of new financing, leasing, service and insurance
contracts signed in the reporting period was 3.6 million, 18.0%
more than in the prior-year period (excluding MAN Finance Inter-national GmbH, which was acquired on January 1, 2014). As at
September 30, 2014, the number of contracts was up 12.0% on the
figure as of December 31, 2013. This included 7.7 million contracts
in the Customer Financing/Leasing area, where the figure was
10.8% higher than as at the end of the year. In the Service/Insur-
ance area, the number of contracts rose by 14.3% to 4.3 million. Based on unchanged credit eligibility criteria, the share of leased or
financed vehicles increased from 28.5% of total Group deliveries
worldwide in the previous year, to 30.2%. Compared with Decem-
ber 31, 2013, receivables relating to dealer financing were up 4.8%
as of September 30, 2014.
Volkswagen Bank’s direct banking business had approximately 1.4 million accounts at the end of the reporting period, 0.5% fewer
than at the end of 2013, although the volume of deposits grew.
Volkswagen Financial Services had 12,707 employees as of Sep-
tember 30, 2014. The 16.1% increase in the headcount as against
December 31, 2013, is primarily attributable to the acquisition of
MAN Finance International GmbH and the consolidation of foreign subsidiaries.

24

I N T E R I M C O N S O L I D AT E D F I N A N C I A L STAT E M E N T S ( C O N D E N S E D )
Income Statement
25
I NCOME STATEMENT FOR TH E PERIOD JAN UARY 1 TO SEPTEMBER 30
V O L K S W A G E N G R OU P D I V I S I ON S
A U T OM O T I V E 1 F I N A N C I A L S E R V I C E S
€ million 2014 2013 2014 2013 2014 2013 Sales revenue 147,718 145,673 129,619 129,171 18,099 16,502
Cost of sales – 120,547 – 118,625 – 106,488 – 105,898 – 14,059 – 12,727
Gross profit 27,171 27,048 23,131 23,273 4,040 3,775
Distribution expenses – 14,751 – 14,255 – 13,933 – 13,497 – 818 – 758
Administrative expenses – 5,082 – 4,858 – 3,983 – 3,956 – 1,099 – 902
Other operating income/expense 2,077 623 2,764 1,406 – 687 – 783
Operating profit 9,416 8,557 7,980 7,225 1,436 1,333
Share of profits and losses of equity-accounted investments 3,057 2,834 3,029 2,774 28 60
Other financial result – 982 – 1,992 – 995 – 2,004 13 12
Financial result 2,075 842 2,034 769 41 72
Profit before tax 11,490 9,399 10,013 7,994 1,477 1,405
Income tax expense – 2,804 – 2,698 – 2,431 – 2,390 – 373 – 308
Profit after tax 8,687 6,702 7,582 5,605 1,105 1,097
of which attributable to
Noncontrolling interests 79 – 18 49 – 35 30 17
Volkswagen AG hybrid capital investors 99 5 99 5 – –
Volkswagen AG shareholders 8,509 6,714 7,434 5,635 1,074 1,080
Basic earnings per ordinary share (€)2 17.18 13.81
Diluted earnings per ordinary share (€)2 17.18 13.81
Basic earnings per preferred share (€)2 17.24 13.87
Diluted earnings per preferred share (€)2 17.24 13.87
1 Including allocation of consolidation adjustments between the Automotive and Financial Services divisions. 2 Explanatory information on earnings per share is presented in note 4. Prior-year figures adjusted to reflect application of IAS 33.26.
Interim Consolidated Financial Statements
(Condensed)

I N T E R I M C O N S O L I D AT E D F I N A N C I A L STAT E M E N T S ( C O N D E N S E D )
Statement of Comprehensive Income
26
STATEMENT OF COMPREH ENSIVE I NCOME FOR TH E PERIOD JAN UARY 1 TO SEPTEMBER 30
€ million 2014 2013
Profit after tax 8,687 6,702
Pension plan remeasurements recognized in other comprehensive income
Pension plan remeasurements recognized in other comprehensive income, before tax – 4,567 2,256
Deferred taxes relating to pension plan remeasurements recognized in other comprehensive income 1,345 – 659
Pension plan remeasurements recognized in other comprehensive income, net of tax – 3,222 1,597
Share of other comprehensive income of equity-accounted investments that will not be reclassified to profit or loss, net of tax – 3 – 4
Items that will not be reclassified to profit or loss – 3,225 1,593
Exchange differences on translating foreign operations
Unrealized currency translation gains/losses 1,252 – 1,415
Transferred to profit or loss 1 –
Exchange differences on translating foreign operations, before tax 1,253 – 1,415
Deferred taxes relating to exchange differences on translating foreign operations 0 0
Exchange differences on translating foreign operations, net of tax 1,253 – 1,415
Cash flow hedges
Fair value changes recognized in other comprehensive income – 3,815 1,659
Transferred to profit or loss – 308 – 89
Cash flow hedges, before tax – 4,123 1,570
Deferred taxes relating to cash flow hedges 1,225 – 457
Cash flow hedges, net of tax – 2,897 1,113
Available-for-sale financial assets
Fair value changes recognized in other comprehensive income 785 – 128
Transferred to profit or loss – 69 – 27
Available-for-sale financial assets, before tax 716 – 155
Deferred taxes relating to available-for-sale financial assets – 26 – 8
Available-for-sale financial assets, net of tax 690 – 163
Share of other comprehensive income of equity-accounted investments that may be reclassified subsequently to profit or loss, net of tax 217 – 82
Items that may be reclassified subsequently to profit or loss – 737 – 546
Other comprehensive income, before tax – 6,507 2,170
Deferred taxes relating to other comprehensive income 2,545 – 1,124
Other comprehensive income, net of tax – 3,962 1,046
Total comprehensive income 4,725 7,748
of which attributable to
Noncontrolling interests 17 – 67
Volkswagen AG hybrid capital investors 99 5
Volkswagen AG shareholders 4,609 7,810

I N T E R I M C O N S O L I D AT E D F I N A N C I A L STAT E M E N T S ( C O N D E N S E D )
Income Statement
27
I NCOME STATEMENT FOR TH E PERIOD J ULY 1 TO SEPTEMBER 30
V O L K S W A G E N G R OU P D I V I S I ON S
A U T OM O T I V E 1 F I N A N C I A L S E R V I C E S
€ million 2014 2013 2014 2013 2014 2013 Sales revenue 48,910 46,985 42,575 41,656 6,335 5,329
Cost of sales – 40,472 – 38,331 – 35,471 – 34,264 – 5,001 – 4,068
Gross profit 8,438 8,654 7,104 7,392 1,334 1,262
Distribution expenses – 4,612 – 4,638 – 4,370 – 4,376 – 242 – 263
Administrative expenses – 1,655 – 1,591 – 1,260 – 1,310 – 394 – 281
Other operating income/expense 1,058 353 1,243 564 – 185 – 211
Operating profit 3,230 2,777 2,717 2,270 513 507
Share of profits and losses of equity-accounted investments 913 993 901 984 12 9
Other financial result – 430 – 990 – 387 – 991 – 42 0
Financial result 483 3 514 – 7 – 30 9
Profit before tax 3,713 2,780 3,231 2,264 482 516
Income tax expense – 743 – 871 – 623 – 854 – 120 – 17
Profit after tax 2,971 1,909 2,608 1,410 363 499
of which attributable to
Noncontrolling interests 4 48 – 2 41 6 7
Volkswagen AG hybrid capital investors 39 5 39 5 – –
Volkswagen AG shareholders 2,928 1,856 2,571 1,364 356 492
Basic earnings per ordinary share (€)2 5.84 3.78
Diluted earnings per ordinary share (€)2 5.84 3.78
Basic earnings per preferred share (€)2 5.85 3.79
Diluted earnings per preferred share (€)2 5.85 3.79
1 Including allocation of consolidation adjustments between the Automotive and Financial Services divisions. 2 Explanatory information on earnings per share is presented in note 4. Prior-year figures adjusted to reflect application of IAS 33.26.

I N T E R I M C O N S O L I D AT E D F I N A N C I A L STAT E M E N T S ( C O N D E N S E D )
Statement of Comprehensive Income
28
STATEMENT OF COMPREH ENSIVE I NCOME FOR TH E PERIOD J U LY 1 TO SEPTEMBER 30
€ million 2014 2013
Profit after tax 2,971 1,909
Pension plan remeasurements recognized in other comprehensive income
Pension plan remeasurements recognized in other comprehensive income, before tax – 1,910 560
Deferred taxes relating to pension plan remeasurements recognized in other comprehensive income 566 – 167
Pension plan remeasurements recognized in other comprehensive income, net of tax – 1,344 392
Share of other comprehensive income of equity-accounted investments that will not be reclassified to profit or loss, net of tax 0 0
Items that will not be reclassified to profit or loss – 1,344 393
Exchange differences on translating foreign operations
Unrealized currency translation gains/losses 1,102 – 422
Transferred to profit or loss 1 –
Exchange differences on translating foreign operations, before tax 1,103 – 422
Deferred taxes relating to exchange differences on translating foreign operations 0 0
Exchange differences on translating foreign operations, net of tax 1,103 – 422
Cash flow hedges
Fair value changes recognized in other comprehensive income – 2,597 711
Transferred to profit or loss – 175 – 78
Cash flow hedges, before tax – 2,772 632
Deferred taxes relating to cash flow hedges 822 – 175
Cash flow hedges, net of tax – 1,950 457
Available-for-sale financial assets
Fair value changes recognized in other comprehensive income 355 126
Transferred to profit or loss – 91 – 27
Available-for-sale financial assets, before tax 263 99
Deferred taxes relating to available-for-sale financial assets 3 – 9
Available-for-sale financial assets, net of tax 266 91
Share of other comprehensive income of equity-accounted investments that may be reclassified subsequently to profit or loss, net of tax 320 – 101
Items that may be reclassified subsequently to profit or loss – 261 25
Other comprehensive income, before tax – 2,996 768
Deferred taxes relating to other comprehensive income 1,392 – 351
Other comprehensive income, net of tax – 1,605 417
Total comprehensive income 1,366 2,326
of which attributable to
Noncontrolling interests 4 79
Volkswagen AG hybrid capital investors 39 5
Volkswagen AG shareholders 1,323 2,242

I N T E R I M C O N S O L I D AT E D F I N A N C I A L STAT E M E N T S ( C O N D E N S E D )
Balance Sheet
29
BALANCE SH EET AS OF SEPTEMBER 30, 2014 AN D DECEMBER 31, 2013
V O L K S WA G E N G R OU P D I V I S I ON S
A U T OM O T I V E * F I N A N C I A L S E R V I C E S
€ million 2014 2013 2014 2013 2014 2013 Assets
Noncurrent assets 215,051 202,141 125,835 122,438 89,216 79,704
Intangible assets 59,882 59,243 59,640 59,007 242 236
Property, plant and equipment 43,742 42,389 41,839 40,632 1,903 1,757
Lease assets 26,474 22,259 2,835 2,642 23,639 19,617
Financial services receivables 56,566 51,198 – 1,030 – 602 57,596 51,800
Investments, equity-accounted investments and other equity investments, other receivables and financial assets 28,388 27,053 22,551 20,759 5,836 6,294
Current assets 132,256 122,192 72,679 68,320 59,577 53,872
Inventories 31,959 28,653 28,942 25,580 3,017 3,073
Financial services receivables 43,008 38,386 – 970 – 844 43,978 39,229
Other receivables and financial assets 26,035 23,483 18,074 16,458 7,961 7,025
Marketable securities 8,881 8,492 7,021 6,675 1,861 1,817
Cash, cash equivalents and time deposits 22,373 23,178 19,612 20,450 2,761 2,728
Total assets 347,308 324,333 198,514 190,758 148,793 133,576
Equity and Liabilities
Equity 91,003 90,037 73,654 75,984 17,348 14,053
Equity attributable to Volkswagen AG shareholders 85,806 85,730 68,698 72,100 17,109 13,630
Equity attributable to Volkswagen AG hybrid capital investors 5,002 2,004 5,002 2,004 – –
Equity attributable to Volkswagen AG shareholders and hybrid capital investors 90,809 87,733 73,700 74,103 17,109 13,630
Noncontrolling interests 194 2,304 – 46 1,881 240 423
Noncurrent liabilities 126,314 115,672 65,812 65,290 60,502 50,382
Financial liabilities 66,832 61,517 11,942 15,913 54,890 45,604
Provisions for pensions 26,526 21,774 26,156 21,481 370 293
Other liabilities 32,957 32,380 27,714 27,896 5,242 4,484
Current liabilities 129,991 118,625 59,048 49,484 70,943 69,141
Put options and compensation rights granted to noncontrolling interest shareholders 3,690 3,638 3,690 3,638 – –
Financial liabilities 64,026 59,987 – 563 – 3,981 64,590 63,968
Trade payables 19,876 18,024 17,824 16,582 2,052 1,441
Other liabilities 42,398 36,976 38,097 33,245 4,301 3,731
Total equity and liabilities 347,308 324,333 198,514 190,758 148,793 133,576
* Including allocation of consolidation adjustments between the Automotive and Financial Services divisions, primarily intragroup loans.

I N T E R I M C O N S O L I D AT E D F I N A N C I A L STAT E M E N T S ( C O N D E N S E D )
Statement of Changes in Equity
30
STATEMENT OF CHANGES I N EQUITY
O T H ER R E S ER V E S
€ million Subscribed capital Capital reserves Retained earnings
Currency
translation reserve Balance at Jan. 1, 2013 1,191 11,509 64,596 – 539
Profit after tax – – 6,714 –
Other comprehensive income, net of tax – – 1,543 – 1,313
Total comprehensive income – – 8,257 – 1,313
Capital increase 0 1,149 – –
Dividend payment – – – 1,639 –
Capital transactions involving a change in ownership interest1 – – – 1,398 39
Other changes – – – 10 –
Balance at Sept. 30, 2013 1,191 12,658 69,807 – 1,813
Balance at Jan. 1, 2014 1,191 12,658 72,341 – 2,799
Profit after tax – – 8,509 –
Other comprehensive income, net of tax – – – 3,213 1,306
Total comprehensive income – – 5,295 1,306
Capital increase2 27 1,959 – –
Dividend payment – – – 1,871 –
Capital transactions involving a change in ownership interest1 – – – 4,484 – 45
Other changes3 – – – 121 0
Balance at Sept. 30, 2014 1,218 14,616 71,160 – 1,539
1 The capital transactions involving a change in ownership interest are attributable in the previous year to the derecognition of the noncontrolling interests in the equity of MAN SE and the interest in Scania AB attributable to those noncontrolling interest shareholders and, in the reporting period, to the derecognition of the noncontrolling interests in the equity of Scania AB.
2 Volkswagen AG recorded an inflow of cash funds amounting to €3,000 million, less a discount of €29 million and transaction costs (€19 million), from the hybrid capital issued in March 2014. Additionally, there are noncash effects from the deferral of taxes amounting to €13 million. The hybrid capital is required to be classified as equity instruments granted. Volkswagen AG recorded an inflow of cash funds amounting to €2,000 million, less transaction costs (€20 million), from the capital increase implemented in June 2014 by issuing new preferred shares. Additionally, there are noncash effects from the deferral of taxes amounting to €6 million.
3 The other changes in retained earnings are primarily a result of exchange rate movements between the dates of publication and completion of the offer to acquire all shares of Scania in conjunction with the measurement of the liability originally recognized outside profit or loss in March 2014.

I N T E R I M C O N S O L I D AT E D F I N A N C I A L STAT E M E N T S ( C O N D E N S E D )
Statement of Changes in Equity
31
Cash flow hedges
Available-for-sale
financial assets
Equity-accounted
investments
Equity attributable to
Volkswagen AG hybrid
capital investors
Equity attributable to
Volkswagen AG
shareholders and hybrid
capital investors
Noncontrolling
interests Total equity
360 624 – 59 – 77,682 4,313 81,995
– – – 5 6,719 – 18 6,702
1,114 – 163 – 85 – 1,096 – 49 1,046
1,114 – 163 – 85 5 7,815 – 67 7,748
– – – 1,976 3,125 – 3,125
– – – – – 1,639 – 209 – 1,848
– 8 0 1 – – 1,366 – 1,759 – 3,125
– – 1 – – 8 9 0
1,466 461 – 142 1,981 85,609 2,286 87,895
1,845 724 – 229 2,004 87,733 2,304 90,037
– – – 99 8,608 79 8,687
– 2,897 690 214 – – 3,900 – 62 – 3,962
– 2,897 690 214 99 4,708 17 4,725
– – – 2,965 4,951 – 4,951
– – – – 87 – 1,958 – 4 – 1,962
2 – 0 – – 4,527 – 2,123 – 6,650
– – 1 22 – 99 0 – 99
– 1,049 1,414 – 13 5,002 90,809 194 91,003

I N T E R I M C O N S O L I D AT E D F I N A N C I A L STAT E M E N T S ( C O N D E N S E D )
Cash Flow Statement
32
CASH FLOW STATEMENT FOR TH E PERIOD JAN UARY 1 TO SEPTEMBER 30
V O L K S WA G E N G R OU P D I V I S I ON S
A U T OM O T I V E 1 F I N A N C I A L S E R V I C E S
€ million 2014 2013 2014 2013 2014 2013 Cash and cash equivalents at beginning of period 22,009 17,794 19,285 14,788 2,724 3,005
Profit before tax 11,490 9,399 10,013 7,994 1,477 1,405
Income taxes paid – 3,185 – 2,494 – 2,785 – 2,158 – 401 – 336
Depreciation and amortization expense 12,153 10,660 8,767 7,778 3,386 2,883
Change in pension provisions 203 177 195 169 8 9
Other noncash income/expense and reclassifications2 – 710 985 – 957 789 247 196
Gross cash flow 19,950 18,729 15,233 14,572 4,717 4,157
Change in working capital – 11,435 – 8,132 – 291 141 – 11,144 – 8,273
Change in inventories – 2,503 – 1,764 – 2,575 – 1,837 73 73
Change in receivables – 2,723 – 1,552 – 2,180 – 1,089 – 542 – 463
Change in liabilities 5,766 2,772 4,090 2,297 1,676 476
Change in other provisions 1,121 1,161 1,057 990 63 171
Change in lease assets (excluding depreciation) – 6,353 – 4,984 – 582 – 102 – 5,771 – 4,882
Change in financial services receivables – 6,743 – 3,765 – 100 – 118 – 6,643 – 3,647
Cash flows from operating activities 8,515 10,597 14,942 14,713 – 6,427 – 4,116
Cash flows from investing activities attributable to operating activities – 10,144 – 8,859 – 9,398 – 10,264 – 746 1,405
of which: Investments in intangible assets (excluding capitalized development costs), property, plant and equipment, and investment property – 6,773 – 6,630 – 6,482 – 6,436 – 291 – 193
capitalized development costs – 3,399 – 2,558 – 3,399 – 2,558 – –
acquisition and disposal of equity investments – 172 – 85 296 – 1,640 – 469 1,555
Net cash flow3 – 1,628 1,738 5,544 4,449 – 7,172 – 2,711
Change in investments in securities and loans – 869 – 2,388 – 362 – 2,026 – 507 – 362
Cash flows from investing activities – 11,013 – 11,247 – 9,760 – 12,290 – 1,252 1,043
Cash flows from financing activities 1,151 6,768 – 6,492 3,588 7,643 3,180
of which: capital transactions with noncontrolling interests – 6,535 0 – 6,535 0 – –
capital contributions/capital redemptions 4,932 3,067 2,670 3,036 2,262 30
Effect of exchange rate changes on cash and cash equivalents 322 – 272 248 – 201 73 – 72
Net change in cash and cash equivalents – 1,025 5,845 – 1,062 5,810 37 35
Cash and cash equivalents at Sept. 30 20,984 23,639 18,223 20,598 2,761 3,041
Securities, loans and time deposits 17,434 16,758 9,940 10,162 7,493 6,596
Gross liquidity 38,418 40,397 28,164 30,761 10,255 9,636
Total third-party borrowings – 130,858 – 121,139 – 11,379 – 14,111 – 119,479 – 107,028
Net liquidity at Sept. 30 – 92,440 – 80,743 16,785 16,649 – 109,225 – 97,392
For information purposes: at January 1 – 82,318 – 85,517 16,869 10,573 – 99,186 – 96,090
1 Including allocation of consolidation adjustments between the Automotive and Financial Services divisions. 2 These relate mainly to the fair value measurement of financial instruments, application of the equity method and reclassification of gains/losses on disposal of noncurrent assets to
investing activities. 3 Net cash flow: cash flows from operating activities, net of cash flows from investing activities attributable to operating activities.

I N T E R I M C O N S O L I D AT E D F I N A N C I A L STAT E M E N T S ( C O N D E N S E D )
Notes to the Interim Consolidated Financial Statements
33
Accounting in accordance with International Financial Reporting Standards (IFRSs)
In accordance with Regulation No. 1606/2002 of the European Parliament and of the Council, Volkswagen AG prepared its
consolidated financial statements for 2013 in compliance with the International Financial Reporting Standards (IFRSs), as adopted by the European Union. These Interim Consolidated Financial Statements for the period ended September 30,
2014 were therefore also prepared in accordance with IAS 34 and are condensed in scope compared with the consolidated
financial statements.
All figures shown are rounded, so minor discrepancies may arise from addition of these amounts.
In addition to the reportable segments, the Automotive and Financial Services divisions are presented in the
condensed interim group financial report for explanatory purposes alongside the income statement, balance sheet and cash flow statement for the Volkswagen Group. This supplemental presentation is not required by IFRSs. Eliminations of
intragroup transactions between the Automotive and Financial Services divisions are allocated to the Automotive Division.
The accompanying interim consolidated financial statements were reviewed by auditors in accordance with section
37x(3) of the Wertpapierhandelsgesetz (WpHG – German Securities Trading Act).
Accounting policies
Volkswagen AG has applied all accounting pronouncements adopted by the EU and effective for periods beginning on or
after January 1, 2014.
The pronouncements contained in the “consolidation package” must be applied effective January 1, 2014. These
relate to the new standards IFRS 10, IFRS 11 and IFRS 12, as well as amendments to IAS 28. IFRS 10 (Consolidated Finan-cial Statements) defines the basis of consolidation and the principles for including subsidiaries in the consolidated
financial statements. All entities that Volkswagen AG can control directly or indirectly must be included in the basis of
consolidation. The switch from IAS 27 to IFRS 10 did not require the Volkswagen Group to make any adjustments because
the parent/subsidiary relationships and other control relationships are attributable almost entirely to voting rights
majorities. There was therefore no requirement to consolidate additional entities or deconsolidate existing ones. Equally,
because all significant special purpose entities/structured entities are consolidated in the Volkswagen Group, no adjust-ments were required for these entities.
IFRS 11 governs the definition of and accounting for “joint arrangements” in the consolidated financial statements.
Joint arrangements are classified into “joint ventures” and “joint operations”. Because all entities that are jointly
controlled by Volkswagen AG or one of its subsidiaries are required to be classified as joint ventures, there were no effects
from applying IFRS 11.
IFRS 12 governs all disclosures on interests in other entities and thus combines all of the information required to be disclosed in the notes on subsidiaries, joint arrangements, associates, and consolidated and unconsolidated structured
entities. The scope of the information to be disclosed was expanded in some cases. IFRS 12 does not result in any additional
disclosure requirements in the interim financial reports.
Only the equity method in accordance with IAS 28 may be applied to joint ventures and associates effective January 1,
2014. The option to include these entities in the consolidated financial statements using proportionate consolidation was
eliminated. Because proportionate consolidation was not used in the past in the Volkswagen Group, the elimination of this option did not result in any adjustments.
The other accounting pronouncements required to be applied for the first time in fiscal year 2014 are insignificant for
the presentation of the Volkswagen Group’s net assets, financial position and results of operations in its interim con-
solidated financial statements. A detailed breakdown of these accounting pronouncements is provided in the notes to the
consolidated financial statements in the 2013 Annual Report.
Notes to the Interim Consolidated Financial
Statements

I N T E R I M C O N S O L I D AT E D F I N A N C I A L STAT E M E N T S ( C O N D E N S E D )
Notes to the Interim Consolidated Financial Statements
34
A discount rate of 2.7% (December 31, 2013: 3.7%) was applied to German pension provisions in the accompanying
interim consolidated financial statements. The reduction in the discount rate increased the actuarial losses for pension
provisions that are recognized in retained earnings.
The income tax expense for the interim reporting period was calculated on the basis of the average annual tax rate that
is expected for the entire fiscal year, in accordance with IAS 34, Interim Financial Reporting.
In other respects, the same accounting policies and consolidation methods that were used for the 2013 consolidated financial statements are generally applied to the preparation of the interim consolidated financial statements and the
measurement of the prior-year comparatives. A detailed description of the policies and methods applied is published in the
notes to the consolidated financial statements in the 2013 Annual Report. This can also be accessed on the Internet at
www.volkswagenag.com/ir.
Basis of consolidation
In addition to Volkswagen AG, which is domiciled in Wolfsburg and entered in the commercial register at the
Braunschweig Local Court under No. HRB 100484, the consolidated financial statements comprise all significant German
and non-German subsidiaries, including structured entities, that are controlled directly or indirectly by Volkswagen AG.
This is the case if Volkswagen AG obtains power over the potential subsidiaries directly or indirectly from voting rights or similar rights, is exposed, or has rights to, positive or negative variable returns from its involvement with the subsidiaries,
and is able to influence those returns.
CO N S O L I DAT E D S U B S I D I A R I E S
On March 14, 2014, Volkswagen AG published an offer to the shareholders of Scania Aktiebolag, Södertälje, (“Scania”) to
acquire all Scania A and Scania B shares. Each Scania A share conveys one vote at the general meeting, while each Scania B share conveys one-tenth of a vote. There are no other legal differences between Scania A and B shares. Volkswagen AG
offered SEK 200 for each Scania share, regardless of share class. One of the conditions of the offer was that it resulted in
the Volkswagen Group holding more than 90 percent of the total number of Scania shares. When the offer to the Scania
shareholders was published, the present value of the put options granted amounting to approximately €6.7 billion was
recognized as a current liability without affecting profit or loss. The Group’s retained earnings declined by the same amount.
Starting on May 7, 2014, Volkswagen acquired a total of 2.4 million Scania shares outside the offer (10,941 A shares and 2,400,679 B shares). This corresponds to 0.30% of Scania shares and 0.06% of the voting rights.
The condition for the Volkswagen Group to hold more than 90% of the total number of Scania shares was satisfied on
May 13, 2014, and Volkswagen initiated a squeeze-out for the Scania shares that were not tendered in the course of the offer.
At the end of the second extended acceptance period on June 5, 2014, the number of shares tendered under the terms
of the offer, together with the shares already held by Volkswagen either directly or indirectly, amounted to a total of
796.6 million Scania shares, comprising 398.7 million A shares and 397.8 million B shares. This corresponds to 99.57% of Scania shares and 99.66% of the voting rights.

I N T E R I M C O N S O L I D AT E D F I N A N C I A L STAT E M E N T S ( C O N D E N S E D )
Notes to the Interim Consolidated Financial Statements
35
On completion of the offer, the equity interest in Scania previously attributable to noncontrolling interest shareholders
amounting to €2,123 million was required to be reclassified from noncontrolling interests to the reserves attributable to
the shareholders of Volkswagen AG. The difference of €4,527 million reduced the retained earnings attributable to the
shareholders of Volkswagen AG by the same amount.
The changes in the carrying amount of the liability of €96 million that was recognized when the offer was published,
which were due primarily to exchange rate movements, were recognized in the financial result in profit or loss. Net of exchange rate effects, the shares already tendered resulted in a cash outflow of €6,535 million as of the
reporting date. This amount is reported within financing activities in the cash flow statement as an outflow from capital
transactions with noncontrolling interests. A liability of €78 million from put options and compensation rights granted to
noncontrolling interest shareholders was recognized for the remaining shares that are subject to the squeeze-out.
I N T E R E ST S I N J O I N T V E N T U R E S
The Volkswagen Group holds a 50% indirect interest in the joint venture LeasePlan Corporation N.V., Amsterdam, the
Netherlands, via its 50% stake in the joint venture Global Mobility Holding B.V., Amsterdam, the Netherlands. Volkswagen
agreed with Fleet Investments B.V., Amsterdam, the Netherlands, an investment company belonging to the von Metzler
family, that Fleet Investments would become the new co-investor in Global Mobility Holding in 2010. The previous co-
investors were instructed by Volkswagen AG to transfer their shares to Fleet Investments B.V. on February 1, 2010 for the
purchase price of €1.4 billion. In fiscal year 2013, the agreement was prolonged by two years until January 2016. Volkswagen AG granted the new co-investor a put option on its shares. If this option is exercised, Volkswagen must pay the
original purchase price plus accumulated pro rata preferred dividends or the higher fair value. The put option is accounted
for at fair value.
In addition, Volkswagen has pledged claims under certificates of deposit with Bankhaus Metzler in the amount of
€1.4 billion to secure a loan granted to Fleet Investments B.V. by Bankhaus Metzler. This pledge does not increase the
Volkswagen Group’s risk arising from the above-mentioned short position.
I N V E STM E N T S I N A S S O C I AT E S
Dr. Ing. h.c. F. Porsche AG, Stuttgart, increased its interest in Bertrandt AG, Ehningen, by just under 4% on July 2, 2014.
Following this acquisition, Volkswagen indirectly holds just under 29% of the voting shares of Bertrandt. There has been
no change in the intention not to exercise any influence on Bertrandt AG’s supervisory board or management board.
Bertrandt AG has been included in the Volkswagen Group’s consolidated financial statements as an equity-accounted associate from the date on which the additional shares were acquired. In this connection, the amounts resulting from the
fair value measurement of the shares amounting to €148 million that had previously been recognized in the other reserves
in other comprehensive income were recognized in profit or loss in the other financial result.

I N T E R I M C O N S O L I D AT E D F I N A N C I A L STAT E M E N T S ( C O N D E N S E D )
Notes to the Interim Consolidated Financial Statements
36
DISCLOSURES ON TH E CONSOLI DATED FI NANCIAL STATEMENTS
1. Sales revenue
ST R U C T U R E O F G R O U P S A L E S R E V E N U E
Q 1 – 3
€ million 2014 2013 Vehicles 98,148 99,957
Genuine parts 10,117 10,148
Used vehicles and third-party products 7,429 5,941
Engines, powertrains and parts deliveries 7,424 6,270
Power Engineering 2,640 2,739
Motorcycles 386 386
Rental and leasing business 11,609 10,431
Interest and similar income 4,819 4,653
Other sales revenue 5,145 5,147
147,718 145,673
2. Cost of sales
Cost of sales includes interest expenses of €1,459 million (previous year: €1,589 million) attributable to the financial
services business.
In addition to depreciation and amortization expenses, cost of sales also includes impairment losses on intangible assets, items of property, plant and equipment, and lease assets. The impairment losses identified on the basis of updated
impairment tests amount to a total of €218 million (previous year: €189 million).
3. Research and development costs in the Automotive Division
Q 1 – 3
€ million 2014 2013 % Total research and development costs 9,619 8,431 14.1
of which: capitalized development costs 3,399 2,558 32.9
Capitalization ratio in % 35.3 30.3
Amortization of capitalized development costs 2,129 1,740 22.4
Research and development costs recognized in the income statement 8,350 7,613 9.7

I N T E R I M C O N S O L I D AT E D F I N A N C I A L STAT E M E N T S ( C O N D E N S E D )
Notes to the Interim Consolidated Financial Statements
37
4. Earnings per share
Basic earnings per share are calculated by dividing profit attributable to shareholders of Volkswagen AG by the weighted
average number of ordinary and preferred shares outstanding during the reporting period.
During the reporting period, Volkswagen AG implemented a capital increase from authorized capital against cash con-
tributions, with existing shareholders’ preemptive rights disapplied, by issuing preferred shares. Since their admission to the regulated market on June 12, 2014, these new preferred shares have been included in the calculation of earnings per share.
In 2012 and 2013, Volkswagen AG placed two mandatory convertible notes with identical features and an aggregate
principal amount of €3.7 billion via a subsidiary, Volkswagen International Finance N.V. Amsterdam/the Netherlands
(issuer). Both mandatory convertible notes mature on November 9, 2015. The current minimum conversion price is
€147.61, and the corresponding maximum conversion price is €177.13. The conversion price will be adjusted if certain
events occur. The convertible notes will be settled by issuing new preferred shares no later than at maturity. The issuer is entitled to convert the mandatory convertible notes at any time at the minimum conversion price. The note terms and
conditions also provide for early conversion options. This discretionary conversion right was exercised in the reporting
period, with a total of €4 million of the notes being converted into 22,103 newly created preferred shares at the effective
maximum conversion price at the conversion date.
IAS 33.23 sets out that all potential shares that will be issued upon the conversion of a mandatory convertible note must
be accounted for as issued shares and included in the calculation of basic and diluted earnings per share. The number of outstanding preferred shares is therefore increased by the potential preferred shares that would be issued if the manda-
tory convertible notes issued were actually to be converted. The average number of preferred shares not yet converted that
have to be included is calculated based on the maximum conversion ratio resulting from the current minimum conversion
price of €147.61. The terms and conditions require the minimum conversion price to be adjusted following the
distribution of dividends. The number of potential preferred shares was calculated retrospectively at the new minimum
conversion price in accordance with IAS 33.26, including for the previous year. The finance costs associated with the mandatory convertible notes are not included in the calculation of consolidated profit because the interest component was
recognized in other comprehensive income when the note was issued, and interest expense arises only from the amount of
compound interest. Since the number of basic and diluted shares is identical, basic earnings per share also correspond to
diluted earnings per share. In total, the existing mandatory convertible notes still entitle the holders to subscribe for a
maximum of 25,032,179 no-par value preferred shares of Volkswagen AG, based on the current maximum conversion ratio.
Q 3 Q 1 – 3
2014 2013* 2014 2013* Weighted average number of shares outstanding
Ordinary shares: basic million 295.1 295.1 295.1 295.1
diluted million 295.1 295.1 295.1 295.1
Preferred shares: basic million 205.7 195.2 199.4 190.2
diluted million 205.7 195.2 199.4 190.2
Profit after tax € million 2,971 1,909 8,687 6,702
Noncontrolling interests € million 4 48 79 – 18
Profit attributable to Volkswagen AG hybrid capital investors € million 39 5 99 5
Profit attributable to Volkswagen AG shareholders € million 2,928 1,856 8,509 6,714
Earnings per share
Ordinary shares: basic € 5.84 3.78 17.18 13.81
diluted € 5.84 3.78 17.18 13.81
Preferred shares: basic € 5.85 3.79 17.24 13.87
diluted € 5.85 3.79 17.24 13.87
* Prior-year figures adjusted to reflect application of IAS 33.26.

I N T E R I M C O N S O L I D AT E D F I N A N C I A L STAT E M E N T S ( C O N D E N S E D )
Notes to the Interim Consolidated Financial Statements
38
5. Noncurrent assets
C H A N G E S I N S E L E C T E D N O N C U R R E N T A S S E T S
B E T W E E N J A N UA RY 1 A N D S E P T E M B E R 3 0 , 2 0 1 4
€ million Carrying amount
at Jan. 1, 2014
Additions/
Changes in
consolidated
Group
Disposals/
Other changes
Depreciation
and amortization
Carrying amount
at Sept. 30, 2014 Intangible assets 59,243 3,608 9 2,960 59,882
Property, plant and equipment 42,389 6,635 – 166 5,448 43,742
Lease assets 22,259 10,909 3,026 3,669 26,474
6. Inventories
€ million Sept. 30, 2014 Dec. 31, 2013 Raw materials, consumables and supplies 4,013 3,716
Work in progress 3,472 3,096
Finished goods and purchased merchandise 20,292 18,284
Current lease assets 4,020 3,418
Payments on account 163 140
31,959 28,653
There was no requirement to recognize or reverse significant impairment losses on inventories in the reporting period.
7. Current other receivables and financial assets
€ million Sept. 30, 2014 Dec. 31, 2013 Trade receivables 12,784 11,133
Miscellaneous other receivables and financial assets 13,251 12,350
26,035 23,483
In the period January 1 to September 30, 2014, impairment losses and reversals of impairment losses on noncurrent and
current financial assets reduced operating profit by €365 million (previous year: €541 million).

I N T E R I M C O N S O L I D AT E D F I N A N C I A L STAT E M E N T S ( C O N D E N S E D )
Notes to the Interim Consolidated Financial Statements
39
8. Equity
Following the approval by the Annual General Meeting of MAN SE of the conclusion of the control and profit and loss
transfer agreement between MAN SE and Truck & Bus GmbH on June 6, 2013, Volkswagen is obliged to pay a cash
settlement to the remaining noncontrolling interest shareholders of MAN SE. For this reason, the noncontrolling interests
in the equity of MAN SE and the interest in Scania AB attributable to those noncontrolling interest shareholders were derecognized from Group equity as of this date. At the same time, a liability was recognized in accordance with the cash
settlement offer for the obligation to acquire the shares. MAN SE’s profit or loss is attributed in full to the shareholders of
Volkswagen AG. As of September 30, 2014, a total of 342,960 ordinary shares and 115,348 preferred shares had been
tendered.
On March 14, 2014, Volkswagen AG published an offer to the shareholders of Scania Aktiebolag, Södertälje, (“Scania”)
to acquire all Scania shares. The offer was completed on May 13, 2014 and Volkswagen initiated a squeeze-out for the Scania shares that were not tendered in the course of the offer. Scania shares were delisted from the NASDAQ OMX
Stockholm at the end of June 5, 2014. The Group’s retained earnings were reduced by the total value of the offer
amounting to €6,650 million as a capital transaction with noncontrolling interest shareholders recognized directly in
equity. At the same time, the equity interest in Scania previously attributable to the noncontrolling interest shareholders in
Scania amounting to €2,123 million was reclassified from noncontrolling interests to the reserves attributable to the share-
holders of Volkswagen AG. The remaining noncontrolling interests are largely attributable to shareholders of RENK AG and AUDI AG. For information on the acquisition of the noncontrolling interests in Scania, see also the disclosures on the basis
of consolidation.
In March 2014, Volkswagen AG placed unsecured subordinated hybrid notes with an aggregate principal amount of
€3 billion via a subsidiary, Volkswagen International Finance N.V. Amsterdam/the Netherlands (issuer). The perpetual
hybrid notes were issued in two tranches and can be called by the issuer. The first call date for the first tranche (€1.25 bil-
lion and a coupon of 3.750%) is after seven years, and the first call date for the second tranche (€1.75 billion and a coupon of 4.625%) is after twelve years. Under IAS 32, the hybrid notes must be classified in their entirety as equity. The capital
raised was recognized in equity, less a discount and transaction costs and net of deferred taxes. The interest payments
payable to the noteholders will be recognized directly in equity, net of income taxes.
The Annual General Meeting on April 19, 2012 resolved to create authorized capital of up to €110 million, expiring on
April 18, 2017, for the issue of new ordinary bearer shares or preferred shares based. In June 2014, Volkswagen AG issued
10,471,204 new preferred shares (with a notional value of €27 million), with the result that the remaining authorized capital amounts to €83 million. Volkswagen AG recorded a cash inflow of €2,000 million from the capital increase, less
transaction costs of €20 million.
In January 2014, Volkswagen AG issued 22,103 newly created preferred shares (notional value: €56,583.68) resulting
from the exercise of mandatory convertible bonds. The subscribed capital is composed of 295,089,818 no-par value
ordinary shares and 180,641,478 preferred shares, and amounts to €1,218 million (December 31, 2013: €1,191 million).
Volkswagen AG paid a dividend of €1,871 million in the reporting period (previous year: €1,639 million). €1,180 mil-lion of this amount (previous year: €1,033 million) was attributable to ordinary shares and €691 million (previous year:
€606 million) to preferred shares.

I N T E R I M C O N S O L I D AT E D F I N A N C I A L STAT E M E N T S ( C O N D E N S E D )
Notes to the Interim Consolidated Financial Statements
40
9. Noncurrent financial liabilities
€ million Sept. 30, 2014 Dec. 31, 2013 Bonds, commercial paper and notes 56,691 51,630
Liabilities to banks 7,988 7,659
Deposit business 1,011 1,015
Other financial liabilities 1,140 1,213
66,832 61,517
10. Current financial liabilities
€ million Sept. 30, 2014 Dec. 31, 2013 Bonds, commercial paper and notes 28,915 25,926
Liabilities to banks 10,215 11,305
Deposit business 24,406 22,310
Other financial liabilities 491 446
64,026 59,987
11. Fair value disclosures
The principles and techniques used for fair value measurement remained unchanged year-on-year. Detailed explanations of the measurement principles and techniques can be found in the 2013 Annual Report.
Fair value generally corresponds to the market or quoted market price. If no active market exists, fair value is deter-
mined using valuation techniques, such as by discounting the future cash flows at the market interest rate, or by using
recognized option pricing models.
Assets and liabilities measured at fair value through profit or loss consist of derivatives or components of derivatives
that are not included in hedge accounting. These relate primarily to the interest component of currency forwards used to hedge sales revenue, commodity futures and currency forwards relating to commodity futures.
Available-for-sale financial assets (marketable securities) are carried at fair value. Changes in fair value are recognized
directly in equity, net of deferred taxes.
Shares in unconsolidated subsidiaries and other equity investments that are not accounted for using the equity method
are also classified as available-for-sale financial assets. They are recognized at cost in the consolidated financial statements
if there is no active market for those companies and fair values cannot be reliably ascertained without undue cost or effort. Fair values are recognized if there are indications that fair value is lower than cost. There is currently no intention to sell
these financial assets.
Uniform valuation techniques and inputs are used to measure fair value. The fair value of Level 2 and 3 financial
instruments is measured in the individual divisions on the basis of Group-wide specifications. The fair value of the put
options and compensation rights granted to noncontrolling interest shareholders is calculated using a present value model
that is based on the expected cash settlement entitlement of the free float MAN and Scania shareholders. Risk-adjusted discount rates for matching maturities were applied. The calculation was also based on any cash compensation that might
be payable and a minimum statutory interest rate.

I N T E R I M C O N S O L I D AT E D F I N A N C I A L STAT E M E N T S ( C O N D E N S E D )
Notes to the Interim Consolidated Financial Statements
41
The following table contains an overview of the financial assets and liabilities measured at fair value:
F I N A N C I A L A S S E T S A N D L I A B I L I T I E S M E A S U R E D AT FA I R VA L U E B Y L E V E L
€ million Dec. 31, 2013 Level 1 Level 2 Level 3 Noncurrent assets
Other equity investments 2,666 2,666 – –
Other financial assets 2,414 – 2,400 14
Current assets
Other financial assets 1,680 – 1,662 18
Marketable securities 8,492 8,410 83 –
Noncurrent liabilities
Other noncurrent financial liabilities 1,169 – 1,033 136
Current liabilities
Other current financial liabilities 1,070 – 988 82
€ million Sept. 30, 2014 Level 1 Level 2 Level 3 Noncurrent assets
Other equity investments 3,054 3,054 – –
Other financial assets 1,861 – 1,830 31
Current assets
Other financial assets 1,120 – 1,108 12
Marketable securities 8,881 8,877 5 –
Noncurrent liabilities
Other noncurrent financial liabilities 1,786 – 1,642 143
Current liabilities
Other current financial liabilities 2,396 – 2,330 66
The allocation of fair values to the three levels in the fair value hierarchy is based on the availability of observable market
prices in an active market. Level 1 is used to report the fair value of financial instruments for which a quoted price is available. Examples include marketable securities and other equity investments measured at fair value. Fair values in
Level 2, for example of derivatives, are measured on the basis of market inputs such as exchange rates or yield curves using
market-based valuation techniques. Level 3 fair values are calculated using valuation techniques that incorporate inputs
that are not directly observable in active markets. In the Volkswagen Group, Level 3 fair values comprise long-term
commodity futures because the prices available on the market must be extrapolated for measurement purposes. Options
on equity instruments and residual value protection models are also reported in Level 3.

I N T E R I M C O N S O L I D AT E D F I N A N C I A L STAT E M E N T S ( C O N D E N S E D )
Notes to the Interim Consolidated Financial Statements
42
C H A N G E S I N B A L A N C E S H E E T I T E M S M E A S U R E D AT FA I R VA L U E B A S E D O N L E V E L 3
€ million Financial assets
measured at fair value
Financial liabilities
measured at fair value Balance at Jan. 1, 2013 119 60
Foreign exchange differences 0 0
Total comprehensive income – 64 – 134
recognized in profit or loss – 59 – 122
recognized in other comprehensive income – 5 – 12
Additions (purchases) 1 1
Sales and settlements – 6 15
Transfers into Level 2 – 9 – 17
Balance at Sept. 30, 2013 41 164
Total gains or losses recognized in profit or loss – 59 – 122
Net other operating expense/income – 59 – 156
of which attributable to assets/liabilities held at the reporting date 59 156
Financial result 0 35
of which attributable to assets/liabilities held at the reporting date 3 – 35
€ million Financial assets
measured at fair value
Financial liabilities
measured at fair value Balance at Jan. 1, 2014 32 218
Foreign exchange differences 0 0
Total comprehensive income 37 34
recognized in profit or loss 24 34
recognized in other comprehensive income 12 1
Additions (purchases) – –
Sales and settlements – 8 – 33
Transfers into Level 2 – 17 – 10
Balance at Sept. 30, 2014 43 209
Total gains or losses recognized in profit or loss 24 – 34
Net other operating expense/income – –
of which attributable to assets/liabilities held at the reporting date – –
Financial result 24 – 34
of which attributable to assets/liabilities held at the reporting date 16 – 28

I N T E R I M C O N S O L I D AT E D F I N A N C I A L STAT E M E N T S ( C O N D E N S E D )
Notes to the Interim Consolidated Financial Statements
43
The transfers between the levels of the fair value hierarchy are reported at the respective reporting dates. The transfers out
of Level 3 into Level 2 comprise commodity futures for which observable quoted prices are now available for measurement
purposes due to the decline in their remaining maturities; consequently, no further extrapolation is required. There were
no transfers between other levels of the fair value hierarchy.
Commodity prices are the key risk variable for the fair value of commodity futures. Sensitivity analyses are used to
present the effect of changes in commodity prices on profit after tax and equity. If commodity prices for commodity futures classified as Level 3 had been 10% higher (lower) as of September 30, 2014,
profit would have been €25 million higher (lower) and equity would have been €8 million higher (lower).
The key risk variable for measuring options on equity instruments held by the Company is the relevant enterprise value.
Sensitivity analyses are used to present the effect of changes in risk variables on profit.
If the assumed enterprise values had been 10% higher, profit would have been €1 million higher. If the assumed
enterprise values had been 10% lower, profit would have been €2 million lower. Residual value risks result from hedging agreements with dealers under which earnings effects caused by market-
related fluctuations in residual values that arise from buy-back obligations under leases are borne in part by the Volks-
wagen Group.
The key risk variable influencing the fair value of the options relating to residual value risks is used car prices. Sensi-
tivity analyses are used to quantify the effects of changes in used car prices on earnings after tax.
If the prices for the used cars covered by the residual value protection model had been 10% higher as of September 30, 2014, profit after tax would have been €191 million higher. If the prices for the used cars covered by the residual value
protection model had been 10% lower as of September 30, 2014, profit after tax would have been €191 million lower.
Reconciliation of balance sheet items to classes of financial instruments
The following table shows the reconciliation of the balance sheet items to the relevant classes of financial instruments,
broken down by the carrying amount and fair value of the financial instruments. The fair value of financial instruments measured at amortized cost, such as receivables and liabilities, is calculated by
discounting using a market rate of interest for a similar risk and matching maturity. For reasons of materiality, the fair
value of current balance sheet items is generally deemed to be their carrying amount.

I N T E R I M C O N S O L I D AT E D F I N A N C I A L STAT E M E N T S ( C O N D E N S E D )
Notes to the Interim Consolidated Financial Statements
44
R E C O N C I L I AT I O N O F B A L A N C E S H E E T I T E M S TO C L A S S E S O F F I N A N C I A L I N ST R U M E N T S
A S O F D E C E M B E R 3 1 , 2 0 1 3
M E A S UR ED
A T F A I R V A L U E
M E A S U R ED A T A MO R T I Z ED C O S T
N O T W I T H I N
S C O P E OF I F R S 7
B A L A N C E SH E E T
I T E M A T
D E C . 3 1 , 2 0 1 3
€ million Carrying amount Carrying amount Fair value Carrying amount Noncurrent assets
Equity-accounted investments – – – 7,934 7,934
Other equity investments 2,666 1,274 1,274 – 3,941
Financial services receivables – 51,198 53,200 – 51,198
Other financial assets 2,414 4,626 4,593 – 7,040
Current assets
Trade receivables – 11,133 11,133 – 11,133
Financial services receivables – 38,386 38,386 – 38,386
Other financial assets 1,680 4,911 4,911 – 6,591
Marketable securities 8,492 – – – 8,492
Cash, cash equivalents and time deposits – 23,178 23,178 – 23,178
Noncurrent liabilities
Noncurrent financial liabilities – 61,517 62,810 – 61,517
Other noncurrent financial liabilities 1,169 1,136 1,153 – 2,305
Current liabilities
Put options and compensation rights granted to noncontrolling interest shareholders – 3,638 3,563 – 3,638
Current financial liabilities – 59,987 59,987 – 59,987
Trade payables – 18,024 18,024 – 18,024
Other current financial liabilities 1,070 3,456 3,456 – 4,526

I N T E R I M C O N S O L I D AT E D F I N A N C I A L STAT E M E N T S ( C O N D E N S E D )
Notes to the Interim Consolidated Financial Statements
45
R E C O N C I L I AT I O N O F B A L A N C E S H E E T I T E M S TO C L A S S E S O F F I N A N C I A L I N ST R U M E N T S
A S O F S E P T E M B E R 3 0 , 2 0 1 4
M E A S UR ED
A T F A I R V A L U E
M E A S U R ED A T A MO R T I Z ED C O S T
N O T W I T H I N
S C O P E OF I F R S 7
B A L A N C E SH E E T
I T E M A T
S E P T . 3 0 , 2 0 1 4
€ million Carrying amount Carrying amount Fair value Carrying amount Noncurrent assets
Equity-accounted investments – – – 8,774 8,774
Other equity investments 3,054 808 808 – 3,862
Financial services receivables – 56,566 58,819 – 56,566
Other financial assets 1,861 4,398 4,392 – 6,259
Current assets
Trade receivables – 12,784 12,784 – 12,784
Financial services receivables – 43,008 43,008 – 43,008
Other financial assets 1,120 5,323 5,323 – 6,442
Marketable securities 8,881 – – – 8,881
Cash, cash equivalents and time deposits – 22,373 22,373 – 22,373
Noncurrent liabilities
Noncurrent financial liabilities – 66,832 68,582 – 66,832
Other noncurrent financial liabilities 1,786 1,220 1,248 – 3,006
Current liabilities
Put options and compensation rights granted to noncontrolling interest shareholders – 3,690 3,755 – 3,690
Current financial liabilities – 64,026 64,026 – 64,026
Trade payables – 19,876 19,876 – 19,876
Other current financial liabilities 2,396 3,410 3,410 – 5,806

I N T E R I M C O N S O L I D AT E D F I N A N C I A L STAT E M E N T S ( C O N D E N S E D )
Notes to the Interim Consolidated Financial Statements
46
12. Cash flow statement
The cash flow statement presents the cash inflows and outflows in the Volkswagen Group and in the Automotive and
Financial Services divisions. Cash and cash equivalents comprise cash at banks, checks, bills, cash-in-hand and call
deposits.
€ million Sept. 30, 2014 Sept. 30, 2013 Cash, cash equivalents and time deposits as reported in the balance sheet 22,373 26,400
of which: time deposits and restricted cash – 1,389 – 2,761
Cash and cash equivalents as reported in the cash flow statement 20,984 23,639
Cash inflows from financing activities in the current year are attributable primarily to the issuance of bonds in the amount of
€19,908 million (previous year: €16,352 million), inflows from the issuance of hybrid notes in the amount of €2,952 million
(previous year: €1,967 million; see note 8), the issuance of new preferred shares amounting to €1,980 million (previous year: issuance of a mandatory convertible note in the amount of €1,099 million) and the change in other financial
liabilities amounting to €1,446 million (previous year: €–786 million). They are offset mainly by cash outflows from the
repayment of bonds amounting to €16,635 million (previous year: €9,999 million), the acquisition of shares of Scania AB
amounting to €6,535 million and dividend payments (including payments to hybrid capital investors) amounting to
€1,962 million (previous year: €1,848 million).
13. Segment reporting
Segments are identified on the basis of the Volkswagen Group’s internal management and reporting. In line with the
Group’s multibrand strategy, each of its brands is managed by its own board of management. The Group targets and
requirements laid down by the Board of Management of Volkswagen AG or the Group Board of Management must be complied with to the extent permitted by law. Segment reporting comprises four reportable segments: Passenger Cars,
Commercial Vehicles, Power Engineering and Financial Services.
The activities of the Passenger Cars segment cover the development of vehicles and engines, the production and sale of
passenger cars, and the corresponding genuine parts business. As a rule, the Volkswagen Group’s individual passenger car
brands are combined on a consolidated basis into a single reportable segment.
The Commercial Vehicles segment primarily comprises the development, production and sale of light commercial vehicles, trucks and buses, the corresponding genuine parts business and related services.
The activities of the Power Engineering segment consist of the development and production of large-bore diesel
engines, turbo compressors, industrial turbines and chemical reactor systems, as well as the production of gear units,
propulsion components and testing systems.
The activities of the Financial Services segment comprise dealer and customer financing, leasing, banking and
insurance activities, fleet management and mobility services. In the segment structure, purchase price allocation for companies acquired is allocated directly to the corresponding
segments.
At Volkswagen, segment profit or loss is measured on the basis of operating profit or loss.
The reconciliation contains activities and other operations that by definition do not constitute segments. It also
includes the unallocated Group financing activities. Consolidation adjustments between the segments are also contained
in the reconciliation. As a matter of principle, business relationships between the companies within the segments of the Volkswagen Group
are transacted at arm’s length prices.

I N T E R I M C O N S O L I D AT E D F I N A N C I A L STAT E M E N T S ( C O N D E N S E D )
Notes to the Interim Consolidated Financial Statements
47
R E P O RT I N G S E G M E N T S : Q 1 – 3 2 0 1 3
€ million Passenger Cars
Commercial
Vehicles
Power
Engineering
Financial
Services Total segments
Reconciliation
Volkswagen
Group Sales revenue from external customers 108,720 18,698 2,739 15,166 145,323 349 145,673
Intersegment sales revenue 7,430 3,881 3 1,336 12,650 – 12,650 –
Total sales revenue 116,150 22,579 2,742 16,502 157,973 – 12,301 145,673
Segment profit or loss (operating profit or loss) 7,907 692 – 302 1,333 9,629 – 1,071 8,557
R E P O RT I N G S E G M E N T S : Q 1 – 3 2 0 1 4
€ million Passenger Cars
Commercial
Vehicles
Power
Engineering
Financial
Services Total segments
Reconciliation
Volkswagen
Group Sales revenue from external customers 110,190 18,046 2,639 16,491 147,367 351 147,718
Intersegment sales revenue 9,612 3,779 3 1,608 15,002 – 15,002 –
Total sales revenue 119,802 21,825 2,642 18,099 162,369 – 14,650 147,718
Segment profit or loss (operating profit or loss) 8,368 662 23 1,436 10,489 – 1,074 9,416
R E C O N C I L I AT I O N
Q 1 – 3
€ million 2014 2013 Segment profit or loss (operating profit or loss) 10,489 9,629
Unallocated activities 104 100
Group financing – 11 – 11
Consolidation – 1,167 – 1,161
Operating profit 9,416 8,557
Financial result 2,075 842
Consolidated profit before tax 11,490 9,399

I N T E R I M C O N S O L I D AT E D F I N A N C I A L STAT E M E N T S ( C O N D E N S E D )
Notes to the Interim Consolidated Financial Statements
48
14. Related party disclosures
At 50.73%, Porsche SE holds the majority of the voting rights in Volkswagen AG.
The creation of rights of appointment for the State of Lower Saxony was resolved at the Extraordinary General Meeting
of Volkswagen AG on December 3, 2009. As a result, Porsche SE can no longer appoint the majority of the members of
Volkswagen AG’s Supervisory Board for as long as the State of Lower Saxony holds at least 15% of Volkswagen AG’s ordinary shares. However, Porsche SE continues to have the power to participate in the operating policy decisions of the
Volkswagen Group.
S U P P L I E S A N D S E R V I C E S
R E N D E R ED
S U P P L I E S A N D S E R V I C E S
R E C EI V ED
Q1–3 Q1–3
€ million 2014 2013 2014 2013 Porsche SE 14 7 5 10
Supervisory Board members 5 1 3 2
Unconsolidated subsidiaries 690 587 477 451
Joint ventures and their majority interests 12,842 10,107 902 903
Associates and their majority interests 135 200 284 218
State of Lower Saxony, its majority interests and joint ventures 4 6 2 1
R E C EI V A B L E S ( I N C L . C O L L A T E R A L
R E C EI V ED ) F R O M
L I A B I L I T I E S
( I N C L . O B L I G A T I ON S ) T O
€ million Sept. 30, 2014 Dec. 31, 2013 Sept. 30, 2014 Dec. 31, 2013 Porsche SE 354 361 215 419
Supervisory Board members 0 0 209 165
Unconsolidated subsidiaries 554 1,172 575 587
Joint ventures and their majority interests 6,305 5,758 2,197 2,064
Associates and their majority interests 53 26 109 73
State of Lower Saxony, its majority interests and joint ventures 0 2 1 0

I N T E R I M C O N S O L I D AT E D F I N A N C I A L STAT E M E N T S ( C O N D E N S E D )
Notes to the Interim Consolidated Financial Statements
49
The supplies and services received from joint ventures and associates in the first nine months do not include resolved
dividend distributions amounting to €2,939 million (previous year: €2,774 million).
The receivables from Porsche SE comprise a receivable under a loan agreement and receivables from land transfer
taxes. The obligations to Porsche SE consist mainly of term deposits and interest payable.
Obligations to members of the Supervisory Board relate primarily to interest-bearing bank balances of Supervisory
Board members amounting to €206 million that were invested at standard market terms and conditions at Volkswagen Group companies.
Obligations to joint ventures contain miscellaneous financial obligations under an irrevocable credit commitment in
the amount of €1.3 billion to LeasePlan Corporation N.V., Amsterdam, the Netherlands, a Volkswagen Group joint venture,
with a term until December 2015.
15. Litigation
Volkswagen AG’s Annual Report for fiscal year 2013 contains detailed information on litigation and other legal
proceedings. The antitrust proceedings opened in 2011 by the Korean Fair Trade Commission against several truck
manufacturers, including local subsidiaries of MAN and Scania, were brought to a close at the end of fiscal year 2013 with
decisions to impose administrative fines on all manufacturers involved. MAN and Scania have lodged appeals at the competent court against the administrative fines imposed on them.
There have been no other significant changes since the publication of the 2013 Annual Report.
16. Contingent assets and liabilities
There were no significant changes as of September 30, 2014 in the contingent assets and liabilities described in the 2013
Annual Report.
17. Other financial obligations
The other financial obligations increased by €4,384 million compared with the 2013 consolidated financial statements to
€28,754 million, due in particular to an increase in purchase commitments for items of property, plant and equipment,
and intangible assets, because of initiated or planned investment projects.

I N T E R I M C O N S O L I D AT E D F I N A N C I A L STAT E M E N T S ( C O N D E N S E D )
Notes to the Interim Consolidated Financial Statements
50
German Corporate Governance Code
The current declarations in accordance with section 161 of the Aktiengesetz (AktG – German Stock Corporation Act) on the
German Corporate Governance Code by the Board of Management and Supervisory Board of Volkswagen AG, AUDI AG,
MAN SE and RENK AG are permanently available on the Internet at www.volkswagenag.com/ir, www.audi.com/cgk-
declaration, www.corporate.man.eu/en and www.renk.biz/corporated-governance.html respectively.
Significant events after the balance sheet date
There were no significant events after the end of the first nine months of 2014.
Wolfsburg, October 30, 2014
Volkswagen Aktiengesellschaft
The Board of Management
I N T E R I M C O N S O L I D AT E D F I N A N C I A L STAT E M E N T S ( C O N D E N S E D )
Review Report
51
This report was originally prepared in German. In case of ambiguities the German version shall prevail:
Review Report
To VOLKSWAGEN AKTIENGESELLSCHAFT, Wolfsburg
We have reviewed the condensed consolidated interim financial statements – comprising the condensed income state-
ment and condensed statement of comprehensive income, condensed balance sheet, condensed statement of changes in
equity, condensed cash flow statement and selected explanatory notes – and the interim Group management report of
VOLKSWAGEN AKTIENGESELLSCHAFT, Wolfsburg, for the period from January 1 to September 30, 2014, which are part
of the quarterly financial report pursuant to § (Article) 37x Abs. (paragraph) 3 WpHG ("Wertpapierhandelsgesetz": German Securities Trading Act). The preparation of the condensed consolidated interim financial statements in accordance with
the IFRSs applicable to interim financial reporting, as adopted by the EU, and of the interim group management report in
accordance with the provisions of the German Securities Trading Act applicable to interim Group management reports is
the responsibility of the parent Company's Board of Management. Our responsibility is to issue a review report on the
condensed consolidated interim financial statements and on the interim Group management report based on our review.
We conducted our review of the condensed consolidated interim financial statements and the interim Group management report in accordance with German generally accepted standards for the review of financial statements
promulgated by the Institut der Wirtschaftsprüfer (Institute of Public Auditors in Germany) (IDW). Those standards require
that we plan and perform the review so that we can preclude through critical evaluation, with moderate assurance, that the
condensed consolidated interim financial statements have not been prepared, in all material respects, in accordance with
the IFRSs applicable to interim financial reporting, as adopted by the EU, and that the interim group management report
has not been prepared, in all material respects, in accordance with the provisions of the German Securities Trading Act applicable to interim Group management reports. A review is limited primarily to inquiries of company personnel and
analytical procedures and therefore does not provide the assurance attainable in a financial statement audit. Since, in
accordance with our engagement, we have not performed a financial statement audit, we cannot express an audit opinion.
Based on our review, no matters have come to our attention that cause us to presume that the condensed consolidated
interim financial statements have not been prepared, in all material respects, in accordance with the IFRSs applicable to
interim financial reporting, as adopted by the EU, nor that the interim group management report has not been prepared, in all material respects, in accordance with the provisions of the German Securities Trading Act applicable to interim
Group management reports.
Hanover, October 30, 2014
PricewaterhouseCoopers
Aktiengesellschaft
Wirtschaftsprüfungsgesellschaft
Norbert Winkeljohann Martin Schröder
German Public Auditor German Public Auditor
Review Report