JANUARY - Next Plc/media/Files/N/Next-PLC-V2/documents/2017/Cop… · As anticipated, the year to...
162
JANUARY
Transcript of JANUARY - Next Plc/media/Files/N/Next-PLC-V2/documents/2017/Cop… · As anticipated, the year to...

slugline slugline
JANUARY

slugline slugline
NEXT is a UK based retailer offering exciting, beautifully designed, excellent quality clothing, footwear, accessories and home products.
ContentsStrategic Report3 Chairman’s Statement4 Chief Executive’s Review26 Business Model28 Key Performance Indicators30 Risks and Uncertainties35 Viability Assessment36 Employees36 Social, Community
and Human Rights38 Environmental Matters
Governance40 Directors’ Report including
Annual General Meeting & Other Matters
47 Directors’ Responsibilities Statement
48 Corporate Governance53 Nomination Committee
Report54 Audit Committee Report58 Remuneration Report86 Independent Auditor’s
ReportShareholder Information145 Half Year and Sector Analysis146 Five Year History147 Glossary149 Notice of Meeting157 Other Shareholder
Information
Consolidated Accounts96 Consolidated Income
Statement97 Consolidated Statement
of Comprehensive Income98 Consolidated Balance Sheet99 Consolidated Statement
of Changes in Equity100 Consolidated Cash Flow
Statement101 Group Accounting Policies107 Notes to the Consolidated
Financial StatementsParent Company Accounts140 Parent Company Balance
Sheet141 Parent Company
Statement of Changes in Equity
142 Notes to the Parent Company Financial Statements
Investor websiteWe maintain a corporate website at www.nextplc.co.uk containing a wide range of information of interest to investors
Please note: you can register to receive electronic shareholder communications at www.nextplc.co.uk
To view our range of exciting, beautifully designed clothing, footwear, accessories and home products go to www.next.co.uk
NEXT distributes through three main channels:
• NEXT Retail, a chain of around 540 stores in the UK and Eire
• NEXT Directory, our home shopping division with over 4.5 million active customers in the UK and overseas
• NEXT International Retail, with around 200 mainly franchised stores
This symbol signposts the reader to other sections within this report
This document contains Forward Looking Statements — see page 158

slugline
Jan 14 Jan 15 Jan 16† Jan 17Jan 13
£3.6bn
£3.8bn
£4.0bn
£4.1bn
£4.1bn
-0.3%TOTAL SALES*
Underlying continuing business
Jan 14Jan 15‡
Jan 16†Jan 17
Jan 13‡
£622
m
£695
m
£782
m
£821
m
£790
m
-3.8%PROFIT BEFORE TAXUnderlying continuing business
Jan 14
Jan 15‡
Jan 16†Jan 17
Jan 13‡
297.7p
366.1p
419.8p
442.5p
441.3p
-0.3%EARNINGS PER SHAREUnderlying
Jan 14
Jan 15Jan 16 Jan 17
Jan 13
105p
129p
150p
158p
158p
no changeDIVIDENDS PER SHAREExcluding special dividends
FINANCIAL HIGHLIGHTS
* Total Sales excludes VAT and includes the full value of commission based sales and interest income (refer to Note 1 of the financial statements).
† Sales, profit and EPS figures for Jan 16 are shown on a comparable 52 week basis.
‡ Underlying results for 2013 and 2015 are shown pre-exceptional items.
HIGHLIGHTS• On a comparable 52 week basis:
• Total sales down -0.3% to £4.1bn;
• Profit before tax down -3.8% to £790m;
• Underlying EPS down -0.3% to 441.3p.
• £314m paid to shareholders in dividends through a combination of ordinary dividends £226m and special dividends £88m. A further £188m was returned through share buybacks.
• Final ordinary dividend of 105p, making 158p for the year, level on last year. Remains covered 2.8 times.
• Strategy continues to be focused on products, profitability and returning cash to shareholders through dividends and share buybacks.
Read more in the Chief Executive’s Review on pages 4 to 25
See our Group Financial Statements on pages 96 to 138

slugline
STRATEGIC REPORT3 Chairman’s Statement4 Chief Executive’s Review26 Business Model28 Key Performance Indicators30 Risks and Uncertainties35 Viability Assessment36 Employees36 Social, Community and Human Rights38 Environmental Matters

slugline
Strategic Report
Chairman’s StatementAs anticipated, the year to January 2017 was a challenging year for NEXT, despite this Earnings Per Share1 declined by only -0.3% to 441.3p. We propose to maintain our total full year ordinary dividend flat at 158p.
Whilst total sales2 for NEXT Retail declined by -2.9%, sales for NEXT Directory increased by +4.2%. Total Group sales were broadly flat at £4.1bn for the year.
Cash flow remained strong and we returned £502m to shareholders through a combination of ordinary dividends (£226m), special dividends (£88m) and share buybacks (£188m).
We have continued to invest in the business, spending £161m on new stores, warehousing and systems. Net debt increased to £861m, well within our bond and bank facilities of £1.4bn.
It has already been announced that I will retire from the Board on 1 August 2017. I have been at NEXT for fifteen years and have immensely enjoyed the experience. NEXT is an excellent company and working with the Board and executive team has been extremely stimulating and enjoyable.
I will be succeeded as Chairman by Michael Roney. The Board appointed Michael as a non-executive director, Deputy Chairman and Chairman Designate in February this year. Michael has extensive business experience and has had a long and distinguished career, including as Chief Executive of Bunzl plc. He also has all the qualities that are necessary in a good chairman and I am very confident that he will make an excellent transition into the role.
I am also pleased that Jonathan Bewes has joined us as a non-executive director during the year. Jonathan has a great deal of experience in investment banking, is a Chartered Accountant and is a very good addition to the Board.
Steve Barber, non-executive director and Chair of the Audit Committee, will step down from the Board at the 2017 AGM in May. Steve has made a much valued and active contribution to the Board and I would like to thank him for his service over the last ten years. Jonathan Bewes will take over from Steve as Chairman of the Audit Committee after the AGM.
The strength of the Group is built on the hard work and dedication of all the people who work for NEXT. I would like to thank them all for their contribution throughout the year. I have been Chairman of NEXT since May 2006. In 2008 our profits fell and our share price halved; by the following year our profits had started to grow again and our share price recovered strongly in the following years. Trading conditions in the year ahead will continue to be tough, however I believe that by focusing on our core strengths, as we did during 2008, we will see NEXT emerge from this period stronger than before.
John BartonChairman
Read more in the Chief Executive’s Review on pages 4 to 25
Read about our Governance on pages 48 to 52
1. Earnings Per Share growth is stated on a comparable 52 v 52 week basis.2. Total sales are VAT exclusive sales including the full value of commission based sales and interest income (refer to Note 1 of the financial statements).
Strategic R
epo
rtG
overnance
Financial Statements
Sharehold
er Inform
ation
3n e x t p l c . c o . u k

slugline
Strategic Report
Chief Executive’s ReviewOverviewNEXT Brand total sales were level with last year, full price sales3 were down -1.3%. Directory has performed better than Retail as customers continue to shop more online. In addition, Directory benefited from improved stock availability, enhanced website functionality and the continued growth of LABEL and Directory overseas.
Profit before tax was down -3.8%. Underlying Earnings Per Share (EPS) were down only -0.3% as a result of share buybacks during the year.
We are proposing a final ordinary dividend of 105p per share, making 158p in total for the year, which is in line with last year.
Last year was a 53 week year. In order to give a clear picture of the underlying performance of the business, the figures above and throughout this report are shown on a 52 week versus 52 week basis unless stated otherwise.
SALES excluding VAT(52 weeks v 52 weeks)
Jan 2017
£m
Jan2016
£mNEXT Retail 2,304.6 2,373.5 -2.9%NEXT Directory 1,728.5 1,658.7 +4.2%NEXT BRAND 4,033.1 4,032.2 0.0%Other 103.7 117.5Total NEXT Group sales (52 v 52 weeks) 4,136.8 4,149.7 -0.3%Statutory revenue (52 v 53 weeks) 4,097.3 4,176.9
PROFIT and EPS(52 weeks v 52 weeks)
Jan2017
£m
Jan2016
£mNEXT Retail 338.7 402.1 -15.8%NEXT Directory 444.1 405.2 +9.6%NEXT BRAND 782.8 807.3 -3.0%Other 44.9 44.5Operating profit 827.7 851.8 -2.8%Net interest (37.5) (30.5)Profit before tax – underlying 790.2 821.3 -3.8%Profit from 53rd week in prior year – 14.8Taxation (52 v 53 weeks) (154.9) (169.3)Profit after tax (52 v 53 weeks) 653.3 666.8
EPS – underlying (52 v 52 weeks) 441.3p 442.5p -0.3%Ordinary dividends per share 158.0p 158.0p 0.0%
3. Full price sales are VAT exclusive sales, excluding items sold in our mid-season or end-of-season Sale events and our Clearance operations. They include interest income relating to those sales.
4 n e x t p l c . c o . u k

slugline
Objectives for the year aheadThe year ahead looks set to be another tough year for NEXT. We remain clear on our priorities going forward. We will continue to focus on improving the Company’s product, marketing, services, stores and cost control.
The Company’s main operational objectives are set out in the table below. They remain broadly unchanged from those set out last year.
Develop the NEXT brand Continue to develop our buying and design capabilities; delivering better design, improved quality and quicker response to new trends whilst also re-building some of our heartland business (see page 6).
Upgrade Directory Continue to build on the improvements we have made to the Directory in the previous year.
Development will focus on improving our website functionality, website look and feel, personalisation, our credit offer and the way we promote it, our online marketing capabilities and our delivery services (see page 16).
Invest in online growth businesses Continue to develop NEXT overseas through investment in our website, in particular the roll out of our overseas mobile site.
Continue to develop LABEL through the addition of new key brands, particularly through ‘Lipsy & Co’.
Invest in profitable new space Open profitable new retail space, maintaining the Company’s payback and profitability hurdles of 15% net store profit (before central overheads) and payback on net capital invested in 24 months (see pages 8 to 10).
Control costs Control costs through constantly innovating and developing more efficient ways of operating. This must be done without detracting from the quality of our products and services.
Strategic R
epo
rtG
overnance
Financial Statements
Sharehold
er Inform
ation
5n e x t p l c . c o . u k

slugline
Strategic Report
Focus on productOur ranges continue to be at the heart of everything we do.
In our half-year report in September 2016, we explained how we were adapting our buying processes to increase the speed with which we react to new trends. We have made a great deal of progress in this area. Our buying teams are now developing new products and making buying decisions faster, taking products from concept to shop floor in much shorter timescales. In many cases we have reduced the product development times by three months. These gains can be even greater where our buyers have pre-ordered fabric and have it available to use at the time they order an item.
Where we have used these new buying techniques they have proved successful. The items shown below were some of our best-selling lines in the run up to Christmas and were all developed rapidly using new buying and merchandise practices.
However, in focussing so much energy on changing our buying culture, processes and adopting exciting new trends, we have omitted some of our best-selling, heartland product from our ranges. These are the easy to wear styles that can be delivered in large volumes and great prices across several colours.
We identified this issue in January. Corrective action is relatively straightforward and began in late January. We believe that some of these changes will begin to be reflected in our Summer ranges from May onwards, but we will not have our ranges where we want them until the Autumn season (September onwards).
Going forward we will continue to build on what we have learnt about the rapid development of new products and the delivery of new trends, with the proviso that those trends must be delivered in a way that all our customers can easily buy into. In re-balancing our ranges, we must be careful not to become overly conservative and throw away the excellent progress we have made in moving our buying processes forward.
6 n e x t p l c . c o . u k

slugline
NEXT RetailRetail sales and profit analysisTotal NEXT Retail sales reduced by -2.9% and full price sales were down -4.6%. Profit reduced by -15.8%, as shown in the table below.
£mJan
2017Jan
2016Retail total sales 2,304.6 2,373.5 -2.9%Retail operating profit 338.7 402.1 -15.8%Retail net margin 14.7% 16.9%
Net new space contributed +2.5% to growth.
The table below sets out significant Retail margin movements by major heads of costs.
Net operating margin on total sales last year 16.9%
Bought-in gross margin Over-achievement against target margin, mainly as a result of lower freight costs.
+0.1%
Markdown Stock for Sale was up +17% on last year whilst markdown sales were up +13%. The increase in stock for sale eroded margin by -0.7% and lower cash recovery4 reduced margin by -0.3%.
-1.0%
Store payroll Increased rates of pay would have reduced margin by -0.5%. However, this adverse effect was offset by productivity initiatives in store.
0.0%
Store occupancy Negative like-for-like5 sales increased fixed costs as a percentage of sales. Underlying rental inflation was +0.5%.
-1.1%
Warehouse & distribution Margins were eroded for three reasons. (1) we incurred start-up costs for our new automated furniture warehouse, (2) negative total sales meant that fixed costs increased as a percentage of sales and (3) wage inflation reduced productivity.
-0.3%
Central overheads Central overheads reduced, mainly due to lower management incentives. +0.1%
Net operating margin on total sales this year 14.7%
Based on our central guidance for the year ahead we expect Retail margins in 2017/18 to reduce to around 12%, mainly as a result of lower like-for-like sales.
4. Cash recovery is the cash generated from markdown sales expressed as a percentage of the full price value of the stock going into the Sale.5. Growth in sales from stores which have been open for at least one year.
Strategic R
epo
rtG
overnance
Financial Statements
Sharehold
er Inform
ation
7n e x t p l c . c o . u k

slugline
Strategic Report
Retail space expansionNet trading space increased by 330,000 square feet this year, taking our portfolio to 8.0m square feet. Store numbers remained broadly the same, with the increase in new space being offset by the closure of smaller, less profitable stores.
The table below sets out the change in store numbers and space for the full year.
Store numbers
Sq. ft. (‘000)
January 2016 540 7,648New stores, including 17 re-sites +27 +608Closures, including 20 re-sites -29 -327Extensions (9) – +49January 2017 538 7,978 +4.3%
The profitability of the portfolio of stores opened or extended in the last 12 months is forecast to be 23% of VAT inclusive sales and payback on the net capital invested is expected to be 24 months. Both measures meet our Company investment hurdles of 15% profitability and 24 months payback.
Looking at the new projects in the year ahead, we estimate we will add 150,000 net square feet and a further 250,000 square feet in the following year. This estimate is only a rough guide at this stage and much will depend on the lease terms we are able to achieve and required planning permissions.
It is worth reiterating that, as we outlined in our Analysts’ presentation in September 2016, the new stores are significantly cheaper than the current portfolio, both in terms of rent per square foot and rent to sales ratio. The table below sets out the rent ratios of our existing stores and the equivalent figures for the new space opening in the year.
Store rent analysisAs at Jan
2017
Opening during
2017/18(e)Square feet 8m 343kAnnual rent £181m £6mRent/square foot £22.68 £17.28 - 24%Rent/sales 6.6% 5.0% - 24%
8 n e x t p l c . c o . u k

slugline
Retail store profitabilityAs a result of the active management of our store portfolio, the vast majority of our stores make a healthy profit, with 97% of our space delivering a net branch profit6 of more than 10%. The left hand table below sets out the percentage of our turnover within stores of different levels of profitability at January 2017. The right hand table shows the same information projected forward into next year based on the assumption that like-for-like retail sales are down -7%, which is in line with our central guidance. As can be seen from the tables, our portfolio is extremely profitable and is likely to remain so despite current trading conditions.
Jan 2017 Jan 2018 (e)Mainline store profitability
Percentage of turnover
Mainline store profitability
Percentage of turnover
>20% 74% >20% 65%>15% 92% >15% 88%>10% 97% >10% 95%>5% 99% >5% 98%>0% 99.3% >0% 98.8%
NEXT: Hull Kingswood
6. Net branch profit is defined as profit before central overheads and is expressed as a percentage of VAT inclusive sales.
Strategic R
epo
rtG
overnance
Financial Statements
Sharehold
er Inform
ation
9n e x t p l c . c o . u k

slugline
Strategic Report
Long term retail portfolio stress testWith increasing amounts of business being transferred online, it is legitimate to question the long term viability of retail stores and whether the possession of a retail portfolio is an asset or a liability. We believe that our stores represent a valuable asset and will continue to do so. However, in the unlikely event that like-for-like retail sales continue to decline at high rates for the next ten years, we believe that our lease structure is such that the portfolio could be managed down profitably.
In such a scenario it is extremely likely that rents would fall to reflect the new reality and that is our experience so far, but what if they do not? To answer this question we projected the profitability of our current store portfolio in three different like-for-like sales scenarios over the next ten years: -2% which is the average of the last five years, -4% and -6%. For the purpose of this model we have made the following conservative assumptions:
• We shut unprofitable stores at their lease expiry.
• When profitable stores reach the end of their lease we are able to continue trading, paying the same rent on a short term lease.
• We take on no new space.
As can be seen from the graph below, even in our worst case scenario, the portfolio would still make around 10% net branch profit before central overheads. In such extreme circumstances it is likely that we would be able to renegotiate rents downwards and open some profitable new stores, both of which would increase profitability.
In conclusion, our existing and new stores will remain a profitable asset even in very difficult circumstances. And this is why we continue to take on new space where we have the opportunity to increase sales and profit, as long as we continue to adhere to our strict profitability and payback hurdles and only take relatively short term leases (e.g. ten years).
25%
20%19%
15%
10%
-2% pa LFL scenario
-4% pa LFL scenario
-6% pa LFL scenario
2017 2018 2019 2020 2021 2022 2023 2026
% o
f VA
T in
clus
ive
sale
s
Projected Net Branch Profitability – Three Scenarios
20%
15%
10%
5%
0%
2024 2025
The weighted average remaining lease term of our current portfolio remains 7.5 years, with 50% of our leases (by value) expiring within six years and 70% within ten years.
10 n e x t p l c . c o . u k

slugline
NEXT DirectoryNEXT Directory sales performanceTotal Directory sales grew by +4.2%, with full price sales growth of +3.6%. The table below shows the growth in full price sales for each element of the business. Full price sales in the UK grew by +1.2% and our overseas business grew by +18.5%.
Full price sales growth £m % var UK NEXT -19 -1.8% UK LABEL +34 +18.9%Total UK +15 +1.2%Overseas +36 +18.5%Total +51 +3.6%
Directory customer baseAverage active customers7 increased by +4% to 4.7 million, driven by the growth of UK ‘cash’ customers (those who do not use our credit account when ordering) and customers overseas. The table below sets out the growth in our customer base.
Average active customers (m)Jan
2017Jan
2016UK credit account8 2.50 2.58 -3%UK cash 1.38 1.21 +14%Total UK 3.88 3.79 +3%Overseas 0.85 0.76 +11%Total 4.73 4.55 +4%
7. Active customers are defined as those who have placed a Directory order or received a standard account statement in the last 20 weeks.8. Prior year active customers have been reduced by 0.04m to exclude inactive accounts that were included in error last year.
Strategic R
epo
rtG
overnance
Financial Statements
Sharehold
er Inform
ation
11n e x t p l c . c o . u k
slugline
Strategic Report
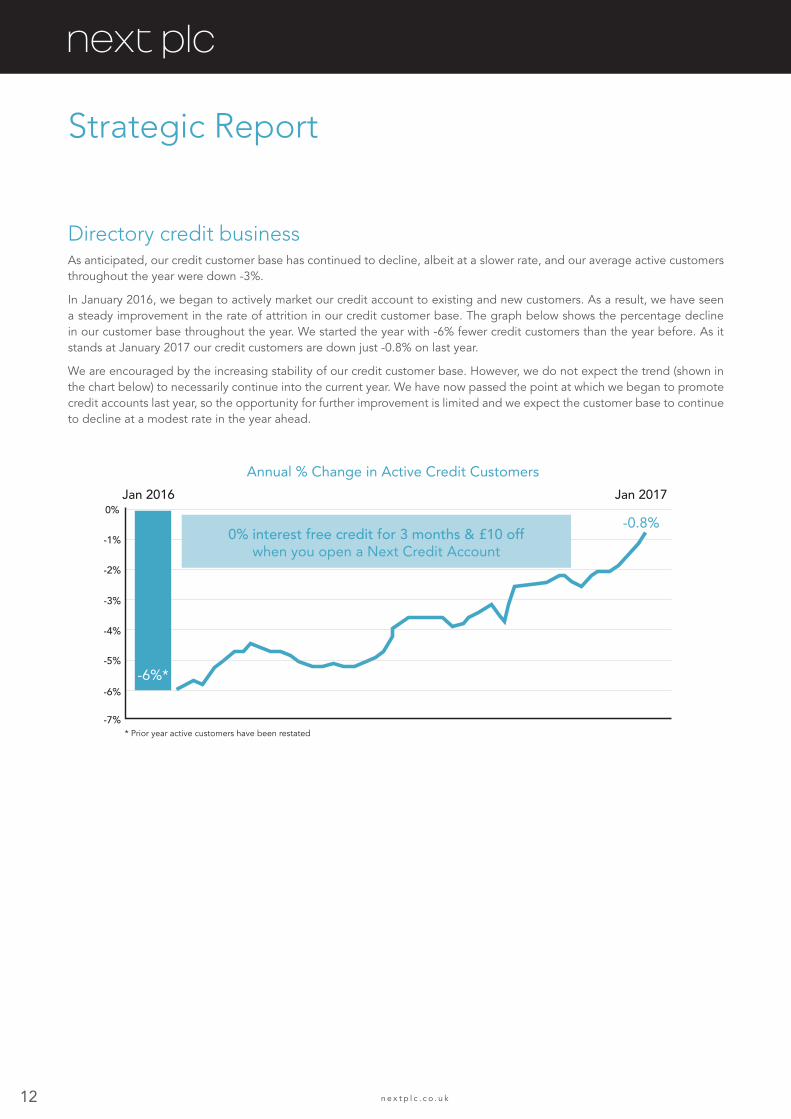
Directory credit businessAs anticipated, our credit customer base has continued to decline, albeit at a slower rate, and our average active customers throughout the year were down -3%.
In January 2016, we began to actively market our credit account to existing and new customers. As a result, we have seen a steady improvement in the rate of attrition in our credit customer base. The graph below shows the percentage decline in our customer base throughout the year. We started the year with -6% fewer credit customers than the year before. As it stands at January 2017 our credit customers are down just -0.8% on last year.
We are encouraged by the increasing stability of our credit customer base. However, we do not expect the trend (shown in the chart below) to necessarily continue into the current year. We have now passed the point at which we began to promote credit accounts last year, so the opportunity for further improvement is limited and we expect the customer base to continue to decline at a modest rate in the year ahead.
Annual % Change in Active Credit Customers
Jan 20160%
-1%
-2%
-3%
-4%
-5%
-6%
-7%* Prior year active customers have been restated
Jan 2017
-0.8%0% interest free credit for 3 months & £10 off
when you open a Next Credit Account
-6%*
12 n e x t p l c . c o . u k

slugline
Directory profit analysisTotal NEXT Directory sales grew by +4.2% and profit grew by +9.6%, as shown in the table below.
£mJan
2017Jan
2016Directory total sales 1,728.5 1,658.7 +4.2%Directory operating profit 444.1 405.2 +9.6%Directory net margin 25.7% 24.4%
The table below sets out significant Directory margin movements by major heads of costs.
Net operating margin on total sales last year 24.4%Bought-in gross margin Bought-in gross margin was +0.1% and in line with Retail. However, this
improvement has been offset by an increase in sales of third-party branded products, which have lower margins.
-0.3%
Markdown Stock for Sale was up +5% on last year, broadly in line with markdown sales. -0.1%
Interest income Higher interest income, as a result of reduced minimum payments, increased margin. This has been partially offset by a reduction in the annual percentage rate of interest we charge our customers.
+1.0%
Warehouse & distribution Margin improved as a result of greater efficiency in our warehousing and distribution operations.
+0.6%
Marketing, photography & catalogue production
Reduction in print costs have been partially offset by increased UK online marketing costs.
+0.1%
Net operating margin on total sales this year 25.7%
Based on our central guidance for the year ahead we expect Directory margins to reduce by -0.3%, mainly as a result of the growth of sales in our third-party branded products, which have lower margins than our NEXT branded stock.
Directory overseasDirectory overseas continues to trade well and full price sales for the full year were up +18% on last year (on a constant currency basis sales were up +19%).
Sales and profit historyThe table below sets out the last four years’ sales, profits and net margins in Pounds Sterling for Directory overseas, along with an estimate for the year ahead. In the year to January 2017, margin in our overseas business improved, mainly as a result of efficiencies within our parcel networks and distribution hubs.
£mJan
2014Jan
2015Jan
2016Jan
2017Jan
2018 (e)Total sales 101 163 197 234 290Operating profit 18 30 31 46 639
Net margin 18% 18% 16% 20% 22%
In the year ahead we expect sales to grow by +15% on a constant currency basis. As a result of the weakening of the Pound our overseas business will benefit in two ways. Firstly, our overseas customers will not experience any inflation in selling prices, so selling prices relative to the UK will reduce by around 5%. Secondly, the revenue stream will be more valuable in Sterling. As a result of this we expect sales in Pounds Sterling to increase by +24%.
9. Profit for the year ahead now includes an allocation of central overheads and markdown costs. This cost allocation reduces overseas profitability by 4%.
Strategic R
epo
rtG
overnance
Financial Statements
Sharehold
er Inform
ation
13n e x t p l c . c o . u k

slugline
Strategic Report
Distribution hubsOur overseas hubs (China, Russia and Germany) are working well, and allow us to get our stock to customers more efficiently compared to servicing orders from the UK network. We now service our Polish business from the German hub, a service we will be extending to fourteen surrounding countries during the year. The China hub is operationally very efficient but the administration associated with importing stock into the country continues to be a challenge.
LABELOur branded business, LABEL, continues to perform well, with total sales10 up +14% and full price sales up +17%. Net margin has improved to 16% largely as a result of less surplus stock. In the year ahead we expect full price and total sales to grow by +17% and to maintain our margin of 16%.
The table below sets out the last three years’ sales, profits and net margins for our LABEL business, along with our estimate for the year ahead.
£mJan
2015Jan
2016Jan
2017Jan
2018 (e)Total sales 145 180 206 241Operating profit 20 22 34 39Net margin 14% 12% 16% 16%
Lipsy & CoOur subsidiary Lipsy, continues to develop its ‘Lipsy & Co’ business. This enterprise offers other third-party young fashion brands, mainly sold on commission, alongside Lipsy product. These brands now account for 34% of Lipsy’s total sales. The aim is to create a younger offer within the NEXT Directory (and on Lipsy’s own website). Sales through the NEXT Directory of Lipsy & Co product are included in the LABEL figures above.
10. Sales and profit referred to in this section exclude interest income on LABEL items purchased on a Directory account.
14 n e x t p l c . c o . u k

slugline
Focus on the Changing Face of NEXT DirectoryAt the beginning of last year, we started the process of modernising the Next Directory. The two sections below detail some of the improvements we delivered in the previous year and some of the planned developments for the year ahead.
Developments during the yearSystemsDuring the year we implemented the following:
• Converged our UK and overseas websites allowing faster roll-out of new functionality and content across all our websites.
• Launched mobile websites in the UK and Northern Ireland across all hand held devices.
• Launched improved Apps for iPhone and iPad.
• Improved promotion of the NEXT Directory account (see page 12) and Directory card.
• Launched a new stock ordering system for Directory, improving stock availability from 65% to 70%.
• Rationalised catalogue distribution, saving £3.5m. This saving partially offset the increases in online marketing spend (see below).
• Developed online marketing capabilities increasing our online recruitment spend by £6m.
• Delivered the capability and began the process of personalising our website.
• Rolled out parcel shop collection from 4,000 parcel shops spread throughout the UK. This route now accounts for around 2% of our delivery volumes.
• Development of the new flowers website.
• Introduced sofa selection and ordering, adapted for our mobile site.
Online marketingDuring the year we increased online marketing expenditure by £6m. It has proven difficult to precisely measure the returns on this expenditure, however our analysis indicates that the internal rate of return (IRR) on investment in online advertising is around 30% in the UK, but unproductive in most overseas territories.
In the year ahead we will be able to target our advertising much more effectively. Firstly, we will be able to prevent recruitment advertising being shown to existing Directory customers (where they are recognised through a cookie). Secondly, we will be able to personalise adverts to our existing customers based on their purchasing history, recent browsing and abandoned baskets. We will also be able to more accurately promote relevant credit offers to existing customers through third-party websites.
Strategic R
epo
rtG
overnance
Financial Statements
Sharehold
er Inform
ation
15n e x t p l c . c o . u k

slugline
Strategic Report
Directory developments planned for the year aheadWe will continue to develop our online services and capabilities in the year ahead and plan to increase investment in Directory systems and content by £11m. The most important projects are:
• The roll out of ‘Next Unlimited’ which allows customers to pay £20 for a year’s unlimited next-day delivery anywhere in the UK and Northern Ireland.
• The re-branding and promotion of our Directory account as ‘nextpay’ along with the development of new, more targeted, credit offers.
• Save for later facility and saved bags across devices.
• Implementation of a Content Management System and Data Management System allowing a deeper level of home page personalisation, sort order personalisation, credit marketing, third-party advertising and emails.
• Precise delivery service offering a one hour delivery slot, selected at check-out, for a £2 premium.
• Look and feel website redesign, including faster and simpler registration and check-out.
• Launch of overseas mobile website. Currently mobile users overseas can only access a desktop website on their mobile devices. 70% of our overseas customers (by sales value) will have access to our mobile site by August.
• Improved search engine functionality (longer term).
The chart below shows the timescales for delivery of some of our major online projects throughout the year.
Major Projects Timeline
Jan 2017
2016
Feb Mar Apr May Jun Jul Aug Sep Oct Nov Dec Jan 2018
Credit promotions
Flowers site
More new lines
Sofas on mobile
Mobile site
Next Unlimited
Intelligent recommendations
Touch ID sign (Apps)
12 x International mobile sites live
Fast check-out
Improved search
Abandoned baskets
Fast registration
Improved selling page
Home page redesign
nextpay
March
April
July August
September
November
December
✓
16 n e x t p l c . c o . u k

slugline
Other Business ActivityNEXT SourcingNEXT Sourcing (NS) is our internal sourcing agent, which procures around 40% of NEXT branded product. NS sales are down -20% in local currency, mainly as a result of competition from other third-party suppliers. The profit impact of these lost sales was partially mitigated by the strengthening of the Dollar.
The table below sets out the performance of the business in Sterling and in Dollars.
Jan 2017 £m
Jan 2016 £m
Jan 2017 USDm
Jan 2016 USDm
Sales (mainly inter-company) 606.7 668.8 -9% 813.0 1,016.6 -20%Operating profit 44.7 50.5 -11% 59.9 76.8 -22%Net margin 7.4% 7.6% 7.4% 7.6%Exchange rate 1.34 1.52
Looking to the year ahead, based upon our central profit guidance, we expect NS to make around $50m profit, a decline of -17% on the current year. At our 2017/18 costing rates we expect this profit to be £39m (in Pounds Sterling).
LipsyLipsy has continued to reduce its UK wholesale business which is less profitable than (and competes with) its other sales channels. This has been more than offset by increased sales in NEXT Retail and Directory. Lipsy’s sales are broken down by distribution channel in the table below; sales through NEXT stores and Directory are reported in those divisions.
Sales (£m) Jan
2017 Jan
2016Wholesale 11.9 16.5Franchise 4.1 3.3Lipsy stand-alone retail stores 2.2 3.2Lipsy online (lipsy.co.uk) 8.9 6.2Total Lipsy sales 27.1 29.2Lipsy sales through NEXT Retail (reported in NEXT Retail) 16.5 14.4Lipsy sales through NEXT Directory (reported in NEXT Directory) 47.0 30.7Total sales 90.6 74.3 +22%
Excluding acquisition costs, operating profit was £8.9m which was up +34% on last year. Net operating profit was £5.5m, up +4% on last year. We are anticipating that the business will make net operating profit of around £7m next year.
Strategic R
epo
rtG
overnance
Financial Statements
Sharehold
er Inform
ation
17n e x t p l c . c o . u k

slugline
Strategic Report
International Retail and franchise storesOur franchise partners currently operate 186 stores in 33 countries. Franchise sales in the year have reduced by -15%, mainly due to retail like-for-like sales decline in some important territories. Our 13 wholly owned stores in Europe have made a small return in the full year. Revenue and profit are set out below.
£m Jan
2017 Jan
2016Franchise income11 51.6 63.0Own store sales 12.1 11.7Total revenue 63.7 74.7 -15%Operating profit 9.3 10.2 -9%
Non-trading activitiesThe table below summarises central costs and other non-trading activities.
£m Jan
2017 Jan
2016Central costs and share options (22.5) (24.2)Property management 6.8 7.4Unrealised foreign exchange 0.1 (5.6)Associate 1.0 1.0Total (14.6) (21.4)
The reduction in central costs and share options reflects lower incentive costs this year. There were minimal gains from unrealised foreign exchange, as budgeted.
Pension schemeOn the IFRS accounting basis, our defined benefit scheme has moved from a £46m surplus at January 2016 to a £63m surplus at January 2017. This is primarily due to the impact of actuarial assumptions and additional contributions of £20m made into the scheme during the year.
A full actuarial valuation of our defined benefit pension scheme was undertaken as at 30 September 2016, which showed a technical funding deficit of £70.2m at that date. A recovery plan has been agreed with the Trustees whereby the Group will contribute five annual payments of up to £14m. The first payment of £14m under this agreement was made in January 2017 and future contributions will only be required to be paid to the extent that there is a funding deficit at that time. The technical funding position moved to a surplus of £5m when rolled forward to 31 January 2017.
11. Franchise income is a combination of royalties or commission added to cost of goods sold to franchise partners.
18 n e x t p l c . c o . u k

slugline
Cost Inflation and Cost ControlIn the year to January 2017 we have offset cost increases of £41m with cost savings of £42m. The tables below outline the main contributors to cost increases and cost savings over the last year. Cost control remains at the heart of the business and we remain determined that cost savings must come through innovation and efficiency rather than any compromise to our product quality or services.
Costs and savings in the year ending January 2017Cost increases £mCost of living awards and other wage costs 22 Additional systems spending on development and software 5 Inflation in rent and rates (of which rates were £3.5m) 5 Directory marketing and other Directory overheads 5Net margin on product 4 Total cost increases 41
Cost savings and other income £mReduction in the cost of management and staff incentives 27Warehouse and distribution efficiencies 9Retail productivity and lower branch controllable costs 6Total cost savings 42Net interest income and bad debt 22 Total cost savings and interest income 64
Costs and savings in the year aheadIn the year ahead we expect cost increases of around £36m. The table below sets out our central forecast of cost increases next year.
Cost increase forecast for 2017/18 £m (e)National Living Wage 4General wage inflation 8Taxes (rates, Apprenticeship Levy, energy taxes) 9Investment in online systems 11Other increases 4Total cost increases 36
We have identified around £26m of cost savings which mitigate some of the cost increases detailed above. This includes a non-cash £10m saving in depreciation.
Strategic R
epo
rtG
overnance
Financial Statements
Sharehold
er Inform
ation
19n e x t p l c . c o . u k

slugline
Strategic Report
Cash Flow Cash generated in the year before interest, tax and depreciation was £946m. Cash flow after non-discretionary outflows of taxation, interest and working capital was £717m. After investing in capital expenditure and paying ordinary dividends the Company generated surplus cash of £330m. This was used to finance £65m of additional Directory debt and the balancing £276m was returned to shareholders through share buybacks and a special dividend.
The table below summarises our main cash flows in the year ending January 2017 and our forecast for the year ahead, based upon our central profit guidance. We expect the Company to continue to generate significantly more cash than is required to invest in capital expenditure and pay ordinary dividends. As we outlined in our January 2017 trading statement, we intend to return surplus cash to shareholders through four special dividends (see page 21).
£mJan
2017
Jan 2018 (e) Central
guidanceProfit before Interest, Tax, Depreciation and Amortisation (EBITDA) 946 885Interest (31) (36)Tax (151) (144)Working capital and other (47) (50)Discretionary cash flow 717 655Capital expenditure (161) (130)Ordinary dividends (226) (225)Surplus cash 330 300Financing additional Directory debt (65) –Special dividends (88) (255)Share buybacks (188) –Movement in net debt (11) 45
Interest and taxationThe interest paid in the year was £31m. However, as a result of timing differences, the interest charged in the year was £38m, £7m higher than in the prior year. Average net debt during the year was up c.£300m on the previous year. This additional debt funded the step change in Directory debtors following the lowering of minimum payments in February 2015. Average interest rates in the year were lower partly due to the bond we issued in May 2016. We are budgeting for the interest charge next year to reduce to £36m.
Our full year tax rate of 19.6% is broadly in line with the headline UK corporation tax rate of 20%. We expect our effective tax rate to be around 19% next year as the headline UK corporation tax rate reduces to 19%.
20 n e x t p l c . c o . u k

slugline
Capital expenditureThis year our capital expenditure was £161m, which was £10m ahead of last year. The increase on last year is as a result of further investment in profitable new space and warehousing, which has been partly offset by a reduction in Head Office and systems capital expenditure.
Our capital expenditure for the last two years is set out in the table below.
£mJan
2017Jan
2016Retail space expansion 108 86Retail cosmetic refits 11 15Total capex on stores 119 101Warehouse 28 22Head Office infrastructure 10 15Systems 4 13Total capital expenditure 161 151
New retail space remained our biggest investment at £108m in the year to January 2017. Warehouse capex was £28m, which included £15m of expenditure to complete our new automated furniture warehouse. The new warehouse cost £30m in total and will be operational from April 2017.
Systems capex of £4m was £9m lower than the prior year’s exceptionally high number, which was inflated by the purchase of hardware for a new till system. Expenditure on Head Office infrastructure reduced by £5m as we are near the end of upgrading our central facilities.
In the year ahead we expect capital expenditure to be around £130m, a reduction of £31m on the current year. This is driven by an anticipated decrease in spending on retail space (£102m versus £119m) and lower warehouse expenditure (£16m versus £28m).
Directory debtDirectory debt increased by £70m, £65m of which was due to the change in minimum payments. We believe this has now fully matured and we do not expect to see a further increase in the year ahead.
Ordinary dividendsThe Board has proposed a final ordinary dividend of 105p, to be paid on 1 August 2017 and taking the total ordinary dividends for the year to 158p, flat on last year. This is subject to approval by shareholders at the Annual General Meeting to be held 18 May 2017. Shares will trade ex-dividend from 6 July 2017 and the record date will be 7 July 2017.
Surplus Cash and Shareholder Distribution in the Year AheadAt the mid-point of our sales and profit guidance we expect to generate surplus cash of £300m after capital expenditure and paying ordinary dividends. In our January 2017 trading statement, we advised that we intended to distribute surplus cash to shareholders by way of four quarterly special dividends of 45p each. This broadly represents the cash we would generate at the lower end of our guidance.
The Board has decided to declare the first of these interim special dividends of 45p per share which will be paid on 2 May 2017. Shares will trade ex-dividend from 6 April 2017 and the record date will be 7 April 2017. Payment of the other three special dividends remain subject to our internal forecasts remaining in line with our guidance ranges and no significant changes in market conditions.
Strategic R
epo
rtG
overnance
Financial Statements
Sharehold
er Inform
ation
21n e x t p l c . c o . u k

slugline
Strategic Report
Why special dividends not buybacks?With the share price trading at a relatively low multiple of future earnings, some have reasonably questioned whether the Company would be better to use surplus cash to buy back shares.
The last time the Company was in a similar situation was in 2008. At that time we were suffering from a combination of tough economic conditions, weakening currency rates and some internal product range issues. Profits were forecast to decline in the year ahead and there was much uncertainty in the wider economy as the credit crunch took hold. We took the decision at that time to halt our buyback programme.
In hindsight, we were wrong to not buy back shares in 2008 and we hope that hindsight will prove us wrong, on this particular decision, once again! But at this time of significant uncertainty, we feel that the decision to buy back shares is best left to shareholders themselves. And of course, shareholders can always use their special dividends to buy shares for themselves. Perhaps we have been overly cautious but companies rarely fail for being prudent with their shareholders’ money and in uncertain times such prudence is all the more important.
In the long term share buybacks remain our preferred route for returning capital to shareholders and we intend to return to them when market and trading conditions make it appropriate.
Net Debt and FinancingOur year end net debt was £861m, which was £11m higher than last year. The entire value of the Company’s net debt is more than matched by the value of our Directory debtor book, a financial asset worth £1bn.
Net debt (which peaks at c.£1.0bn) is securely financed through a combination of bonds and committed bank facilities. In May 2016 we issued a new £300m 12-year bond in anticipation of redeeming our £213m bond in October 2016. At January 2017 our financing consists of £875m of bonds and £525m of committed bank facilities. In the year ahead, based on our central guidance, we are forecasting for our net debt to remain at £861m, as set out in the chart below.
Financing (£m)
Funding
£m
200
400
600
800
1,000
1,200
1,400
1,600
Net debt Directory debtors
2028
2026
Jan 2018(e)
8612021
2021
2020
1.4bn
Peak
1.0bnBank facility
525
Bonds
875
1bn
The Group maintains its objective of retaining investment grade status. At £861m, the Group’s net debt is comfortably within the limit of investment grade status which we estimate to be around £1.5bn.
22 n e x t p l c . c o . u k

slugline
Outlook for the Year Ahead2017 External headwindsWe remain extremely cautious about the outlook for the year ahead. The clothing sector faces three potential threats: a sectorial shift away from spending on clothing, price inflation as a result of Sterling’s devaluation and potentially weaker growth in real incomes in the wider economy.
These headwinds are likely to be felt most acutely in our Retail business, as sales continue to migrate away from the High Street to online shopping.
Sectorial shift The figures issued below by Barclaycard give an indication as to how spending preferences have changed. The chart below shows the growth in spending on pubs, restaurants and entertainment compared to High Street clothing in the fourth quarter of 2016. We believe that these numbers demonstrate the continuing trend towards spending on experiences away from ‘things’. Shifts in consumer spending patterns are not unusual and we expect that the trend will stabilise and reverse at some point, though it is impossible to say exactly when this will happen.
UK Consumer Trends
Entertainmentspend grew by
8%
Source: Barclaycard Consumer Spending Report Q4 2016
Pubspend grew by
10%
Restaurantspend grew by
11%
High Streetclothing
spend fell by
-0.3%
Strategic R
epo
rtG
overnance
Financial Statements
Sharehold
er Inform
ation
23n e x t p l c . c o . u k

slugline
Real wage growthAs can be seen from the graph below, inflation is slowly rising to the level of general wage growth and looks set to continue to do so for the remainder of the year. We therefore expect a continuing squeeze on real incomes in the year ahead.
CPI and Average Weekly Earnings
Jan 2015
Avg. Weekly Earnings
CPI
Mar
-1%
0%
1%
2%
3%
4%
May Jul Sep Nov Jan 2016
Mar May Jul Sep
2.3%(21 March 2017)
BoE, CPI forecast(2 February 2017)
Source: ONS, CPI (21 March 2017). Avg. Weekly Earnings (15 March 2017).
Nov Jan2017
Mar May Jul Sep Nov
PricesAs expected, prices on like-for-like product in the first half of the year are up less than five percent with average selling prices of sold garments up +4%.
The table below sets out our costing rates for the Dollar (which accounts for around 60% of our total buy) for the year to January 2017 compared to January 2018.
2016/17 2017/18
Costing rate
variance
Selling price
varianceSpring & Summer $1.54 $1.39 -10% 4%Autumn & Winter $1.47 $1.26 -14% Less than 5%
As can be seen from the table above, costing rates are more challenging in the second half. This is because some of our currency for the first half of 2017 had been hedged before the devaluation of Sterling in June 2016. Although costing rates are relatively lower in Autumn Winter, we do not expect price rises to be any worse in the second half and they may be a little better. A combination of alternative sources of supply, better negotiation and surplus capacity mean that we have been able to mitigate much of the weakness in Sterling.
Longer term outlook for pricing and inflationThe inflation in our cost prices and the wider economy looks like it has been driven mainly by the devaluation of the Pound. In the event that devaluation is a one off adjustment and Sterling does not devalue again in 2018, pricing pressure should ease as we go into the second half of 2018. By the same logic, the pressure on real wages from rising inflation may also work its way through the system by the middle of 2018.
2017 Internal factorsAs detailed in the Product section (see page 6) we have substantially improved the Company’s ability to respond to new trends. Where we have done so, we have been rewarded with good sales. However, in the process of making our ranges more responsive, we have omitted some best-selling, heartland product.
Strategic Report
24 n e x t p l c . c o . u k

slugline
Over the last three months we have taken corrective action in all the relevant areas. This work will begin to be reflected in our ranges as the Summer season progresses. However, our ranges will not be exactly where we want them to be until we get into the third quarter.
So we expect sales in the first quarter to be around the lower end of the 2017/18 guidance range we issued with our January 2017 trading statement. All other things being equal, we expect some improvement in the second quarter and a more marked improvement in the second half of the year. This, of course, is subject to there being no further deterioration in the external environment as the year progresses.
Outlook for Sales and ProfitWe are maintaining the guidance range we issued for the full year in our January trading statement. We expect total full price sales growth for 2017/18 to be between -3.5% and +2.5%, with Earnings Per Share growth of between -12.4% and +0.5%.
Guidance estimates Full year to January 2018
Lower end of guidance
Upper end of guidance
Total full price sales versus 2016/17 (at constant currency)Total full price sales versus 2016/17 (including currency gain)
-4.5%-3.5%
+1.5%+2.5%
Group profit before tax £680m £780mChange in profit before tax versus 2016/17 -13.9% -1.3%Earnings Per Share versus 2016/17 -12.4% +0.5%
First quarter trading updateOur next trading statement will cover the thirteen weeks to 29 April and is scheduled for Thursday 4 May 2017.
SummaryThe year ahead looks like it will be tough with a combination of economic, cyclical and internal factors working against us. Our reaction to these challenges will be, as it has been in the past, to acknowledge where we can improve and focus on our core business. We are very clear about our priorities for the year ahead and how we can continue to make NEXT a better business for our customers. Our objectives are as follows:
• Continue our efforts to improve our buying processes, pushing the boundaries of what we can achieve in terms of design and quality whilst maximising the potential of our best-selling, heartland products.
• Continue the process of modernising the UK Directory business: improving our systems capabilities, developing new ways of recruiting customers, stimulating sales from existing customers, improving the presentation of our website, personalising our product offer and developing our credit offer.
• Continue to grow LABEL and Next Directory overseas.
• Develop and profitably expand our UK retail store network.
• Control costs through innovation.
We are in a good position to deliver these objectives. NEXT is financially strong with high net margins, healthy cash generation, good cost control and a robust, well financed balance sheet. We have a highly profitable, well maintained and relatively flexible store portfolio and excellent home shopping operations in the UK and overseas. For NEXT these have proven to be the foundations of long term success. We aim to build on them in the year ahead.
Lord Wolfson of Aspley GuiseChief Executive 23 March 2017
Strategic R
epo
rtG
overnance
Financial Statements
Sharehold
er Inform
ation
25n e x t p l c . c o . u k

slugline
Strategic Report
Business ModelNEXT is a UK based retailer offering exciting, beautifully designed, excellent quality clothing, footwear, accessories and home products. NEXT is one of the largest clothing and home products retailers in the UK by sales, and a member of the FTSE 100 index.
In 1981, J Hepworth & Son, Gentleman’s Tailors, bought a chain of shops with the aim of developing a womenswear brand called NEXT. The first NEXT womenswear store opened in 1982 and over the following years menswear, home and childrenswear were added to the product ranges. In 1991 the move to larger stores commenced, bringing together all four product groups and ranges across both retail and home shopping formats. The NEXT Directory website was launched in 1999 to augment the traditional catalogue offer and has become a significant driver of the growth of the Group’s sales and profitability. The strategy of larger stores and multi-channel retailing has been continuously developed over the past two decades.
The Group is primarily comprised of:
• NEXT Retail, a chain of around 540 stores in the UK and Eire. The majority of our stores sell clothing, footwear, accessories and/or home products; and we now operate over 30 large combined fashion and home stores.
• NEXT Directory, an online and catalogue shopping business with over 4.5 million active customers and international websites serving approximately 70 countries. By embracing the internet, providing exceptional customer service and developing overseas opportunities, NEXT Directory’s sales have grown by more than 120% over the last ten years. The NEXT Directory business provides customers with the option of a credit facility for purchases called nextpay. Through LABEL, NEXT Directory offers premium non-competing brands to customers.
• NEXT International Retail, with around 200 mainly franchised stores across the world. NEXT’s franchise partners operate over 180 stores in 33 countries; there are also a small number of overseas stores which NEXT operates directly.
• Lipsy, which designs and sells Lipsy and other branded fashion products. Lipsy trades from 38 stores, online, and through wholesale and franchise channels.
• NEXT Sourcing, which designs and sources NEXT branded products. NEXT Sourcing (NS) is our Hong Kong based internal sourcing agent which competes for business against other suppliers to NEXT Retail and Directory.
2016/17 profit by segment
NEXT Retail 40%
NEXT Directory 52%
NEXT Sourcing 5%
NEXT International Retail 1%
Other 2%
1 Great productsNEXT products are developed by our in-house design team to offer great style, quality and value for money with a contemporary fashion edge.
2 Global sourcingOver 130 million products are sourced globally from around 40 countries.
During the year, NEXT Sourcing provided around 40% of the NEXT branded products from our global supplier base including 3 owned factories.
Over 100 brands are sold through LABEL online.
3 Efficient supply chainOur network of warehouses and international hubs delivers product cost-effectively and efficiently.
9 warehouses, 6 depots and 4 international hubs.
Next day delivery is standard for UK NEXT Directory orders placed before midnight.
4 Outstanding customer serviceProviding value for money and outstanding customer service is key to NEXT. We offer customers a credit facility for UK NEXT Directory purchases, called nextpay.
Our large number of stores, complemented by an integrated multi-channel offering, offers convenience to customers.
In store design and concession partners provide an exciting shopping environment.
5 Returning value to shareholdersWe are very cash generative, allowing us to invest in the business and return value to shareholders through dividends, share buybacks and earnings growth.
What we do
1Great products
Global sourcing
Efficient supply chain
Outstanding customer service
Returning value to
shareholders
2
3
4
5
26 n e x t p l c . c o . u k

slugline
Read about our objectives for the year ahead on page 25 Read about the outlook for sales and profit on page 25
Business Strategies and ObjectivesHow we create valueThe primary financial objective of the Group is to deliver long term, sustainable returns to shareholders through a combination of growth in Earnings Per Share (EPS) and payment of cash dividends. Over the last ten years, EPS and ordinary dividends per share have both increased by over 200% and the Company’s share price has increased by around 100%. This long term value has been created through the pursuit of the following strategies:
• Improving and developing our product ranges, success in which is measured by sales performance.
• Profitably increasing retail selling space. New store appraisals must meet demanding financial criteria before the investment is made, and success is measured by achieved profit contribution and return on capital against appraised targets.
• Increasing the number of profitable NEXT Directory cash and credit customers and their spend, both in the UK and internationally, complemented by our LABEL publication of branded products and the credit facility (nextpay) we offer to our UK NEXT Directory customers.
• Managing gross and net margins through efficient product sourcing, stock management and cost control.
• Focussing on customer service and satisfaction levels in both Retail stores and Directory.
• Maintaining the Group’s financial strength through an efficient balance sheet and secure financing structure.
• Generating and returning surplus cash to shareholders by way of share buybacks or special dividends.
Our key resources and relationships
PeopleThe employees of NEXT are key to achieving the objectives of the business.
Customers are at the heart of everything we do.
Knowledge and know-how35 years of retailing experience.
The NEXT brand offers uniquely designed and high quality products; forging long term relationships with customers and suppliers.
SuppliersSourcing globally to deliver quality and value under ethical trading principles.
Buildings and Infrastructure The predominantly leased store portfolio is actively managed, with opening and closure decisions based on store profitability and payback.
FinanceEffective management of financial resources including focus on cost management and maximising returns from space.
Further detail on the performance and development of the Group’s business can be found in the Chief Executive’s Review (pages 4 to 25), which forms part of this Strategic Report along with Key Performance Indicators (pages 28 to 29), Risks and Uncertainties (pages 30 to 34 ) and Environmental Matters (page 38).
For further details refer to page 36
For further details refer to page 37
For further details refer to page 8
Strategic R
epo
rtG
overnance
Financial Statements
Sharehold
er Inform
ation
27n e x t p l c . c o . u k

slugline
Strategic Report
Key Performance Indicators (KPIs)KPIs are designed to measure the development, performance and position of the business. In the current year, the KPIs of NEXT BRAND full price sales and total sales growth of NEXT products have been included, as the directors believe these are effective measures for assessing progress against objectives and strategy. Group cash flows and divisional results are detailed in the Chief Executive’s Review and elsewhere in this Annual Report. For comparability, all KPIs are shown on a 52 v 52 week basis. Refer to the Glossary on page 147 for further details.
Sales (%)
NEXT profitability NEXT Retail selling space
NEXT Retail sales performance
NEXT BRAND full price sales growth
NEXT Retail operating margin
Full price sales growth
NEXT Directory operating margin
Group profit before tax (£m)
Total sales growth
Underlying total like-for-like sales
Underlying full price like-for-like sales
NEXT BRAND total sales growth
2017
2017
-1.3% 0.0%
2016
+3.9%
2017
25.7%
2017
790.2
2016
24.4%
2016
821.3
2017
-4.6%
2017
-2.9%
2016
+2.2%
2016
+1.1%
2017
14.7%16.9%
2016
2017
-5.4%
2017
-6.9%
2016
-1.3%
2016
-0.5%
2016
+3.7%
Store numbers
2017
538
2016
540
Divisional operating margin is profit after deducting markdowns and all direct and indirect trading costs expressed as a percentage of achieved total sales (refer to Note 1 of the financial statements).
Total sales are VAT exclusive full price and markdown sales including the full value of commission based sales and interest income (as described in Note 1 of the financial statements).
Full price sales are VAT exclusive sales of stock items excluding items sold in our mid-season and end-of-season Sale events and our Clearance operations, and includes interest income on those sales.
2017
2016
Underlying like-for-like sales represents the growth in sales from stores which have been open for at least one full year, excluding stores impacted by new openings.
Square feet (000’s)
7,978
7,648
Selling space is defined as the trading floor area of a store which excludes stockroom and administration areas and is shown as at the financial year end.
28 n e x t p l c . c o . u k

slugline
Sales (%)
NEXT Directory Sales performance
20172016
Average active customers are defined as those who have placed a Directory order or received a standard account statement in the last 20 weeks. Prior year active customers have been reduced by 40k to exclude inactive accounts that were included in error last year.
Credit customers are those who order using a Directory credit account, whereas cash customers are those who pay when ordering.
Returns to shareholders (£m)
Earnings Per Share
Ordinary dividends
2017
225.8
2016
226.9
Special dividends
2017
88.3
2016
340.6
Share buybacks
2017
187.6
2016
150.7
Total
2017
501.7
2016
718.2
2016442.5p
2017441.3p
Refer to Note 8 of the financial statements.
3,613,121 shares were purchased in the financial year (2016: 2,203,873) at an average cost per share of £51.91 (2016: £68.39) including stamp duty and associated costs. The average price before costs was £51.59 (2016: £67.97). Buybacks represented 2.4% (2016: 1.4%) of opening share capital.
Based on dividends paid in the cash flow statement. Refer to Note 7 of the financial statements.
Full price sales growth
Total sales growth
Credit
Cash
Total
+3.6%
+6.5%
+4.2%
2,5732,496
1,9752,235
4,731
Average active customers (000’s)
+7.7%
4,548
Strategic R
epo
rtG
overnance
Financial Statements
Sharehold
er Inform
ation
29n e x t p l c . c o . u k

slugline
Strategic Report
Risks and UncertaintiesRisk management and internal control frameworkThe Board has a policy of continuous identification and review of principal business risks, and oversees risk management. This includes identifying key risks, determining control strategies and considering how those risks may affect the achievement of business objectives, taking into account risk appetite.
Executive directors and operational management are delegated the task of implementing processes to ensure that risks are managed appropriately. On a day-to-day basis, the risk management process is managed and co-ordinated by the corporate compliance team. Each business area is responsible for preparing and maintaining operational risk registers which involves identifying, evaluating, managing, measuring and monitoring the risks in their respective areas. Risk registers are prepared using consistent risk factors and incorporate business impact and likelihood ratings, both before and after the effect of any mitigating factors or controls. Progress and issues are reported to the corporate compliance team on a regular basis, and more formal annual reviews are also carried out to ensure robustness and consistency across the business. In addition, Internal Audit plans are agreed with the Audit Committee based on the risks and controls identified through this risk management process.
During the year the Board carried out a detailed evaluation of the effectiveness of the risk management and internal controls systems for all parts of the business, which covered all material controls including financial, operational and compliance controls, and it is satisfied that they are operating effectively for the financial year to January 2017 and up to and including the date of this report. This incorporated a review of reports, discussion, challenge and assessment of the principal business risks with relevant senior management. During the year, the directors received presentations from management on specific higher risk areas and agreed key action plans including further enhancement of mitigating controls.
The work and findings of the corporate compliance team are also reviewed, discussed and agreed by the Audit Committee on a regular basis; any significant matters are communicated to the Board. No significant failings of internal control were identified during these reviews. Operational risk registers detail limited, though not significant, control weaknesses and clear action plans are in place to address these.
During the year, an independent review was undertaken by Ernst and Young in relation to the assessment of NEXT’s cyber risk. Findings were discussed in detail with relevant senior management and presented to the Audit Committee and the Board. A prioritised action plan has been agreed and, in addition to significant resources which are already devoted to the development, maintenance and security of IT systems, further investment has been approved.
BrexitFollowing the outcome of the UK referendum to leave the EU, there are a number of uncertainties about how the exit will be engineered. Therefore, the extent to which our operations and financial performance are affected in the longer term will only become clear as details emerge. We have considered the possible consequences that Brexit could have upon our business and have concluded that it does not raise any new principal risks, however it does have the potential to impact a number of our existing risks at an individual risk level, e.g. exchange rates, changes in tariffs and duties, regulatory changes and economic uncertainty.
We will continue to monitor the risks and uncertainties arising from Brexit within the risk management and control process described above. This provides a more effective and operationally focused mitigation of these risks on an ongoing and timely basis.
Assessment of principal risks and uncertaintiesThe directors confirm that they have carried out a robust assessment of the principal risks and uncertainties facing the Group, including those that would threaten its business model, future performance, solvency or liquidity. Those principal risks are described below along with explanations of how they are managed or mitigated. The principal risks areas remain the same as reported last year. The Board remains committed to ensuring that the key risks are managed on an ongoing basis and operate within an acceptable level. Whilst these risks all have the potential to affect future performance, work is undertaken to mitigate and manage these risks such that they should not threaten the overall viability of the business over the three year assessment period (refer to the Viability Assessment on page 35).
30 n e x t p l c . c o . u k

slugline
Description of principal risk or uncertainty How the risk or uncertainty is managed or mitigated
Business strategy development and implementationIf the Board adopts the wrong business strategy or does not implement its strategies effectively, the business may suffer. The Board therefore needs to understand and properly manage strategic risk, taking into account specific retail sector risk, in order to deliver long term growth for the benefit of NEXT’s stakeholders.
The Board reviews business strategy on a regular basis to determine how sales and profit budgets can be achieved or bettered, and business operations made more efficient. Seasonal and annual budgets together with longer term financial objectives and cash flow forecasts are produced.
The Board and senior management consider strategic risk factors, wider economic and industry specific trends that affect the Group’s businesses, the competitive position of its product offer and the financial structure of the Group.
The Audit Committee monitors strategic and operational risk regularly and any significant matters are reported to the Board.
Management teamThe success of NEXT relies on the continued service of its senior management and technical personnel, and on its ability to continue to attract, motivate and retain highly qualified employees. The retail sector is very competitive and NEXT’s staff may be targeted by other companies.
The Remuneration and Nomination Committees identify senior personnel, review remuneration at least annually and formulate packages to retain and motivate these employees, including long term incentive schemes.
The Board considers the development of senior managers to ensure adequate career development opportunities for key personnel, with orderly succession and promotion to important management positions.
Product design and selectionNEXT’s success depends on designing and selecting products that customers want to buy, at appropriate price points and in the right quantities. In the short term, a failure to properly manage this area may mean that NEXT is faced with surplus stocks that cannot be sold at full price and may have to be disposed of at a loss. In the longer term, the reputation of the NEXT Brand may suffer. Product design and selection is therefore at the heart of the business.
Executive directors and senior management continually review the design, selection and performance of NEXT’s product ranges. To some extent, product risk is also mitigated by the diversity of NEXT’s ranges.
Strategic R
epo
rtG
overnance
Financial Statements
Sharehold
er Inform
ation
31n e x t p l c . c o . u k

slugline
Strategic Report
Description of principal risk or uncertainty How the risk or uncertainty is managed or mitigated
Key suppliers and supply chain managementNEXT relies on its supplier base to deliver products on time and to the quality standards it specifies. Failure to do so may result in an inability to service customer demand or adversely affect NEXT’s reputation.
NEXT continually seeks ways to develop its supplier base so as to reduce over-reliance on individual suppliers of products and services, and maintain the quality and competitiveness of its offer. The Group’s risk assessment procedures for key suppliers identify alternatives and develop contingency plans in the event of key supplier failure.
Changes in global manufacturing capacity and costs may impact on profit margins.
Existing and new sources of supply are developed in conjunction with NEXT Sourcing, external agents and/or direct suppliers.
Non-compliance by suppliers with the NEXT Code of Practice principles may increase reputational risk.
NEXT carries out regular inspections of its suppliers’ operations to ensure compliance with the standards set out in this Code; covering production methods, employee working conditions, quality control and inspection processes. Further details can be found on page 37.
NEXT monitors and reviews the financial, political and geographical aspects of its supplier base to identify any factors that may affect the continuity or quality of supply of its products.
NEXT also monitors and reviews stock availability on an ongoing basis to ensure that issues are identified and appropriate action is taken where any issues are impacting service delivery to customers.
Warehousing and distributionNEXT regularly reviews the warehousing and distribution operations that support the business. Risks include business interruption due to physical damage, access restrictions, breakdowns, capacity shortages, IT systems failure (see next page), inefficient processes and third-party failures.
Planning processes are in place to ensure there is sufficient warehouse handling capacity for expected future business volumes over the short and longer terms.
Service levels, warehouse handling, inbound logistics and delivery costs are monitored continuously to ensure goods are delivered to our warehouses, Retail stores and Directory customers in a timely and cost-efficient manner.
Business continuity plans and insurance are in place to mitigate the impact of business interruption.
32 n e x t p l c . c o . u k

slugline
Description of principal risk or uncertainty How the risk or uncertainty is managed or mitigated
Customer experienceNEXT’s performance depends on the recruitment and retention of customers, and on its ability to drive and service customer demand. This includes having an attractive, functional and reliable website and effective call centres, operating successful marketing strategies, and providing both Retail and Directory customers with service levels that meet or exceed their expectations.
Market research is used to assess customer opinions and satisfaction levels, and regular customer experience visits to our stores help to ensure that staff remain focussed on delivering excellent customer service.
The Group continuously monitors website and call centre operations that support the business to ensure that there is sufficient capacity to handle volumes.
Call centre employees receive comprehensive and relevant training on an ongoing basis, targeting our service to be at its highest possible levels.
Retail store networkNEXT Retail’s performance depends on profitably developing the trading space of the store network. The successful development of new stores depends on a number of factors including the identification of suitable properties, obtaining planning permissions and the negotiation of acceptable lease terms. Prime retail sites will generally remain in demand, and increased competition for these can result in higher future rents.
The predominantly leased store portfolio is actively managed by senior management, with openings, refits and closures based on store profitability and cash payback criteria.
Regular reviews of lease expiry and break clauses are undertaken to identify opportunities for exit or renegotiation of commitments. Profiling of the Group’s lease commitments is also regularly reviewed by the Board.
NEXT will continue to invest in new space where its financial criteria are met, and will renew and refurbish its existing portfolio when appropriate.
Information security, business continuity and cyber riskNEXT is dependent upon the continued availability and integrity of its IT systems, which must record and process substantial volumes of data and conduct inventory management accurately and quickly. The Group’s systems require continuous enhancement and investment to prevent obsolescence and maintain responsiveness. The threat of unauthorised or malicious attack is an ongoing risk, the nature of which is constantly evolving and becoming increasingly sophisticated.
Systems’ vulnerability and penetration testing are carried out regularly to ensure that data is protected from corruption or unauthorised access or use.
Critical systems are reviewed and tested periodically to ensure they have back up facilities and business continuity plans in place; these are updated on an ongoing basis to reflect business risk.
IT risks are also managed through the application of internal policies and change management procedures, contractual service level agreements with third-party suppliers, and IT capacity management.
The Audit Committee received updates and agreed appropriate actions relating to cyber risk and business continuity during the year (see page 56).
As the nature of cyber attack risk is constantly changing and becoming ever more sophisticated, NEXT continually works towards improving mitigating controls in this critical area (see page 56 regarding the independent cyber risk review undertaken during the year).
Strategic R
epo
rtG
overnance
Financial Statements
Sharehold
er Inform
ation
33n e x t p l c . c o . u k

slugline
Strategic Report
Description of principal risk or uncertainty How the risk or uncertainty is managed or mitigated
Financial, treasury, liquidity and credit risksThe main financial risks are the availability of funds to meet business needs, default by counterparties to financial transactions, the effect of fluctuations in foreign exchange rates and interest rates, and compliance with regulation.
NEXT operates a centralised treasury function which is responsible for managing its liquidity, interest and foreign currency risks. The Group’s treasury function operates under a Board approved policy. This includes approved counterparty and other limits which are designed to mitigate NEXT’s exposure to financial risk. Further details of the Group’s treasury operations are given in Note 24 of the financial statements.
Compliance teams are responsible for regulatory compliance in specific areas. NEXT continually strives to maintain and develop the systems and processes that underpin these areas (see page 30). The Audit Committee received regular briefings on regulatory compliance during the year, for example in relation to requirements for the Payment Card Industry Data Security Standards (PCI DSS), and the FCA regulated credit business.
NEXT has a longstanding policy of returning surplus cash to shareholders through share buybacks and special dividends, whilst maintaining an appropriate level of debt. Adequate financing facilities are therefore required to support the operational needs of the business.
NEXT has adequate medium and long term financing in place to support its business operations, and the Group’s cash position and forecasts are regularly monitored and reported to the Board.
NEXT is also exposed to credit risk, particularly in respect of its Directory customer receivables, which at £1bn represents the largest item on the Group balance sheet.
Rigorous procedures are in place with regard to the Group’s Directory account customers, including the use of external credit reference agencies and applying set risk criteria before acceptance. These procedures are regularly reviewed and updated.
The Audit Committee received a formal update regarding the customer credit business during the year.
34 n e x t p l c . c o . u k

slugline
Viability AssessmentThe directors have assessed the prospects of the Group by reference to its current financial position, its recent and historical financial performance and forecasts, and the principal risks and mitigating factors described above. In addition, the Board regularly reviews the financing position of the Group and its projected funding position and requirements. The Group is operationally and financially strong and has a track record of consistently generating profits and cash, which is expected to continue. The Group has grown strongly in recent years but maintaining such growth will continue to be challenging. The directors review cash flow projections on a regular basis. This included a recent review by the Audit Committee of three year cash projections which were stress tested to determine the extent to which trading cash flows would need to deteriorate before breaching the Group’s facilities, both before and after anticipated shareholder distributions. In addition, the likelihood and impact of severe but plausible scenarios in relation to the principal risks were assessed, as described on pages 30 to 34, both individually and collectively, taking into consideration mitigating actions that might be undertaken in particular situations.
Whilst the principal risks all have the potential to affect future performance, none of them are considered likely either individually or collectively to threaten the viability of the business over the three year assessment period.
The retail sector is inherently fast paced, competitive and dynamic, particularly in respect of the fashion product cycle. However, as illustrated in the diagram below, a wide variety of other time horizons are also relevant in the management of the business:
1 year 2 years 3 years 5 years 7 years 10 years+
40%
Detailedbudgets and
forecasts
Logistics capacity planning New leasecommitments
Retail space planning Pensions
Target paybackperiod fornew stores
Cash flowforecasts
Medium termfinancing
considerations
Weighted average
remaininglease life
Long terminvestment and
financing considerations
Share-based incentives
Fashion lifecycle
Currency hedging
Management succession planning
IT systems development
The directors have assessed the viability of the Group over a three year period, as they believe this strikes an appropriate balance between the different time horizons which are used in the business and is a reasonable period for a shareholder to expect a fashion retail business to be assessed upon. Based on this review, the directors confirm that they have a reasonable expectation that the Group will continue in operation and meet its liabilities as they fall due over this period.
Strategic R
epo
rtG
overnance
Financial Statements
Sharehold
er Inform
ation
35n e x t p l c . c o . u k

slugline
Strategic Report
EmployeesNEXT’s employees are integral to achieving its business objectives. NEXT strives to create an environment to help to attract and retain the right people to work at every level. NEXT has established policies for recruitment, training and development of personnel and is committed to achieving excellence in health, safety, welfare and the protection of employees and their working environment.
Equal opportunities and diversityNEXT is an equal opportunities employer and will continue to ensure that it offers career opportunities without discrimination. Full consideration is given to applications for employment from disabled persons, having regard to their particular aptitudes and abilities and in accordance with relevant legislation. The Group continues the employment wherever possible of any person who becomes disabled during their employment, providing assistance and modifications where possible. Opportunities for training, career development and promotion do not operate to the detriment of disabled employees.
The following table shows the gender mix of the Group’s employees at the end of the financial year:
Directors of Subsidiary directors NEXT plc and other senior managers
4
6
Male
2017
Female
Male
2016
Female
5
4
12
26
Male
2017
Female
Male
2016
Female
29
12
Total employees
31,037
14,860
Male
2017
Female
Male
2016
Female
34,347
16,378
Training and developmentNEXT aims to realise the potential of its employees by supporting their career progression and promotion wherever possible. It makes significant investment in the training and development of staff and in training and education programmes which contribute to the promotion prospects of employees.
Employee communicationNEXT has a policy of providing employees with financial and other information about the business and ensures that the suggestions and views of employees are taken into account. NEXT has an employee forum made up of elected representatives from throughout the business who attend meetings at least twice a year with directors and senior managers. This forum enables and encourages open discussion on key business issues, policies and the working environment.
Employee share ownershipApproximately 11,900 employees held options or awards in respect of 5.6m shares in NEXT at January 2017, being 3.8% of the total shares in issue. Its employee share ownership trust (ESOT) purchases shares for issue to employees when their options are exercised. At the year end the ESOT held 4.4m shares; the Trustee generally does not vote on this holding on any resolution at General Meetings.
Pension provisionNEXT provides pension benefits to participating employees, details of which are set out in the Remuneration Report and in Note 18 of the financial statements. At January 2017, there were 943 (2016: 1,021) active members in the Defined Benefit Section of the NEXT Group Pension Plan and 2,949 (2016: 2,888) UK active members of the Defined Contribution Section. In addition, 15,033 employees (2016: 14,583) participate in the Group’s Auto Enrolment defined contribution scheme.
Social, Community and Human RightsNEXT is committed to the principles of responsible business by addressing key business related social, ethical and environmental matters. Senior directors and managers representing key areas of the business take responsibility for corporate responsibility and sustainability. NEXT strives to continually make improvements by:
• acting in an ethical manner;• developing positive relationships with suppliers and
business partners;• recruiting and retaining responsible employees;• taking responsibility for our impact on the environment;
and• delivering support through charitable donations to
charities and community organisations.
36 n e x t p l c . c o . u k

slugline
A third-party provides independent assurance on the Group’s Corporate Responsibility Report which is published on the Company’s website (www.nextplc.co.uk). NEXT is also a member of the FTSE4Good Index Series.
Find out more on our website by visiting www.nextplc.co.uk/corporate-responsibility
Human rights NEXT recognises its responsibility to respect human rights throughout its operations. We are committed to ensuring that people are treated with dignity and respect by upholding internationally recognised human rights principles encompassed in the Universal Declaration of Human Rights and the International Labour Organisation’s Declaration on Fundamental Principles and Rights at Work.
Our approach is to implement the United Nations Guiding Principles on Business and Human Rights (UN Guiding Principles). As a business we shall seek to avoid infringing the human rights of others and work to address any adverse human rights impacts we identify.
NEXT takes seriously any allegation of human rights abuse in all its forms and will not tolerate human rights abuse throughout its operations. We have developed training for our employees, suppliers, business partners and service providers which is being implemented in 2017.
For further information, refer to the NEXT Human Rights and Modern Slavery Policy and the latest Corporate Responsibility Report at www.nextplc.co.uk. In line with the requirements of the Modern Slavery Act 2015, our first annual modern slavery statement will be published on the Company website during 2017.
Suppliers NEXT continues to focus on its supply chain as it recognises that there is potential for human rights issues to arise in this area. In common with other retailers, NEXT’s product supply chain is both diverse and dynamic. During the year, NEXT used around 570 third-party suppliers providing NEXT products, with products manufactured in around 40 countries. The challenge of trading ethically and acting responsibly towards the workers in our own and our suppliers’ factories is a key priority which is managed by the NEXT Code of Practice (COP) Team, made up of 47 employees based in key sourcing locations.
NEXT’s COP programme is based on the Ethical Trading Initiative base code and international labour conventions and has nine key principles that stipulate the minimum standards with which suppliers are required to comply. The COP team continue to deliver training to our product teams, other relevant employees and to third parties providing NEXT product, ensuring they understand the vital role they play in our ethical trading programme.
The COP team carried out over 2,000 factory audits in 2016/17 and work directly with these suppliers to identify and address
causes of non-compliance. NEXT also recognises the importance of partnership and collaboration, both with our suppliers and with other brands and organisations to work to resolve some of the complex problems we are unable to solve alone.
CustomersNEXT is committed to offering stylish, quality products to its customers which are well made, functional, safe and are sourced in a responsible manner. NEXT technologists work closely with buyers, designers and suppliers to ensure its products comply with all relevant legislation and its own internal standards where these are higher. The expertise of independent safety specialists for clothing, footwear, accessories, beauty and home products is used where required.
NEXT endeavours to provide a high quality service to its customers, whether they are shopping through its stores, brochures or website. NEXT Customer Services interacts with Retail and Directory customers to resolve enquiries and issues. Findings are recorded and the information is used by other areas of the business to review how a product or service can be improved.
Health and safetyNEXT recognises the importance of health and safety and its management is designed to contribute to business performance. The Group’s objective is to manage all aspects of its business in a safe manner and take practical measures to ensure that its activities and products do not harm the public, customers, employees or contractors. Policies and procedures are reviewed and audited regularly to make safety management more robust and current.
Supporting charity and community NEXT supports a wide range of charities and organisations, and provided the following financial support during the year:
2017£000
2016£000
Registered charities 1,020 1,012Individual requests, local and national groups and organisations 46 63Commercial support 103 80
This support was supplemented by the following additional activities:
2017£000
2016£000
NEXT charity events 53 64Gifts in kind–product donations 1,730 3,426Charity linked sales 441 403Employee fundraising 55 43
Strategic R
epo
rtG
overnance
Financial Statements
Sharehold
er Inform
ation
37n e x t p l c . c o . u k

slugline
Strategic Report
Political donations No donations were made for political purposes (2016: £nil).
Environmental MattersNEXT recognises that it has a responsibility to manage the impact of its business on the environment both now and in the future. For several years we have measured and reported against environmental targets for NEXT in the UK and Eire. During the year, we set the following new five year targets which will be measured in relation to the financial years 2016/17 through to 2020/21 inclusive:
Focus Five year target: 2016/17 to 2020/21 Year one progress: 2016/17Energy use and emissions from stores, warehouses, distribution centres and offices.
Electricity consumption: -10% reduction in kg CO2e/m2 over the five year period.
-12%* reduction in kg CO2e/m2.
Waste created in stores, warehouses, distribution centres and offices.
To divert more than 95% of operational waste from landfill.
81% of operational waste diverted from landfill.
* 10% of this reduction is attributable to the improvement in the emission factor provided by DEFRA.
Further information will be published in our Corporate Responsibility Report issued later in 2017.
Greenhouse gas emissionsIn accordance with the disclosure requirements for listed companies under the Companies Act 2006, the table below shows the Group’s greenhouse gas emissions during the financial year:
2017 2016Tonnes of CO2
equivalent
Tonnes of CO2
equivalentCombustion of fuel & operation of facilities (Scope 1) 52,901 52,021Electricity, heat, steam and cooling purchased for own use (Scope 2) 109,584 121,056Total Scope 1 and Scope 2 emissions 162,485 173,077Intensity metric: tonnes of CO2e per £m of sales 39.28 41.71
MethodologyThe methodology used to calculate our emissions are based on operational control in accordance with 2016 DECC/DEFRA using Guidelines WRI/WBCSD GHG Reporting Protocols (Revised edition) and 2016 Scope 2 Guidelines.
NEXT remains committed to reducing its carbon footprint by reducing energy consumption throughout its operations, minimising and recycling waste and cutting transport emissions. Further detailed information on NEXT’s global emissions footprint can be found in our Corporate Responsibility Report on the Company website www.nextplc.co.uk.
On behalf of the Board
Amanda James Group Finance Director 23 March 2017
Find out more on our website by visiting www.nextplc.co.uk/corporate-responsibility
38 n e x t p l c . c o . u k

slugline
GOVERNANCE
40 Directors’ Report including Annual General Meeting & Other Matters
47 Directors’ Responsibilities Statement48 Corporate Governance
53 Nomination Committee Report
54 Audit Committee Report
58 Remuneration Report
86 Independent Auditor’s Report
Financial Statements
Sharehold
er Inform
ation
Strategic R
epo
rtG
overnance

slugline
Directors’ Report
Directors and OfficersJohn Barton CHAIRMAN
APPOINTED TO THE BOARD February 2002
COMMITTEE MEMBERSHIP Remuneration and Nomination (Chairman)
Michael Law GROUP OPERATIONS DIRECTOR
EXECUTIVE DIRECTOR
Amanda James GROUP FINANCE DIRECTOR
EXECUTIVE DIRECTOR
Michael joined the Group in 1995 as Call Centre Manager for the NEXT Directory. Michael was appointed Call Centre Director in 2003 and in 2006 became responsible for Group IT. In 2010 he was appointed Group Operations Director, adding Warehousing and Logistics to his portfolio. Michael is now responsible for all Systems, Warehousing, Logistics and Call Centres within the Group.
Amanda joined the Group in 1995 and has led the management accounting and commercial finance teams since 2005. In 2009 Amanda was appointed Commercial Finance Director and was promoted to NEXT Brand Finance Director in 2012. Amanda has comprehensive knowledge of NEXT’s operations and has played a central role in the financial management of the business.
APPOINTED TO THE BOARD July 2013
APPOINTED TO THE BOARD April 2015
Michael Roney DEPUTY CHAIRMAN AND CHAIRMAN
DESIGNATE (from 14 February 2017)
APPOINTED TO THE BOARD February 2017
COMMITTEE MEMBERSHIP Remuneration and Nomination
Jane Shields GROUP SALES AND MARKETING DIRECTOR
EXECUTIVE DIRECTOR
Jane joined NEXT Retail in 1985 as a Sales Assistant in one of our London stores. Jane worked her way through store management to be appointed Sales Director in 2000, responsible for all store operations and training. In 2006 Jane was given additional responsibility for Retail Marketing and in 2010 was appointed Group Sales and Marketing Director, adding Directory and online marketing to her portfolio.
APPOINTED TO THE BOARD July 2013
Lord Wolfson of Aspley Guise CHIEF EXECUTIVE
EXECUTIVE DIRECTOR
APPOINTED TO THE BOARD February 1997
John was appointed Deputy Chairman in 2004 and Chairman in 2006. He is also Chairman of easyJet plc and a non-executive director of SSP Group plc and Luceco plc. John previously served as Chief Executive of JIB Group plc, was Chairman of Cable and Wireless Worldwide plc, Catlin Group Limited, Jardine Lloyd Thompson Group plc, Wellington Underwriting plc and Brit Insurance Holdings plc and a non-executive director of WH Smith plc and Hammerson plc.
John will retire as non-executive Chairman and step down from the Board of NEXT on 1 August 2017.
Michael is also Chairman of Grafton Group plc and a non-executive director of US firm Brown-Forman Corporation and of Azelis SA, a privately owned company. Michael brings a wealth of business experience to the Board having previously been the Chief Executive of Bunzl plc, Chief Executive of Goodyear Dunlop Tires Europe and non-executive director of Johnson Matthey plc.
Michael will succeed John Barton as non-executive Chairman on 1 August 2017.
Simon joined the Group in 1991 and was appointed Retail Sales Director in 1993. He became responsible for NEXT Directory in 1995 and was appointed to the Board in 1997 with additional responsibilities for Systems. Simon was appointed Managing Director of the NEXT Brand in 1999 and Chief Executive in 2001.
40 n e x t p l c . c o . u k
slugline
Francis Salway SENIOR INDEPENDENT NON-EXECUTIVE DIRECTOR
APPOINTED TO THE BOARD June 2010
COMMITTEE MEMBERSHIP Audit, Remuneration and Nomination
Dame Dianne Thompson INDEPENDENT NON-EXECUTIVE DIRECTOR
Dianne has significant senior management experience including fourteen years as Chief Executive Officer of Camelot Group. During her 42 year career, she has worked in marketing for several retail companies. More recently she was Chairman of RadioCentre and a non-executive director of the Home Office. She is currently President of the Market Research Society.
APPOINTED TO THE BOARD January 2015
COMMITTEE MEMBERSHIP Audit, Remuneration and Nomination
Steve Barber INDEPENDENT NON-EXECUTIVE DIRECTOR
Jonathan Bewes INDEPENDENT NON-EXECUTIVE DIRECTOR (from 3 October 2016)
APPOINTED TO THE BOARD June 2007
COMMITTEE MEMBERSHIP Audit (Chairman), Remuneration and Nomination
APPOINTED TO THE BOARD October 2016
COMMITTEE MEMBERSHIP Audit, Remuneration and Nomination
Caroline Goodall INDEPENDENT NON-EXECUTIVE DIRECTOR
APPOINTED TO THE BOARD January 2013
COMMITTEE MEMBERSHIP Audit, Remuneration (Chairman) and Nomination
Francis is also Chairman of Town & Country Housing Group, Chairman of the Property Advisory Group for Transport for London, a non-executive director of Cadogan Group Limited and a Visiting Professor in Practice at the London School of Economics. Formerly Chief Executive of Land Securities Group plc and past president of the British Property Federation.
Steve is also a non-executive director of Domino’s Pizza Group plc and Fenwick Limited. Steve’s previous experience includes almost thirty years in the accountancy profession, principally with Price Waterhouse where he was a senior partner. Steve was formerly Finance Director of Mirror Group and Chief Operating Officer of Whitehead Mann. Founder of The Objectivity Partnership, a member of the steering group of the Audit Quality Forum and Chairman of Design Objectives Worldwide.
Steve will step down from the Board of NEXT on 18 May, immediately after the 2017 AGM.
Since qualifying as a Chartered Accountant with KPMG, Jonathan has spent 25 years in investment banking, with Robert Fleming, UBS and Bank of America Merrill Lynch. As a senior banker, he has provided advice to the Boards of many UK and overseas companies on a wide range of financial and strategic issues, including financing, M&A and general corporate matters. Jonathan is a Fellow of the Institute of Chartered Accountants of England and Wales.
Caroline is also an independent non-executive on the Partnership Board of the accountancy firm Grant Thornton UK LLP and a Trustee of the National Trust. She was a non-executive director of SVG Capital plc, a FTSE 250 listed private equity investor, from 2010 to October 2014. Prior to that, Caroline had over thirty years’ experience in corporate finance and was a corporate finance partner at the international law firm Herbert Smith including five years as Head of the Global Corporate Division.
Board committeesAudit CommitteeSteve Barber (Chairman)Jonathan Bewes Caroline GoodallFrancis SalwayDame Dianne Thompson
Nomination Committee John Barton (Chairman)Steve Barber Jonathan BewesCaroline Goodall Michael RoneyFrancis SalwayDame Dianne Thompson
Remuneration CommitteeCaroline Goodall (Chairman)John Barton Steve Barber Jonathan Bewes Michael RoneyFrancis SalwayDame Dianne Thompson
Seonna Anderson
Company Secretary
Financial Statements
Sharehold
er Inform
ation
41n e x t p l c . c o . u k
Strategic R
epo
rtG
overnance

slugline
Directors’ Report
Disclosures required under the 2013 amendment to the Large and Medium-sized Companies and Groups (Accounts and Reports) Regulations 2008 in respect of employee matters (including the employment, training and advancement of disabled persons), future developments, political donations and greenhouse gas emissions are given in the Strategic Report. Information on financial instruments and the use of derivatives is given in Notes 24 to 27 of the financial statements.
Annual General Meeting & Other MattersNotice of the Annual General Meeting (AGM) is on pages 149 to 156 and includes the following business:
DividendsThe directors recommend that a final dividend of 105p per share be paid on 1 August 2017 to shareholders on the register of members at close of business on 7 July 2017. This resolution relates only to the final dividend. The directors may decide to pay special dividends in line with the Company’s policy of returning surplus cash generated from operations to shareholders, via special dividends or share buybacks. Any such special dividends will be declared by the directors as interim dividends. The announcement of any dividend will clearly indicate whether it is a special dividend or not.
The Trustee of the NEXT Employee Share Ownership Trust (ESOT) has waived dividends paid in the year on the shares held by it, refer to Note 23 of the financial statements.
DirectorsDirectors’ biographies are set out on pages 40 to 41.
The UK Corporate Governance Code (the “Code”) recommends that all directors of FTSE companies stand for election every year and all members of the Board will do so at this year’s AGM, other than Steve Barber who is stepping down immediately after the 2017 AGM, which is the ninth anniversary of his first election to the Board. Each of the directors standing for re-election has undergone performance evaluation and has demonstrated that they remain committed to their role (including making sufficient time available for Board and committee meetings and other duties as required) and continue to be an effective and valuable member of the Board. The Board is satisfied that each non-executive director offering themselves for re-election is independent in both character and judgement, and their knowledge and other business interests enable them to contribute significantly to the work and balance of the Board.
Jonathan Bewes was appointed as a non-executive director on 3 October 2016 and will be subject to election by shareholders at the 2017 AGM. Jonathan is a qualified accountant and also has significant skills and experience in
investment banking which enable him to make a valuable contribution to the Company. When Steve Barber steps down from the Board, Jonathan Bewes will succeed him as Chairman of the Audit Committee.
Michael Roney was appointed as a non-executive director, Deputy Chairman and Chairman Designate on 14 February 2017 and will be subject to election by shareholders at the 2017 AGM. Michael has extensive business experience. He was Chief Executive of Bunzl plc, a FTSE 100 listed distribution and outsourcing business from 2005 until his retirement in April 2016. Michael will succeed John Barton as non-executive Chairman on 1 August 2017.
Further details about the appointments of Jonathan Bewes and Michael Roney are provided in the Nomination Committee Report on page 53.
The interests of the directors who held office at 28 January 2017 and their connected persons are shown in the Remuneration Report on page 77.
AuditorThe Company is required to appoint auditors at each general meeting at which its report and accounts are presented to shareholders. Following a tender process during 2016 (see page 57 for further details) ordinary resolution 15 proposes the appointment of PricewaterhouseCoopers LLP as auditor. Ernst & Young LLP has confirmed that it will resign as auditor with effect from the conclusion of the 2017 AGM and has provided the Company with a Statement of Circumstances (see page 154). This resolution also proposes that the auditor’s remuneration be determined by the directors. In practice, the Audit Committee will consider and approve the audit fees on behalf of the Board in accordance with the Competition and Markets Authority Audit Order.
Disclosure of information to the auditorIn accordance with the provisions of Section 418 of the Companies Act 2006 (the “2006 Act”), each of the persons who is a director at the date of approval of this report confirms that:
• so far as the director is aware, there is no relevant audit information of which the Company’s auditor is unaware; and
• each director has taken all the steps that they ought to have taken as a director to make themselves aware of any relevant audit information and to establish that the Company’s auditor is aware of that information.
42 n e x t p l c . c o . u k

slugline
The NEXT Long Term Incentive Plan (LTIP)Ordinary resolution 16 is seeking authority from shareholders to amend the NEXT LTIP to permit new awards under this plan to receive the benefit of dividends paid in the period between the grant date of these awards and the date when these awards vest (which is normally the third anniversary of the date of grant).
This is a standard provision for share plans like the LTIP and its effect is to align further the position of LTIP award-holders with that of shareholders. Any benefit from this provision will normally be delivered in the form of additional NEXT shares when an LTIP award vests, with such shares representing the cumulative value of dividends which would have been paid on the number of vesting shares since the grant date, and assuming re-investment in NEXT shares on each ex-dividend date. No benefits will be delivered in respect of dividends which relate to award shares which lapse due to non-fulfilment of applicable performance vesting conditions.
This change to the LTIP is being introduced as part of the revised Directors’ Remuneration Policy which is proposed for approval at the 2017 AGM. However, as the change involves an alteration to the rules of the LTIP itself which is to the potential advantage of LTIP participants in respect of future awards, this alteration to the LTIP requires specific approval by NEXT’s shareholders in a general meeting.
Authority to allot sharesUnder the 2006 Act, the directors may only allot shares or grant rights to subscribe for, or convert any security into, shares if authorised to do so by shareholders in general meeting. The authority conferred on the directors at last year’s AGM under section 551 of the 2006 Act expires on the date of the forthcoming AGM and ordinary resolution 17 seeks a new authority to allow the directors to allot ordinary shares up to a maximum nominal amount of £4,900,000, representing approximately one third of the Company’s existing issued share capital as at 22 March 2017. In accordance with institutional guidelines, resolution 17 will also allow directors to allot further ordinary shares, in connection with a pre-emptive offer by way of a rights issue, up to a total maximum nominal amount of £9,800,000, representing approximately two thirds of the Company’s existing issued share capital as at that date. As at 22 March 2017 (being the latest practicable date prior to publication of this document) the Company’s issued share capital amounted to £14,705,656 comprising 147,056,562 ordinary shares of 10 pence each, none of which are held in treasury. The directors have no present intention of exercising this authority which will expire at the conclusion of the AGM in 2018 or, if earlier, 18 August 2018.
Authority to disapply pre-emption rights Special resolution 18 will, if passed, renew the directors’ authority pursuant to sections 570 to 573 of the 2006 Act to allot equity securities for cash without first offering them to existing shareholders in proportion to their holdings. This resolution limits the aggregate nominal value of ordinary shares which may be issued by the directors on a non pre-emptive basis to £735,000, representing 5% of the issued ordinary share capital of the Company as at 22 March 2017 (excluding treasury shares). This authority also allows the directors, within the same aggregate limit, to sell for cash, shares that may be held by the Company in treasury.
In March 2015, the Pre-Emption Group issued a revised Statement of Principles stating that an allotment of up to an additional 5% of the issued ordinary share capital of the Company may be made on a non pre-emptive basis if that allotment is in connection with an acquisition or specified capital investment (within the meaning given in the Pre-Emption Group’s Statement of Principles) which is announced at the same time as the allotment, or which has taken place in the six-month period before and is disclosed in the announcement of the allotment. Special resolution 19 seeks this separate and additional authority.
In accordance with the Pre-Emption Group’s Statement of Principles, the directors do not intend to issue more than 7.5% of the share capital of the Company for cash (excluding treasury shares) under this or previous authorities in any rolling three year period without prior consultation with shareholders, except in connection with an acquisition or specified capital investment.
The directors do not have any present intention of exercising this authority which will expire at the AGM in 2018 or, if earlier, 18 August 2018.
On-market purchase of own sharesNEXT has been returning capital to its shareholders through share repurchases as well as special and ordinary dividends since March 2000 as part of its strategy for delivering sustainable long term returns to shareholders. Over this period, and up to 22 March 2017, NEXT has returned over £3.6bn to shareholders by way of share buybacks and over £2.8bn in dividends, of which £652m comprised special dividends. This buyback activity has enhanced Earnings Per Share, given shareholders the opportunity for capital returns (as well as dividends) and has been transparent to the financial markets. Share buybacks have not been made at the expense of investment in the business. Over the last five years, NEXT has invested over £609m in capital expenditure to support and grow the business.
Financial Statements
Sharehold
er Inform
ation
43n e x t p l c . c o . u k
Strategic R
epo
rtG
overnance

slugline
Directors’ Report
Special resolution 20 will renew the authority for the Company to make market purchases (as defined in Section 693 of the 2006 Act) of its ordinary shares of 10p each provided that:
a. the aggregate number of ordinary shares authorised to be purchased shall be the lesser of 22,043,000 ordinary shares of 10p each (being less than 15% of the issued share capital at 22 March 2017) and no more than 14.99% of the issued ordinary share capital outstanding at the date of the AGM, such limits to be reduced by the number of any shares to be purchased pursuant to special resolution 21: Off-market purchases of own shares, see below;
b. the payment per ordinary share is not less than 10p and is an amount not more than the higher of: (i) 105% of the average of the middle market price of the ordinary shares of the Company according to the Daily Official List of the London Stock Exchange for the five business days immediately preceding the date of purchase and (ii) an amount equal to the higher of the price of the last independent trade of an ordinary share of the Company and the highest current independent bid for an ordinary share of the Company as derived from the London Stock Exchange Trading System; and
c. the renewed authority will expire at the AGM in 2018 or, if earlier, 18 August 2018.
The directors intend that this authority to purchase the Company’s shares will only be exercised if doing so will result in an increase in Earnings Per Share and, being in the interests of shareholders generally, it is considered to promote the success of the Company. The directors will also give careful consideration to financial gearing levels of the Company and its general financial position. The purchase price would be paid out of distributable profits. It is the directors’ present intention to cancel any shares purchased under this authority.
The repurchase of ordinary shares would give rise to a stamp duty liability of the Company at the rate currently of 0.5% of the consideration paid.
The total number of employee share awards and share options to subscribe for shares outstanding at 22 March 2017 was 5,370,981. This represents 3.7% of the issued share capital at that date. If the Company were to buyback the maximum number of shares permitted pursuant to both the existing authority granted at the 2016 AGM (which will expire at the 2017 AGM) and the authority sought by this resolution, then the total number of options to subscribe for shares outstanding at 22 March 2017 would represent 5.1% of the reduced issued share capital.
Off-market purchases of own shares The directors consider that share buybacks are an important means of returning value to shareholders and maximising sustainable long term growth in EPS. Contingent contracts for off-market share purchases are an integral part of the Company’s buyback strategy and offer a number of additional benefits compared to on-market share purchases:
• Contingent contracts allow the Company to purchase shares at a discount to the market price prevailing at the date each contract is entered into. No shares have been bought back under contingent purchase contracts pursuant to the authority granted at the 2016 AGM up to 22 March 2017.
• Low share liquidity can often prevent the Company from purchasing sufficient numbers of shares on a single day without risk of affecting the prevailing market price. Contingent contracts enable the Company to purchase shares over time without risk of distorting the prevailing share price, and also spread the cash outflow.
• Contingent contracts entered into prior to any closed period allow the Company to take delivery of shares during these periods.
• Competitive tendering involving up to five banks is used which minimises the risk of hidden purchase costs. The pricing mechanism ensures the Company retains the benefit of declared and forecast dividends.
• The Company would also have the option to set a suspension price in individual contracts whereby they would automatically terminate if the Company’s share price was to fall.
As with any share buyback decision, the directors would use this authority only after careful consideration, taking into account market conditions prevailing at the time, other investment opportunities and the overall financial position of the Company. The directors will only purchase shares using such contracts if, based on the contract discounted price (rather than any future price), it is earnings enhancing and promotes the success of the Company for the benefit of its shareholders generally. It is the directors’ present intention to cancel any shares purchased under this authority.
Special resolution 21 will give the Company authority to enter into contingent purchase contracts with any of Goldman Sachs International, UBS AG, Deutsche Bank AG, HSBC Bank plc and Barclays Bank plc under which shares may be purchased off-market at a discount to the market price prevailing at the date each contract is entered into. The maximum which the Company would be permitted to purchase pursuant to this authority would be the lower of 3,000,000 shares or a total cost of £200 million.
The principal features of the contracts are set out in Appendix 1 to the Notice of the AGM. Copies of the agreements the Company proposes to enter into with any of the banks (the Programme Agreements) will be available for inspection at the registered office of the Company, and at the offices of Slaughter and May, One Bunhill Row, EC1Y 8YY during normal working hours from the date of the Notice of the AGM up to the date of the AGM and at the Meeting itself.
Increasing the Company’s borrowing powersSpecial resolution 22 proposes an increase in the Company’s maximum borrowing powers limit in its Articles, as set out in Article
44 n e x t p l c . c o . u k

slugline
67, by increasing the directors’ powers to incur borrowings from the higher of £1.5bn or an amount equal to two times adjusted total equity (as defined in the Articles) in the Company to the higher of £2bn, or an amount equal to two times adjusted total equity (as defined in the Articles) of the Company. For these purposes borrowings do not include operational leases.
The current fixed limit was last changed in 2006. The Company has grown significantly over the last decade in market capitalisation, revenue and profits. The Board considers that it is prudent to refresh the borrowing limit to create additional headroom and flexibility for the Company to respond to future development of the business. The Company’s external borrowing is also limited by the financial ratios required to maintain its credit rating and the financial covenants in the Group’s committed borrowing facilities. There are no current plans to materially increase the level of debt, however the Board believes it to be in the best interests of the Group to give the Company sufficient headroom over the long term to develop its business.
A copy of the proposed amended Articles of Association that reflect the above change will be available at the AGM on 18 May 2017. A copy will also be available for inspection at the Company’s registered office at Desford Road, Enderby, Leicester, LE19 4AT and at the offices of Slaughter and May at One Bunhill Row, London, EC1Y 8YY during usual business hours until the date of the AGM.
Notice of general meetingsThe notice period required by the 2006 Act for general meetings of the Company is 21 days unless shareholders approve a shorter notice period, which cannot be less than 14 clear days. However, the Company’s AGM must always be held on at least 21 clear days’ notice. At the AGM of the Company held in 2016, shareholders authorised the calling of general meetings other than an AGM on not less than 14 clear days’ notice and it is proposed that this authority be renewed. The authority granted by special resolution 23, if passed, will be effective until the Company’s AGM in 2018. In order to be able to call a general meeting on less than 21 clear days’ notice, the Company will make electronic voting available to all shareholders for that meeting. The flexibility offered by this resolution will not be used as a matter of routine for such meetings, but only where the directors consider it appropriate, taking account of the business to be conducted at the meeting and the interests of the Company and its shareholders as a whole.
RecommendationThe Board are of the opinion that all resolutions which are to be proposed at the 2017 AGM will promote the success of the Company and are in the best interests of its shareholders as a whole and, accordingly, unanimously recommend that they vote in favour of the resolutions.
Share capital and major shareholdersDetails of the Company’s share capital are shown in Note 20 of the financial statements.
The Company was authorised by its shareholders at the 2016 AGM to purchase its own shares. During the year the Company purchased and cancelled 3,613,121 ordinary shares with a nominal value of 10p (none of which were purchased off-market), at a cost of £187.6m and representing 2.4% of its issued share capital at the start of the year.
At the financial year end 28 January 2017, the Company had 147,056,562 shares in issue, which remained the same as at 22 March 2017.
As at 28 January 2017, the Company had been notified under the Disclosure and Transparency Rules (DTR 5) of the following notifiable interests in the Company’s issued share capital. The information provided below was correct at the date of notification. These holdings are likely to have changed since the Company was notified, however, notification of any change is not required until the next notifiable threshold is crossed:
Notifications received as at 28 January 2017
No. of voting rights at date of
notification% of voting
rights*Nature of
holdingDate of
notificationBlackRock, Inc. 15,449,823 10.51 Indirect interest 8 January 2014FMR LLC (Fidelity) 19,486,285 13.25 Indirect interest 8 April 2016Invesco Limited 7,522,064 5.12 Indirect interest 3 June 2016NEXT plc Employee Share Ownership Trust 4,437,245 3.02 Direct interest 8 November 2016
* Based on the total issued share capital at 28 January 2017.
The following notification was received after 28 January 2017 up to 22 March 2017.
No. of voting rights at date of
notification% of voting
rights* Nature of holdingDate of
notificationNEXT plc Employee Share Ownership Trust 4,408,241 2.98 Direct interest 30 January 2017
Financial Statements
Sharehold
er Inform
ation
45n e x t p l c . c o . u k
Strategic R
epo
rtG
overnance

slugline
Directors’ Report
Additional informationShareholder and voting rightsAll members who hold ordinary shares are entitled to attend and vote at the AGM. On a show of hands at a general meeting every member present in person and every duly appointed proxy shall have one vote and on a poll, every member present in person or by proxy shall have one vote for every ordinary share held or represented. It is intended that voting at the 2017 AGM will be on a poll. The Notice of Meeting on pages 149 to 156 specifies deadlines for exercising voting rights.
The Company is not aware of any agreements between shareholders that may result in restrictions on the transfer of securities and voting rights. There are no restrictions on the transfer of ordinary shares in the Company other than certain restrictions imposed by laws and regulations (such as insider trading laws and market requirements relating to closed periods) and requirements of internal rules and procedures whereby directors and certain employees of the Company require Board approval to deal in the Company’s securities.
The Company’s Articles may only be amended by a special resolution at a general meeting. Directors are elected or re-elected by ordinary resolution at a general meeting; the Board may appoint a director but anyone so appointed must be elected by ordinary resolution at the next general meeting. Under the Articles, directors retire and may offer themselves for re-election at a general meeting at least every three years.
However, in line with the provisions of the UK Corporate Governance Code, all directors will stand for re-election at the 2017 AGM other than Steve Barber, see page 149.
Change of controlThe Company is not party to any significant agreements which take effect, alter or terminate solely upon a change of control of the Company. However, in the event of a change of control, the Company’s medium term borrowing facilities will be subject to early repayment in full if a majority of the lending banks give written notice or in part if a lending bank gives written notice following a change of control. In addition, should a change of control cause a downgrading in the credit rating of the Company’s corporate bonds to sub-investment grade or if already sub-investment grade, a further credit rating downgrade which is not rectified within 120 days after a change of control, holders of the bonds have the option to call for redemption of the bonds by the Company at their nominal value together with accrued interest.
The Company’s share option plans, and its Long Term Incentive and Share Matching Plans, contain provisions regarding a change of control. Outstanding options and awards may vest on a change of control, subject to the satisfaction of any relevant performance conditions.
Directors’ service contracts are terminable by the Company on giving one year’s notice. There are no agreements between the Company and its directors or employees providing for additional compensation for loss of office or employment (whether through resignation, redundancy or otherwise) that occurs because of a takeover bid.
Corporate governanceThe corporate governance statement as required by the UK Financial Conduct Authority’s Disclosure Guidance and Transparency Rules (DTR 7.2.6) comprises the Additional Information section of the Directors’ Report and the Corporate Governance statement included in this Annual Report.
The following disclosures are required under Listing Rule 9.8.4 R:
Publication of unaudited financial information
In January 2017, NEXT published a Profit Before Tax (PBT) forecast for the year to January 2017 of £785m to £799m. Actual PBT for the period was £790.2m.
Shareholder waivers of dividends
The NEXT Employee Share Ownership Trust waived its rights to receive dividends during the year.
No further LR 9.8.4 disclosures are required.
By order of the Board
Amanda James Group Finance Director 23 March 2017
46 n e x t p l c . c o . u k

slugline
Directors’ Responsibilities Statement
Directors’ ResponsibilitiesThe directors are responsible for preparing the Strategic Report, Directors’ Report and the financial statements in accordance with applicable law and regulations.
As a listed company within the European Union, the directors are required to prepare the Group financial statements in accordance with International Financial Reporting Standards (IFRSs) as adopted by the EU. The directors have elected to prepare the parent company financial statements in accordance with the Companies Act 2006 and UK Accounting Standard FRS 101 “Reduced Disclosure Framework”.
Under company law the directors must not approve the financial statements unless they are satisfied that they give a true and fair view of the state of affairs of the Group and the Company and of the profit or loss of the Group for that period. In preparing the financial statements, the directors are required to:
• select suitable accounting policies and then apply them consistently;
• make judgements and estimates that are reasonable and prudent;
• present information, including accounting policies, in a manner that provides relevant, reliable, comparable and understandable information;
• in respect of the Group financial statements, provide additional disclosures when compliance with the specific requirements of IFRS is insufficient to enable users to understand the impact of particular transactions, other events and conditions on the Group’s financial position and performance;
• state that the Group has complied with IFRS, subject to any material departures disclosed and explained in the financial statements;
• in respect of the parent company financial statements, state whether applicable UK accounting standards have been followed, subject to any material departures disclosed and explained in the financial statements; and
• prepare the financial statements on a going concern basis, unless they consider that to be inappropriate.
The directors confirm that the financial statements comply with the above requirements.
The directors are responsible for keeping adequate accounting records that are sufficient to show and explain the Company’s transactions and disclose with reasonable accuracy at any time the financial position of the Company and the Group and enable them to ensure that the financial statements comply with the Companies Act 2006 and, as regards the Group financial statements, Article 4 of the IAS Regulation. They are also responsible for safeguarding the assets of the Group and hence for taking reasonable steps for the prevention and detection of fraud and other irregularities.
Responsibilities statement We confirm that to the best of our knowledge:
a. the Group financial statements, which have been prepared in accordance with IFRSs as adopted by the EU, give a true and fair view of the assets, liabilities, financial position and results of the Group;
b. the Strategic Report contained in this annual report includes a fair review of the development and performance of the business and the position of the Company and the Group, together with a description of the principal risks and uncertainties that they face; and
c. the annual report and accounts, taken as a whole, is fair, balanced and understandable and provides the information necessary for shareholders to assess the Company’s performance, business model and strategy.
Lord Wolfson of Aspley Guise Chief Executive 23 March 2017
Amanda James Group Finance Director
Financial Statements
Sharehold
er Inform
ation
47n e x t p l c . c o . u k
Strategic R
epo
rtG
overnance

slugline
Corporate Governance
Chairman’s Introduction Over the long term, NEXT has grown its business and created shareholder value against the backdrop of a challenging and changing external environment. This is the ultimate measure of our success and reflects our strong corporate governance structure and the effective management team we have in place. We remain committed to the robust approach to governance which has served the business well.
As Chairman, my role is to manage the Board, ensuring it operates effectively and contains the right balance of skills and experience, promoting a healthy culture of challenge and scrutiny. The Board is collectively responsible for the long term success of the Company and for setting and executing the business strategy. In particular, the Board is responsible for monitoring financial performance together with setting and monitoring our risk framework and risk appetite.
Through working closely with our business areas, our directors and senior management promote NEXT’s culture and standards and help to provide a strong corporate governance framework. I firmly believe that this culture will continue to be a key contributor to delivering sustainable long term value for stakeholders.
John BartonChairman 23 March 2017
Compliance with UK Corporate Governance CodeThe Group complied throughout the year under review with the provisions set out in the 2014 UK Corporate Governance Code (the “Code”) which is the version of the Code that applies to its 2016/17 financial year. The sections below detail how the Company has complied with the Code, which is available from the Financial Reporting Council website at www.frc.org.uk. These disclosures are ordered into the sections as they appear in the Code. Disclosures required by the Disclosure Guidance and Transparency Rules DTR 7.2.6, with regard to share capital are presented in the ‘Share capital and major shareholders’ and ‘Additional information’ sections of the Directors’ Report on pages 45 and 46.
Directors’ biographies and Board Committees’ membership are set out on pages 40 and 41.
A. LeadershipA.1 Role of the BoardThe Board is responsible for providing effective leadership whilst delegating more detailed matters to its committees and officers including the Chief Executive. The Board sets strategic priorities and oversees their delivery in a way that enables sustainable long term growth. The Board is
responsible for the Group’s system of risk management and internal control and for monitoring implementation of its policies by the Chief Executive. The system of internal control is designed to manage, rather than eliminate, the risk of failure to achieve business objectives and can only provide reasonable and not absolute assurance against material misstatement or loss.
The Board has a formal schedule of matters reserved for it and holds regular meetings where it approves major decisions, including investments, treasury and dividend policies and significant items of capital expenditure. The Board is responsible for approving semi-annual Group budgets. Performance against budget is reported to the Board monthly and any substantial variances are explained. Forecasts for each half year are revised and reviewed monthly. Certain other important matters are subject to weekly or monthly reporting to the Board or Board Committee, including sales, treasury operations and capital expenditure programmes. Board papers including reports from the Chief Executive and other executive directors are circulated in advance of each Board meeting.
In addition, our executive directors drive forward operational business strategies by way of attendance at key trading meetings and working closely with our business areas. This style of management serves to align with our risk management framework and facilitates senior management setting the tone from the top.
48 n e x t p l c . c o . u k

slugline
Management delegation
The Chief Executive has delegated authority for the day to day management of the business to operational management drawn from executive directors and other senior management who have responsibility for their respective areas. The most important management meetings are the weekly NEXT Brand trading and capital expenditure meetings which consider the performance and development of the NEXT Brand through its different distribution channels. These and other senior management meetings cover risk management of all business areas in respect of the NEXT Brand, including product, sales, property, warehousing, systems and personnel. Key performance indicators are monitored daily, weekly and monthly.
Attendance at Board and Committee meetings
The Board held eleven formal meetings during the year, the Audit Committee held four meetings, the Remuneration Committee held seven meetings and the Nomination Committee held three meetings. All meetings were fully attended other than two Nomination Committee meetings which John Barton did not attend as his succession as Chairman was considered at these meetings.
The Board has appointed committees to carry out certain of its duties, three of which are detailed below. Each of these is chaired by a different director and has written terms of reference which are available on the Company’s website or on request.
Audit Committee
The Committee consists of all the independent non-executive directors including the senior independent non-executive director and at least one member (Steve Barber, the Committee Chairman) with recent and relevant financial experience. The Audit Committee Report on page 54 describes the role and activities of the Committee.
Remuneration Committee
The Committee consists of the Chairman and all the independent non-executive directors and is chaired by Caroline Goodall. The Committee determines the remuneration of the executive directors in accordance with the Remuneration Policy and reviews the remuneration of senior management. Page 58 of the Remuneration Report summarises the role and activities of the Committee.
Nomination Committee
The Committee consists of the Chairman and all the independent non-executive directors including the senior independent director. The Committee meets whenever necessary to consider succession planning for directors and other senior executives and to ensure that requisite skills and expertise are available to the Board to address future challenges and opportunities. The Nomination Committee Report on page 53 describes the Board appointments process and its approach to diversity.
A.2 Division of responsibilitiesThere is a clear division of responsibilities between the offices of Chairman and Chief Executive, which is set out in writing and agreed by the Board. The Chairman manages the Board to ensure that the Group has appropriate objectives and an effective strategy; that there is a high calibre Chief Executive with a team of executive directors able to implement the strategy; that there are procedures in place to inform the Board of performance against objectives; and that the Group is operating in accordance with a high standard of corporate governance.
The Board sets objectives and annual targets for the Chief Executive to achieve. The Board is responsible for general policy on how these objectives are achieved and delegates the implementation of that policy to the Chief Executive. The Chief Executive is required to report at each Board meeting all material matters affecting the Group and its performance.
A.3 The ChairmanThe Chairman, John Barton, became a member of the Board in 2002 and was an independent non-executive director of the Company prior to his appointment as Chairman on 17 May 2006. His other significant commitments are noted on page 40, and the Board considers that these are not a constraint on his agreed time commitment to the Company.
A.4 Non-executive directorsFrancis Salway is our Senior Independent Director. Meetings of the non-executive directors without the executive directors being present are held at least annually, both with and without the Chairman.
Financial Statements
Sharehold
er Inform
ation
49n e x t p l c . c o . u k
Strategic R
epo
rtG
overnance

slugline
B. EffectivenessB.1 Composition of the BoardThe Board currently includes five independent non-executive directors and the Chairman who bring considerable knowledge, judgement and experience to the Group. The Board has a good record of recruiting new non-executive directors at regular intervals to achieve appropriate rotation and continuity.
As is best practice, we continually assess and refresh the Board to ensure we maintain an appropriate balance of skills and experience. Jonathan Bewes joined the Board on 3 October 2016 as a non-executive director and brings with him a great deal of banking and financial experience. The Board also appointed Michael Roney on 14 February 2017 as a non-executive director, Deputy Chairman and Chairman Designate. Michael will succeed John Barton as Chairman when he steps down from the Board on 1 August 2017. Further details about these appointments are provided in the Nomination Committee Report on page 53.
Steve Barber is our longest serving non-executive director, having first been elected at the 2008 AGM. Steve will stand down from the Board at the end of the 2017 AGM. Jonathan Bewes will succeed him as Chair of the Audit Committee at that time.
After giving thorough consideration to the matter, the Board considers that all of its non-executive directors are independent in character and judgement, and their knowledge, diversity of experience and other business interests continue to enable them to contribute significantly to the work of the Board.
B.2 Appointments to the BoardFor information on the procedure for appointment of new directors to the Board, and the role of the Nomination Committee in this process, refer to the Nomination Committee Report on page 53.
B.3 CommitmentFollowing the Board evaluation process, detailed further below, the Board is satisfied that each of the directors is able to allocate sufficient time to the Company to discharge their responsibilities effectively. No executive director holds any non-executive directorships outside the Group.
Contracts and letters of appointment of directors are made available at the AGM, and are available for inspection at the Company’s registered office during normal business hours or on request.
B.4 DevelopmentOn joining the Board, new members receive a personalised induction, tailored to their experience, background and understanding of the Group’s operations. Individual training and development needs are reviewed as part of the annual Board evaluation process and training is provided where a need is identified or requested. All directors receive frequent updates on a variety of issues relevant to the Group’s business, including legal, regulatory and governance issues, with visits to stores and warehouse operations organised periodically to assist with directors’ understanding of the operational aspects of the business.
B.5 Information and supportThere is a regular flow of written and oral information between all directors irrespective of the timing of Board meetings. The Company Secretary attends all Board meetings and is responsible for advising the Board on corporate governance matters and facilitating the flow of information within the Board.
Should directors judge it necessary to seek independent advice about the performance of their duties with the Company, they are entitled to do so at the Company’s expense. Details of professional assistance in relation to Remuneration Policy matters are shown on page 84.
B.6 EvaluationThis year an internal evaluation of the Board and Committees was completed with the process being facilitated by the Company Secretary. The review covered all aspects of the effectiveness of the Board and its Committees including composition, experience, dynamics, the Chairman’s leadership, and the Board’s role and responsibilities with particular regard to strategy, oversight of risk and succession planning. All directors continue to be of the opinion that the Board and its Committees were functioning effectively and that the processes underpinning the Board’s effectiveness remained appropriate.
An externally facilitated review was carried out in the 2015/16 financial year by Independent Audit Limited. This review highlighted that the Board dynamics were positive and constructive, with a strong focus on shareholder interests and the non-executives have a broad range of skills and experience and a good degree of commitment. Areas for possible attention highlighted by the evaluation were incorporated into existing plans and reassessed as part of the internal evaluation carried out during the 2016/17 financial year.
Corporate Governance
50 n e x t p l c . c o . u k

slugline
The senior independent non-executive director leads the appraisal of the performance of the Chairman through discussions with all the directors individually and, together with the Chairman, appraises the performance of the Chief Executive. The performance of the executive directors is monitored throughout the year by the Chief Executive and the Chairman. The Chairman also monitors the performance of the non-executive directors.
B.7 Re-electionThe Company’s Articles of Association require directors to submit themselves for re-election by shareholders at least once every three years. However, the Board has determined that all directors will stand for re-election or election at each AGM in accordance with the Code, with the exception of Steve Barber, who will be stepping down after serving ten years as a non-executive director.
C. AccountabilityC.1 Financial and business reportingPlease refer to:
• page 47 for the Board’s statement on the annual report and accounts being fair, balanced and understandable;
• page 93 for details of the Independent Auditor’s responsibilities; and
• pages 26 and 27 of the Strategic Report for an explanation of the Company’s business model and strategy for delivering the objectives of the Company.
Going concern and viability assessment
The Group’s business activities, together with the factors likely to affect its future development, performance and position are set out in the Strategic Report, which also describes the Group’s financial position, cash flows and borrowing facilities. Further information on these areas is detailed in the financial statements. Information on the Group’s financial management objectives, and how derivative instruments are used to hedge its capital, credit and liquidity risks is provided in Note 24 of the financial statements.
The directors report that, having reviewed current performance and forecasts, they have a reasonable expectation that the Group has adequate resources to continue its operations for the foreseeable future. For this reason, they have continued to adopt the going concern basis in preparing the financial statements. The directors have also assessed the prospects of the Company over a three year period. Further details of the viability assessment are provided on page 35.
C.2 Risk management and internal control
The Board is responsible for the Group’s risk management process and has delegated responsibility for its implementation to the Chief Executive and senior management best qualified in each area of the business. The Board sets guidance on the general level of risk which is acceptable and has a considered approach to evaluating risk and reward and promoting a risk aware culture throughout the business.
The Board has carried out a robust assessment of the principal risks facing the Company and has also conducted an annual review of the effectiveness of the systems of internal control during the year. Please refer to page 30 in the Strategic Report for further information. Risk management and internal control is a continuous process and has been considered by the Board on a regular basis throughout the year. This includes identifying and evaluating principal risks, determining control strategies and considering how they may impact on the achievement of the business objectives. The Board promotes the development of a strong control culture within the business. The Audit Committee regularly reviews strategic and operational risk, and has reviewed the principal risks (described on pages 31 to 34) and the associated controls and mitigating factors.
The Board considers that the Group’s management structure and continuous monitoring of key performance indicators provide the ability to identify promptly any material areas of concern. Business continuity plans, procedures manuals and codes of conduct are maintained in respect of specific major risk areas and business processes. Through these measures the management of business risk is an integral part of Group policy and the Board will continue to develop risk management and internal controls where necessary.
The use of a Group accounting manual and prescribed reporting requirements for finance teams throughout the Group ensures that the Group’s accounting policies are clearly established and consistently applied. Information is appropriately reviewed and reconciled as part of the reporting process and the use of a standard reporting package by all entities in the Group ensures that information is presented consistently to facilitate the production of the consolidated financial statements.
Financial Statements
Sharehold
er Inform
ation
51n e x t p l c . c o . u k
Strategic R
epo
rtG
overnance
slugline
C.3 Audit Committee and auditorsFor further information on the Company’s compliance with the Code provision relating to the Audit Committee and auditors, please refer to the Audit Committee Report on pages 54 to 57.
D. RemunerationFor further information on the Company’s compliance with the Code provision relating to remuneration, please refer to the Remuneration Report on page 84.
E. Relations with shareholdersE.1 Dialogue with shareholdersThe Company actively engages with investors and the Chief Executive and Group Finance Director are involved in regular one-to-one meetings, roadshows and conferences with institutional investors. There is also regular communication with institutional investors on key business issues.
The Board communicates with its shareholders in respect of the Group’s business activities through its Annual Report, yearly and half yearly announcements and other regular trading statements. Full year and other public announcements are presented in a consistent format with a particular focus on making the presentations as meaningful, understandable and comparable as possible. This information is also made publicly available via the Company’s website (www.nextplc.co.uk).
The Company’s largest shareholders are invited to the annual and half year results presentations, at which executive and non-executive directors are present. Non-executive directors attend other meetings with shareholders if requested. Our shareholder views are also communicated to the Board through regular reports of shareholder feedback and statements made by representative associations. Whilst the Board recognises that it is primarily accountable to the Company’s shareholders, the views of other providers of capital are also considered.
The Board takes care not to disseminate information of a share price sensitive nature which is not available to the market as a whole.
E.2 Constructive use of the Annual General Meeting
All shareholders have an opportunity to ask questions or represent their views formally to the Board at the AGM, or informally with directors after the meeting.
Other disclosuresDirectors’ conflicts of interestIn accordance with the Company’s Articles of Association, the Board has a formal system in place for directors to declare situational conflicts to be considered for authorisation by those directors who have no interest in the matter being considered. In deciding whether to authorise a situational conflict, the non-conflicted directors consider the situation in conjunction with their general duties under the Companies Act 2006. They may impose limits or conditions when giving an authorisation or subsequently if considered appropriate. Any situational conflicts considered by the Board, and any authorisations given, are recorded in the Board minutes and in a register of conflicts which is reviewed annually by the Board.
Corporate Governance
52 n e x t p l c . c o . u k

slugline
Nomination Committee Report
Board appointments process The Committee adopts a formal and transparent procedure for the appointment of new directors to the Board.
External consultants may be used to assist in identifying suitable external Board candidates, based on a written specification for each appointment. The Chairman is responsible for providing a shortlist of candidates for consideration by the Nomination Committee which then makes its recommendation for final approval by the Board. The Nomination Committee is led by the Senior Independent Director when dealing with the appointment of a successor to the Board chairmanship.
New Board appointmentsIn anticipation of Steve Barber’s intended retirement at the 2017 AGM, a description of the role and required capabilities was prepared for a replacement non-executive director. The Committee was advised of the availability of Jonathan Bewes to act in this capacity and considered his suitability for the role and his other commitments in light of the existing skills and knowledge of the Board as a whole. It was concluded that his broad range of skills and experience, particularly in finance and in the financial services sector, would assist the Board and enable him to make a valuable contribution to the Group and as the successor to Steve Barber, as Audit Committee Chairman. The Board as a whole determined it unlikely that external searches would identify other candidates who would improve on the specific knowledge and expertise that Jonathan offered. Accordingly, Jonathan was appointed to the Board with effect from 3 October 2016.
Once John Barton indicated his intention to step down as Chairman, the Nomination Committee, led by Francis Salway (Senior Independent Director) commenced its search for a suitable successor. An external search firm, JCA Group (JCA), was engaged to assist and advise the Committee on the search and appointment process.
In consultation with the Committee and Lord Wolfson (Chief Executive), JCA designed a specification for the desired candidate. Candidate profiles were prepared by JCA for consideration by the Committee to agree a list of the strongest candidates.
These candidates met with Francis Salway and Lord Wolfson, and two shortlisted candidates were then interviewed by the Nomination Committee members. Following consideration of interview feedback it became clear that Michael Roney was the most suitable candidate to succeed John Barton as Chairman. Michael Roney then met with the three executive directors who subsequently also confirmed that his experience and attributes made Michael an excellent candidate.
The Board approved the appointment of Michael and he joined the Board as non-executive director, Deputy Chairman and Chairman Designate with effect from 14 February 2017. Michael will succeed John Barton as Chairman on 1 August 2017, subject to reappointment by shareholders at the AGM in May 2017. Michael met the independence requirements set out in the UK Corporate Code on appointment and has confirmed he is able to dedicate the requisite time to the role. A number of larger shareholders were contacted by Francis Salway just prior to the announcement to make them aware of this decision.
DiversityAppointments to the Board, as with other positions within the Group, are made on merit according to the balance of skills and experience offered by prospective candidates. Whilst acknowledging the benefits of diversity, individual appointments are made irrespective of personal characteristics such as race, religion or gender and the Committee will always seek to appoint the candidate with the most appropriate skills and experience. The Board had 36% female representation at the date of approval of this report and, following the retirement of Steve Barber (May 2017) and John Barton (August 2017), this will increase to 44%. The number of directors, senior managers and employees by gender is given in the Strategic Report on page 36.
Financial Statements
Sharehold
er Inform
ation
53n e x t p l c . c o . u k
Strategic R
epo
rtG
overnance

slugline
Audit Committee Report
Chairman’s Introduction During the year the Audit Committee has continued to assist the Board in discharging its responsibilities with regard to financial reporting, controls, internal audit and external audit. It has continued to review and challenge management on the robustness and effectiveness of internal controls and risk management systems, and this year has also managed the external audit tender process.
Following changes to the UK Corporate Governance Code and EU Regulation which require auditor tendering and rotation, the Committee led a robust external audit tender process during the year leading to the Board’s recommendation at the 2017 AGM to appoint PricewaterhouseCoopers LLP (PwC) as auditor for the 2017/18 financial year. Further details of the audit tender are provided below. I would like to record my thanks to our outgoing auditor Ernst & Young LLP (EY) and their partners and staff for their many years of excellent service to the shareholders of NEXT. I have enjoyed working with them and have valued their challenge and robust approach to the audit, as well as the professionalism they have brought to the Audit Committee meetings.
This is my final report to shareholders as Audit Committee Chairman as I retire from the Board immediately after the 2017 AGM. At that time, Jonathan Bewes, our recently appointed non-executive director, will become Audit Committee Chairman. Jonathan is a Chartered Accountant, and possesses recent and relevant financial experience and the skills necessary to effectively chair the Committee.
I would like to thank NEXT’s management and the members of the Audit Committee for their counsel and support during my time as a non-executive director at NEXT.
Steve BarberChairman of the Audit Committee 23 March 2017
Membership and meetingsThe composition of the Committee is described on page 49. The Committee’s wide range of financial and commercial skills and experience serves to provide the necessary expertise and knowledge required for the efficient and robust working of the Committee.
The Committee holds regular, structured meetings and consults with external auditors and senior management, including internal audit, where appropriate. The Committee frequently requests that executive directors and senior managers attend meetings in order to reinforce a strong culture of risk management and to keep the Committee up to date with events in the business. The Group Finance Director and the Group Chairman attended all of this year’s meetings.
Committee activitiesThe Committee’s roles and responsibilities are covered in its Terms of Reference, which were last reviewed in January 2017. A copy of the Terms of Reference is available on our Company’s website (www.nextplc.co.uk).
54 n e x t p l c . c o . u k

slugline
The Committee’s main activities during the financial year were as follows:
Review of financial statementsThe Committee reviews the financial statements of the Group and assesses whether suitable accounting policies have been adopted and whether management has made appropriate estimates and judgements. The Committee is satisfied that the judgements made by management are reasonable, and that suitable accounting policies have been adopted and appropriate disclosures have been made in the accounts.
The Committee’s review of the half year and full year financial statements focused on the following areas of significance, all of which were discussed and addressed with our external auditor throughout the full year external audit process. There were no significant differences between management and external auditor conclusions.
a. Directory receivables and related provisions for doubtful debts. These, at £1.0bn, represent the largest asset class on the Group’s balance sheet and have increased significantly during the year, principally as a result of reduction in the monthly minimum payments now required to be made by customers.
Based on detailed reports and through discussions with management and the external auditor, the Committee reviewed and assessed the basis and level of provisions and their sensitivity and is satisfied that the judgements made were reasonable, consistent with the prior year and appropriate.
b. Pension scheme funding, accounting and actuarial reports. Prepared in accordance with International Accounting Standards, the Group’s balance sheet shows a net surplus of £62.9m, comprised of £873.8m assets and £810.9m liabilities. This compares with a net surplus of £46.0m in the previous year.
The Committee reviewed the actuarial assumptions underlying the calculations and was satisfied that they are reasonable. They are highly sensitive to small changes, particularly in respect of discount rates and inflation, and are not intended to reflect the full cost of a fully funded pension buyout (refer to Note 18 of the financial statements).
c. Hedge accounting. Forward contracts and options are used to manage the Sterling cost of future product purchases; this provides certainty to the cost of purchases and therefore enables selling prices and gross margins to be set. Interest rate swap arrangements are used to reduce the Group’s exposure to changes in interest rates.
The Committee discussed the systems and processes in relation to the valuation and accounting treatment of such contracts with management and the external auditor. In addition, the Board reviewed and renewed the detailed operating authority framework and limits in place for execution of such arrangements.
d. Inventory valuation. The Committee reviewed and agreed the methodology for calculating the net realisable values of inventories, which has been applied consistently.
e. Other accounting estimates. The Committee reviewed reports on the reasonableness and consistency of other accounts estimates such as product return rates and property provisions. Through discussions with management and the external auditor, the Committee is satisfied that they remain appropriate and reasonable.
New accounting standardsDuring the year the Committee considered the potential impact on the Group’s financial statements of three new accounting standards:
a. IFRS 15 “Revenue from contracts with customers” will be effective for the year ending January 2019 onwards, and is not expected to have a significant impact on the Group’s revenues. The majority of the Group’s sales are for standalone products made direct to customers at standard prices either in store or through the Directory. Estimates are already made of anticipated returns and sales awaiting delivery to the customer.
b. IFRS 9 “Financial instruments” will be effective for the year ending January 2019 onwards, the main impact being the impairment assessment methodology used to value our Directory receivables. An assessment of the full impact of this standard is in progress. Process and modelling amendments will be implemented in line with the required effective date.
c. IFRS 16 “Leases” will be effective for the year ending January 2020 onwards and the impact on the financial statements will be significant. IFRS 16 requires lessees to recognise a lease liability reflecting future lease payments and a right-of-use asset for all lease contracts. Therefore, the substantial majority of the Group’s operating lease commitments (some £2bn on an undiscounted basis, as shown in Note 29 of the financial statements) would be brought on balance sheet and amortised and depreciated separately. There will be no impact on cash flows although the presentation of the cash flow statement will change significantly. Management are currently working on the new processes and systems that will be required to comply with this accounting standard.
Financial Statements
Sharehold
er Inform
ation
55n e x t p l c . c o . u k
Strategic R
epo
rtG
overnance

slugline
Viability statement and going concern The Committee performed a detailed review of the Group’s projected cash flows, facilities and covenants which covered a three year period (our viability assessment period). The proposed approach was discussed and agreed by the Committee in October 2016 and followed up more recently by reviewing the Group’s financial position and performance, budgets for 2017/18 and three year cash projections which were stress tested for different scenarios having regard to the principal risks faced by the business. The Committee reported to the Board that, in its view, the going concern assumption remains appropriate. In addition, as regards the Group’s viability assessment, the directors confirmed that they have reasonable expectation that the Group will continue in operation and meet its liabilities as they fall due over the three year review period. Further details of this review are on page 35.
Risk management and internal controlThe Committee regularly reviews the effectiveness of risk management, and during the year has reviewed the key risks together with the associated controls and mitigating factors. Further details regarding the risk framework and approach, together with details of NEXT’s principal risks and risk assessment are on pages 30 to 34.
Internal auditThe Committee reviewed the level of internal audit resource, experience and expertise, and believes that it is adequate for the size, structure and business risks of the Group and is supplemented with appropriate external resources where needed. The Committee reviews and approves the scope of the internal audit work plan and ensures it is aligned to the key risks of the business. The Head of Internal Audit is invited to all Audit Committee meetings and provides regular reports and updates. The Head of Internal Audit has direct access to all Committee members and is given the opportunity to meet with them separately.
IT systemsThe operations of the Group are highly reliant on its IT systems. The Committee receives regular updates from the IT and operations teams covering various aspects of IT and cyber security. In this rapidly moving area, there is inevitably a risk that a systems failure or cyber attack could cause significant business disruption. Substantial resources are therefore devoted to the development and security of
the Group’s IT systems and during the year an independent cyber security review was undertaken. Please refer to more detail provided on page 30 of the principal risks section of the Strategic report.
Other activitiesDuring the year the Committee received reports and presentations from senior management on other significant activities of the Group, including Directory marketing, social media and e-commerce, regulatory compliance and developments, property, corporate responsibility, suppliers and Code of Practice (ethical and responsible sourcing). The Group’s internal controls in areas such as finance, IT, and product are also regularly reviewed by the Committee. Frequent updates are received on health and safety, risk management, business continuity, whistleblowing and corporate governance.
WhistleblowingThe Company’s whistleblowing procedures ensure that arrangements are in place to enable employees and suppliers to raise concerns about possible improprieties on a confidential basis. Any significant issues are reported to the Audit Committee.
External auditorEffectivenessThe Committee had discussions with the external auditor on audit planning, fees, accounting policies, audit findings and internal control. The external auditor attended all of this year’s Committee meetings. The Committee assessed the effectiveness of the external audit through the review of audit plans, reports and conclusions and through discussions with management (both with and without the external auditor present) and the external auditor (both with and without management present). The Committee was satisfied that the audit was effective.
In addition, the Chairman of the Audit Committee regularly meets with the Audit Partner outside formal meetings. The Committee is satisfied that EY continued to possess the skills and experience required to fulfil its duties effectively and efficiently during the financial year.
Independence and objectivityEY has reported to the Committee that, in its professional judgement, it is independent within the meaning of regulatory and professional requirements and the objectivity of the audit engagement partner and audit staff is not impaired. The Audit Committee has assessed the independence of the auditor, and concurs with this statement.
Audit Committee Report
56 n e x t p l c . c o . u k

slugline
Non-audit work carried out by the external auditor
In order to ensure the continued independence and objectivity of the Group’s external auditor, the Board has strict policies regarding the provision of non-audit services by the external auditor.
The Committee’s approval is required in advance for the provision of any non-audit services if the fee exceeds £100,000 for an individual assignment, or if the aggregate non-audit fees for the year exceed £150,000 or 20% of the audit fee.
The Committee reviews audit and non-audit fees twice a year. Proposed assignments of non-audit services with anticipated fees in excess of £50,000 are generally subject to competitive tender and decisions on the award of work are made on the basis of competence, cost-effectiveness and legislation. A tender process may not be undertaken where existing knowledge of the Group enables the auditor to provide the relevant services more cost-effectively than other parties. The Group’s external auditor is prohibited from providing any services that would conflict with their statutory responsibilities or which would otherwise compromise their objectivity or independence. During the year, EY’s audit fee amounted to £0.6m and EY’s non-audit fees were £0.2m in total. In line with the above policy, appropriate advance approval was obtained from the Committee. Further details are provided in Note 3 of the financial statements.
In line with the new EU audit reform regulations which come into force for NEXT for the first time for the financial year 2017/18, the Audit Committee has set in place procedures to ensure only permitted non-audit services are provided by the auditor and these are in line with the above policy. These procedures will also ensure that the new cap on permitted non-audit services of 70% of the average Group audit fee paid on a rolling three year basis is not exceeded, even though this will not apply to NEXT until the financial year 2020/21.
External audit tenderThe Audit Committee is responsible for recommending to the Board the appointment, re-appointment and removal of the external auditor. EY, or its predecessor firms, have been the Group’s auditor for over 20 years and there has been regular partner rotation, most recently in 2012.
As disclosed in last year’s Audit Committee Report, and following changes to the UK Corporate Governance Code and EU Regulation requiring auditor tendering and rotation, during 2016 the Committee led a process to select a new external auditor for the financial year ending January 2018. The Committee was conscious that the audit tender
process is time and resource consuming for all of the parties involved, and was therefore determined to have a concise, yet efficient and thorough process. They were also keen to ensure equivalent access to management and information for each firm.
The Committee commenced the initial selection process in January 2016 by agreeing the selection criteria and considered five firms. EY was not invited to tender because regulation would limit its future tenure to no more than three years as a result of the long period during which they have acted as the Company’s external auditor. One firm was conflicted and another was not in a position to provide the local service required, therefore three firms, PwC, KPMG and Deloitte were invited to tender. Our largest shareholders were invited to comment on the process and no issues were raised.
Participating firms were granted access to key members of management and the Audit Committee, as well as access to a wealth of information about the Group. They also attended a full day’s briefing in April 2016 which included group meetings with all firms, comprising a series of presentations from key senior managers explaining the NEXT business.
Following these meetings, the firms submitted formal audit proposal documents covering predetermined areas of focus, including audit quality, audit approach, independence, risk identification and audit scope. In June 2016, each firm presented to the Audit Committee, at which certain members of NEXT’s management were also present.
Subsequent to the presentations, the Audit Committee met and concluded that they would propose two firms to the Board, PwC and KPMG, both of which met the pre-agreed selection and assessment criteria, albeit that they indicated a preference for PwC. The Board reviewed the Audit Committee’s proposal and approved the appointment of PwC for the 2017/18 financial year. A resolution to this effect will be submitted to shareholders for approval at the 2017 Annual General Meeting.
CMA Order 2014 Statement of ComplianceNEXT confirms that it was in compliance with the provisions of The Statutory Audit Services for Large Companies Market Investigation (Mandatory Use of Competitive Tender Processes and Audit Committee Responsibilities) Order 2014 during the financial year ended 28 January 2017.
Financial Statements
Sharehold
er Inform
ation
57n e x t p l c . c o . u k
Strategic R
epo
rtG
overnance

slugline
Remuneration Report
Contents
Part 1: Annual Statement from the Remuneration Committee Chairman page 58
Part 2: Proposed Directors’ Remuneration Policy page 63
Part 3: Annual Remuneration Report page 72
Remuneration complianceThis report is compiled in accordance with Schedule 8 of the Large and Medium-sized Companies and Group (Accounts and Reports) (Amendment) Regulations 2013. The Remuneration Committee believes that the Company has complied with the provisions regarding remuneration matters contained within the UK Corporate Governance Code.
Part 1: Annual Statement from the Remuneration Committee Chairman On behalf of the Board, I am pleased to present the report on directors’ remuneration for 2016/17.
Outcome for 2016/17 remunerationTotal remuneration
As outlined in our Strategic Report it has been a challenging year for NEXT and the remuneration outcomes for the directors have reflected this. Total annual remuneration earned by our executive directors for the financial year 2016/17 was significantly less than that earned for the financial year 2015/16. In the view of the Remuneration Committee, this is appropriate and aligns the remuneration received by management with the experience of shareholders.
The Committee considers that the current remuneration arrangements promote the long term success of the Company within an appropriate risk framework and are suitably aligned to enhancing shareholder value and the Company’s objective of delivery of long term sustainable growth in total shareholder returns (TSR). Moreover, we believe our rigorous approach to target setting and linking pay to performance means that the actual remuneration earned by the executive directors continues to be a good reflection of their and NEXT’s overall performance. Thus the challenging trading conditions encountered by the Company during the year and the reduction in the profit before tax in 2016/17 as compared with the previous year, are reflected in no executive directors’ annual bonus having been earned in 2016/17 and in decreased LTIP vesting rates as compared with the previous year.
Total remuneration for 2016/17 for Lord Wolfson was over 55% lower than his total remuneration in 2015/16, and between 30% and 45% lower for the other executives.
Despite the challenging trading conditions the business continues to face, NEXT remains focused on executing our business strategy and improving the business over the long term.
Annual bonus
As has been the case for many years at NEXT, annual bonus is calculated with reference to pre-tax EPS, including the impact of share buybacks. In the 2014 Remuneration Report we first set out the basis on which we would ensure that executive directors are not incentivised to recommend share buybacks to the Board in preference to special dividends, or vice versa. This is achieved by making a notional adjustment to EPS growth for special dividends, on the basis that the cash distributed had instead been used to purchase shares at the prevailing share price on the day of the special dividend payment.
The growth in pre-tax EPS in the year, as adjusted for special dividends, was below the target threshold and no bonus was earned for 2016/17, compared to 45% for the executive directors and 67% for Lord Wolfson in 2015/16. Details of the targets set for 2016/17 are on page 73.
58 n e x t p l c . c o . u k

slugline
Long Term Incentive Plan (LTIP)
LTIP awards are granted twice a year (each at 100% of base salary for executive directors) and during the year the Committee approved two grants and two awards vested. The LTIP for the three year performance period to July 2016 vested 61% (July 2015 LTIP: vested 76%) as NEXT’s TSR ranked seventh out of 21 companies in the comparator group. The LTIP for the three year performance period to January 2017 vested 20% (January 2016 LTIP: vested 77%) as NEXT’s TSR ranked eleventh. Details of the comparator group are set out on page 80.
From 2014 onwards, awards granted to executive directors which vest must be taken in shares and the net shares (after payment of tax and NIC) must be held for a minimum period of two further years.
Matters addressed during the yearThe Committee has addressed the following matters this year:
Remuneration policy NEXT’s current Remuneration Policy reaches the end of its three year life at the AGM on 18 May 2017. The Remuneration Committee has therefore reviewed the current Remuneration Policy and proposes a number of minor changes. We shall be seeking shareholder approval for the revised Remuneration Policy at the 2017 AGM. Thus, there will be both a resolution to approve the remuneration report (including the implementation of the current policy in respect of the 2016/17 financial year) and a resolution to approve the revised new Remuneration Policy for the forthcoming three year period to the 2020 AGM.
Background and summary proposals
Whilst the Committee was mindful of the proposals set out by the Executive Remuneration Working Group (ERWG), which encouraged companies to consider whether alternative models of remuneration were appropriate, we do not feel it is the right time in the Company’s development to make any radical changes. NEXT’s business model and strategy has not changed and we believe that the structure of the existing Remuneration Policy continues to be the right one for the Company and its shareholders as it is aligned with the Company’s annual and long term performance, with shareholder experience and with the Company’s strategy, objectives and business model. We are therefore proposing a Remuneration Policy which makes only modest changes to the current Remuneration Policy.
The proposed amendments to the policy address developments in best practice and assist with its efficient operation. That said, the Committee will continue to monitor developments in best practice. If, at a later date, the Committee concludes that alternative remuneration arrangements would be appropriate, it would consult with NEXT’s major shareholders before proposing a revised policy to shareholders.
The Remuneration Committee reviewed the existing Remuneration Policy against the current backdrop in trading conditions and the wider economic background generally and determined that, with a few changes, the current Remuneration Policy remains fit for purpose and supports the long term success of the business.
Proposed changes
A summary of the changes to the policy is set out below:
• Long Term Incentive Plan (LTIP) and Share Matching Plan (SMP)As executive directors have not been granted SMP awards in recent years, we propose that the facility to make future grants under this plan to the executive directors is formally removed from the new Remuneration Policy. Legacy SMP awards granted to individuals before they were promoted to the Board as executive directors will continue to run their course.
Participants in the LTIP have not previously been entitled to receive ordinary and special dividend accruals on any awards vesting under the LTIP. It is proposed that this will be amended so participants in the future will be entitled to receive ordinary and special dividend accruals on any awards granted under the LTIP (to the extent which they vest). The Committee recognises that the inclusion of dividend accruals on any vested awards increases the expected value of the award. However, the Committee noted that maximum normal annual award levels of 200% of salary (which will remain unchanged) are already below the market median for FTSE 100 Chief Executives and Chief Financial Officers (260% and 225% respectively) and current practice in most other FTSE 100 companies is to provide for dividend accrual on vested awards. Therefore, the Committee is comfortable that the proposed amendment is appropriate as it provides a relatively modest benefit to participants and its effect is to align further the position of LTIP award holders with that of shareholders.
Financial Statements
Sharehold
er Inform
ation
59n e x t p l c . c o . u k
Strategic R
epo
rtG
overnance

slugline
The Company will be seeking shareholder approval at the forthcoming 2017 AGM for changes to the Company’s LTIP rules to permit the dividend accruals described above.
• Annual bonusThe annual bonus plan will remain unchanged in terms of the application of stretching financial measures and the maximum amounts payable. Participants will be entitled to receive ordinary and special dividend accruals on any awards vesting under the Deferred Share Bonus award.
• Service contracts For any new executive director, it is proposed that the service contract will limit any payment in lieu of notice to 12 month’s base salary only with the provision for payments on a phased basis. There will also be no liquidated damages provisions on change of control for any new executive director.
Annual base salary review for 2017/18The Committee undertook a review of executive director salaries in the context of overall remuneration, and considered whether, in the case of those executive directors promoted internally to the Board in recent years, some adjustments to reflect their experience and development in the role of executive director was appropriate.
NEXT has a good track record of internal promotions to the Board and has not made an external appointment of an executive director for over 28 years. When Michael Law (Group Operations Director) and Jane Shields (Group Sales and Marketing Director) were each promoted to executive directors in July 2013 and when Amanda James (Group Finance Director) was similarly promoted in April 2015, none of them received a salary increase at the time of their promotion. The Committee firmly believes that salary increases should be timed to reflect performance and contribution at Board level rather than automatically applied immediately on promotion. Salary progression is therefore phased over a period of approximately 1 to 3 years after promotion to the Board, subject to proven performance and development during that period.
We understand that this approach to salary progression for internal promotions to the Board may be relatively uncommon and other companies would typically award significant salary increases on promotion and with effect from the day of joining the Board. Consequently, these increases are often not externally reported. The Committee is very mindful that the NEXT approach to salary progression does mean that there are significant pay rises awarded to executives in the first few years following their promotion. However, ours is actually a prudent policy and delaying increases is in the interests of shareholders as it saves money on salary as well as bonus and LTIP grants which are correspondingly less for the newly promoted executive directors in those first few years following promotion. Furthermore, if the transition to the executive director role proves to be unsuccessful, any exit terms would be based on a correspondingly lower salary and therefore also in the interests of shareholders.
Therefore, consistent with this approach to salary progression, had the Company’s performance in the 2016/17 financial year been in line with our expectations at the outset of the year, the Committee would have proposed an increase of around 15%, effective from February 2017, in the base salary of Michael Law and Jane Shields taking their salaries to £475,000. This would have represented the final stage in setting their pay levels at an appropriate level, reflecting the progression in their respective roles since their promotion to the Board in July 2013. Similarly, in the case of the base salary of Amanda James (promoted to the Board in April 2015) the Committee would have recommended an increase of 18%, effective from February 2017, taking her base salary to £425,000. The increase for Amanda James would have been considered a further interim increase reflecting her strong performance in the Group Finance Director role since her promotion to the Board.
However, in light of the lower than expected 2016/17 profit and EPS outcome, the Committee decided that it was more appropriate to revise these proposed salary increases downwards. Therefore, although many of the challenges facing NEXT are consistent with the UK fashion retailing sector more generally and the executive directors are all performing and developing well, the Committee decided to increase the base salaries of Jane Shields and Michael Law by 1% (taking their salaries to £416,200), in line with the wider Company pay award with effect from February 2017. In the case of Amanda James, the Committee agreed a base salary increase of 16% (taking her base salary also to £416,200).
The Committee will consider further salary progression increases for these three executives in due course, although such increases would be subject to ongoing development in their roles, continued strong performance of the individual and the Company’s performance against the wider economic background.
Remuneration Report
60 n e x t p l c . c o . u k
slugline
The base salary for Lord Wolfson was increased in February 2017 by 1%, in line with the wider Company award. Lord Wolfson’s annual base salary increases have been in line with the wider Company awards since 2009.
For information, even after the salary increase noted above, the executive directors and CEO’s salary will continue to be positioned below the median of comparable roles in other FTSE 100 companies in general and other FTSE 100 retailers more specifically. We believe this demonstrates our overall conservative approach to pay.
Other matters addressed during the yearThe Committee has addressed the following matters this year:
Share ownership guidelines
Share ownership guidelines were increased to 2 times salary for all executive directors (previously 1.5 times salary for the Chief Executive and 1 times salary for other executive directors). As at the 2016/17 financial year end, the value of shareholdings of Lord Wolfson, Michael Law and Jane Shields met or exceeded the increased share ownership guidelines of 2 times salary. Amanda James held shares to the value of 1.8 times her salary at the 2016/17 year end. In line with the share ownership guidelines, Amanda has until April 2020 (i.e. 5 years from the date of her appointment to the Board) to acquire the minimum shareholding.
EPS and performance measurement
The Committee reviews each year the basis and performance measures used for the annual bonus and LTIP. The performance measure for the annual bonus continues to be based on pre-tax EPS.
The principal reasons for using EPS are:
• it is consistent and transparent to participants and shareholders;
• NEXT is predominantly a single business selling products through a number of channels under the NEXT and third-party brands. No significant earnings are derived from unrelated businesses and, therefore, a group metric such as EPS is logical and consistent with strategy;
• EPS continues to be the core financial measure by which the Board assesses overall performance; and
• the use of EPS is complemented by the application of TSR and consideration of the general economic underpin condition for the LTIP.
As set out in previous years, we consider it right that the impact of share buybacks on EPS (or adjustments for special dividends) should be included in performance measurement as share buybacks, and more recently special dividends, have been one of NEXT’s primary strategies in returning value to shareholders. Share buybacks or special dividends are regularly considered by the Board. Share buybacks are subject to prior approval as to timing, price and volume. Shares are only bought when the Board is satisfied that the ability to invest in the business and to grow the ordinary dividend will not be impaired.
Remuneration principlesThe Remuneration Committee members are keenly aware of the importance and sensitivity of remuneration issues among investors, employees and the wider public and the responsibilities which that places on us. The Committee’s objective is to ensure that the remuneration paid to senior executives is appropriate in both amount and structure, is directly linked to the Company’s annual and long term performance and aligned with the interests of shareholders. We believe that stable and transparent remuneration structures are key elements in a fair system for rewarding personal and collective contribution across the business. There are bonus structures throughout the Company, including Head Office, stores, call centres and warehouses.
Financial Statements
Sharehold
er Inform
ation
61n e x t p l c . c o . u k
Strategic R
epo
rtG
overnance

slugline
The focus is on ensuring that a competitive and appropriate base salary is paid to directors and senior managers, together with incentive arrangements that are:
• appropriate in both amount and structure;
• directly linked to the Company’s annual and long term performance;
• in alignment with the interests of shareholders and our long term strategy; and
• stable and transparent.
We also focus on maintaining an appropriate balance between annual and long term incentive elements and also between cash and share-based elements, with the aim of ensuring that remuneration drives the right behaviours and rewards the right outcomes. We believe that weighting rewards towards the long term ensures proper shareholder alignment.
Executive directors receive a mix of annual and long term incentives which reward strong business and financial performance in line with the Company’s strategy and which are measured against robust benchmarks. We place special importance on rewarding consistently strong performance over longer periods and, therefore, the balance of incentives is tilted towards the LTIP, with its 3 year performance period and 2 year holding period following vesting.
Pay and employment conditions elsewhere in the Group are considered to ensure that differences for directors are justified. Remuneration Policy does not conflict with the Company’s approach to environmental, social and corporate governance matters and we believe the current arrangements do not encourage directors to take undue business risks.
Wider employee considerations The Remuneration Committee is very mindful about remuneration arrangements across the Group, including performance related pay which ensures that all employees have the potential to benefit from the success of NEXT. There are bonus structures throughout the Company and employee share ownership is strongly encouraged. Market value options over NEXT shares are granted each year to middle management in Head Office as well as senior store staff and participation in our Sharesave is open to all of our UK and Eire employees. Around 11,900 employees (circa 26% of our total UK and Eire employees) held options or awards in respect of 5.6 million shares in NEXT at January 2017.
Shareholder engagementDuring the year, the Committee consulted extensively with our largest shareholders and their representative bodies on our proposed changes to Remuneration Policy. We were pleased by the level and quality of engagement and the support we received for our proposals. The Committee genuinely values feedback from shareholders and this was an opportunity, which is very important to me as a relatively new Remuneration Committee chair, to enter into dialogue with our principal shareholders.
2017 AGMThe Committee considers that the simplicity and transparency of our remuneration arrangements and their consistent application have contributed positively to NEXT’s strong management team continuing to deliver resilient performance in both benign and more challenging trading environments. I very much hope that shareholders will support the Committee’s overall approach and, on behalf of the Committee, I commend each of our proposed Remuneration Policy, our 2016/17 Directors’ Annual Remuneration Report and the changes to the LTIP to you.
Caroline Goodall Chairman of the Remuneration Committee 23 March 2017
Remuneration Report
62 n e x t p l c . c o . u k

slugline
Part 2: Proposed Remuneration Policy for the Period 2017 to 2020 The proposed Remuneration Policy is set out in this section. At the AGM to be held on 18 May 2017 a resolution to adopt the proposed Remuneration Policy will be put to shareholders for approval. The policy is set to apply, subject to shareholders’ approval, for three years from the 2017 AGM.
The table below summarises the Company’s policies with regard to each of the elements of remuneration for existing directors and the approach to payments on external recruitment and termination. The key changes in the proposed policy from the current Remuneration Policy which expires at the 2017 AGM have been highlighted where necessary.
Base salary
Purpose and link to strategyTo attract, motivate and retain high-calibre individuals, while not overpaying. To provide a satisfactory base salary within a total package comprising salary and performance-related pay.
Performance-related components and certain benefits are calculated by reference to base salary. The level of salary broadly reflects the value of the individual, their role, skills and experience.
OperationNormally reviewed annually, generally effective 1 February. The Committee focuses particularly on ensuring that an appropriate base salary is paid to directors and senior managers. The Committee considers salaries in the context of overall packages with reference to individual experience and performance, the level and structure of remuneration for other employees, the external environment and market data. External benchmarking analysis is only occasionally undertaken and the Committee has not adopted a prescribed objective of setting salaries by reference to a particular percentile or benchmark.
Maximum opportunityThere is no guaranteed annual increase. The Committee considers it important that base salary increases are kept under tight control given the multiplier effect of such increases on future costs. In the normal course of events, increases in executive directors’ salaries would be in line with the wider Company cost of living awards.
The Committee reserves flexibility to grant larger increases where considered appropriate, such as where a new executive director, being an internal promotion, has been appointed to the Board with an initial salary which is considered below the normal market rate, then the Committee may make staged increases to bring the salary into line as the executive gains experience in the role. Also if there have been significant changes in the size and scope of the executive’s role then the Committee would review salary levels accordingly.
Under the reporting regulations the Company is required to specify a maximum potential value for each component of pay. Accordingly, for the period of this policy no base salary paid to an executive director in any year will exceed £850,000 (being the current median base salary of FTSE 100 Chief Executives). The amount of the maximum base salary which may be paid to an executive director in any year shall increase in line with the growth in RPI from the date of approval of this policy.
Performance measures and targetsNot applicable.
Key changes to last approved policyNo material changes. To comply with the latest regulatory guidance, the salary cap has been expressed as a fixed amount.
Financial Statements
Sharehold
er Inform
ation
63n e x t p l c . c o . u k
Strategic R
epo
rtG
overnance

slugline
Annual bonus
Purpose and link to strategyTo incentivise delivery of stretching annual goals.
To provide focus on the Company’s key financial objectives.
To provide a retention element in the case of the Chief Executive as any annual bonus in excess of 100% of base salary is payable in shares, deferred for a period of two years and subject to forfeiture if he voluntarily resigns prior to the end of that period.
OperationPerformance measures and related performance targets are set at the commencement of each financial year by the Committee. Company policy is to set such measures by reference to financial measures (such as pre-tax EPS) but the Committee retains flexibility to use different performance measures during the period of this policy if it considers it appropriate to do so, although at least 75% of any bonus will continue to be subject to financial measures.
At the threshold level of performance, 20% of the maximum bonus may be earned. A straight sliding scale of payments operates for performance between the minimum and maximum levels. There is no in-line target level although, for the purposes of the scenario charts on page 71, 50% of maximum bonus has been assumed because it is the mid-point.
Dividend accruals (both in respect of special and ordinary dividends) may be payable on any deferred bonus awards which vest.
The Company has the flexibility within the rules of the Deferred Share Bonus Plan to grant nil cost options as an alternative to conditional share awards or exceptionally to settle in cash.
Maximum opportunityAt present Company policy is to provide a maximum bonus of 150% of salary for the Chief Executive and 100% of salary for other executive directors.
Although the Committee has no current plan to make any changes, for the period of this policy the Committee reserves flexibility to:
• increase maximum bonus levels for executive directors in any financial year to 200% of salary. This flexibility would be used only in exceptional circumstances and where the Committee considered any such increase to be in the best interests of shareholders and after appropriate consultation with key shareholders;
• lessen the current differentials in bonus maximums which exist between the Chief Executive and other executive directors; and
• introduce or extend an element of compulsory deferral of bonus outcomes if considered appropriate by the Committee.
Performance measures and targetsCurrently performance is assessed against pre-tax EPS targets set annually, which take account of factors including the Company’s budgets and the wider background of the UK economy. Pre-tax EPS has been chosen as the basic metric to avoid executives benefitting from external factors such as reductions in the rate of corporation tax. Generally the threshold for staff bonuses is set at a lower level than for directors. The Committee reserves flexibility to apply discretion in the interests of fairness to shareholders and executives by making adjustments it considers appropriate.
The Committee reserves flexibility to apply different performance measures and targets in respect of the annual bonus for the period of this policy but a financial measure will continue to be used for at least 75% of the award. The Committee will consult with major shareholders before any significant changes are made to the use of performance measures.
The basis of performance measurement incorporates an appropriate adjustment to EPS growth to reflect the benefit to shareholders from special dividends paid in any period.
Key changes to last approved policyDividend accruals (both in respect of special and ordinary dividends) may be payable on vested deferred bonus awards.
Remuneration Report
64 n e x t p l c . c o . u k

slugline
Long Term Incentive Plan (LTIP)
Purpose and link to strategyTo incentivise management to deliver superior total shareholder returns (TSR) over three year performance periods relative to a selected group of retail companies, and align the interests of executives and shareholders.
Retention of key, high calibre employees over three-year performance periods and encouraging long term shareholding, through post vesting holding requirement, and commitment to the Company.
OperationA variable percentage of a pre-determined maximum number of shares can vest, depending on the achievement of performance conditions.
The maximum number of shares that may be awarded to each director is a percentage of each director’s base salary at the date of each grant, divided by NEXT’s average share price over the three months prior to the start of the performance period.
LTIP awards are made twice a year to reduce the volatility inherent in any TSR performance measure and to enhance the portfolio effect for participants of more frequent, but smaller, grants.
The Company has the flexibility within the rules of the LTIP to grant nil cost options as an alternative to conditional share awards and to settle vested LTIP awards in cash.
Dividend accruals (both in respect of special and ordinary dividends) may be payable on any vested LTIP awards.
Maximum opportunityThe maximum possible aggregate value of awards granted to all executive directors will be 200% of annual salary (i.e. 100% every six months) and up to 300% in exceptional circumstances.
The Committee reserves the right to vary these levels within the overall annual limits described above. In addition, awards granted to executive directors which vest must be taken in shares and the net shares (after payment of tax and NIC) must be held for a minimum period of two further years. The Committee reserves the right to lengthen (but not reduce) the performance period and to further increase the holding period or to introduce a retention requirement.
Performance measures and targetsPerformance is measured over a period of three years. Currently performance is measured based on NEXT’s TSR against a group (currently 20 other UK listed retail companies) which are, in the view of the Committee, most comparable with NEXT in size or nature of their business. Comparison against such a group is more likely to reflect the Company’s relative performance against its peers, thereby resulting in awards vesting on an appropriate basis.
Relative performancePercentage
vestingBelow median 0%Median 20%Upper quintile 100%
If no entitlement has been earned at the end of a three year performance period then that award will lapse; there is no retesting.
Key changes to last approved policyDividend accruals (both in respect of special and ordinary dividends) may be payable on vested awards.
Financial Statements
Sharehold
er Inform
ation
65n e x t p l c . c o . u k
Strategic R
epo
rtG
overnance

slugline
Pension
Purpose and link to strategyTo provide for retirement through Company sponsored schemes or a cash alternative for personal pension planning and therefore assist attraction and retention.
OperationLord Wolfson, Michael Law and Jane Shields are deferred members of the defined benefit (DB) section of the 2013 NEXT Group Pension Plan (the “Plan”).
In addition to being a deferred member of the DB section of the Plan, Lord Wolfson is a member of the unfunded, unapproved supplementary pension arrangement (SPA), described on page 77. His future pension will be calculated by reference to his October 2012 salary, rather than his final earnings, and any future salary changes will have no effect.
Jane Shields and Michael Law ceased to contribute to the Plan in 2011 and in 2012 respectively. Their pensions are no longer linked to salary and will increase in line with statutory deferred revaluation only (i.e. in line with CPI).
Lord Wolfson, Michael Law and Jane Shields receive salary supplements of 15% in lieu of past changes to their pension arrangements, in line with other senior employee members of the DB section of the Plan.
Amanda James is a member of the defined contribution section of the Plan and the Company currently makes a contribution equal to 5% of her salary into her pension plan. Amanda can opt to receive an equivalent cash supplement in lieu of this Company contribution. This is consistent with the pension provision and alternatives available to employees generally.
New employees of the Group can join the defined contribution (DC) section of the NEXT Plan or the statutory Auto-Enrolment plan or receive a cash supplement.
Bonuses are not taken into account in assessing pensionable earnings in the Plan.
Maximum opportunityUnder the DB section and the SPA, the maximum potential pension is only achieved on completion of at least 20 years of pensionable service at age 65, when two thirds of the executive director’s annual pensionable salary at October 2012 could become payable. The lump sum payable on death in service is four times base salary.
No DC contributions, or equivalent cash supplement payments, will be made to an executive director in any year that will exceed 25% of base salary (being slightly below the median level of contributions or payments made to FTSE 100 Chief Executives).
Performance measures and targetsNot applicable.
Key changes to last approved policyNo material changes. To comply with the latest regulatory guidance, the pension cap has been expressed as a fixed percentage of salary.
Other benefits
Purpose and link to strategyTo provide market competitive non-cash benefits to attract and retain high-calibre individuals.
OperationExecutive directors receive benefits which may include the provision of a company car or cash alternative, private medical insurance, subscriptions to professional bodies and staff discount on Group merchandise. A driver is also made available to the executive directors.
The Committee reserves discretion to introduce new benefits where it concludes that it is in the interests of NEXT to do so, having regard to the particular circumstances and to market practice and reserves flexibility to make relocation related payments.
Whilst not considered necessarily to be benefits, the Committee reserves the discretion to authorise attendance by directors and their family members (at the Company’s cost if required) at corporate events and to receive reasonable levels of hospitality in accordance with Company policies.
Reasonable business related expenses will be reimbursed (including any tax thereon).
Maximum opportunityDuring the policy period, the value of benefits (other than relocation costs) paid to an executive director in any year will not exceed £150,000. In addition, the Committee reserves the right to pay up to £250,000 relocation costs in any year to an executive director if considered appropriate to secure the better performance by an executive director of their duties.
During the policy period, the actual level of taxable benefits provided will be included in the Single Total Figure of Remuneration.
Performance measures and targetsNot applicable.
Key changes to last approved policyIncreased the benefits cap by £50,000 to £150,000 to provide suitable flexibility over the period of the Remuneration Policy.
Remuneration Report
66 n e x t p l c . c o . u k

slugline
Termination payments
Purpose and link to strategyConsistent with market practice, to ensure NEXT can recruit and retain key executives, whilst protecting the Company from making payments for failure.
OperationThe Committee will consider the need for and quantum of any termination payments having regard to all the relevant facts and circumstances at that time.
Future service contracts will take into account relevant published guidance.
Maximum opportunityEach of the executive directors has a rolling service contract. Dates of appointment and notice periods are disclosed on page 85. The contract is terminable by the Company on giving one year’s notice and by the individual on giving six months’ notice. For current directors, the Company has reserved the right to make a payment in lieu of notice on termination of an executive director’s contract equal to their base salary and contractual benefits (excluding performance-related pay). For future directors, any payment in lieu of notice would be limited to their base salary only.
For current directors, if notice of termination is given immediately following a change of control of the Company, the executive director may request immediate termination of his/her contract and payment of liquidated damages equal to the value of his/her base salary and contractual benefits. Liquidated damages provisions will not be present in any service contract for a new executive director. Any new service contract will include provision for any termination payments to be made on a phased basis.
In normal circumstances executive directors have no entitlement to compensation in respect of loss of performance bonuses and all share awards would lapse following resignation. However, under certain circumstances (e.g. ‘good leaver’ or change in control), and solely at the Committee’s discretion, annual bonus payments may be made and would ordinarily be calculated up to the date of termination only, based on performance. In addition, awards made under the LTIP would in those circumstances generally be time pro-rated and remain subject to the application of the performance conditions at the normal measurement date. The Committee also has a standard discretion to vary the application of time pro-rating in such cases. ‘Good leaver’ treatments are applied in exceptional cases only.
In the event of any termination payment being made to a director (including any performance-related pay elements), the Committee will take full account of that director’s duty to mitigate any loss and, where appropriate, may seek independent professional advice and consider the views of shareholders as expressed in published guidance prior to authorising such payment.
Consistent with market practice, in the event of removal from office of an executive director, the Company may pay a contribution towards the individual’s legal fees and fees for outplacement services as part of a negotiated settlement and such other amounts as the Committee considers to be necessary, having taken legal advice, in settlement of potential claims. Any such fees would be disclosed with all other termination arrangements. The Committee reserves the right, if necessary, to authorise additional payments in respect of such professional fees if not ascertained at the time of reporting such termination arrangements up to a maximum of £10,000.
A departing gift may be provided up to a value of £10,000 (plus related taxes) per director.
Performance measures and targetsNot applicable.
Key changes to last approved policyPayment in lieu of notice will be limited to base salary for any new executive directors.
Liquidated damages will not be used for any new executive director appointment. Any new service contracts will include provision for phased payments.
Save As You Earn Scheme (Sharesave)
Purpose and link to strategyTo encourage all employees to make a long term investment in the Company’s shares.
OperationExecutive directors can participate in the Company’s Sharesave scheme which is HMRC approved and open to all employees in the UK. A similar scheme is available to employees in Eire. Option grants are generally made annually, with the exercise price discounted by a maximum of 20% of the share price at the date an invitation is issued. Options are exercisable three or five years from the date of grant. Alternatively, participants may ask for their contributions to be returned.
Maximum opportunityInvestment currently limited to a maximum amount of £250 per month. The Committee reserves the right to increase the maximum amount in line with limits set by HMRC (currently £500 per month).
Performance measures and targetsNot applicable.
Key changes to last approved policyUpdated to permit the maximum amount to reflect the latest HMRC limits.
Financial Statements
Sharehold
er Inform
ation
67n e x t p l c . c o . u k
Strategic R
epo
rtG
overnance

slugline
Recovery and withholding provisions
Purpose and link to strategyTo ensure the Company can recover any payments made or potentially due to executive directors under performance-related remuneration structures.
OperationRecovery and withholding provisions are in the service contracts of all executive directors and will be enforced where appropriate to recover or withhold performance-related remuneration which has been overpaid due to: a material misstatement of the Company’s accounts; errors made in the calculation of an award; or a director’s misconduct. These provisions allow for the recovery of sums paid and/or withholding of sums to be paid.
Maximum opportunityNot applicable.
Performance measures and targetsNot applicable.
Key changes to last approved policyNo material changes.
Chairman and non-executive director fees
Purpose and link to strategyTo ensure fees paid to the Chairman and non-executive directors are competitive and comparable with other companies of equivalent size and complexity so that the Company attracts non-executive directors who have a broad range of experience and skills to oversee the implementation of our strategy.
OperationRemuneration of the non-executive directors is normally reviewed annually and determined by the Chairman and the executive directors. The Chairman’s fee is determined by the Committee (excluding the Chairman).
Additional fees are paid to non-executive directors who chair the Remuneration and Audit Committees, and act as the Senior Independent Director. The structure of fees may be amended within the overall limits.
External benchmarking is undertaken only occasionally and there is no prescribed policy regarding the benchmarks used or any objective of achieving a prescribed percentile level.
Currently, for each day spent on Company business in excess of the normal time commitment, the Chairman will be paid £1,500 and the non-executive directors £1,000. These are subject to an annual review by the Board. Reasonable business related expenses will be reimbursed (including any tax thereon).
Maximum opportunityThe total of fees paid to the Chairman and the non-executive directors in any year will not exceed the maximum level for such fees from time to time prescribed by the Company’s articles of association (currently £750,000 per annum).
Performance measures and targetsNon-executive directors receive the normal staff discount on Group merchandise but do not participate in any of the Group’s bonus, pension, share option or other incentive schemes.
Key changes to last approved policyNo material changes.
The policies as set out above would apply to the promotion of an existing group employee to the Board.
Remuneration Report
68 n e x t p l c . c o . u k

slugline
The following principles will be applied on an internal appointment or the recruitment of an external candidate to the Board.
For such appointments, and unless agreed otherwise with the new director, the Company will honour the contractual entitlements and other incentives (e.g. options granted under the NEXT Share Matching Plan) awarded prior to the Board appointment.
For external recruits, the Committee will also aim to structure and agree a package which is in line with the same policies for existing executive directors as set out above. However, consistent with the reporting regulations, the Committee reserves the right not to apply the caps contained within the policy for fixed pay, either on joining or for any subsequent review within the life of this policy, although the Committee would not envisage exceeding these caps in practice. In addition, the Committee may offer cash or share-based incentives when considered to be necessary to secure a candidate and in the best interests of the Company and its shareholders. It may be necessary to make such awards on more bespoke terms which differ from NEXT’s existing annual and share-based pay structures. Depending on the timing of an appointment it may be necessary to use different performance criteria to other executive directors for any initial incentive awards. However, the Committee will not authorise the payment of more than it considers necessary and will abide by the caps for such elements within the general policy.
Additional awards may be made to compensate for forfeiture of incentive awards in the previous employer, and may not be subject to the caps applied to NEXT’s annual bonus plan or the LTIP. All such awards for external appointments, whether made under the annual bonus plan, LTIP or otherwise, will be limited to the commercial value of the amounts forfeited and will take account of the nature, time periods and performance requirements of those awards. In particular, the Committee’s starting point will be that any forfeited awards which are subject to continued service or performance requirements are replaced by NEXT awards with broadly equivalent terms. However, the Committee may relax these requirements in exceptional circumstances and where the Committee considers it to be less expensive for shareholders, for example where service periods are materially complete and/or the replacement awards are materially discounted to reflect the conditions on forfeited awards. The Committee will only authorise guaranteed or non pro-rated awards under the annual bonus plan where the Committee considers it is necessary to secure a recruitment and these would be limited to no more than the first year of appointment.
For external and internal appointments, the Committee may agree that the Company will meet such reasonable relocation expenses it considers appropriate and/or make a contribution towards legal fees in agreeing employment terms.
The Company has not made an external appointment of an executive director for over 28 years and therefore this policy, which remains materially unchanged from the last approved policy, has not been used since its implementation. All such appointments during this time have been through internal promotions, so it is challenging to set out principles for an event that has not occurred in recent practice. Therefore, the above broad policy, particularly for external appointments, represent guidelines considered to be reasonable by the Committee, but which will be considered on the merits of each potential appointment on a case by case basis and taking account of evolving best practice.
Exercise of discretionIn line with market practice, the Committee retains discretion in relation to the operation and administration of the annual bonus, Deferred Share Bonus Plan and LTIP. This discretion includes, but is not limited to:
• the timing of awards and payments;
• the size of awards, within the overall limits disclosed in the policy table;
• the determination of vesting;
• the treatment of awards in the case of change of control or restructuring;
• the treatment of leavers within the rules of the plan and the termination policy summary shown on page 67; or
• adjustments needed in certain circumstances (for example, rights issue, corporate restructuring or special interim dividend).
While performance conditions will generally remain unchanged once set, the Committee has the usual discretions to amend the measures, weightings and targets in exceptional circumstances (such as a major transaction) where the unamended
Financial Statements
Sharehold
er Inform
ation
69n e x t p l c . c o . u k
Strategic R
epo
rtG
overnance

slugline
conditions would cease to operate as intended. Any such changes would be explained in the subsequent annual remuneration report and, if appropriate, be the subject of consultation with the Company’s major shareholders. Consistent with best practice, the LTIP rules also provide that any such amendment must not make the amended condition materially less difficult to satisfy than the original condition was intended to be prior to the occurrence of such event.
Adjustment to number of shares under deferred bonus and LTIPThe number of shares subject to deferred bonus and LTIP awards may be increased to reflect the value of dividends that would have been paid in respect of any dates falling between the grant of awards and the date of vesting.
The terms of incentive plan awards may be adjusted in the event of a variation of the Company’s share capital, demerger or a similar event that materially affects the price of the shares or otherwise in accordance with the plan rules.
Share ownership guidelines Share ownership guidelines do not form part of directors’ remuneration but the Committee has determined that these should be observed by executive directors.
The minimum shareholding is 2 times salary for all executive directors (previously 1.5 times for the Chief Executive and 1 times for other executive directors). An executive director has up to five years from date of appointment to acquire the minimum shareholding and only shares owned beneficially are counted.
Legacy commitmentsThe Committee reserves the right to honour all historic contractual entitlements and other incentives provided they were consistent with the shareholder approved policy in place at the time they were agreed. Any such payments would be disclosed in the relevant Annual Remuneration Report as necessary.
Stating maximum amounts for each element of remunerationWhere the above policy refers to the maximum amounts that may be paid in respect of any element of the policy (as required under the Regulations) these will operate simply as caps and will not be indicative of any aspiration.
Consideration of shareholder views During the year, the Committee consulted extensively with our largest shareholders and their representative bodies on our proposed changes to the Remuneration Policy. We were pleased by the level and quality of engagement and the support we received for our proposals. The specific shareholder views about remuneration are also communicated to the Committee on an ongoing basis through inclusion in Board reports of shareholder feedback and statements made by representative associations. The Committee remains committed to ongoing dialogue and shareholders and representative bodies are able to contact the Committee Chairman directly if they have any concerns regarding remuneration.
Pay and performance scenario analysis The Committee’s objective is to ensure that the remuneration paid to senior executives is appropriate in both amount and structure, is directly linked to the Company’s annual and longer term performance and aligned with the interests of shareholders. Careful consideration is given to ensuring there is an appropriate balance in the remuneration structure between annual and long term rewards, as well as between cash and share-based payments.
The charts opposite indicate the level of remuneration that could be received by each executive director in accordance with the directors’ Remuneration Policy in the first year to which the new policy applies (i.e. year to January 2018) at different levels of performance. These scenarios do not take into account share price movement or dividends received. For simplicity the value of any potential all-employee award has been ignored.
The Committee has a conservative approach to overall levels of executive pay. Variable pay is linked to measures which are aligned with the Company’s long term strategy and objectives. The overall level of executive director pay remains modest compared with that available at other FTSE 100 companies and the chosen maximum remuneration indicated in the charts opposite reflects the Committee’s conservative approach to executive pay which it considers is appropriate.
Remuneration Report
70 n e x t p l c . c o . u k
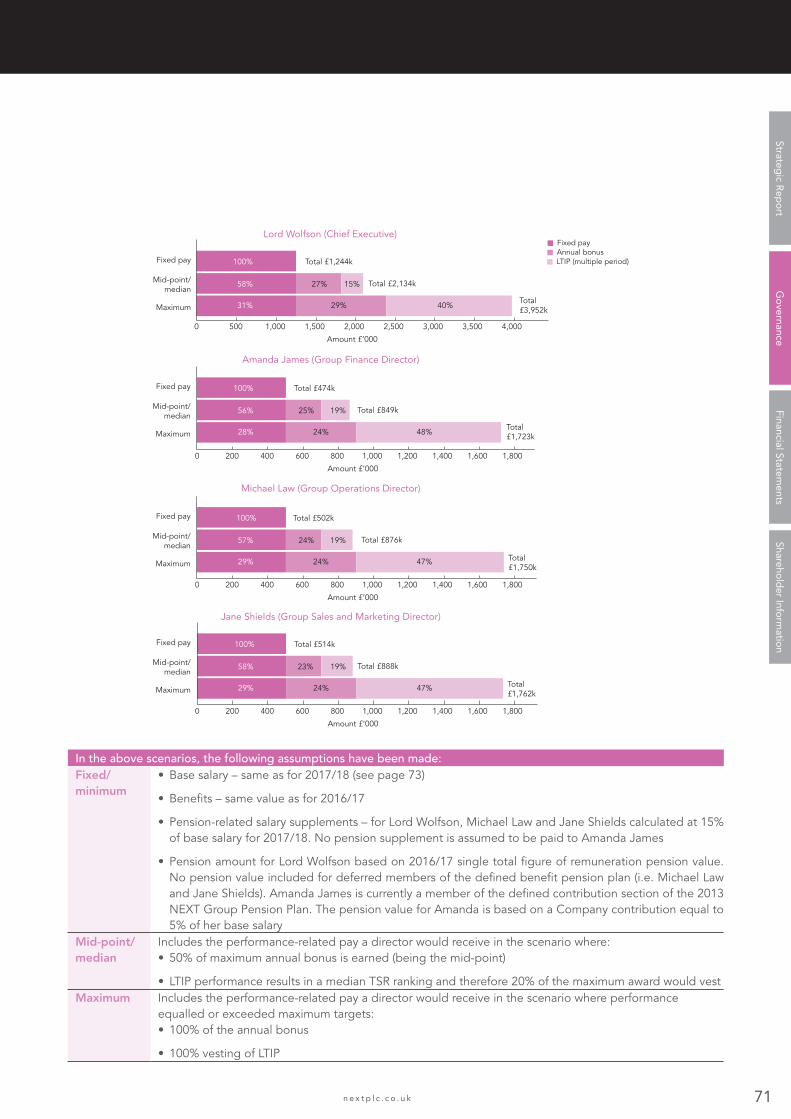
slugline
Lord Wolfson (Chief Executive)
1,000 1,5005000 2,000 2,500
Amount £’000
3,000 3,500 4,000
Fixed payAnnual bonusLTIP (multiple period)Fixed pay
Mid-point/median
Maximum
100%
58%
31%
27%
Total £1,244k
Total £2,134k
Total £3,952k 29%
15%
40%
Michael Law (Group Operations Director)
400 6002000 800 1,000 1,200 1,400 1,600 1,800
Fixed pay
Mid-point/median
Maximum
100%
57%
29%
24%
24%
19%
47%
Total £502k
Total £876k
Total £1,750k
Amount £’000
Fixed payAnnual bonusLTIP (multiple period)
Amanda James (Group Finance Director)
400 6002000 800 1,000 1,200 1,400 1,600 1,800
Fixed pay
Mid-point/median
Maximum
100%
56%
28%
25%
24%
19%
48%
Total £474k
Total £849k
Total £1,723k
Amount £’000
Fixed payAnnual bonusLTIP (multiple period)
Jane Shields (Group Sales and Marketing Director)
400 6002000 800 1,000 1,200 1,400 1,600 1,800
Fixed pay
Mid-point/median
Maximum
100%
58%
29%
23%
24%
19%
47%
Total £514k
Total £888k
Total £1,762k
Amount £’000
Fixed payAnnual bonusLTIP (multiple period)
In the above scenarios, the following assumptions have been made: Fixed/ minimum
• Base salary – same as for 2017/18 (see page 73)
• Benefits – same value as for 2016/17
• Pension-related salary supplements – for Lord Wolfson, Michael Law and Jane Shields calculated at 15% of base salary for 2017/18. No pension supplement is assumed to be paid to Amanda James
• Pension amount for Lord Wolfson based on 2016/17 single total figure of remuneration pension value. No pension value included for deferred members of the defined benefit pension plan (i.e. Michael Law and Jane Shields). Amanda James is currently a member of the defined contribution section of the 2013 NEXT Group Pension Plan. The pension value for Amanda is based on a Company contribution equal to 5% of her base salary
Mid-point/ median
Includes the performance-related pay a director would receive in the scenario where: • 50% of maximum annual bonus is earned (being the mid-point)
• LTIP performance results in a median TSR ranking and therefore 20% of the maximum award would vestMaximum Includes the performance-related pay a director would receive in the scenario where performance
equalled or exceeded maximum targets: • 100% of the annual bonus
• 100% vesting of LTIP
Financial Statements
Sharehold
er Inform
ation
71n e x t p l c . c o . u k
Strategic R
epo
rtG
overnance

slugline
Remuneration Report
NEXT employment conditions generally Pay structures and employment conditions for other Group employees are driven by market and role comparatives and are also considered by the Committee to ensure that any differences for directors are justified. Salary increases for the wider employee group are taken into consideration when determining increases for executive directors and senior management.
In common with executive directors, all other employees are eligible to participate in annual bonus arrangements. The targets for these are linked to performance of the group, their operating function or personal performance.
These other employees are provided with a competitive package of benefits that includes the opportunity to participate in the Group’s pension arrangements and staff discount on Group merchandise. In addition, the NEXT Management Share Option Plan provides for options over shares, exercisable between three and ten years following their grant, to be allocated to Group employees. This plan is primarily aimed at middle management and senior store staff. Options are set at the prevailing market price at the time of grant, and are generally granted annually.
The Company also operates a Share Matching Plan for certain senior managers below Board level to encourage them to invest in shares in the Company and receive a related matching award of shares based on certain underlying fully diluted post-tax EPS targets being achieved which are set by the Remuneration Committee.
In order to encourage wider employee share ownership, the Company also operates all-employee Save As You Earn share schemes in the UK and Eire, in which all permanent employees (including executive directors) are eligible to participate. As shareholders, these employees have the opportunity to express their views in the same way as other shareholders.
The Company did not consult with employees when drawing up the directors’ Remuneration Policy. The Committee does not generally use any formal internal comparison metrics when setting directors’ remuneration, other than the consideration of employee pay as described above, but has sought advice from FIT Remuneration Consultants LLP from time to time on the appropriateness and competitiveness of remuneration structures in place within the Company.
Part 3: Annual Remuneration ReportContents
This report comprises a number of sections:
Implementation of Remuneration Policy in 2016/17 page 73 Payments for loss of office page 82Single total figure of remuneration page 74 Company performance and CEO remuneration comparison page 82Executive directors’ external appointments page 76 Change in remuneration of Chief Executive page 83Pension entitlements page 76 Relative importance of spend on pay page 83Directors’ shareholding and share interests page 77 Dilution of share capital by employee share schemes page 83Scheme interests awarded during the financial year page 80 Remuneration Committee page 84Performance targets for outstanding awards page 80 Voting outcomes at General Meetings page 84Payments to past directors page 81 Service contracts page 85
Annual remuneration reportThe Remuneration Committee presents the annual remuneration report, which, together with the Chairman’s introduction on pages 58 to 62, will be put to shareholders as an advisory (non-binding) vote at the Annual General Meeting to be held on 18 May 2017. Sections which have been subject to audit are noted accordingly.
72 n e x t p l c . c o . u k

slugline
Implementation of remuneration policy in 2016/17The Committee has implemented the Remuneration Policy in accordance with the policy approved by shareholders at the AGM in May 2014. The table below sets out the way that the policy was implemented in 2016/17 and any significant changes in the way the policy will be implemented in 2017/18.
Element of remuneration
Policy implemented during 2016/17 and changes in 2017/18
Base salary The base salary of Lord Wolfson, Michael Law and Jane Shields increased by 1% in February 2017, in line with the wider Company award. For details about the base salary increase for Amanda James please refer to page 60. The base salaries for the executive directors from February 2017 are:
£000 2017/18 2016/17
Lord Wolfson 773 766Amanda James 416 360Michael Law 416 412Jane Shields 416 412
Annual bonus Annual bonus is calculated on pre-tax EPS and we ensure that the executive directors are not incentivised to recommend share buybacks in preference to special dividends, or vice versa. This is achieved by making a notional adjustment to EPS for special dividends, on the basis that the cash distributed had instead been used to purchase shares at the prevailing share price on the day of the special dividend payment.
For the year to January 2017, performance targets were set requiring pre-tax EPS growth on the prior year, adjusted for special dividends and excluding exceptional gains, of 5% before any bonus became payable (being pre-tax EPS of 583p). Maximum bonus of 100% and 150% of salary for the executive directors and Chief Executive respectively was payable if pre-tax EPS exceeded growth of 15% (being pre-tax EPS of 638p).
Pre-tax EPS growth achieved in the year, adjusted for special dividends, was -0.2%. In accordance with the bonus formula, no bonus was earned.
As detailed on page 64, the annual bonus plan will remain unchanged in terms of the application of stretching financial measures and the maximum amounts payable, however it is proposed in the new Remuneration Policy that participants will be entitled to receive ordinary and special dividend accruals on any awards vesting under the deferred bonus award.
Bonus performance targets for the year ahead have been set but are not disclosed in advance for reasons of commercial sensitivity. The targets and performance will be disclosed in next year’s Remuneration Report.
LTIP No change in 2016/17. See Single Total Figure of Remuneration table, Note 5 for details of LTIP vestings in the year.
As detailed on page 59, it is proposed in the new Remuneration Policy that participants will be entitled to receive ordinary and special dividend accruals on any awards vesting under the LTIP.
Grants in 2017/18 will be otherwise made on the same basis to the 2016/17 grants (with any changes to the TSR comparator group confirmed immediately prior to each grant).
Recovery and withholding provisions
No change. The Committee previously introduced recovery and withholding provisions in the service contracts of all executive directors to cover the bonus and LTIP, and a 5 year from grant holding period (comprising a 3 year vesting period and a 2 year holding period) under the LTIP for executive directors. The Committee reconsidered these requirements during the year and concluded that these provisions remain appropriate.
SMP No change and, with effect from 2014, executive directors are no longer eligible to receive new grants under the SMP.
Chairman and non-executive director fees
The fees of the Chairman and non-executive directors were increased by 1% in February 2017, in line with the wider Company award. The Chairman, John Barton, will be paid an annual fee of £270,635 (2016/17: £267,955). The basic non-executive director fee for 2017/18 is £55,720 (2016/17: £55,168), with a further £11,144 (2016/17: £11,033) paid to the Chairman of each of the Audit and Remuneration Committees respectively, and to the Senior Independent Director.
Michael Roney was appointed as an independent non-executive director, Deputy Chairman and Chairman Designate with effect from 14 February 2017. Michael will succeed John Barton as Chairman when he retires on 1 August 2017. Michael will be paid an annual fee of £162,500 up until 31 July 2017, thereafter he will be paid an annual fee of £325,000.
Pension No material change.Other benefits No material change.Sharesave No material change.
Financial Statements
Sharehold
er Inform
ation
73n e x t p l c . c o . u k
Strategic R
epo
rtG
overnance

slugline
Rem
uner
atio
n R
epo
rt
Sing
le t
ota
l fig
ure
of r
emun
erat
ion
(aud
ited
info
rmat
ion)
Dire
cto
rs’ r
emun
erat
ion
Fixe
d p
ay
Per
form
ance
–rel
ated
pay
£000
Sala
ry/f
ees
Ben
efit
s1P
ensi
on2
Sala
ry
sup
ple
men
t3Su
bto
tal
Ann
ual
bo
nus4
LTIP
5
Shar
e M
atch
ing
P
lan6
Shar
esav
eSu
bto
tal
Tota
lre
mun
erat
ion
2016
/17
2015
/16
2016
/17
2015
/16
2016
/17
2015
/16
2016
/17
2015
/16
2016
/17
2015
/16
2016
/17
2015
/16
2016
/17
2015
/16
2016
/17
2015
/16
2016
/17
2015
/16
2016
/17
2015
/16
2016
/17
2015
/16
Cha
irm
anJo
hn B
arto
n26
826
3–
––
––
–26
826
3–
––
––
––
––
–26
826
3
Exe
cuti
ve d
irec
tors
Lord
Wol
fson
766
751
7777
278
184
115
113
1,23
61,
125
–50
360
62,
193
–47
4–
–60
63,
170
1,84
24,
295
Am
and
a Ja
mes
*36
025
337
2218
13–
–41
528
8–
136
9131
364
831
–15
653
257
182
0M
icha
el L
aw41
240
423
2328
–62
6152
548
8–
182
200
502
–12
7–
–20
081
172
51,
299
Jane
Shi
eld
s 41
240
435
3225
–62
6153
449
7–
182
200
502
–12
71
–20
181
173
51,
308
No
n-ex
ecut
ive
dir
ecto
rsSt
eve
Bar
ber
6665
––
––
––
6665
––
––
––
––
––
6665
Jona
than
Bew
es †
18n/
a–
––
––
–18
n/a
––
––
––
––
––
18n/
aC
arol
ine
Goo
dal
l •66
62–
––
––
–66
62–
––
––
––
––
–66
62Fr
anci
s Sa
lway
•66
62–
––
––
–66
62–
––
––
––
––
–66
62
Dam
e D
iann
e Th
omps
on55
54–
––
––
–55
54–
––
––
––
––
–55
542,
489
2,31
817
215
434
919
723
923
53,
249
2,90
4–
1,00
31,
097
3,51
064
811
2–
1,16
35,
324
4,41
28,
228
* A
man
da
Jam
es jo
ined
the
Boa
rd o
n 1
Ap
ril 2
015.
Val
ues
dis
clos
ed fo
r 201
5/16
sal
ary,
ben
efits
and
pen
sion
rela
te o
nly
to th
e p
erio
d o
f her
exe
cutiv
e d
irect
orsh
ip d
urin
g th
at y
ear.
Perf
orm
ance
-rel
ated
rem
uner
atio
n in
clud
es p
ay
rela
ting
to
the
per
iod
bef
ore
she
bec
ame
an e
xecu
tive
dire
ctor
but
pai
d a
fter
her
ap
poi
ntm
ent.
Exe
cutiv
e d
irect
or b
onus
ear
ned
for
2015
/16
(45%
) was
ap
plie
d t
o A
man
da’
s fu
ll ye
ar s
alar
y as
Am
and
a ha
d s
tart
ed h
er t
rans
ition
to
the
role
of G
roup
Fin
ance
Dire
ctor
prio
r to
the
dat
e sh
e jo
ined
the
Boa
rd.
† J
onat
han
Bew
es jo
ined
the
Boa
rd in
Oct
ober
201
6.
• C
arol
ine
Goo
dal
l bec
ame
Rem
uner
atio
n C
omm
ittee
Cha
irman
and
Fra
ncis
Sal
way
bec
ame
Seni
or In
dep
end
ent
Dire
ctor
in M
ay 2
015.
Tota
l em
olum
ents
pai
d t
o d
irect
ors
(sal
ary/
fees
, ben
efits
, sal
ary
sup
ple
men
ts a
nd a
nnua
l bon
us) f
or t
he y
ear
to J
anua
ry 2
017
wer
e £2
,900
,000
(201
6: £
3,83
2,00
0).
74 n e x t p l c . c o . u k

slugline
No
te 1
: Ben
efit
s Car
/cha
uffe
ur
char
ges
/cas
h
allo
wan
ce
Fuel
Med
ical
insu
ranc
e
& N
EXT
clot
hing
allo
wan
ceTo
tal
2016
/17
£000
2015
/16
£000
2016
/17
£000
2015
/16
£000
2016
/17
£000
2015
/16
£000
2016
/17
£000
2015
/16
£000
Lord
Wol
fson
6666
88
33
7777
Am
and
a Ja
mes
2615
85
32
3722
Mic
hael
Law
2020
––
33
2323
Jane
Shi
eld
s25
237
73
235
32
No
te 2
: Pen
sio
nD
efin
ed B
enef
it (D
B) p
ensi
on v
alue
s ar
e ca
lcul
ated
usi
ng t
he m
etho
d r
equi
red
by
rem
uner
atio
n re
gul
atio
ns, i
.e.
the
tota
l pen
sion
acc
rued
at J
anua
ry 2
017
less
the
tota
l pen
sion
acc
rued
at t
he e
nd o
f the
pre
viou
s ye
ar, a
dju
sted
fo
r inf
latio
n an
d m
ultip
lied
by
a fa
ctor
of 2
0, le
ss th
e d
irect
or’s
own
cont
ribut
ion.
It d
oes
not n
eces
saril
y re
pre
sent
th
e ec
onom
ic v
alue
of
the
pen
sion
rig
hts
accr
ued
and
thi
s b
enef
it is
not
imm
edia
tely
ava
ilab
le t
o th
e d
irect
or.
Con
sist
ent
with
oth
er s
taff
par
ticip
atin
g i
n th
e p
lans
, d
irect
ors’
sal
arie
s ar
e fr
ozen
for
DB
pen
sion
pur
pos
es a
t O
ctob
er 2
012,
but
dire
ctor
s m
ay c
ontin
ue t
o ac
crue
pen
sion
able
ser
vice
.
In s
umm
ary,
the
pen
sion
ent
itlem
ents
of
the
dire
ctor
s w
ho w
ere
mem
ber
s of
the
DB
sec
tion
of t
he 2
013
NEX
T G
roup
Pen
sion
Pla
n d
urin
g t
he y
ear
are
as fo
llow
s:
Ag
e at
Ja
nuar
y 20
17
Year
s of
p
ensi
onab
le
serv
ice
Acc
rued
an
nual
p
ensi
on
£000
Cha
nge
in
accr
ued
an
nual
p
ensi
on
£000
Cha
nge
in
accr
ued
an
nual
p
ensi
on (n
et
of in
flatio
n)£0
00
Lord
Wol
fson
4922
371
1616
Mic
hael
Law
5525
125
11
Jane
Shi
eld
s53
1912
11
1
Year
s of
pen
sion
able
ser
vice
sho
wn
abov
e m
ay i
nclu
de
bou
ght
-in s
ervi
ce f
rom
the
tra
nsfe
r of
oth
er p
ensi
on
entit
lem
ents
into
the
Pla
n. D
irect
ors’
pen
sion
arr
ang
emen
ts a
re s
ubje
ct t
o th
e sa
me
actu
aria
l red
uctio
n as
oth
er
emp
loye
es o
n te
rmin
atio
n or
ear
ly re
tirem
ent.
Am
and
a Ja
mes
is a
mem
ber
of t
he D
efin
ed C
ontr
ibut
ion
sect
ion
of t
he 2
013
NEX
T G
roup
Pen
sion
Pla
n an
d t
he
Com
pan
y cu
rren
tly m
akes
a c
ontr
ibut
ion
equa
l to
5% o
f her
sal
ary
into
her
pen
sion
pla
n.
No
te 3
: Sal
ary
sup
ple
men
t in
lieu
of
pen
sio
nSu
pp
lem
ents
of
15%
of
bas
e sa
lary
are
pai
d i
n lie
u of
pen
sion
pro
visi
on a
fter
the
dire
ctor
s b
ecam
e d
efer
red
m
emb
ers
of t
he D
B s
ectio
n of
the
NEX
T G
roup
Pen
sion
Pla
n. J
ane
Shie
lds
has
rece
ived
thi
s su
pp
lem
ent
from
20
11, a
nd M
icha
el L
aw a
nd L
ord
Wol
fson
from
201
2.
No
te 4
: Ann
ual b
onu
sD
etai
ls o
f the
per
form
ance
tar
get
s fo
r th
e an
nual
bon
us a
re s
et o
ut o
n p
age
73. F
or t
he y
ear
to J
anua
ry 2
017,
in
acco
rdan
ce w
ith t
he b
onus
form
ula,
no
bon
us w
as a
war
ded
to
any
exec
utiv
e d
irect
or.
To p
rovi
de
a re
tent
ion
elem
ent
in t
he c
ase
of t
he C
hief
Exe
cutiv
e, a
ny a
nnua
l bon
us in
exc
ess
of 1
00%
of
bas
e sa
lary
is p
ayab
le in
sha
res,
def
erre
d f
or a
per
iod
of
two
year
s an
d s
ubje
ct t
o fo
rfei
ture
if h
e vo
lunt
arily
res
igns
p
rior
to t
he e
nd o
f tha
t p
erio
d.
No
te 5
: LTI
PPe
rfor
man
ce ta
rget
s fo
r the
LTI
P ar
e se
t out
on
pag
e 65
. For
the
thre
e ye
ar p
erio
d to
Jul
y 20
16, N
EXT’
s TS
R ra
nked
nu
mb
er 7
in
the
com
par
ator
gro
up o
f 21
and
61%
of
the
gra
nt m
ade
in t
he s
econ
d h
alf
of 2
013
vest
ed.
The
Com
mitt
ee r
evie
wed
the
Com
pan
y’s
finan
cial
per
form
ance
ag
ains
t un
der
lyin
g e
cono
mic
and
oth
er c
ond
ition
s (th
e ‘e
cono
mic
und
erp
in’)
and
not
ed t
hat,
dur
ing
thi
s p
erio
d, t
he C
omp
any’
s co
mp
ound
ave
rag
e an
nual
gro
wth
in
und
erly
ing
EPS
and
pre
-tax
pro
fits
was
11.
4% a
nd 8
.3%
resp
ectiv
ely,
sig
nific
antly
ahe
ad o
f RPI
(1.8
%).
Ord
inar
y d
ivid
end
s al
so in
crea
sed
bro
adly
in li
ne w
ith E
PS a
nd s
ome
£1.2
bn
was
ret
urne
d t
o sh
areh
old
ers
thro
ugh
shar
e b
uyb
acks
and
sp
ecia
l d
ivid
end
s. T
he C
omp
any’
s p
erfo
rman
ce a
lso
com
par
ed f
avou
rab
ly a
gai
nst
its p
rinci
pal
re
tail
com
pet
itors
and
FTS
E 10
0 co
mp
anie
s. T
he C
omm
ittee
con
firm
ed th
at th
e ec
onom
ic u
nder
pin
per
form
ance
co
nditi
on h
ad b
een
satis
fied
and
, as
a co
nseq
uenc
e, 6
1% o
f the
aw
ard
ves
ted
.
For
the
thre
e ye
ar p
erio
d t
o Ja
nuar
y 20
17,
NEX
T’s
TSR
rank
ed n
umb
er 1
1 in
a c
omp
arat
or g
roup
of
21 w
hich
g
ives
an
exp
ecte
d v
estin
g o
f 20
% o
f th
e aw
ard
mad
e in
Jan
uary
201
4. In
Mar
ch 2
017
the
Com
mitt
ee r
evie
wed
th
e C
omp
any’
s fin
anci
al p
erfo
rman
ce o
n th
e sa
me
bas
is a
s d
escr
ibed
ab
ove
and
not
ed t
hat
dur
ing
thi
s p
erio
d,
the
Com
pan
y’s
com
pou
nd a
nnua
l gro
wth
in u
nder
lyin
g E
PS a
nd p
re-t
ax p
rofit
was
6.4
% a
nd 4
.4%
res
pec
tivel
y,
sig
nific
antly
ahe
ad o
f RP
I 1.
7%.
Ord
inar
y d
ivid
end
s in
crea
sed
by
7% o
ver
the
per
form
ance
per
iod
and
£1.
1bn
was
ret
urne
d t
o sh
areh
old
ers
thro
ugh
shar
e b
uyb
acks
and
sp
ecia
l div
iden
ds.
The
Com
pan
y’s
per
form
ance
als
o co
mp
ared
pos
itive
ly a
gai
nst i
ts p
rinci
pal
reta
il co
mp
etito
rs a
nd F
TSE
100
com
pan
ies.
The
Com
mitt
ee c
onfir
med
th
at th
e ec
onom
ic u
nder
pin
per
form
ance
con
diti
on h
ad b
een
satis
fied
and
, as
a co
nseq
uenc
e, 2
0% o
f the
aw
ard
ve
sted
.
LTIP
val
ues
incl
uded
in t
he 2
016/
17 s
ing
le fi
gur
e ta
ble
com
pris
e th
e ac
tual
val
ue o
f aw
ard
s th
at h
ave
vest
ed fo
r th
e p
erfo
rman
ce p
erio
d e
nded
Jul
y 20
16 p
lus
the
esti
mat
ed v
alue
of
awar
ds
that
will
ves
t fo
r th
e p
erfo
rman
ce
per
iod
end
ed J
anua
ry 2
017
bas
ed o
n th
e av
erag
e N
EXT
shar
e p
rice
over
the
fina
l thr
ee m
onth
s of
the
fina
ncia
l ye
ar o
f £46
.73.
For
the
201
5/16
com
par
ativ
e fig
ures
, num
ber
s ha
ve b
een
calc
ulat
ed a
nd u
pd
ated
to
refle
ct t
he
actu
al m
arke
t val
ues
of th
e LT
IP a
war
ds
that
ves
ted
in re
spec
t of p
erfo
rman
ce p
erio
ds
end
ing
in th
at fi
nanc
ial y
ear
(as
set
out
in t
he t
able
on
pag
es 7
8 an
d 7
9.
The
max
imum
val
ue o
f LT
IP a
war
ds
that
ves
t fo
r a
par
ticip
ant
in a
yea
r w
as p
revi
ousl
y ca
pp
ed a
t £2
.5m
. In
line
with
the
dec
isio
n m
ade
by
the
Com
mitt
ee d
urin
g 2
014/
15, t
he c
ap h
as n
ow b
een
rem
oved
so
doe
s no
t ap
ply
to
any
LTIP
s ve
stin
g in
201
6/17
or
in a
ny fu
ture
fina
ncia
l yea
rs.
No
te 6
: SM
P
Whi
lst
exec
utiv
e d
irect
ors
will
not
rece
ive
furt
her
gra
nts,
leg
acy
awar
ds
will
run
the
ir co
urse
, inc
lud
ing
tho
se t
hat
wer
e g
rant
ed t
o ex
ecut
ive
dire
ctor
s b
efor
e th
ey w
ere
pro
mot
ed t
o th
e B
oard
. The
per
form
ance
tar
get
s ar
e se
t ou
t on
pag
e 81
.
The
estim
ated
val
ue f
or t
he 2
014
awar
d g
rant
ed t
o A
man
da
Jam
es b
efor
e sh
e w
as p
rom
oted
to
the
Boa
rd
assu
mes
96%
of
the
max
imum
aw
ard
will
ves
t in
May
201
7 an
d i
s b
ased
on
the
aver
age
NEX
T sh
are
pric
e ov
er t
he t
hree
mon
ths
to J
anua
ry 2
017
of £
46.7
3. S
tron
g g
row
th in
ful
ly d
ilute
d p
ost-
tax
EPS,
as
adju
sted
for
sp
ecia
l div
iden
ds
pai
d d
urin
g t
he 3
yea
r p
erfo
rman
ce p
erio
d, w
as s
light
ly b
elow
the
30%
gro
wth
req
uire
d fo
r a
max
imum
aw
ard
to v
est a
nd th
eref
ore
it w
ill v
est a
t 96%
of t
he m
axim
um a
war
d in
May
201
7, s
ubje
ct to
con
tinue
d
emp
loym
ent.
The
SMP
valu
es fo
r 201
5/16
are
cal
cula
ted
bas
ed o
n ac
tual
mar
ket v
alue
s at
the
dat
e of
ves
ting
(as
set o
ut in
the
tab
le o
n p
ages
78
and
79.
Financial Statements
Sharehold
er Inform
ation
75n e x t p l c . c o . u k
Strategic R
epo
rtG
overnance

slugline
Remuneration Report
Executive directors’ external appointmentsNo current executive director holds any non-executive directorships outside the Group.
Pension entitlements (audited information)In 2013 all active members of the NEXT Group Pension Plan (the “Original Plan”), were transferred to the new 2013 NEXT Group Pension Plan (the “2013 Plan”) so that pensioners of the Plan could be issued individual policies with Aviva. Most deferred pensioners and pensioners who had not previously been subject to a buy-in through Aviva were also transferred to the 2013 Plan. Benefits within the 2013 Plan mirror those in the previous Original Plan.
Executive directors are members of the 2013 Plan which has been approved by HM Revenue & Customs and consists of defined benefit and defined contribution sections.
The trustee of both Plans is a limited company, NEXT Pension Trustees Limited (the “Trustee”). The Board of the Trustee currently comprises of five directors who are all members of either the Original Plan or the 2013 Plan, and an independent Chairman who has no other connection to NEXT. Two of these directors are member nominated directors and cannot be removed by NEXT. The other four directors, including the independent director, are appointed by and can be removed by NEXT. All directors of the Trustee receive a fee for their services, including those directors who are also employees of NEXT. No director of the Company is a director of the Trustee.
The Plans’ investments are kept separate from the business of the NEXT Group and the Trustee holds them in separate trusts. Responsibility for investment of the Plans’ funds has been delegated to professional investment managers.
The Group operates a salary sacrifice scheme whereby members from either section can elect to receive a reduced gross salary in exchange for enhanced employer pension contributions. The participation of members in the salary sacrifice scheme does not result in any overall increase in costs to the Group.
Defined contribution sectionEmployees of the Group can join the defined contribution section of the 2013 Plan. Members elect to pay either 3% or 5% of their pensionable earnings which is matched by the Company. For death prior to retirement, a lump sum of three times the member’s base salary at the previous April is payable along with the current value of the member’s fund.
Defined benefit sectionThe defined benefit section was closed to new members in 2000. Since 2012, the accrual of pension benefits has been based on pensionable salary frozen at October 2012, rather than final earnings. Those employees can also elect to receive up to a 15% salary supplement or additional contributions to the defined contribution section. The defined benefit section now provides members with a retirement benefit of one sixtieth or one eightieth (depending on the member’s chosen contribution rate) of pensionable earnings at October 2012 for each year of pensionable service.
Lord Wolfson and a small number of senior employees, on completion of at least 20 years’ pensionable service at age 65, receive a retirement benefit of two-thirds of pensionable earnings at October 2012, which accrues uniformly throughout their pensionable service. The deferred pensions for Jane Shields and Michael Law are based on their pensionable earnings at the time they became deferred pensioners and accrued uniformly throughout their pensionable service.
The defined benefit section provides a lump sum death in service benefit and dependants’ pensions on death in service or following retirement. In the case of ill-health retirement, only the accrued pension is payable. All benefits are subject to 2013 Plan limits. Increases to pensions in payment are at the discretion of the Trustee although pensionable service post 1997 is subject to limited price indexation. From 2006, sales and profit related bonuses were excluded from pensionable earnings and the normal retirement age under the Original Plan was increased from 60 to 65. There are no additional benefits payable to directors in the event of early retirement.
Members contribute 3% or 5% of pensionable earnings, whilst the Company currently makes contributions at the rate of 17.5%. The last full triennial actuarial valuation of the 2013 Plan was carried out as at 30 September 2016. As calculated in accordance with International Financial Reporting Standards, the net pension surplus at January 2017 was £62.9m. Further details (including details of the full actuarial valuation) are provided in Note 18 of the financial statements.
76 n e x t p l c . c o . u k

slugline
Certain members (including Lord Wolfson) whose accrued or projected pension fund value exceeds their personal lifetime allowance are provided with benefits through an unfunded, unapproved supplementary pension arrangement. The relevant members contribute towards the additional cost of providing these benefits by a payment of 5% on all pensionable earnings to the 2013 Plan. Since April 2011, where existing members have reached either the annual or lifetime pension contributions limits, the Company has offered those members the choice of leaving the defined benefit section and either joining the defined contribution section (with an enhanced Company contribution) or taking a salary supplement, in both cases equal to 10% or 15% of their salary (depending on their existing contributions and benefits).
Directors’ shareholding and share interests (audited information)Directors’ interestsAs disclosed on page 61, during the year the Remuneration Committee increased the formal share ownership requirement to 2 times salary for all executive directors (previously the Chief Executive’s minimum shareholding was 1.5 times salary and for other executive directors 1 times salary). Details of the value of each executive director’s share ownership at the 2016/17 financial year end is provided on page 61.
Directors’ interests in shares (including those of their connected persons) at the beginning and end of the financial year were as follows:
Ordinary sharesDeferred bonus
shares1 LTIP2 SMP2 Sharesave3
2017 2016 2017 2016 2017 2016 2017 2016 2017 2016Lord Wolfson 1,518,184 1,515,136 5,180 10,932 71,127 81,189 9,204 9,204 364 364Steve Barber 7,500 5,000 – – – – – – – –John Barton 14,000 14,000 – – – – – – – –Jonathan Bewes4 1,750 n/a – – – – – – – –Caroline Goodall nil nil – – – – – – – –Amanda James 17,107 14,192 – – 25,553 18,758 1,418 3,036 372 462Michael Law 27,765 24,233 – – 36,605 32,739 2,468 2,468 163 163Francis Salway 9,040 7,790 – – – – – – – –Jane Shields 57,013 53,481 – – 36,605 32,739 2,466 2,466 369 348Dame Thompson nil nil – – – – – – – –
1. Full details of the basis of allocation and terms of the deferred bonus are set out on page 64.2. The LTIP and SMP amounts above are the maximum potential awards that may vest subject to performance conditions described on pages 65, 80 and 81.3. Executive directors can participate in the Company’s Sharesave scheme (see details on page 67) and the amounts above are the options which will become
exercisable at maturity.4. Jonathan Bewes joined the Board in October 2016.
There have been no other changes to directors’ interests in the shares of the Company from the end of the financial year to 22 March 2017. Full details of directors’ interests in the shares and share options of the Company are contained in the Register of Directors’ Interests which is open to inspection at the Company’s registered office.
Financial Statements
Sharehold
er Inform
ation
77n e x t p l c . c o . u k
Strategic R
epo
rtG
overnance

slugline
Remuneration Report
The table below shows share awards held by directors and movements during the year:
Date of award
Maximum receivable at start of
financial year
Awarded during
the year
Shares vested/
exercised in the
yearOptions
lapsed
Maximum receivable at end of financial
year
Market price at
award date
£
Option price
£
Market price on date of
vesting/exercise
£Vesting date/
Exercisable dates1
Lord WolfsonDeferred bonus shares Apr 2014 5,752 – 5,752 – – 63.35 n/a 53.25 Apr 2016
Apr 2015 5,180 – – – 5,180 71.75 n/a – Apr 2017
10,932 5,180
LTIP Mar 2013 19,492 – 15,009 4,483 – 37.39 Nil 56.35 Jan 2016
Sept 2013 15,720 – 9,5892 6,1312 – 46.36 Nil 50.40 Jul 2016
Mar 2014 13,1872 – – – 13,187 56.37 Nil – Jan 2017
Sept 2014 11,421 – – – 11,421 65.09 Nil – Jul 2017
Mar 2015 11,263 – – – 11,263 66.66 Nil – Jan 2018
Sept 2015 10,106 – – – 10,106 74.29 Nil – Jul 2018
Mar 2016 – 10,360 – – 10,360 73.923 Nil – Jan 2019
Sept 2016 – 14,790 – – 14,790 51.783 Nil – Jul 2019
81,189 71,127
SMP Apr 2013 9,204 – – – 9,204 43.81 Nil – Apr 2016–Apr 2023
Sharesave Oct 2013 364 – – – 364 – 41.12 – Dec 2018–Jun 2019
Amanda JamesLTIP Mar 2013 2,783 – 2,143 640 – 37.39 Nil 56.35 Jan 2016
Sept 2013 2,244 – 1,3692 8752 – 46.36 Nil 50.40 Jul 2016
Mar 2014 2,3422 – – – 2,342 56.37 Nil – Jan 2017
Sept 2014 2,765 – – – 2,765 65.09 Nil – Jul 2017
Mar 2015 4,545 – – – 4,545 66.66 Nil – Jan 2018
Sept 2015 4,079 – – – 4,079 74.29 Nil – Jul 2018
Mar 2016 – 4,870 – – 4,870 73.923 Nil – Jan 2019
Sept 2016 – 6,952 – – 6,952 51.783 Nil – Jul 2019
18,758 25,553
SMP Apr 2013 1,618 – 1,618 – – 43.81 Nil 52.50 Apr 2016–Apr 2023
May 2014 1,418 – – – 1,418 66.50 Nil – May 2017–May 2024
3,036 1,418
Sharesave Oct 2011 198 – 198 – – – 20.84 48.77 Dec 2016–Jun 2017
Oct 2013 264 – – – 264 – 41.12 – Dec 2018–Jun 2019
Oct 2016 – 108 – – 108 – 38.25 – Dec 2021–Jun 2022
462 372
Michael LawLTIP Mar 2013 4,814 – 3,707 1,107 – 37.39 Nil 56.35 Jan 2016
Sept 2013 4,853 – 2,9602 1,8932 – 46.36 Nil 50.40 Jul 2016
Mar 2014 5,4282 – – – 5,428 56.37 Nil – Jan 2017
Sept 2014 6,145 – – – 6,145 65.09 Nil – Jul 2017
Mar 2015 6,061 – – – 6,061 66.66 Nil – Jan 2018
Sept 2015 5,438 – – – 5,438 74.29 Nil – Jul 2018
Mar 2016 – 5,575 – – 5,575 73.923 Nil – Jan 2019
Sept 2016 – 7,958 – – 7,958 51.783 Nil – Jul 2019
32,739 36,605
SMP Apr 2013 2,468 – – – 2,468 43.81 Nil – Apr 2016–Apr 2023
2,468 2,468
Sharesave Oct 2014 163 – – – 163 – 54.92 – Dec 2017–Jun 2018
78 n e x t p l c . c o . u k

slugline
Date of award
Maximum receivable at start of
financial year
Awarded during
the year
Shares vested/
exercised in the
yearOptions
lapsed
Maximum receivable at end of financial
year
Market price at
award date
£
Option price
£
Market price on date of
vesting/exercise
£Vesting date/
Exercisable dates1
Jane ShieldsLTIP Mar 2013 4,814 – 3,707 1,107 – 37.39 Nil 56.35 Jan 2016
Sept 2013 4,853 – 2,9602 1,8932 – 46.36 Nil 50.40 Jul 2016
Mar 2014 5,4282 – – – 5,428 56.37 Nil – Jan 2017
Sept 2014 6,145 – – – 6,145 65.09 Nil – Jul 2017
Mar 2015 6,061 – – – 6,061 66.66 Nil – Jan 2018
Sept 2015 5,438 – – – 5,438 74.29 Nil – Jul 2018
Mar 2016 – 5,575 – – 5,575 73.923 Nil – Jan 2019
Sept 2016 – 7,958 – – 7,958 51.783 Nil – Jul 2019
32,739 36,605
SMP Apr 2013 2,466 – – – 2,466 43.81 Nil – Apr 2016–Apr 2023
2,466 2,466
Sharesave Oct 2013 299 – – – 299 – 41.12 – Dec 2018–Jun 2019
Oct 2014 49 – – 49 – – 54.92 – Dec 2019–Jun 2020
Oct 2016 – 70 – – 70 – 38.25 – Dec 2021–Jun 2022
348 369
1. For LTIP awards, the date in this column is the end of the three year performance period. Actual vesting will be the date on which the Committee determines whether any Performance Conditions have been satisfied, or shortly thereafter.
2. See page 75 for details of the performance conditions and vesting levels applicable to the LTIP schemes with performance periods ending in the year. 3. The LTIP price at award date is NEXT’s average share price over the three months prior to the start of the performance period.4. Within the above table, all awards are subject to performance conditions except for Sharesave options and Deferred Bonus Shares. From 2014 onwards,
LTIP awards granted to executive directors which vest must be taken in shares and the net shares (after payment of tax and NIC) must be held for a minimum period of two further years.
Financial Statements
Sharehold
er Inform
ation
79n e x t p l c . c o . u k
Strategic R
epo
rtG
overnance

slugline
Remuneration Report
The aggregate gains of directors arising from the exercise of options granted under the SMP, Sharesave and LTIP that vested in the year totalled £2,325,000 (2015/16: £5,939,000).
Scheme interests awarded during the financial year ended January 2017 (audited information) LTIPFace value In respect of the LTIP awards granted during the year 2016/17, the maximum “face value” of
awards (i.e. the maximum number of shares that would vest if all performance measures are met multiplied by the average share price used to determine the award) is summarised below:
Mar 2016 £000
Sep 2016 £000
Total£000
Lord Wolfson 766 766 1,532Amanda James 360 360 720Michael Law 412 412 824Jane Shields 412 412 824
Vesting if minimum performance achieved
20% of the entitlement will be earned for relative TSR at median. Full vesting requires relative TSR at upper quintile.
Performance period March 2016 grant: three years to January 2019.
September 2016 grant: three years to July 2019.
Performance measures The LTIP performance measures are detailed on page 65. The companies in the TSR comparator group for awards granted during the financial year are:
ASOS Dunelm Marks & Spencer SupergroupB&M European Value Retail* Halfords Morrisons Ted BakerBurberry Home Retail Group* Mothercare TescoCarpetright J Sainsbury N Brown W H SmithDebenhams JD Sports Pets at Home*Dixons Carphone Kingfisher Poundland** Following the delisting of Home Retail Group and Poundland in September 2016, B&M European Value Retail and Pets at Home replaced these companies in the comparator group for the September 2016 LTIP grant.
Deferred bonusIn addition to the scheme interests detailed above, any annual bonus in excess of 100% of base salary payable to the Chief Executive is payable in shares, deferred for a period of two years and subject to forfeiture if he voluntarily resigns prior to the end of that period. No 2016/17 annual bonus was earned.
Performance targets for outstanding awardsSummarised below are the performance targets for all outstanding awards made under the LTIP and SMP schemes:
LTIPDetails of potential awards granted to executive directors for outstanding performance periods are as follows:
Three year performance periods commencing
Maximum potential award granted (% of base salary)
Lord Wolfson Amanda JamesJane Shields &
Michael LawAugust 2014 100% 60% 100%February 2015 and August 2015 100% 100% 100%February 2016 and August 2016 100% 100% 100%
80 n e x t p l c . c o . u k

slugline
Details of the comparator group for the LTIP three year performance periods commencing February 2016 and August 2016 are shown on the previous page. The comparator group for the performance periods commencing in August 2013, February 2014, August 2014, February 2015 and August 2015 is the same as for the March 2016 LTIP grant. However, for performance periods commencing August 2013 and February 2014, Poundland was not included in the comparator group.
Following the acquisition by J Sainsbury of Home Retail Group in September 2016, Home Retail Group was delisted from the London Stock Exchange. For the LTIP grants prior to that time, J Sainsbury and Home Retail Group will continue as two separate entries with their relative TSRs being measured on pre (independent) and post (identical) takeover performance over each performance period.
Poundland was also delisted following its acquisition in September 2016. For the LTIP grants prior to that time which included Poundland in the comparator group, from September 2016, the relative TSR of B&M European Value Retail replaces that of Poundland.
Following the merger of Carphone Warehouse and Dixons Retail in August 2014, for LTIP grants prior to that time, Carphone Warehouse and Dixons continued as two entries and their relative TSRs were measured on a pre (independent) and post (identical) merger performance over each performance period.
SMP (legacy only)While the Committee decided in 2014 that executive directors should no longer participate in the SMP, legacy awards will run their course. The SMP remains open to a small number of senior executives below Board level.
Vesting of awards is dependent solely on achieving the underlying fully diluted post-tax EPS targets detailed below. Under the formulae, a notional adjustment is made to actual EPS achieved for special dividends, on the basis that the cash distributed had instead been used to purchase shares at the prevailing share price on the day of the special dividend payment.
Date of grantRequired underlying fully diluted EPS (pence)
For 0.5:1 match For 1:1 match For 2:1 match 2016/17 actualMay 2014 388.8 409.6 451.2 426.2*
These targets require a minimum three year growth in EPS of 12% before any shares vest and a maximum award is only achieved if EPS growth reaches 30% over three years. The effective matching ratio will be calculated on a straight line basis for EPS falling between each of the threshold points. The same EPS growth performance targets and matching ratios were also set for the April 2015 and May 2016 SMPs (which were not granted to executive directors, although those executives who subsequently joined the Board retain awards granted prior to their joining the Board). Details of the calculation of fully diluted EPS are provided in Note 8 of the financial statements.
* The growth in underlying fully diluted EPS for the 2014 SMP performance period was 23%. After adjustment for special dividends, this increased to 29% and therefore 96% of the maximum 2014 SMP award will vest in May 2017, subject to continued employment of participants.
Payments to past directors (audited information)David Keens stepped down from the Board on 1 April 2015 and retired from the business in May 2015. He received no compensation payments in lieu of notice or otherwise. During the financial year 2016/17 and in relation to two LTIP awards which vested after he retired, David Keens received shares valued at £438k as at the dates of vesting. In April 2016 he exercised his award under the 2013 SMP and he received shares valued at £244k at that date. As a ‘good leaver’, his entitlement to these LTIP and SMP awards was time pro-rated proportionately to his actual period of service. He has no further outstanding LTIP and SMP awards.
Andrew Varley stepped down from the Board in May 2013 and continued in his role as Group Property Director until he retired in May 2014. Again, he received no compensation payments in lieu of notice or otherwise. During the financial year 2016/17 he was paid £119k in relation to an LTIP award which vested. As a ‘good leaver’, his LTIP entitlement was time pro-rated proportionately to his actual period of service. He has no further outstanding LTIP and SMP awards.
There were no other payments made to past directors.
Financial Statements
Sharehold
er Inform
ation
81n e x t p l c . c o . u k
Strategic R
epo
rtG
overnance

slugline
Remuneration Report
Payments for loss of office (audited information)There were no payments made to any director in respect of loss of office.
Performance and CEO remuneration comparisonPerformance graphThe graph below illustrates the TSR performance of the Company when compared with the FTSE All Share and FTSE General Retailers indices. These have been selected to illustrate the Company’s total shareholder return performance against a wide UK index and a sector specific index for the eight year period ended January 2017.
2009 2010
660
580
500
420
340
260
180
100
20
NEXT FTSE All Share
Re-based to 31 January 2009 = 100
FTSE General Retailers
NEXT plc performance chart 2009-2017 Total Shareholder Return
740
820
2011 2012 2013 2014 2015 2016 2017
Analysis of Chief Executive’s pay over 8 yearsThe table below sets out the remuneration for Lord Wolfson who has been the Chief Executive throughout this period.
Financial year to January 2010 2011 2012 2013 2014 2015 2016 2017Single figure of total remuneration £000
2,833 3,010 4,106 4,630 4,646 4,660 4,295 1,842
Annual bonus pay-out against maximum opportunity1
100% 100% 72% 99% 100% 100% 45% 0%
LTIP pay-out against maximum opportunity2
100% 65% Two semi-annual awards
vested at100% and
83%, however total value capped at
£2.5m
Two semi-annual awards
vested at 96% and
98%, however total value capped at
£2.5m
Two semi-annual awards
vested at 100% each,
however total value capped at
£2.5m
Two semi-annual awards
vested at 100% each,
however total value capped at
£2.5m
Two semi-annual awards
vested at 76% and
77%
Two semi-annual awards
vested at 61% and
20%
SMP pay-out against maximum opportunity
n/a n/a n/a Entitlement waived3
Entitlement waived3
Did not participatein 2012–15
SMP
100% n/a
1. The maximum bonus for the Chief Executive is 150% of salary.2. The first of semi-annual, rather than annual, awards vested in July 2011.3. Lord Wolfson waived his entitlement to SMP awards in these years. Had he not done so, his total remuneration would have been £8,947k for the financial
year to January 2014 and £7,601k for the financial year to January 2013.
82 n e x t p l c . c o . u k

slugline
Change in remuneration of Chief ExecutiveThe table below shows the percentage changes in Lord Wolfson’s remuneration (i.e. salary, taxable benefits and annual bonus) between 2015/16 and 2016/17 compared with the percentage changes in the average of each of those components of pay for Group employees in the UK and Eire. This group has been selected as the most appropriate comparator and represents over 87% of the Group’s workforce.
Salary% change
Annualbonus
% change
Taxable benefits
% changeLord Wolfson +2.0% -100.0% +0.2%UK/Eire Employees (average per FTE) +3.5% -32.8% +11.1%
Relative importance of spend on payThe graph below illustrates for the years 2016/17 and 2015/16 the relative and actual spend on total remuneration paid to all employees of the Group together with other significant distributions and payments (i.e. for share buybacks/special dividends and ordinary dividends).
£226.9m
£150.7mBuybacks
£88.3mSpecialdividends
£340.6mSpecialdividends
£600.6m
£275.9m
£491.3m
£594.6m
£225.8m
All employee remuneration compared with other disbursements
Total wages and salaries Buybacks andspecial dividends
Ordinary dividends
2016/17
2015/16
£187.6mBuybacks
Dilution of share capital by employee share plansThe Company monitors and complies with dilution limits in its various share scheme rules and has not issued a significant number of new or treasury shares in satisfaction of share schemes in the last 10 years. Share-based incentives are in most cases satisfied from shares purchased and held by the ESOT (refer to Note 23 of the financial statements).
Financial Statements
Sharehold
er Inform
ation
83n e x t p l c . c o . u k
Strategic R
epo
rtG
overnance

slugline
Remuneration Report
Consideration of matters relating to directors’ remunerationRemuneration CommitteeDuring the year the Committee comprised the following independent non-executive directors:
Caroline Goodall (Committee Chairman)Steve BarberJohn BartonJonathan Bewes (from October 2016)Francis SalwayDame Dianne Thompson
The Committee met seven times during the year under review and all meetings were fully attended.
Role of Remuneration CommitteeThe Committee determines the remuneration of the Group’s Chairman and executive directors, and reviews that of senior executives. It is also responsible for determining the targets for performance-related pay schemes, approves any award of the Company’s shares under share option or incentive schemes to employees, and oversees any major changes in employee benefit structures. The Committee members have no conflicts of interest arising from cross-directorships and no director is permitted to be involved in any decisions as to his or her own remuneration. The remuneration of non-executive directors is decided by the Chairman and executive directors of the Board. The Committee’s terms of reference are available on the Company’s website (www.nextplc.co.uk) or on request from the Company Secretary.
Assistance to the CommitteeDuring the period the Committee received input from the Chief Executive and the Group Finance Director. Aon Hewitt Ltd and FIT Remuneration Consultants LLP (FIT) also provided independent external advice, including updates on legislative requirements, best practice, and other matters of a technical nature and related to share plans.
Aon Hewitt and FIT have no other connection with the Company and were appointed by the Committee based on their expertise in the relevant areas of interest. Based on the nature of the advice, the relatively small fees and no other connection existing with these advisers, the Committee was satisfied that the advice received was objective and independent. Aon Hewitt and FIT are members of the Remuneration Consultants Group, the body that oversees the Code of Conduct in relation to executive remuneration consulting in the UK, and have confirmed to us that they adhere to its Code. PricewaterhouseCoopers LLP (PwC) provided independent verification services of total shareholder returns for NEXT and the comparator group of companies under the LTIP and other technical assistance.
During the year Aon Hewitt, FIT and PwC were each paid less than £26k for the services described above, charged at their standard hourly rates.
Voting outcomes at general meetings
Votes for%
forVotes
against%
againstTotal votes
cast
% of shares on
registerVotes
withheldTo approve the Remuneration Policy 2014 AGM 100,456,860 97.9 2,132,633 2.1 102,589,493 66.2 672,096
To approve the 2015/16 Remuneration Report 2016 AGM 102,705,670 97.6 2,558,066 2.4 105,263,736 70.4 56,641
84 n e x t p l c . c o . u k

slugline
Service contractsExecutive directorsThe Company’s policy on notice periods and in relation to termination payments is set out in the policy table on page 67. Apart from their service contracts, no director has had any material interest in any contract with the Company or its subsidiaries.
Non-executive directors Letters of appointment for the Chairman and non-executive directors do not contain fixed term periods; however, they are appointed in the expectation that they will serve for a minimum of six years, subject to satisfactory performance and re-election at Annual General Meetings.
Dates of appointment and notice periods for directors are set out below:
Date of appointment to the Board
Notice period where given by the
Company
Notice period where given by the
employeeChairmanJohn Barton 15 February 2002* 12 months 6 monthsDeputy Chairman/Chairman DesignateMichael Roney 14 February 2017 12 months 6 monthsExecutive directorsLord Wolfson 3 February 1997 12 months 6 monthsAmanda James 1 April 2015 12 months 6 monthsMichael Law 1 July 2013 12 months 6 monthsJane Shields 1 July 2013 12 months 6 monthsNon-executive directorsSteve Barber 1 June 2007 1 month 1 monthJonathan Bewes 3 October 2016 1 month 1 monthCaroline Goodall 1 January 2013 1 month 1 monthFrancis Salway 1 June 2010 1 month 1 monthDame Dianne Thompson 1 January 2015 1 month 1 month
* Appointed Chairman 17 May 2006
On behalf of the Board
Caroline Goodall Chairman of the Remuneration Committee 23 March 2017
Financial Statements
Sharehold
er Inform
ation
85n e x t p l c . c o . u k
Strategic R
epo
rtG
overnance

slugline
Independent Auditor’s Reportto the Members of NEXT plc
What we have auditedWe have audited the financial statements of NEXT plc for the 52 week period ended 28 January 2017 which comprise:
Group Parent companyConsolidated Balance Sheet Balance Sheet Consolidated Income Statement Consolidated Statement of Comprehensive Income Consolidated Statement of Changes in Equity Statement of Changes in Equity Consolidated Cash Flow Statement Group Accounting Policies and related notes 1 to 30 to the Consolidated financial statements
Related notes C1 to C6 to the financial statements
The financial reporting framework that has been applied in the preparation of the Group financial statements is applicable law and International Financial Reporting Standards (IFRSs) as adopted by the European Union. The financial reporting framework that has been applied in the preparation of the Parent Company financial statements is United Kingdom Accounting Standards comprising FRS101 “Reduced Disclosure Framework”, and applicable law (United Kingdom Generally Accepted Accounting Practice); and.
Our opinion on the financial statementsIn our opinion:
• the financial statements give a true and fair view of the state of the Group’s and of the Parent Company’s affairs as at 28 January 2017 and of the Group’s profit for the 52 week period then ended;
• the Group financial statements have been properly prepared in accordance with IFRSs as adopted by the European Union;
• the Parent Company financial statements have been properly prepared in accordance with United Kingdom Accounting Standards comprising FRS101 “Reduced Disclosure Framework”, and applicable law (United Kingdom Generally Accepted Accounting Practice); and
• the financial statements have been prepared in accordance with the requirements of the Companies Act 2006 and, as regards the Group financial statements, Article 4 of the IAS Regulation.
Overview of our audit approach
Materiality
Audit Scope
Risks of material misstatement
• Overall Group materiality of £40m (2016: £40m) which represents approximately 5% (2016: 5%) of profit before tax.• Any audit differences in excess of £2m (2016: £2m) are reported to the Audit Committee.
• We performed an audit of the complete financial information of 3 (2016: 3) full scope components and audit procedures in respect of 3 (2016: 3) specific scope components.• The full and specific scope components accounted for 99% of each of profit before tax (the measure used to calculate materiality), external revenue and of total assets.
• Under / over allowance for doubtful directory debt.• Determination of the net realisable value of inventory.• The valuation of derivatives which hedge foreign exchange and interest rate fluctuations.• Management override of internal controls with regard to key estimates and other provisions for returns and properties.
What we have auditedWe have audited the �nancial statements of NEXT plc for the 53 week period ended 30 January 2016 which comprise:Group Parent companyGroup Balance Sheet Company Balance Sheet Group Income Statement Group Statement of Comprehensive Income Company Statement of Comprehensive Income Group Statement of Changes in Equity Company Statement of Changes in Equity Group Cash Flow Statement Company Cash Flow Statement Related notes 1 to 33 to the �nancial statements Related notes C1 to C6 to the �nancial statements
The �nancial reporting framework that has been applied in their preparation is applicable law and International Financial Reporting Standards (IFRSs) as adopted by the European Union and, as regards the Parent Company �nancial statements, as applied in accordance with the provisions of the Companies Act 2006.Our opinion on the �nancial statementsIn our opinion:the �nancial statements give a true and fair view of the state of the Group’s and of the Parent Company’s a�airs as at 30 January 2016 and of the Group’s pro�t for the 53 week period then ended;the Group �nancial statements have been properly prepared in accordance with IFRSs as adopted by the European Union;the Parent Company �nancial statements have been properly prepared in accordance with United Kingdom Generally Accepted Accounting Practice; andthe �nancial statements have been prepared in accordance with the requirements of the Companies Act 2006 and, as regards the Group �nancial statements, Article 4 of the IAS Regulation.Overview of our audit approach
The scope of an audit of the �nancial statementsAn audit involves obtaining evidence about the amounts and disclosures in the �nancial statements su�cient to give reasonable assurance that the �nancial statements are free from material misstatement, whether caused by fraud or error. This includes an assessment of: whether the accounting policies are appropriate to the Group’s and the Parent Company’s circumstances and have been consistently applied and adequately disclosed; the reasonableness of signi�cant accounting estimates made by the directors; and the overall presentation of the �nancial statements. In addition, we read all the �nancial and non-�nancial information in the Annual Report and Accounts to identify material inconsistencies with the audited �nancial statements and to identify any information that is apparently materially incorrect based on, or materially inconsistent with, the knowledge acquired by us in the course of performing the audit. If we become aware of any apparent material misstatements or inconsistencies we consider the implications for our report.Our application of materialityWe apply the concept of materiality both in planning and performing the audit, and in evaluating the e�ect of misstatements on the audit and in forming our audit opinion.MaterialityThe magnitude of an omission or misstatement that, individually or in the aggregate, could reasonably be expected to in�uence the economic decisions of the users of the �nancial statements. Materiality provides a basis for determining the nature and extent of our audit procedures. (ISA 320)We determined materiality for the Group to be £40m (2015: £40m), which is approximately 5% (2015: 5%) of pro�t before tax. The basis for materiality is normally underlying pro�t before tax, but in the current year this is equivalent to pro�t before tax as there are no exceptional items. The rationale for using underlying pro�t before tax as our basis for materiality is that it provides a consistent period on period approach, excluding one o� gains or losses which can be signi�cant compared to underlying trading performance.
Performance materialityThe application of materiality at the individual account or balance level. It is set at an amount to reduce to an appropriately low level the probability that the aggregate of uncorrected and undetected misstatements exceeds materiality. (ISA 320)On the basis of our risk assessments, together with our assessment of the Group’s overall control environment, our judgement was that performance materiality should be set at 75% (2015: 75%) of materiality, the top end of our range, namely £30m (2015: £30m); although we reduce our testing threshold in areas of signi�cant risk to appropriately re�ect our assessment of risk of material misstatement and focus on the key judgements and estimates.Materiality £40m
Reporting thresholdAn amount below which identi�ed misstatements are considered as being clearly trivial. (ISA 450)We agreed with the Audit Committee that we would report to them all uncorrected audit di�erences in excess of £2m (2015: £2m), which is set at 5% of materiality, as well as di�erences below that threshold that, in our view, warranted reporting on qualitative grounds.We evaluate any uncorrected misstatements against both the quantitative measures of materiality discussed above and in light of other relevant qualitative considerations in forming our opinion.Scope of our audit for the 53 week period ended 30 January 2016Tailoring the scopeOur assessment of audit risk, our evaluation of materiality and our allocation of performance materiality determine the audit scope for each component within the Group. Taken together, this enables us to form an opinion on the �nancial statements. We take account of size, risk pro�le, the organisation of the Group and e�ectiveness of Group-wide controls, changes in the business environment and other factors such as recent internal audit results when assessing the level of work to be performed at each component.After assessing the risk of material misstatement to the Group �nancial statements, we ensured we had adequate quantitative coverage of signi�cant accounts in the �nancial statements. Of the 24 reporting components of the Group, we selected 6 components covering entities within the UK and Hong Kong, which represent the principal business units within the Group.
Of the 6 (Jan-15: 6) components selected, we (the Primary audit team) performed an audit of the complete �nancial information of 3 (Jan-15: 2) components (“full scope components”) which were selected based on their size or risk characteristics. These were NEXT plc, NEXT Group plc and NEXT Retail Limited. Together these represent more than 85% (Jan-15: 83%) of underlying pro�t before tax, 97% (Jan-15: 97%) of external revenue and 92% (Jan-15: 76%) of total assets. NEXT Retail Limited which includes the Retail and Directory businesses accounts for more than 90% (Jan-15: 88%) of underlying pro�t before tax, 97% (Jan-15: 97%) of external revenue and 78% (Jan-15: 66%) of total assets.For the remaining 3 (Jan-15: 4) components comprising NEXT Distribution Limited, Lipsy Limited and NEXT Sourcing Limited (“speci�c scope components”), we performed audit procedures on speci�c accounts within that component that we considered had the potential for the greatest impact on the signi�cant accounts in the �nancial statements, either because of the size of these accounts or their risk pro�le. Together these represent more than 14% (Jan-15: 16%) of underlying pro�t before tax, 2% (Jan-15: 2%) of external revenue and 7% (Jan-15: 23%) of total assets. The audit scope of these components may not have included testing of all signi�cant accounts of the component, but will have contributed to the overall coverage of signi�cant accounts tested for the Group.Therefore, the reporting components where we performed audit procedures accounted for more than 99% (2015: 99%) of underlying pro�t before tax, 99% (2015: 99%) of external revenue and 99% (2015: 99%) of total assets.The remaining components together represent less than 1% of underlying pro�t before tax, external revenue and total assets. These entities are subject to overall analytical review procedures to respond to any potential risks of material misstatement to the Group �nancial statements. Although not relied up on for the purpose of this opinion, the majority of the remaining components have to prepare statutory accounts which are audited by EY member �rms.For the elimination adjustments posted in the Group consolidation, we performed procedures to con�rm there were no signi�cant risks of material misstatement in the Group �nancial statements including the testing of consolidation journals and intercompany eliminations.The audits of the full and speci�c scope entities are performed at a materiality level calculated by reference to a proportion of the Group materiality appropriate to the scale of the business concerned. NEXT Retail Limited was allocated 80% of the Group performance materiality. The range of performance materiality allocated to the other full scope components and the speci�c scope components was 20% to 30% of the Group performance materiality of £30m.The audit of the full scope components and speci�c scope components, other than NEXT Sourcing Limited, were undertaken by the Primary audit team in the UK. The NEXT Sourcing Limited audit was performed by the EY �rm in Hong Kong.
Changes from the prior yearThe scope designated for NEXT Group plc has been changed from speci�c scope last year to full scope this year as substantially all of the balances were already in scope due to their size or complexity.Our assessment of the risks of material misstatementWe identi�ed the risks of material misstatement described below as those that had the greatest e�ect on our overall audit strategy, the allocation of resources in the audit and the direction of the e�orts of the audit team. In addressing these risks, we have performed the procedures below which were designed in the context of the �nancial statements as a whole and, consequently, we do not express any opinion on these individual areas.Risk Our response to the risk What we concluded to the Audit CommitteeUnder/over provision for Directory debtManagement records a provision of £162.5m (Jan-15: £140.6m) where a loss event has occurred using historical default rates and credit score information to determine the extent to which a loss event will result in an actual loss for the Group.This is the largest provision within the Group �nancial statements relating to a gross debtor balance of £1,094.1m (2015: £853.1m).Whilst the provision is calculated using a combination of internally and externally sourced information there is signi�cant judgement in determining the assumptions.Key assumptions:How indicators of impairment (or ‘loss events’) are identi�ed;The default rates representing the likelihood of eventual default for debt within each risk/ageing category of the debtor book; andThe recovery rate for debt that has defaulted and passed to debt collection agencies.This risk has increased in the current period due to the gross debtor balance increasing, driven by reductions in the minimum payment amounts.Changes to default stage risk categorisation to meet FCA requirements have also increased the uncertainty and this reduced the comparability of data to assess the risk of loss.See also the Strategic Report Risks and Uncertainties (page 30); Audit Committee Report (page 50); Accounting Policies (pages 99 & 101); and Note 14 of the Consolidated Financial Statements (page 114). We performed audit procedures which covered 100% of the provision balance.We understood the ongoing impact of the reduction in minimum payments on consumer behavioural patterns, the debt pro�le and consequently the implications for the provision at the period end.We investigated the nature of and rationale for signi�cant changes to the model which have been made in the period and considered their appropriateness with reference to the changes in the debt pro�le.We challenged the reasonableness of the key assumptions in determining management’s provision as follows:We assessed the appropriateness of the de�nition of a loss event and the method used by management to identify impacted debts/loss events;We recalculated the historical default rates for each risk category of customer by comparing prior year customer balances and actual default during the last year, as support for the assumed default rates; andWe compared the assumed recovery rates for debts passed to debt collection agencies to historical recovery rates and current performance.We tested management’s categorisation of the debtor book by stage of current default based on whether payments have been made in accordance with “the NEXT terms and conditions” for Directory accounts.We tested the arithmetical accuracy of the provision based on management’s assumptions in respect of default rates and expected recovery rates, and we also checked the underlying debtor book categorisation to recent customer payment history.We compared the credit score data used by management to stratify the customer base to third party data source information. The provision for impaired Directory debtors of £162.5m (Jan-15: £140.6m) is sensitive to the key assumptions resulting in high levels of estimation uncertainty. We have independently determined our own acceptable range for the provision based on our assessment of these assumptions. While consistently conservative, we consider the provision is within this acceptable range.
Determination of the net realisable values of inventoriesThe inventories balance at the period end £486.5m (2015: £416.8m), is held at the lower of cost and net realisable value and is signi�cant to the overall Balance Sheet.The inventory provision is calculated using post period end trading performance and historical sales patterns. Changes in trading performance can result in signi�cant judgement in determining the provision required. We consider the level of risk in this provision to be consistent with previous years.See also the Audit Committee Report (page 50); Accounting Policies (pages 99 & 101); and Balance Sheet (page 94). We assessed the reasonableness of the inventory provision by projecting future sales levels to calculate our own estimate of the required provision. This was determined by applying the historical sell through performance to the anticipated surplus stock. This included historical data for stock sold at full price, stock marked down below full price in a sale period, and the element of inventory that is passed to a clearance route; together with the related margins/losses achieved for each of these sales channels.We tested a sample of stock items categorised as Spring Summer 2016, Autumn Winter 2015, and prior season older items, to gain comfort over the categorisation of stock used in the provision calculation. We consider the valuation of inventory continues to be conservative and not materially misstated based on our assessment of management’s assumptions and the provision model they have applied.Valuation of derivatives which hedge foreign exchange and interest rate �uctuations.The nature of the business is such that there is exposure to foreign currency receipts and purchases. The Group’s hedging strategy to manage this risk is such that at any one point in time there is a signi�cant value of outstanding derivatives, which are marked to market and whose values are estimated based upon market inputs, rather than being directly observable market values.The Group also uses interest rate derivatives to hedge part of the interest rate risk associated with the Company’s corporate bonds.Refer to the Strategic Report Risks and Uncertainties (page 30); Audit Committee Report (page 50); Accounting Policies (page 100); and Note 27 of the Consolidated Financial Statements (page 125) which summarises the instruments held. We identi�ed the di�erent types of derivative held by the Group and assessed the level of risk inherent in each type of derivative such as forwards, options and swaps.We analysed the features of a sample of the instruments held at the period end per the contractual agreements and checked that the details matched the counterparty valuations.We selected a sample of derivatives for valuation testing. This sample covered each instrument, and counterparty combinations for each type of instrument.The Group audit team was supported by EY experts who independently valued the sample in order to challenge the reasonableness of the counterparty valuations used by the Group.We evaluated the associated �nancial statement disclosures for appropriateness and completeness. We consider the valuation of derivatives assets of £95.9m (Jan-15: £132.4m) and derivative liabilities of £15.2m (Jan-15: £20.0m) are appropriate based on our assessment of management’s process, third party valuations and our sample testing by an internal derivatives valuation expert.Management override with regard to estimates and other provisions for returns and properties.Other than stock and debtors dealt with separately above, these primarily relate to property related and returns provisions. In addition to the risks disclosed above, we focused on accruals and provisions of a judgemental nature and therefore capable of being manipulated through management override such as onerous lease and dilapidations provisions.For material items we re–performed the calculation of the accrual to test mathematical accuracy.We understood the basis for these accruals and provisions in order to assess the appropriateness of management’s underlying assumptions.We compared these assumptions to subsequent outcomes where available. Where subsequent outcomes were not available to assess their accuracy, we considered the appropriateness of management’s previous estimates against historical outcomes.We performed targeted journal entry testing focussed on journal entries which we considered to be higher risk. We concluded the key judgements and estimates were conservative and consistent with the prior year. Therefore, we did not identify evidence of bias indicating management override of controls.
We assessed the design and operating e�ectiveness of the controls management performs over each of the risks. However, we did not rely on these controls to form our conclusion on those risks.The above risks are the same as in the prior year. Revenue recognition risk, being a signi�cant risk prescribed by ISA’s, is not included above, as it was not an area of greatest audit e�ort.Our opinion on other matters prescribed by the Companies Act 2006In our opinion:the part of the Directors’ Remuneration Report to be audited has been properly prepared in accordance with the Companies Act 2006; andthe information given in the Strategic Report and the Directors’ Report for the �nancial period for which the �nancial statements are prepared is consistent with the �nancial statements.Matters on which we are required to report by exceptionISAs (UK and Ireland) reporting We are required to report to you if, in our opinion, �nancial and non-�nancial information in the Annual Report and Accounts is:materially inconsistent with the information in the audited �nancial statements; orapparently materially incorrect based on, or materially inconsistent with, our knowledge of the Group acquired in the course of performing our audit; orotherwise misleading.In particular, we are required to report whether we have identi�ed any inconsistencies between our knowledge acquired in the course of performing the audit and the directors’ statement that they consider the Annual Report and Accounts taken as a whole is fair, balanced and understandable and provides the information necessary for shareholders to assess the Group’s performance, business model and strategy; and whether the Annual Report and Accounts appropriately addresses those matters that we communicated to the Audit Committee which we consider should have been disclosed. We have no exceptions to report.Companies Act 2006 reporting We are required to report to you if, in our opinion:adequate accounting records have not been kept by the Parent Company, or returns adequate for our audit have not been received from branches not visited by us; orthe Parent Company �nancial statements and the part of the Directors’ Remuneration Report to be audited are not in agreement with the accounting records and returns; orcertain disclosures of directors’ remuneration speci�ed by law are not made; orwe have not received all the information and explanations we require for our audit. We have no exceptions to report.Listing Rules review requirements We are required to review:the directors’ statement in relation to going concern, set out on page 49, and longer-term viability, set out on page 31; andthe part of the Corporate Governance Statement relating to the Company’s compliance with the provisions of the UK Corporate Governance Code speci�ed for our review. We have no exceptions to report.
Statement on the directors’ assessment of the principal risks that would threaten the solvency or liquidity of the GroupISAs (UK and Ireland) reporting We are required to give a statement as to whether we have anything material to add or to draw attention to in relation to:the directors’ con�rmation in the Annual Report and Accounts that they have carried out a robust assessment of the principal risks facing the Group, including those that would threaten its business model, future performance, solvency or liquidity;the disclosures in the Annual Report and Accounts that describe those risks and explain how they are being managed or mitigated;the directors’ statement in the �nancial statements about whether they considered it appropriate to adopt the going concern basis of accounting in preparing them, and their identi�cation of any material uncertainties to the Group’s ability to continue to do so over a period of at least twelve months from the date of approval of the �nancial statements; andthe directors’ explanation in the Annual Report and Accounts as to how they have assessed the prospects of the Group, over what period they have done so and why they consider that period to be appropriate, and their statement as to whether they have a reasonable expectation that the Group will be able to continue in operation and meet its liabilities as they fall due over the period of their assessment, including any related disclosures drawing attention to any necessary quali�cations or assumptions. We have nothing material to add or to draw attention to.
Respective responsibilities of directors and auditorAs explained more fully in the Directors’ Responsibilities Statement set out on page 44, the directors are responsible for the preparation of the �nancial statements and for being satis�ed that they give a true and fair view. Our responsibility is to audit and express an opinion on the Group �nancial statements in accordance with applicable law and International Standards on Auditing (UK and Ireland). Those standards require us to comply with the Auditing Practices Board’s Ethical Standards for Auditors.This report is made solely to the Company’s members, as a body, in accordance with Chapter 3 of Part 16 of the Companies Act 2006. Our audit work has been undertaken so that we might state to the Company’s members those matters we are required to state to them in an auditor’s report and for no other purpose. To the fullest extent permitted by law, we do not accept or assume responsibility to anyone other than the Company and the Company’s members as a body, for our audit work, for this report, or for the opinions we have formed.
86 n e x t p l c . c o . u k

slugline
The scope of an audit of the financial statementsAn audit involves obtaining evidence about the amounts and disclosures in the financial statements sufficient to give reasonable assurance that the financial statements are free from material misstatement, whether caused by fraud or error. This includes an assessment of: whether the accounting policies are appropriate to the Group’s and the Parent Company’s circumstances and have been consistently applied and adequately disclosed; the reasonableness of significant accounting estimates made by the directors; and the overall presentation of the financial statements. In addition, we read all the financial and non-financial information in the Annual Report and Accounts to identify material inconsistencies with the audited financial statements and to identify any information that is apparently materially incorrect based on, or materially inconsistent with, the knowledge acquired by us in the course of performing the audit. If we become aware of any apparent material misstatements or inconsistencies we consider the implications for our report.
Our application of materialityWe apply the concept of materiality both in planning and performing the audit, and in evaluating the effect of identified misstatements on the audit and in forming our audit opinion.
MaterialityThe magnitude of an omission or misstatement that, individually or in the aggregate, could reasonably be expected to influence the economic decisions of the users of the financial statements. Materiality provides a basis for determining the nature and extent of our audit procedures. (ISA 320)
We determined Group materiality to be £40m (2016: £40m), which is approximately 5% (2016: 5%) of profit before tax. The basis for Group materiality is normally underlying profit before tax, but in the current period this is equivalent to profit before tax as there are no exceptional items. The rationale for using underlying profit before tax as our basis for materiality is that it provides a consistent period on period approach, excluding one off gains or losses which can be significant compared to underlying trading performance.
Performance materialityThe application of materiality at the individual account or balance level. It is set at an amount to reduce to an appropriately low level the probability that the aggregate of uncorrected and undetected misstatements exceeds materiality. (ISA 320)
On the basis of our risk assessments, together with our assessment of the Group’s overall control environment, our judgement was that performance Group materiality should be set at 75% (2016: 75%) of Group materiality, the top end of our range, namely £30m (2016: £30m); although we reduce our testing threshold in areas of significant risk to appropriately reflect our assessment of risk of material misstatement and focus on the key judgements and estimates.
The audits of the full and specific scope entities are performed at a performance materiality level calculated by reference to a proportion of the Group performance materiality of £30m (2016: £30m) appropriate to the relative scale and risk of the business concerned. NEXT Retail Limited was allocated £24m (2016: £24m) equating to 80% of the Group performance materiality. In the current period the range of performance materiality allocated to the other components was £6m (2016: £6m) to £9m (2016: £9m) equating to 20% to 30% of Group performance materiality.
Reporting thresholdAn amount below which identified misstatements are considered as being clearly trivial. (ISA 450)
We agreed with the Audit Committee that we would report to them all uncorrected audit differences in excess of £2m (2016: £2m), which is set at 5% of Group materiality, as well as differences below that threshold that, in our view, warranted reporting on qualitative grounds.
We evaluate any uncorrected misstatements against both the quantitative measures of Group materiality discussed above and in light of other relevant qualitative considerations in forming our opinion.
Performance materiality
£30m
£10m
Tolerance for potential undetected misstatements 75%
Tolerance for potential uncorrected misstatements 25%
Materiality £40m
Financial Statements
Sharehold
er Inform
ation
87n e x t p l c . c o . u k
Strategic R
epo
rtG
overnance

slugline
Scope of our audit for the 52 week period ended 28 January 2017Tailoring the scopeOur assessment of audit risk, our evaluation of Group materiality and our allocation of Group performance materiality determine the audit scope for each component within the Group. Taken together, this enables us to form an opinion on the financial statements. We take account of size, risk profile, the organisation of the Group and effectiveness of Group-wide controls, changes in the business environment and other factors such as recent internal audit results when assessing the level of work to be performed at each component.
After assessing the risk of material misstatement to the Group financial statements, we ensured we had adequate quantitative coverage of significant accounts in the financial statements. Of the 25 (2016: 25) reporting components of the Group, we selected 6 (2016: 6) components covering 5 (2016: 5) entities within the UK and one (2016: one) in Hong Kong, which represent the principal business units within the Group.
2017 2016
No.
Underlying`profit
before taxExternalrevenue
Totalassets No.
Underlyingprofit
before taxExternalrevenue
Totalassets Notes
Full scope 3 86.3% 97.0% 92.9% 3 85.5% 97.7% 92.1% 1
Specific scope 3 13.3% 2.0% 6.0% 3 14.1% 1.7% 7.0% 2
Full and specific scope coverage 6 99.6% 99.0% 98.9% 6 99.6% 99.4% 99.1%
Remaining components 19 0.4% 1.0% 1.1% 19 0.4% 0.6% 0.9% 3
Total reporting components 25 100.0% 100.0% 100.0% 25 100.0% 100.0% 100.0% 4
Notes:1. Full scope components selected being NEXT plc, NEXT Holdings Limited (formerly named NEXT Group plc) and NEXT Retail Limited were selected based
on their size and risk characteristics. We performed an audit of the complete financial information of these full scope components. NEXT Retail Limited which includes the Retail and Directory Businesses accounts for more than 92% (2016: 90%) of underlying profit before tax, 96% (2016: 97%) of external revenue and 76% (2016: 78%) of total assets.
2. Specific scope components comprise NEXT Distribution Limited, Lipsy Limited and NEXT Sourcing Limited. We performed audit procedures on specific accounts within these components that we considered had the potential for the greatest impact on the significant accounts in the Group financial statements, either because of the size of these accounts or their risk profile.
3. These entities are subject to overall analytical review procedures to respond to any potential risks of material misstatement to the Group financial statements. Although not relied upon for the purpose of this opinion, the majority of the remaining components have to prepare statutory accounts which are audited by EY member firms.
4. For the elimination adjustments posted in the Group consolidation, we performed procedures to confirm there were no significant risks of material misstatement in the Group financial statements including the testing of consolidation journals and intercompany eliminations.
Involvement with component teamsIn establishing our overall approach to the Group audit, we (the Primary team) determined the type of work that needed to be undertaken at each of the components by us, as the Primary audit team, or by component auditors from other EY global network firms operating under our instruction. All full and specific scope component audit procedures were performed directly by the Primary audit team other than for NEXT Sourcing Limited where the work was performed by EY Hong Kong. We determined the appropriate level of involvement in the audit of each component to enable us to determine that sufficient audit evidence had been obtained as a basis for our opinion on the Group as a whole.
During the current period’s audit cycle, meetings with EY Hong Kong were chaired by senior members of the Primary audit team and a face to face meeting was held with NEXT Sourcing management. The meetings included our attendance at the team planning meeting and closing meeting with local management. We discussed their risk assessment, audit approach and results of the audit. The Primary audit team also interacted regularly with the component audit team throughout the course of the audit, and were responsible for the scope and direction of the audit process. This, together with the additional procedures performed at Group level, gave us appropriate evidence for our opinion on the Group financial statements.
Independent Auditor’s Reportto the Members of NEXT plc
88 n e x t p l c . c o . u k

slugline
Our assessment of the risks of material misstatementWe identified the risks of material misstatement described below as those that had the greatest effect on our overall audit strategy, the allocation of resources in the audit and the direction of the efforts of the audit team. In addressing these risks, we have performed the procedures below which were designed in the context of the financial statements as a whole and, consequently, we do not express any opinion on these individual areas.
Risk Our response to the risk Key observations communicated to the Audit Committee
Under / over allowance for doubtful directory debt (‘Allowance’)
Management has recorded an Allowance of £137.5m (2016: £162.5m). Where a loss event has been deemed to have occurred, historical default rates and credit score information is used to determine the extent to which a loss event will result in an actual loss for the Group.
This is a significant estimate within the Group financial statements relating to a gross debtor balance of £1,139.3m (2016: £1,094.1m).
Whilst the Allowance is calculated using a combination of internally and externally sourced information there is significant judgement in determining the assumptions.
Key assumptions:
1. How indicators of impairment (or ‘loss events’) are identified;
2. The default rates representing the likelihood of eventual default for debt within each risk/ageing category of the debtor book; and
3. The recovery rate for debt that has defaulted and has been passed to debt collection agencies.
The impact of reductions to the minimum payment amounts and the change in arrears stage risk categorisation (to meet Financial Conduct Authority requirements) in the prior period gave rise to a further increase in the gross debtor balance in the current period, and there is still a lack of comparability of default and recovery rates with historic trends. As a result estimation uncertainty remains high and the level of risk in the Allowance is consistent with the prior period.
See also the Strategic Report Risks and Uncertainties (page 34); Audit Committee Report (page 55); Accounting policies (pages 101); and Note 11 of the Consolidated Financial Statements (page 119).
We performed audit procedures which covered 100% of the provision balance.
• We considered current customer payment behaviour patterns, the debt profile and the consequent implications for the Allowance.
• We confirmed no changes have been made to the underlying principles within the Allowance model.
• We challenged the reasonableness of the key assumptions in determining management’s Allowance as follows:
1. We assessed the appropriateness of the definition of a loss event and the method used by management to identify impacted debts/loss events;
2. We recalculated the historical default rates for each risk category of customer by comparing prior period customer balances and actual default during the last period, as support for the assumed default rates; and
3. We compared the assumed recovery rates for debts passed to debt collection agencies to historical recovery rates and current performance.
• We tested management’s categorisation of the debtor book by stage of arrears based on whether payments have been made in accordance with “the NEXT terms and conditions” for Directory accounts. We also compared the credit score data, used by management to further categorise the debtor book, to third-party data source information.
• We tested the arithmetical accuracy of the Allowance based on management’s assumptions in respect of default and recovery rates.
• We performed a retrospective review of the prior period Allowance compared with current period outcomes.
The Allowance for impaired directory debts of £137.5m (2016: £162.5m) is sensitive to the key assumptions resulting in high levels of estimation uncertainty.
We have determined our own acceptable range for the Allowance based on our assessment of these assumptions and stress testing.
The Allowance remains consistently conservative, but within this acceptable range.
Financial Statements
Sharehold
er Inform
ation
89n e x t p l c . c o . u k
Strategic R
epo
rtG
overnance

slugline
Risk Our response to the risk Key observations communicated to the Audit Committee
Determination of the net realisable values of inventories
The inventories balance at the period end £451.1m (2016: £486.5m), is held at the lower of cost and net realisable value and is significant to the overall Balance Sheet.
The write down to net realisable value (‘Write Down’) is calculated using forecast sales patterns based on historical data. Changes in trading require significant judgement when determining the Write Down assumptions to be used.
Key assumptions:
1. The forecast sell through rate to identify expected clearance stock; and
2. The forecast cash recovery rates on sale of clearance stock.
We consider the level of risk in this Write Down to be consistent with previous periods.
See also the Audit Committee Report (page 55); Accounting policies (pages 101); and Balance Sheet (page 98).
• We understood the nature of and rationale for the changes made to the model during the period and ensured this was appropriate.
• We challenged:
1. The appropriateness of the sell through rate assumption applied in the Write Down to ensure it reflects both historic and current experience of customer buying patterns; and
2. The cash recovery assumption applied by management in the model with reference to historical and current experience.
• We evaluated the outturn of actual cash recovery for inventories sold after the period end and compared this to management’s assumptions used.
• We tested a sample of stock items categorised by season, to confirm the integrity of the categorisation of stock used in the Write Down calculation.
• We tested the integrity of the underlying model which calculates the Write Down by interrogating the clerical accuracy of the formulas used.
• We performed a retrospective review of the prior period Write Down based on current period outcomes for sell through and recovery rates.
We consider the valuation of inventory continues to be conservative and not materially misstated based on our assessment of management’s assumptions and the Write Down model they have applied.
Valuation of derivatives
The nature of the business is such that there is exposure to foreign currency receipts and purchases. The Group’s hedging strategy to manage this risk is such that at any point in time there is a significant value of outstanding derivatives, which are marked to market and whose values are estimated based upon market inputs, rather than being directly observable market values.
We consider the level of risk in this valuation to have increased in the current period due to high level of foreign exchange rate fluctuations.
Refer to the Strategic Report Risks and Uncertainties (page 34); Audit Committee Report (page 55); Accounting policies (pages 101); and Note 25 of the Consolidated Financial Statements (page 135) summarises the instruments held.
• We agreed individual derivative fair values to counterparty valuation statements obtained by management.
• We selected a sample of derivatives for valuation testing. This sample covered each instrument, and counterparty combinations for each type of instrument.
• The Primary audit team was supported by EY derivative valuation specialists who independently valued the sample in order to challenge the reasonableness of the counterparty valuations used by the Group.
• We evaluated the associated financial statement disclosures for appropriateness and completeness.
We consider the valuation of derivatives assets of £91.3m (2016: £95.9m) and derivative liabilities of £19.7m (2016: £15.2m) are appropriate.
Independent Auditor’s Reportto the Members of NEXT plc
90 n e x t p l c . c o . u k

slugline
Risk Our response to the risk Key observations communicated to the Audit Committee
Management override of internal controls with regard to estimates and provisions for returns and property.
Other than inventory and directory debtors dealt with separately, these primarily relate to property related and returns provisions.
• In addition to the risks disclosed above, we focused on accruals and provisions of a judgemental nature and therefore capable of being manipulated through management override such as returns, onerous lease and dilapidations provisions.
• We inquired of management regarding the risks of fraud, the controls put in place to address those risks and consideration of the effectiveness of those controls.
• For material items we re–performed the calculation of the accrual to test arithmetical accuracy.
• We understood the basis for these accruals and provisions in order to assess the appropriateness of management’s underlying assumptions.
• We compared these assumptions to outcomes subsequent to period end where available. Where subsequent outcomes were not available to assess their accuracy, we considered the appropriateness of management’s prior period estimates against historical outcomes.
• We performed targeted journal entry testing focussed on journal entries which we considered to be higher risk.
• In accordance with ISA 420 we inquired of internal audit of their procedures to detect fraud including whistleblowing and anti-bribery logs. We have assessed that management have satisfactorily responded to any findings from those procedures.
We concluded that the key judgements and estimates were conservative and consistent with the prior period. Therefore, we did not identify evidence of bias indicating management override of controls.
We assessed the design and operating effectiveness of the controls management performs over each of the risks. However, we did not rely on these controls to form our conclusion on those risks.
The above risks are the same as in the prior period. Revenue recognition risk, being a significant risk prescribed by ISAs (UK and Ireland), is not included above, as it was not an area of greatest audit effort, allocation of resources, or senior executive time.
Financial Statements
Sharehold
er Inform
ation
91n e x t p l c . c o . u k
Strategic R
epo
rtG
overnance
slugline
Our opinion on other matters prescribed by the Companies Act 2006In our opinion:
• the part of the Directors’ Remuneration Report to be audited has been properly prepared in accordance with the Companies Act 2006; and
• we identified no material misstatements in the Strategic Report or Directors’ Report in light of the knowledge and understanding of the Group and its environment obtained in the course of the audit; and
• based on the work undertaken in the course of the audit:
— the information given in the Strategic Report and the Directors’ Report for the financial period for which the financial statements are prepared is consistent with the financial statements; and
— the Strategic Report and the Directors’ Report have been prepared in accordance with applicable legal requirements.
Matters on which we are required to report by exceptionISAs (UK and Ireland) reporting
We are required to report to you if, in our opinion, financial and non-financial information in the Annual Report and Accounts is:
• materially inconsistent with the information in the audited financial statements; or
• apparently materially incorrect based on, or materially inconsistent with, our knowledge of the Group acquired in the course of performing our audit; or
• otherwise misleading.
In particular, we are required to report to you if:
• in our opinion, the Annual Report and Accounts does not appropriately address those matters that we communicated to the Audit Committee which we consider should have been disclosed; or
• we have identified any inconsistencies between:
— our knowledge acquired in the course of performing the audit; and
— the directors’ statement that they consider the Annual Report and Accounts taken as a whole is fair, balanced and understandable and provides the information necessary for shareholders to assess the Group’s performance, business model and strategy.
We have no exceptions to report.
Companies Act 2006 reporting
We are required to report to you if, in our opinion:
• adequate accounting records have not been kept by the Parent Company, or returns adequate for our audit have not been received from branches not visited by us; or
• the Parent Company financial statements and the part of the Directors’ Remuneration Report to be audited are not in agreement with the accounting records and returns; or
• certain disclosures of directors’ remuneration specified by law are not made; or
• we have not received all the information and explanations we require for our audit.
We have no exceptions to report.
Listing Rules review requirements
We are required to review:
• the directors’ statements in relation to going concern, set out on page 56, and longer-term viability, set out on page 35; and
• the part of the Corporate Governance Statement relating to the Company’s compliance with the provisions of the UK Corporate Governance Code specified for our review.
We have no exceptions to report.
Independent Auditor’s Reportto the Members of NEXT plc
92 n e x t p l c . c o . u k
slugline
Statement on the directors’ assessment of the principal risks that would threaten the solvency or liquidity of the Group
ISAs (UK and Ireland) reporting
We are required to give a statement as to whether we have anything material to add or to draw attention to in relation to:
• the directors’ confirmation in the Annual Report and Accounts that they have carried out a robust assessment of the principal risks facing the Group, including those that would threaten its business model, future performance, solvency or liquidity;
• the disclosures in the Annual Report and Accounts that describe those risks and explain how they are being managed or mitigated;
• the directors’ statement in the financial statements about whether they considered it appropriate to adopt the going concern basis of accounting in preparing them, and their identification of any material uncertainties to the Group’s ability to continue to do so over a period of at least twelve months from the date of approval of the financial statements; and
• the directors’ explanation in the Annual Report and Accounts as to how they have assessed the prospects of the Group, over what period they have done so and why they consider that period to be appropriate; and their statement as to whether they have a reasonable expectation that the Group will be able to continue in operation and meet its liabilities as they fall due over the period of their assessment, including any related disclosures drawing attention to any necessary qualifications or assumptions.
We have nothing material to add or to draw attention to.
Respective responsibilities of directors and auditorAs explained more fully in the Directors’ Responsibilities Statement set out on page 47, the directors are responsible for the preparation of the financial statements and for being satisfied that they give a true and fair view. Our responsibility is to audit and express an opinion on the Group financial statements in accordance with applicable law and International Standards on Auditing (UK and Ireland). Those standards require us to comply with the Auditing Practices Board’s Ethical Standards for Auditors.
This report is made solely to the Company’s members, as a body, in accordance with Chapter 3 of Part 16 of the Companies Act 2006. Our audit work has been undertaken so that we might state to the Company’s members those matters we are required to state to them in an auditor’s report and for no other purpose. To the fullest extent permitted by law, we do not accept or assume responsibility to anyone other than the Company and the Company’s members as a body, for our audit work, for this report, or for the opinions we have formed.
Nigel Meredith (Senior statutory auditor) for and on behalf of Ernst & Young LLP, Statutory Auditor Birmingham 23 March 2017
Notes:1. The maintenance and integrity of the NEXT plc web site is the responsibility of the directors; the work carried out by the auditors does not involve
consideration of these matters and, accordingly, the auditors accept no responsibility for any changes that may have occurred to the financial statements since they were initially presented on the web site.
2. Legislation in the United Kingdom governing the preparation and dissemination of financial statements may differ from legislation in other jurisdictions.
Financial Statements
Sharehold
er Inform
ation
93n e x t p l c . c o . u k
Strategic R
epo
rtG
overnance

slugline
GROUP FINANCIAL STATEMENTS96 Consolidated Income Statement97 Consolidated Statement
of Comprehensive Income98 Consolidated Balance Sheet99 Consolidated Statement
of Changes in Equity100 Consolidated Cash Flow Statement
NOTES INDEX101 Group Accounting Policies107 Notes to the Consolidated Financial Statements107 1 Segmental Analysis109 2 Revenue by Type110 3 Operating Profit 111 4 Staff Costs and Key Management Personnel112 5 Finance Income and Costs113 6 Taxation114 7 Dividends115 8 Earnings Per Share117 9 Property, Plant and Equipment118 10 Intangible Assets119 11 Customer and Other Receivables120 12 Other Financial Assets120 13 Cash and Short Term Deposits120 14 Bank Loans and Overdrafts120 15 Trade Payables and Other Liabilities
121 16 Other Financial Liabilities121 17 Corporate Bonds122 18 Pension Benefits127 19 Provisions128 20 Share Capital128 21 Other Reserves128 22 Share-based Payments132 23 Shares Held by ESOT132 24 Financial Instruments: Risk Management
and Hedging Activities135 25 Financial Instruments: Categories136 26 Financial Instruments: Fair Values136 27 Financial Instruments: Sensitivity Analysis137 28 Analysis of Net Debt137 29 Operating Lease Commitments138 30 Related Party Transactions

slugline
Go
vernanceShareho
lder Info
rmatio
nFinancial Statem
entsStrateg
ic Rep
ort
Group
Com
pany

slugline
Consolidated Income Statement
Notes
52 weeks to 28 January
2017£m
53 weeks to 30 January
2016£m
Continuing operationsRevenue 1, 2 4,097.3 4,176.9Cost of sales (2,710.7) (2,724.2)Gross profit 1,386.6 1,452.7Distribution costs (345.1) (351.6)Administrative expenses (214.9) (229.3)Unrealised foreign exchange gains/(losses) 3 0.1 (5.6)Trading profit 826.7 866.2Share of results of associate 1.0 1.0Operating profit 3 827.7 867.2Finance income 5 0.3 0.5Finance costs 5 (37.8) (31.6)Profit before taxation 790.2 836.1Taxation 6 (154.9) (169.3)Profit for the year attributable to equity holders of the parent company 635.3 666.8
Earnings Per Share 52 weeks v 53 weeks Basic 8 441.3p 450.5p Diluted 8 438.1p 443.0p
The Notes 1 to 30 are an integral part of these consolidated financial statements.
96 n e x t p l c . c o . u k
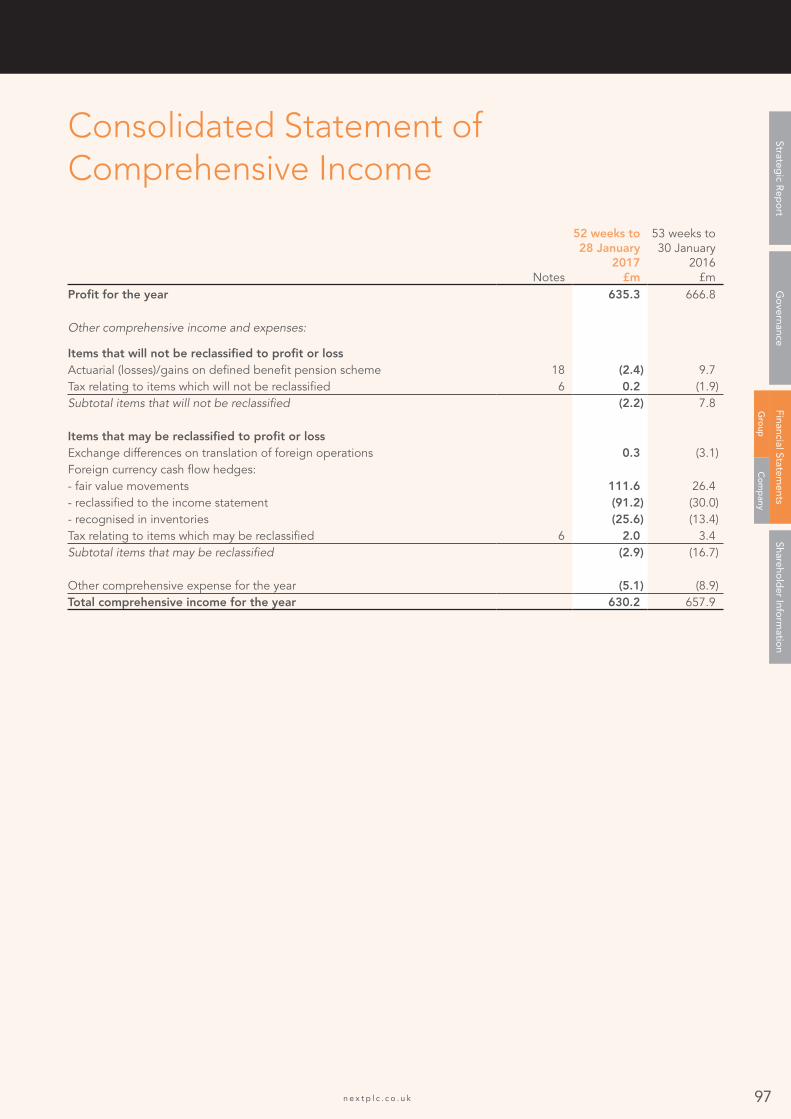
slugline
Consolidated Statement of Comprehensive Income
Notes
52 weeks to 28 January
2017£m
53 weeks to 30 January
2016£m
Profit for the year 635.3 666.8
Other comprehensive income and expenses:
Items that will not be reclassified to profit or lossActuarial (losses)/gains on defined benefit pension scheme 18 (2.4) 9.7Tax relating to items which will not be reclassified 6 0.2 (1.9)Subtotal items that will not be reclassified (2.2) 7.8
Items that may be reclassified to profit or lossExchange differences on translation of foreign operations 0.3 (3.1)Foreign currency cash flow hedges:- fair value movements 111.6 26.4- reclassified to the income statement (91.2) (30.0)- recognised in inventories (25.6) (13.4)Tax relating to items which may be reclassified 6 2.0 3.4Subtotal items that may be reclassified (2.9) (16.7)
Other comprehensive expense for the year (5.1) (8.9)Total comprehensive income for the year 630.2 657.9
Go
vernanceShareho
lder Info
rmatio
n
97n e x t p l c . c o . u k
Financial Statements
Strategic R
epo
rt
Group
Com
pany

slugline
Consolidated Balance Sheet
Notes
28 January 2017
£m
30 January 2016
£mASSETS AND LIABILITIES Non-current assetsProperty, plant and equipment 9 578.6 536.4Intangible assets 10 43.3 43.7Interests in associate and other investments 2.1 2.1Defined benefit pension asset 18 62.9 46.0Other financial assets 12 57.3 57.0Deferred tax assets 6 – 2.7
744.2 687.9Current assetsInventories 451.1 486.5Customer and other receivables 11 1,125.8 1,050.5Other financial assets 12 34.0 38.9Cash and short term deposits 13 49.7 66.3
1,660.6 1,642.2Total assets 2,404.8 2,330.1
Current liabilitiesBank loans and overdrafts 14 (35.3) (128.6)Corporate bonds 17 – (213.8)Trade payables and other liabilities 15 (615.8) (673.5)Dividends payable 7 – (88.3)Other financial liabilities 16 (3.2) (1.3)Current tax liabilities (70.7) (65.1)
(725.0) (1,170.6)Non-current liabilitiesCorporate bonds 17 (913.5) (615.0)Provisions 19 (6.7) (7.3)Other financial liabilities 16 (16.5) (13.9)Other liabilities 15 (226.9) (211.5)Deferred tax liabilities 6 (5.7) –
(1,169.3) (847.7)
Total liabilities (1,894.3) (2,018.3)
NET ASSETS 510.5 311.8
TOTAL EQUITY 510.5 311.8
The financial statements were approved by the Board of directors and authorised for issue on 23 March 2017. They were signed on its behalf by:
Lord Wolfson of Aspley Guise Chief Executive
Amanda James Group Finance Director
98 n e x t p l c . c o . u k

slugline
Share capital
£m
Share premium account
£m
Capital redemption
reserve£m
ESOT reserve
£m
Fair value
reserve£m
Foreign currency
translation£m
Other reserves
£m
Retained earnings
£m
Share-holders’
equity£m
Non-controlling
interest£m
Total equity
£m
At 24 January 2015 15.3 0.9 14.6 (192.0) 43.0 (1.6) (1,443.8) 1,885.6 322.0 (0.1) 321.9Profit for the year – – – – – – – 666.8 666.8 – 666.8Other comprehensive (expense)/income for the year – – – – (13.6) (3.2) – 7.8 (9.0) 0.1 (8.9)Total comprehensive (expense)/ income for the year – – – – (13.6) (3.2) – 674.6 657.8 0.1 657.9
Share buybacks and commitments (Note 20) (0.2) – 0.2 – – – – (49.6) (49.6) – (49.6)ESOT share purchases and commitments (Note 23) – – – (108.7) – – – – (108.7) – (108.7)Shares issued by ESOT – – – 92.0 – – – (37.2) 54.8 – 54.8Share option charge – – – – – – – 13.7 13.7 – 13.7Tax recognised directly in equity (Note 6) – – – – – – – 3.7 3.7 – 3.7Equity dividends (Note 7) – – – – – – – (581.9) (581.9) – (581.9)At 30 January 2016 15.1 0.9 14.8 (208.7) 29.4 (4.8) (1,443.8) 1,908.9 311.8 – 311.8
Profit for the year – – – – – – – 635.3 635.3 – 635.3Other comprehensive (expense)/income for the year – – – – (3.2) 0.3 – (2.2) (5.1) – (5.1)Total comprehensive (expense)/income for the year – – – – (3.2) 0.3 – 633.1 630.2 – 630.2
Share buybacks and commitments (Note 20) (0.4) – 0.4 – – – – (187.6) (187.6) – (187.6)ESOT share purchases and commitments (Note 23) – – – (50.9) – – – – (50.9) – (50.9)Shares issued by ESOT – – – 44.2 – – – (13.7) 30.5 – 30.5Share option charge – – – – – – – 13.1 13.1 – 13.1Tax recognised directly in equity (Note 6) – – – – – – – (10.8) (10.8) – (10.8)Equity dividends (Note 7) – – – – – – – (225.8) (225.8) – (225.8)At 28 January 2017 14.7 0.9 15.2 (215.4) 26.2 (4.5) (1,443.8) 2,117.2 510.5 – 510.5
Consolidated Statement of Changes in Equity
Go
vernanceShareho
lder Info
rmatio
n
99n e x t p l c . c o . u k
Financial Statements
Strategic R
epo
rt
Group
Com
pany

slugline
Consolidated Cash Flow Statement
52 weeks to 28 January
2017£m
53 weeks to 30 January
2016£m
Cash flows from operating activitiesOperating profit 827.7 867.2 Depreciation, impairment and loss on disposal of property, plant and equipment 116.3 117.7 Amortisation and impairment of intangible assets 0.4 0.3 Share option charge less amounts settled in cash 13.1 13.7 Exchange movement 0.3 2.9 Decrease/(increase) in inventories 35.3 (57.0) Increase in customer and other receivables (73.7) (214.5) (Decrease)/increase in trade and other payables (49.7) 29.4 Net pension contributions less income statement charge (19.3) 1.6Cash generated from operations 850.4 761.3 Corporation taxes paid (150.9) (153.0)Net cash from operating activities 699.5 608.3
Cash flows from investing activities Additions to property, plant and equipment (160.8) (151.0) Movement in capital accruals 3.8 3.5 Payments to acquire property, plant and equipment (157.0) (147.5) Proceeds from sale of property, plant and equipment 2.7 0.2 Proceeds from sale of investment in associate – 8.0Net cash from investing activities (154.3) (139.3)
Cash flows from financing activities Repurchase of own shares (187.6) (150.7) Purchase of shares by ESOT (50.9) (108.7) Disposal of shares by ESOT 29.9 53.0 (Repayment)/proceeds from unsecured bank loans (115.0) 115.0 Issue of corporate bond 297.3 – Repayment of corporate bond (212.6) – Interest paid (31.5) (30.8) Interest received 0.1 0.6 Payment of finance lease liabilities – (0.1) Dividends paid (Note 7) (314.1) (567.5)Net cash from financing activities (584.4) (689.2)
Net decrease in cash and cash equivalents (39.2) (220.2)Opening cash and cash equivalents 52.7 272.7Effect of exchange rate fluctuations on cash held 0.9 0.2Closing cash and cash equivalents (Note 28) 14.4 52.7
100 n e x t p l c . c o . u k

slugline
Group Accounting Policies
General informationNEXT plc and its subsidiaries (the “Group”) is a UK based retailer offering exciting, beautifully designed, excellent quality clothing, footwear, accessories and home products. The Company is a public limited company, which is listed on the London Stock Exchange and incorporated in England and Wales and domiciled in the UK. The address of the registered office is Desford Road, Enderby, Leicester, LE19 4AT.
Basis of preparationThe financial statements of NEXT plc and the Group have been prepared in accordance with International Financial Reporting Standards (IFRS) adopted for use in the European Union and in accordance with the Companies Act 2006. The financial statements have been prepared on the historical cost basis except for certain financial instruments, pension assets and liabilities and share-based payment liabilities which are measured at fair value. As is common in the retail sector, the Group operates a weekly accounting calendar and this year the financial statements are for the 52 weeks to 28 January 2017 (last year 53 weeks to 30 January 2016) which means that some figures may not be directly comparable. To aid comparability, we have also presented 52 week sales and profit figures for the prior year which are shown in Note 1 of the financial statements.
There have been no changes to our accounting policies this year and the principal policies adopted are set out below.
Basis of consolidationThe consolidated financial statements incorporate the financial statements of NEXT plc (the “Company”) and its subsidiary undertakings. Subsidiaries are entities over which the Group has control. All intra-group transactions, balances, income and expenses are eliminated on consolidation.
Associates are all entities over which the Group has significant influence but not control. Investments in associates are accounted for using the equity method of accounting. Under the equity method, the investment is initially recognised at cost, and the carrying amount is increased or decreased to recognise the Group’s share of the change in net assets of the associate after the acquisition date.
Foreign currenciesThe consolidated financial statements are presented in Pounds Sterling, which is the Company’s functional and presentation currency. The Group includes foreign entities whose functional currencies are not Sterling. On consolidation, the assets and liabilities of those entities are translated at the exchange rates at the balance sheet date and income and expenses are translated at weighted average rates during the period. Translation differences are recognised in other comprehensive income.
Transactions in currencies other than an entity’s functional currency are recorded at the exchange rate on the transaction date, whilst assets and liabilities are translated at exchange rates at the balance sheet date. Exchange differences are recognised in the income statement, except when deferred in other comprehensive income as qualifying cash flow hedges.
RevenueRevenue represents the fair value of amounts receivable for goods and services and is stated net of discounts, value added taxes and returns. Sales of goods are recognised on delivery.
It is the Group’s policy to sell its products to the retail customer with a right to return within 14 days. Accumulated experience is used to estimate and provide for such returns at the time of sale. Revenue is adjusted for the value of expected returns. The Group does not operate any loyalty programmes. Revenue from the sale of gift cards is deferred until their redemption.
Directory account interest is accrued on a time basis by reference to the principal outstanding and the effective interest rate.
Where third-party goods are sold on a commission basis, only the commission receivable is included in statutory revenue. To aid comparability, “Total sales” are disclosed in the Strategic Report and in Note 1 of the financial statements. This includes the full customer sales value of commission based sales and interest income, excluding VAT.
Go
vernanceShareho
lder Info
rmatio
n
101n e x t p l c . c o . u k
Financial Statements
Strategic R
epo
rt
Group
Com
pany

slugline
Revenue (continued)
Royalty income is received from franchisees and is recognised on an accruals basis in accordance with the substance of the relevant agreements.
Property, plant and equipmentProperty, plant and equipment are stated at cost less accumulated depreciation and impairment.
Depreciation is charged so as to write down the cost of assets to their estimated residual values over their remaining useful lives on a straight line basis. Estimated useful lives and residual values are reviewed at least annually. Estimated useful lives are summarised as follows:
Freehold and long leasehold property 50 yearsPlant and fittings: Plant and fittings 6–25 years Leasehold improvements the period of the lease, or useful life if shorter
GoodwillGoodwill arises on the acquisition of subsidiaries and represents the excess of the consideration transferred over the fair value of the identifiable net assets acquired. Goodwill is initially measured at cost, being the excess of the acquisition cost over the Group’s interest in the assets and liabilities recognised. Goodwill is not amortised, but is reviewed for impairment annually or whenever there is an indication of impairment. For the purposes of impairment testing, goodwill acquired is allocated to the cash generating unit (CGU) that is expected to benefit from the synergies of the combination. The carrying value of the CGU containing the goodwill is compared to the recoverable amount, which is the higher of value in use and the fair value less costs of disposal. Any impairment is recognised immediately as an expense and is not subsequently reversed.
Other intangible assetsOther intangible assets relate to the Lipsy brand names and trademarks obtained on acquisition which were initially recognised at fair value. They are amortised on a straight line basis over their expected useful lives of 10 years.
Other intangible assets are reviewed for impairment whenever events or changes in circumstances indicate their carrying value may not be recoverable.
InvestmentsInvestments in subsidiary companies (Parent Company only) and equity instruments that do not have a quoted market price in an active market and whose fair value cannot be reliably measured are stated at cost, subject to review for impairment.
ImpairmentThe carrying values of non-financial assets are reviewed at each balance sheet date to determine whether there is any indication of impairment. If any impairment loss arises, the asset value is adjusted to its estimated recoverable amount and the difference is recognised in the income statement.
Inventories Inventories (stocks) are valued at the lower of standard cost or net realisable value. Net realisable value is based on estimated selling prices less further costs to be incurred to disposal. Where hedge accounting applies, an adjustment is applied such that the cost of stock reflects the hedged exchange rate.
Group Accounting Policies
102 n e x t p l c . c o . u k

slugline
Directory and other receivablesDirectory customer receivables represent outstanding customer balances less any allowance for impairment which is based on objective evidence and relevant default experience by customer account category. Other trade receivables are stated at invoice value less any allowance for impairment.
Cash and cash equivalentsFor the purposes of the consolidated cash flow statement, cash and cash equivalents consist of cash and short term deposits, less bank overdrafts which are repayable on demand. Short term deposits are those with an original maturity of three months or less. Refer to Note 28 of the financial statements.
Corporate bonds and bank borrowingsCorporate bonds and bank borrowings are initially recognised at fair value, net of transaction costs incurred and subsequently measured at amortised cost and adjusted where hedge accounting applies (see interest rate derivatives on page 104). Accrued interest is included within other creditors and accruals.
Pension arrangementsThe Group provides pension benefits which include both defined benefit and defined contribution arrangements. Pension assets are held in separate trustee administered funds and the Group also provides other, unfunded, pension benefits to certain plan members.
The cost of providing benefits under the defined benefit and unfunded arrangements are determined separately for each plan using the projected unit credit method, with actuarial valuations being carried out at each balance sheet date by external actuaries. The present value of the defined benefit obligation is determined by discounting the estimated future cash outflows using interest rates of high quality corporate bonds that are denominated in the currency in which the benefits will be paid, and that have terms to maturity approximating to the terms of the related pension obligation. A net pension asset is only recognised to the extent that it is expected to be recoverable in the future through a cash refund or a reduction in future payments.
The current service cost of the defined benefit plan is recognised in the income statement as an employee benefit expense. The net interest cost is calculated by applying the discount rate to the net balance of the defined benefit obligation and the fair value of the plan assets.
Actuarial gains and losses arising from experience adjustments and changes in actuarial assumptions are charged or credited to other comprehensive income in the period in which they arise.
The cost of defined contribution schemes is recognised in the income statement as incurred. The Group has no further payment obligations once the contributions have been paid.
Share-based paymentThe fair value of employee share options is calculated when they are granted using a Black-Scholes model and the fair value of equity-settled LTIP awards is calculated at grant using a Monte Carlo model. The resulting cost is charged in the income statement over the vesting period of the option or award, and is regularly reviewed and adjusted for the expected and actual number of options or awards vesting. The social security contributions payable in connection with the grant of the share options is considered an integral part of the grant itself, and the charge is treated as a cash-settled transaction.
For cash-settled awards, the fair value of the liability is determined at each balance sheet date and the cost is recognised in the income statement over the vesting period.
Dividend incomeDividend income is recognised when the right to receive payment is established.
Go
vernanceShareho
lder Info
rmatio
n
103n e x t p l c . c o . u k
Financial Statements
Strategic R
epo
rt
Group
Com
pany

slugline
TaxationTaxation, comprised of current and deferred tax, is charged or credited to the income statement unless it relates to items recognised in other comprehensive income or directly in equity. In such cases, the related tax is also recognised in other comprehensive income or directly in equity.
Current tax liabilities are measured at the amount expected to be paid, based on tax rates and laws that are enacted or substantively enacted at the balance sheet date.
Deferred tax is accounted for using the balance sheet liability method and is calculated using rates of taxation enacted or substantively enacted at the balance sheet date which are expected to apply when the asset or liability is settled.
Deferred tax liabilities are generally recognised for all taxable temporary differences. Deferred tax assets are only recognised to the extent that it is probable that taxable profits will be available against which deductible temporary differences can be utilised. Deferred tax is not recognised in respect of investments in subsidiaries and associates where the reversal of any taxable temporary differences can be controlled and are unlikely to reverse in the foreseeable future. Deferred tax assets and liabilities are offset when there is a legally enforceable right to offset and there is an intention to settle the balances on a net basis.
Tax provisions are recognised when there is a potential exposure under changes to International tax legislation. Management uses professional advisers and in-house tax experts to determine the amounts to be provided.
Other financial assets and liabilities: derivative financial instruments and hedge accountingDerivative financial instruments (“derivatives”) are used to manage risks arising from changes in foreign currency exchange rates relating to the purchase of overseas sourced products and changes in interest rates relating to the Group’s debt. In accordance with its treasury policy, the Group does not enter into derivatives for speculative purposes. Foreign currency and interest rate derivatives are stated at their fair value, being the estimated amount that the Group would receive or pay to terminate them at the balance sheet date based on prevailing foreign currency and interest rates.
The Group designates certain derivatives as either:
a. Hedges of fair value of recognised assets or liabilities or a firm commitment (fair value hedge); or
b. Hedges of a particular risk associated with a recognised asset or liability or a highly probable forecast transaction (cash flow hedge).
The Group documents at the inception of the transaction the relationship between hedging instruments and hedged items, as well as its risk management objectives and strategy for undertaking various hedging transactions. The Group also documents its assessment, both at hedge inception and on an ongoing basis, of whether the derivatives that are used in hedging transactions are highly effective in offsetting changes in fair values or cash flows of hedged items.
Interest rate derivatives – fair value hedges
The Group uses interest rate derivatives to hedge part of the interest rate risk associated with the Company’s corporate bonds. The carrying values of the relevant bonds are adjusted only for changes in fair value attributable to the interest rate risk being hedged. The adjustment is recognised in the income statement and is offset by movements in the fair value of the derivatives.
Changes in the fair value of interest rate derivatives which are ineffective or do not meet the criteria for hedge accounting in IAS 39 “Financial instruments: recognition and measurement” are recognised in the income statement.
Group Accounting Policies
104 n e x t p l c . c o . u k
slugline
Foreign currency derivatives – cash flow hedges
Changes in the fair value of foreign currency derivatives which are designated and effective as hedges of future cash flows are recognised in other comprehensive income and in the fair value reserve, and subsequently transferred to the carrying amount of the hedged item or the income statement. Realised gains or losses on cash flow hedges are therefore recognised in the income statement in the same period as the hedged item.
Hedge accounting is discontinued when the hedging instrument expires or is sold, terminated or exercised, or no longer qualifies for hedge accounting. At that time, any cumulative gain or loss on the hedging instrument previously recognised in equity is retained in equity until the hedged transaction occurs. If the hedged transaction is no longer expected to occur, the net cumulative gain or loss recognised in equity is then transferred to the income statement.
Changes in the fair value of foreign currency derivatives which are ineffective or do not meet the criteria for hedge accounting in IAS 39 are recognised in the income statement.
Share buybacksThe Group has regularly returned surplus cash to shareholders through share buybacks. Shares purchased for cancellation are deducted from retained earnings at the total consideration paid or payable. The Company also uses contingent share purchase contracts and irrevocable closed period buyback programmes; the obligation to purchase shares is recognised in full at the inception of the contract, even when that obligation is conditional on the share price. Any subsequent reduction in the obligation caused by the expiry or termination of a contract is credited back to equity at that time.
Shares held by ESOTThe NEXT Employee Share Ownership Trust (ESOT) provides for the issue of shares to Group employees, principally under share option schemes. Shares in the Company held by the ESOT are included in the balance sheet at cost, including any directly attributable incremental costs, as a deduction from equity.
ProvisionsA provision is recognised where the Group has a legal or constructive obligation as a result of a past event and it is probable that an outflow of economic benefits will be required to settle the obligation. Provisions are measured at the present value of the expenditures expected to be required to settle the obligation using a pre-tax rate that reflects current market assessments of the time value of money and the risks specific to the obligation.
Leasing commitmentsRentals payable under operating leases are charged to income on a straight line basis over the period of the lease. Contingent rentals payable based on store revenues are accrued in line with the related sales.
Premiums payable, rent free periods and capital contributions receivable on entering an operating lease are released to income on a straight line basis over the lease term.
Major sources of estimation uncertainty and judgementThe preparation of the financial statements requires judgements, estimations and assumptions to be made that affect the reported values of assets, liabilities, revenues and expenses. The nature of estimation and judgement means that actual outcomes could differ from expectation. Significant areas of estimation uncertainty and judgement for the Group include:
Go
vernanceShareho
lder Info
rmatio
n
105n e x t p l c . c o . u k
Financial Statements
Strategic R
epo
rt
Group
Com
pany

slugline
Major sources of estimation uncertainty and judgement (continued)
Recoverable amount of Directory customer receivables.
The provision for potentially irrecoverable debtors (refer to Note 11) is calculated using a combination of internally and externally sourced information, including historical default and collection rates and other credit data. The judgement applied in the basis for identifying when debtors are potentially impaired has been applied consistently. A 1% movement in default rate would move the provision by c£2.8m. A 1% movement in the collections rate would change the provision balance by c£1.0m.
Net realisable value of inventories
The selling prices of inventory are estimated to determine the net realisable value of inventory (£451.1m at 28 January 2017). Historical sales patterns and post year end trading performance are used to determine these. A 2% change in the volume of inventories going to clearance would impact the net realisable value by c£3m. A 2% change in the level of markdown applied to the selling price would impact the value of inventories going to clearance by c£6m.
Defined benefit pension valuation
The assumptions applied in determining value of the defined benefit pension obligation (refer to Note 18), which is particularly sensitive to small changes in assumptions. Advice is taken from a qualified actuary to determine appropriate assumptions at each balance sheet date. The actuarial valuation involves making assumptions about discount rates, mortality rates and future pension increases. Due to the complexity of the valuation, the underlying assumptions and the long term nature of these plans, such estimates are subject to significant uncertainty. A sensitivity analysis is shown in Note 18. In determining the appropriate discount rate, management considers the interest rates of high quality UK corporate bonds, with extrapolated maturities corresponding to the expected duration of the obligation. The mortality rate is based on publicly available mortality tables.
Other areas of estimation and judgement include product returns rates and property provisions. Product returns rates are based on historical returns rate patterns and are recorded so as to allocate them to the same period in which the original revenue is recorded. Sensitivities to the assumptions for product returns and property provisions are not expected to result in a material change in the carrying amount. These provisions are reviewed regularly and updated to reflect management’s latest best estimates.
New accounting standards Various new or revised accounting standards have been issued which are not yet effective. The key ones affecting the Group are described below. The Group does not intend to early adopt these standards.
a. IFRS 15 “Revenue from contracts with customers” will be effective for the year ending January 2019 onwards, and is not expected to have a significant impact on the Group’s revenues. The majority of the Group’s sales are for standalone products made direct to customers at standard prices either in store or through Directory. Estimates are already made of anticipated returns and sales awaiting delivery to the customer.
b. IFRS 9 “Financial instruments” will be effective for the year ending January 2019 onwards, the main impact being the impairment assessment methodology used to value our Directory receivables. An assessment of the full impact of this standard is in progress. Process and modelling amendments will be implemented in line with the required effective date.
c. IFRS 16 “Leases” will be effective for the year ending January 2020 onwards and the impact on the financial statements will be significant to NEXT. IFRS 16 requires lessees to recognise a lease liability reflecting future lease payments and a right-of-use asset for all lease contracts. Therefore, the substantial majority of the Group’s operating lease commitments (some £2bn on an undiscounted basis, as shown in Note 29) would be brought on balance sheet and amortised and depreciated separately. There will be no impact on cash flows although the presentation of the cash flow statement will change significantly. Management is currently working on the new processes and systems that will be required to comply with this accounting standard.
Group Accounting Policies
106 n e x t p l c . c o . u k

slugline
1. Segmental AnalysisThe Group’s operating segments are determined based on the Group’s internal reporting to the Chief Operating Decision Maker (CODM). The CODM has been determined to be the Group Chief Executive, with support from the Board. The performance of operating segments is assessed on profits before interest and tax, excluding equity-settled share option charges recognised under IFRS 2 “Share-based payment“ and unrealised foreign exchange gains or losses on derivatives which do not qualify for hedge accounting. The activities, products and services of the operating segments are detailed in the Strategic Report on page 26. The Property Management segment holds properties and property leases which are sublet to other segments and external parties. The NEXT International Retail segment comprises franchise and wholly owned stores overseas. International online sales are included in the NEXT Directory segment.
Where third-party branded goods are sold on a commission basis, only the commission receivable is included in statutory revenue. Total sales represents the amount payable by the customer, excluding VAT.
As the prior year was a 53 week period, to aid comparability the 52 week equivalent sales and profit figures are also shown.
Segment sales and revenue
52 weeks to 28 January 2017
Total sales excluding
VAT£m
Commission
sales adjustment
£m
External revenue
£m
Internal revenue
£m
Total segment revenue
£mNEXT Retail 2,304.6 (3.9) 2,300.7 5.9 2,306.6NEXT Directory 1,728.5 (34.1) 1,694.4 – 1,694.4NEXT International Retail 63.7 – 63.7 – 63.7NEXT Sourcing 5.3 – 5.3 599.9 605.2
4,102.1 (38.0) 4,064.1 605.8 4,669.9Lipsy 27.1 (1.5) 25.6 38.8 64.4Property Management 7.6 – 7.6 205.6 213.2Total segment sales/revenue 4,136.8 (39.5) 4,097.3 850.2 4,947.5Eliminations – – – (850.2) (850.2)Total 4,136.8 (39.5) 4,097.3 – 4,097.3
53 weeks to 30 January 2016 52 weeks Total sales excluding
VAT£m
Total sales excluding
VAT£m
Commission
sales adjustment
£m
External revenue
£m
Internal revenue
£m
Total segment revenue
£mNEXT Retail 2,373.5 2,406.0 (6.1) 2,399.9 6.2 2,406.1NEXT Directory 1,658.7 1,687.7 (29.4) 1,658.3 – 1,658.3NEXT International Retail 74.7 75.9 – 75.9 – 75.9NEXT Sourcing 7.0 7.2 – 7.2 675.7 682.9
4,113.9 4,176.8 (35.5) 4,141.3 681.9 4,823.2Lipsy 29.2 30.1 (1.3) 28.8 27.9 56.7Property Management 6.6 6.8 – 6.8 197.4 204.2Total segment sales/revenue 4,149.7 4,213.7 (36.8) 4,176.9 907.2 5,084.1Eliminations – – – – (907.2) (907.2)Total 4,149.7 4,213.7 (36.8) 4,176.9 – 4,176.9
Notes to the Consolidated Financial Statements
Go
vernanceShareho
lder Info
rmatio
n
107n e x t p l c . c o . u k
Financial Statements
Strategic R
epo
rt
Group
Com
pany

slugline
1. Segmental Analysis (continued)
Segment profit
52 weeks to 28 January
2017£m
52 weeks to 23 January
2016£m
53 weeks to 30 January
2016£m
NEXT Retail 338.7 402.1 408.1NEXT Directory 444.1 405.2 413.3NEXT International Retail 9.3 10.2 10.4NEXT Sourcing 44.7 50.5 51.1
836.8 868.0 882.9Lipsy 5.5 5.3 5.7Property Management 6.8 7.4 7.5Total segment profit 849.1 880.7 896.1Central costs and other (9.4) (10.6) (10.6)Share option charge (13.1) (13.7) (13.7)Unrealised foreign exchange gains/(losses) 0.1 (5.6) (5.6)Trading profit 826.7 850.8 866.2Share of results of associate 1.0 1.0 1.0Finance income 0.3 0.5 0.5Finance costs (37.8) (31.0) (31.6)Profit before tax 790.2 821.3 836.1
Transactions between operating segments are made on an arm’s length basis in a manner similar to those with third-parties. Segment revenue and segment profit include transactions between business segments which are eliminated on consolidation. The substantial majority of NEXT Sourcing’s revenues and profits are derived from sales to NEXT Retail and NEXT Directory.
Segment assets, capital expenditure and depreciation
Property, plant and equipment
Capital expenditure Depreciation
2017£m
2016£m
2017£m
2016£m
2017£m
2016£m
NEXT Retail 405.4 367.0 138.2 126.7 96.0 95.7NEXT Directory 88.6 85.6 19.0 17.7 15.7 14.4NEXT International Retail 0.7 0.8 – – 0.3 0.3NEXT Sourcing 2.8 2.7 1.0 1.2 1.0 0.9Lipsy 3.2 3.2 0.9 2.1 1.0 1.0Property Management 77.9 77.1 1.7 3.3 0.3 0.3Total 578.6 536.4 160.8 151.0 114.3 112.6
The amounts provided to the Board with respect to assets are measured in a manner consistent with that of the financial statements. These assets are allocated based on the operations of the segment and the physical location of the asset.
Impairment charges in relation to property, plant and equipment are included in the NEXT Retail segment. Segment liabilities have not been disclosed as these are not regularly provided to the CODM.
Notes to the Consolidated Financial Statements
108 n e x t p l c . c o . u k

slugline
1. Segmental Analysis (continued)
Analyses of the Group’s external revenues (by customer location) and non-current assets (excluding investments, the defined benefit pension surplus, other financial assets and deferred tax assets) by geographical location are detailed below:
External revenue by geographical location2017
£m2016
£mUnited Kingdom 3,713.5 3,781.9Rest of Europe 218.2 238.2Middle East 88.1 75.7Asia 50.2 52.8Rest of World 27.3 28.3
4,097.3 4,176.9
Non-current assets by geographical location2017
£m2016
£mUnited Kingdom 583.0 541.3Rest of Europe 5.3 6.5Middle East 4.3 5.0Asia 29.3 27.3
621.9 580.1
2. Revenue by Type2017
£m2016
£mSale of goods 3,866.0 3,966.8Directory account interest 213.7 192.5Royalties 9.9 10.8Rental income 7.7 6.8Revenue 4,097.3 4,176.9
Go
vernanceShareho
lder Info
rmatio
n
109n e x t p l c . c o . u k
Financial Statements
Strategic R
epo
rt
Group
Com
pany

slugline
3. Operating ProfitGroup operating profit is stated after charging/(crediting):
2017£m
2016£m
Depreciation on tangible assets 114.3 112.6(Profit)/loss on disposal of property, plant and equipment (1.2) 1.0Impairment charges on tangible assets 3.2 4.1Amortisation of intangible assets 0.4 0.3
Operating lease rentals: Minimum lease payments (net of amortisation of incentives) 219.8 208.6 Contingent rentals payable 5.8 6.0
Customer and other receivables: Impairment charge 35.0 28.7 Amounts recovered (6.9) (2.1)
Cost of inventories recognised as an expense 1,441.0 1,474.6Write down of inventories to net realisable value 109.9 103.7
1,550.9 1,578.3
Cost of inventories recognised as an expense consists of those costs which are directly attributable to goods sold in the year, including packaging and inbound freight costs.
Gains and losses on cash flow hedges removed from equity and included in the income statement for the period comprise gains of £91.2m (2016: £30.0m) included in cost of sales.
Unrealised foreign exchange gains/(losses) reported in the income statement represent foreign exchange gains of £0.1m (2016: losses of £5.6m) in respect of derivative contracts which do not qualify for hedge accounting under IAS 39.
Other foreign exchange differences recognised in the income statement were gains of £4.2m (2016: £1.4m).
During the year the Group (including its overseas subsidiaries) obtained the following services from the Company’s auditor and its associates:
2017£000
2016 £000
Auditor's remunerationAudit of the financial statements 240 212Audit of subsidiaries 358 324Total audit fees 598 536Other services: Tax compliance 20 21 Tax advisory services 10 – Other assurance services 159 22
787 579
Notes to the Consolidated Financial Statements
110 n e x t p l c . c o . u k

slugline
4. Staff Costs and Key Management PersonnelTotal staff costs were as follows:
2017£m
2016£m
Wages and salaries 594.6 600.6Social security costs 39.5 37.9Other pension costs 20.5 21.1
654.6 659.6Share-based payments expense – equity-settled 13.1 13.7Share-based payments (benefit)/expense – cash-settled (2.3) 7.4
665.4 680.7
Share-based payments comprise Management options, Sharesave options and potential LTIP and SMP awards, details of which are given in Note 22.
Total staff costs by business sector were made up as follows:
2017£m
2016£m
NEXT Retail and Directory 619.2 634.3NEXT International Retail 1.9 1.8NEXT Sourcing 27.5 27.0Other activities 16.8 17.6Total 665.4 680.7
Average employees Full-time equivalents
2017Number
2016Number
2017Number
2016Number
NEXT Retail and Directory 44,887 47,039 26,445 26,528NEXT International Retail 135 152 111 124NEXT Sourcing 3,760 3,743 3,760 3,743Other activities 251 245 209 196Total 49,033 51,179 30,525 30,591
The aggregate amounts charged in the accounts for key management personnel (including employer’s National Insurance contributions), being the directors of NEXT plc, were as follows:
2017£m
2016£m
Short term employee benefits 2.9 4.4Post-employment benefits 0.3 0.2Share-based payments (0.4) 2.1
2.8 6.7
Directors’ remuneration is detailed in the Remuneration Report.
Go
vernanceShareho
lder Info
rmatio
n
111n e x t p l c . c o . u k
Financial Statements
Strategic R
epo
rt
Group
Com
pany

slugline
5. Finance Income and Costs2017
£m2016
£mInterest on bank deposits 0.2 0.5Other fair value movements 0.1 –Finance income 0.3 0.5
Interest on bonds and other borrowings 37.8 31.9Other fair value movements – (0.3)Finance costs 37.8 31.6
Directory account interest is presented as a component of revenue.
6. TaxationTax charge for the yearOur tax charge for the year is shown below. Tax is made up of current and deferred tax. Current tax is the amount payable on the taxable income in the year and any adjustments to tax payable in previous years. Deferred tax is explained on page 113.
2017£m
2016£m
Current tax:Current tax on profits for the year 157.1 174.1Adjustments in respect of prior years – (2.9)Total current tax 157.1 171.2
Deferred tax:Origination and reversal of temporary differences 1.1 (6.4)Adjustments in respect of prior years (3.3) 4.5Tax expense reported in the consolidated income statement 154.9 169.3
Factors affecting the tax charge in the yearThe tax rate for the current year varied from the standard rate of corporation tax in the UK due to the following factors:
2017 %
2016 %
UK corporation tax rate 20.0 20.2Non-deductible expenses 0.6 0.4Overseas tax differentials (0.6) (0.5)Adjustments in respect of prior years (0.4) 0.1Effective total tax rate on profit before taxation 19.6 20.2
Notes to the Consolidated Financial Statements
112 n e x t p l c . c o . u k

slugline
6. Taxation (continued)
Tax recognised in other comprehensive income and equityIn addition to the amount charged to the income statement, tax movements recognised in other comprehensive income and in equity were as follows:
2017£m
2016£m
Deferred tax:Pension benefit obligation (0.2) 1.9Fair value movements on derivative instruments (2.0) (3.4)Tax (credit) in other comprehensive income (2.2) (1.5)
2017£m
2016£m
Current tax:Share-based payments (2.0) (17.8)Deferred tax:Share-based payments 12.8 14.1Tax charge/(credit) in the statement of changes in equity 10.8 (3.7)
Deferred taxThe deferred tax (liability)/asset is made up of:
2017£m
2016£m
Accelerated capital allowances (0.4) (1.1)Revaluation of derivatives to fair value (5.2) (7.1)Pension benefit obligations (10.7) (9.2)Share-based payments 3.3 18.2Other temporary differences 7.3 1.9
(5.7) 2.7
Deferred tax is the tax expected to be payable or recoverable in the future arising from temporary differences that arise when the carrying value of assets and liabilities differ between accounting and tax treatments. Deferred tax assets represent the amounts of income taxes recoverable in the future in respect of those differences, while deferred tax liabilities represent the amounts of income taxes payable in the future in respect of those differences.
Go
vernanceShareho
lder Info
rmatio
n
113n e x t p l c . c o . u k
Financial Statements
Strategic R
epo
rt
Group
Com
pany

slugline
6. Taxation (continued)
The deferred tax movement in the year is as follows:
2017£m
2016£m
At the beginning of the year 2.7 13.3Recognised in the income statement: Accelerated capital allowances 0.7 2.8 Revaluation of derivatives to fair value (0.1) 1.2 Pension benefit obligations (1.7) 0.3 Share-based payments (2.1) (0.8) Other temporary differences 5.4 (1.5)Recognised in other comprehensive income 2.2 1.5Recognised in the statement of changes in equity (12.8) (14.1)At the end of the year (5.7) 2.7
There has been a reduction in the deferred tax asset for share-based payments due to a reduction in the Company’s share price during the year. Deferred tax assets are recognised for tax losses carried forward to the extent that the realisation of the related tax benefit through future taxable profits is probable. No recognition has been made of the following deferred tax assets:
Gross value2017
£m
Unrecognised deferred tax
2017£m
Gross value2016
£m
Unrecognised deferred tax
2016£m
Capital losses 34.5 5.8 42.6 8.5
The benefit of unrecognised capital losses will only accrue if taxable profits are realised on future disposals of the Group’s capital assets.
Factors affecting tax charges in future yearsChanges to the UK corporation tax rates were substantively enacted as part of the Finance Bill 2016 (on 6 September 2016). These include reductions to the main rate of corporation tax to 19% from 1 April 2017 and to 17% from 1 April 2020. Deferred taxes at the balance sheet date have been measured using these enacted tax rates and reflected in these financial statements.
The Group’s effective tax rate is forecast to remain broadly in line with UK corporation tax rates.
Provisions, which are immaterial to the accounts, have been recognised in relation to uncertain tax positions. These relate to the interpretation of tax legislation, including changes arising from the OECD’s Base Erosion and Profit Shifting project, that impact our NEXT Sourcing operation in its ordinary course of business. Any uncertainty is likely to lessen as the business responds to these rule changes.
NEXT seeks to manage its tax affairs responsibly and proactively to comply with tax legislation. We seek to build solid and working relationships with all tax authorities.
7. Dividends
Year to January 2017 Paid Pence per
share
Cash flow statement
£m
Statement of changes
in equity£m
Jan 2017 balance
sheet£m
Special interim dividend 1 Feb 2016 60p 88.3 – –Final ordinary dividend for year to Jan 2016 1 Aug 2016 105p 150.2 150.2 –Interim ordinary dividend for year to Jan 2017 3 Jan 2017 53p 75.6 75.6 –
314.1 225.8 –
Notes to the Consolidated Financial Statements
114 n e x t p l c . c o . u k

slugline
7. Dividends (continued)
Year to January 2016 Paid Pence per
share
Cash flow statement
£m
Statement of changes
in equity£m
Jan 2016 balance
sheet£m
Special interim dividend 2 Feb 2015 50p 73.9 – –Special interim dividend 1 May 2015 60p 88.9 88.9 –Special interim dividend 3 Aug 2015 60p 88.9 88.9 –Final ordinary dividend for year to Jan 2015 3 Aug 2015 100p 148.1 148.1 –Special interim dividend 2 Nov 2015 60p 88.9 88.9 –Interim ordinary dividend for year to Jan 2016 4 Jan 2016 53p 78.8 78.8 –Special interim dividend 1 Feb 2016 60p – 88.3 88.3
567.5 581.9 88.3
The February 2016 special interim dividend was announced on 5 January 2016 and shares in NEXT plc traded ex-dividend from 14 January. The liability of £88.3m was recorded in the January 2016 balance sheet on the basis that it could not realistically have been cancelled after the ex-dividend date, and was paid on 1 February 2016.
It is intended that this year’s ordinary final dividend of 105p per share will be paid to shareholders on 1 August 2017. NEXT plc shares will trade ex-dividend from 6 July 2017 and the record date will be 7 July 2017. The estimated amount payable is £149.8m.
The proposed final dividend is subject to approval by shareholders at the Annual General Meeting and has not been included as a liability in these financial statements. The Trustee of the ESOT has waived dividends paid in the year on shares held by the ESOT.
8. Earnings Per Share2017 2016
Basic Earnings Per Share Total (52 weeks v 53 weeks) 441.3p 450.5p Underlying (52 weeks v 52 weeks) 441.3p 442.5p
Basic Earnings Per Share is based on the profit for the year attributable to the equity holders of the Parent Company divided by the net of the weighted average number of shares ranking for dividend less the weighted average number of shares held by the ESOT during the period.
2017 2016Diluted Earnings Per Share Total (52 weeks v 53 weeks) 438.1p 443.0p Underlying (52 weeks v 52 weeks) 438.1p 435.1p
Diluted Earnings Per Share is calculated by adjusting the weighted average number of shares used for the calculation of basic Earnings Per Share as increased by the dilutive effect of potential ordinary shares. Dilutive shares arise from employee share option schemes where the exercise price is less than the average market price of the Company’s ordinary shares during the period. Their dilutive effect is calculated on the basis of the equivalent number of nil cost options. Where the option price is above the average market price, the option is not dilutive and is excluded from the diluted EPS calculation. There were 2,578,878 non-dilutive share options in the current year (2016: nil).
Go
vernanceShareho
lder Info
rmatio
n
115n e x t p l c . c o . u k
Financial Statements
Strategic R
epo
rt
Group
Com
pany

slugline
8. Earnings Per Share (continued)2017 2016
Fully diluted Earnings Per Share Total (52 weeks v 53 weeks) 426.2p 434.4p Underlying (52 weeks v 52 weeks) 426.2p 426.7p
Fully diluted Earnings Per Share is based on the weighted average number of shares used for the calculation of basic Earnings Per Share, increased by the weighted average total employee share options outstanding during the period. Underlying fully diluted Earnings Per Share is used for the purposes of the Share Matching Plan, described further in the Remuneration Report.
The table below shows the key variables used in the Earnings Per Share calculations:
2017£m
2016£m
Profit after tax attributable to equity holders of the Parent Company 635.3 666.8 Less 53rd week profit in current year (post-tax) – (11.8) 52 week underlying profit (for underlying EPS) 635.3 655.0
Weighted average number of shares (millions) Weighted average shares in issue 148.4 152.7 Weighted average shares held by ESOT (4.4) (4.7) Weighted average shares for basic EPS 144.0 148.0 Weighted average dilutive potential shares 1.0 2.5 Weighted average shares for diluted EPS 145.0 150.5
Weighted average shares for basic EPS 144.0 148.0 Weighted average total share options outstanding 5.1 5.5 Weighted average shares for fully diluted EPS 149.1 153.5
As detailed in the Remuneration Report, the annual bonus for executive directors is determined by reference to underlying pre-tax Earnings Per Share of 548.9p (2016: 554.8p). This is calculated using 52 week underlying pre-tax profit of £790.2m (2016: £821.3m) as shown in Note 1 divided by the net of the weighted average number of shares in issue less the weighted average number of shares held by the ESOT during the period.
Notes to the Consolidated Financial Statements
116 n e x t p l c . c o . u k

slugline
9. Property, Plant and EquipmentFreehold property
£m
Leasehold property
£m
Plant and fittings
£mTotal
£mCostAt January 2015 74.8 9.4 1,541.3 1,625.5Exchange movement – – 0.2 0.2Additions 2.6 – 148.4 151.0Disposals – – (93.0) (93.0)At January 2016 77.4 9.4 1,596.9 1,683.7Exchange movement – – 1.6 1.6Additions 1.8 – 159.0 160.8Disposals (0.8) – (54.2) (55.0)At January 2017 78.4 9.4 1,703.3 1,791.1
DepreciationAt January 2015 7.8 1.6 1,112.8 1,122.2Exchange movement – – 0.2 0.2Provided during the year 0.2 – 112.4 112.6Impairment charge – – 4.1 4.1Disposals – – (91.8) (91.8)At January 2016 8.0 1.6 1,137.7 1,147.3Exchange movement – – 1.3 1.3Provided during the year 0.2 – 114.1 114.3Impairment charge – – 3.2 3.2Disposals – – (53.6) (53.6)
At January 2017 8.2 1.6 1,202.7 1,212.5
Carrying amountAt January 2017 70.2 7.8 500.6 578.6At January 2016 69.4 7.8 459.2 536.4At January 2015 67.0 7.8 428.5 503.3
At January 2017 the Group had entered into contractual commitments for the acquisition of property, plant and equipment amounting to £14.2m (2016: £33.6m).
Impairment charges relate to the impairment of shop fittings on loss-making stores.
Go
vernanceShareho
lder Info
rmatio
n
117n e x t p l c . c o . u k
Financial Statements
Strategic R
epo
rt
Group
Com
pany
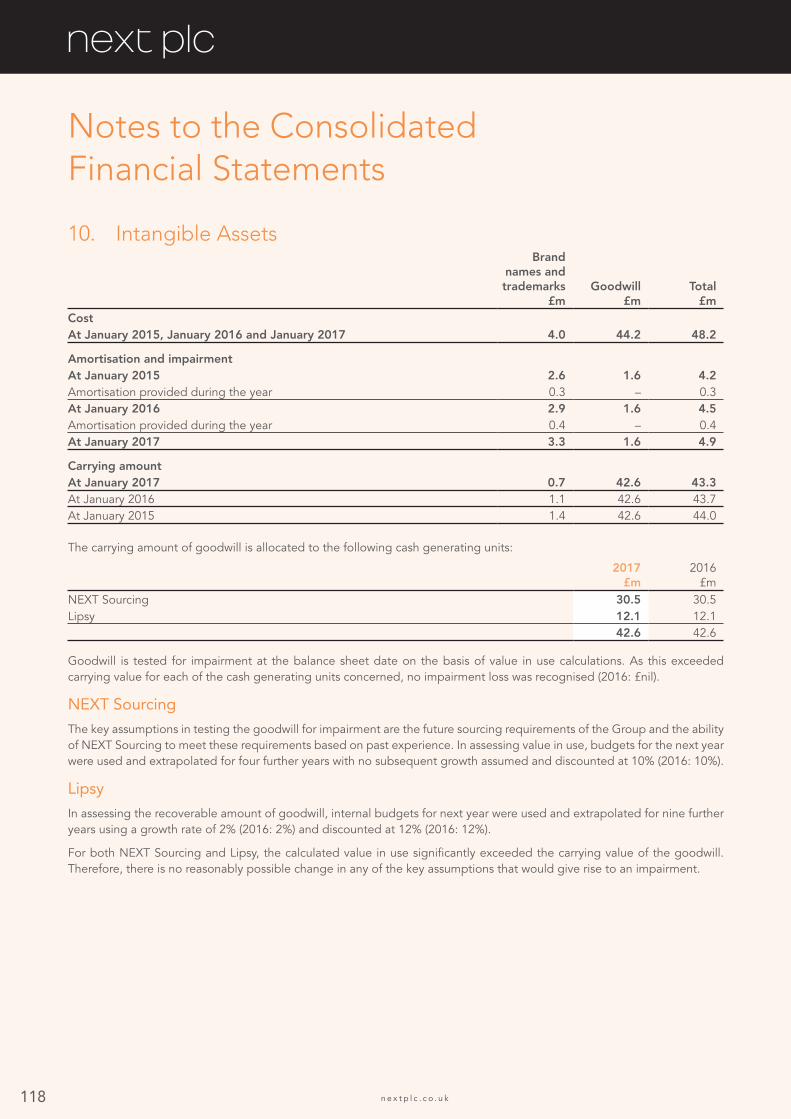
slugline
10. Intangible Assets Brand
names and trademarks
£m Goodwill
£m Total
£mCostAt January 2015, January 2016 and January 2017 4.0 44.2 48.2
Amortisation and impairmentAt January 2015 2.6 1.6 4.2Amortisation provided during the year 0.3 – 0.3At January 2016 2.9 1.6 4.5Amortisation provided during the year 0.4 – 0.4At January 2017 3.3 1.6 4.9
Carrying amountAt January 2017 0.7 42.6 43.3At January 2016 1.1 42.6 43.7At January 2015 1.4 42.6 44.0
The carrying amount of goodwill is allocated to the following cash generating units:
2017£m
2016£m
NEXT Sourcing 30.5 30.5Lipsy 12.1 12.1
42.6 42.6
Goodwill is tested for impairment at the balance sheet date on the basis of value in use calculations. As this exceeded carrying value for each of the cash generating units concerned, no impairment loss was recognised (2016: £nil).
NEXT SourcingThe key assumptions in testing the goodwill for impairment are the future sourcing requirements of the Group and the ability of NEXT Sourcing to meet these requirements based on past experience. In assessing value in use, budgets for the next year were used and extrapolated for four further years with no subsequent growth assumed and discounted at 10% (2016: 10%).
LipsyIn assessing the recoverable amount of goodwill, internal budgets for next year were used and extrapolated for nine further years using a growth rate of 2% (2016: 2%) and discounted at 12% (2016: 12%).
For both NEXT Sourcing and Lipsy, the calculated value in use significantly exceeded the carrying value of the goodwill. Therefore, there is no reasonably possible change in any of the key assumptions that would give rise to an impairment.
Notes to the Consolidated Financial Statements
118 n e x t p l c . c o . u k
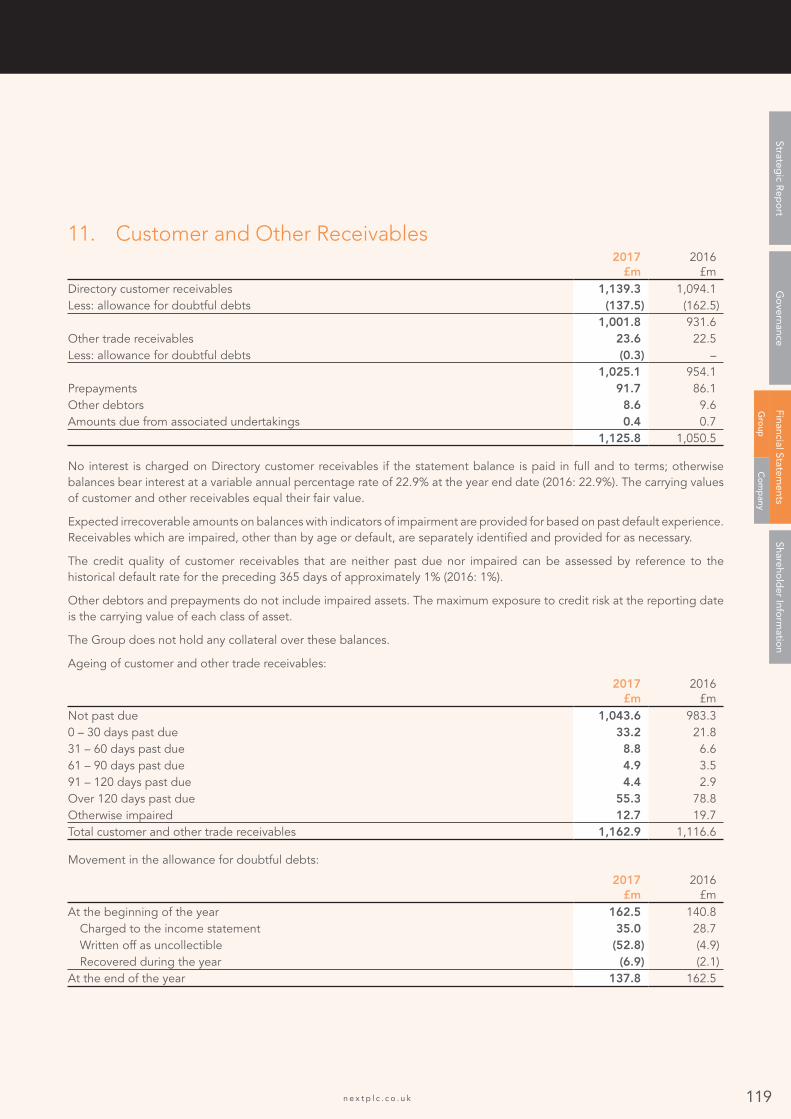
slugline
11. Customer and Other Receivables2017
£m2016
£mDirectory customer receivables 1,139.3 1,094.1Less: allowance for doubtful debts (137.5) (162.5)
1,001.8 931.6Other trade receivables 23.6 22.5Less: allowance for doubtful debts (0.3) –
1,025.1 954.1Prepayments 91.7 86.1Other debtors 8.6 9.6Amounts due from associated undertakings 0.4 0.7
1,125.8 1,050.5
No interest is charged on Directory customer receivables if the statement balance is paid in full and to terms; otherwise balances bear interest at a variable annual percentage rate of 22.9% at the year end date (2016: 22.9%). The carrying values of customer and other receivables equal their fair value.
Expected irrecoverable amounts on balances with indicators of impairment are provided for based on past default experience. Receivables which are impaired, other than by age or default, are separately identified and provided for as necessary.
The credit quality of customer receivables that are neither past due nor impaired can be assessed by reference to the historical default rate for the preceding 365 days of approximately 1% (2016: 1%).
Other debtors and prepayments do not include impaired assets. The maximum exposure to credit risk at the reporting date is the carrying value of each class of asset.
The Group does not hold any collateral over these balances.
Ageing of customer and other trade receivables:
2017£m
2016£m
Not past due 1,043.6 983.30 – 30 days past due 33.2 21.831 – 60 days past due 8.8 6.661 – 90 days past due 4.9 3.591 – 120 days past due 4.4 2.9Over 120 days past due 55.3 78.8Otherwise impaired 12.7 19.7Total customer and other trade receivables 1,162.9 1,116.6
Movement in the allowance for doubtful debts:
2017£m
2016£m
At the beginning of the year 162.5 140.8 Charged to the income statement 35.0 28.7 Written off as uncollectible (52.8) (4.9) Recovered during the year (6.9) (2.1)At the end of the year 137.8 162.5
Go
vernanceShareho
lder Info
rmatio
n
119n e x t p l c . c o . u k
Financial Statements
Strategic R
epo
rt
Group
Com
pany

slugline
12. Other Financial Assets2017 2016
Current£m
Non-current£m
Current£m
Non-current£m
Foreign exchange contracts 34.0 – 37.2 –Interest rate derivatives – 57.3 1.7 57.0
34.0 57.3 38.9 57.0
Foreign exchange contracts comprise forward contracts and options, the majority of which are used to hedge exchange risk arising from the Group’s merchandise purchases (refer to Note 24). These instruments are primarily for US Dollars and Euros. Interest rate derivatives relate to the corporate bonds (refer to Note 17).
13. Cash and Short Term Deposits2017
£m2016
£mCash at bank and in hand 49.7 46.3Short term deposits – 20.0
49.7 66.3
Cash at bank earns interest at floating rates based on daily bank deposit rates. Short term deposits are made for varying periods of between one day and three months depending on the cash requirements of the Group and earn interest at short term market deposit rates.
14. Bank Loans and Overdrafts2017
£m2016
£mBank overdrafts 35.3 13.6Unsecured bank loans – 115.0
35.3 128.6
Bank overdrafts are repayable on demand and bear interest at a margin over bank base rates. Unsecured bank loans relate to amounts drawn under a medium term bank revolving credit facility which bear interest at a margin above LIBOR (refer to Note 24).
15. Trade Payables and Other Liabilities2017 2016
Current£m
Non-current£m
Current£m
Non-current£m
Trade payables 186.1 – 219.0 –Other taxation and social security 62.5 – 76.8 –Deferred revenue from sale of gift cards 77.3 – 74.0 –Property lease incentives 31.9 212.9 31.4 198.4Share-based payment liability 1.9 5.6 10.2 6.4Other creditors and accruals 256.1 8.4 262.1 6.7
615.8 226.9 673.5 211.5
Trade payables do not bear interest and are generally settled on 30 day terms. Other creditors and accruals do not bear interest. Property lease incentives are classified as non-current to the extent that they will be credited to the income statement more than one year from the balance sheet date.
Notes to the Consolidated Financial Statements
120 n e x t p l c . c o . u k

slugline
16. Other Financial Liabilities2017 2016
Current£m
Non-current£m
Current£m
Non-current£m
Foreign exchange contracts 3.2 – 1.3 –Interest rate derivatives – 16.5 – 13.9
3.2 16.5 1.3 13.9
Foreign exchange contracts comprise forward contracts and options, the majority of which are used to hedge exchange risk arising from the Group’s merchandise purchases (refer to Note 24). These instruments are primarily for US Dollars and Euros. Interest rate derivatives relate to the corporate bonds (refer to Note 17).
17. Corporate BondsBalance sheet
valueNominal value
2017£m
2016£m
2017£m
2016£m
Corporate bond 5.875% repayable 2016 – 213.8 – 212.6Corporate bond 5.375% repayable 2021 329.5 332.7 325.0 325.0Corporate bond 4.375% repayable 2026 284.0 282.3 250.0 250.0Corporate bond 3.625% repayable 2028 300.0 – 300.0 –
913.5 828.8 875.0 787.6
The 2016 corporate bond was repaid in October 2016 and was therefore classified as current in the prior year. The 2021, 2026 and 2028 bonds are classified as non-current liabilities.
The Group uses interest rate derivatives to manage the interest rate risk associated with its bonds, the profile of which is shown below:
2017Nominal
value£m
2017 Effective interest
rate
2016Nominal
value£m
2016 Effective interest
rate2016 bond Fixed – 162.6 5.875%Floating – 50.0 6m LIBOR +1.7%
– 212.62021 bondFixed 150.0 5.375% 150.0 5.375%Fixed 50.0 5.200% –Fixed 50.0 5.150% –Fixed 50.0 5.050% –Floating 25.0 6m LIBOR +1.9% 175.0 6m LIBOR +1.9%
325.0 325.02026 bondFloating 250.0 6m LIBOR +1.4% 250.0 6m LIBOR +1.4%2028 bondFixed 300.0 3.625% –Total 875.0 787.6
Interest rate risk management is explained in Note 24 and the fair values of the corporate bonds are shown in Note 26.
Go
vernanceShareho
lder Info
rmatio
n
121n e x t p l c . c o . u k
Financial Statements
Strategic R
epo
rt
Group
Com
pany
slugline
18. Pension BenefitsThe Group operates three pension arrangements in the UK: the Next Group Pension Plan (the “Original Plan”), the 2013 Next Group Pension Plan (the “2013 Plan”) and the Next Supplementary Pension Arrangement (the “SPA”).
The Group’s UK pension arrangements include defined benefit and defined contribution sections. The Original Plan and 2013 Plan are established under trust law and comply with all relevant UK legislation. Pension assets are held in separate trustee administered funds which have equal pension rights with respect to members of either sex in so far as this is required by current legislation.
The Group also provides additional retirement benefits through the SPA to some plan members whose benefits would otherwise be affected by the lifetime allowance.
The defined benefit section was closed to new members in 2000 and over recent years the Group has taken steps to manage the ongoing risks associated with its defined benefit liabilities.
The Original Plan comprises predominantly members with pensions in payment, following the transfer of active and deferred members (and associated liabilities) to the 2013 Plan. The risks associated with the payment of pensions of the Original Plan have been largely mitigated by the purchase of two insurance contracts (“buy-ins”) with Aviva in 2010 and 2012 to cover the liabilities of this Plan, although it remains the ultimate responsibility of the Company to provide members with benefits.
The pensions and matching insurance contracts held by the Original Plan are being converted to buy-out and the Original Plan will then be dissolved.
The 2013 Plan was established in 2013 via the transfer of liabilities and assets from the Original Plan. This arrangement provides benefits to the majority of members whose pensions were not insured with Aviva. From November 2012, the future accrual of benefits for remaining active employee members has been based on pensionable earnings frozen at that time, rather than final earnings.
Further information on the Group’s pension arrangements is given in the Remuneration Report on pages 76 and 77.
Principal risksThe following table summarises the principal risks associated with the Group’s defined benefit arrangements:
Investment risk The present value of defined benefit liabilities is calculated using a discount rate set by reference to high quality corporate bond yields. If plan assets underperform corporate bonds, this will create a deficit. The strategic allocation of assets in the 2013 Plan is currently weighted towards equity and property assets as its liability profile is relatively immature and it is expected that these asset classes will, over the long term, outperform gilts and corporate bonds.
Interest rate risk A fall in bond yields would increase the value of the liabilities. This would be only partially offset by an increase in the value of bond investments held.
Inflation risk Pensions in payment are increased annually in line with RPI or CPI for Guaranteed Minimum Pensions built up since 1988. Pensions built up since 2005 are capped at 2.5% and pensions built up between 1997 and 2005 are capped at 5%. When discretionary increases have been awarded for pensions built up before 1997, they too have tended to reflect RPI, capped at 2.5%. Therefore an increase in inflation would increase the value of pension liabilities. The assets would be expected to also increase, to the extent that they are linked to inflation, but this would not be expected to fully match the increase in liabilities.
Longevity risk The present value of the defined benefit liabilities is calculated having regards to a best estimate of the mortality of plan members. If members live longer than this mortality assumption, this will increase the liabilities.
The buy-in insurance contracts represent over 99% of the Original Plan pension liabilities and 18% of the total pension liabilities. This provides a partial hedge to the total risks described above. Derivatives are not used to hedge any of the risks noted above.
Notes to the Consolidated Financial Statements
122 n e x t p l c . c o . u k

slugline
18. Pension Benefits (continued)
Income statementThe components of the net defined benefit expense recognised in the consolidated income statement are as follows:
2017 2016
2013 Plan£m
Original Plan£m
SPA£m
Total£m
2013 Plan£m
Original Plan£m
SPA£m
Total£m
Current service cost 7.4 – 0.4 7.8 8.8 – 0.4 9.2Net interest (2.2) – 0.4 (1.8) (1.8) 0.1 0.4 (1.3)Administrative costs 1.8 0.1 – 1.9 0.8 0.2 – 1.0
Net defined benefit expense 7.0 0.1 0.8 7.9 7.8 0.3 0.8 8.9
Other comprehensive incomeThe components of the net defined benefit expense recognised in other comprehensive income are as follows:
2017 2016
2013 Plan£m
Original Plan£m
SPA£m
Total£m
2013 Plan£m
Original Plan£m
SPA£m
Total£m
Actuarial gain/(loss) due to liability experience 12.2 2.4 (1.6) 13.0 6.7 5.6 – 12.3Actuarial gain/(loss) due to liability assumption changes (121.9) (11.8) (1.9) (135.6) 35.1 13.4 1.0 49.5
(109.7) (9.4) (3.5) (122.6) 41.8 19.0 1.0 61.8Return on plan assets greater/(less) than discount rate 108.8 11.4 – 120.2 (35.4) (16.7) – (52.1)Actuarial gain/(loss) recognised in other comprehensive income (0.9) 2.0 (3.5) (2.4) 6.4 2.3 1.0 9.7
Balance sheet valuationThe net defined benefit pension asset/(liability) recognised in the consolidated balance sheet is analysed as follows:
2017 2016
2013 Plan£m
Original Plan£m
SPA£m
Total£m
2013 Plan£m
Original Plan£m
SPA£m
Total£m
Present value of benefit obligations (646.6) (148.0) (16.3) (810.9) (521.3) (146.1) (12.0) (679.4)Fair value of plan assets 723.8 150.0 – 873.8 579.2 146.2 – 725.4Net pension asset/(liability) 77.2 2.0 (16.3) 62.9 57.9 0.1 (12.0) 46.0
A net asset has been recognised as the Trust Deeds of the Original and 2013 Plans provide the Group with an unconditional right to a refund assuming the gradual settlement of the Plan’s liabilities over time until all members have left the Plans.
Go
vernanceShareho
lder Info
rmatio
n
123n e x t p l c . c o . u k
Financial Statements
Strategic R
epo
rt
Group
Com
pany

slugline
18. Pension Benefits (continued)
Plan obligationsChanges in the present value of defined benefit pension obligations are analysed as follows:
2017 2016
2013 Plan£m
Original Plan£m
SPA£m
Total£m
2013 Plan£m
Original Plan£m
SPA£m
Total£m
Opening obligation 521.3 146.1 12.0 679.4 549.3 175.9 12.2 737.4Current service cost 7.4 – 0.4 7.8 8.8 – 0.4 9.2Interest cost 18.8 4.7 0.4 23.9 18.2 5.0 0.4 23.6Employee contributions 0.1 – – 0.1 0.1 – – 0.1Benefits paid (13.5) (9.4) – (22.9) (17.2) (11.9) – (29.1)Transfers 2.8 (2.8) – – 3.9 (3.9) – –Actuarial (gains)/losses – financial assumptions 113.3 12.0 1.9 127.2 (35.1) (7.2) (1.0) (43.3)– experience (12.2) (2.4) 1.6 (13.0) (6.7) (5.6) – (12.3)– demographic assumptions 8.6 (0.2) – 8.4 – (6.2) – (6.2)Closing obligation 646.6 148.0 16.3 810.9 521.3 146.1 12.0 679.4
The present value of the defined benefit closing obligation of £810.9m was comprised of approximately 26% relating to active participants, 48% relating to deferred participants and 26% relating to pensioners.
Plan assetsChanges in the fair value of defined benefit pension assets were as follows:
2017 2016
2013 Plan£m
Original Plan£m
SPA£m
Total£m
2013 Plan£m
Original Plan£m
SPA£m
Total£m
Opening assets 579.2 146.2 – 725.4 602.5 172.8 – 775.3Employer contributions 27.2 – – 27.2 7.3 – – 7.3Employee contributions 0.1 – – 0.1 0.1 – – 0.1Benefits paid (13.5) (9.4) – (22.9) (17.2) (11.9) – (29.1)Transfers 2.8 (2.8) – – 2.7 (2.7) – –Interest income on assets 21.0 4.7 – 25.7 20.0 4.9 – 24.9Return on plan assets (excluding amounts included in interest) 108.8 11.4 – 120.2 (35.4) (16.7) – (52.1)Administrative costs (1.8) (0.1) – (1.9) (0.8) (0.2) – (1.0)Closing assets 723.8 150.0 – 873.8 579.2 146.2 – 725.4
Notes to the Consolidated Financial Statements
124 n e x t p l c . c o . u k

slugline
18. Pension Benefits (continued)
The fair value of plan assets was as follows:
2017 2016
2013 Plan£m
Original Plan£m
Total£m %
2013 Plan£m
Original Plan£m
Total£m %
Equities 459.2 1.5 460.7 52.8 370.1 4.4 374.5 51.6Bonds 148.4 – 148.4 17.0 123.8 – 123.8 17.1Gilts 61.4 0.7 62.1 7.1 49.6 1.9 51.5 7.1Property 29.2 – 29.2 3.3 27.6 – 27.6 3.8Insurance contracts – 147.8 147.8 16.9 – 139.7 139.7 19.3Cash and cash equivalents 25.6 – 25.6 2.9 8.1 0.2 8.3 1.1
723.8 150.0 873.8 100.0 579.2 146.2 725.4 100.0
None of the pension arrangements directly invest in any of the Group’s own financial instruments nor any property occupied by, or other assets used by, the Group. The fair values of the above equity and debt instruments are determined based on quoted prices in active markets. The property assets relate to investments in property funds and their fair value is based on quoted prices in active markets. The majority of the benefits within the Original Plan are covered by two insurance contracts with Aviva. The insurance assets have been valued so as to match the defined benefit obligations, the value of which was calculated by Aviva.
Principal assumptionsThe IAS 19 (accounting) valuation of the defined benefit obligation was undertaken by an external qualified actuary as at January 2017 using the projected unit credit method. The principal actuarial assumptions used in the valuation were as follows:
2017 2016
Original Plan
2013 andSPA
OriginalPlan
2013 andSPA
Discount rate 2.65% 2.80% 3.40% 3.65%Inflation – RPI 3.60% 3.40% 3.05% 3.05%Inflation – CPI 2.60% 2.40% 2.05% 2.05%Salary increases – – – –Pension increases in payment– RPI with a maximum of 5% 3.25% 3.10% 3.05% 3.05%– RPI with a maximum of 2.5% and discretionary increases 2.10% 2.00% 2.50% 2.50%
2017 2016
Pensioner aged 65
Non-pensioner
aged 45Pensioner
aged 65
Non-pensioner
aged 45Life expectancy at age 65 (years) Male 22.9 23.3 22.8 25.0 Female 25.3 25.8 25.2 27.5
The discount rate has been derived as the single average discount rate appropriate to the term of the liabilities, based on the yields available on high quality Sterling corporate bonds. The expected average duration of the Original Plan’s liabilities is 13 years and for the SPA and 2013 Plans it is 26 years.
Go
vernanceShareho
lder Info
rmatio
n
125n e x t p l c . c o . u k
Financial Statements
Strategic R
epo
rt
Group
Com
pany

slugline
18. Pension Benefits (continued)
The rate of retail price inflation (RPI) has been derived in a consistent way to the discount rate, so that it is appropriate to the term of the liabilities. As in previous years, the RPI assumption for the 2013 and SPA allow for the inflation risk premium of 0.2% whereas that for the Original Plan does not, because its assets and liabilities are almost fully matched.
The rate of consumer price inflation (CPI) is set at 1.0% lower than the assumption for retail price inflation, reflecting the long term expected gap between the two indices.
In 2017, the approach to setting the assumptions for pension increases in payment has been revised to take account of future inflation volatility and how this is likely to interact with the caps of 2.5% and 5% that apply to different tranches of pension. This results in lower pension increase assumptions and a reduction in the defined benefit obligation of approximately £40m, but no direct impact on the income statement.
For the 2013 Plan and the SPA, the mortality assumptions reflect the best estimate output from a postcode mortality study and the most recent 2015 Core Projection model for future improvements published by the CMI Mortality Projections Committee. Post retirement mortality is therefore assumed to follow the standard SAPS Series 2 All Pensioner tables (with a multiplier of 95% for males and 92% for females) with improvements based on the CMI 2015 Core Projection model with a long term trend towards 1.5% pa from 2007.
The mortality assumption for the Original Plan is in line with the standard SAPS Series 1 All Pensioner tables with medium cohort improvements to 2009 and CMI 2013 improvements with a long term trend towards 1.5% per annum from 2009. Future improvements from 2016 have been allowed for in line with the most recent CMI 2015 core projections model, with a long term trend towards 1.5%.
Sensitivity analysisThe sensitivity of the net pension asset to changes in the principal assumptions is:
Sensitivity analysis
Impact on net pension asset as at 28 January
2017Discount rate 0.5% decrease £86.5m decreasePrice inflation 0.5% increase to RPI and CPI £47.5m decreasePrice inflation 0.1% decrease to CPI (i.e. increase in the gap between RPI and CPI) £4.3m increaseMortality CMI 2014 improvements (instead of CMI 2015) from 2016 £2.7m decrease
The above sensitivity analyses are based on a change in an assumption while holding all other assumptions constant. In practice, this is unlikely to occur and changes in some of the assumptions may be correlated. Aside from the matching insurance contracts held in the Original Plan, no allowance has been made for any change in assets that might arise under any of the scenarios set out above. When calculating the sensitivity of the defined benefit obligation to significant assumptions, the same method has been applied as when calculating the pension liability recognised within the consolidated balance sheet.
The sensitivities shown are just one possible outcome and should not be taken as an indication of the likelihood of a change occurring in the future. Economic markets have been particularly volatile in recent months and market metrics used to derive the discount rate and price inflation assumptions could increase or decrease in the future, by more or less than the change set out.
Notes to the Consolidated Financial Statements
126 n e x t p l c . c o . u k

slugline
18. Pension Benefits (continued)
Full actuarial valuationThe latest full actuarial valuation of the 2013 Plan was undertaken as at 30 September 2016 by Willis Towers Watson (who act as Actuary to the Trustees). The valuation showed a funding deficit on the Technical Provisions basis required by legislation of £70.2m at that date.
The Group has agreed a recovery plan to meet the technical deficit, which is intended to restore the scheme assets to a fully funded position on a Technical Provisions basis by 30 September 2021. Under that agreement, the Group will contribute five annual payments of up to £14.0m by 31 January each year. The first payment of £14.0m under this agreement was made in January 2017 and future contributions will only be required to be paid to the extent that there is a funding deficit at the preceding 31 December.
At the Company’s year end date the 2013 Plan was estimated to be fully funded on a Technical Provisions basis with a surplus in the region of £5m.
With effect from January 2018, the Company has also agreed to pay contributions of 31.3% pa of members’ frozen pensionable salaries as at 31 October 2012 towards the future accrual of benefits for active members, an increase from 17.5% pa.
ContributionsMembers of the defined benefit section of the 2013 Plan contribute 3% or 5% of pensionable earnings. With effect from January 2018, employer contributions will increase from 17.5% pa to 31.3% (c£6m to c£8m pa). Members of the defined contribution section contribute 3% or 5% of pensionable earnings which is matched by the Group.
Contributions paid by the Group are set out below:
2017£m
2016£m
Defined contribution – recognised as an expense 10.8 10.0Automatic enrolment – recognised as an expense 1.8 1.6Defined benefit 27.2 7.3
39.8 18.9
The £27.2m paid into the defined benefit section of the 2013 Plan in 2017 included an additional contribution of £14m paid in respect of the recovery plan agreed with the Trustees following the September 2016 full actuarial valuation and a prepayment of contributions of £6m for the cost of future accrual in the year to January 2018. Employer contributions for the defined contribution and automatic enrolment schemes are expected to be similar in the year ahead. Employer contributions to the defined benefit section in the year ahead are expected to be around £23m assuming a contribution of £14m is paid in January 2018, although in practice this is contingent on there being a deficit on a funding (Technical Provisions) basis at this time (refer to details in the Full actuarial valuation section above).
19. ProvisionsVacant property
costs
2017£m
2016£m
At the beginning of the year 7.3 9.4 Provisions made in the year 4.4 1.2 Utilisation of provisions (1.8) (2.6) Release of provisions (3.4) (0.9) Unwind of discount 0.2 0.2At the end of the year 6.7 7.3
Provision is made for the committed cost of future rentals or estimated exit costs of properties no longer occupied by the Group. The average remaining lease term for these properties is 11 years (2016: 10 years).
Go
vernanceShareho
lder Info
rmatio
n
127n e x t p l c . c o . u k
Financial Statements
Strategic R
epo
rt
Group
Com
pany

slugline
20. Share Capital2017
Shares ‘000
2016 Shares
‘0002017
£m2016
£mAllotted, called up and fully paidOrdinary shares of 10p eachAt the start of the year 150,670 152,874 15.1 15.3Purchased for cancellation in the year (3,613) (2,204) (0.4) (0.2)At the end of the year 147,057 150,670 14.7 15.1
The table below shows the movements in equity from share purchases and commitments during the year:
2017 2016
Shares ‘000
Cost£m
Shares ‘000
Cost£m
Shares purchased for cancellation in the year 3,613 187.6 2,204 150.7Less: commitment at start of year – – (1,500) (101.1)Amount shown in statement of changes in equity 187.6 49.6
21. Other ReservesOther reserves in the consolidated balance sheet comprise the reserve created on reduction of share capital through a Scheme of Arrangement under Section 425 of the Companies Act 1985 (£1,460.7m) less share premium account (£3.8m) and capital redemption reserve (£8.7m) at the time of a capital reconstruction in 2002, plus the accumulated amount of goodwill arising on acquisition after taking into account subsequent disposals (£0.7m), less the unrealised component of revaluations of properties arising under previous accounting standards (£5.1m) as at the date of transition to IFRS.
22. Share-based PaymentsThe Group operates a number of share-based payment schemes as follows:
Management share optionsThe NEXT Management Share Option Plan provides for options over shares, exercisable between three and ten years following their grant, to be allocated to Group employees at the discretion of the Remuneration Committee. This plan is primarily aimed at middle management and senior store staff. No options were granted to any directors or changes made to existing entitlements in the year under review. No employee is entitled to be granted options under the scheme if, in the same financial year, they have received an award under NEXT’s LTIP or SMP.
The total number of options which can be granted is subject to limits. There are no cash settlement alternatives and they are therefore accounted for under IFRS 2 as equity-settled awards. Option prices are set at the prevailing market price at the time of grant. The maximum total market value of shares (i.e. the acquisition price of shares) over which options may be granted to any person during any financial year of the Company is three times salary, excluding bonuses and benefits in kind. This limit may be increased to five times salary in circumstances considered by the Committee to be exceptional, for example on the grant of options following recruitment. Grants are generally made annually.
Sharesave optionsThe Company’s Save As You Earn (“Sharesave”) scheme is open to all UK employees. Invitations to participate are generally issued annually and the scheme is subject to HMRC rules. The current maximum monthly savings for the schemes detailed below is £250. Options are granted at the prevailing market rate less a discount of 20% and are exercisable three or five years from the date of grant. A similar Sharesave scheme is open to the Company’s Eire employees. Sharesave options are also accounted for as equity-settled awards under IFRS 2.
Notes to the Consolidated Financial Statements
128 n e x t p l c . c o . u k

slugline
22. Share-based Payments (continued)
Management and Sharesave optionsThe following table summarises the movements in Management and Sharesave options during the year:
2017 2016
No. of options
Weighted average exercise
priceNo. of
options
Weighted average exercise
priceOutstanding at beginning of year 4,624,159 £47.60 5,735,130 £36.22Granted 2,129,400 £45.54 1,155,664 £66.41Exercised (883,097) £33.94 (2,032,959) £25.84Forfeited (805,511) £56.97 (233,676) £50.53Outstanding at end of year 5,064,951 £47.61 4,624,159 £47.60Exercisable at end of year 1,392,536 £31.90 998,094 £22.37
Options were exercised on a regular basis throughout the year and the weighted average share price during this period was £52.89 (2016: £74.82). Options outstanding at January 2017 are exercisable at prices ranging between £10.81 and £70.80 (2016: £9.17 and £70.80) and have a weighted average remaining contractual life of 5.7 years (2016: 5.6 years), as analysed below:
2017 2016
No. of options
Weighted average
remaining contractual life (years)
No. of options
Weighted average
remaining contractual life (years)
Exercise price range £9.17 - £29.67 771,652 3.4 1,129,741 3.9£38.25 1,117,369 3.7 – –£41.12 - £41.70 757,351 5.3 1,332,947 5.6£54.10 - £59.76 1,219,448 7.4 840,540 3.2£66.95 - £70.80 1,199,131 7.7 1,320,931 8.7
5,064,951 5.7 4,624,159 5.6
Share Matching Plan (SMP) and Long Term Incentive Plan (LTIP)As explained in the Remuneration Report, the Group operates LTIP and SMP schemes for executive directors and other senior executives. The SMP is an equity-settled scheme. Prior to January 2014, all LTIP awards were accounted for as cash-settled share-based payments. From January 2014 onwards, new LTIP grants to executive directors will be settled in shares with no cash settlement alternative. Those awards are therefore accounted for under IFRS 2 as equity-settled. Awards to other senior executives and legacy awards to executive directors will continue to be treated as cash-settled. From January 2014, executive directors are no longer granted SMP awards. Performance conditions for SMP and LTIP awards are detailed in the Remuneration Report.
Go
vernanceShareho
lder Info
rmatio
n
129n e x t p l c . c o . u k
Financial Statements
Strategic R
epo
rt
Group
Com
pany

slugline
22. Share-based Payments (continued)
Share Matching PlanThe following table summarises the movements in nil cost SMP options during the year:
2017No. of
options
2016No. of
optionsOutstanding at beginning of year 85,657 118,281Granted 15,002 17,686Exercised (21,081) (48,137)Forfeited (2,632) (2,173)Outstanding at end of year 76,946 85,657Exercisable at end of year 21,390 –
The weighted average remaining contractual life of these options is 7.6 years (2016: 7.5 years). SMP options were exercised at different times in the year and the weighted average share price during this period was £52.47 (2016: £72.92).
Equity-settled LTIP awardsThe following table summarises the movements in nil cost equity-settled LTIP awards during the year:
2017 Maximum
No. of awards
2016 Maximum
No. of awards
Outstanding at beginning of year 100,745 64,182Granted 64,038 52,991Lapsed – (16,428)Outstanding at end of year 164,783 100,745
The weighted average remaining contractual life of these options is 1.5 years (2016: 1.9 years).
Cash-settled LTIP awardsThe following table summarises the movements in cash-settled LTIP awards during the year:
2017 Maximum
No. of awards
2016 Maximum
No. of awards
Outstanding at beginning of year 338,760 507,164Granted 92,912 83,633Vested (114,345) (188,218)Lapsed (69,715) (63,819)Outstanding at end of year 247,612 338,760
A credit of £2.3m for the year (2016: charge of £7.4m) has been made in the accounts in respect of cash-settled LTIP grants, of which a credit of £2.1m (2016: charge of £0.6m) related to the executive directors. The weighted average remaining contractual life of these awards is 1.4 years (2016: 1.5 years).
Notes to the Consolidated Financial Statements
130 n e x t p l c . c o . u k

slugline
22. Share-based Payments (continued)
Fair value calculationsThe fair value of Management, Sharesave and SMP options granted is calculated at the date of grant using a Black–Scholes option pricing model. Expected volatility was determined by calculating the historical volatility of the Company’s share price over a period equivalent to the expected life of the option. The expected life applied in the model is based on historical analyses of exercise patterns, taking into account any early exercises. The following table lists the inputs to the model used for options granted in the years ended 28 January 2017 and 30 January 2016 based on information at the date of grant:
Management share options (granted in April) 2017 2016Share price at date of grant £54.10 £70.80Exercise price £54.10 £70.80Volatility 20.60% 19.64%Expected life 4 years 4 yearsRisk free rate 0.64% 1.03%Dividend yield 2.83% 2.02%Weighted average fair value per option £6.22 £9.09
Sharesave plans (granted in October) 2017 2016Share price at date of grant £47.81 £74.70Exercise price £38.25 £59.76Volatility 25.22% 18.00%Expected life 3.3 years 3.3 yearsRisk free rate 0.31% 0.75%Dividend yield 3.30% 2.01%Weighted average fair value per option £10.04 £15.53
SMP (granted in April/May) 2017 2016Share price at date of grant £52.65 £71.75Exercise price Nil NilVolatility 21.53% 18.39%Expected life 3 years 3 yearsRisk free rate 0.58% 0.87%Dividend yield 2.91% 1.99%Weighted average fair value per option £48.25 £67.59
The fair value of equity-settled LTIP awards granted is calculated at the date of grant using a Monte Carlo option pricing model. Expected volatility was determined by calculating the historical volatility of the Company’s share price over a period equivalent to the life of the award. The following table lists the inputs to the model used for awards granted in the year ended 28 January 2017 and 30 January 2016 based on information at the date of grant:
Equity-settled LTIP awards (granted in March) 2017 2016Share price at date of grant £56.35 £72.75Award price Nil NilVolatility 20.92% 18.19%Life of award 3 years 3 yearsRisk free rate 0.64% 1.10%Dividend yield 2.72% 1.97%Fair value per award £23.27 £31.10
Go
vernanceShareho
lder Info
rmatio
n
131n e x t p l c . c o . u k
Financial Statements
Strategic R
epo
rt
Group
Com
pany

slugline
22. Share-based Payments (continued)Equity-settled LTIP awards (granted in September) 2017 2016Share price at date of grant £50.05 £77.40Award price Nil NilVolatility 24.54% 18.22%Life of award 3 years 3 yearsRisk free rate 0.16% 0.90%Dividend yield 3.16% 1.94%Fair value per award £20.60 £32.38
23. Shares Held by ESOTThe NEXT 2003 Employee Share Ownership Trust (ESOT) has an independent Trustee resident in Jersey and provides for the issue of shares to Group employees, including share issues under share options, at the discretion of the Trustee. All Management and Sharesave options which were exercised during the year were satisfied by shares issued from the ESOT.
At 28 January 2017 the ESOT held 4,414,892 (2016: 4,348,344) ordinary shares of 10p each in the Company, the market value of which amounted to £170.0m (2016: £301.1m). Details of outstanding share options are shown in Note 22.
The consideration paid for the ordinary shares of 10p each in the Company held by the ESOT at 28 January 2017 and 30 January 2016 has been shown as an ESOT reserve and presented within equity for the Company and the Group. All other assets, liabilities, income and costs of the ESOT have been incorporated into the accounts of the Company and the Group.
The table below shows the movements in equity from ESOT share purchases during the year:
2017 2016
Shares‘000 £m
Shares‘000 £m
Shares purchased by ESOT in the year 978 50.9 1,468 108.7Shares issued on employee option exercises 911 30.5 2,130 54.8
Proceeds of £29.9m (2016: £53.0m) were received on the exercise of Management and Sharesave options. The amount shown in the statement of changes in equity of £30.5m (2016: £54.8m) is after the issue of nil cost LTIP, SMP and Deferred Bonus shares. The weighted average cost of shares issued by the ESOT was £44.2m (2016: £92.0m).
At 22 March 2017, employee share options over 96,530 shares had been exercised subsequent to the balance sheet date and had been satisfied by ordinary shares issued by the ESOT.
24. Financial Instruments: Risk Management and Hedging ActivitiesNEXT operates a centralised treasury function which is responsible for managing the liquidity, interest and foreign currency risks associated with the Group’s activities. As part of its strategy for the management of these risks, the Group uses derivative financial instruments. In accordance with the Group’s treasury policy, derivative instruments are not entered into for speculative purposes. Treasury policy is reviewed and approved by the Board and specifies the parameters within which treasury operations must be conducted, including authorised counterparties, instrument types and transaction limits, and principles governing the management of liquidity, interest and foreign currency risks.
The Group’s principal financial instruments, other than derivatives, are cash and short term deposits, bank overdrafts and loans, and corporate bonds. The main purpose of these financial instruments is to raise finance for the Group’s operations. In addition, the Group has various other financial assets and liabilities such as trade receivables and trade payables arising directly from its operations.
Notes to the Consolidated Financial Statements
132 n e x t p l c . c o . u k

slugline
24. Financial Instruments: Risk Management and Hedging Activities (continued)
Liquidity riskThe Group manages its cash and borrowing requirements centrally to minimise net interest expense within risk parameters agreed by the Board, whilst ensuring that the Group has sufficient liquid resources to meet the operating needs of its businesses. The forecast cash and borrowings profile of the Group is monitored to ensure that adequate headroom remains under committed borrowing facilities.
The table below shows the maturity analysis of the undiscounted remaining contractual cash flows (including interest) of the Group’s financial liabilities, including cash flows in respect of derivatives:
2017
Less than 1 year£m
1 to 2 years
£m
2 to 5 years
£m
Over 5 years
£mTotal
£mBank loans and overdrafts 35.3 – – – 35.3Trade and other payables 479.4 7.7 – – 487.1Corporate bonds 39.3 39.3 442.8 680.8 1,202.2
554.0 47.0 442.8 680.8 1,724.6Derivatives: net settled (7.2) (7.1) (18.2) (16.9) (49.4)Derivatives: gross settled Cash inflows (1,106.0) – – – (1,106.0) Cash outflows 1,067.9 – – – 1,067.9Total cash flows 508.7 39.9 424.6 663.9 1,637.1
2016
Less than 1 year£m
1 to 2 years
£m
2 to 5 years
£m
Over 5 years
£mTotal
£mBank loans and overdrafts 128.6 – – – 128.6Trade and other payables 530.7 5.7 – – 536.4Dividends 88.3 – – – 88.3Corporate bonds 253.5 28.4 85.2 658.1 1,025.2
1,001.1 34.1 85.2 658.1 1,778.5Derivatives: net settled (12.1) (6.6) (16.8) (16.7) (52.2)Derivatives: gross settled Cash inflows (1,070.2) – – – (1,070.2) Cash outflows 1,025.4 – – – 1,025.4Total cash flows 944.2 27.5 68.4 641.4 1,681.5
At 28 January 2017, the Group had borrowing facilities of £525.0m (2016: £550.0m) in respect of which all conditions precedent have been met. £285.0m is committed until November 2020 and a further £240.0m is committed until September 2021. £nil of this facility was drawn down at January 2017 (2016: £115.0m).
Interest rate riskThe Group is exposed to fair value interest rate risk on its fixed rate corporate bonds and cash flow interest rate risk on floating rate bank loans and overdrafts. The forecast cash and borrowings profile of the Group is monitored regularly to assess the mix of fixed and variable rate debt, and the Group uses interest rate derivatives where appropriate to reduce its exposure to changes in interest rates and the economic environment.
Go
vernanceShareho
lder Info
rmatio
n
133n e x t p l c . c o . u k
Financial Statements
Strategic R
epo
rt
Group
Com
pany

slugline
24. Financial Instruments: Risk Management and Hedging Activities (continued) Interest rates: fair value hedgesThe Group has interest rate swap agreements in place as fair value hedges of part of the interest rate risk associated with the corporate bonds. Under the terms of the swaps, which have the same key features as the bonds, the Group receives a fixed rate of interest equivalent to the relevant coupon rate, and pays a variable rate. Details of the effective rates payable are given in Note 17.
The fair values of the Group’s interest rate swaps, including accrued interest, are as follows:
2017£m
2016£m
Derivatives in designated fair value hedging relationships 40.8 44.8
The fair values of derivatives have been calculated by discounting the expected future cash flows at prevailing interest rates and are based on market prices at the balance sheet date.
Foreign currency riskThe Group’s principal foreign currency exposures arise from the purchase of overseas sourced products. Group policy allows for these exposures to be hedged for up to 24 months ahead in order to fix the cost in Sterling. This hedging activity involves, the use of spot, forward and option contracts.
The market value of outstanding foreign exchange contracts is reported regularly at Board level, and reviewed in conjunction with percentage cover taken by season and current market conditions in order to assess and manage the Group’s ongoing exposure.
The Group does not have a material exposure to currency movements in relation to the translation of overseas investments and consequently does not hedge any such exposure. The Group’s net exposure to foreign currencies, taking hedging activities into account, is illustrated by the sensitivity analysis in Note 27.
Foreign currency hedgesThe fair values of foreign exchange derivatives are as follows:
2017£m
2016£m
Derivatives in designated hedging relationships 31.6 36.8Other foreign exchange derivatives (0.8) (0.9)Total foreign exchange derivatives 30.8 35.9
The total notional amount of outstanding foreign exchange contracts at the balance sheet date is as follows:
2017£m
2016£m
US Dollar 1,003.4 987.4Euro 39.2 59.2Other 63.3 23.6
1,105.9 1,070.2
Notes to the Consolidated Financial Statements
134 n e x t p l c . c o . u k

slugline
24. Financial Instruments: Risk Management and Hedging Activities (continued)
Credit riskInvestments of cash surpluses, borrowings and derivative instruments are made through banks and companies which must fulfil credit rating and investment criteria approved by the Board. Concentrations of risk are mitigated by the use of various counterparties at any one time. All customers who wish to trade on credit terms are subject to credit verification procedures. Receivable balances are monitored on an ongoing basis and provision is made for estimated irrecoverable amounts. The concentration of credit risk is limited due to the Directory customer base being large and diverse. The Group’s outstanding receivables balances are detailed in Note 11.
Capital riskThe capital structure of the Group consists of debt, as analysed in Note 28, and equity attributable to the equity holders of the Parent Company, comprising issued capital, reserves and retained earnings as shown in the consolidated statement of changes in equity. The Group manages its capital with the objective that all entities within the Group continue as going concerns while maintaining an efficient structure to minimise the cost of capital. The Group is not restricted by any externally imposed capital requirements.
As part of its strategy for delivering sustainable long term growth in Earnings Per Share, the Group has been returning capital to shareholders by way of share buybacks in addition to dividends (including special dividends). Share buybacks may be transacted through both on-market purchases and contingent contracts for off-market share purchases.
25. Financial Instruments: Categories2017
£m2016
£mFinancial assetsDerivatives in designated hedging relationships 91.3 95.9Loans and receivables 1,033.2 963.4Cash and short term deposits 49.7 66.3Available for sale financial assets 1.0 1.0Financial liabilitiesDerivatives at fair value through profit and loss – held for trading (0.8) (0.9)Derivatives in designated hedging relationships (18.9) (14.3)Corporate bonds (913.5) (828.8)Amortised cost (446.3) (667.9)
All derivatives are categorised as Level 2 under the requirements of IFRS 13 “Fair value measurement”, as they are valued using techniques based significantly on observed market data.
Go
vernanceShareho
lder Info
rmatio
n
135n e x t p l c . c o . u k
Financial Statements
Strategic R
epo
rt
Group
Com
pany

slugline
26. Financial Instruments: Fair ValuesThe fair values of each category of the Group’s financial instruments are the same as their carrying values in the Group’s balance sheet, other than as noted below:
2017 2016
Carrying amount
£mFair value
£m
Carrying amount
£mFair value
£mCorporate bondsIn hedging relationships 463.5 478.5 516.2 533.9Not in hedging relationships 450.0 481.3 312.6 345.4
913.5 959.8 828.8 879.3
Corporate bonds are held at amortised cost adjusted for the effect of the change in fair value hedge.
The fair values of corporate bonds are their market values at the balance sheet date (IFRS 13 Level 1) reflecting quoted (unadjusted) prices in active markets for identical assets or liabilities. Market values include accrued interest and changes in credit risk and interest rate risk, and are therefore different to the reported carrying amounts.
27. Financial Instruments: Sensitivity AnalysisForeign currency sensitivity analysisThe Group’s principal foreign currency exposures are to US Dollars and the Euro. The table below illustrates the hypothetical sensitivity of the Group’s reported profit and closing equity to a 10% increase and decrease in the US Dollar/Sterling and Euro/Sterling exchange rates at the year end date, assuming all other variables remain unchanged. The sensitivity rate of 10% represents the directors’ assessment of a reasonably possible change, based on historic volatility.
The analysis assumes that exchange rate fluctuations on currency derivatives that form part of an effective cash flow hedge relationship affect the fair value reserve in equity and the fair value of the hedging derivatives. For foreign exchange derivatives which are not designated hedges, movements in exchange rates impact the income statement.
Positive figures represent an increase in profit or equity.
Income statement Equity
2017£m
2016£m
2017£m
2016£m
Sterling strengthens by 10%US Dollar (3.6) (2.8) (64.2) (41.9)Euro – – (2.2) (3.1)Sterling weakens by 10%US Dollar (0.4) (5.6) 73.0 51.6Euro – – 2.7 3.8
Year end exchange rates applied in the above analysis are US Dollar 1.25 (2016: 1.42) and Euro 1.17 (2016: 1.31). Strengthening and weakening of Sterling may not produce symmetrical results depending on the proportion and nature of foreign exchange derivatives which do not qualify for hedge accounting.
Notes to the Consolidated Financial Statements
136 n e x t p l c . c o . u k

slugline
27. Financial Instruments: Sensitivity Analysis (continued)
Interest rate sensitivity analysisThe table below illustrates the hypothetical sensitivity of the Group’s reported profit and closing equity to a 0.5% increase or decrease in interest rates, assuming all other variables were unchanged. The sensitivity rate of 0.5% represents the directors’ assessment of a reasonably possible change, based on historic volatility.
The analysis has been prepared using the following assumptions:
• For floating rate assets and liabilities, the amount of the asset or liability outstanding at the balance sheet date is assumed to have been outstanding for the whole year.
• Fixed rate financial instruments that are carried at amortised cost are not subject to interest rate risk for the purpose of this analysis.
Positive figures represent an increase in profit or equity.
Income statement Equity
2017£m
2016£m
2017£m
2016£m
Interest rate increase of 0.5% (2.2) (2.8) (2.2) (2.8)Interest rate decrease of 0.5% 2.2 2.8 2.2 2.8
28. Analysis of Net Debt
January 2016
£mCash flow
£m
Other non-cash changes
£m
January 2017
£mCash and short term deposits 66.3 49.7Overdrafts and short term borrowings (13.6) (35.3)Cash and cash equivalents 52.7 (39.2) 0.9 14.4Unsecured bank loans (115.0) 115.0 – –Corporate bonds (828.8) (84.7) – (913.5)Fair value hedges of corporate bonds 41.2 – (2.6) 38.6Total net debt (849.9) (8.9) (1.7) (860.5)
29. Operating Lease CommitmentsThe Group has entered into operating leases primarily in respect of retail stores and lesser amounts for warehouses, vehicles and equipment. These non-cancellable leases have remaining terms of between one month and approximately 25 years. Contingent rentals are payable on certain retail store leases based on store revenues. The majority of the Group’s property leases provide for their renewal by mutual agreement at the expiry of the lease term.
Future minimum rentals payable under non-cancellable operating leases where the Group is the lessee:
2017£m
2016£m
Leases expiring:Within one year 246.3 242.6In two to five years 825.6 828.9Over five years 963.6 917.2
2,035.5 1,988.7
At January 2017, future rentals receivable under non-cancellable subleases where the Group is the lessor were £12.0m (2016: £11.3m).
Go
vernanceShareho
lder Info
rmatio
n
137n e x t p l c . c o . u k
Financial Statements
Strategic R
epo
rt
Group
Com
pany

slugline
29. Operating Lease Commitments (continued)
Additional information on the Group’s leasing commitments as at 28 January 2017 is detailed in the table below:
Minimum lease
payments£m
Less sub-lease
income£m
Net total£m
Year to January 2016 (Actual) 236.2 (6.8) 229.4Year to January 2017 (Actual) 243.5 (7.7) 235.8
Year to January 2018 246.3 (6.3) 240.0Year to January 2019 233.6 (3.5) 230.1Year to January 2020 224.1 (2.0) 222.1Year to January 2021 196.9 (0.2) 196.7Year to January 2022 171.0 – 171.0
Subtotal 5 years to January 2022 1,071.9 (12.0) 1,059.95 years from February 2022 to January 2027 591.7 – 591.710 years from February 2027 to January 2037 345.6 – 345.62037 and beyond 26.3 – 26.3Total future obligations 2,035.5 (12.0) 2,023.5
30. Related Party TransactionsDuring the year to January 2016, the directors became aware that certain dividends paid in 2014 and 2015 totalling £311.2m had been made otherwise than in accordance with the Companies Act 2006 because interim accounts had not been filed at Companies House prior to payment. At a General Meeting of the Company’s shareholders held on 10 February 2016, a resolution was passed which authorised the appropriation of distributable profits to the payment of the relevant dividends and removed any right for the Company to pursue shareholders or directors for repayment. This constituted a related party transaction under IAS 24 “Related party disclosures”. The overall effect of the resolution being passed was to return all parties to the position they would have been in had the relevant dividends been made in full compliance with the Act.
During the year the Group sold goods and services in the normal course of business to its associate undertaking, Choice Discount Stores Limited, as follows:
2017£m
2016£m
Sales 8.6 7.7Trade receivables 0.4 0.7
The Group’s other related party transactions were the remuneration of key management personnel (refer to Note 4).
Notes to the Consolidated Financial Statements
138 n e x t p l c . c o . u k

slugline
COMPANY FINANCIAL STATEMENTS
140 Parent Company Balance Sheet141 Parent Company Statement
of Changes in Equity142 Notes to the Parent Company Financial
Statements
Go
vernanceShareho
lder Info
rmatio
nFinancial Statem
entsStrateg
ic Rep
ort
Group
Com
pany
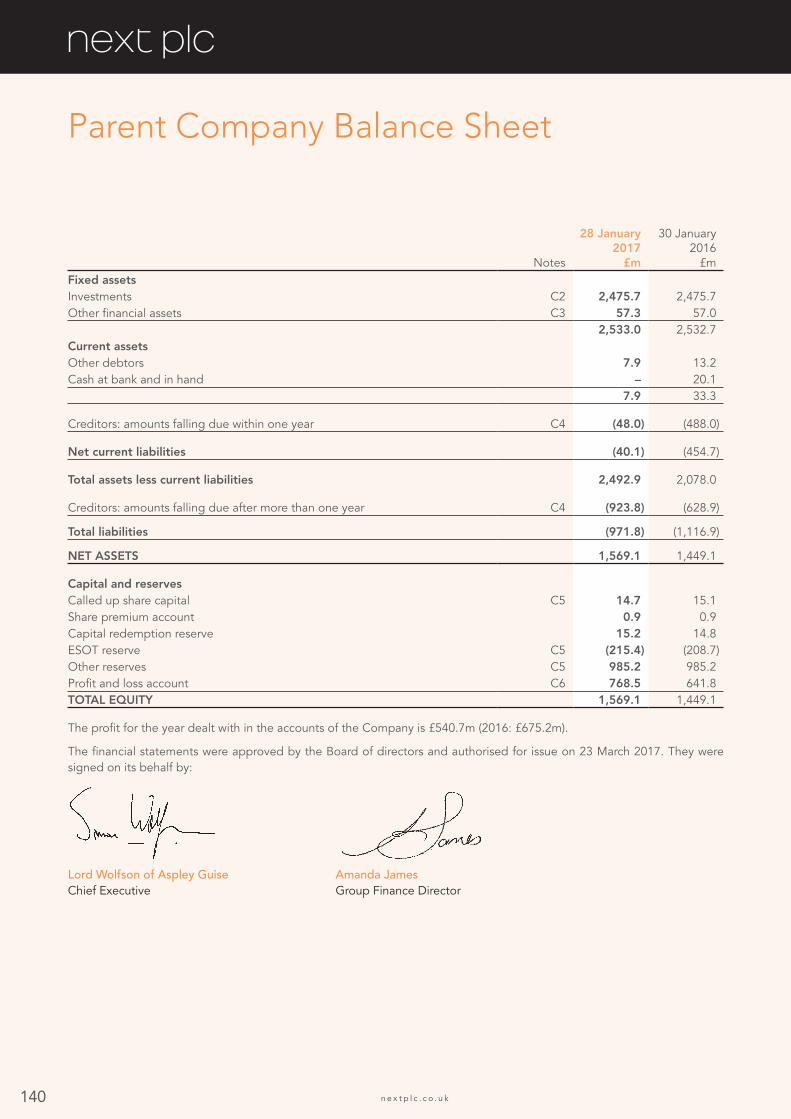
slugline
Notes
28 January2017
£m
30 January2016
£mFixed assetsInvestments C2 2,475.7 2,475.7Other financial assets C3 57.3 57.0
2,533.0 2,532.7Current assetsOther debtors 7.9 13.2Cash at bank and in hand – 20.1
7.9 33.3
Creditors: amounts falling due within one year C4 (48.0) (488.0)
Net current liabilities (40.1) (454.7)
Total assets less current liabilities 2,492.9 2,078.0
Creditors: amounts falling due after more than one year C4 (923.8) (628.9)
Total liabilities (971.8) (1,116.9)
NET ASSETS 1,569.1 1,449.1
Capital and reservesCalled up share capital C5 14.7 15.1Share premium account 0.9 0.9Capital redemption reserve 15.2 14.8ESOT reserve C5 (215.4) (208.7)Other reserves C5 985.2 985.2Profit and loss account C6 768.5 641.8TOTAL EQUITY 1,569.1 1,449.1
The profit for the year dealt with in the accounts of the Company is £540.7m (2016: £675.2m).
The financial statements were approved by the Board of directors and authorised for issue on 23 March 2017. They were signed on its behalf by:
Lord Wolfson of Aspley Guise Chief Executive
Amanda James Group Finance Director
Parent Company Balance Sheet
140 n e x t p l c . c o . u k

slugline
Parent Company Statement of Changes in Equity
Sharecapital
£m
Sharepremiumaccount
£m
Capitalredemption
reserve£m
ESOT
reserve£m
Otherreserves
£m
Profit andloss
account£m
Total equity
£mAt 24 January 2015 15.3 0.9 14.6 (192.0) 985.2 621.6 1,445.6Profit for the year – – – – – 675.2 675.2Other comprehensive income for the year – – – – – – –Total comprehensive income for the year – – – – – 675.2 675.2Share buybacks and commitments (Note C5) (0.2) – 0.2 – – (49.6) (49.6)ESOT share purchases and commitments (Note C5) – – – (108.7) – – (108.7)Shares issued by ESOT – – – 92.0 – (37.2) 54.8Share option charge – – – – – 13.7 13.7Equity dividends – – – – – (581.9) (581.9)At 30 January 2016 15.1 0.9 14.8 (208.7) 985.2 641.8 1,449.1Profit for the year – – – – – 540.7 540.7Other comprehensive income for the year – – – – – – –Total comprehensive income for the year – – – – – 540.7 540.7Share buybacks and commitments (Note C5) (0.4) – 0.4 – – (187.6) (187.6)ESOT share purchases and commitments (Note C5) – – – (50.9) – – (50.9)Shares issued by ESOT – – – 44.2 – (13.7) 30.5Share option charge – – – – – 13.1 13.1Equity dividends – – – – – (225.8) (225.8)At 28 January 2017 14.7 0.9 15.2 (215.4) 985.2 768.5 1,569.1
Go
vernanceShareho
lder Info
rmatio
n
141n e x t p l c . c o . u k
Financial Statements
Strategic R
epo
rt
Group
Com
pany
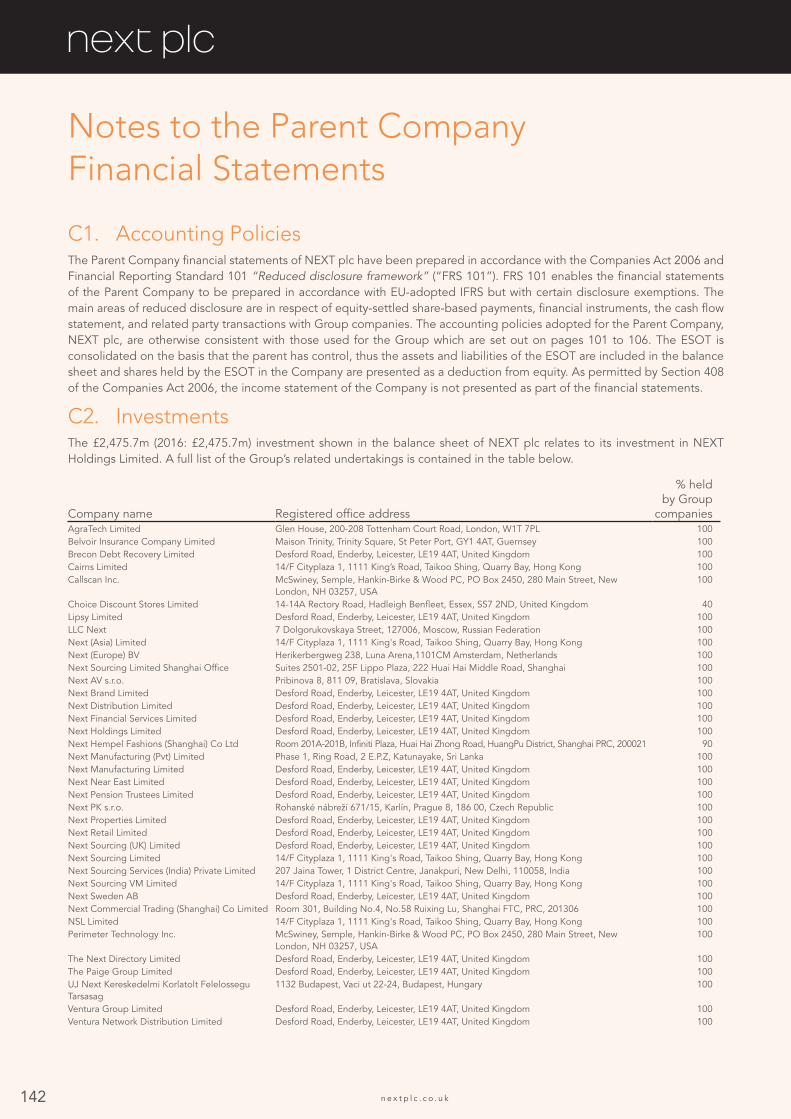
slugline
C1. Accounting PoliciesThe Parent Company financial statements of NEXT plc have been prepared in accordance with the Companies Act 2006 and Financial Reporting Standard 101 “Reduced disclosure framework” (“FRS 101”). FRS 101 enables the financial statements of the Parent Company to be prepared in accordance with EU-adopted IFRS but with certain disclosure exemptions. The main areas of reduced disclosure are in respect of equity-settled share-based payments, financial instruments, the cash flow statement, and related party transactions with Group companies. The accounting policies adopted for the Parent Company, NEXT plc, are otherwise consistent with those used for the Group which are set out on pages 101 to 106. The ESOT is consolidated on the basis that the parent has control, thus the assets and liabilities of the ESOT are included in the balance sheet and shares held by the ESOT in the Company are presented as a deduction from equity. As permitted by Section 408 of the Companies Act 2006, the income statement of the Company is not presented as part of the financial statements.
C2. InvestmentsThe £2,475.7m (2016: £2,475.7m) investment shown in the balance sheet of NEXT plc relates to its investment in NEXT Holdings Limited. A full list of the Group’s related undertakings is contained in the table below.
Company name Registered office address
% held by Group
companiesAgraTech Limited Glen House, 200-208 Tottenham Court Road, London, W1T 7PL 100Belvoir Insurance Company Limited Maison Trinity, Trinity Square, St Peter Port, GY1 4AT, Guernsey 100Brecon Debt Recovery Limited Desford Road, Enderby, Leicester, LE19 4AT, United Kingdom 100Cairns Limited 14/F Cityplaza 1, 1111 King’s Road, Taikoo Shing, Quarry Bay, Hong Kong 100Callscan Inc. McSwiney, Semple, Hankin-Birke & Wood PC, PO Box 2450, 280 Main Street, New
London, NH 03257, USA100
Choice Discount Stores Limited 14-14A Rectory Road, Hadleigh Benfleet, Essex, SS7 2ND, United Kingdom 40Lipsy Limited Desford Road, Enderby, Leicester, LE19 4AT, United Kingdom 100LLC Next 7 Dolgorukovskaya Street, 127006, Moscow, Russian Federation 100Next (Asia) Limited 14/F Cityplaza 1, 1111 King's Road, Taikoo Shing, Quarry Bay, Hong Kong 100Next (Europe) BV Herikerbergweg 238, Luna Arena,1101CM Amsterdam, Netherlands 100Next Sourcing Limited Shanghai Office Suites 2501-02, 25F Lippo Plaza, 222 Huai Hai Middle Road, Shanghai 100Next AV s.r.o. Pribinova 8, 811 09, Bratislava, Slovakia 100Next Brand Limited Desford Road, Enderby, Leicester, LE19 4AT, United Kingdom 100Next Distribution Limited Desford Road, Enderby, Leicester, LE19 4AT, United Kingdom 100Next Financial Services Limited Desford Road, Enderby, Leicester, LE19 4AT, United Kingdom 100Next Holdings Limited Desford Road, Enderby, Leicester, LE19 4AT, United Kingdom 100Next Hempel Fashions (Shanghai) Co Ltd Room 201A-201B, Infiniti Plaza, Huai Hai Zhong Road, HuangPu District, Shanghai PRC, 200021 90Next Manufacturing (Pvt) Limited Phase 1, Ring Road, 2 E.P.Z, Katunayake, Sri Lanka 100Next Manufacturing Limited Desford Road, Enderby, Leicester, LE19 4AT, United Kingdom 100Next Near East Limited Desford Road, Enderby, Leicester, LE19 4AT, United Kingdom 100Next Pension Trustees Limited Desford Road, Enderby, Leicester, LE19 4AT, United Kingdom 100Next PK s.r.o. Rohanské nábreží 671/15, Karlín, Prague 8, 186 00, Czech Republic 100Next Properties Limited Desford Road, Enderby, Leicester, LE19 4AT, United Kingdom 100Next Retail Limited Desford Road, Enderby, Leicester, LE19 4AT, United Kingdom 100Next Sourcing (UK) Limited Desford Road, Enderby, Leicester, LE19 4AT, United Kingdom 100Next Sourcing Limited 14/F Cityplaza 1, 1111 King's Road, Taikoo Shing, Quarry Bay, Hong Kong 100Next Sourcing Services (India) Private Limited 207 Jaina Tower, 1 District Centre, Janakpuri, New Delhi, 110058, India 100Next Sourcing VM Limited 14/F Cityplaza 1, 1111 King's Road, Taikoo Shing, Quarry Bay, Hong Kong 100Next Sweden AB Desford Road, Enderby, Leicester, LE19 4AT, United Kingdom 100Next Commercial Trading (Shanghai) Co Limited Room 301, Building No.4, No.58 Ruixing Lu, Shanghai FTC, PRC, 201306 100NSL Limited 14/F Cityplaza 1, 1111 King's Road, Taikoo Shing, Quarry Bay, Hong Kong 100Perimeter Technology Inc. McSwiney, Semple, Hankin-Birke & Wood PC, PO Box 2450, 280 Main Street, New
London, NH 03257, USA100
The Next Directory Limited Desford Road, Enderby, Leicester, LE19 4AT, United Kingdom 100The Paige Group Limited Desford Road, Enderby, Leicester, LE19 4AT, United Kingdom 100UJ Next Kereskedelmi Korlatolt Felelossegu Tarsasag
1132 Budapest, Vaci ut 22-24, Budapest, Hungary 100
Ventura Group Limited Desford Road, Enderby, Leicester, LE19 4AT, United Kingdom 100Ventura Network Distribution Limited Desford Road, Enderby, Leicester, LE19 4AT, United Kingdom 100
Notes to the Parent Company Financial Statements
142 n e x t p l c . c o . u k

slugline
C3. Other Financial AssetsOther financial assets comprise interest rate derivatives as detailed in Note 12 of the consolidated financial statements, which are carried at their fair value.
C4. Current and Non-current Creditors2017 2016
Current£m
Non-current£m
Current£m
Non-current£m
Corporate bonds – 907.3 213.8 615.0Unsecured bank loans – – 115.0 –Amounts due to subsidiary undertaking 32.1 – 58.6 –Dividends payable – – 88.3 –Other financial liabilities – 16.5 – 13.9Accruals and other creditors 15.9 – 12.3 –
48.0 923.8 488.0 628.9
Further information on the Company’s corporate bonds is given in Note 17. For dividends payable refer to Note 7. Other financial liabilities include interest rate swaps carried at fair value (Refer to Note 16).
C5. Share Capital, ESOT and Other ReservesDetails of the Company’s share capital and share buybacks are given in Note 20. ESOT transactions are detailed in Note 23. Other reserves in the Company balance sheet of £985.2m (2016: £985.2m) represent the difference between the market price and the nominal value of shares issued as part of the capital reconstruction in 2002 on acquisition of NEXT Holdings Limited (formerly NEXT Group plc) which was subject to section 131 Companies Act 1985 merger relief.
C6. Profit and Loss Account and Distributable ReservesThe profit and loss account of the Parent Company does not include any unrealised profits, however the amount available for distribution under the Companies Act 2006 by reference to these accounts is effectively reduced by the ESOT reserve of £215.4m (2016: £208.7m). At January 2017, therefore, the amount available for distribution by reference to these accounts is £553.1m (2016: £433.1m). The Group also has substantial retained profits in its subsidiary companies which are expected to flow up to the Parent Company in due course, such that surplus cash generated can continue to be returned to our external shareholders.
During the year to January 2016, the directors became aware that certain dividends paid in 2014 and 2015 were made otherwise than in accordance with the Companies Act 2006 because interim accounts had not been filed at Companies House prior to payment. At a General Meeting of the Company’s shareholders held on 10 February 2016, a resolution was passed which authorised the appropriation of distributable profits to the payment of the relevant dividends and removed any right for the Company to pursue shareholders or directors for repayment. The overall effect of this resolution being passed was to return all parties to the position they would have been in had the relevant dividends been made in full compliance with the Companies Act 2006.
Go
vernanceShareho
lder Info
rmatio
n
143n e x t p l c . c o . u k
Financial Statements
Strategic R
epo
rt
Group
Com
pany

slugline
SHAREHOLDER INFORMATION145 Half Year and Sector Analysis146 Five Year History147 Glossary149 Notice of Meeting
157 Other Shareholder Information

slugline
Half Year and Sector Analysis (unaudited)
First half £m
Second half £m
52 weeks to Jan 2017
£m
First half £m
Second half £m
53 weeks to Jan 2016
£mTotal sales1
NEXT Retail 1,083.6 1,221.0 2,304.6 1,083.0 1,323.0 2,406.0NEXT Directory 821.2 907.3 1,728.5 767.0 920.7 1,687.7NEXT International Retail 32.1 31.6 63.7 36.3 39.6 75.9NEXT Sourcing 2.5 2.8 5.3 3.2 4.0 7.2Lipsy 14.1 13.0 27.1 14.9 15.2 30.1Property Management 3.6 4.0 7.6 3.0 3.8 6.8Total 1,957.1 2,179.7 4,136.8 1,907.4 2,306.3 4,213.7
Profit before taxNEXT Retail 133.9 204.8 338.7 161.0 247.1 408.1NEXT Directory 204.2 239.9 444.1 184.1 229.2 413.3NEXT International Retail 4.2 5.1 9.3 4.7 5.7 10.4NEXT Sourcing 21.8 22.9 44.7 22.9 28.2 51.1Lipsy 2.8 2.7 5.5 1.8 3.9 5.7Property Management 3.0 3.8 6.8 6.6 0.9 7.5Other activities (9.4) (12.0) (21.4) (19.1) (9.8) (28.9)Operating profit 360.5 467.2 827.7 362.0 505.2 867.2Net finance costs (18.4) (19.1) (37.5) (14.9) (16.2) (31.1)Total 342.1 448.1 790.2 347.1 489.0 836.1
1 As defined in Note 1 of the consolidated financial statements.
Go
vernanceFinancial Statem
ents
145n e x t p l c . c o . u k
Sharehold
er Inform
ation
Strategic R
epo
rt

slugline
Five Year History
Year to January 2017
£m 2016
£m2015
£m2014
£m2013
£mUnderlying1 continuing businessTotal sales2 4,136.8 4,213.7 4,027.8 3,758.2 3,562.5Statutory revenue 4,097.3 4,176.9 3,999.8 3,740.0 3,547.8Operating profit – underlying 52 weeks 827.7 851.8 812.1 722.8 650.2Net finance costs – underlying 52 weeks (37.5) (30.5) (29.9) (27.6) (28.6)Profit before tax – underlying 52 weeks 790.2 821.3 782.2 695.2 621.653rd week (pre-tax) – 14.8 – – –Exceptional items (pre-tax) – – 12.6 – 44.9Taxation (154.9) (169.3) (159.9) (142.0) (157.9)Profit after taxation 635.3 666.8 634.9 553.2 508.6
Total equity 510.5 311.8 321.9 286.2 285.6
Shares purchased for cancellation 3.6m 2.2m 2.2m 6.2m 7.5mDividends per share – ordinary 158.0p 158.0p 150.0p 129.0p 105.0p – special – 240.0p 150.0p 50.0p –
Basic Earnings Per Share Underlying (52 weeks) 441.3p 442.5p 419.8p 366.1p 297.7p Total 441.3p 450.5p 428.3p 366.1p 320.1p
1. Underlying is shown pre-exceptional items.2. As defined in Note 1 of the consolidated financial statements.
146 n e x t p l c . c o . u k

slugline
Glossary
Alternative performance measuresThe Directors use alternative performance measures as they believe these measures provide additional useful information on the underlying trends, performance and position of the Group. These measures are used for performance analysis. The alternative performance measures are not defined by IFRS and therefore may not be directly comparable with other companies’ alternative performance measures. These measures are not intended to be a substitute for, or superior to, IFRS measures.
Divisional operating profitDivisional profit before interest and tax, excluding equity-settled share option charges recognised under IFRS 2 “Share-Based Payment” and unrealised foreign exchange gains and losses on derivatives which do not qualify for hedge accounting. Refer to Note 1 of the financial statements.
Earnings Per ShareThe level of growth in EPS provides a suitable measure of the financial health of the Group and its ability to deliver returns to shareholders. Refer to Note 8 of the financial statements.
EBITDAEarnings before Interest, Taxation, Depreciation and Amortisation is a measure of cash generation. 2017 EBITDA is calculated as profit before tax of £790m plus interest of £38m, plus depreciation and amortisation of £118m.
Full price salesVAT exclusive sales of stock items excluding items sold in our mid-season or end-of-season Sale events and our Clearance operations and includes interest income relating to those sales. Full price sales are a direct indicator of the performance and profitability of the business.
Bought-in gross marginDifference between the cost of stock and initial selling price, expressed as a percentage of achieved total VAT exclusive selling prices. Bought-in gross margin is a measure of the profit made on the sale of stock at full price.
Like-for-like salesGrowth in sales from stores which have been open for at least one full year. This metric enables the performance of the Group to be measured on a consistent year on year basis.
Net branch profitStore Total Sales less cost of sales, payroll, controllable costs, occupancy costs and depreciation. Expressed as a percentage of VAT inclusive sales. It is a measure of profitability on a store by store level.
Net debtComprises cash and cash equivalents, bank loans, corporate bonds, fair value hedges of corporate bonds and finance leases. Refer to Note 28 of the financial statements. Net debt is a measure of the Group’s indebtedness.
Net operating marginProfit after deducting markdowns and all direct and indirect trading costs, expressed as a percentage of achieved Total Sales. Net margin measures whether profitability is changing at a higher or lower rate relative to revenue.
Total SalesVAT exclusive full price and markdown sales including the full value of commission based sales and interest income (as described and reconciled in Note 1 of the financial statements). Total sales is a direct indicator of performance.
Underlying like-for-like salesLike-for-like sales, excluding stores impacted by new openings. This is a measure of the annual performance of stores taking into account the impact of new store openings on existing stores.
Underlying profit and Earnings Per ShareExcludes exceptional items and shown on a consistent 52 week basis, where relevant. Allows for more consistent comparison, excluding one-off items.
Go
vernanceFinancial Statem
ents
147n e x t p l c . c o . u k
Sharehold
er Inform
ation
Strategic R
epo
rt
slugline
Other definitionsDirectory active customersCustomers who have placed a Directory order or received a standard account statement in the last 20 weeks.
Capital expenditure (“Capex”)The additions to property, plant and equipment.
Cash recoveryCash recovery is the cash generated from Markdown sales expressed as a percentage of the VAT inclusive full price value of the stock going into the Sale.
Directory cash customersDirectory customers who pay at the time of ordering online or via the Call Centre.
Directory credit customersCustomers who order using a Directory credit account (nextpay account).
Exceptional itemsExceptional items relate to certain costs or incomes that derive from events or transactions that fall within the normal activities of the Group but which, individually or, if of a similar type, in aggregate, are excluded from the Group’s underlying performance measures by virtue of their size and nature in order to better reflect management’s view of the performance of the Group.
FTEFTE refers to full time equivalent number of employees.
Internal rate of return (IRR)Internal rate of return is a discount rate that makes the net present value of all cash flows from a particular project equal to zero.
Like-for-like storesStores that have traded for at least one full year.
Mainline storeNon-clearance store. Clearance stores sell stock left over from the NEXT end-of-season Sale activity.
Markdown salesVAT exclusive sales of stock items in our mid-season or end-of-season Sale events and our Clearance operations.
Retail selling spaceSelling space is defined as the trading floor area of a store which excludes stockroom and administration areas.
LTIPLong Term Incentive Plan (refer to page 75).
SMPShare Matching Plan (refer to page 75).
Total Shareholder Returns (TSR)TSR has been calculated by reference to the growth in share price combined with the notional investment of gross dividends on ex-dividend dates to create a dividend fraction.
Glossary
148 n e x t p l c . c o . u k

slugline
Notice of Meeting
THIS DOCUMENT IS IMPORTANT AND REQUIRES YOUR IMMEDIATE ATTENTION.
If you are in any doubt as to the action you should take, you are recommended to seek your own personal financial advice from your stockbroker, bank manager, solicitor, accountant or other financial advisor authorised under the Financial Services and Markets Act 2000.
If you have sold or otherwise transferred all your NEXT plc (“NEXT” and/or the “Company”) shares, please send this document, together with the accompanying Form of Proxy, as soon as possible to the purchaser or transferee, or to the stockbroker, bank or other agent through whom the sale or transfer was effected, for delivery to the purchaser or transferee.
Notice is given that the Annual General Meeting (AGM) of NEXT will be held at the Leicester Marriott Hotel, Smith Way, Grove Park, Leicester, LE19 1SW on Thursday 18 May 2017 at 9.30 am at which the following resolutions will be proposed, resolutions 1 to 17 as Ordinary Resolutions and 18 to 23 as Special Resolutions.
Further information on these resolutions can be found in the Directors’ Report on pages 43 to 46 and in the appendices to this Notice. Biographies of the directors are shown on pages 40 and 41 of the Annual Report.
1. To receive and adopt the accounts and reports of the directors and auditor for the year ended 28 January 2017.
2. To approve the Directors’ Remuneration Policy, the full text of which is contained in the Remuneration Report for the year ended 28 January 2017 and set out on pages 63 to 72.
3. To approve the Remuneration Report (excluding the Directors’ Remuneration Policy set out on pages 63 to 72) for the year ended 28 January 2017.
4. To declare a final dividend of 105p per share in respect of the year ended 28 January 2017.
5. To re-elect John Barton as a director.
6. To elect Jonathan Bewes as a director.
7. To re-elect Caroline Goodall as a director.
8. To re-elect Amanda James as a director.
9. To re-elect Michael Law as a director.
10. To elect Michael Roney as a director.
11. To re-elect Francis Salway as a director.
12. To re-elect Jane Shields as a director.
13. To re-elect Dame Dianne Thompson as a director.
14. To re-elect Lord Wolfson as a director.
15. To appoint PricewaterhouseCoopers LLP as auditor of the Company, to hold office until the conclusion of the 2018 AGM of the Company and to authorise the directors to set their remuneration.
16. That the directors be authorised to amend the rules of the NEXT Long Term Incentive Plan (LTIP) to permit new awards under the LTIP to receive the benefits of dividends paid by the Company in the period from the grant date of the awards and the date when these awards vest, as explained on page 43 of the Directors’ Report.
17. Directors’ authority to allot shares
That:
a. the directors be authorised to allot equity securities (as defined in section 560 of the Companies Act 2006 (the “2006 Act”)) in the Company:
i. in accordance with article 7 of the Company’s articles of association (the “Articles”), up to a maximum nominal amount of £4,900,000 (as reduced by any equity securities allotted under paragraph (a)(ii) below); and
ii. up to a maximum nominal amount of £9,800,000 (as reduced by any equity securities allotted under paragraph (a)(i) above) in connection with an offer by way of a rights issue (as defined in article 8(b)(ii) of the Articles);
b. in accordance with article 7 of the Articles this authority shall expire at the conclusion of the next AGM of the Company after the passing of this resolution, or, if earlier, at the close of business on 18 August 2018; and
c. all previous unutilised authorities under section 551 of the 2006 Act shall cease to have effect (save to the extent that the same are exercisable pursuant to section 551(7) of the 2006 Act by reason of any offer or agreement made prior to the date of this resolution which would or might require shares to be allotted on or after that date).
Go
vernanceFinancial Statem
ents
149n e x t p l c . c o . u k
Sharehold
er Inform
ation
Strategic R
epo
rt

slugline
18. General disapplication of pre-emption rights
a. that, subject to resolution 17 being passed, in accordance with article 8 of the Articles, the directors be given power to allot equity securities for cash;
b. the power under paragraph (a) above (other than in connection with a rights issue, as defined in article 8(b)(ii) of the Articles) shall be limited to the allotment of equity securities having a nominal amount not exceeding in aggregate £735,000 representing 5% of the issued ordinary share capital;
c. in accordance with article 8 of the Articles this authority shall expire at the conclusion of the next AGM of the Company after the passing of this resolution or, if earlier, at the close of business on 18 August 2018; and
d. all previous unutilised authorities under sections 570 and 573 of the 2006 Act shall cease to have effect (save to the extent that they are exercisable by reason of any offer or agreement made prior to the date of this new resolution which would or might require shares to be allotted on or after that date).
19. Additional disapplication of pre-emption rights
a. that, subject to resolutions 17 and 18 being passed, in accordance with article 8 of the Articles, the directors be given the power to allot additional equity securities for cash;
b. the power under paragraph (a) above (other than in connection with a rights issue, as defined in article 8(b)(ii) of the Articles) shall be limited to the allotment of equity securities having a nominal amount not exceeding in aggregate £735,000 representing 5% of the issued ordinary share capital;
c. used only for the purposes of financing (or refinancing, if the authority is to be used within six months after the original transaction) a transaction which the directors determine to be an acquisition or other capital investment of a kind contemplated by the Statement of Principles on Disapplying Pre-emption Rights most recently published by the Pre-Emption Group prior to the date of this notice;
d. in accordance with article 8 of the Articles this authority shall expire at the conclusion of the next AGM of the Company after the passing of this resolution or, if earlier, at the close of business on 18 August 2018; and
e. other than in respect of authorities granted pursuant to resolution 18, all previous unutilised authorities under sections 570 and 573 of the 2006 Act shall cease to have effect (save to the extent that they are exercisable by reason of any offer or agreement made prior to the date of this new resolution which would or might require shares to be allotted on or after that date).
20. On-market purchase of own shares
That in accordance with the 2006 Act, the Company be granted general and unconditional authority to make market purchases (as defined in section 693 of the 2006 Act) of any of its own ordinary shares on such terms and in such manner as the directors may determine provided that:
a. the authority conferred by this resolution shall be limited to the lesser of 22,043,000 ordinary shares of 10p each and no more than 14.99% of the issued ordinary shares outstanding at the date of the AGM, such limit to be reduced by the number of any shares purchased pursuant to the authority granted at resolution 21 opposite;
b. the minimum price which may be paid for ordinary shares (exclusive of expenses) is 10p per ordinary share;
c. the maximum price which may be paid for each ordinary share (exclusive of expenses) is an amount not more than the higher of: (i) 105% of the average of the middle market price of the ordinary shares of the Company according to the Daily Official List of the London Stock Exchange for the five business days immediately preceding the date of purchase and (ii) an amount equal to the higher of the price of the last independent trade of an ordinary share of the Company and the highest current independent bid for an ordinary share of the Company as derived from the London Stock Exchange Trading System;
d. this authority shall expire at the conclusion of the next AGM of the Company after the passing of this resolution or, if earlier, at the close of business 18 August 2018;
e. the Company may make a contract or contracts to purchase ordinary shares under the authority hereby conferred prior to the expiry of such authority which will or may be executed wholly or partly after the expiry of such authority and may make a purchase of ordinary shares in pursuance of any such contract; and
Notice of Meeting
150 n e x t p l c . c o . u k

slugline
f. all existing authorities for the Company to make market purchases of its own ordinary shares are revoked, except in relation to the purchase of shares under a contract or contracts concluded before the date of this resolution and which has or have not yet been executed.
21. Off-market purchases of own shares
That, in accordance with section 694 of the 2006 Act, the proposed programme agreements to be entered into between the Company and any of Goldman Sachs International, UBS AG, Deutsche Bank AG, HSBC Bank plc and Barclays Bank plc (in the form produced to this meeting and initialled by the Chairman for the purpose of identification) (the “Programme Agreements”) be and are approved and the Company be and is authorised to enter into the Programme Agreements and all and any forward trades which may be effected or made from time to time under or pursuant to the Programme Agreements for the off-market purchase by the Company of its ordinary shares of 10 pence each, as more fully described in Appendix 1 on pages 152 to 153 of this Notice (the authority conferred by this special resolution to expire on whichever is the earlier of the conclusion of the next AGM of the Company held after the passing of this resolution of, if earlier, at the close of business on 18 August 2018, (except in relation to the purchase of ordinary shares under any forward trade effected or made before the expiry of such authority and which might be completed wholly or partly after such expiry)), and provided that shares purchased pursuant to this authority will reduce the number of shares that the Company may purchase under the general authority granted under resolution 20 opposite.
22. Increasing the Company’s borrowing powers
That the Articles be amended by deleting the present article 67 (borrowing powers) and replacing it with a new article 67 in order to increase the directors’ powers to incur borrowings of the Company from the higher of £1.5bn or an amount equal to two times adjusted total equity to the higher of £2bn, or an amount equal to two times adjusted total equity (as defined in the Articles) of the Company. For these purposes borrowings do not include operational leases.
23. Notice of general meetings
That, in accordance with the Articles, a general meeting (other than an AGM) may be called on not less than 14 clear days’ notice.
By order of the Board
Seonna AndersonCompany SecretaryRegistered Office: Desford Road, Enderby, Leicester, LE19 4AT17 April 2017
Go
vernanceFinancial Statem
ents
151n e x t p l c . c o . u k
Sharehold
er Inform
ation
Strategic R
epo
rt

slugline
Appendix 1Further information on resolution 21: Off-market purchases of own shares As noted in the Directors’ Report on page 44, approval will be sought from shareholders to renew the Company’s authority to make off-market purchases of its shares.
By virtue of special resolution 16 passed at the Company’s 2016 AGM, shareholder authority was given to the Company to make on-market purchases of shares. This authority was limited to a maximum of 22,585,000 shares and expires on the earlier of the date of the AGM held in 2017 or 19 August 2017. At the same AGM, authority was granted to the Company to make off-market purchases of shares for cancellation under contingent purchase contracts to be entered into with any of Goldman Sachs International, UBS AG, Deutsche Bank AG, HSBC Bank plc and Barclays Bank plc (the “Bank(s)”). This authority was limited to a maximum of 3 million shares and expires on the earlier of the date of the AGM to be held in 2017 or 19 August 2017. Pursuant to those authorities and up to 22 March 2017, the Company has bought back 3,613,121 shares for cancellation, representing 2.4% of its issued share capital as at the date of the 2016 AGM, at a total cost of £187.6m. No shares were bought back under contingent purchase contracts.
Under sections 693 and 694 of the 2006 Act, the Company is not permitted to make off-market purchases or contingent purchases of its shares unless it obtains advance shareholder approval to the proposed contract terms. Furthermore, the Market Abuse Regulations (MAR) limit the Company’s ability to purchase its shares at a time when any director is in receipt of unpublished price sensitive information about the Company. Accordingly, no purchases of shares would normally be made in periods when the directors might be in receipt of unpublished price sensitive information (“Closed Periods”). The Company typically follows the definition of Closed Period in Article 19(11) of MAR which includes 30 days before the announcement of its interim results in September and full year results in March each year. In the absence of a Programme Agreement (as defined below), these Closed Periods inevitably reduce the number of shares the Company is able to purchase.
In order to achieve maximum flexibility in its share purchase activities, the Company is able to enter into irrevocable and non-discretionary programmes to allow it to buy shares during Closed Periods. Another method of providing flexibility and reducing the cost, is for the Company to enter into contingent forward purchase contracts outside of Closed
Periods. As in previous years, the Company intends to enter into new agreements (the “Programme Agreements”), with each of the Banks, under which the Company may (although it is not obliged to) enter into contingent forward trades (Contingent Forward Trades or CFT) from time to time.
The terms of a CFT will be agreed between the Company and the Bank before it is entered into. The Company is committed to purchase shares under a CFT on the day it is executed subject to the terms of the Programme Agreement. The terms of each CFT will provide for the Company to purchase a fixed number of shares each week over a period of between 20 to 30 weeks. The maximum number of shares that can be purchased under each CFT is limited to 30,000 shares per week.
Whether or not the Company purchases shares in a particular week during the term of a CFT is dependent upon the Company’s share price either not rising to, or above, a level (the “Upper Suspension Level”) or, if applicable, falling to or below a level (the “Lower Suspension Level” and together with the Upper Suspension Level, the “Suspension Levels”). The Suspension Levels and duration are determined by the Company and are set at the time the CFT is entered into. The Upper Suspension Level must be set between 104% and 110% of the Company’s share price at the start of the CFT. If the Company chooses to incorporate a Lower Suspension Level, it must be set between 80% and 95% of the price at the start of the CFT. The inclusion of a Lower Suspension Level would help mitigate the Company’s financial commitment under a CFT if its share price was to fall below this level after the CFT had been executed. If the Lower Suspension Level is not included, the level of discount to the market share price would be higher.
The price at which the Company may purchase shares during the term of a CFT (the “Forward Price”) shall also be fixed at the start of the CFT. The Forward Price will be determined by the Bank with reference to the volume weighted average price for shares traded in NEXT on the day the CFT is entered into. The Forward Price is subject to a maximum of 99% of the share price at the start of the contract and a minimum of 10 pence (the par value of an ordinary share). The minimum and maximum amount of time between entering a CFT and shares being purchased is 5 days and 30 weeks respectively. The Company will announce the details of each CFT on the day it is entered into and any subsequent termination via the UK Listing Authority’s Regulatory News Service. This structure would allow the Company to purchase shares at a discount to the market price (as at the time each CFT commences), for so long as the Suspension Levels are not reached, without breaching the Listing Rules. If any Suspension Level is reached, the CFT would terminate automatically at that time and no further shares would be purchased under that contract.
Notice of Meeting
152 n e x t p l c . c o . u k
slugline
Under the provisions of sections 693 and 694 of the 2006 Act, the Programme Agreements and Contingent Forward Trades are contingent purchase contracts to purchase shares by the Company off-market. Accordingly resolution 21, which will be proposed as a special resolution, seeks shareholder approval to the terms of the Programme Agreements to be entered into between the Company and each of the Banks. The Programme Agreements will have a duration of the shorter of the period to the date of the next AGM to be held in 2018 or 18 August 2018 and will incorporate the terms of an ISDA Master Agreement and Schedule. The Programme Agreements will be entered into and each CFT will be affected outside a Closed Period but shares may be purchased during a Closed Period by the Company.
Should shareholder approval be granted, any number of CFT may be affected with the Banks at any time, provided that:
• the total maximum number of shares which the Company is permitted to purchase pursuant to this authority would be 3 million, representing circa 2% of its issued share capital at 22 March 2017;
• the total cost of shares that the Company would be permitted to purchase pursuant to this authority may not exceed £200m (including costs);
• the Forward Price may not exceed the higher of:
(i) 105 per cent of the average of the middle market price of a share according to the Daily Official List of the London Stock Exchange for the five business days immediately preceding the day on which the share is purchased; and
(ii) an amount equal to the higher of the price of the last independent trade of an ordinary share of the Company and the highest current independent bid for an ordinary share of the Company as derived from the London Stock Exchange Trading System;
• the Forward Price will be no more than 99% of the share price at the time the CFT was effected;
• the minimum price that can be paid for any share is 10p; and
• only one CFT will be entered into on any particular day.
Shares purchased under the Programme Agreements will reduce the number of shares that the Company may purchase under any authority granted at the AGM on 18 May 2017 for on-market purchases. No shares will be purchased under that authority on the same day that a CFT is entered into. The authority granted to the Company under this resolution will expire at the conclusion of the AGM of the Company held in 2018 or on 18 August 2018, whichever is the earlier, unless such authority is renewed prior to that time (except in relation to the purchase of shares under any CFT effected before the expiry of such authority and which might be completed wholly or partly after such expiry). The purchase of shares under the Programme Agreements will always be physically settled by delivery of shares to the Company (except in the case of certain events of default or termination events).
A copy of each of the Programme Agreements will be available at the AGM on 18 May 2017. Copies will also be available for inspection at the Company’s registered office at Desford Road, Enderby, Leicester, LE19 4AT and at the offices of Slaughter and May at One Bunhill Row, London, EC1Y 8YY during usual business hours until the date of the AGM and at the AGM itself.
The total number of employee share awards and share options to subscribe for shares outstanding at 22 March 2017 was 5,370,981. This represents 3.7% of the issued share capital at that date. If the Company were to buy back the maximum number of shares permitted pursuant to both the existing authority for off-market purchases granted at the 2016 AGM (which will expire at the 2017 AGM) and the authority sought by this special resolution, then the total number of options to subscribe for shares outstanding at 22 March 2017 would represent 3.8% of the reduced issued share capital.
Go
vernanceFinancial Statem
ents
153n e x t p l c . c o . u k
Sharehold
er Inform
ation
Strategic R
epo
rt

slugline
Appendix 2: Statement of Circumstances
NoticAppeStatem
MeetiAttendTo be entUncertificshareholdeadjournedadjourned
ce of Mendix 2: ment of
ing formding the Atitled to attend cated Securitiesers must be reg
d, shareholders d meeting.
Meeting
Circum
malities aAnnual G
and vote at the Regulations 20
gistered in the rmust be entere
stances
and votinGeneral M
e AGM (and in001) and for theregister of memed on the Com
ng Meeting
n accordance we purposes of d
mbers of the Commpany’s register
ANNUAL
with the Articledetermining the mpany as at 6pr of members a
REPORT AND A
es and pursuantnumber of vote
pm on 16 May 2at 6pm on the
ACCOUNTS JANU
t to Regulationes shareholders2017 or, if the day two days
UARY 2017
n 41 of the s may cast, meeting is before the
Meeting formalities and voting Attending the Annual General Meeting To be entitled to attend and vote at the AGM (and in accordance with the Articles and pursuant to Regulation 41 of the Uncertificated Securities Regulations 2001) and for the purposes of determining the number of votes shareholders may cast, shareholders must be registered in the register of members of the Company as at 6.00 pm on 16 May 2017 or, if the meeting is adjourned, shareholders must be entered on the Company’s register of members at 6.00 pm on the day two days before the adjourned meeting.
Notice of Meeting
154 n e x t p l c . c o . u k

slugline
The total number of the Company’s issued share capital on 22 March 2017, which is the latest practicable date before the publication of this Notice, is 147,056,562 ordinary shares. All of the ordinary shares carry one vote each and there are no shares held in treasury. On a vote by a show of hands every member who is present has one vote and every proxy present who has been duly appointed by a member entitled to vote has one vote. On a poll vote every member who is present in person or by proxy has one vote for every ordinary share they hold.
In line with best practice, all resolutions will be put to poll votes. The directors believe a poll is more representative of shareholders’ voting intentions because shareholders’ votes are counted according to the number of shares held and all votes tendered are taken into account. The procedures for the poll votes will be explained at the AGM.
In respect of resolution 21 on off-market share purchase contracts, the 2006 Act provides that this resolution will not be effective if any member of the Company holding shares to which it relates (i.e. those which may be purchased pursuant to the Programme Agreements) exercised the voting rights carried by any of those shares in voting on the resolution and the resolution would not have been passed if they had not done so. Therefore, NEXT intends to disregard any poll votes which are cast in favour of resolution 21 attaching to 3 million shares (being the total maximum number of shares which the Company is permitted to purchase pursuant to the Programme Agreements) from both the total number of votes cast in favour of this resolution and the total number of votes cast.
The results of the AGM will be posted on the Company’s website (www.nextplc.co.uk) after the meeting and notified to the UK Listing Authority.
Voting and proxiesWhether or not you intend to attend the AGM in person, you are requested to complete and return the form of proxy to Equiniti, to arrive as soon as possible but in any event not later than 9.30 am on 16 May 2017 (or 48 hours before any adjourned meeting). The completion and return of the form of proxy will not prevent you from attending and voting at the AGM if you so wish.
A shareholder who is entitled to attend and vote at the AGM may appoint one or more proxies to attend, speak and vote instead of him/her, provided that each proxy is appointed to exercise the rights attached to a different share or shares held by that shareholder. A proxy need not also be a shareholder of the Company and may vote on any other business which may properly come before the meeting.
The statements of the rights of members in relation to the appointment of proxies in the above paragraph and in the paragraphs headed “Electronic Voting” and “CREST voting facility” below do not apply to a Nominated Person. The
rights described in these paragraphs can only be exercised by registered members of the Company. Nominated persons are reminded that they should contact the registered holder of their shares (and not the Company) on matters relating to their investments in the Company.
In the case of joint holders, where more than one of the joint holders purports to appoint a proxy, only the appointment submitted by the most senior holder will be accepted, the senior holder being the first named of the joint holders to appear in the Company’s share register.
A member who appoints as their proxy someone other than the Chairman, is responsible for ensuring that the proxy attends the meeting and is aware of the voting intention of the member. If no voting instruction is given, the proxy has discretion on whether and how to vote.
A person to whom this Notice is sent who is a person nominated under section 146 of the 2006 Act to enjoy information rights (a “Nominated Person”) may, under an agreement between them and the shareholder by whom they were nominated, have a right to be appointed (or to have someone else appointed) as a proxy for the AGM. If a Nominated Person has no such proxy appointment right or does not wish to exercise it, they may, under any such agreement, have a right to give instructions to the shareholder as to the exercise of voting rights.
If a member submits more than one valid proxy appointment, the appointment received last before the latest time for the receipt of proxies will take precedence.
Electronic votingAs an alternative to completing and returning a form of proxy, you may submit your proxy electronically by accessing our registrar’s website www.sharevote.co.uk. You will require your unique Voting ID, Task ID and Shareholder Reference Number as printed on the proxy card. The use by members of the electronic proxy appointment service will be governed by the terms and conditions of use which appear on the website. Electronic proxies must be completed and lodged in accordance with the instructions on the website by no later than 9.30 am on 16 May 2017.
CREST voting facilityThose shareholders who hold shares through CREST may choose to appoint a proxy or proxies using CREST for the AGM to be held on 18 May 2017 and any adjournment(s) thereof by using the procedures described in the CREST Manual. CREST personal members or other CREST sponsored members, and those CREST members who have appointed a voting service provider(s), should refer to their CREST sponsor or voting service provider(s), who will be able to take the appropriate action on their behalf.
Go
vernanceFinancial Statem
ents
155n e x t p l c . c o . u k
Sharehold
er Inform
ation
Strategic R
epo
rt

slugline
In order for a proxy appointment or instruction made using the CREST service to be valid, the appropriate CREST message (a “CREST Proxy Instruction”) must be properly authenticated in accordance with Euroclear UK & Ireland Limited’s specifications and must contain the information required for such instructions, as described in the CREST Manual. The message, regardless of whether it constitutes the appointment of a proxy or is an amendment to the instruction given to a previously appointed proxy must, in order to be valid, be transmitted so as to be received by the issuer’s agent (ID RA19) by the latest time(s) for receipt of proxy appointments specified in the notice of meeting. For this purpose, the time of receipt will be taken to be the time (as determined by the timestamp applied to the message by the CREST Applications Host) from which the issuer’s agent is able to retrieve the message by enquiry to CREST in the manner prescribed by CREST. After this time any change of instructions to proxies appointed through CREST should be communicated to the appointee through other means.
CREST members and, where applicable, their CREST sponsors or voting service providers should note that Euroclear UK & Ireland Limited does not make available special procedures in CREST for any particular messages. Normal system timings and limitations will therefore apply in relation to the input of CREST Proxy Instructions. It is the responsibility of the CREST member concerned to take (or, if the CREST member is a CREST personal member or sponsored member or has appointed a voting service provider(s), to procure that his CREST sponsor or voting service provider(s) take(s)) such action as shall be necessary to ensure that a message is transmitted by means of the CREST system by any particular time. In this connection, CREST members and, where applicable, their CREST sponsors or voting service provider(s) are referred, in particular, to those sections of the CREST Manual concerning practical limitations of the CREST system and timings. The CREST Manual is available at www.euroclear.com.
The Company may treat as invalid a CREST Proxy Instruction in the circumstances set out in Regulation 35(5)(a) of the Uncertificated Securities Regulations 2001.
Corporate representativesAny corporation which is a member can appoint one or more corporate representatives who may exercise on its behalf all of its powers as a member provided that they do not do so in relation to the same shares.
Right to ask questionsAny shareholder attending the meeting has the right to ask questions. The Company must answer any such question relating to the business being dealt with at the AGM but no such answer need be given if (i) to do so would interfere unduly with the preparation for the meeting or involve the disclosure of confidential information, (ii) the answer has
already been given on a website in the form of an answer to a question, or (iii) it is undesirable in the interests of the Company or the good order of the AGM that the question be answered.
Documents available for inspectionCopies of the following documents will be available for inspection at the Company’s registered office during usual business hours and will be available for 15 minutes prior to and for the duration of the AGM. Copies will also be available for inspection at the offices of Slaughter and May at One Bunhill Row, London, EC1Y 8YY during usual business hours until the close of the AGM:
• Terms of appointment of the non-executive directors
• Rules of the NEXT Long Term Incentive Plan, pursuant to resolution 16
• The Programme Agreements pursuant to resolution 21
• Articles that reflect the change proposed in resolution 22
Company websiteA full copy of the Annual Report (which includes this Notice), together with those for prior years, and other information required by section 311A of the 2006 Act can be found on the NEXT plc website at www.nextplc.co.uk.
Under section 527 of the 2006 Act members meeting the threshold requirements set out in that section have the right to require the Company to publish on a website a statement setting out any matter relating to: (i) the audit of the Company’s accounts (including the auditor’s report and the conduct of the audit) that are to be laid before the AGM; or (ii) any circumstance connected with an auditor of the Company ceasing to hold office since the previous meeting at which annual accounts and reports were laid in accordance with section 437 of the 2006 Act. The Company may not require the members requesting such website publication to pay its expenses in complying with sections 527 or 528 of the 2006 Act, and it must forward the statement to the Company’s auditor not later than the time when it makes the statement available on the website. The business which may be dealt with at the AGM includes any statement that the Company has been required under section 527 of the 2006 Act to publish on its website.
You may not use any electronic address provided in this Notice of Meeting to communicate with the Company for any purposes other than those expressly stated.
Notice of Meeting
156 n e x t p l c . c o . u k

slugline
Other Shareholder Information
Registered officeDesford Road, Enderby, Leicester, LE19 4AT
Registered in England and Wales, no. 4412362
Payment of dividendThe recommended final dividend, if approved, will be paid on 1 August 2017 to holders of ordinary shares registered at close of business on 7 July 2017. The ordinary shares will trade ex-dividend from 6 July 2017.
Annual General MeetingThe AGM will be held at 9.30 am on Thursday 18 May 2017 at the Leicester Marriott Hotel, Smith Way, Grove Park, Leicester, LE19 1SW. The Notice of Meeting on pages 149 to 156 sets out business to be transacted. Full access is available to the venue for those with special requirements.
Share price data(Stock Exchange Code: NXT.L)
2017 2016 Share price at financial year end £38.50 £69.25Market capitalisation £5,662m £10,434mShare price movement during year:High mid-market quotation £70.20 £80.15Low mid-market quotation £38.26 £65.25
Discount voucherThe Company offers a discount voucher to any first named, registered shareholder holding a minimum number of 100 ordinary shares as at 1 April each year. The shareholder discount voucher entitles the recipient or their immediate family to a 25% discount against most purchases at any one time of full price NEXT merchandise in NEXT Retail stores. There is no limit on the value of goods that can be purchased at that time. The voucher expires on 31 October of the year in which it was issued. It cannot be used in conjunction with any other discount voucher or offer, nor can it be used for the purchase of gift cards, Sale merchandise, electrical goods, non-NEXT branded goods or purchases from NEXT Directory (unless ordered through one of our Retail stores). Shareholders holding shares in nominee or ISA accounts are also eligible, but must request the voucher through their nominee or ISA account manager who should email [email protected].
Registrars and transfer officeEquiniti, Aspect House, Spencer Road, Lancing, West Sussex, BN99 6DA
Telephone +44 (0) 371 384 2164. Calls to this number are charged at 8p per minute plus network extras. Overseas Shareholder Helpline Number +44 (0) 121 415 7047. Lines are open 8.30 am to 5.30 pm Monday to Friday.
Shareholder enquiriesThe Company’s share register is maintained by Equiniti. Please contact them online at www.shareview.co.uk or using the contact details above if you have any enquiries about your NEXT shareholding including the following matters:
• change of name and address;
• loss of share certificate, dividend warrant or dividend confirmation;
• if you receive duplicate sets of Company mailings as a result of an inconsistency in name or address and wish, if appropriate, to combine accounts.
The Shareview Portfolio service from Equiniti gives you more online information about your NEXT shares and other investments. For direct access to information held for you on the share register, including recent balance movements and a daily valuation of investments held in your portfolio, visit www.shareview.co.uk.
For shareholders with disabilities Equiniti provides the following:
• if requested future communications produced by them will be sent in the appropriate format;
• textphone number +44 (0) 371 384 2255 for shareholders with hearing difficulties;
• hearing loop facilities in their buildings for use by visiting shareholders.
CRESTThe Company’s ordinary shares are available for electronic settlement.
Payments of dividends to mandated accountsShareholders who do not at present have their dividends paid directly into a bank or building society may wish to do so. A mandate form is attached to your dividend warrant and tax voucher or is available to download from the NEXT website on www.nextplc.co.uk or from Equiniti, telephone +44 (0) 371 384 2164.
Go
vernanceFinancial Statem
ents
157n e x t p l c . c o . u k
Sharehold
er Inform
ation
Strategic R
epo
rt

slugline
Forward looking statementsThis Report and Accounts contains “forward looking statements” which are all matters that are not historical facts, including anticipated financial and operational performance, business prospects and similar matters. These forward looking statements are identifiable by words such as “aim”, “anticipate”, “believe”, “budget”, “estimate”, “expect”, “forecast”, “intend”, “plan”, “project” and similar expressions. These forward looking statements reflect NEXT’s current expectations concerning future events and actual results may differ materially from current expectations or historical results. Any such forward looking statements are subject to risks and uncertainties, including but not limited to those risks described in “Risks & Uncertainties” on pages 30 to 34; failure by NEXT to predict accurately customer fashion preferences; decline in the demand for merchandise offered by NEXT; competitive influences; changes in level of store traffic or consumer spending habits; effectiveness of NEXT’s brand awareness and marketing programmes; general economic conditions or a downturn in the retail industry; the inability of NEXT to successfully implement relocation or expansion of existing stores; insufficient consumer interest in NEXT Directory; acts of war or terrorism worldwide; work stoppages, slowdowns or strikes; and changes in financial or equity markets. These forward looking statements do not amount to any representation that they will be achieved as they involve risks and uncertainties and relate to events and depend upon circumstances which may or may not occur in the future and there can be no guarantee of future performance. Undue reliance should not be placed on forward looking statements which speak only as of the date of this document. NEXT does not undertake any obligation to update publicly or revise forward looking statements, whether as a result of new information, future events or otherwise, except to the extent legally required.
The paper used in this Report and Accounts is carbon neutral certified. All associated emissions have been independently audited and offset to net zero.
This Annual Report is printed on Revive 100% Recycled Silk. The paper is made from 100% post consumer waste and is fully recyclable and biodegradable. The mill of manufacture is certified to the ISO 9001 Quality Standard and the ISO 14001 Environmental Standard.
www.jonesandpalmer.co.uk
158 n e x t p l c . c o . u k

slugline slugline

slugline slugline
nextplc.co.uk|