January 31, 2018s21.q4cdn.com/515635695/files/doc_financials/quarterly/...Highlights 4 • Continue...
33
Fourth-Quarter 2017 Results January 31, 2018
Transcript of January 31, 2018s21.q4cdn.com/515635695/files/doc_financials/quarterly/...Highlights 4 • Continue...

Fourth-Quarter 2017 ResultsJanuary 31, 2018

Safe Harbor
This presentation includes “forward-looking statements” which are statements that are not historical facts, including statements that relate to the mix of and demand for our products; performance of the markets in which we operate; our share repurchase program including the amount of shares to be repurchased and timing of such repurchases; our capital allocation strategy including projected acquisitions; our projected 2018 full-year financial performance and targets including assumptions regarding our effective tax rate and other factors described in our guidance. These forward-looking statements are based on our current expectations and are subject to risks and uncertainties, which may cause actual results to differ materially from our current expectations. Such factors include, but are not limited to, global economic conditions, the outcome of any litigation, demand for our products and services, and tax law changes and interpretations. Additional factors that could cause such differences can be found in our Form 10-K for the year ended December 31, 2016, as well as our subsequent reports on Form 10-Q and other SEC filings. We assume no obligation to update these forward-looking statements.
This presentation also includes non-GAAP financial information which should be considered supplemental to, not a substitute for, or superior to, the financial measure calculated in accordance with GAAP. The definitions of our non-GAAP financial information are included as an appendix in our presentation and reconciliations can be found in our earnings releases for the relevant periods located on our website at www.ingersollrand.com. All data beyond the fourth quarter of 2017 are estimates.
2

Executing a Consistent Strategy that Delivers Profitable Growth
3
Differentiated products and services deliver top-tier revenue growth
Sustained Growth
1.
Margin improvement and powerful cash flow
Operational Excellence
2.
Reinvestment, dividends, share repurchase and acquisitions
Dynamic Capital Allocation
3.
Commitment to integrity, ingenuity and engagement
Winning Culture
4.
Strong, globally recognized brands
Well positioned in both geographic and end markets
Leadingmarket shares
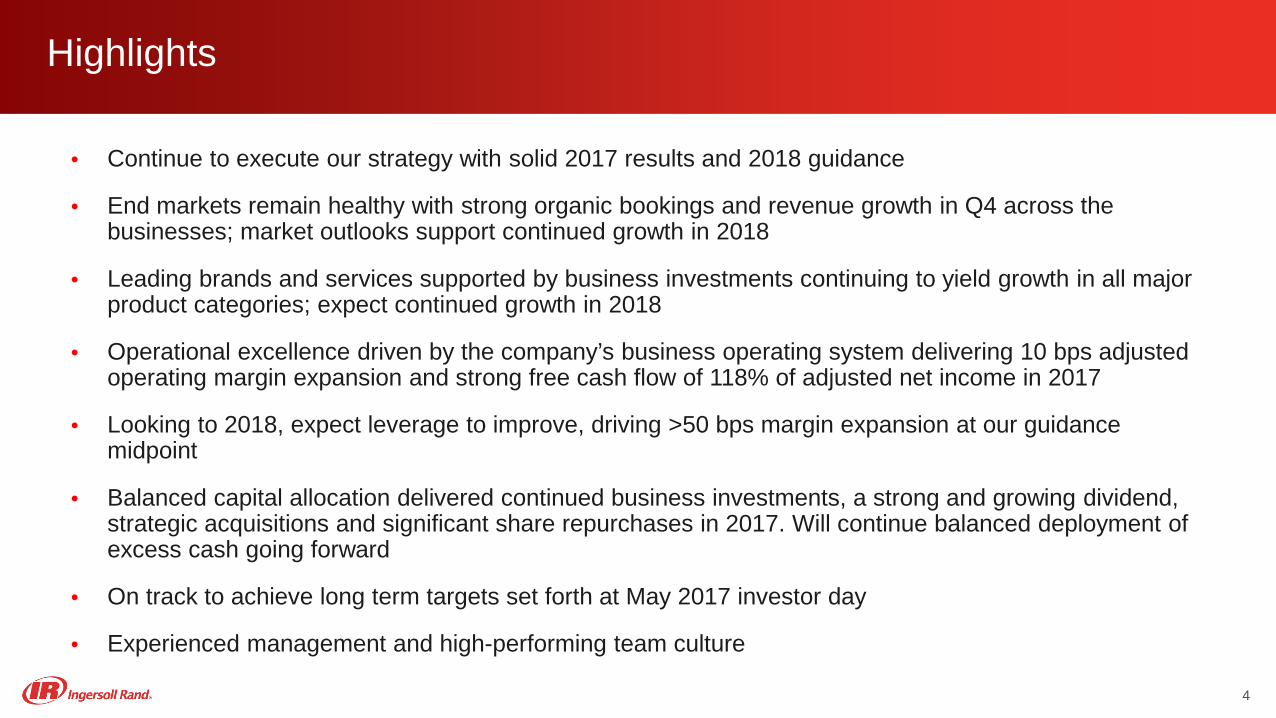
Highlights
4
• Continue to execute our strategy with solid 2017 results and 2018 guidance
• End markets remain healthy with strong organic bookings and revenue growth in Q4 across the businesses; market outlooks support continued growth in 2018
• Leading brands and services supported by business investments continuing to yield growth in all major product categories; expect continued growth in 2018
• Operational excellence driven by the company’s business operating system delivering 10 bps adjusted operating margin expansion and strong free cash flow of 118% of adjusted net income in 2017
• Looking to 2018, expect leverage to improve, driving >50 bps margin expansion at our guidance midpoint
• Balanced capital allocation delivered continued business investments, a strong and growing dividend, strategic acquisitions and significant share repurchases in 2017. Will continue balanced deployment of excess cash going forward
• On track to achieve long term targets set forth at May 2017 investor day
• Experienced management and high-performing team culture

Net Revenue
Adj. Operating Margin*
Adj. Continuing EPS*
Free Cash Flow*
Versus 2016 +5% reported
+5% organic
+10 bps
* Includes certain Non-GAAP financial measures. See the company’s Q4 2017 earnings release for additional details and reconciliations.
+9%
-2%
Full Year 2017
$14,198M
12.2%
$4.51
$1.3B>100% adj. net income
Consistent Progress Against Key Metrics*
2017 Guidance~2% reported
~3% organic
12.2% to 12.6%
$4.30 to $4.50
$1.1B to $1.2B>100% adj. net income
5
• FCF was 118% of adjusted net income*• Raised dividend above earnings growth rate – up 12.5% in 2017• Spent / committed ~$460M to strategic acquisitions • Repurchased ~11.8M shares for $1B in 2017
Capital Allocation ~$1.9B~$1.9B +$1.3B

• Solid operating results– Adjusted continuing EPS of $1.02, up 21% year over year– Strong full year free cash flow of $1.3 billion (118% of adjusted net income)
• Broad based strength in organic bookings and revenue – Industrial bookings up 12% with low-teens growth in Compressor, Club Car and Industrial Products– Climate bookings up 7% with particular strength in Commercial and Residential HVAC
Key Takeaways Q4 2017
• Industrial business continues to strengthen ahead of expectations– Adjusted operating margins up 160 bps with 5% organic revenue growth– Organic revenue growth in compressor aftermarket, service and installation up high-single digits
• Balanced capital allocation– Annualized dividend payout of $1.80 / share; ~2% dividend yield. Increased dividend 12.5% in 2017– Repurchased $1B or 11.8M shares in 2017 ($106M in Q4)– ~$460M spent or committed over the last 12 months to strategic acquisitions – mainly channel and technology
6* Includes certain Non-GAAP financial measures. See the company’s Q4 2017 earnings release for additional details and reconciliations.

Q4 2017 Strong Operational Performance Overcoming Headwinds
Adj. Operating Margin*Net Revenue
10.9%11.1%
Q4 '16 Q4 '17
$3,359$3,618
Q4 '16 Q4 '17
$0.84
$1.02
Q4 '16 Q4 '17
+8%
+6%Organic
+20 bps
Adjusted EPS*+21%
• Gains in volume, price and productivity offset by headwinds from material inflation• Industrial business operating performance continues to improve
Highlights
7* Includes certain Non-GAAP financial measures. See the company’s Q4 2017 earnings release for additional details and reconciliations.

8
Q4 2017 Strong Organic Bookings Growth in Industrial and North America, Europe and China HVAC
Y-O-Y%
ChangeReported Organic*
Q1 2016 1% 4%
Q2 2% 3%
Q4 2% 3%
Q4 6% 7%
Q1 2017 6% 7%
Q2 3% 4%
Q3 6% 5%
Q4 10% 8%
Climate CCommercial HVAC + high-single digits
- N. America + low teens
- L. America - low-single digits
- EMEA + high-single digits
- Asia + low-single digits
Residential HVAC + low teens
Transport - low-single digits
Total + 7%
IndustrialCompression Tech + low teens
Industrial Products + low teens
Small Elec. Vehicle + low teens
Total + 12%
Y-O-Y Change in Organic* Bookings
*Organic bookings excludes acquisitions and currency
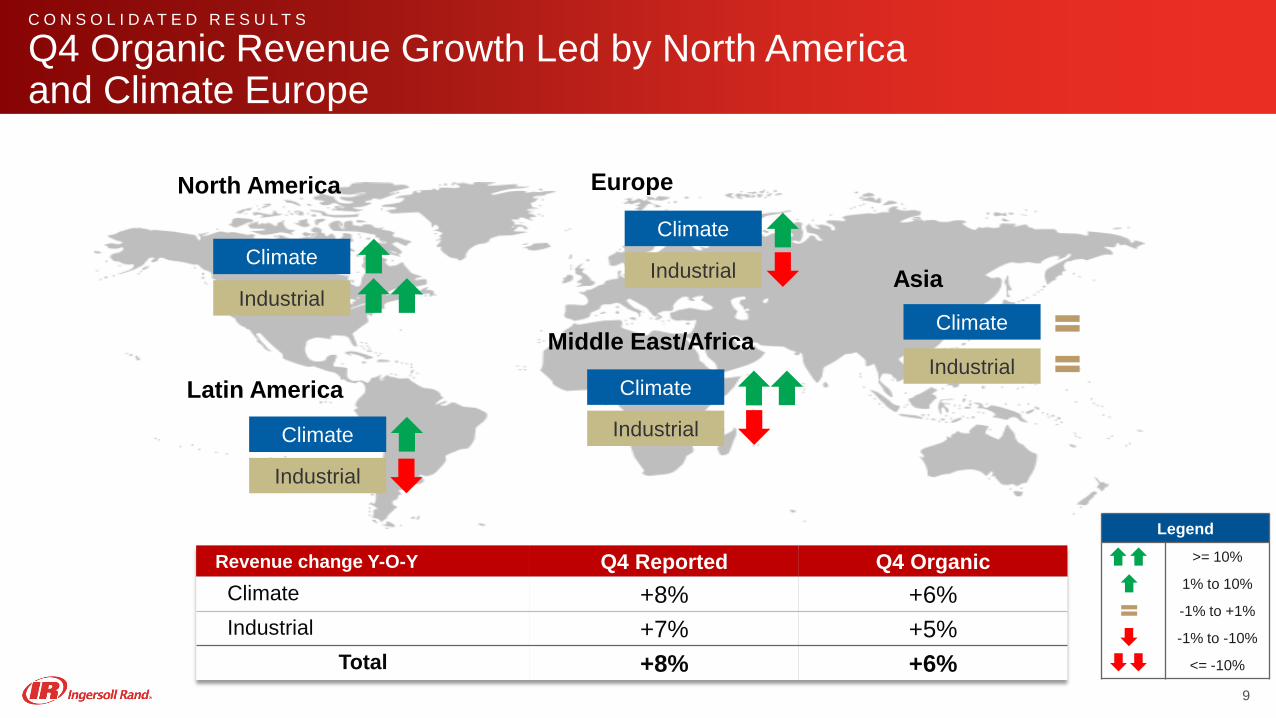
North America Europe
Asia
Latin America
Revenue change Y-O-Y Q4 Reported Q4 OrganicClimate +8% +6%Industrial +7% +5%
Total +8% +6%
Climate
Industrial
Middle East/Africa
C O N S O L I D A T E D R E S U L T S
Q4 Organic Revenue Growth Led by North America and Climate Europe
Climate
Industrial
Climate
IndustrialClimate
Industrial
Climate
Industrial
9
Legend>= 10%
1% to 10%
-1% to +1%
-1% to -10%
<= -10%
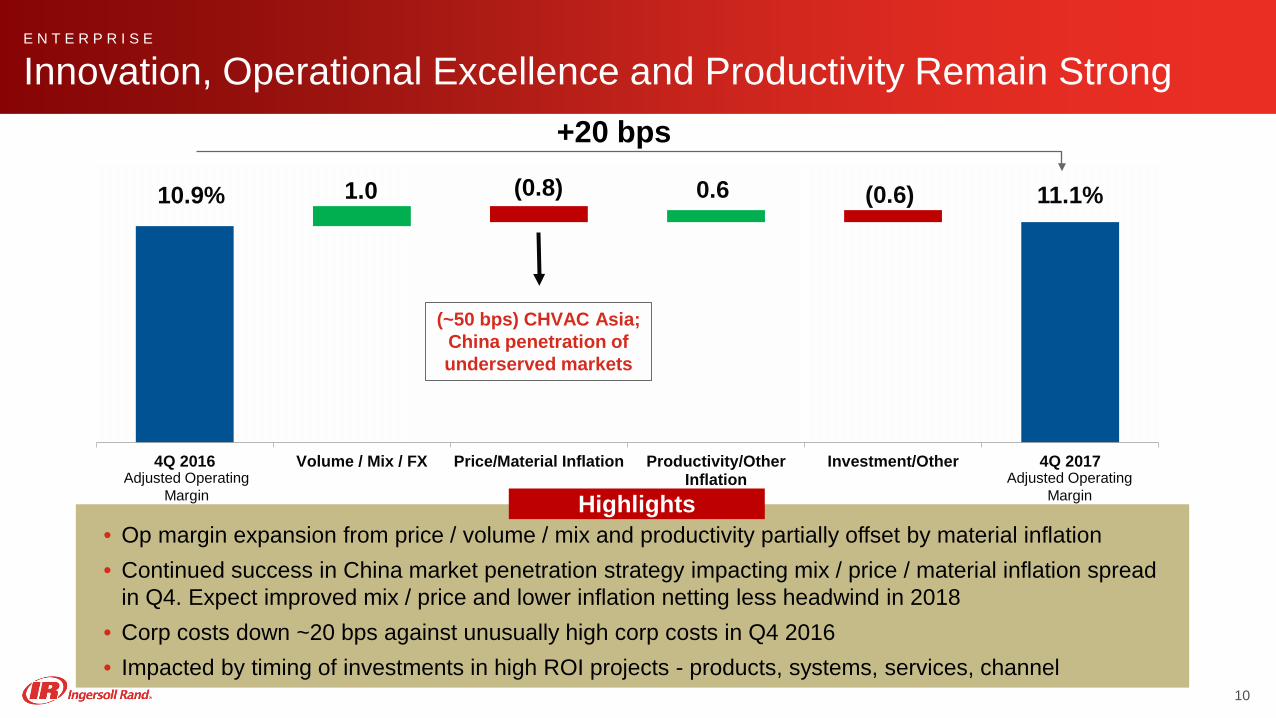
10.9% 0.6 (0.6) 11.1%
4Q 2016 Volume / Mix / FX Price/Material Inflation Productivity/OtherInflation
Investment/Other 4Q 2017
1.0 (0.8)
+20 bps
(~50 bps) CHVAC Asia; China penetration of underserved markets
E N T E R P R I S E
Innovation, Operational Excellence and Productivity Remain Strong
• Op margin expansion from price / volume / mix and productivity partially offset by material inflation• Continued success in China market penetration strategy impacting mix / price / material inflation spread
in Q4. Expect improved mix / price and lower inflation netting less headwind in 2018• Corp costs down ~20 bps against unusually high corp costs in Q4 2016 • Impacted by timing of investments in high ROI projects - products, systems, services, channel
HighlightsAdjusted Operating
MarginAdjusted Operating
Margin
10

C L I M A T E S E G M E N T
Q4 Broad-Based Revenue Growth; Material Inflation Headwinds
Adj. Operating Margin*Net Revenue
13.7% 12.9%
Q4 '16 Q4 '17
$2,559$2,760
Q4 '16 Q4 '17
15.9% 15.2%
Q4 '16 Q4 '17
+8%
+6%Organic
-80 bps
Adj. OI + D&A %**-70 bps
* Adjusted operating margin excludes restructuring in 2016 and 2017. See tables in news release for additional information.** Adjusted OI + D&A divided by revenue. This excludes restructuring in 2016 and 2017. See tables in news release for additional information.
• Broad-based revenue growth across all businesses• Lower margins the result of material inflation headwinds
Highlights
11

I N D U S T R I A L S E G M E N T
Q4 Solid Margin Expansion and Revenue Growth
11.6%13.2%
Q4 '16 Q4 '17
Adj. Operating Margin*
$800$858
Q4 '16 Q4 '17
Net Revenue
13.7%15.6%
Q4 '16 Q4 '17
+7%
+5%Organic
+160 bps
Adj. OI + D&A %**
+190 bps
• Strong revenue growth in service and install, Industrial Products and Small Electric Vehicles• Solid margin expansion driven by ongoing improvement in business operating performance
* Adjusted operating margin excludes restructuring in 2016 and 2017. See tables in news release for additional information. ** Adjusted OI + D&A divided by revenue. This excludes restructuring in 2016 and 2017. See tables in news release for additional information.
12
Highlights

2014 2015 2016 2017
1,367
810985
Strong Balance Sheet and Free Cash Flow
Free Cash Flow*$ Millions
$1,340
$Mil YE 15 Q1 16 Q2 16 Q3 16 YE 16 Q1 17 Q2 17 Q3 17 YE 17
Cash 737 613 929 1,505 1,715 1,322 1,310 1,259 1,549
Debt 4,218 4,473 4,086 4,070 4,070 4,072 4,066 4,063 4,064
Net Debt 3,481 3,860 3,157 2,565 2,355 2,750 2,756 2,804 2,515
• 2017 free cash flow of $1.34 billion (118% of adjusted net income) indicative of high quality of earnings• Maintained strong balance sheet providing optionality as markets continue to evolve• Cash flow ROIC of 21.2%; up from 18.2% prior 4-year average
13
Highlights
* Includes certain Non-GAAP financial measures. See the company’s Q4 2017 earnings release for additional details and reconciliations.

Balanced Execution of Dynamic Capital Allocation Plan in 2017
14
Maintain Healthy, Efficient Balance Sheet
Invest for Growth
Return Capital toShareholders
• Strong year-end balance sheet, maintaining optionality as markets evolve, preserving liquidity and managing leverage
• Maintained BBB investment grade rating
• Dividends of $1.80/share annualized; paid $430M in dividends in 2017• Raised dividend 12.5% in 2017; continued growth expected at or above
rate of earnings growth going forward• Repurchased $1B in shares in 2017 or 11.8M shares• Plan to continue balanced deployment of excess cash in the future
• Strengthen the core business and extend product and market leadership• Invest in new technology and innovation• Strategic acquisitions of ~$460M spent / committed to date including Jan
2018 announcements
2
1
3

Impact of The U.S. Tax Cuts and Jobs Act
15
• U.S. Tax Legislation− ~$221M primarily non-cash net benefits related to U.S. tax legislation− Benefits from deferred tax liabilities revaluations and other items more than
offset the “repatriation” tax• Revaluation of deferred tax liabilities from 35% tax rate to 21%
− Tax rate for 2018 and beyond largely unchanged and “in the low 20’s”• Rate for 2018 expected to be 21% to 22%
− Historically, maintained efficient tax structure as an Irish plc; overall tax rate outlook has not changed materially under the new tax law
− Additionally, recorded ~$20M of discrete tax benefits during the quarter unrelated to tax reform

Guidance
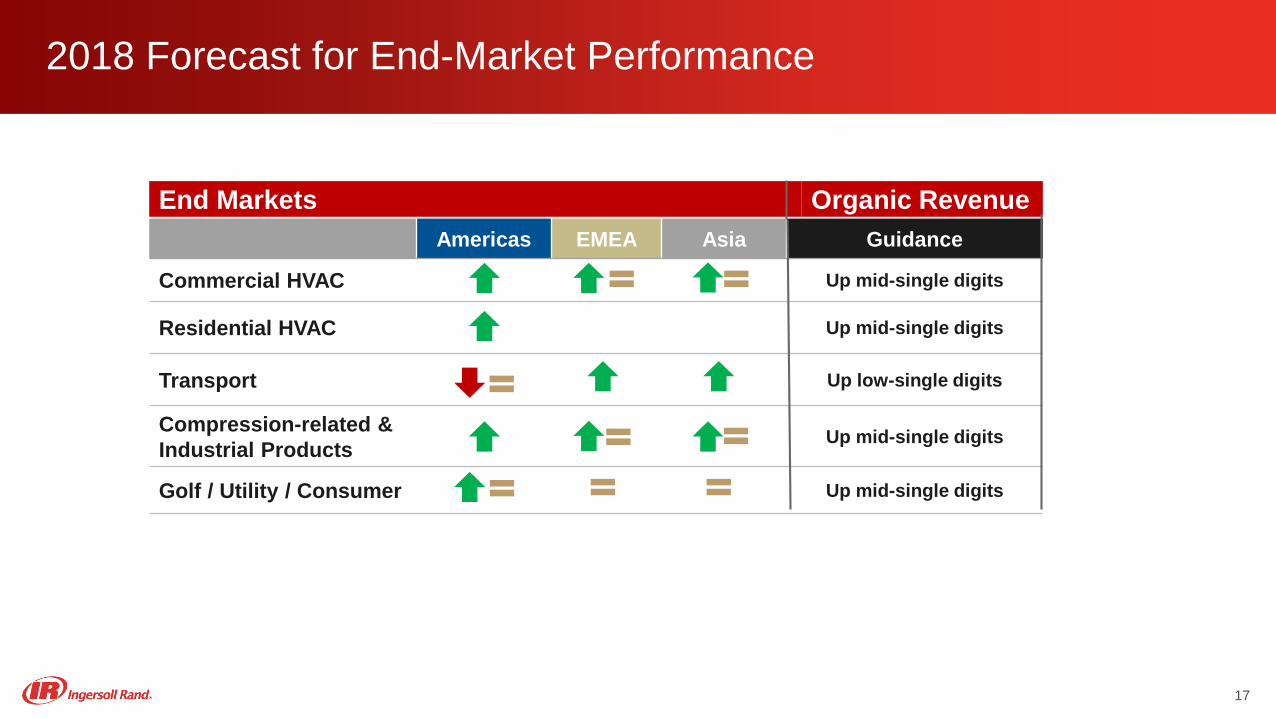
End MarketsAmericas EMEA Asia Guidance
Commercial HVAC Up mid-single digits
Residential HVAC Up mid-single digits
Transport Up low-single digits
Compression-related & Industrial Products Up mid-single digits
Golf / Utility / Consumer Up mid-single digits
Organic Revenue
2018 Forecast for End-Market Performance
17

FY GuidanceClimate‒ Revenue Reported‒ Revenue Organic
5.0% to 5.5% 3.0% to 3.5%
Adjusted Operating Margin 14.6% to 15.1%
Industrial‒ Revenue Reported‒ Revenue Organic
5.5% to 6.0%3.5% to 4.0%
Adjusted Operating Margin 12.5% to 13.0%
Total‒ Revenue Reported‒ Revenue Organic*
5.0% to 5.5% 3.0% to 3.5%
Adjusted Operating Margin 12.5% to 13.0%
2018 Enterprise Guidance
18* Adjusted for ~1% from FX and ~1% from acquisitions

Full YearY-O-Y change in revenue
• Reported • Organic
5.0% to 5.5%3.0% to 3.5%
EPS continuing $4.80 to $5.00Restructuring – (add back) ($0.20)EPS continuing – adjusted $5.00 to $5.20EPS – discontinued ($0.14)Share Count – Millions ~250*Free Cash Flow $1.2B to $1.3B
Tax Rate 21% to 22%
Corporate Costs ~$250M
CAPEX ~$300M
2018 Guidance: Full-year Continuing Adjusted EPS $5.00 to $5.20
19* ~250M FY 2018 share count assumes $500M in share repurchases for modeling purposes

Topics of Interest

Topics of Interest
21
• China Direct Sales Market Penetration Strategy − Execution of strategy ahead of plan− Full year 2017 China HVAC organic bookings growing high-teens and
organic revenues growing low-teens− Long-term market investments transforming go-to-market strategy in
underserved China markets− Infrastructure investments largely complete, e.g., sales network (majority
included in run rate for 2018)− Lower margin backlog expected to sell through primarily in first half of 2018− Focus on service growth in 2018− Expected to be accretive to EPS in 2018
Topics of Interest (Continued)
22
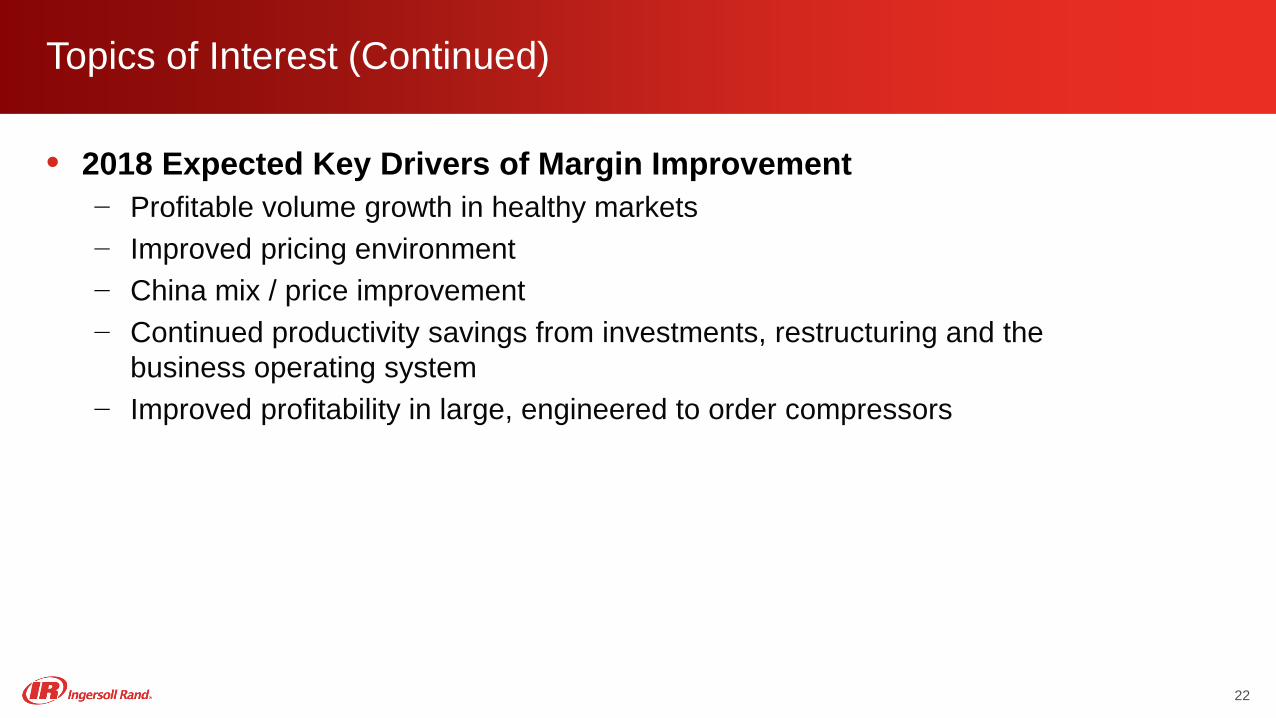
• 2018 Expected Key Drivers of Margin Improvement− Profitable volume growth in healthy markets− Improved pricing environment− China mix / price improvement− Continued productivity savings from investments, restructuring and the
business operating system− Improved profitability in large, engineered to order compressors
Topics of Interest (Continued)
23
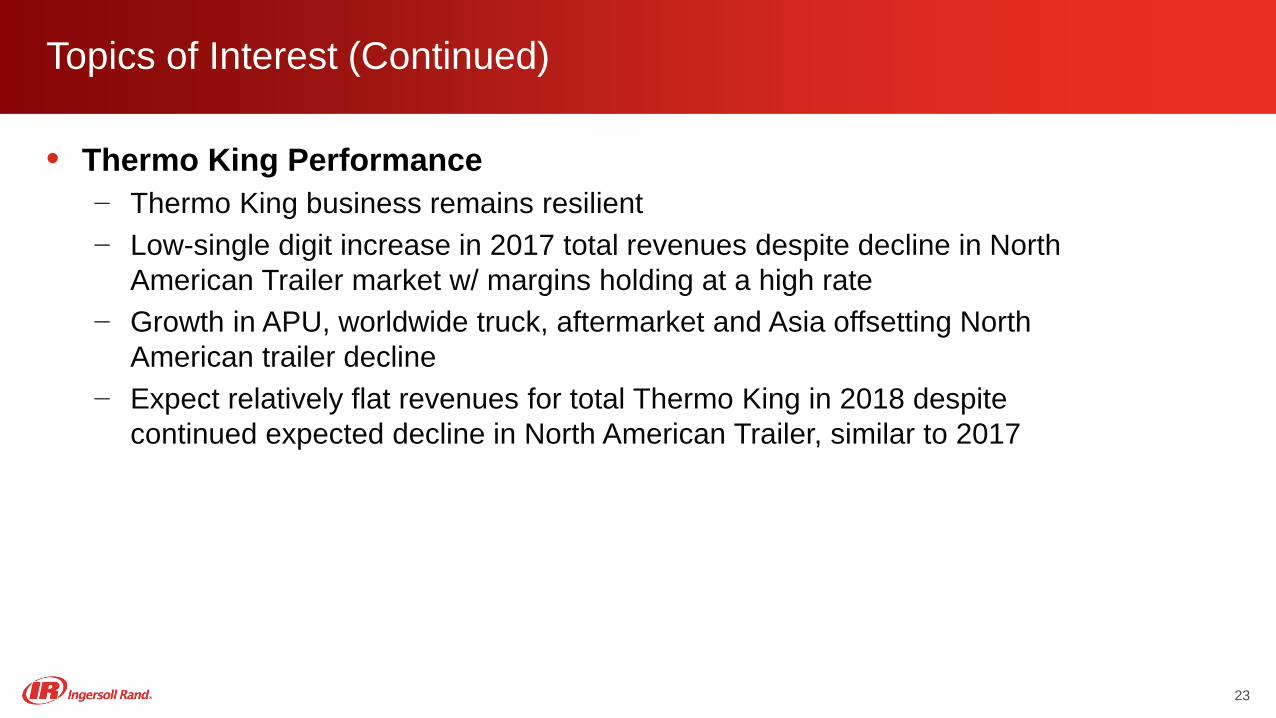
• Thermo King Performance− Thermo King business remains resilient − Low-single digit increase in 2017 total revenues despite decline in North
American Trailer market w/ margins holding at a high rate− Growth in APU, worldwide truck, aftermarket and Asia offsetting North
American trailer decline− Expect relatively flat revenues for total Thermo King in 2018 despite
continued expected decline in North American Trailer, similar to 2017

Topics of Interest (Continued)
24
• Acquisitions− Approximately $460M spent or committed to date including January 2018
announcements − Mitsubishi Electric Joint Venture (pending regulatory approval)
• Marketing, sales, support and distribution of ductless and variable refrigerant flow (VRF) HVAC systems in the U.S. and parts of Latin America
• Provides Ingersoll Rand distribution and service channels with high-quality equipment consistent with our brand promise
− ICS Cool Energy Acquisition• Specializes in temporary rental of energy efficient chillers in key Western European
markets• Expands range of customers serviced by Trane / Ingersoll Rand• Leverages Trane / Ingersoll Rand service footprint

2018 Outlook: Continue to Execute a Consistent Strategy that Delivers Strong Shareholder Returns
25
● Strategy tied to attractive end markets supported by global mega trends
● Franchise brands and businesses with leadership market positions
● Sustained business investments delivering innovation and growth, operating excellence and improving margins
● Experienced management and high performing team culture
● Operating model delivers powerful cash flow
● Capital allocation priorities deliver strong shareholder returns
Strategy
Brands
Innovation
Performance
Cash Flow
Capital Allocation

Appendix

Q4 Organic Revenue Up 6% Year-Over-Year
Reported 2015 2016 2017
Q1 Q2 Q3 Q4 FY Q1 Q2 Q3 Q4 FY Q1 Q2 Q3 Q4 FY
Climate 6% 2% 4% 2% 3% 3% 4% 3% 3% 3% 5% 7% 4% 8% 6%
Industrial 7% (1%) (2%) 5% 2% (7%) (4%) Flat (4%) (4%) (1%) 1% flat 7% 2%
Total 6% 2% 3% 3% 3% Flat 2% 2% 1% 2% 4% 6% 3% 8% 5%
2013Organic* 2015 2016 2017
Q1 Q2 Q3 Q4 FY Q1 Q2 Q3 Q4 FY Q1 Q2 Q3 Q4 FY
Climate 9% 5% 8% 5% 7% 4% 5% 3% 4% 4% 6% 8% 3% 6% 6%
Industrial 4% (4%) (2%) (2%) (1%) (5%) (3%) 1% (3%) (3%) 1% 2% (1%) 5% 2%
Total 8% 3% 6% 3% 5% 2% 3% 3% 2% 3% 4% 7% 2% 6% 5%
*Organic revenues excludes acquisitions and currency27

3%
17%
7%
ReportedOrganic*
*Organic revenues excludes acquisitions and currency
6%
9%
-1%
Q4 Revenue Up 8% and Organic Up 6%
8%
6%
5%
Climate
IndustrialReportedOrganic*
7%
Segment Revenue Change
Geographic Revenue Change
Americas
Europe, Middle East, Africa
Asia
N. America Organic +7%
28

Q4 2017 Year-Over-Year Revenue Change
Reported Organic*
Climate- Commercial HVAC + Mid-single + Mid-single
- Residential HVAC + High-single + High-single
- Transport + Low-teens + High-single
Total Climate + 8% + 6%
Industrial- Compression-related Products + Low-single + Low-single
- Industrial Products + Mid-teens + Low-teens
- Small Electric Vehicle + Low-teens + Low-teens
Total Industrial + 7% + 5%
Total Company + 8% + 6%29*Organic revenues excludes acquisitions and currency
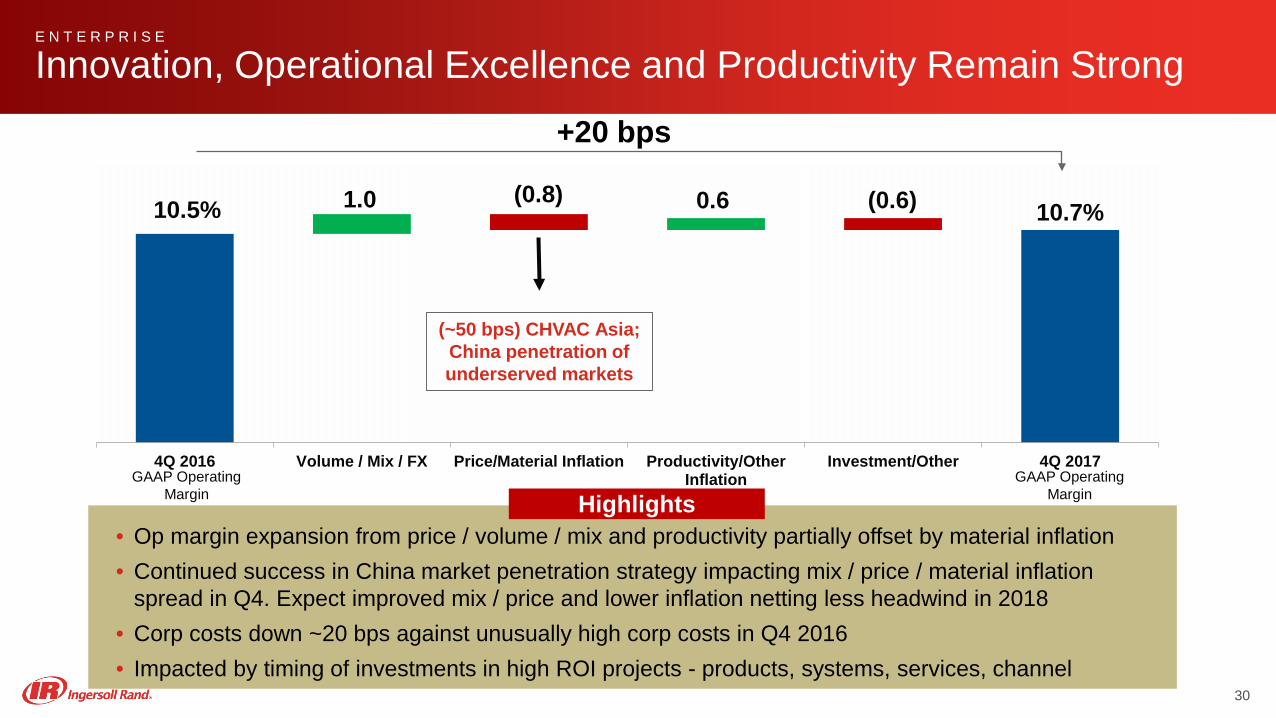
10.5% 0.6 (0.6) 10.7%
4Q 2016 Volume / Mix / FX Price/Material Inflation Productivity/OtherInflation
Investment/Other 4Q 2017
1.0 (0.8)
+20 bps
E N T E R P R I S E
Innovation, Operational Excellence and Productivity Remain Strong
30
• Op margin expansion from price / volume / mix and productivity partially offset by material inflation• Continued success in China market penetration strategy impacting mix / price / material inflation
spread in Q4. Expect improved mix / price and lower inflation netting less headwind in 2018• Corp costs down ~20 bps against unusually high corp costs in Q4 2016 • Impacted by timing of investments in high ROI projects - products, systems, services, channel
HighlightsGAAP Operating
MarginGAAP Operating
Margin
(~50 bps) CHVAC Asia; China penetration of underserved markets
Non-GAAP Measures Definitions
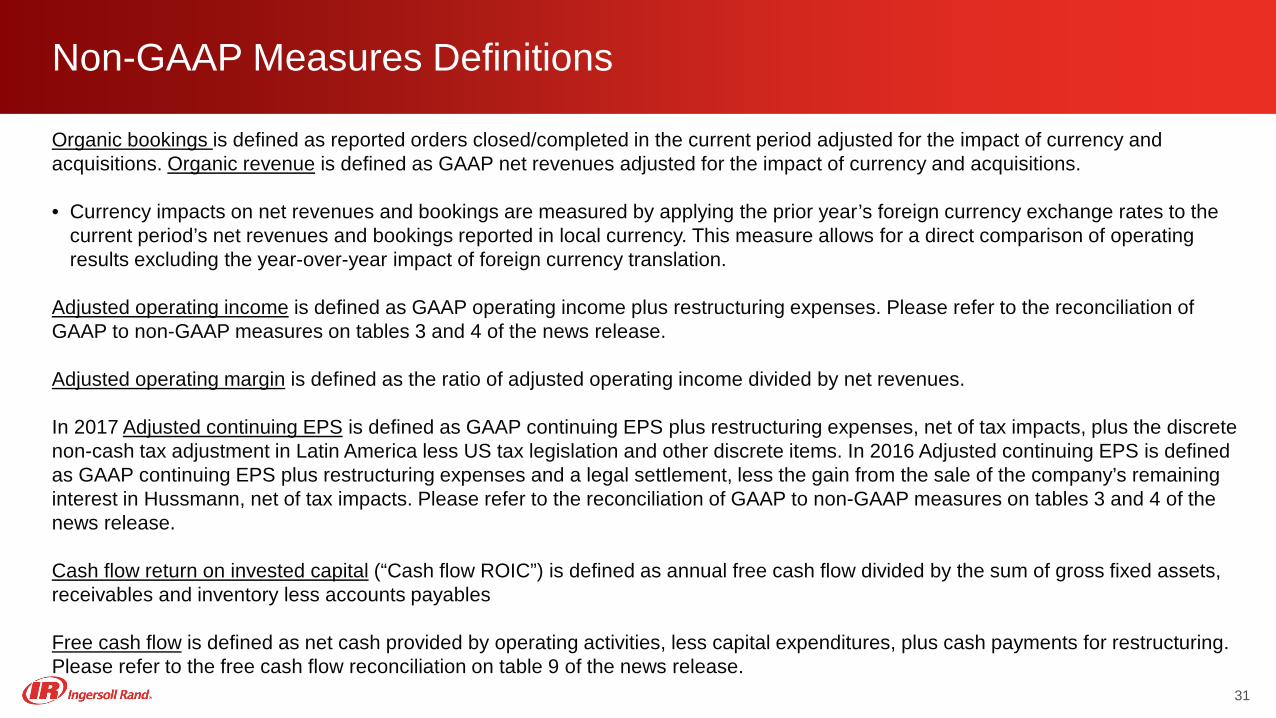
Organic bookings is defined as reported orders closed/completed in the current period adjusted for the impact of currency and acquisitions. Organic revenue is defined as GAAP net revenues adjusted for the impact of currency and acquisitions.
• Currency impacts on net revenues and bookings are measured by applying the prior year’s foreign currency exchange rates to the current period’s net revenues and bookings reported in local currency. This measure allows for a direct comparison of operating results excluding the year-over-year impact of foreign currency translation.
Adjusted operating income is defined as GAAP operating income plus restructuring expenses. Please refer to the reconciliation of GAAP to non-GAAP measures on tables 3 and 4 of the news release.
Adjusted operating margin is defined as the ratio of adjusted operating income divided by net revenues.
In 2017 Adjusted continuing EPS is defined as GAAP continuing EPS plus restructuring expenses, net of tax impacts, plus the discrete non-cash tax adjustment in Latin America less US tax legislation and other discrete items. In 2016 Adjusted continuing EPS is defined as GAAP continuing EPS plus restructuring expenses and a legal settlement, less the gain from the sale of the company’s remaining interest in Hussmann, net of tax impacts. Please refer to the reconciliation of GAAP to non-GAAP measures on tables 3 and 4 of the news release.
Cash flow return on invested capital (“Cash flow ROIC”) is defined as annual free cash flow divided by the sum of gross fixed assets, receivables and inventory less accounts payables
Free cash flow is defined as net cash provided by operating activities, less capital expenditures, plus cash payments for restructuring. Please refer to the free cash flow reconciliation on table 9 of the news release.
31
Non-GAAP Measures Definitions
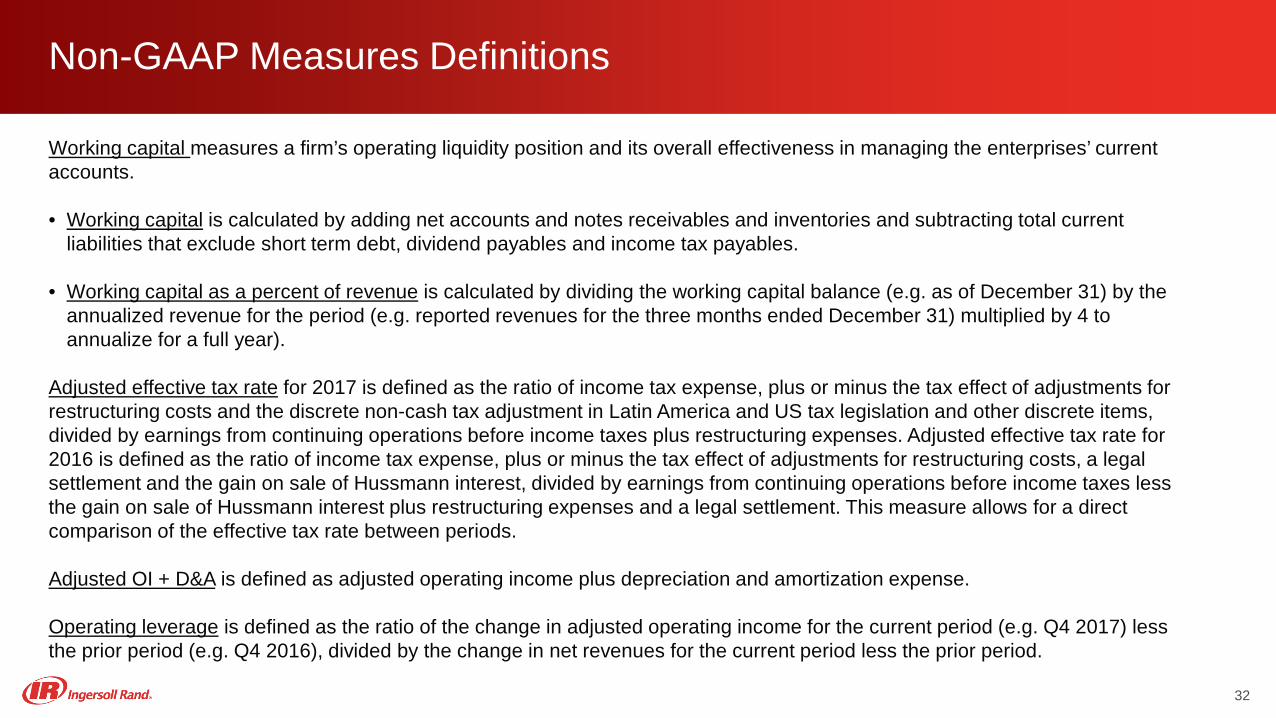
Working capital measures a firm’s operating liquidity position and its overall effectiveness in managing the enterprises’ current accounts.
• Working capital is calculated by adding net accounts and notes receivables and inventories and subtracting total current liabilities that exclude short term debt, dividend payables and income tax payables.
• Working capital as a percent of revenue is calculated by dividing the working capital balance (e.g. as of December 31) by the annualized revenue for the period (e.g. reported revenues for the three months ended December 31) multiplied by 4 to annualize for a full year).
Adjusted effective tax rate for 2017 is defined as the ratio of income tax expense, plus or minus the tax effect of adjustments for restructuring costs and the discrete non-cash tax adjustment in Latin America and US tax legislation and other discrete items, divided by earnings from continuing operations before income taxes plus restructuring expenses. Adjusted effective tax rate for 2016 is defined as the ratio of income tax expense, plus or minus the tax effect of adjustments for restructuring costs, a legalsettlement and the gain on sale of Hussmann interest, divided by earnings from continuing operations before income taxes lessthe gain on sale of Hussmann interest plus restructuring expenses and a legal settlement. This measure allows for a direct comparison of the effective tax rate between periods.
Adjusted OI + D&A is defined as adjusted operating income plus depreciation and amortization expense.
Operating leverage is defined as the ratio of the change in adjusted operating income for the current period (e.g. Q4 2017) less the prior period (e.g. Q4 2016), divided by the change in net revenues for the current period less the prior period.
32

33