Infrastructure Solutions for Commercial Properties and Developers

January 2016

2
think about theENVIRONMENT
3
• Design Capacity : 89.7 mio tons• Production Capacity : 75.5 mio tons• Domestic Growth : 5.5%• Domestic Utilization: 87%•Supply Domestic : 65 mio tons Export : 4.0 mio tons Import : 1.5 mio tons2)
Domestic Capacity (2016)
2016F
New Players (2016)
1. Semen Indonesia 30 mio ton2. Semen Andalas 1.6 mio ton3. Semen Baturaja 2.0 mio ton4. Indocement TP 25.9 mio ton5. Holcim Indonesia 12.1 mio ton6. Semen Bosowa 6.0 mio ton7. Semen Kupang 0.5 mio ton8. Semen Jui Shin 2.0 mio ton9. Semen Puger 0.3 mio ton
10. Semen Merah Putih 4.0 mio ton11. Semen Anhui Conch 1.7 mio ton12. Siam Cement 1.8 mio ton13. Semen Pan Asia 1.8 mio ton
TOTAL 89.7 mio ton
New Players 2016

4
Supply and demand of Cement in the next 5 years
Ton
0
20
40
60
80
100
120
2014 2015 2016 2017 2018 2019
Gap Supply & Demand
Installed Capacity Production Capacity Growth 4% Growth 6% Growth 8%
5
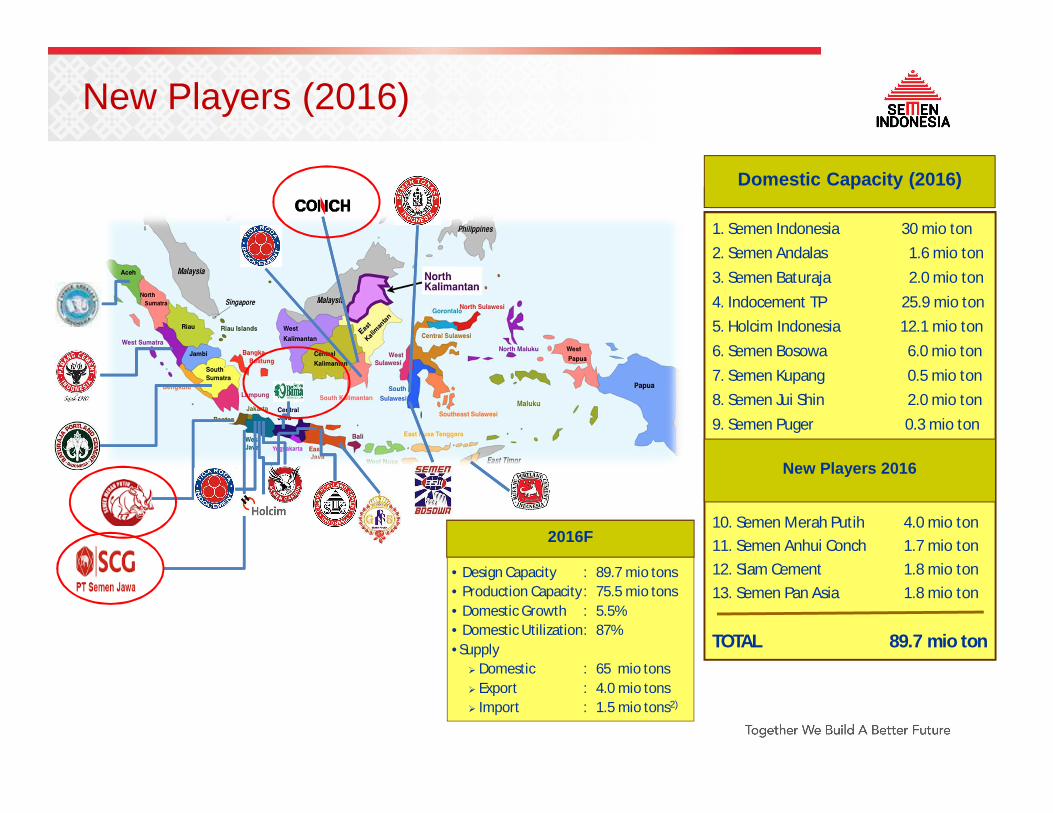
Infrastructure Spending Planned for 2015 – 2019 (USD Bn)
INFRASTRUCTURE DEVELOPMENT
COMMERCIAL & INDUSTRIAL High growth in retail, commercial and
institutional sector in urban and semi-urban area High growth industry segment (precast, light brick,
cement fiber, pave, ready mixed concrete)
HOUSING Population Growth Rising per Capita Income Mass urbanization
CEMENT CONSUMPTION (KG/CAPITA)
Rapidly Growing Productive Population
Key Factors Supporting Domestic Cement Consumption
172 42106
113 433
CentralGovt
RegionalGovt
SOEs Private Total238
POTENTIAL MARKETThe fourth largest population in the world: 240 millions people (2014)
DEMOGRAPHIC BONUS

6
Strategic Projects
These strategic projects are to ensure the Company’ position as the market leader.
Strategic Projects Capacity Investment(US$mn)
Construction
Start Completion
Indarung VI-Sumatera Barat
3.0 Mt
352 Q2-2013 Q3-2016
Rembang –Jawa Tengah
3.0Mt
403 Q2-2013 Q3-2016
Grinding millJawa Barat
2.0Mt
61.1 Q2-2015 Q3-2016
Waste Heat Recovery Power Generation
30.6 MW 49.3 Q4-2014 Q4-2016
MAIN STORAGE
PREHEATER AREA
INDARUNG PROJECT REMBANG PROJECT
MAIN STORAGE
PREHEATER AREA
RAW MILL AREARAW MILL AREA
Projects completed in 2015:• Packing Plant Pontianak
• Packing Plant Balikpapan
• Packing Plant Lampung
• Grinding Plant Dumai
• New Coal Mill Tonasa

7
Source: Company data, Indonesia Cement Association
Market update – recovery of demandSMGR sales volume (million tons)
11M15 11M14 Change (%)DomesticSemen Indonesia 12.8 12.8 (0.2) Semen Padang 5.8 6.1 (5.0) Semen Tonasa 4.9 4.9 0.1 Total domestic 23.5 23.9 (1.4) Export 0.45 0.20 128.4 Total volume 24.0 24.1 (0.3)
Domestic consumption (million tons)Area 11M15 11M14 Change (%)Jakarta 4.9 5.2 (7.3) Banten 3.0 2.9 3.4 West Java 8.2 8.1 0.8 Central Java 6.5 6.3 2.8 Yogyakarta 0.9 0.9 (5.1) East Java 7.4 7.3 1.6 Total Java 30.8 30.8 0.1 Sumatera 11.8 11.4 3.6 Kalimantan 3.7 4.1 (9.5) Sulawesi 4.3 4.1 5.1 Nusa Tenggara 3.2 3.1 4.0 Maluku & Papua 1.2 1.1 5.5 Total outside Java 24.2 23.7 1.8 Total Indonesia 55.0 54.5 0.8 Export Cement 0.53 0.22 140.8 Clinker 0.45 0.04 893.2 Total export 0.97 0.26 268.5 Grand total 56.0 54.8 2.1
SMGR sales type
mt mtBag 17.8 76% 18.1 76% -1.8% -0.6%Bulk 5.7 24% 5.6 24% 0.5% 0.6%
Industry sales type
mt mtBag 41.9 76% 42.7 78% -1.9% -2.2%Bulk 13.0 24% 11.7 22% 10.9% 2.2%
11M15 11M14 Change (%)
11M15 11M14 Change (%)

8
Source: Indonesian Cement Association & BPS Statistic
Long-term demand growth 7% pa
9
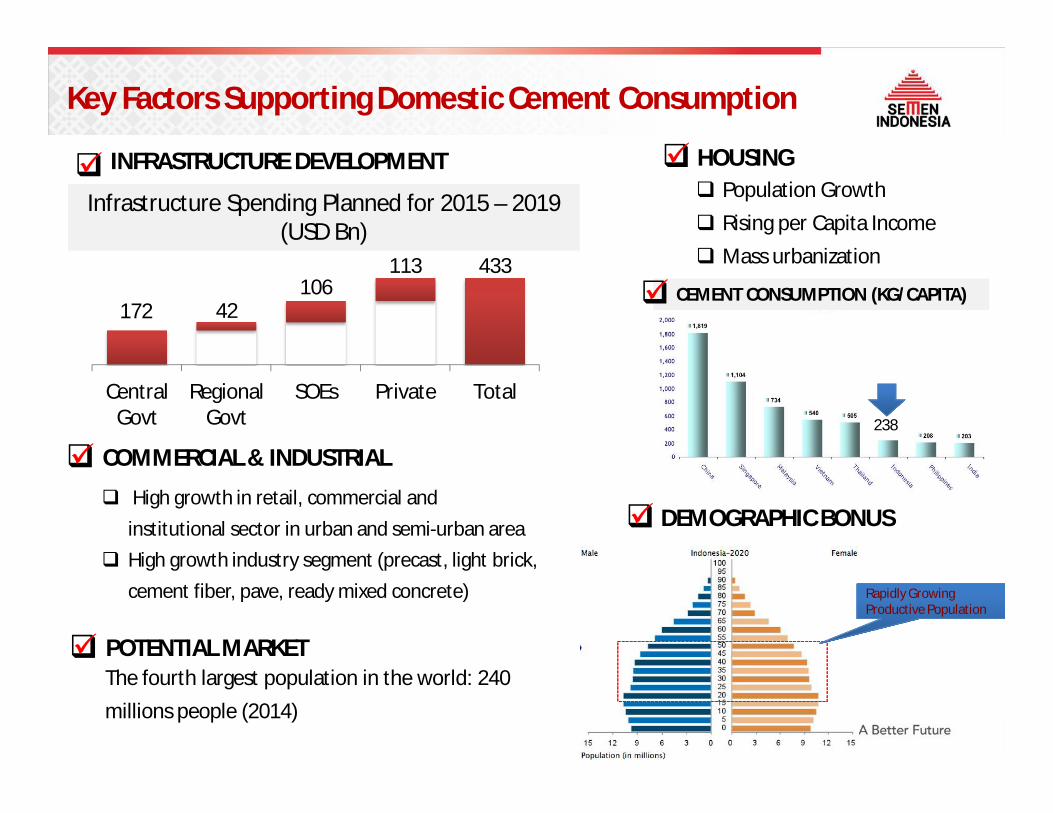
Demand from property and infrastructure projects
Source: Department of Public WorksSource: Department of Public Works
Government infrastructure budget Property lending
Source: Bank IndonesiaSource: Bank Indonesia
High execution risk on infrastructure spending remains.
But lending to the property related sector has continued to grow.
10
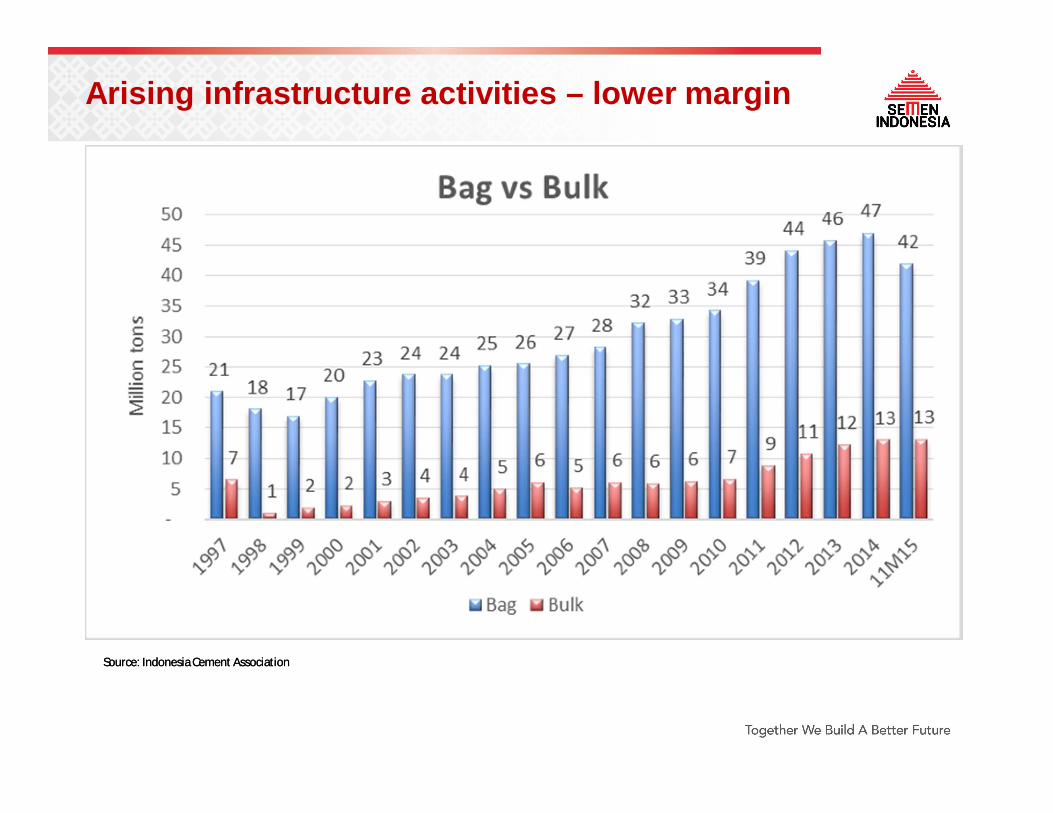
Arising infrastructure activities – lower margin
Source: Indonesia Cement AssociationSource: Indonesia Cement Association

11
Retail (residential) sector is the largest consumer of cement in Indonesia
Bag76.7%
Bulk23.3%
• Ready-mix (infrastructure):± 60%
• Fabricator (pre-cast, fiber cement, cement based industry):± 35%
• Projects (mortar, render):± 5%
• Ready-mix (infrastructure):± 60%
• Fabricator (pre-cast, fiber cement, cement based industry):± 35%
• Projects (mortar, render):± 5%
• Housing:± 90%
• Cement based industry:± 10%
• Housing:± 90%
• Cement based industry:± 10%
±
±
Source: Internal Research
Domestic market consumption

12
Papua
Bali & N T
Sulawesi
Kalimantan
Population Distribution (FY14)Population Distribution (FY14)
Sumatera21.3% Java
57.5.%
8.4%
5.8%
5.5% 1.5%
20.9%
6.6%9.1%
5.9% 2.2%
Java55.4%
Sumatera
Cement DistributionCement Distribution
Domestic Market Share
Market by Geography
SMGR INTP SMCB SMBR Bosowa Andalas Kupang MP JC
Java 40% 36% 18% - 2% - - 3% 2%
Sumatra 43% 11% 15% 12% 3% 14% - 2% 0%
Kalimantan 52% 28% 10% - 7% - - 3% 0%
Sulawesi 50% 10% 1% - 21% - - 17% -
Nusa Tenggara 37% 32% 6% - 14% - 7% 4% -
East Indonesia 57% 18% 1% - 24% - - - -
Total Indonesia 42% 27% 14% 3% 5% 3% 0% 4% 1%
Market share

13
We are the market leader
Source: Indonesia Cement AssociationSource: Indonesia Cement Association
Target markets Market share
Source: Indonesia Cement AssociationSource: Indonesia Cement Association
14
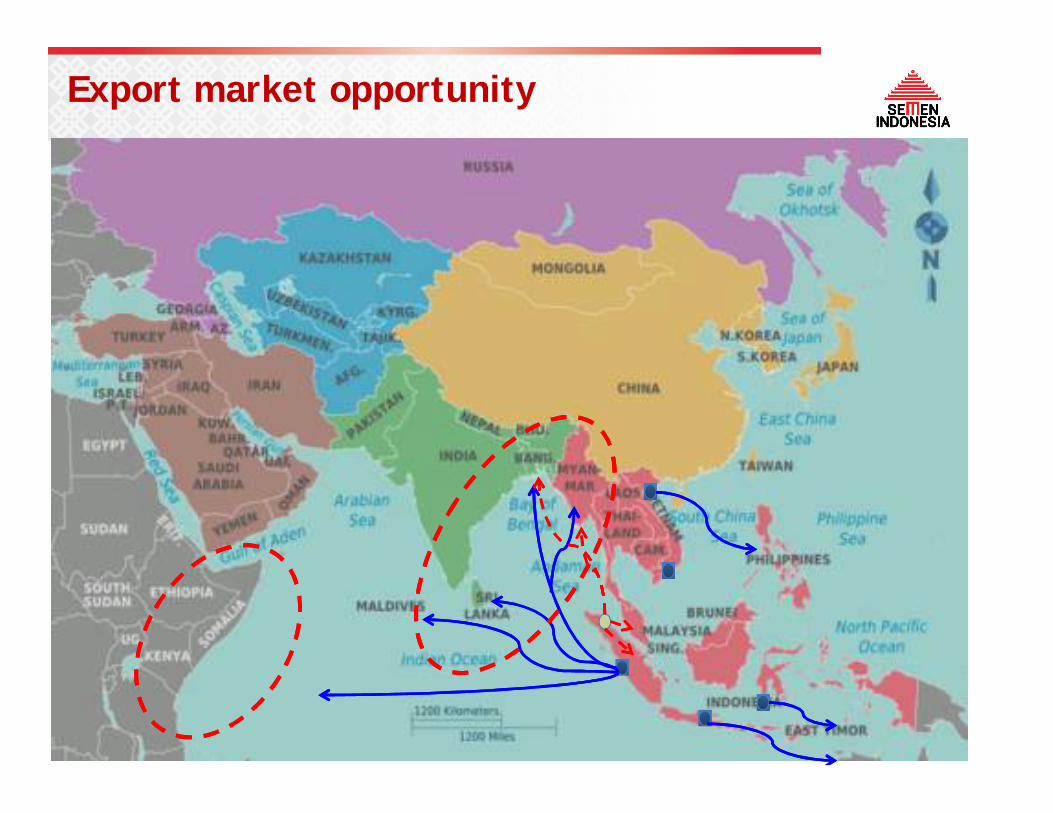
Export market opportunity

15
Financial Summary: 9M15 Results
*) Total debt calculated from interest bearing debt
In Rpbn 9M15 9M14 ChangeRevenue 19,115 19,349 -1.2%Cost revenue 11,602 10,898 6.5%Gross profit 7,513 8,451 -11.1%Operating expenses 3,352 3,242 3.4%Operating income 4,160 5,209 -20.1%EBITDA 5,211 6,138 -15.1%Pre-tax profit 4,102 5,193 -21.0%Net profit 3,198 4,077 -21.6%EPS (Rp) 539 687 -21.6%RatioEBITDA margin 27% 32% -4%Interest coverage - x 19 25 (6)Cost ratio 78% 73% 5%Net debt to equity 5% h2% 4%Debt to equity 16% 18% -2%Receivable turnover - days 52 45 7
16
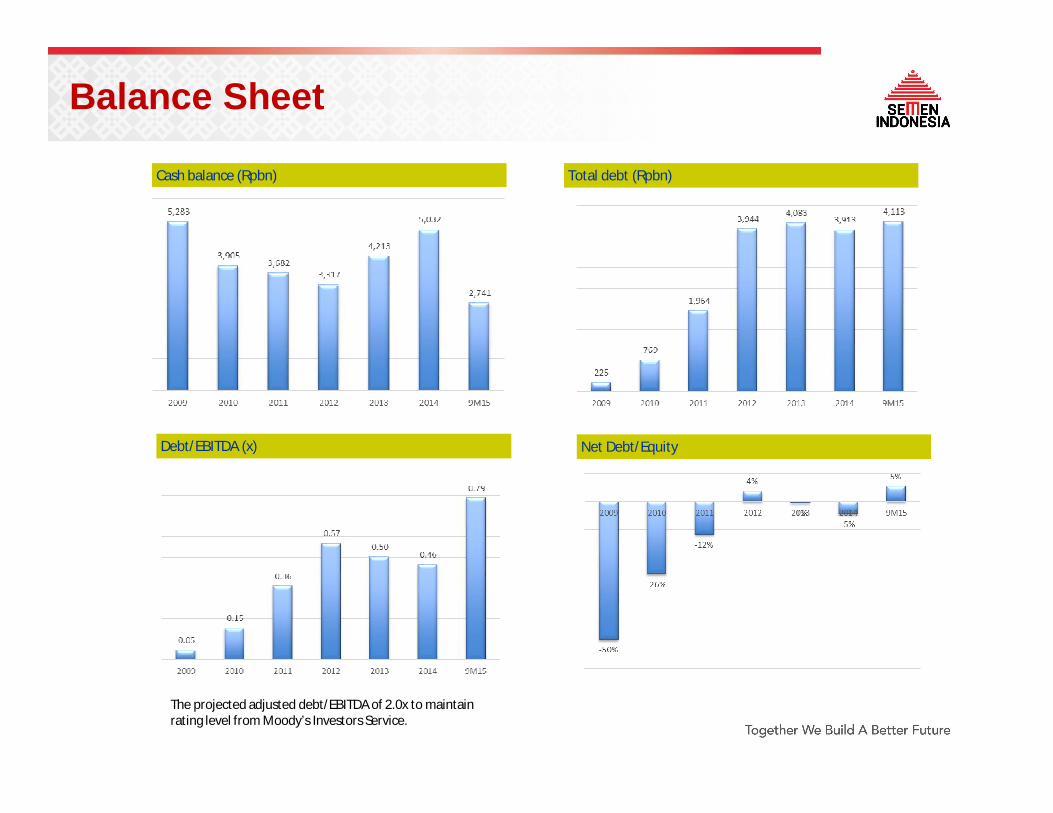
Balance Sheet
Cash balance (Rpbn) Total debt (Rpbn)
Debt/EBITDA (x) Net Debt/Equity
The projected adjusted debt/EBITDA of 2.0x to maintain rating level from Moody’s Investors Service.

17
Margin & Returns
Return on Equity (%) Return on Assets (%)
EBITDA/t (US$/t) Receivables Turnover (days)
The projected adjusted debt/EBITDA of 2.0x to maintain rating level from Moody’s Investors Service.

18
Cost structureRp000/t 9M15 9M14 ChangeRaw materials 37 30 22%Fuel 110 117 -6%Electricity 103 85 22%Labor 52 51 4%Maintenance 54 49 10%Packaging 27 36 -23%Trading 85 89 -5%Others 52 35 52%Cost of goods sold 523 491 6%Selling expense 93 96 -4%G&A 75 68 11%Total cost 591 550 7%Unit cost (US$/t)Cash COGS 39 40 -4%Total cash cost 51 53 -5%
Cash COGS in Rp000/t
Energy prices in US$/unit

19
think about theENVIRONMENT

20
Development New Industrial Estates is a catalyst for cement demand
Semen Indonesia Packing PlantNew Industrial Estate Area

21
Funding for the Government Infrastructure Development (2015 – 2019)
If 1% from total project value for roads, MRT, airport, seaport, housing ($206bn) spent to cement consumption, estimated cement consumption in the next 5 years around 26.8 Mio ton or 5.4 Mio ton per year)
22
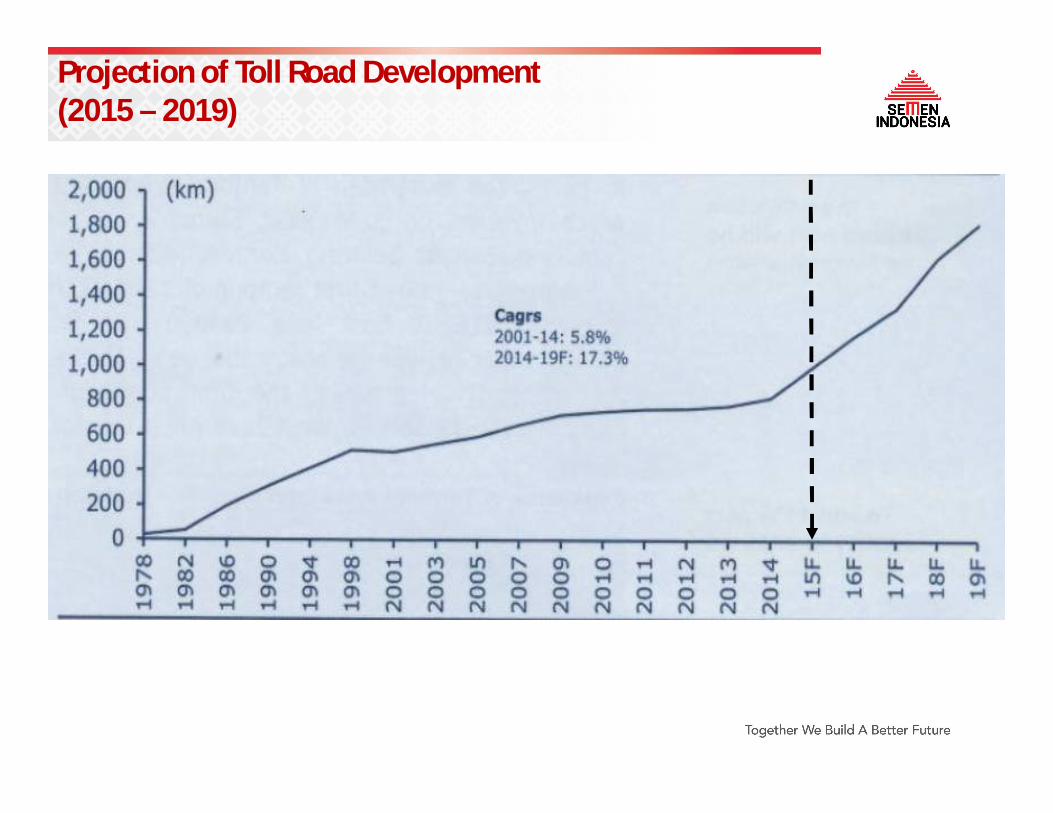
Projection of Toll Road Development (2015 – 2019)
23
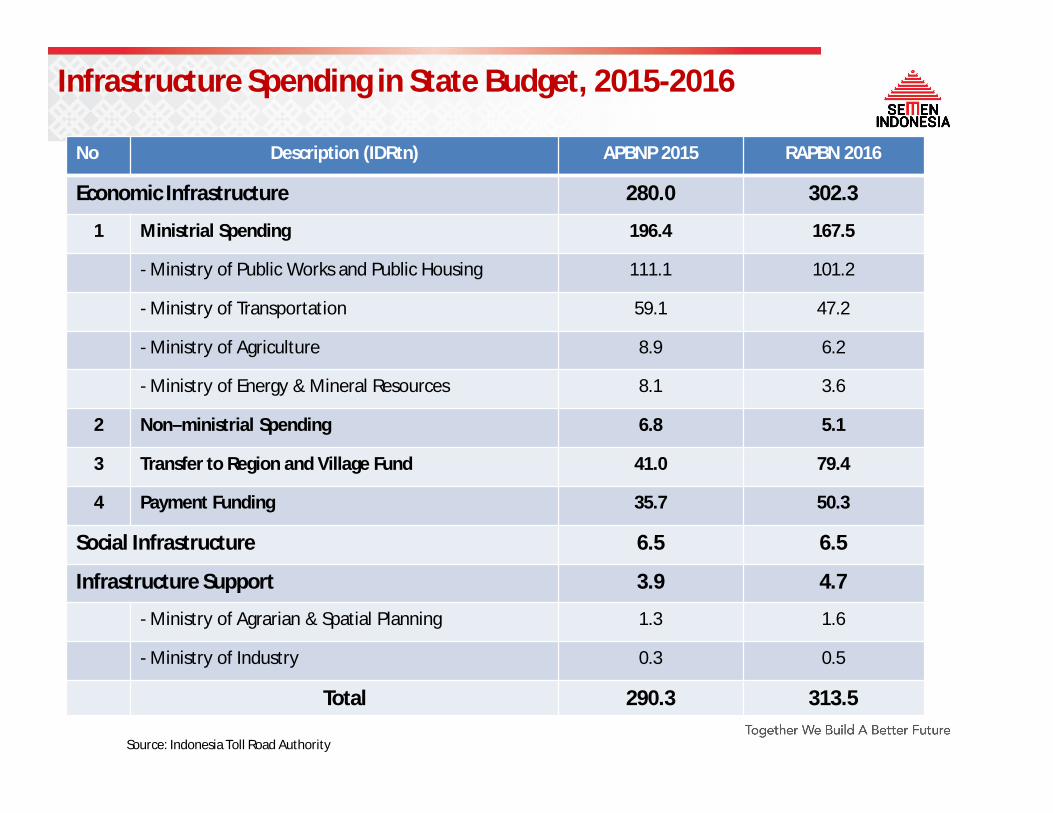
Infrastructure Spending in State Budget, 2015-2016
No Description (IDRtn) APBNP 2015 RAPBN 2016
Economic Infrastructure 280.0 302.3
1 Ministrial Spending 196.4 167.5
- Ministry of Public Works and Public Housing 111.1 101.2
- Ministry of Transportation 59.1 47.2
- Ministry of Agriculture 8.9 6.2
- Ministry of Energy & Mineral Resources 8.1 3.6
2 Non–ministrial Spending 6.8 5.1
3 Transfer to Region and Village Fund 41.0 79.4
4 Payment Funding 35.7 50.3
Social Infrastructure 6.5 6.5
Infrastructure Support 3.9 4.7
- Ministry of Agrarian & Spatial Planning 1.3 1.6
- Ministry of Industry 0.3 0.5
Total 290.3 313.5
Source: Indonesia Toll Road Authority

24
think about theENVIRONMENT

25
BRIEF HISTORYBRIEF HISTORY SMGR CAPACITY BUILD-OUT (MM TONS)SMGR CAPACITY BUILD-OUT (MM TONS)31,8 mn tons
Semen Indonesia highlights
1957 : Inauguration of Gresik I, installed capacity of250,000 ton cement per annum
1991 : Initial Public Offering, Market Cap.: IDR0.63tn,resulting shareholding structure post IPO:
●Government of Republic of Indonesia: 73%●Public: 27%
1995 : Acquisition of PT Semen Padang (Persero) andPT Semen Tonasa (Persero)
1998 : Cemex became a strategic partner, Market Cap.:IDR4.9tn
2006 : Blue Valley Holdings bought Cemex’s 24.9%stake in SMGR, Market Cap.: IDR21.5tn
2010 : In March 31, Blue Valley Holdings sold all of itsstake ownership in SMGR, Market Cap per April 30,2010: IDR72.1tn
2011 : Total installed capacity of 20.00mm tons, MarketCap per June 29, 2012: IDR67.0tn
2012 : Acquisition of Thang Long Cement Vietnam, Totalinstalled capacity of 2.3mm tons, Market Cap Dec 19th,2012: IDR91.9tn
2013: Transformed to PT Semen Indonesia (Persero)Tbk as strategic holding co.
0,0
5,0
10,0
15,0
20,0
25,0
30,0
35,0
1957
1970
1980
1984
1985
1986
1990
1995
1997
1998
2006
2007
2008
2009
2010
2011
2012
2013
2014

26
Semen Indonesia as strategic holding company
99,9% 99,9% 70,0%55,0%
SP ST TLCCPT United Tractors Semen Gresik
97,0%PT SGG Energi Prima
60,0% PT Industri KemasanSemen Gresik
65,0% PT Kawasan IndustriGresik
99,99% PT SGG Prima Beton
24,95% PT Varia Usaha
25% PT Swadaya Graha
17,6%
99,9%
SG
NO
N C
EMEN
T CO
MPA
NY
50,0%PT Krakatau SemenIndonesia
CEMENT COMPANY
Komposisi Pemegang Saham Per 31 Desember 2014
85%
PT Eternit Gresik
PT SISI
No Shareholders %
1 Government RI 51.01
2 Foreign Institution 38.59
3 Foreign Individual 0.01
4 Domestic Institution 9.73
5 Domestic Individual 0.67

27
Regional market
Kiln 1 unit
Cement Mill 1 unit
Kiln 4 unit
Cement Mill 9 unit
Grinding Plant
1 unit Cement Mill
Kiln 4 unit
Cement Mill 6 unit
Grinding Plant
3 unit Cement Mill
Kiln 4 unit
Cement Mill 6 unit
25 lokasi

28
Main Office:Main Building of Semen Gresik
Jln. Veteran Gresik 61122 – IndonesiaPhone: (62-31) 3981731 -2, 3981745
Fax: (62-31) 3983209, 3972264
Representative Office:The East Building, 18 floorJl. Lingkar Mega Kuningan Blok E 3.2 No. 1,JAKARTA – 12950Telp.: 021 – 5261174, 5261175; Faks : 021 – 5261176
www.semenindonesia.com