January 2013 Volume 2 Issue 1 The Macrotheme...
37
Mathotaarachchi, The Macrotheme Review, WINTER 2013. 56 January 2013 Volume 2 Issue 1 The Macrotheme Review A multidisciplinary journal of global macro trends The impact of transformational and transactional leadership behaviours on employees’ trust and their organizational commitment for non-teaching staff of the Sri Lankan Universities Kamani Priyangika Mathotaarachchi University of Colombo, Sri Lanka, [email protected] Abstract The purpose of this research was to investigate the impact of transformational and transactional leadership behaviours on employees’ trust and their organizational commitment for non-teaching staff of the Sri Lankan Universities. Transformational and transactional leadership behaviours were measured using 26 items taken from the Bass & Avolio’s (1995) Multifactor Leadership Questionnaire. Employees’ trust in bosses were measured using 10 items related to scholars’ accepted variables such as Reliability, Acceptance, Benevolence, Openness and Supportiveness. The Organizational Commitment Questionnaire (OCQ) developed by Meyer & Allen’s in 1997 was used to measure the employees’ organizational commitment. Participants were permanent non – academic employees of Sri Lankan Universities. The survey was carried out through a questionnaire circulated among 465 employees in 12 universities. The data were mainly analysed with correlation and multiple regression models. The study findings indicated that there is a positive impact of leadership of bosses’ on employees’ trust. Employees’ were satisfied with the benevolence, openness and supportiveness with the transformative leader than the transactional leader. Transformational leadership behaviors explained the greatest amount of correlations in normative commitment, compared with the affective commitment while no relationship with continuance commitment. The results for transactional leadership variables revealed the weaker relationships with the different types of organizational commitment. The best predictors of the employees’ trust among the transformational and transactional variables are idealized influence (attribute), inspirational motivation, individual consideration, laissez - faire, management -by- exception (passive), contingent reward, and Intellectual stimulation. Individual Consideration, idealized influence (attributed), Management-by-exception (passive) were the best predictors of employees’ organizational commitment. Keywords: Transformational Leadership, Transactional Leadership, employees’ Trust, organizational commitment 1. Introduction Leadership is the process whereby one individual influences subordinates towards the attainment of organizational goals (Greenberg and Baron, 2000). Further no other role in the organization has received more interest than that of the leader. Therefore the study
-
Upload
truongmien -
Category
Documents
-
view
217 -
download
3
Transcript of January 2013 Volume 2 Issue 1 The Macrotheme...

Mathotaarachchi, The Macrotheme Review, WINTER 2013.
56
January 2013 Volume 2 Issue 1
The Macrotheme Review A multidisciplinary journal of global macro trends
The impact of transformational and transactional leadership
behaviours on employees’ trust and their organizational
commitment for non-teaching staff of the Sri Lankan Universities
Kamani Priyangika Mathotaarachchi University of Colombo, Sri Lanka, [email protected]
Abstract
The purpose of this research was to investigate the impact of transformational and
transactional leadership behaviours on employees’ trust and their organizational
commitment for non-teaching staff of the Sri Lankan Universities. Transformational
and transactional leadership behaviours were measured using 26 items taken from
the Bass & Avolio’s (1995) Multifactor Leadership Questionnaire. Employees’ trust
in bosses were measured using 10 items related to scholars’ accepted variables such
as Reliability, Acceptance, Benevolence, Openness and Supportiveness. The
Organizational Commitment Questionnaire (OCQ) developed by Meyer & Allen’s in
1997 was used to measure the employees’ organizational commitment. Participants
were permanent non – academic employees of Sri Lankan Universities. The survey
was carried out through a questionnaire circulated among 465 employees in 12
universities. The data were mainly analysed with correlation and multiple regression
models. The study findings indicated that there is a positive impact of leadership of
bosses’ on employees’ trust. Employees’ were satisfied with the benevolence,
openness and supportiveness with the transformative leader than the transactional
leader. Transformational leadership behaviors explained the greatest amount of
correlations in normative commitment, compared with the affective commitment
while no relationship with continuance commitment. The results for transactional
leadership variables revealed the weaker relationships with the different types of
organizational commitment. The best predictors of the employees’ trust among the
transformational and transactional variables are idealized influence (attribute),
inspirational motivation, individual consideration, laissez - faire, management -by-
exception (passive), contingent reward, and Intellectual stimulation. Individual
Consideration, idealized influence (attributed), Management-by-exception
(passive) were the best predictors of employees’ organizational commitment.
Keywords: Transformational Leadership, Transactional Leadership, employees’ Trust,
organizational commitment
1. Introduction
Leadership is the process whereby one individual influences subordinates towards
the attainment of organizational goals (Greenberg and Baron, 2000). Further no other role
in the organization has received more interest than that of the leader. Therefore the study

Mathotaarachchi, The Macrotheme Review, WINTER 2013.
57
of leadership has been an important and central part of the researchers on management
and organizational behavior in several decades.
According to Chandan (2001), leadership is defined as the art of
influencing and inspiring subordinates to perform their duties willingly,
competently and enthusiastically for achievement of group objectives. Most
management writers agree that, leadership is the process of influencing the
activities of an individual or a group in efforts towards goal achievement in a
given situation. This argument is provided evidence that the leadership is an essential
ingredient in organizational success. With successful leadership, organization can grow,
prosper, compete and can smoothly achieve for its mission.
The differentiation of a leader from the manager within the organization is
obligation for the better explanation of this research study. Leaders create the
organization’s mission and outline the strategy for attaining it whereas managers are
responsible for managerial tasks. Thus although there is a distinction between leaders and
managers, it is often blurred in practice (Greenberg and Baron, 2000). In this research
study, the term ‘leader’ is considered as the ‘manager’ or the ‘boss’ of the employee.
However, the early examination of leadership behaviors included a separation of
leaders’s behaviors into transformational and transactional categories. As well as Dirks
& Ferrin (2002) and Joseph & Winston (2005) find out that the leadership is very likely
the chief source of developing trust or distrust within the organizational setting. Recent
development in organizational science reflects the importance of relationship built upon
interpersonal trust for sustaining both organizational as well as individual effectiveness (
Mc Allister, 1995).
The Main objective of every organization and the concern of every person within
that organization are to perform well for the purpose of achieving their desired goals. To
be fruitful in reaching its mission, the achievement of productivity through attractive
leadership and effective management of personnel, together with their commitment to and
collaboration with the organization is an essential per- requisite (Ubayachandra, 2002).
This research stresses the impact of transformational and transactional leadership
behaviors to the employees’ trust and their organizational commitment with reference to
the non academic employees of the Sri Lankan Universities sector.
2. Definition of the key Terms
For the purpose of this research study, the following definitions were used:
Boss / Supervisors of the Employee: The term, ‘Boss’ or ‘Supervisor’ is
depends on the situation. But generally it can be concluded that ‘bosses’
are the administrators who are responsible for maintaining the facilities
and infrastructure of the universities or institutions, responsible for all
administrative work of the employees as well as students, responsible for
examination matters of the students, and also overseeing financial affairs
of the universities or the institutions.
Mathotaarachchi, The Macrotheme Review, WINTER 2013.
58
Transformational Leaders: Leaders who are inspire followers to transcend
their own self-interests and who are capable of having profound and
extraordinary effects on the followers.
Transactional leaders: Leaders who are guide or motivate their followers
in the direction of established goals by clarifying role and task
requirements.
Trust: Trust is a psychological bond which assurance of maintaining
intimate relationship between two or more parties powered by acceptance,
benevolence, reliability, supportiveness, and openness.
3. Literature Review
3.1 Transformational Leadership Behavior and Transactional Leadership
Behavior
Based on Burn’s (1978) original theory of transformational leadership it has been
suggested that subordinates function most effectively when led in a way that extends
beyond mere transaction (Bass & Avolio, 1993). Whereas the transactional leader
provides rewards and punishments based on subordinate output (contingent reward) and
may only intervene when he observes deviation from standard procedure (management-
by-exception), transformational leaders move their employees beyond the basic economic
exchange process (Bass & Avolio, 1993). In other words, Transformational leadership
behaviors focus on the quality of the relationship with followers, whereas, transactional
leadership behaviors focus on the task to be accomplished by followers (Bass, 1990).
Throughout the years, researchers as mentioned below, have used various terms to
describe transformational and transactional leadership behaviors. Bass (1990a) provides
an overview of terms used by several researchers. For example, descriptions of
transformational leadership behaviors have included consideration (Hemphill, 1950),
building mutual trust (Misumi, 1985), participatory decision-making (Ouchi, 1981),
interaction-oriented (Bass, 1967), supportive & democratic (Misumi, 1985), concern for
people (Blake & Mouton, 1964), people centered (Anderson, 1974), emphasizing
employee needs (Fleishman, 1957), and leadership (Zaleznik, 1977). Conversely,
descriptions of transformational leadership behaviors have included initiating structure
(Hemphill, 1950), defining group activities (Fleishman, 1951), concerned with
production (Blake & Mouton, 1964), autocratic (Reddin, 1977), achievement oriented
(Indvik, 1986), focused on production (Katz, Maccoby, & Morse, 1950), production
emphasizing (Fleishman, 1957), goal-achieving (Cartwright & Zander, 1960), goal
emphasizing and management (Zaleznik, 1977). Transformational leadership also known
as the charismatic leadership (Greenberg and Baron, 2000).
For both types of leadership behaviors, the most recent descriptions come from
Bass & Avolio (1997). They describe transformational leadership behaviors as idealized
influence (attributed), idealized influence (behavior), individualized consideration,
intellectual stimulation, and inspirational motivation. Their transactional descriptions

Mathotaarachchi, The Macrotheme Review, WINTER 2013.
59
include contingent reward, management-by- exception (active), and management-by-
exception (passive) and laissez-faire.
For the purpose of this research, the terms transformational leadership and
transactional leadership is used to distinguish between various leadership behaviors.
Consequently it is an important to note that effective leadership is an essential ingredient
in organizational success (Greenberg and Baron, 2000). Bennis and Nanus (1985) cite
trust as a key element of effective leadership. Moreover, effective leaders focus on
building strong relationships with others and maintain their position by inspiring trust and
confidence in other members or subordinates. With effective leadership, organization can
grow, prosper and compete. Without it, many simply cannot survive (Greenberg and
Baron, 2000).
3.2 Employees’ Trust
Trust, or lack of trust, is an increasingly important leadership issue in today's
organizations. Trust is a positive expectation that another will not-through words,
actions, or decisions-act opportunistically (Holmes, 1991, Rousseau et. el in 1998).
According to the previous researches, the most important of trust elements can be
summarized as: Reliability (Hosmer, 1995), Acceptance (Hosmer, 1995), Benevolence
(Baier, 1986, Cummings & Bromily, 1996, Hoy & Tschannen-Moran, 1999), openness
(Mishra, 1996) and Supportiveness (Baier, 1986). Bennis and Nanus (1985, P. 153)
fascinatingly point out trust as follows:
“Trust is the emotional glue that binds followers and leaders
together. The accumulation of trust is a measure of the legitimacy of
leadership. It cannot be mandated or purchased; it must be earned. Trust is a
basic ingredient of all organizations, the lubrication that maintain the
organization”
3.3 Organizational Commitment
Organizational commitment is one of the major employee attitudinal change, that
is used in a number of different ways. As part of their research, Meyer & Allen (1991)
developed a framework that was designed to measure three different types of
organizational commitment: (a) Affective commitment refers to employees’ emotional
attachment, identification with, and involvement in the organization. Employees with a
strong affective commitment stay with the organization because they want to. (b)
Continuance commitment refers to employees’ assessment of whether the costs of leaving
the organization are greater than the costs of staying. Employees who perceive that the
costs of leaving the organization are greater than the costs of staying remain because they
need to. (c) Normative commitment refers to employees’ feelings of obligation to the
organization. Employees with high levels of normative commitment stay with the
organization because they feel they ought to. Consequently, for this research, the
different scales will be referred to as types rather than components.
Mathotaarachchi, The Macrotheme Review, WINTER 2013.
60
3.4 Organizational Commitment with in the Organizational Setting
The degree to which an individual feels committed to his or her organization may
be related to career stage. It may be that exploration-stage individuals bring high
expectations to the workplace and can become critical of their organizations when these
expectations are not met (Hall 1976). Studies have linked organizational commitment to
measures of effectiveness that are similar to those found when investigating the outcomes
of transformational and transactional leadership behaviours. Louis et.al (1995), for
instance, found that commitment was significantly related to trust, job involvement, and
job satisfaction. Jermier & Berkes (1979) discovered that employees who were allowed
to participate in decision-making had higher levels of commitment to the organization.
DeCotiis & Summers (1987) found that when employees were treated with consideration,
they displayed greater levels of commitment. Bycio, Hackett, & Allen (1995) reported
positive correlations between the leadership behaviors of charisma, intellectual
stimulation, individualized consideration, and contingent reward and affective,
continuance, and normative commitment.
The Main objective of every organization and the concern of every person within
that organization is to perform well for the purpose of achieving their desired goals. To
be fruitful in reaching its mission, the achievement of productivity through attractive
leadership and effective management of personnel, together with their commitment to and
collaboration with the organization is an essential per- requisite (Ubayachandra, 2002).
4. Statement of the Problem
Leadership behavior is an increasing organizational phenomenon as well as
popular in both academics and practitioner’s researches. In today’s highly competitive
work environment, some employees would probably do all they can for the purpose of
their survival. Much of the behavioral research literature has emanated from western
based studies and recently it is spread over Asia and worldwide. Chandan (2001)
argued that leadership is not an attribute of business alone. In the army, in the
government, in universities, in hospitals and anywhere else where people work in
groups, the leadership function emerges. There must be somebody to guide that
group. The group leader may also be an informal leader, one who emerges from
the ranks of the group according to consensus of the members.
Researches have shown that leadership affect employees’ trust and trusted
employees are highly committed to the organization. The relationship between leadership
and trust as well as trust and organizational commitment is well documented in the
industrial sector but is less understood in the educational setting, both domestically and
internationally. In Sri Lankan context researchers give limited attention on job related
attitude and employees behavior in higher educational sector.
In Universities as in any other organization, the leadership appearance practiced
by the authorities may hinder or enhance performance, quality and productivity
(Ubayachandra, 2002). Ubayachandra (2002) argued that the management style leads
members of an organization to behave with and build a particular attitude towards their

Mathotaarachchi, The Macrotheme Review, WINTER 2013.
61
job and their organization. This attitude may bring a positive or negative effect to the
organizational performance and its image. He also stressed that the way the Universities
are perceived by their stakeholders can consider in this point When considering the
higher educational sector in Sri Lanka, it is indeed to explore non academic employee’s
job related attitudes towards the better enhancement of this sector. Non academic
employees are responsible for the entire non-academic functions including recruitments,
examinations, financial activities, maintenance etc. In addition to this, the literature does
not offer guidance on how organizational commitment and employees’ trust are affected
by transformational and transactional leadership behaviors. In this research, it is an
attempt to investigate the relationship between leadership, trust and commitment of the
non academic employees of the university staff the Sri Lanka. Hence the research
problem can be state as: “How far the transformational and transactional leadership
behaviors impact on employees’ trust and organization commitment of non-academic
staff of the Sri Lankan Universities?”
5. Objectives of the Research
1. To identify the relationship between transformational and transactional
leadership variables and organizational commitment variables
2. To identify the relationship between employees’ trust variables and organizational
commitment variables
3. To identify the relationship between bosses’ transformational and transactional
leadership behaviors and employees’ trust
4. To examine the relationship between bosses’ transformational and transactional
leadership behaviors and organizational commitment
5. To identify the relationship between employees’ trust and the organizational
commitment
6. To identify the significant predictors of employees trust among the leadership
variables
7. To identify the significant predictors of organizational affective commitment
among the leadership variables
6. Research Questions
The following questions were proposed as part of this research:
1. What are the relationships between leadership variables and organizational
commitment variables?
Mathotaarachchi, The Macrotheme Review, WINTER 2013.
62
2. What are the relationships between employees trust variables and organizational
commitment variables?
3. What is the relationship between bosses’ transformational and transactional
leadership behaviors and employees’ trust?
4. What is the relationship between bosses’ transformational and transactional
leadership behaviors and organizational commitment
5. What is the relationship between employees’ trust and their organizational
commitment?
6. What is/are the significant predictor/s of employees trust among the leadership
variables?
7. What is/are the significant predictor/s of organizational affective commitment
among the leadership variables?
7. Research Hypothesis
H10: Transactional leadership is negatively correlated or not correlated with
employees’ trust
H20: Transformational leadership positively correlated with organizational
commitment
H30: Transformational leadership variables are statistically and significantly predict the
employees’ trust than transactional leadership variables.
H40: Out of the five variables, idealized influence (attribute) will have the largest
impact on employees’ organizational affective commitment
Mathotaarachchi, The Macrotheme Review, WINTER 2013.
63
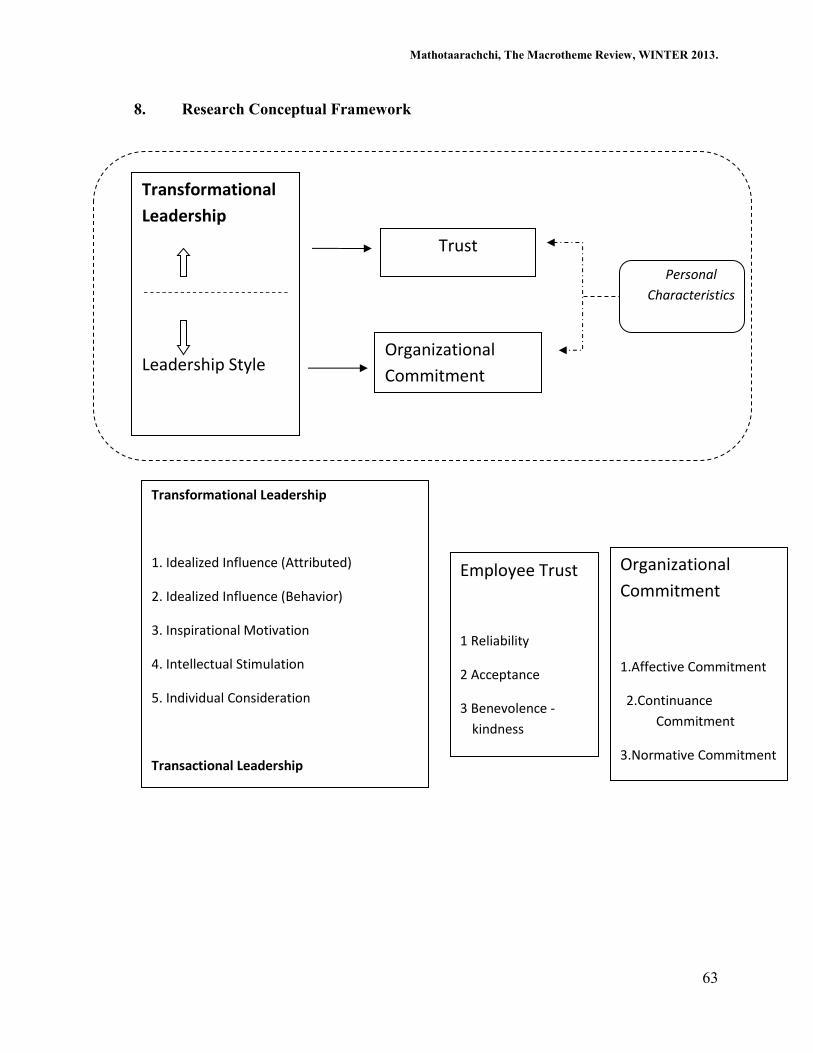
8. Research Conceptual Framework
Transformational
Leadership
Leadership Style
Transactional
Leadership
Employee Trust
1 Reliability
2 Acceptance
3 Benevolence -
kindness
4 Openness -
5 Supportiveness
Organizational
Commitment
1.Affective Commitment
2.Continuance
Commitment
3.Normative Commitment
Organizational
Commitment
Personal
Characteristics
Transformational Leadership
1. Idealized Influence (Attributed)
2. Idealized Influence (Behavior)
3. Inspirational Motivation
4. Intellectual Stimulation
5. Individual Consideration
Transactional Leadership
1. Contingent Reward
2.Management-by-Exception (Active)
3.Management-by-Exception (Passive)
4. Laissez – Faire
Trust

Mathotaarachchi, The Macrotheme Review, WINTER 2013.
64
9. Significances of the Study
1. To get a knowledge about the leadership behavior of the non academic and
executive grade employees’ in Sri Lankan University sector.
2. Identify the employees’ trust level and its impact on organizational
commitment
3. University grant commission can redesign the training programs according
to improve organizational commitment.
4. Assist to policy makers to restructure policies to enhance the
employees’ productivity.
5. With the improvement of the non teaching employees’, university students
can have a high quality service.
6. Help to University Grant commission to diversify and assurance of quality
of academic program.
10. Research Methodology
This study was based on both secondary and primary data. The secondary data
were gathered through referred journal articles, text books in leadership, organizational
behaviour, and management, magazines and news papers through relative websites. A
structured representative questionnaire was given to the selected non teaching members
of the university staff. In the questionnaire since it is used more qualitative variables five
point likert scales were used for each variable measured.
The target population of this study was all the non teaching staff who was
permanent in their position of all fifteen universities including post graduate and other
institutions. Employees of the University Grants Commission (UGC) were excluded from
the population as this research was conducted only for the non teaching staff of the
universities. Consequently total numbers of permanent employees were 8197. Since this
study was focused to study the Bosses leadership style and employees’ trust on their
bosses. The content validity of the questionnaire was tested by using three employees
from each job category (altogether 12 employees) who were randomly selected. Skilled /
semiskilled grade employees were unable to even understand the questions properly.
Hence, to minimize the error occurring in the process of sampling 4651 employees from
the staff grade, clerical and allied grade and technical grade were targeted for this study.
Sample Size was 10% of the total target population of 4651 employees. As subsequence
465 employees were selected for this study as the sample. The sample elements were
selected through the sampling technique of multistage random sampling technique which
consisted of three stages. As the first step from the fifteen universities in Sri Lanka 12
universities are selected omitting the three universities of Jaffna, Eastern and South
Eastern which are located in the terrorist affected areas. Other 12 universities were
included to the sampling frame.

Mathotaarachchi, The Macrotheme Review, WINTER 2013.
65
Number of total employees in each university *
=
Sample unit
Table 1. Sampling Frame
No. University
Number of total
employees
Sample
size
1 University of Colombo 634 73
2 University of Kelaniya 457 53
3 University of Jayawardhanapura 394 46
4 University of Peradeniya 903 105
5 University of Moratuwa 338 39
6 Sabaragamuwa University of Sri Lanka 131 15
7 Rajarata University of Sri Lanka 93 11
8
University of Performing Arts & Visual
Studies 85 10
9 University of Ruhuna 490 57
10 University of Wayamba 113 13
11 Uva Wellassa University 06 01
12 Open University of Sri Lanka 349 40
Total 3993 465
The questionnaire was delivered by hand to minimize the non respondent error.
Two contact people were appointed from each university to collect the completed
questionnaires. Completed questionnaires returned to the researcher at a 98% return rate.
It had to redeliver some questionnaires to arrive at the total sample size. Respond rate
was 98% and 14 questionnaires were uncompleted. All together 24 questionnaires were
sent to the contact people accordingly.
Sample size
Number of
employees
from each
university
Mathotaarachchi, The Macrotheme Review, WINTER 2013.
66
10.1 Description of the Primary Data Collection Instruments
The main primary data collection instrument was “questionnaire”. This research
was conducted using three separate instruments related to demographic information,
bosses’ leadership and employees’ trust. The instruments were completed using a self
report, pencil and paper method.
Employees Trust Questionnaire
A ten item scale to assess employees trust on bosses was constructed based on a
content analysis of 12 pilot interviews and in-depth study of literature revives. This ten
item questionnaire measures the extent to which the specifies leader is judged to be trusty
across the following 5 measures of trust; Reliability, acceptance, benevolence, openness
and supportiveness. A five point Likert rating scale of “almost never, seldom,
satisfactory, just right and more than necessary” was used.
Leadership Questionnaire
The moderated Multifactor leadership questionnaire, MLQ (form 5X) developed
by the Bass & Avolio in 1995 was used. The moderated MLQ from the 5X is self-
scoring and used 26 items to measure the nine subscales in this research. These items are
rated using a 5-point Likert scale with anchors labelled as 1 = not at all, 2= once in a
while, 3= sometimes, 4= fairly often, 5 = frequently, if not always.
Organizational Commitment Questionnaire
The Organizational Commitment Questionnaire (OCQ) developed by Meyer &
Allen’s in 1997 was used. This is a self-scoring questionnaire. Responses to each of the
6 items are rated using a 5-point Likert scale with anchors labeled: 1 = strongly disagree,
2 = disagree, 3 = neither agree nor disagree, 4 = agree, 5= strongly agree.
10.2 Data analysis Procedure
SPSS® version 11.5 for Windows was the statistical software program used to
perform all procedures. Pearson correlation coefficient was used for identify the
relationship between bosses leadership styles and employees’ trust on their bosses’.
Correlation is the degree of association between two variables and it is represented in
terms of a coefficient known as a correlation coefficient. The range of the correlation
coefficient is in between -1 and +1. Practical Descriptors for Correlation Coefficient
produced by Hinkle D.E. Oliver, J.D., & Hinkle, CA. (1985) was followed for this
research.
Accordingly where the Correlation Coefficient – r:
0.90 to 1.00 - Very High Correlation
0.70 to 0.90 - High Correlation
Mathotaarachchi, The Macrotheme Review, WINTER 2013.
67
0.50 to 0.70 - Moderate Correlation
0.30 to 0.50 - Low Correlation
0.0 o 0.30 - Little if any Correlation
11. Operationalization of the Key Variables
Mean score for transformational leadership variables i.e. idealized influence
(attributed), idealized influence (behavior), individualized consideration, intellectual
stimulation, and inspirational motivation is 3.0 or above consider as leaders’ have higher
level of leadership in each variables while the mean score is 2.0 to 3.0 considered as
moderate level and the mean score is less than 2.0 is considered as lower level. Mean
score for transactional leadership variables i.e. contingent reward, management-by-
exception (active), and management-by- exception (passive) and laissez-faire is 3.0 or
above considered as leaders’ have higher level of leadership in each variables while the
mean score is 2.0 to 3.0 considered as moderate level and the mean score is less than 2.0
is considered as lower level. Mean score for employees’ trust elements i.e. reliability,
acceptance, benevolence, openness and supportiveness is 3.0 or above considered as
satisfactory trust level in each variables while the mean score is 2.0 to 3.0 considered as
moderate trust level and the mean score is less than 2.0 is considered as lower trust level.
Mean score for employees’ organizational commitment elements i.e. affective
commitment, continuance commitment and normative commitment is 3.0 or above
considered as higher commitment level in each variables while the mean score is 2.0 to
3.0 considered as moderate commitment level and the mean score is less than 2.0 is
considered as lower commitment level.
Mathotaarachchi, The Macrotheme Review, WINTER 2013.
68
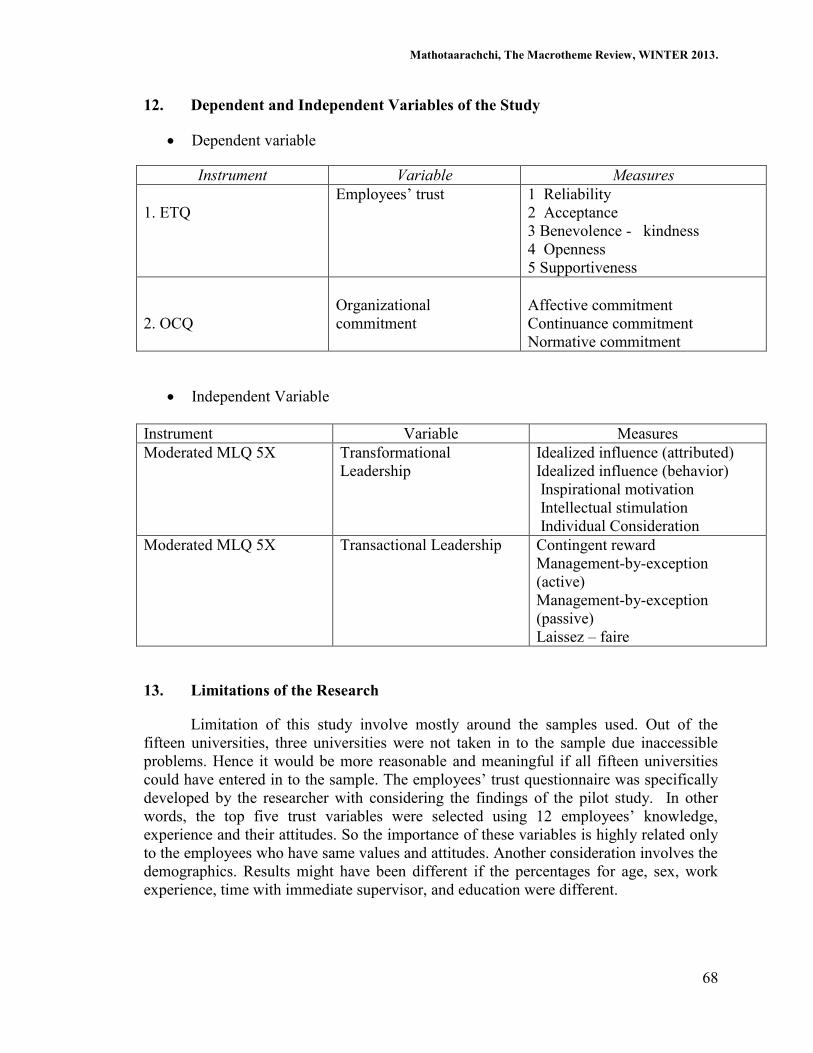
12. Dependent and Independent Variables of the Study
Dependent variable
Instrument Variable Measures
1. ETQ
Employees’ trust
1 Reliability
2 Acceptance
3 Benevolence - kindness
4 Openness
5 Supportiveness
2. OCQ
Organizational
commitment
Affective commitment
Continuance commitment
Normative commitment
Independent Variable
Instrument Variable Measures
Moderated MLQ 5X
Transformational
Leadership
Idealized influence (attributed)
Idealized influence (behavior)
Inspirational motivation
Intellectual stimulation
Individual Consideration
Moderated MLQ 5X
Transactional Leadership
Contingent reward
Management-by-exception
(active)
Management-by-exception
(passive)
Laissez – faire
13. Limitations of the Research
Limitation of this study involve mostly around the samples used. Out of the
fifteen universities, three universities were not taken in to the sample due inaccessible
problems. Hence it would be more reasonable and meaningful if all fifteen universities
could have entered in to the sample. The employees’ trust questionnaire was specifically
developed by the researcher with considering the findings of the pilot study. In other
words, the top five trust variables were selected using 12 employees’ knowledge,
experience and their attitudes. So the importance of these variables is highly related only
to the employees who have same values and attitudes. Another consideration involves the
demographics. Results might have been different if the percentages for age, sex, work
experience, time with immediate supervisor, and education were different.

Mathotaarachchi, The Macrotheme Review, WINTER 2013.
69
14. Research Findings
14.1 Sample Profile
The demographical data in several areas has been collected in this research.
Gender and Civil Status
Table 02 through provides gender and civil status for non teaching staff of the Sri
Lankan Universities. Accordingly, 194 (41.7%) were male and 271 (58.7) were female.
77% of the participants were marries while 23% were unmarried.
Table 02- Gender and Civil Status
Demographics Frequency Percent %
Valid Male 194 41.7
Female 271 58.3
Total 465 100.0
Valid Married 358 77.0
Unmarried 107 23.0
Total 465 100.0
Total Service Period of the Sample
The total service of the employees in the university sector varied, with 20.2%
having less than five years service period and 20.6% having more than 25 years (table
02).
Table 03- Total Service Period of the Employees
Service period
(years) Frequency Percent %
Valid >5 94 20.2
6 - 10 79 17.0
11 - 15 74 15.9
16 - 20 53 11.4
21 - 25 69 14.8
<25 96 20.6
Total 465 100.0

Mathotaarachchi, The Macrotheme Review, WINTER 2013.
70
Age and Educational Qualification of the Sample
According to the table 4, 94.7% of the employees, who were below 25 years, had
only Advance level or less qualifications. Only 5.3% had first degree. None of them were
capable of obtaining a post graduate degrees.75% of the employees, who were in 26 to 35
years of their age, still had only the Advance level or less qualifications while 24.1% had
their first degree. According to the research findings, 72.8% of the employees who were
in 46 – 55 years in their age had Advanced Level or below educational qualification,
while 24.3% had their first degree.
Table 04 Age * Educational Qualification of the Sample
Educational Qualification Total
Description
Advanced Level
and Below
First Degree
Post
Graduate
Degree
Age >25 Count 36 2 0 38
% within Age 94.7% 5.3% .0% 100.0%
26 - 35 Count 87 28 1 116
% within Age 75.0% 24.1% .9% 100.0%
36 - 45 Count 89 29 10 128
% within Age 69.5% 22.7% 7.8% 100.0%
46 - 55 Count 99 33 4 136
% within Age 72.8% 24.3% 2.9% 100.0%
<55 Count 28 19 0 47
% within Age 59.6% 40.4% .0% 100.0%
Total Count 339 111 15 465
% within Age 72.9% 23.9% 3.2% 100.0%

Mathotaarachchi, The Macrotheme Review, WINTER 2013.
71
Graph 01 - Age * Educational Qualification of the Sample
Age
<5546 - 5536 - 4526 - 35>25
Co
un
t120
100
80
60
40
20
0
Educational Qualific
Advanced Level and B
elow
First Degree
Post Graduate Degree
14.2 Descriptive Statistics for Leadership, Employees Trust and Organizational
Commitment
This research has utilized descriptive statistics as the way of examining the mean
and standard deviation of the surveyed data.
14.2.1 Descriptive Statistics for Transformational Leadership and
Transactional Leadership Variables
The overall score of research data for the transformational and transactional
variables were considerably comparable with what Bass & Avolio (1997) consider
“ideal” levels for effective leadership. Suggested scores for the most effective leaders
include a mean of 3.0 or higher for idealized influence (attributed), idealized influence
(behavior), inspirational motivation, and intellectual stimulation. Mean scores for sample
data ranged from 3.33 to 3.76. The suggested score for the contingent reward was 2.0, but
significantly lower than the sample data mean of 3.47. The score for management - by –
exception (active) was 2.36, this was again slightly higher with in the suggested range of
1.0 and 2.0 (table 5).

Mathotaarachchi, The Macrotheme Review, WINTER 2013.
72
Table 05 - Descriptive Statistics for Transformational Leadership and Transactional
Leadership Variables
Mean
Std.
Deviation
Idealized influence
(attributed) 3.54 .97
Idealized influence (behavior) 3.33 .79
Inspirational motivation 3.76 .93
Intellectual stimulation 3.51 1.23
Individual Consideration 2.72 .85
Contingent reward 3.47 .93
MGT-by-exception (active) 2.36 1.18
MGT-by-exception (passive) 2.31 1.04
Laissez – faire 1.97 .98
Five Transformational Variables: Idealized Influence (attributed), Idealized
Influence (behavior), Inspirational Motivation, Intellectual Stimulation, and Individual
Consideration. Four Transactional Variables: Contingent Reward, Management-by-
Exception (active), Management-by-Exception (passive) and Laissez-Faire Note: Each
subscale has 4 items except laissez faire which has 3 items and N=465.
14.2.2 Descriptive Statistics for Employees’ Trust Variables
Literature does not provide guidance about the standard measures for trust
variables. Although all of the facets of trust are important, their relative weight will
depend on the nature of the interdependence and vulnerability in the relationship. (Megan
Tschannen-Moran, Hoy, 2000). But for the purpose of this research the researcher
considered the mean value of 3 or higher as the sustainable or satisfactory trust level. The
findings of this study provided evidence about the employees’ trust level on their bosses.
Mean scores for survey data ranged from 3.07 to 3.36 (table 06).
Table 06 - Descriptive Statistics for Employees’ Trust Variables
Mean
Std.
Deviation
Reliability
3.07
.767
Acceptance 3.33 .985
Benevolence 3.36 .814
Openness 3.35 .832
Supportiveness 3.22 .861
Note: Each subscale has 2 items and N=465.

Mathotaarachchi, The Macrotheme Review, WINTER 2013.
73
14.2.3 Descriptive Statistics for Organizational Commitment Variables
Meyer & Allen (1997) do not provide guidance about expected, desired, average,
or ideal means for affective, continuance, and normative commitment of their
Organizational Commitment Questionnaire (OCQ) variables. According to the findings
of this research the, highest scores remarked for normative commitment (mean score =
3.11), followed by continuance commitment (mean score = 2.96), then affective
commitment (mean score = 2.82). The mean scores for this survey data reflects that
normative commitment scores were the highest compared with the other two.
Continuance commitment was again higher than the affective commitment (table 07).
Table 07 - Descriptive Statistics for Organizational Commitment Variables
Mean
Std.
Deviation
Affective
commitment 2.82 .420
Continuance
commitment 2.96 .579
Normative
commitment 3.11 .719
Note: Each variables has 6 items and N = 465
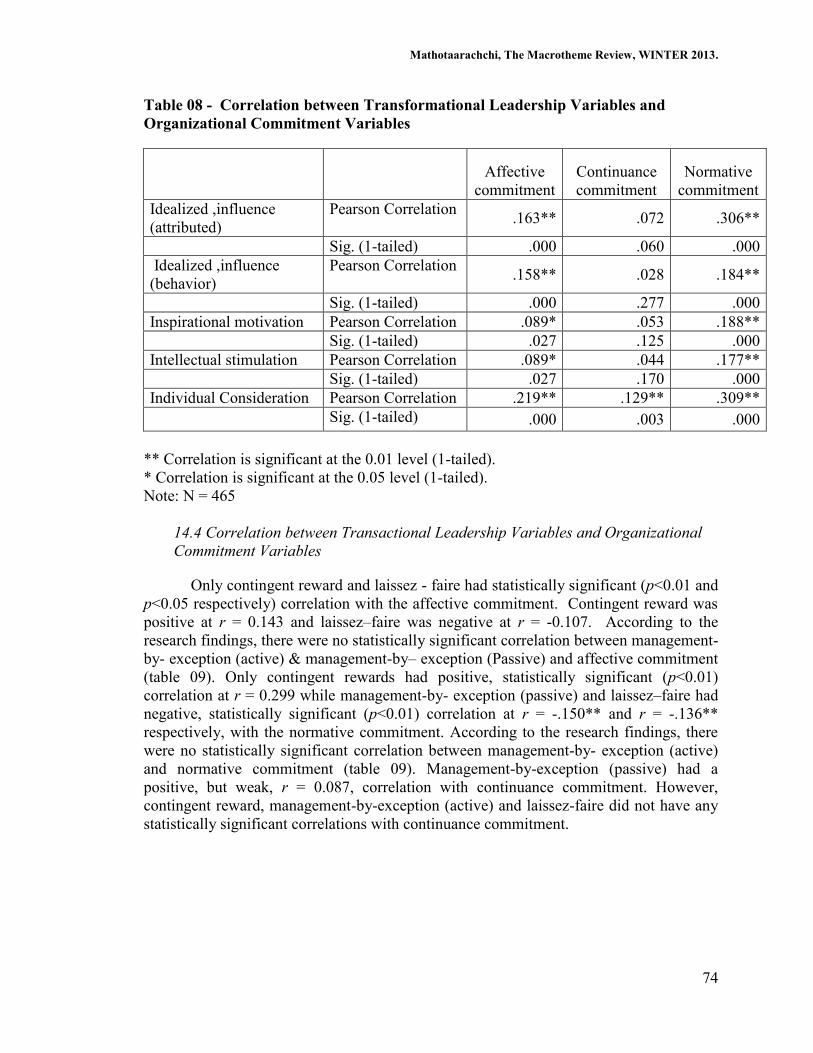
14.3 Correlation between Transformational Leadership Variables and
Organizational Commitment Variables
According to the findings of the research, three of the transformational leadership
variables had positive, statistically significant (p<0.01) correlations with affective
commitment while the other two variables have positive significant correlation at p =
0.05 level. These correlations were as follows: Idealized Influence (attributed) r = 0.163,
Idealized Influence (behavior) r = 0.158, Individual Consideration r = 0.219,
Inspirational Motivation r = 0.089, Intellectual Stimulation r = 0.089.
The transformational leadership variables also had positive, statistically
significant ((p<0.01) correlation with the normative commitment. These correlations
were remarked higher score compared with the affective commitment. Correlation
coefficient were:, Idealized Influence (attributed) r = 0.306, Idealized Influence
(behavior) r = 0.184, Individual Consideration r = 0.309 Inspirational Motivation r =
0.188, Intellectual Stimulation r = 0.177 (table 08)
Mathotaarachchi, The Macrotheme Review, WINTER 2013.
74
Table 08 - Correlation between Transformational Leadership Variables and
Organizational Commitment Variables
Affective
commitment
Continuance
commitment
Normative
commitment
Idealized ,influence
(attributed)
Pearson Correlation .163** .072 .306**
Sig. (1-tailed) .000 .060 .000
Idealized ,influence
(behavior)
Pearson Correlation .158** .028 .184**
Sig. (1-tailed) .000 .277 .000
Inspirational motivation Pearson Correlation .089* .053 .188**
Sig. (1-tailed) .027 .125 .000
Intellectual stimulation Pearson Correlation .089* .044 .177**
Sig. (1-tailed) .027 .170 .000
Individual Consideration Pearson Correlation .219** .129** .309**
Sig. (1-tailed) .000 .003 .000
** Correlation is significant at the 0.01 level (1-tailed).
* Correlation is significant at the 0.05 level (1-tailed).
Note: N = 465
14.4 Correlation between Transactional Leadership Variables and Organizational
Commitment Variables
Only contingent reward and laissez - faire had statistically significant (p<0.01 and
p<0.05 respectively) correlation with the affective commitment. Contingent reward was
positive at r = 0.143 and laissez–faire was negative at r = -0.107. According to the
research findings, there were no statistically significant correlation between management-
by- exception (active) & management-by– exception (Passive) and affective commitment
(table 09). Only contingent rewards had positive, statistically significant (p<0.01)
correlation at r = 0.299 while management-by- exception (passive) and laissez–faire had
negative, statistically significant (p<0.01) correlation at r = -.150** and r = -.136**
respectively, with the normative commitment. According to the research findings, there
were no statistically significant correlation between management-by- exception (active)
and normative commitment (table 09). Management-by-exception (passive) had a
positive, but weak, r = 0.087, correlation with continuance commitment. However,
contingent reward, management-by-exception (active) and laissez-faire did not have any
statistically significant correlations with continuance commitment.

Mathotaarachchi, The Macrotheme Review, WINTER 2013.
75
Table 09 - Correlation between Transactional Leadership Variables and
Organizational Commitment Variables
Affective
commitment
Continuance
commitment
Normative
commitme
nt
Contingent reward Pearson Correlation .143** .063 .299**
Sig. (1-tailed) .001 .088 .000
MGT-by-exception (active) Pearson Correlation .057 .041 .028
Sig. (1-tailed) .111 .189 .276
MGT-by-exception (passive) Pearson Correlation .035 .087* -.150**
Sig. (1-tailed) .228 .031 .001
Laissez – faire Pearson Correlation -.107* .028 -.136**
Sig. (1-tailed) .011 .270 .002
* Correlation is significant at the 0.05 level (1-tailed).
** Correlation is significant at the 0.01 level (1-tailed).
Note: N = 465
The above description, related to the table 08 and table 09 gives clear answer for
the research question no.01 i.e. what are the relationships between transformational and
transactional leadership variables and organizational commitment variables?
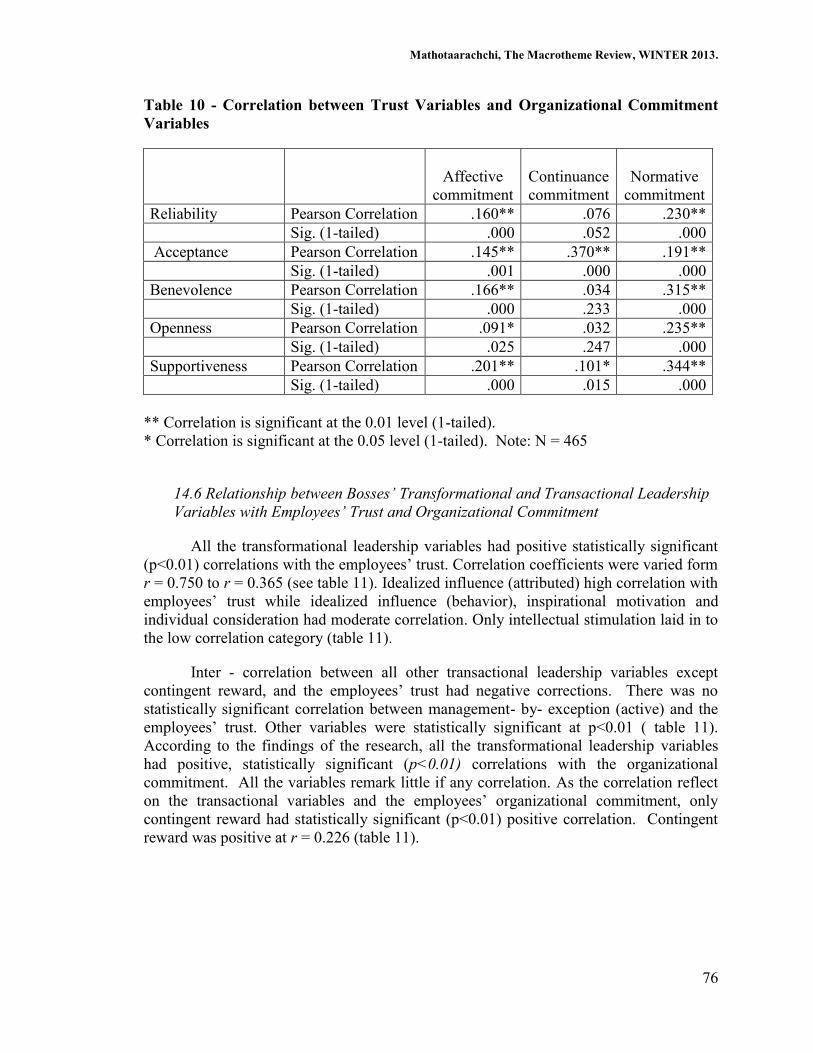
14.5 Correlation between Trust Variables and Organizational Commitment
Variables
The data in the table 10 provides answer for the research question no.2 i.e. What
are the relationships between employees trust variables and organizational commitment
variables? According to the table 10, affective commitment had positive, statistically
significant (p<0.01 & p<0.05) correlation with all subscales of employees trust.
Correlation coefficients for reliability, acceptance, benevolence, openness and
supportiveness were: r = 0.160, r = 0.145, r = 0.166, r = 0.091 and r = 0.201 respectively.
This meant that the correlation was very little.
Acceptance and supportiveness had positively, statistically significant (p<0.01 &
p<0.05 respectively) correlation with continuous commitment. However, reliability,
benevolence and openness did not have any statistically significant correlations with
continuance commitment. But all the trust subscales were positively, (statistically
significant, at p<0.01) correlated with normative commitment. Correlation coefficients
for reliability, acceptance, benevolence, openness and supportiveness were: r = 0.230, r =
0.191, r = 0.315, r = 0.235 and r = 0.344 respectively.
Mathotaarachchi, The Macrotheme Review, WINTER 2013.
76
Table 10 - Correlation between Trust Variables and Organizational Commitment
Variables
Affective
commitment
Continuance
commitment
Normative
commitment
Reliability Pearson Correlation .160** .076 .230**
Sig. (1-tailed) .000 .052 .000
Acceptance Pearson Correlation .145** .370** .191**
Sig. (1-tailed) .001 .000 .000
Benevolence Pearson Correlation .166** .034 .315**
Sig. (1-tailed) .000 .233 .000
Openness Pearson Correlation .091* .032 .235**
Sig. (1-tailed) .025 .247 .000
Supportiveness Pearson Correlation .201** .101* .344**
Sig. (1-tailed) .000 .015 .000
** Correlation is significant at the 0.01 level (1-tailed).
* Correlation is significant at the 0.05 level (1-tailed). Note: N = 465
14.6 Relationship between Bosses’ Transformational and Transactional Leadership
Variables with Employees’ Trust and Organizational Commitment
All the transformational leadership variables had positive statistically significant
(p<0.01) correlations with the employees’ trust. Correlation coefficients were varied form
r = 0.750 to r = 0.365 (see table 11). Idealized influence (attributed) high correlation with
employees’ trust while idealized influence (behavior), inspirational motivation and
individual consideration had moderate correlation. Only intellectual stimulation laid in to
the low correlation category (table 11).
Inter - correlation between all other transactional leadership variables except
contingent reward, and the employees’ trust had negative corrections. There was no
statistically significant correlation between management- by- exception (active) and the
employees’ trust. Other variables were statistically significant at p<0.01 ( table 11).
According to the findings of the research, all the transformational leadership variables
had positive, statistically significant (p<0.01) correlations with the organizational
commitment. All the variables remark little if any correlation. As the correlation reflect
on the transactional variables and the employees’ organizational commitment, only
contingent reward had statistically significant (p<0.01) positive correlation. Contingent
reward was positive at r = 0.226 (table 11).

Mathotaarachchi, The Macrotheme Review, WINTER 2013.
77
Table 11 - Correlation between Leadership Variables, Employees’ Trust and
Organizational Commitment
Leadership
Employees'
trust
organizational
Commitment
Idealized influence (attributed) Pearson Correlation .750** .245**
Sig. (1-tailed) .000 .000
Idealized influence (behavior) Pearson Correlation .501** .158**
Sig. (1-tailed) .000 .001
Inspirational motivation Pearson Correlation .663** .149**
Sig. (1-tailed) .000 .001
Intellectual stimulation Pearson Correlation .365** .139**
Sig. (1-tailed) .000 .003
Individual Consideration Pearson Correlation .601** .287**
Sig. (1-tailed) .000 .000
Contingent reward Pearson Correlation .672** .226**
Sig. (1-tailed) .000 .000
MGT-by- exception (active) Pearson Correlation -.071 .049
Sig. (1-tailed) .125 .294
MGT-by- exception (passive) Pearson Correlation -.460** -.036
Sig. (1-tailed) .000 .442
Laissez – faire Pearson Correlation -.561** -.089
Sig. (1-tailed) .000 .055
** Correlation is significant at the 0.01 level (1-tailed). N = 465
* Correlation is significant at the 0.05 level (1-tailed)
14.7 Relationship between Bosses’ Transformational and Transactional Leadership
Behaviors and Employees’ Trust
Transformational leadership had positive, statistically significant (p<0.01) correlations
with the employees’ trust. Correlation coefficients was r = 0.704 but transactional leadership
negative but still statistically significant (p<0.01) correlation with employees’ trust. Correlation
coefficient was r = -0.163. It was noted that the correlation between total leadership and the
employees’ trust was r = 0.556 which means positive, statistically significant (p<0.01)
relationship (table 12).
The research question was: “What is the Relationship between Bosses’ Transformational
and Transactional Leadership Behaviors and Employees’ Trust?” According to the table 12 there
was positive and statistically significant correlation between transformational leadership and the
employees’ trust while the transactional leadership had statistically significant, negative
correlation.
Mathotaarachchi, The Macrotheme Review, WINTER 2013.
78
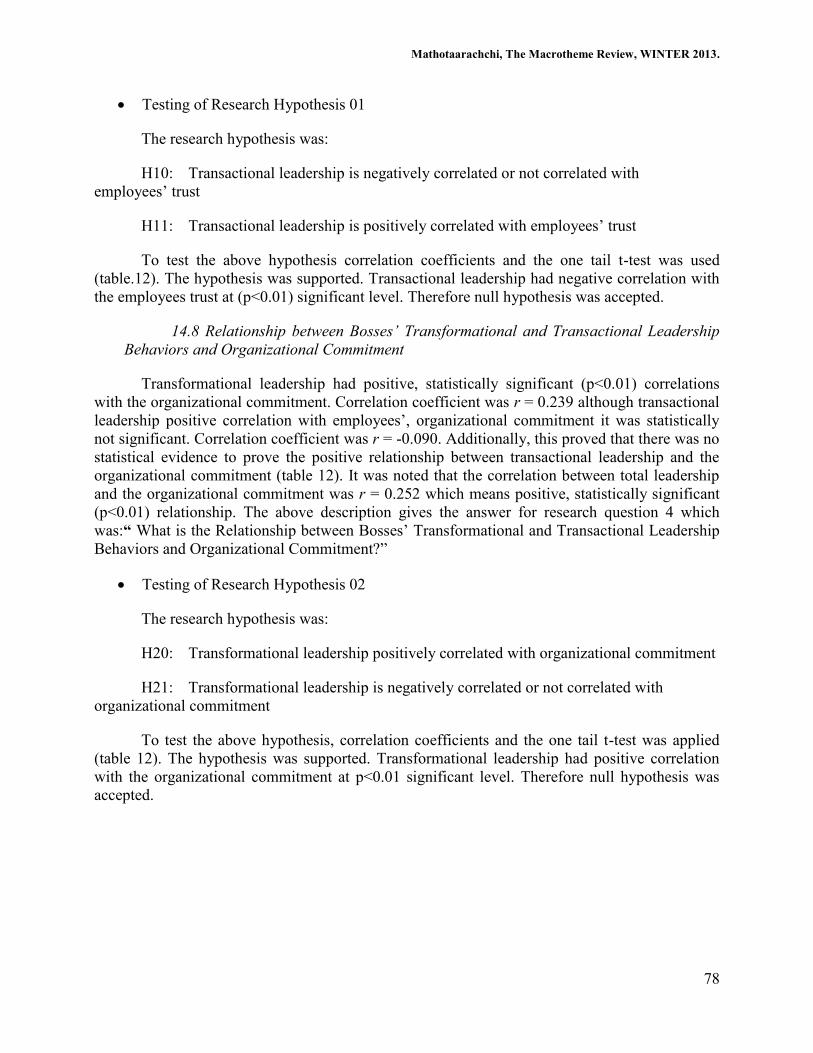
Testing of Research Hypothesis 01
The research hypothesis was:
H10: Transactional leadership is negatively correlated or not correlated with
employees’ trust
H11: Transactional leadership is positively correlated with employees’ trust
To test the above hypothesis correlation coefficients and the one tail t-test was used
(table.12). The hypothesis was supported. Transactional leadership had negative correlation with
the employees trust at (p<0.01) significant level. Therefore null hypothesis was accepted.
14.8 Relationship between Bosses’ Transformational and Transactional Leadership
Behaviors and Organizational Commitment
Transformational leadership had positive, statistically significant (p<0.01) correlations
with the organizational commitment. Correlation coefficient was r = 0.239 although transactional
leadership positive correlation with employees’, organizational commitment it was statistically
not significant. Correlation coefficient was r = -0.090. Additionally, this proved that there was no
statistical evidence to prove the positive relationship between transactional leadership and the
organizational commitment (table 12). It was noted that the correlation between total leadership
and the organizational commitment was r = 0.252 which means positive, statistically significant
(p<0.01) relationship. The above description gives the answer for research question 4 which
was:“ What is the Relationship between Bosses’ Transformational and Transactional Leadership
Behaviors and Organizational Commitment?”
Testing of Research Hypothesis 02
The research hypothesis was:
H20: Transformational leadership positively correlated with organizational commitment
H21: Transformational leadership is negatively correlated or not correlated with
organizational commitment
To test the above hypothesis, correlation coefficients and the one tail t-test was applied
(table 12). The hypothesis was supported. Transformational leadership had positive correlation
with the organizational commitment at p<0.01 significant level. Therefore null hypothesis was
accepted.

Mathotaarachchi, The Macrotheme Review, WINTER 2013.
79
Table 12 - Correlation between Transformational & Transactional Leadership Behaviors
and Employees’ Trust and Organizational Commitment
Employees'
trust
Employees'
commitment
Transformational
leadership
Pearson Correlation .704** .239**
Sig. (1-tailed) .000 .000
Transactional
leadership
Pearson Correlation -.163** .090*
Sig. (1-tailed) .000 .026
Leadership Pearson Correlation .556** .252**
Sig. (1-tailed) .000 .000
** Correlation is significant at the 0.01 level (1-tailed).
* Correlation is significant at the 0.05 level (1-tailed).
N = 465
Correlati
14.09 The Significant Predictors of Employees’ Trust among the Leadership Variables
According to the Table 14, not only transformational leadership variables but also some of
the transactional leadership variables had significantly positive correlation with the employees’
trust. So the stepwise multiple regressions were used to determine which of the nine leadership
variables had the greatest impact on employees’ trust. Out of nine, seven leadership variables
were identified as predictable variables while other two variables were excluded from the model.
The multiple regression coefficient (R) was 0.80. The best predictors of scores for the dependent
variable "employees’ trust” was "idealized influence (attribute), inspirational motivation,
individual consideration, laissez - faire, management -by-exception (passive), contingent
reward, and intellectual stimulation ( table 14). Further Stepwise multiple regressions found that
idealized influence (behavior) and management- by- exception (active) as non predicting
variables of employees’ trust. The adjusted R square value of model 7 is 0.635. This means that
the seven leadership variables in model 7 can predict the employees’ trust by 63.5%.

Mathotaarachchi, The Macrotheme Review, WINTER 2013.
80
Table 13 - Model Summary of Stepwise Multiple Regression Analysis of Leadership
Variables on Employees’ Trust
Mode
l R R Square
Adjusted R
Square
Std. Error of the
Estimate
1 .750(a) .562 .562 .451
2 .771(b) .594 .592 .434
3 .781(c) .610 .607 .426
4 .791(d) .625 .622 .418
5 .795(e) .632 .628 .415
6 .798(f) .637 .633 .412
7 .800(g) .641 .635 .411
a Predictors: (Constant), Idealized Influence (Attribute),
b Predictors: (Constant), Idealized Influence (Attribute),, Inspirational Motivation
c Predictors: (Constant), Idealized Influence (Attribute),, Inspirational Motivation, Individual
Consideration
d Predictors: (Constant), Idealized Influence (Attribute), Inspirational Motivation, Individual
Consideration, Laissez - Faire
e Predictors: (Constant), Idealized Influence (Attribute), Inspirational Motivation, Individual
Consideration, Laissez - Faire, Management -by- Exception (Passive)
f Predictors: (Constant), Idealized Influence (Attribute), Inspirational Motivation, Individual
Consideration, Laissez - Faire, Management -by-Exception (Passive), and Contingent Reward
g Predictors: (Constant), Idealized Influence (Attribute), Inspirational Motivation, Individual
Consideration, Laissez - Faire, Management -by-Exception (Passive), Contingent Reward, and
Intellectual Stimulation
Variables used in each step of the analysis were shown below in the table 15. It consisted
with seven models. The t-test statistic (t) for each component of the model is given in the t
column of the coefficients table. The p-value (Sig) for each components of the model is given in
the Sig column. The column on the table headed Beta gives more information about the relative
importance of the variables. The co-efficient of the final regression model are given in the B
column of the un-standardized Coefficients. According to the table 15 un-standardized
coefficient of predictors, except laissez – faire and intellectual stimulation, all other variables
were positively related to the employees’ trust. A stepwise multiple regression analysis revealed
that idealized influence (attribute) was highly significant predictor of employees’ trust. It also
discovered that the largest beta weight also has the largest correlation with the dependent
variable. The above description also addressed the research question no 06which was; “What
is/are the Significant Predictor/s of Employees Trust among the Leadership Variables?”

Mathotaarachchi, The Macrotheme Review, WINTER 2013.
81
Table 15 - Coefficients of Stepwise Multiple Regression Analysis of Leadership Variables on
Employees’ Trust
Model
Un-standardized
Coefficients
Standardized
Coefficients t Sig.
B
Std.
Error Beta
1 (Constant) 1.410 .079 17.860 .000
Idealized Influence (Attribute), .523 .021 .750 24.371 .000
2 (Constant) 1.165 .086 13.491 .000
Idealized Influence (Attribute), .395 .030 .566 13.249 .000
Inspirational Motivation .187 .031 .256 6.004 .000
3 (Constant) 1.117 .086 13.054 .000
Idealized Influence (Attribute), .355 .031 .509 11.579 .000
Inspirational Motivation .140 .032 .192 4.307 .000
Individual Consideration .134 .031 .168 4.272 .000
4 (Constant) 1.602 .139 11.504 .000
Idealized Influence (Attribute), .300 .033 .430 9.185 .000
Inspirational Motivation .106 .033 .146 3.244 .001
Individual Consideration .154 .031 .193 4.958 .000
Mean -Laissez - Faire -.111 .025 -.161 -4.367 .000
5 (Constant) 1.379 .159 8.657 .000
Idealized Influence (Attribute), .315 .033 .452 9.596 .000
Inspirational Motivation .123 .033 .169 3.724 .000
Individual Consideration .154 .031 .193 4.991 .000
Laissez - Faire -.144 .028 -.209 -5.184 .000
MGT-by- Exception (Passive) .075 .026 .114 2.830 .005
6 (Constant) 1.225 .169 7.267 .000
Idealized Influence (Attribute), .290 .034 .416 8.536 .000
Inspirational Motivation .102 .034 .140 3.030 .003
Individual Consideration .131 .032 .163 4.089 .000
Laissez - Faire -.133 .028 -.194 -4.770 .000
MGT-by- Exception (Passive) .088 .027 .135 3.314 .001
Contingent Reward .096 .036 .131 2.646 .008
7 (Constant) 1.198 .168 7.109 .000
Idealized Influence (Attribute), .298 .034 .427 8.737 .000
Inspirational Motivation .113 .034 .155 3.317 .001
Individual Consideration .133 .032 .166 4.174 .000
Laissez - Faire -.125 .028 -.182 -4.457 .000
MGT-by- Exception (Passive) .092 .027 .140 3.434 .001
Contingent Reward .116 .037 .158 3.105 .002
Intellectual Stimulation -.039 .019 -.071 -2.063 .040
a Dependent Variable: Mean - Employees' trust
Mathotaarachchi, The Macrotheme Review, WINTER 2013.
82
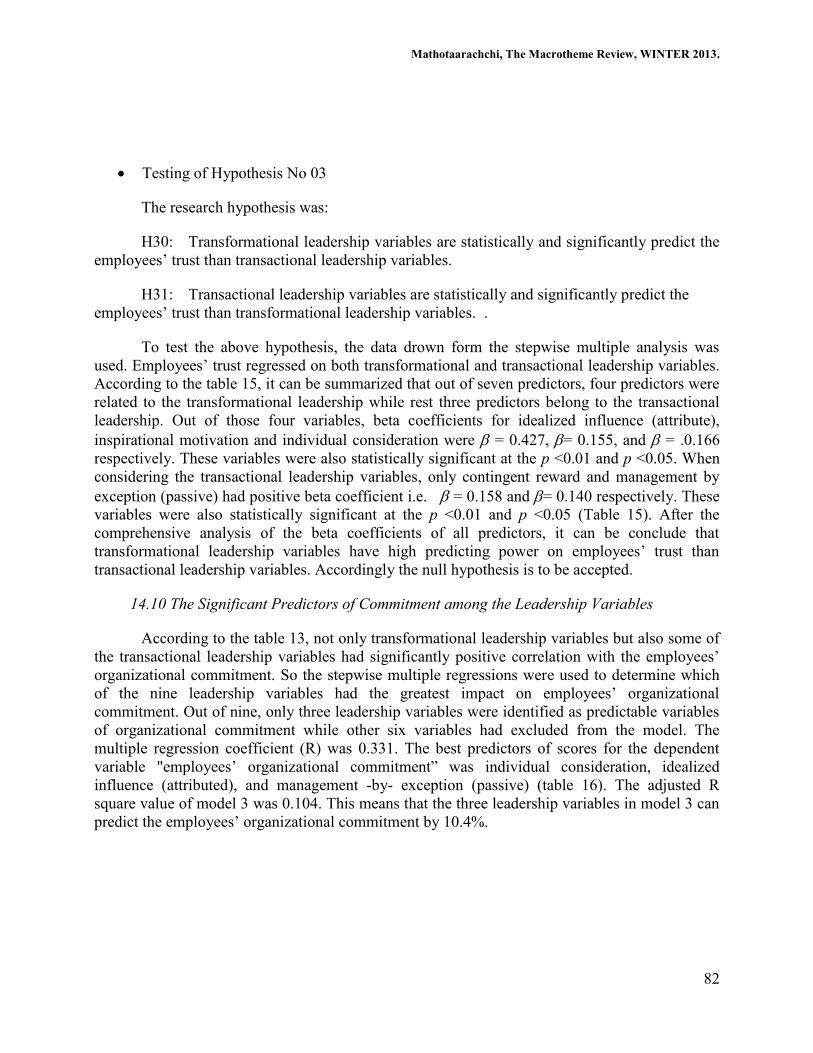
Testing of Hypothesis No 03
The research hypothesis was:
H30: Transformational leadership variables are statistically and significantly predict the
employees’ trust than transactional leadership variables.
H31: Transactional leadership variables are statistically and significantly predict the
employees’ trust than transformational leadership variables. .
To test the above hypothesis, the data drown form the stepwise multiple analysis was
used. Employees’ trust regressed on both transformational and transactional leadership variables.
According to the table 15, it can be summarized that out of seven predictors, four predictors were
related to the transformational leadership while rest three predictors belong to the transactional
leadership. Out of those four variables, beta coefficients for idealized influence (attribute),
inspirational motivation and individual consideration were = 0.427, = 0.155, and = .0.166
respectively. These variables were also statistically significant at the p <0.01 and p <0.05. When
considering the transactional leadership variables, only contingent reward and management by
exception (passive) had positive beta coefficient i.e. = 0.158 and = 0.140 respectively. These
variables were also statistically significant at the p <0.01 and p <0.05 (Table 15). After the
comprehensive analysis of the beta coefficients of all predictors, it can be conclude that
transformational leadership variables have high predicting power on employees’ trust than
transactional leadership variables. Accordingly the null hypothesis is to be accepted.
14.10 The Significant Predictors of Commitment among the Leadership Variables
According to the table 13, not only transformational leadership variables but also some of
the transactional leadership variables had significantly positive correlation with the employees’
organizational commitment. So the stepwise multiple regressions were used to determine which
of the nine leadership variables had the greatest impact on employees’ organizational
commitment. Out of nine, only three leadership variables were identified as predictable variables
of organizational commitment while other six variables had excluded from the model. The
multiple regression coefficient (R) was 0.331. The best predictors of scores for the dependent
variable "employees’ organizational commitment” was individual consideration, idealized
influence (attributed), and management -by- exception (passive) (table 16). The adjusted R
square value of model 3 was 0.104. This means that the three leadership variables in model 3 can
predict the employees’ organizational commitment by 10.4%.

Mathotaarachchi, The Macrotheme Review, WINTER 2013.
83
Table 16 - Model Summary of Stepwise Multiple Regression Analysis of Leadership
Variables on Employees’ Organizational Commitment
Mode
l R R Square
Adjusted
R Square
Std. Error
of the
Estimate
1 .287(a) .082 .080 .418
2 .300(b) .090 .086 .417
3 .331(c) .110 .104 .413
a Predictors: (Constant), Individual Consideration
b Predictors: (Constant), Individual Consideration, Idealized influence (attributed)
c Predictors: (Constant), Individual Consideration, Idealized influence (attributed) ,
Management -by- exception (passive)
Variables used in each step of the analysis were shown below the table 17. It consisted
with three models. The t-test statistic (t) for each component of the model is given in the t
column of the coefficients table. The p-value (Sig) for each components of the model is given
in the ‘Sig’ column. The column on the table headed Beta gives more information about the
relative importance of the variables. The co-efficient of the final regression model are given in
the B column of the unstandardized coefficients. According to the table 17 un-standardized
coefficient of predictors were positively related to the employees’ organizational commitment.
The above description also addressed the research question no 07 which was: “What is/are the
Significant Predictor of Organizational Commitment among the Leadership Variables?”

Mathotaarachchi, The Macrotheme Review, WINTER 2013.
84
Table 17 - Coefficients of Stepwise Multiple Regression Analysis of Leadership Variables on
Employees’ Organizational Commitment
Model
Unstandardized
Coefficients
Standardized
Coefficients t Sig.
B
Std.
Error Beta
1 (Constant) 2.561 .065 39.315 .000
Individual
Consideration .147 .023 .287 6.439 .000
2 (Constant) 2.480 .077 32.280 .000
Individual
Consideration .112 .029 .218 3.879 .000
Idealized influence
(attributed) .050 .025 .112 1.982 .048
3 (Constant) 2.145 .130 16.556 .000
Individual
Consideration .114 .029 .223 4.005 .000
Idealized influence
(attributed) .095 .029 .212 3.313 .001
Management -by-
exception (passive) .073 .023 .174 3.192 .002
a Dependent Variable: Employees' Commitment
Hypothesis Testing No.04
The research hypothesis was:
H40: Out of the transformational leadership five variables, idealized influence (attribute)
or charisma will have the largest impact on employees’ affective commitment
H41: Out of the five transformational leadership variables, idealized influence (attribute)
or charisma will not have the largest impact on employees’ affective commitment
To test the above hypothesis, multiple regression analysis was run entering the
transformational leadership variables according to stepwise procedures. Individual consideration
was the only variable that had a positive, significant R square increment (see table 18). Other four
variables were excluded from the model.

Mathotaarachchi, The Macrotheme Review, WINTER 2013.
85
Table 18 - Model Summary of Stepwise Multiple Regression Analysis of Transformational
Leadership Variables on Affective Commitment
Mode
l R R Square
Adjusted
R Square
Std. Error
of the
Estimate
1 .219(a) .048 .046 .411
a Predictors: (Constant), Individual Consideration
The standardized beta coefficient for individual consideration was 0.219 which was
statistically significant at p<0.01. Furthermore it can be concluded that idealized influence
(attributed) idealized influence (behavior), inspirational motivation, and intellectual stimulation
were not consider as the predictors of the employees’ organizational commitment. Therefore
hypothesis no. 5 was not supported.
Table 19 - Coefficients of Stepwise Multiple Regression Analysis of Leadership Variables
on Employees’ Affective Commitment
Model
Unstandardized
Coefficients
Standardized
Coefficients
t Sig. B
Std.
Error Beta
1 (Constant) 2.524 .064 39.476 .000
Individual
Considerat
ion
.108 .022 .219 4.824 .000
a Dependent Variable: Affective commitment
15. Conclusions
For the purpose of this study, the non academic staff of the universities was categorized as
staff grade, clerical & allied grade and technical grade. The average non academic employees
were female. Majority of the sample employees were married. When considering about the
service period, less than five years and more than twenty five years had remarkable percentage
compared to the other categories. Majority of the sample employees were 45-55 in their age
followed by 26-35 years. Considerable percentage of the sample employees had acquired only
their ordinary level or advanced level educational qualifications. It was also observed that
majority of the employees’ bossed were male. When compared with the ideal score as
recommended by Bass and Avolio (1997) the mean value for all nine leadership variables were
stated in a greater level. This behavior of scores for this survey data suggests that some
employees perceived their immediate supervisors as exhibiting the “ideal” levels of relations-

Mathotaarachchi, The Macrotheme Review, WINTER 2013.
86
oriented leadership behaviors. These behaviors included creating trust, inspiring a shared vision,
generating enthusiasm, encouraging creativity, and providing coaching. The mean for contingent
reward suggests that some employees perceived their immediate supervisors as doing an above
average job of clarifying expectations and recognizing accomplishments. This was also the case
for the management-by-exception (active) mean, which implies that some employees perceived
their immediate supervisors as taking corrective action in a timely manner. Mean scores for
management-by-exception (passive) and laissez-faire suggests some employees perceived that
their immediate supervisors tended to wait too long before resolving a problem or taking
corrective action.
Literature does not provide guidance about the standard measures for trust variables.
Although all of the facets of trust are important, their relative weight will depend on the nature of
the interdependence and vulnerability in the relationship. (Megan Tschannen-Moran, Wayne K.
Hoy, 2000). When compared to the ideal score suggested by the researcher, the mean scores for
survey data remarked a higher value. This pattern of scores for survey data suggested that
majority of the employees’ have substantial/ satisfactory trust level on their immediate bosses.
These trust facets include the greater extents of the predictability of the boss’s behavior, highly
believed that the boss really listen to them and feel safe in expressing conflicting views and they
have confident that their bosses wish for their wellbeing , protection, and treated kindly. Mean
score of the openness and supportiveness suggested that a number of employees trust their boss
explore the relevant information and give his hand to solve the problems. However the mean
score surveyed data reflects that there are marginal differences among Reliability, acceptance,
benevolence, openness and supportiveness
Meyer & Allen (1991) do not provide guidance about expected, desired, average, or ideal
means for affective, continuance, and normative commitment of their Organizational
Commitment Questionnaire (OCQ) sub scales. The mean scores for this survey data reflects that
normative commitment scores were the highest compared with the other two. Continuance
commitment was again higher than the affective commitment. This behavior of scores for this
survey data suggests that employees’ feeling of obligation to the organization is very strong. It
means that the employees with high levels of normative commitment stay with the organization
because they feel they ought to. Over again commitment of the employees’ emotional attachment,
identification with, and involvement in the organization is less than employees’ who assessment
of whether the costs of leaving the organization are greater than the costs of staying.
These findings suggested that there is a positive although not a very strong relationship
between the transformational leadership variables and both effective and normative
commitments. For normative commitment, this suggests that leadership behaviors which involve
building trust, inspiring a shared vision, encouraging creativity, emphasizing development, and
recognizing accomplishments is somewhat positively related to how employees feel about their
obligation to stay with the university. For the affective commitment, the research findings
suggest that transformational leadership behavior was somewhat positively related how
employees feel about wanting stay with the university system.
As for the lack of statistically significant correlations between the transformational
leadership subscales and continuance commitment, this finding suggests that transformational
leadership behaviors may not be related to how employees feel about having to stay with the
Mathotaarachchi, The Macrotheme Review, WINTER 2013.
87
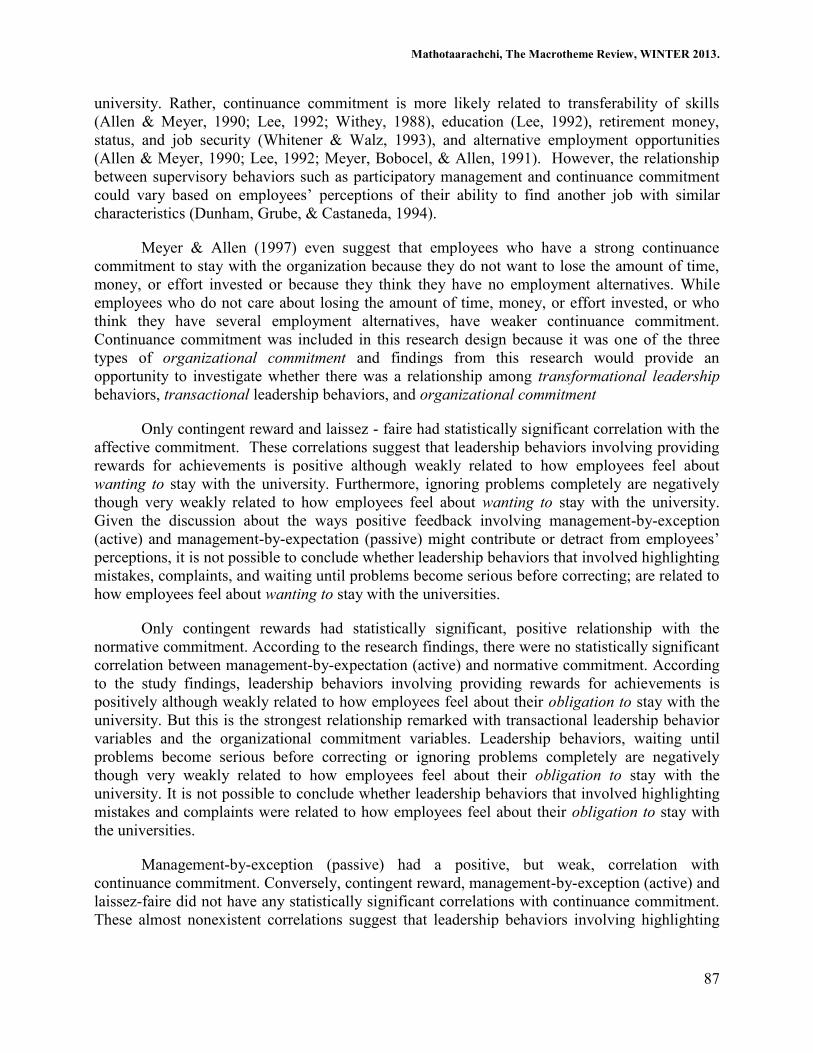
university. Rather, continuance commitment is more likely related to transferability of skills
(Allen & Meyer, 1990; Lee, 1992; Withey, 1988), education (Lee, 1992), retirement money,
status, and job security (Whitener & Walz, 1993), and alternative employment opportunities
(Allen & Meyer, 1990; Lee, 1992; Meyer, Bobocel, & Allen, 1991). However, the relationship
between supervisory behaviors such as participatory management and continuance commitment
could vary based on employees’ perceptions of their ability to find another job with similar
characteristics (Dunham, Grube, & Castaneda, 1994).
Meyer & Allen (1997) even suggest that employees who have a strong continuance
commitment to stay with the organization because they do not want to lose the amount of time,
money, or effort invested or because they think they have no employment alternatives. While
employees who do not care about losing the amount of time, money, or effort invested, or who
think they have several employment alternatives, have weaker continuance commitment.
Continuance commitment was included in this research design because it was one of the three
types of organizational commitment and findings from this research would provide an
opportunity to investigate whether there was a relationship among transformational leadership
behaviors, transactional leadership behaviors, and organizational commitment
Only contingent reward and laissez - faire had statistically significant correlation with the
affective commitment. These correlations suggest that leadership behaviors involving providing
rewards for achievements is positive although weakly related to how employees feel about
wanting to stay with the university. Furthermore, ignoring problems completely are negatively
though very weakly related to how employees feel about wanting to stay with the university.
Given the discussion about the ways positive feedback involving management-by-exception
(active) and management-by-expectation (passive) might contribute or detract from employees’
perceptions, it is not possible to conclude whether leadership behaviors that involved highlighting
mistakes, complaints, and waiting until problems become serious before correcting; are related to
how employees feel about wanting to stay with the universities.
Only contingent rewards had statistically significant, positive relationship with the
normative commitment. According to the research findings, there were no statistically significant
correlation between management-by-expectation (active) and normative commitment. According
to the study findings, leadership behaviors involving providing rewards for achievements is
positively although weakly related to how employees feel about their obligation to stay with the
university. But this is the strongest relationship remarked with transactional leadership behavior
variables and the organizational commitment variables. Leadership behaviors, waiting until
problems become serious before correcting or ignoring problems completely are negatively
though very weakly related to how employees feel about their obligation to stay with the
university. It is not possible to conclude whether leadership behaviors that involved highlighting
mistakes and complaints were related to how employees feel about their obligation to stay with
the universities.
Management-by-exception (passive) had a positive, but weak, correlation with
continuance commitment. Conversely, contingent reward, management-by-exception (active) and
laissez-faire did not have any statistically significant correlations with continuance commitment.
These almost nonexistent correlations suggest that leadership behaviors involving highlighting

Mathotaarachchi, The Macrotheme Review, WINTER 2013.
88
problems, ignoring problems, or waiting for problems to become serious before taking action
may not be related to how employees feel about having to stay with the university.
These research findings are consistent with other research involving these transactional
leadership behaviors and organizational commitment. For instance, Bycio, Hackett, & Allen
(1995) reported that management-by-exception (passive and active) were negatively related to
both affective and normative commitment, however there was no statistically significant
relationship between management-by-exception (passive and active) and continuance
commitment. Mathieu & Zajac (1990) conducted a meta-analysis of 48 studies and found that
overall organizational commitment was low when employees were unsure about what was
expected of them (role ambiguity). In nine studies, Dunham, Grube, & Castaneda (1994) found
that employees understanding about the significance of their tasks were somewhat positively
related to affective commitment, but not related to normative or continuance commitment.
Several observations are possible regarding the findings for management-by exception (active).
This subscale had not statistically significant correlations with affective, normative and
continuance commitment and the relationships were almost meaningless. As such, the pattern of
relationships that management-by exception (active) had with the three organizational
commitment scales is similar to the pattern that existed with the transformational subscales
except individual consideration (which had statistically significant, positive but very weaker
relationship). Lastly, given the discussion about feedback with regards to management-by-
exception (active), it is not possible to conclude whether this leadership behavior contributed to
or detracted from employees’ levels of affective, normative, or continuance commitment.
All the trust variables had positive, statistically significant correlation with the affective
and normative commitment. This finding suggests that the employees trust was positively related
to how employees feel about their obligation to stay with the university system. For the affective
commitment, the research findings suggest that employees trust was also positively related how
employees feel about wanting stay with the university system. However, for continuance
commitment only acceptance and supportiveness had statistically significant, positive
relationship while reliability, benevolence and openness had not provided any statistically
significance evidence for the above relationship.
The best predictors of the employees’ trust among the transformational and transactional
variables are Idealized influence (attribute), inspirational motivation, individual consideration,
Laissez - faire, Management -by-exception (passive), Contingent reward, and Intellectual
stimulation. Individual Consideration, Idealized influence (attributed) , Management -by-
expectation (passive) were the best predictors of employees’ organizational commitment.
16. Implications for investors
As demonstrated in the text, employees’ trusts on their bosses’ depend on the bosses’
leadership behavior and this study provides several theoretical and practical implications for
future transformational/ transactional leadership research and training. The following
implications can come up with the findings of this study.

Mathotaarachchi, The Macrotheme Review, WINTER 2013.
89
Use for Better Design of Transformational Leadership Training Program
Supervisors may enhance their leadership effectiveness and thus increase performance
among followers by understanding how transformational leaders motivate followers. By
enhancing the transformational leadership attributes, the organization can win the employees’
trust, to a greater extent.
Enhance the Employees’ Organizational Commitment, Motivation and Productivity
When the employees’ work in the trustful organizational culture, they generously behave
with an assurance. Trust influences the perception, behavior and performance outcomes. They
engage with their work without any fear. This work behavior reflects the employees’
commitment to the organization. Committed employee has positive impact on motivation as well
as the productivity.
Increasing the use of Work team with in the Organization
The increasing use of work teams makes the findings important for practice. According to
the findings of this research, transformational leader, who make an effort to build a better
relationship with his employees’, can increase the employees’ trust. The employees, who tend to
trust their boss, also have a propensity to trust their co-workers too. This situation leads to the
effective performance of the group work.
Promote Open Communication.
Practice an "open door" policy that permits all employees to share their concerns with
management. Regularly survey employees to obtain their input and respond to the survey's
findings
Behave in an ethical and socially responsible manner.
By taking the initiative to be a good corporate citizen, organizations demonstrate integrity
and caring.
Provide job security.
Layoffs breed distrust. We invest a certain amount of our careers, psychological identity,
and personal lives in the organizations that we work for. Such investment leaves us
vulnerable. It may be impossible or unwise for employers to offer employees lifetime
employment (tenured faculty notwithstanding). Nevertheless, reasonable efforts to ensure a
degree of job security will promote trust. For the sake of trust, organizations that need to reduce
their workforce should consider alternatives to layoffs even if they are more expensive.
Mathotaarachchi, The Macrotheme Review, WINTER 2013.
90
Howell and Avolio (1992) recommended the six actions to create employee oriented
(Transformational) leaders within the organization.
Those are,
1. Create Performance Standers that emphasize respect for people.
2. Show Commitment to a code of ethics that is continually enforced.
3. Recruit, select and promote only individuals with the highest moral
standards.
4. Train Leaders how to respect and integrate diverse viewpoints.
5. Train Leaders in ethical values and develop their skills in this area.
6. Identify as heroes or heroines individuals who show exemplary moral
conduct.
This strategy also proposed to apply for improve the relationship with employees.
17. Future Research Needs
Research should be conducted to develop an instrument that represents more appropriate
measures of transactional and transformational leadership behavior considering the employees
attitudes in Sri Lanka. The questions should be more related to the Sri Lankan culture so
employees will feel more familiar with concepts. Further I proposed that contingent rewards
which consider as a transactional leadership variable should come under the transformational
leadership variable. Additional research should be conducted to improve the relationship between
transformational and transactional leadership behavior on employees job satisfaction. It is indeed
to investigate the impact of employees trust on their job satisfaction in Sri Lankan organizations.
Lastly, additional research should be conducted to compare the public sector and the private
sector employees’ perception on their supervisors’ leadership behaviors, employees’ trust and
their organizational commitment.
REFERENCES
Anderson, D. (1974), Leadership Effectiveness in Education as Related to Congruence
Between Human Behavior Types and Leadership Styles. Journals of Dissertation Abstractions
International
Avolio B.J, Bass B.M., (1988), Transformational Leadership, Charisma and Beyond. In
Emerging Leadership Vista, Hunt JG, Balaga BR, Bachler HP, Schriesheim C (Eds). Pergamon
Press: Emsford, NY
Avolio, B.J., Bass B.M., (1995), Individual Consideration Viewed at Multiple Levels of
Analysis: A Multi-Level Framework for Examining the Diffusion of Transformational

Mathotaarachchi, The Macrotheme Review, WINTER 2013.
91
Leadership. Vol. 6, Journal of Leadership (Quarterly)
Baier, A. C., (1986), Trust and Antitrust. Vol. 96, Journal of Ethics
Bass B.M, Avolio B.J., (1993), Transformational Leadership: A Response to Critiques. In
Leadership Theory and Research: Perspectives and Directions, Chemers MM, Ayman R (Eds).
Academic Press: San Diego, CA;
Bass B.M, Avolio B.J., (1997), Full-Range of Leadership Development. Manual for the Multi-
Factor Leadership Questionnaire. Mind Garden: Palo Alto, CA.
Bass, B., (1990), Bass & Stodgill’s Handbook of Leadership. The Free Press, New York
Bass, B., (1990a), Bass & Stodgill’s Handbook of Leadership. The Free Press, New York
Bennis, W. And Nanus, B., (1985), Leaders: The Strategies for Taking Charge. New York, NY:
Burns JM., (1978), Leadership. Harper & Row: New York. NY.
Bycio, P., Hackett, R., & Allen, J., (1995), Further Assessment's of Bass's (1985)
Conceptualization of Transactional and Transformational Leadership. Vol. 80, Journal of Applied
Psychology
Cartwright, D., & Zander, A., (1960), Group Dynamics-Research and Theory. Evanston, IL:
Row, Peterson.
Chandan J.S., (2001), Organizational Behaviour. Vikas Publishing House (Pvt) Ltd, New Delhi
Cummings, L.L. & Bromily, P., (1996), “The Organizational Trust Inventory (OTI):
Development and Validation. In Kramer, R. and Tyler, T. (Eds.), Trust in Organizations, Sage
Publication, Thousand Oaks, CA:
Decotiis, T. & Summers, T., (1987), A Path Analysis of A Model of the Antecedents and
Consequences of Organizational Commitment. Vol. 40, Journal of Human Relations
Dirks, K. T., & Ferrin, D. L., ( 2002), The Role of Trust in Organizational Settings. Vol. no 12,
Journal of Organization Science
Fleishman, E., (1957), A Leader Behavior Description for Industry. In R. Stogdill & A. Coons
(Eds.), Leader Behavior: its Description and Measurement. Columbus, OH: Ohio State
University, Bureau of Business Research
Fleishman, E., (1957), A Leader Behavior Description for Industry. In R. Stogdill & A. Coons
(Eds.), Leader Behavior: Its Description and Measurement. Bureau of Business Research,
Columbus, OH: Ohio State University
Greenberg, J & Baron R.A., (2000), Behavior in Organization. Prentice Hall of Indian (Pvt)
Ltd. New Dilhi

Mathotaarachchi, The Macrotheme Review, WINTER 2013.
92
Hall, D. T. 1976. Careers in Organizations. Pacific Palisades, California: Goodyear.
Hemphill, J. (1950), Leader Behavior Description. Columbus, OH: Ohio State University,
Personnel Research Board.
Hosmer, L.T., (1995), Trust: The Connecting Link Between Organizational Theory and
Philosophical Ethics. Vol. 20(2), Journal of Academy of Management Review
Hoy, W. K., & Tschannen-Moran, M., (1999), Five Faces of Trust: An Empirical Confirmation
in Urban Elementary Schools. Vol. 9(3), Journal of School Leadership
Indvik, J., (1986), Path-Goal Theory of Leadership: a Meta-Analysis. Paper Presented at the
Academy of Management, Chicago, Ill.
Jermier, J. & Berkes, L., (1979), Leader Behavior in a Police Command Bureaucracy: A Closer
Look at the Quasi-Military Model. Vol. 24 (Quarterly), Journal of Administrative Science
Joseph, E.E. and Winston, B.E. (2005), A Correlation of Servant Leadership, Leader Trust, and
Organizational Trust. Vol. 26, Journal of Leadership and Organizational Development
Katz, D., Maccoby, N., & Morse, N., (1950), Productivity, Supervision, and Morale in an Office
Situation. Institute for Social Research, Ann Arbor, MI: University of Michigan
McAllister, D. J., (1995), Affect- and Cognition-based Trust as Foundations for Interpersonal
Cooperation in Organizations. Vol. 38, Journal of Academy of Managemer1
Meyer, J. P., & Allen, N. J., (1991), A Tree-Component Conceptualization of Organizational
Commitment. Vol.1, Journal of Human Resource Management Review
Mishra, A.K., (1996), Organizational Responses to Crisis: The Centrality of Trust. In R.Kramer,
& T. Tyler (Eds.), Trust in Organizations. Sage Publication, Thousand Oaks
Reddin, W., (1977), an Integration of Leader-Behavior Typologies. Vol. 2, Group and
Organization Studies