JANUARY 1940 SURVEY - U.S. Bureau of Economic ... FARM INCOME~ ~ i STEEL INGOTS WHOLESALE COMMODITY...
60
JANUARY 1940 SURVEY OF CURR NT I ESS UNITED STATES DEPART ENT OF CQ:M ERCE BUREAU OF FOREIGN AND DOMESTi( C(JMfv'\ERCE WASHINGTON VOLUME 20 'i J E t R 1
Transcript of JANUARY 1940 SURVEY - U.S. Bureau of Economic ... FARM INCOME~ ~ i STEEL INGOTS WHOLESALE COMMODITY...

JANUARY 1940
SURVEY OF
CURR NT I ESS
UNITED STATES DEPART ENT OF CQ:M ERCE BUREAU OF FOREIGN AND DOMESTi( C(JMfv'\ERCE
WASHINGTON VOLUME 20 'i J ,,~ E t R 1


Volume 20 Number 1
UNITED STATES DEPARTMENT OF COMMERCE HARRY L. HOPKINS, Secretary
BUREAU OF FOREIGN AND DOMESTIC COMMERCE JAMES W. YOUNG, Director
SURVEY OF CURRENT BUSINESS
JANUARY 1940
A publication of the
DIVISION OF BUSINESS REVIEW M. JOSEPH MEEHAN, Chief
MILTON GILBERT, Editor
TABLE OF SUMMARIES Page
Business situation summarized.................................... 3
SPECIAL ARTICLES
Recent trends in United States export trade....................... 6 Present position of the lumber industry........................... 12
CHARTS
Figure I.-Monthly business indicators, 1929-39.................... 2 Figure 2.-Industrial production, income and distribution, and
prices--percentage change November 1939 from November 1938... 4 Figure 3.-Value of United States exports of merchandise, and
imports for consumption, calendar years, 1937-39................ 6 Figure 4.-Va1ue of United States exports of merchandise by econ-
omic classes, calendar years, 1914, 1915, 1938, and 1939........... 7 Figure 5.-Value of total exports (including reexports) by geographic
areas, calendar years, 1914, 1915, 1938, and 1939.................. 7 Figure 6.-National income, total exports and net exports, calendar
years, 1913-19................................................... 9 Figure 7.-Value of total exports (including reexports) and general
imports, calendar years, 1910-39................................. 9 Fijl,ure 8.-Value of United States exports of merchandise and im
ports for consumption, by economic classes and total exports (including reexports) and general imports by geojl,raphic areas 1910-14, 1918, and 1935-39....................................... 10
CONTENTS CHARTs-continued Page
Figure 9.-Total lumber production, shipments and orders, by weeks, 1939..................................................... 12
Figure 10.-Softwood production, shipments and stocks, by quar-ters, 1925-39. . • . . . . • . . .. . . . . . . . . . . . . .. .. . • . . .. . . . . . . . . . . . . . • . • . • 13
Figure 11.-Total exports of hardwood and softwood lumber, 1910-39. 15 Figure 12.-Floor space of residential construction contracts award-
ed and consumption of lumber, by quarters, 1928-39............. 16
STATISTICAL DATA New or revised series:
Table I.-Average weekly hours per worker in factories and factory average hourly and weekly earnings (U. S. Depart-ment of Labor) 1932-39...................................... 17
Table 2.-Avera!!,e weekly hours per worker in factories and factory average hourly and weekly earnings (National In-dustrial Conference Board) 1934-39.......................... 18
Table 3.-Department store sales-San Francisco Federal Reserve District, unadjusted and adjusted, 1919-39........... 18
Table 4.-Department store sales--Cleveland Federal Reserve District, adjusted, 1929-39................................... 18
Table 5.-Department store sales-Minneapolis Federal Re-serve District, adjusted, 1934-39 •.•.•••....•.•.• ,',... . • . . . • . . 18
Monthly business statistics........................................ 19 General index ......................................... Inside back cover
Subscription price of the monthly and weekly issues of the SuRVEY OF CuRRENT BusiNESS is l\2 a year. Single-copy price: Monthly, 15 cents; weekly, 5 cento.
20034!)---40-1
Foreign subscriptiona,l\3.50. Price of the 1938 Supplement is 40 cents. Make remittancet only to Superintendent of Documents, Washington, D. C.
1

2
140
130
120
110
100
90
80
70
60
0
140
120
100
80
60
40
20
0
140
SURVEY OF CURRENT BUSINESS JAN1:7ARY 1940
Monthly Business Indicators, 1929-39 INDUSTRIAL PRODUCTION *
VOLUME (1923-25•100)
I 1\. I I ~ \! I
I }~! I I I
'(\ ( l J
\ ~ I /I\/ I
I \ V\ If\ IV 71 I I \) I ~~ v !Vl
I I
I I \~ I I
I v
I i
I I
I I 1929 1930 1931 1932 1933 1934 1935 1936 1937 193B 1939
CONSTRUCTION CONTRACTS AWARDED* • r' I
' I -+- --: --t--I I '
1929 1930 i931 1932 1933 1934 1935 1936 1937 1938 1939
FACTORY EMPLOYMENT AND PAYROLLS
INCOME PAYMENTS AND CASH FARM INCOME * r-----------------~--~----.---,---r--,120
MONTHLY INCOME PAYMENTS (1929•100) CASH FARM INCOME (1924-1929•100)
40
L-~--~~------~~--~--~~--~__Jo 1929 1930 1931 1932 1933 1934 1935 1936 1937 1938 1939
20
L-------------------~---L--~--~--L-~0 1929 1930 1931 1932 1933 1934 1935 1936 1937 1938 1939
WHOLESALE PRICES AND COST OF LIVING
OL-~ ______ L_ ______ L_~--~--~--L-~---r-~
1929 1930 1931 1932 1933 1934 1935 1936 1937 1938 1939
175
150
125
75
50
RETAIL SALES *
0 I
1929 1930 1931 1932 1933 1934 1935 1936 1937 1938 1939
"'ADJUSTED FOR SEASONAL VARIATION
STOCK PRICES r---------~---,------~--~--,-~------~ 350
( 192.3-25 •100) i I
300 ~ 350 INDUSTRIAL COMPANIES i · -· c ,_ : ~rl-t _ 250
200
I 150
·=ct~--:---\+-----.---- 50
~~-~~~~~~~~~~~~~-------0 1929 1930 1931 1932 1933 1934 1935 !936 1937 1938 1939
• THREE-MONTH MOVING AVERAGE
Figure 1.

JANUARY 1940 SURVEY OF CURRENT BUSINESS 3
Business Situation Summarized BUSINESS did not undergo marked change in De
cember from the position prevailing at the end of November, after allowance for the divergence in the usual seasonal movements between retail trade and industrial production. The very substantial rise in consumer purchasing power in recent months of expanded activity had assured the increase in retail sales over a year ago that was realized. The irregularity in store sales which developed over the November month-end was not significant, as higher pay rolls, larger farm income, and a year-end flow of dividends much in excess of that in 1938 brought trade through retail channels to a strong close for the year.
On the whole, industrial production was maintained at a high rate during the month. There were seasonal declines in some industries but in total the let-up was probably less than usual for December. Steel ingot production, which in the spectacular autumn rise reached the practical limits of capacity by the end of November, tended to decline as the volume of new orders fell to a figure more in line with current utilization. Pressure for delivery of steel has decreased following the announcement that prices for the first quarter of 1940 would be about the same as those listed for the past several months. By the third week of December the rate of ingot production was off to 90 percent of capacity, against 94 percent at the end of November. This recession is not indicative of a general decline since the rate of steel production was above the operating rate for the steel-consuming industries generally. The more highly fabricated lines of steel manufacture are not subject to such quick adjustments as those which characterize ingot production, and no signs of slackening activity have appeared among them as yet. In some of the metal industries incoming business remained comparatively high during November; e. g., orders received by metal trade concerns in Massachusetts were as large as in September, though well below the October volume. New orders in the other major industries reported for this State were much smaller in November than in September.
Activjty has been sustained in machine tool, aircraft, shipbuilding, and electrical equipment manufacturing. Automobile assemblies were stepped up in December as Chrysler plants again came into production. Total assemblies rose to about 440,000 units, the highest total since the middle of 1937. This represented a larger volume than retail sales plus exports, as stocking of dealers eontinued. Domestic retail sales of passenger cars in November amounted to 257,000 compared with 241,000 in November 1938.
Output of Consumers' Goods Maintained.
In the industries manufacturing consumers' goods, operations continued high in December. Some downward adjustments occurred, but these were neither large nor widespread. November figures show the extent to which the operations of these industries were pushed by the September-October buying. Output of cotton textile mills, already high in October, increased further in November. While some increase in the purchasing of textiles occurred in the middle of December, following the rise in raw cotton prices, the mills have been operating at a rate above the volume of incoming business for some time. WooJen mills in November also operated at a very high rate.
The extent of the rise over a year ago in a number of important areas of the economy is indicated by the comparisons presented in figure 2. The rise in durable goods manufactures-still relatively depressed toward the end of 1938-is outstanding, as is the increase of about one-fifth in the volume of freight moved. The general advance in production and distribution brought the rise in the national income payment total to 6 percent. The price data given show that price changes were not an important factor in the magnitude of the change in dollar figures, though actual and anticipated price movements did have an important influence on the volume of purchasing and sales during the final third of the year.
Estimates of the dollar sales of service and limited function wholesalers prepared by the Bureau of Foreign and Domestic Commerce show a sharply increased relative gain over 1938 in the final quarter of the year. Moderate advance in the first half gave way to a wider increase for the third quarter, but in the final 3 months sales ran well over 10 percent in excess of the final quarter of 1938 which was, it will be recalled, a period of improving trade. For the year 1939, the percentage increase in sales was 9 percent, the total rising from 19,023 million dollars in 1938 to 20,700 million dollars in 1939. The more important increases were in such lines as electrical goods, metals and metal work, lumber and construction material, jewelry and optical goods, machinery, automobiles, and furniture. Sales of food and farm products, which make up an important part of the total, showed only moderate increases as prices were generally lower throughout the year. Price changes were not a factor in the larger annual sales total for this group of merchants, since they averaged lower in 1939 than in 1938. It was not until the last quarter of the year that average wholesale prices moved higher than a year ago.

4 SURVEY OF CURRENT BUSINESS .JA:\T.\RY 1940
Income Payments Higher.
Reference to the chart on page 3 will revea.l the unusual rise in income payments that has occurred during the few months subsequent to the outbrea.k of war in Europe. The reaction in domestic markets to this event-superimposed as it was on a rising trend of domestic economic acdYity-brought a rise in the index of income payments to 88.8 in November (1929=100) from the August figure of 85.4. The advance in this index of more than 1 point a month for the past 3 months means an increase in income payments on an annual basis from 69.7 billion dollars at the August rate to 72.5 billion dollars at the November mte. Some further increase in income payments probably resulted from December business; for the year 1939 a
Farmers' incomes rose sharply after the prices of agricultural products advanced in September. The improvement of the past 4 months has raised the estimated total of cash farm income for the year 1939 to $7,625,000,000, virtually the same as in the preceding year. With Government payments of $675,000,000 estimated to be almost $200,000,000 larger than in 1938, the total income of farmers of $8,300,000,000 from marketings and Government payments is expected to be about 2.5 percent higher than in 1938.
A marked rise in dividends, particularly in the final month of the year, has been an important factor in increasing the flow of income to individuals. It is estimated on the basis of data now available that dividends in 1939 were at least half a billion dollars larger
PRODUCTION INCOME AND DISTRIBUTION PRICES PERCENT PERCENT PERCENT
0 20 40 60 0 10 20 30 -5 0 t5 +10
I I TOTAL MANUFACTURING ... TOTAL INCOME PAYMENTS ~
I COST OF LIVING
PRODUCTION* I I
DURABLE PRODUCTS I SALARIES &. WAGES .. i RETAIL FOOD PRICES '
CASH FARM INCOME~ ~ i WHOLESALE COMMODITY STEEL INGOTS
I PRICES
PLATE GLASS ALL COMMODITIES -I
I I LUMBER ! FREIGHT CAR LOADINGS FARM PRODUCTS
NONDURABLE PRODUCTS • I WHOLESALE SALES ... FOODS -PAPERBOARD PRODUCTION TOTAL RETAIL SALES .. INDUSTRIAL COMMODITIES •
I COTTON CONSUMPTION GENERAL MERCHANDISE .. FINISHED PRODUCTS ~
SHOE PRODUCTION • CON5UI\IeR's DURABLE GOODS .... RAW a SEMI-FINISHED I
'----'
* f"Pdl'ra/ Rl'serve !nde~es • E xclt.~de.s Govemmenf f'ar'menfs *Fetiero/ Reserve C!osstficof;On; e--rc!udes all foods cf feeds [)_[)_ 59-34)
Fi!l,ure 2.-Industrial Production, Income and Distribution, and Prices-Percenta!l,e Chan!l,e November 1939 from November 1938.
NOTE.-All series shown on this chart are those regularly published in the Survey except wholesale and retail sales which are estimates of the U. S. Department of Commerce and prices of industrial commodities which are compiled by the Board of Governors of the Federal Reserve System from data of the U. S. Bureau of Labor Statistics.
total of almost 70 billion dollars is indicated, as compared with 66.3 billion dollars in 1938 and 72.4 billion dollars in 1937.
Income payments in November were 310 million dollars larger than a year ago, an increase of nearly 6 percent. In general, the industrial sections of the Nation have shown the greater improvement over the same month of last year. Although salaries and wages as a whole during November were only 6 percent above those of November 1938, aggregate pay rolls in the commodity-producing industries were 208 milli0n dollars or nearly 15 percent larger than a year ago. ·while representing less than one-quarter of all income payments, pay rolls in these important industries account for two-thirds of the increase in _total income oYer November 1938. Factory employment in November was 11 percent higher than in 1938, and pay rolls \Vere one-fifth larger. In contrast, the governmental contribution to employee's income was nearly 10 percent less than November of last year, reflecting the lower level of work-relief wages during 1939.
than the 1938 figure of 3.7 billion dollars, representing an increase of 14 percent. The marked increase in dividends relative to the increases in other types of incomes reflects partly the more variable character of this type of income and partly the concentration of the present recovery in those industrial branches (notably manufacturing) where share capital represents an important factor of production. Enlarged dividends reflect the substantial expansion in business profits that has occurred in the fourth quarter of 1939, Data are not available at this time to compute the actual increase in current profits, but recent months have undoubtedly produced a volume of earnings which are not far removed from the results of early 1937. Financial Markets Quiet.
As in November, domestic and international financial markets were relatively quiet, aside from the drop in quotations of Finnish bonds which followed the attack of the U. S. S. R. on Finland. Prices of stocks and eorporate bonds on the whole did not show significant or material rhanges. Corporate security flotations on

JANUARY 1940 SURVEY OF CURRENT BUSINESS 5
the open market achieved substantial volume after 3 months of stagnation. The issues were predominantly utility refunding operations; the amount of new capital raised was small. That business concerns have required some additional funds is evidenced by the trend of commercial loans; the amount outstanding with reporting member banks has increased $400,000,000 since August to $4,400,000,000 in December.
As the year ends the prospects for business in the first half of 1940 remain uncertain, though the level of activity is currently well above that of the first quarter of 1939. Production in the basic industries during the final quarter of 1939 has matched that of the best quarter of 1929. But with industrial activity not being supported at present by a volume of incoming business of corresponding magnitude, some readjustment in productive activity can hardly be avoided as the backlogs of orders are reduced. Buying policies during the fall rush were predicated largely upon covering requirements for some months ahead rather than upon immediate needs. As these commitments brought company positions into line with their raised expectations regarding sales trends and inventory needs, purchasing settled down to a replacement basis. The mere cessation of inventory accumulation can only result in some decline in industrial activity unless a
prompt expansion in consumption, investment, or export demand, not now in evidence, should come in as an offsetting influence.
What is uncertain at this time is the magnitude and duration of the reaction to come in the next few months. The fact that inventory holdings have been and are still being enlarged through previous commitments is an unfavorable factor in the present situation. The attitude taken toward these holdings may largely determine the extent of the readjustment. There are several factors on the favorable side which militate against liquidation. The advance in prices, particularly retail prices, has not been as large as seemed likely two months ago. Hence, an expanded volume of goods should continue to be taken off the market by consumers. The prospects for farm income have been strengthened by the December rise in the prices of a few agricultural staples, principally wheat and cotton. Activity in the construction industry has been well maintained during recent months, and a continuance of the expansion of 1939 into the spring of next year would provide added stimulus to the economic structure. Furthermore, there has been a sizable increase in commitments for capital expenditures by business in the past 4 months :md the activity created by it will be felt during the first quarter of 1940.
MONTHLY BUSINESS INDEXES
Monthly Income Factory em- Foreign :; .:.I Industrial Freight-car Retail sales, ..
ployment Cash farm trad~, = payments, ad- production, loadings, value, ad- ~ and income' value, justed 1 pay rolls adjusted! adjusted 1 justed 1 adjusted 1 rE~ II: ..... ..... " .,., li'< • ~ ~ • . "=' " .9 ~ = "' = =:c "" ., "' "'
... l>o E .! = =<~~ !_e. " " " . ... 1>0) = ~»""
... .. "' "' c; -a- = " =·-" "'~ 4!~ = o'-' Year and month "" II: .. 8'il ~
... fiSm .9 = .. =-., "' cc; .. ~~ ... ~= ~
"" i:l8 ...... .. = "" = s ="' .... "" = ::So '¢! =:; "' - ... ""' ~.g ~i :c "' "' .;: ... .... ., ...
"" ., == 8 . e ~~
., ~ i ., .. ~= ~ ==- " "' .. == ::I .& :::: .... .,
"" "" "' 1>0) == :; "' = t .. =- .. .. -a ,e. 'l: "' c; c; ..... .. = .:.I e e = = = "' = "' = e "' :; ... .9 .... .. =- II: =- =- = = = c; ~ = = ~ "' = " " " ... 8 = "' Q I'll li'< <ll ;;. <ll ;;J ;;J ""'
;;J = li'< ~ ... Q = Monthly av· Monthly av· Monthly average, 1929- Monthly average,
1929=100 erage, 1923- erage, 1924- Monthly average, 1923-25= 100 31=100 1923-25=100 25=100 29=100
1929: November ................ 100.0 1100.6 100.8 104.4 104.9 109.0 93.0 110 110 no 102 104 1932: November ............... 56.8 55.4 59.3 66.2 43.6 44.5 39.5 65 63 75 56 68 1933: November--------------- 60.5 59.4 61.5 81.2 57.3 60.5 51.5 72 70 82 60 66 1936: November--------------- 85.8 83.8 85.9 104.4 94.4 88.5 77.5 114 114 nz 82 67 1937: November ............... 86.7 84.8 87.5 103.7 93.3 84.5 73.5 88 85 109 71 64 1938: November _________________ 83.1 82.4 84.2 92.8 84.4 78.0 69.5 103 103 !02 69 61
December_---------------- 83.4 83.0 84.7 94.4 87.1 72.5 68.0 104 104 109 69 61 1939:
January_----------··----- __ 83.3 82.3 84.4 94.6 83.7 68.5 67.5 101 100 no 69 62 February·--- ______________ 83.0 82.0 84.4 94.3 86.0 51.0 60.0 99 97 no 67 62 M •Jrch _____________________ 81. I 82.1 84.8 94.0 87.6 57.5 64.0 98 96 !10 66 62 ApriL ... ------ ____ -------- 83.0 81.0 83.8 93.8 85.5 55.0 64.5 92 92 95 60 61 May •. __ ------------------ 83.4 81.4 84.3 93.3 85.0 60.0 65.0 92 91 98 62 61 June. ______ --------------- 84.1 82.8 85.4 94.3 86.5 59.0 60.0 98 97 104 67 61 JulY----------------------- 83.7 82.8 85.5 95.3 84.4 63.0 62.5 101 100 106 69 62 Angust. ................... 85.4
84.0 I 86.7 96.0 89.7 71.0 I 71.0 103 i 104 91 70 62 September ______________ ... 86.8 84.4 87.0 97.3 93.8 92.5 79.0
111 I Ill Jl4 77 63 Octo her ____________________ 88. 1 86.7 88.8 1101.2 101.6 96.0 72.5 121 1 121 121 80 62 November ________________ 88.8 87.5 89.6 103.4 101.8 78.5 74,0 124 I 124 124 82 G3 Monthly avera~e. January I 1
I through November: I 1929 _______________________ 100.0 11100.0 100.0 106.5 111.3 102.9
-------1 121 122 ll6 108 105
1932 .• ----------------------1 61.1 59.7 63.9 66.4 47. 1 42.9 ------- 65 63 72 55 72 19,l3.- --------------------- 511.9 55.0 58.2 ,_.I .. , 48.8 77 76 82 58 67
1936 .. ----------------------1 82.5 79.2 82.8 98.3 84.6 1 73.6
=======i
104 104 104 74 65 1937________________________ 89.1 86.8 89.0 109. 6 104. I I 80.0 112 112 116 79 68 J9:l8.______________________ st. 5 1 79.1 82.3 89.3 77. 1 69.5 85 82 98 62 61 1939 _______________________ 84.9 II 83.41 85.9 -------
96.2 89.6 68.4 104 103 108 70 62
I Adjusted for seasonal varifltions; monthly averages, except income p»vments, are based on unadjusted indexes. 'Average of 10 months, January, February, and April through November.
108 132.5 101 105 103 144.4 64 28.5 32 32 27 55.4 67 53.0 42 40 48 60.5 94 151.0 52 61 58 93.7 91 89.0 72 69 56 92.1
89 100.0 58 55 96 86.4 89 92.5 67 54 96 106.9
88 91.0 55 55 86 90.5 87 96.0 63 49 73 77. I 88 88.0 70 53 69 9~. 3 88 79. 5 64 53 67 85.3 85 79.0 70 61 63 90.0 86 79.0 70 58 63 94.7 86 RO. 5 69
571 67 89.6
89 76.5 72 57 73 88.7 91 83.5
721 59 73 93.9
90 93.7 72 65 76 96.5 94 102.61 67 73 72 9J. 5
103 151.2 i 115 115 120 140.6 66 36.9 36 35 28 65. 2 62
.:ti I 36 37 24 3 61.3 81 53 61 55 90.5 87 111.3 73 81 60 98.8 79 63.9 68 50 63 84.6 83 88.7 67 58 71 90.3
l From farm marketings.
• 8 = ... = ®
.;-.... """ c:: -;:a .,= i,8
" c; ~ 0
~ Monthly average, 1926=100
93.5 63.9 71.1 82.4 83.3
77.5 77.0
76. g 76.9 76.7 76.2 76.2 75.6 75.4 75.0 79.1 79.4 79.2
95.5 65.2 65.5 80.5 86.7 78.7 77.0

6 SURVEY OF CURRENT BUSINESS JAKUARY 1940
Recent Trends in United States Export Trade T HE foreign trade returns for recent months reveal
a number of abrupt changes in both the composition and destination of United States exports, but they do not show any significant increase in the export totals which can clearly be attributed to the war in Europe. This is probably due to the character of the war to date; if and when the war enters a more destructive phase a larger volume of exports from this country may still reasonably be expected. It is, nevertheless, a fact that the expectations of greatly enlarged foreign sales, which formed the basis for the unusually rapid acceleration in domestic business since August, have not been realized. On the other hand, dislocations arising out of shipping and other difficulties have not restricted trade as they did immediately upon the outbreak of war in 1914. Exports Rising Since June.
In the 3-month period from September to November exports were 17 percent higher than in the same period of 1938. (See table 1.) This fact might at first appear to be attributable to the war. In making the comparison with 1938, however, it must be recalled that that year was one of falling foreign demand for
EXPORTS MILLIONS OF DOLLARS 350
200r-------------------------~
150r-~----------------------~
J F M MJJASOND
our goods, as is evident in figure 3. Our exports this year were already showing a rising tendency before the outbreak of the war, and have been higher than last year in every month since June. The direct requirements of intensified foreign rearmament programs and the expansion of industrial activity abroad resulting from them both contributed toward an increase of foreign demand for American goods. If the comparison is made with 1937, exports from September to November of the current year have fallen slightly. From these facts it might be assumed that the war had little effect upon our export trade and that the increase over 1938 reflects merely the continuation of an upward movement which was already under way. Analysis of the detailed figures demonstrates, however, that the war has affected both the commodity and the geographic distribution of shipments from this country.
Comparative data for the September-November periods of 1938 and 1939 show that the 17 percent advance in exports was entirely the consequence of increased exports to the European neutrals and to countries outside Europe, as is shown in table 1. Purchases of United States merchandise by the Scandinavian
IMPORTS MILLIONS OF DOLLARS
350
r---------------------------~300 ,.., I ' ,' .... _____ ,;--/937
I ' I '
I ' I ', r-~~~------------~~--------~250
I ', ,' ,_ .......
' ..
···················· ..... ~/938 ·• ••.
r-------~=-.. = ... =-·=··= .. ~.----------~150
J F M S 0 N 0 D.D.39-326
Fi~ure 3.-Value of United States Exports of Merchandise, and Imports for Consumption, Calendar Years 1937-39 (U. S. Department of Commerce, Bureau of Forei~n and Domestic Commerce).

J A-"vARY 1940 st:"RVEY OF CURRENT BUSINESS 7
countries rose by no less than 70 percent over 1938; those by Canada and other northern North American countries increased approximately 42 percent and for Latin-American countries the gain was 40 percent. Direct shipments to Germany, relatively small in recent years, fell almost to zero. An increase to the United Kingdom and France, however, has not materialized. Exports to the United Kingdom declined somewhat and those to France increased slightly, as compared with 1938; both were far below the same months of 1937.
MILLIONS OF DOLLARS MILLIONS OF DOLLARS 200 200
150 150
100 100
• • •t i,4
50 i ~
50
0 0 1938 1939
0/J-39·3.30
Figure 4.-Value of United States Exports of Merchandise, by Economic Classes, Calendar Years 1914, 1915, 1938, and 1939 (U. S. Department of Commerce, Bureau of Forei!l,n and Domestic Commerce).
Our exports to these two countries together were in fact lower than in the corresponding period of any year since 1934. The sharp divergence between actual developments and the widely held anticipations of increased sales to the European Allies is brought out even more clearly by the movement of exports within the 3-month period. Shipments to the United Kingdom fell from 60 million dollars in Spetember to 31 million dollars in November; a substantial decline occurred in all but one minor group of commodities.
Of the gain in total exports over 1938, appro:ximately one-third was accounted for by higher cotton shipments. (See table 1.) Cotton exports in 1938, however, were unusually low; exports in 1939, despite the operation of the cotton-export program were still below those of 1937. Large wartime demand for pork products and dried fruits failed to materialize, while the demand for fresh fruits and tobacco was curtailed even more rapidly than at first seemed likely. Tobacco exports fell from 65 million dollars in SeptemberNovember, 1938, to 17 million dollars in the same period of 1939, as a result of the sharp decline in British purchases. In the first 2 months of hostilities, the quantity of farm products, other than cotton, exported to France, Germany, Poland, and the United Kingdom, was 61 percent less than in September and October of last year. Foreign purchases of nonagricultural commodities on the other hand, showed significant increases over 1938, but this was the case in every month since
April. The expansion since the outbreak of war occurred in foreign purchases of metals and metal manufactures, chiefly iron and steel-mill products, nonmetallic minerals, mainly coal and petroleum products, machinery, and chemicals. Our exports of aircraft, parts, and accessories also increased in spite of a decline in October. Foreign purchases of United States automobiles, including parts for assembly abroad, on the other hand, fell nearly 10 percent from 1938 and were nearly 35 percent below exports in the same period of 1937.
These developments are in many ways different from those of the first few months of the World War, par-
MILLIONS OF DOLLARS 300
MILLIONS OF DOLLARS 300
Fi!l,ure 5.-ValuP of Total Exports (lncludin!l, Reexports) By Geographic Areas, Calendar Y<'ars 1914, 1915, 1938, and 1939 (U. S. Department of Commerce, Bureau of Forei!l,n and Domestic Commerce).
ticularl) with respect to exports of agricultural commodities. In 1914 it was the cotton trade which was most severely affected by the first dislocations resulting from the outbreak of hostilities. Shipments of grain and foodstuffs, as given in figure 4, showed an early rise, although this was in great part a result of the fact that Canadian and Australian wheat production was small while the United States enjoyed a record crop. Foreign purchases of finished and semimanufactured articles increased sharply in September and October of 1914 as they did jn 1939. In 1914, however, they had been declining prior to the outbreak of war and in the September-November period of 1914 they were still lower than in 1913. Thus the World War reversed a downward movement whereas the present war began at a time when exports of semimanufactures and finished manufactures were already higher than in the preceding year. As may be seen in figure 5 the two periods differ also in the fact that exports to nonEuropean areas did not expand immediately in 1914 as they have in 1939.

8 SURVEY OF CURRENT BUSINESS
Table 1.-Exports of United States Merchandise, by Economic Classes, by Principal Commodities, and by Re~ions, September, October, and l\overnbu, 1938 and 1939
[In thousands of dollars]
Item October ~ovember ! September ,
I )
1938 1939 1938 1939 I 1938 I 1939 I -------------------;----:----1---- --------------
243,5951 284,041 I 274,0591 323,160 ~~~~~~I CLASS AND COMMODITY
Total, U.S. Exports---------------------------------------------
Agricultural products ____________________ ------- _______ --------- ______ _ Nonagricultural produ~ts __________________ ------ ______ ------- ________ _
Crude materials ____________________ ------- _________ ----- _____________ _ Foodstuffs, crude __________________ ---------- _________ ------ ____ ----- __ Foodstuffs. manufactured ___________ ----------- ______ ---------- _______ _ Manufactures, semi ---------------------------------------------------Manufactures, finished. ___ ------------------------------------------- -I Animals and products, edible __________________________________________ !
Meats and lard_- ______ -------------------------------------------- i Animals anJ products, inedible ________________________________________
1
Leather __________ -------------------------------------------------Leather manufactures_.--------------------------------------------
Vegetable food products and beverages---------------------------------Corn ___ -- --------------------------------------------------------Wheat and wheat flour ___________________________________________ _ Canned vegetables __________________________ ----- _________________ _ Fruits, dried and canned •. -----------------------------------------Fruit:~, fresh _______________ ----------------------------------------
Vegetable products, inedible ______________________________ --------- ___ _ Automobile casiJ?gS. _ ---------- ------------------------------------~ Leaf tobacco (bnght flue-cured) ___________________________________ _
Texw::~~i~oan~~-~~~~!~~~~~~~~~=====================================:i Wood and paper _______ -------- _______________________________________ _ Sawmill products ______________________________________ --------- ______ _ Nonmetallic minerals _________________________________ ------ __________ _
Coal. ______________ ------------------------------------------------Petroleum and products.-------------- ____ -------- ______ -------- __
Crude petroleum. ___ -------------------- ______ -------------- __ Metals and manufa~tures _____________________________________________ _ Iron and steel-mill products, totaL---------------------------------
Iron and steel scraP--------------------------------------------Ferro alloys _________________________________________ ----- _________ _ Aluminum. except manufactures __________________________________ _ Copper, refined ___ -------------------------------------------------
Machinery and vehicle•------------------------------------------------Machinery, totaL __________________________________ ----- ___________
1
Electrical machinery and apparatus ___________________________ _ Power-generating machinery __________________________________ _ Construction and conveying machinery _______________________ _ Metal-working machinery __ -----------------------------------Tractors and parts _____ -------------------- --------------------1 Automobiles, parts and accessories ________________________________ _ Motortrucks and busses ________________________ ------------ ___ _ Passenger rars ___ ----------------------------------------------
Airlr':nt~ :~~ -~s_s_e_~-~~-~ ~ ~ ~ ~ ~ ~ = ~ = = ~ == = = = = = = = = = = = = = = =: = = = = = =: = = = =: = = =: Chemicals and related products----------------------------------------Industrial chemicals and specialties _______________________________ _
REGION AND COUNTRY
Europe, total _________________________________________________________ _ European belligerents: France ________________________________________________________ _
Germany t ____________ ----------------- ______ ------------------United Kingdom ________________________________________ ------Other Europe: Belgium ______________________________________________________ _
Nether lands _____________________________________________ ------Denmark _____________________________________________________ _ Finland ______________________________________________________ _ Norway ______________________________________________________ _ Sweden ______________________________________________ . ________ _ Union of Soviet Socialist Republics ___________________________ _
Italy __________________________________________________________ _ Rtitnania ___________________ --~-- ______________________ .. ______ _ Spain ___________________________________ . _____________________ _
Northern North America, totaL ______________________________________ _ Canada ___________________________________________________________ _
Latin America, totaL-------------------------------------------------Southern North America, totaL __________________________________ _ Cuba·--------------------------------------------------------·· Mexico _____________ -------------------------- ________________ _ Netherland West Indies_--------------------------------------
South America, totaL_------- __ -------------- ____________________ _
75, 194 1
168,401 I 59,605 ' 14,254 i 17,134 i 10, 221 1
112,377 i 6, OF6
1
3, 849 2, 759
933 832
25,261 4, 788 4, 038
279 5, 914 4,425
28,491 985
21.902 27,941 20,252
6, 842 3,189
40, 537 5, 153
30,837 8,166
28,8.>4 13, 105 l, 974 1,711
220 7, 343
5i, 178 36,659
7, 298 914
1, 814 8, 406 4. 574
14, 171 5, 780 1, 815 2, 949 4,642
11,497 5,087
=---==
111,711
11.117 17,725 48,955
4,404 6, 585 1, 369
727 1, 658 3, fil7 5, 530
4,099 458 882
35,553 34,Q76 43, 447 20,814
6,175 4, 227 3, 750
22, 633
~~rr:;;=-=-==:: == :: ======: :::::::::::::::::::::::::::::::::::::1 5, 928 4, 831 1, ~Oil I 3, 324 1
4,0.10 I 38, :ZX7
Colombia ______ ---------------------------- ___________________ _ 'r enezuela _________ ------- ____ .. ________________________________ _ Asia, totaL ____________ --------------- ___________ --··-- ___ -----------··--
China, including Hong Kong and Kwantung ______________________ _ JaP'm- _. _________ --------------------------------------------------Philippine Islands_---------- ______ --------_------------------- ___ _ Oce.ania, total _________________________________________________________ _ Australia ____ -------------- ___________________________ -------------
Africa, total ___________ ----------------------- ________________________ _ Union of South Africa_-------·-------------------------------------
4, 233 19. 791 I 7, 051 6,113 i 4. 8~lsll 7, 884 4, 419
74,579 209,462
66.847 7,477
21,309 58,993
129,415
fl, 9.55 4, 290 2, 798 1, 204
807 21,742
1, 121 4, 270
417 R, 749 2, 228
18.304 1, 478 8, 433
45, 141 35, 153 9, 069 3, 788
51,379 9, 649
35, 930 9,071
41,249 20,445 4, 995 2, 072 3, 236 6, 833
61,898 40,143 8,063 1, 114 1, 768 9, 950 4, 258
12,457 2, 502 2. 778 2. 717 8,052
16, 6.'1 7, 955
119,530
12,112 606
60,050
5, 533 9,861 Z, 51.5 l, 212 4,172 8, 052 1, 785
4, 81~ 169
3, 370
51, 191 50,189 53,859 28.683 9,199 5, [104 4, 419
2.1,175 4, 928 5. 9".0 2,010 4. 077 5, 043
43, 123
I
!'}_ 939 !9, 305 7. 929 7, <>S2 6. oao I 8, 9.56 I fi, 271 1
I
86.941 I 95.847 73.609 63.8721 187, 118 227,313 176, 235 223,019
12. 125 I 78,449 59. 847 ss. 318 12, 501 10, 213 12, 045 5, 386 20,7761 21,547 11.429 1 11,210
124, 209 142,414 120, 562 142, 716 44, 448 64, 537 39, 9621 63, 200
6, 866 1 6, 764 6, 199 6, oo4 3, 9991 3, .506 4, 003 3, 749 3, 506 4, 900 2, 711 4, 237 1, 105
8.09 , 26, a.u I
2, 306 4,031 i
4<:!7 i
7. 7JBI 5, 497
36,511 I 1, 394
27, f.Ol 32,718 23,747
7, 534 3,174
42,751 5, 699
32,211 9, 568
31, 727 14,600 3,156 2, 356
83 6, 934
62,701 38,432
9,190 1, 186 1, 920 7, 840 3, 576
17, 303 4,075 6, 713 2,164 4, 967
13, 257 5,884
126,770
12,206 13,330 55,634
7, 025 8, 539 2, 266 1, 518 2, 245 8, 690 3,042
5, 306 381 865
40.765 39, 699 45,376 22.868
6, 502 4,197 4,105
22,508 6.017 s: 328 2.122 3, 154 3, 401
43,132 3, 804
19, 449 I 7,456
7, 728 5, 3721
10.2881 6, 595
1, 608 778
30, 8F6 I
3, 222 3, 604
643 10.838
2, 899 18,621
1,688 4, 928
59,046 46, 7:H
9, 887 3, 382
52,771 9. 335
36,018 9,011
45,063 22,380
5, 630 3, 690 3,176 5, 509
65,902 42,316
9,5.56 1, 126 1, 965 9, o85 4, 356
18,900 4, 661 5,842 3,H22 3,025
19,771 9,450
I 124,319
12, 399 40
51,951
4, 836 8, 768 2. 978 1,654 5, 894
15, 79.5 5,455
6, 222 86
2,617
60, 658 59,573 6.o, 229 32, f163 10.249 8, 378 3, n76
32,566 6, g:n 8, 514 2,M1
4,67·1 I .1, 591 5.), 865 7, 117
23,304 I 11.873
6, 726 5, 4261
10, 363 6, o65 I
905 746
23,225 3,130 4,474
340 6, 025 ' 4,0!i2
24,7% 866
15,665 33,118 24,618 6,8M 2, 693
38,126 5. 456
29,011 7,635
29,320 15, 499
3, 932 916 371
5, 999 65,761 34,701
7, 935 1, 121 1, 396 8, 346 3,183
25,417 4, 598
11,830 4, 753 4, 156
10,640 4,415
109, 174
13, 540 12,209 42,439
6, 358 6, 616 2, JOC, 1,376 1, 737 6, 430 4,071
5,032 380 938
37,936 37,459 44,326 21, Jf;3
5, 659 5, 000 3,007
23, )()3 6, 784 5, 124 1, 7231 3, 929 3, 484
41, 505 1 4, 886 :
19, 124 I 8, 6ii31 7,0H
4. 966 I 9. 860 5, 559
1, 520 1, 275
16,571 787
3,078 37>
3, 445 2, 267
18, Otl8 I 2, 264 3. 874
41,869 30,288 8, 977 2, 789
45,494 8, 294
31, 261 6,623
52,214 27,856 5,093 ' 2, 280 2,030 8,421
67,940 38,637
9, 759 1, 245 1, 465 9, 051 3, 049
19,870 4, 689 6, 241 4, 468 6, 760
16,772 8,012
101,923
13, 188 2
30,979
5, 473 12,712
2, 026 1,014 3,675 9,699 7,027
5, 948 1, 469 2,814
49,819 48,993 67.785 29,016
7, Ql7 8, 430 1, 938
38, 7fi9 9, 842
10,571 3. 602 4, 674 5, 8f·il
53,227 f., 471
25,217 7, 664 5,159 4, 330 I 8,979 . 5,101 I
' For purposes of comparison, trade with Aust.ria, Czecho-slovakia, and Poland are included with thot tor Germny in all periods shown.
3 months ended November
1938 1939
767, 4981 894, 092 ====
215, 7441 234,298 531, 754 659, 794
191,577 I' 201. fi14 38, 800 23. 076 55, 3391 66, 126
124, 634 186, 730 357, 148 414, 545
19, 151 I 19, 723 11, 8.51 11, 545 8, 976 11, 935 2. 943 2, 4~7
74,827 10,224 12. 043
1, 056 19, 652 ! n,974 \ 89, 767
3, 245 65,168 93,777 68,M7 21,230
9, 056 121,414
16. 308 92,059 25,369 89,901 43,204 9,062 5,003
674 20, 27G
185,640 109.792
24,423 3, 221 5,130 .
24,5921 11, 333 5fi, 891 I 14,453 20,358 9,866
13, 7R5 35,394 15,386
347,655
36,863 4~. 264
147,028
17, 787 21,740
5, 741 3, 651 5. 640
18,737 12,643
14. 437 1, 219 2,685
114,254 112, 134 133, 149 64.845 18, 336 13, 424 10,863 68,304 18.729 15,283
5, 7iil 10.407 10, 935
122. ~?4 12. n3 1
58, 3!14 i 23,160 21, 4S5 1.5, 1761 28. 0'12 16, 573 I
4, 3:~2 2. 860
69, 199 5, 130
10. 952 1, 433
21,032 7,194
54, 993 0, 430
17.2:35 146.056 112, 172 27,933
9, 9.19 149.644
27,278 103. 209
24, 705 138, 526
70, 681 15, 718
8, 042 8, 442
20, 763 195. 740 121,096
27,378 3, 485 5,198
28,586 11,663 51.227 11,852 14.861 11,007 17,837 53,194 25, 417
345, 772
37,699 648
142,980
1.5,817 31, 3.Jl
7, 519 3,880
13, 741 33, 546 14,267
16,988 1, 724 8, 801
161,668 158, 7!)5 186,873 90, ;)62 27,255 22,312 10,033 96, f,10 21, 701 25,045
8, 253 13, 425 lf>. 492
1f)2, '215 19, ii27 (i7. 826 27, 4nu l~. 2f\7 h846 28,298 17, C38

.Lu;u.\RY 1940 ~UH\'EY OF CCRRENT BUSINESS g
The time which was required before our exports felt the full impact of the World \Var is likely to be for-
CURRENT DOLLA~S IN BILLIONS
70
.. ········· 60~~---+---+--~--+-~~~--~
.mJMAT.EJ N4170M4t hVCO.M'E"' •••••••• /
I . ...-so~~~-4---+--~~~~---+--~~
········· ··········
.· .··
20r-~~-4---+---+--~--~--~~
tor----r-~---1---+---+--~--~~
mmiEmJaf~ ----- ----- _-:.:::.. o l---:-::-z:-::!-,-,_;S_'!:_::;::::r-:=-_-::_.L ______ -.,-_.LEX~""'~c~~W~"~~!;:~~'XA~~~>R7l-;$ __ _L __ ___J
1913 '14 '15 '16 '17 '18 1919 0.0.39-327
Figure 6.-National Income, Total Exports, and Net Exports, Calendar Years 1913-19 (U. S. Department of Commerce, Bureau of Foreign and Domestic Commerce).
gotten. The War tends to be remembered as a single episode which resulted in a tripling of our exports between 1914 and 1918. It will be recalled that under the stimulus of expanding exports, industrial production, commodity prices, and the national income increased to high levels. (See figs. 6 and 7.) The memory of this enormous expansion appears to have been the primary factor in the wave of buying and the sudden expansion of business activity which began in September. Although the decline in shipments to the United Kingdom and the failure of total exports to expand more than they have are at variance with the expectations which played a major part in the September expansion, these developments appear to be quite consistent both with the changed position of the United States us a supplier of food and ra.w materials, and with the eeonomic polieies of the Allies.
In recent years nearly two-thirds of exports from the United States have consisted of finished and semifinished manufactures. (See table 2 and fig. 8.) Crude materials comprise about a fourth of all exports, with erude and manufactured foodstuffs making up the remainder. Before the World War, on the other hand, crude materials, principally cotton,. constituted onethird of our exports while foodstuffs amounted to about one-fifth. Finished and semifinished manufactures comprised less than one-half of our exports.
200349-40-2
These differences in the structure of our export trade are dosely related to changes in the geographic distribution of exports. The decline in relative importance of crude materials and of foodstuffs since the pre-\Vorld \V ar years has been accompanied by a decline in the proportion of our total exports taken by European
BH----+---.~A------+----4-----4-----TOTAL EX~ORrozf1
7
6H------HJ-~r---+---4--~r---~ 1/
5 t--
I H-----1----~--+---- --+------1-------+----------j
Ol!:,-910:+,-!19cc;ll'--l-fc91;;-"5 -J-1+91-:'6 --:_ I-':-;92+0+-19'-:,2.LI -~19-::-:2S4-':19.,-26'--.LI9~30-!-,1"'93:-'-I -_ji9L3~S ~19L36'---'-19_j40L.j 0039-329
Figure 7.-Value of Total Exports (Including Reexports) and General Imports. Calendar Years 1910-39 (U. S. Department of Commerce, Bureau of Foreil1,n and Domestic Commerce).
NoTE.-Figures for 1939 include estimates for December.
countries, which were the prineipal markets for these products. Shipments to Europe during the 5-year period preceding the present conflict were approximately two-fifths of shipments to all countries; in the period preceding the World War they were three-fifths of the total. The relative importance of exports to all other world areas has increased, the rise in the proportion of exports going to Asia being particularly notable.
Whatever gains or dislocations in foreign trade may be anticipated as a result of the European War, it should be emphasized that exports of crude products are not now of the same importance that they were in 1914 and that trade with Europe, partly for this reason, does not occupy the place that it then did. Behind these facts lie long-run developments with a direct bearing upon the probable course of export trade during the present conflict. Additional major sources of breadstuffs and other agricultural products outside the United States have appeared since 1914, and many of the belligerent countries are themselves more nearly self-sufficient in essential foodstuffs than they were at the time of the World War.
Moreover, it is precisely in the case of the United Kingdom, which must import large quantities of food, that alternative sources of supply have been developed. At the outset of the World War we supplied 20 percent of British imports of food, drink, tobacco, and raw materials. In recent years we have contributed only about 10 percent. In the case of other crude materials as, for example, in the case of minerals, production

10 SURVEY OF CURRENT BUSINESS JAl\l"AHY 1940
outside the United States has been greatly increased since the World War period. These considerations, among others, suggest what is to some extent already evident from trade returns: that any increase in exports to European countries and to the belligerent countries in particular will be concentrated to a considerable degree in manufactured articles. As a matter of fact, it was this category of exports which expanded to the greatest extent during the ·world War years, although the rise in shipments of foodstuffs was significant for the war period as a whole and especially during the first year. Table 2.-Percentage Distribution of Value of United States Exports,
By Economic Classes, and By Geographic Areas, Selected Periods 1
[Percent of total]
Item 1910-14 ~1193~~ Economic classes:
Crude materials.--------------------------- ___ _ 33 16 24 Crude foodstuffs _____________ ------ ____________ _ 6 9 4 Manufactured foodstuffs ____ ------- ______ ------- 14 23 6 Semimanufactures ____ ------ ___________________ _ 16 18 18 Finished manufactures_---------------------- __ 31 34 48
---------TotaL ________________________ --- ___ ---- _____ _ 100 100 100 ----------
62 62 43 15 15 15
Geographic areas: Europe _______ ----- ____________________________ _ Northern North America ______________________ _
8 7 . 9 6 (I~) I 9
(14) (18)
Southern North America ______________________ _ South America_-_---------------------- __ ------(Latin America) ___________________________ _ Asia ______________ ------------------------------ G 8 17 Oceania __________ ------------------ __ ---- _____ _ 2 2 3 Africa ____ --------------------- ________________ _ 1 1 4
---------•rotaL ___________ --- _ --- __ -------------------- 100 100 100
1 Years ended June 30 for 1910-14 and 193(;-39; calendar year for 1918. Source: U. 8. Department of Commerce, Bureau of Foreign and Domestic Com
merce.
A second factor operating to restrict the great expansion of our exports to the belligerents lies in the economic policies which France and the United Kingdom have adopted. Strict control of foreign trade and repressive fiscal policies were immediately put into effect, in order to minimize nonessential uses of labor, materials, and foreign exchange. Consumption and private investment are being repressed by drastic increases in income and other taxes while the capital markets are under strict control. These measures, by restricting the expansion of incomes and by forcing a reduction in the standard of living, cause a reduction in certain types of imports. In addition the depreciation of sterling impedes the flow of goocls into sterling countries from the United States. Imports are being further reduced by direct limitation and, in some cases, absolute prohibition. Cautious and coordinated buying by the Allies contrasts sharply with the competition and duplication which characterized orders during the first part of the last war. It is clear that the Allies intend to limit their expenditures in the United States as much as possible. They are carefully conserving their gold, dollar balances, and securities marketable in the United States to meet the neerls which may arise if and as the war develops. Furthermore, they evidently hope to minimize the inflationary effects of war expenditure at home.
The movement of our goods to neutrals is limited by
the controls imposed by the belligerents upon neutral trade, applied with greater severity and at a much earlier stage than in the World vVar. Blockade and
EXPORTS ECONOMIC CLASSES
BJ LLI ONS OF DOLLARS GEOGRAPHIC AREAS
7
2
0
IMPORTS
81 LLIONS OF DOLLARS 7
ECONOMIC CLASSES GEOGRAPHIC AREAS Bl DOLLARS
4
2
0
DD.39-328
Fill,ure 8.-Value of United States Exports of Merchandise and Imports for Consumption, by Economic Classes, and Total Exports (Including, Reexports) and General Imports By Geog,raphic Areas, 1910-14, 1918, and 1935-39 (U. S. Department of Commerce, Bureau of Foreig,n and Domestic Commerce).
NOTE.-Data for 1918 are for the calendar year; other data are for fiscal years.
contraband regulations will keep at a minimum our exports to certain of the belligerents as well as to some neutral countries. The existence of substantial accumulated stocks of both war materials and civilian supplies is yet another factor which will presumably restrict the demand for American products in the near future. In a measure, as export statistics during the past several years indicate, the war demand for domestic exports has been already felt. Armament requirements, tbe building up of reserve stocks, and the generally high rate of industrial activity induced by war preparations have all been reflected in the export trade of the United States.
The foregoing conRiderations apply particularly to prospective export trade with the European belligerents and with some qualifications to other European coun-

JANUARY 1940 SURVEY OF CURRENT BUSINESS 11
tries also. The prospects of improved trade with nonEuropean countries, belligerent and neutral, tum upon rather different issues. The possibility of an expansion of exports from the United States to such countries as a result of a lessening of trade with Europe, depends, of course, upon the trend of their exports to the United States, upon the disposable proceeds of their total exports, and upon the possibility of borrowing in the United States. The fact that the productive facilities of many of the countries concerned are not in high degree complementary to those of the United States need not constitute an insuperable obstacle in this direction, provided that receipts from shipments to Europe and elsewhere can be freely utilized for making purchases of our goods.
Here it should be noted that the movement of prices,
especially the prices of the primary materials which comprise such a large proportion of the exports of countries outside of Europe, is a factor of primary importance. The boom in the external trade of Latin America during the World War, for example, was in large measure the consequence of a great rise of prices. Aside from the price factor, the experience of the World War period suggests that trade between the United States and Latin-American countries may be expected to increase moderately in the short run and significantly over an extended period of time under the conditions created by war in Europe. An increase over both 1937 and 1938 has occurred in exports from the United States to Canada, and the use of Canadian facilities for the manufacture or processing of war materials may lead to a further marked expansion.

12 SURVEY OF CURRENT BUSINESS JAXL~RY 1940
Present Position of the Lumber Industry By W. LeRoy Neubrech, Chief, Lumber and Allied Products Section, Forest Products Division
I T IS well known that one of the differences between the immediate repercussions of the outbreak of war
in September and the start of the holoraust. in 1914 was the generality of the impetus given this time to prices. There was no hesitancy in many important sectors of the priee structure during the first few weeks of war as there was in 1914. Rather, expectations ehanged quicldy and the psychological impact was virtually allinclusive. Prices of such commodities as lard, copper, lead, and cotton did not follow the 1914 precedent and dip downward. Presumably many people thought that price inflation like that of 1916-20 was imminent and sought to protect themselves, though there were, no doubt, some who were merely guarding against delays in delivery.
It is largely on such grounds that an explanation of the rush of buying and the consequent price rise that came in the lumber industry must rest. One might, not unreasonably, have expected a less optimistic reaction to the war, since during the World War lumber had proved not to be a war stimulated industry.
Buying Rush in September.
Nevertheless, a sharp lumber buying movement did develop in September. The trend of developments is indicated by the data in figure 9 which cover a large fraction of the industry New orders for those mills reporting to regional associations had been coming in at about 260 million board feet a week during the period immediately preceding the start of hostilities, somewhat above the level of produetion of about 240 million feet a week. By the week ended September 23 new business of over 370 million feet was reeeived. While the data to show the preeise sources of this increased demand are not available, there is a presumption that it resulted from anticipatory buying by wholesalers, retailers, and industrial consumers. The movement was fostered by the relatively low stock position of these groups. There is no evidence of an increase in total consumption although there has been expansion in particular lumber consuming areas; in fact, the Lumber Survey Committee 1 estimated in its report of November 4 that consumption in the fourth quarter would decline to 6.8 billion feet from the third quarter total of over 7 billion.
After several weeks of accelerated business there was a reappraisal of the situation. A sharp decline in new orders occurred and by the middle of October they fell below production. During November this gB,p between output and new business was rather wide with
t Special Lumber Survey Committee established upon recommendations to the President by the Timber Conservation Board. June 19RI.
the latter fluctuating under 200 million board feet per week. From the end of October to the end of November unfilled orders were reduced from 980 million board feet to 769 million and this clo1vmvard movement has continued in December. They had been 836 million at the end of August.
This strong buying wave soon produced a marked increase in lumber prices generally. The Bureau of Labor Statistics index of wholesale lumber priees rose from 91.8 (1926=100) in August to 93.7 in September and again to 98.0 in October. The movement of mill prices for some typical lumber items is indicated in table 1. As can be seen from these data, a large part of the price rise, which was transmitted to all the important types of lumber, came between mid-September and mid-Oetober. During the rest of October mill priees leveled off and with the derided decline in new business in November many lumber items were offered at lower priees.
MILLIONS OF BOARD FEET 400
..~··\ 300 ~--~----0-R-U~R-S~--T~~-+----_,------r-----~
I f 3oor-·--~-----+--+----+----_,------r-----~
ISO~--~-----+-------+-----_, ______ t 0~~~~~-r~~~-+~~~~~~~~~~ JUlY AUGUST SEPTEMBER)
939ocT08EA NOVEMBER I DECEMBER
LJ£J39·31S
Figure 9.-Total Lumber Production, Shipments and Orders, by Weeks, 1939.
Source of data: National Lumber Manufacturers' Association, based upon data for approximately identical mills.
This price reaction was not immediately reflected widely in wholesale markets. The Bureau of Labor Statistics index of prices in wholesale markets did not decline in November but showed a further slight increase to 98.3.
While supply conditions and the pricing process differ widely among the various sectors of the lumber industry, short-term price changes generally result from the impact of changed demand upon existing stocks. The industry has large possibilities for expansion from the relatively low levels of production of recent years, but it takes some time for these to be realized. The time required for the logging, log transportation, saw milling, drying, and finishing operations does not allow a

.JANI.:ARY 1940 SURVEY OF CURRENT BUSINESS 13
marked expansion of production to meet a flood of new orders within a few weeks or a month's time, particularly during those months when, for climatic reasons, a seasonal decline in production is customary. It has been characteristic of the lumber industry for some time that production lags considerably behind changes in demand so that stocks tend to move in the opposite direction to production. The fact that production and stocks have opposite cyclical patterns can be seen in figure 10. Hence, a sudden increase in demand must be met largely out of stocks and is likely, if of sufficient magnitude, to give a temporary lift to the price structure.
Table 1.-Trend of Prices I of 8 Typical Lumber Items
[Dollars per 1,000 board feet]
Item I Aug. 19 • Sept. 16' Oct. 14' I Nov. 25'
sPrnption in 1939 will exceed that of any year since 1929. Lumber consumption in 1939 is estimated at slightly above 26.5 billion board feet, more than double the depression low of 1932. It will surpass the 1937 figure by about a billion and a half feet. Produetion has also expanded in 1939 although it is estimated to be about 2 percent under 1937 and 1930, total output in each of these years having been approximately 26 billion feet. The steep climb from 10.8 to 25.5 billion feet measures the progress made from the trough of the depression in 1932 to 1939. Nevertheless, consumption stands far below the level of the twenties; in 1929, not an exceptional lumber year for that decade, consumption was 35.8 billion feet. It is necessary to inquire whether the difference between 1929 and 1939 conrmrnption represents a trend away from lumber use or merely the relotively depressed condition of the national
Southern piue dimension·----···-·······-Southern pine flooring __________________ _
21.24 38.85 33.61 27.00 21.00 63.00 29.00 21.50
21.85 40.42 34.42 28.00 22.00 66.00 29.00 23. oo I
23.67 42.60 34.27 31.00 24.00 68.00 32.75 26.00
24.65 economy. 43.52
Ponderosa pine shoP---······----------·Donglas fir flooring __ .. ---·----·--··--·-Douglas fir dimension--------··----~~----Oak flooring_-----------···--·-··------Plain red oak ___________________________ _ Plain sap gum ________________________ _
35.28 30.00 23.00 68.00 29.25 25.50
__________ __. __ __,_ __ _c__~-~---~~---
I Actual sales, f. o.b. mills. Source: American Lumberman.
Lumber Stocks Declining.
2 Approximate date.
Total shipments of lumber, which in August had been larger than at any time since 1930, were maintained in September at 2.5 billion board feet and increased to 2.6 billion in October against a customary seasonal contraction at this time of the year. As production declined, though less than seasonally, from 2.4 billion in August to approximately 2.3 billion in September and October, the volume of shipments was maintained partly by withdrawals from existing stocks. This decline in mill stocks continues a movement which has been under way for about 2 years. During 1937 lumber stocks had increased by 1 billion board feet because of the sharp decline in demand that came in the second half of that year. In 1938 these enlarged stocks were reduced 555 million feet and in 1939, by the end of August, a further reduction of over 500 million had been effected. Then, in the next 2 months there was a decline in stocks of 515 million board feet, as v result of the buying touched off by the war. Lumber stocks, in relation to the current rate of consumption, now appear to be somewhat low. Furthermore, present stocks, as the Lumber Survey Committee observed at the end of the third quarter, are broken and ill-assorted in some regions and this tends to encourage erratic price changes. The committee adds that such price changes benefit neither producers nor consumers vnd evidently discourage more liberal use of lumber and timber products.
Consumption of Lumber Increases in 1939.
An accurate appraisal of the current position and prospects of the lumber industry must, however, be made in terms of more fundamental factors than a short period buying movement. The fact is that lumber con-
BILLION FEET PER QUARTER 12
10 .....
v ~llj N- STOCKS ...... v I I I I 8 "'- ... /"'i ! N T_L thl ., ..... 6 I~±±' '-.11 tv~~ I ,f.;
\ w'~"" f[' ' 4 1-:,: .... 1 i I l ·~r./1_
I I I 1"'~·-T ! !.A.. 1.-.r i I
I 'l : ' 1' I PRODUCTION_.\··.. :i~·~ ··.~::: ~ I I L \ .... , i
2 l-1 -1 -1 111- . 0
1925 "26 "21 '28 ·zg "30 "31 '32 '33 '34 '35 '36 '31 "38 1939 l).P.3?-.$H
Fi!!,ure 10.-Softwood Production, Shipments, and Stocks by Quarters, 1925-39 (National Lumber Manufacturers' Association).
NOTE.-Data are adjusted tor seasonal variation.
Even in 1929lurnber was known to be in the category of declining rather than expanding industries. The peak in lumber production and consumption carne in the years 1906-7. Up to that time it can fairly be said that lumber was the dominant manufacturing industry in our economic development, although for about 10 years steel had become increasingly important. Lumber was the lowest priced and most widely used material for durable goods during the great economic and territorial expansion that followed the Civil War. Its consumption increased from about 8 billion feet in 1859 to almost 45 billion in 1906. The Great Plains of the Middle West were being settled rapidly, towns and cities were springing up, and population, even in the East, was multiplying. This expansion and migration of the population, couple.d with the rising productiveness of our economic machine, resulted in an increase in the per capita consumption of lumber during the half century from 260 to 525 board feet.

14 SURVEY OF CURRENT BUSINESS JANUARY 1940
Declining Trend in Consumption Since 1907.
After 1907 this rising trend was reversed and the lumber industry entered its new phase of declining production and consumption. The great agricultural migration that had added approximately 90,000 new farms per year to the economy, each with a requirement of about 50,000 board-feet of lumber,! was over. New materials were being developed and they began to replace lumber in urban buildings, sidewalks, shipbuilding, fencing, and a host of industrial uses.
The comparison of the major outlets for lumber in 1912 and 1928, given in table 2, shows in what areas the trend was declining after the peak in 1907.
Table 2.-Estimated Distribution of National Lumber Consumption for 1912 and 1928 1
Class of use
1912. consumption sumption loss (-)
1928, con· I Gain(+) or
1-----,---I---.---!------
Mil· I lions feet Per·
board cent meas-
ure
Mil· lions feet Per-
board cent
Millions feet
board meas~ meas-
ure ure
Percent
Factory ...•.......•....•............. 11,200 ~ 10,300 --;I -900 ~ Construction:
Sash, door, and millwork......... 2, 500 6 3, 300 9 , +800 -t-32
Rural construction ........... 15,000 51 5,500 1 24 -9,500 -63 Direct to construction ............ 29.300 68 22,900 63~-6, 400 -22
Urban nonresidentiaL........ 5,300 18 5,400, 24, +too +2 UrbanresidentiaL ...........
1
9,000 31 12,000 I' 52 +3,000 +33
An lumber. __________________________ 43.ooar1oo1
36 .. 5oo i100I=a:5o0 -1s
1 Forest Service, a National Plan for American Forestry, S. Doc. No. 12, 73d Cong., 1st Sess., 1933, vol. 1, p. 249.
In construction the use of manufactured lumber products (sash, door<>, etc.) increased during this period but the total lumber used in this field declined by 5.6 billion board feet. It was entirely in rural construction that the decline occurred, a result of the rural-tourban shift in population that was taking place. The relatively depressed condition of agriculture during the twenties, which was the underlying cause of the shift in population, also held back the normal replacement and repair demand for lumber. Actual consumption in urban construction, including planing-mill product<J, increased by substantially more than 3 billion board feet. This increased urban consumption was occasioned by the much higher level of construction activity in 1928 and took place despite the tremendous increase in the use of other building materials which was a concurrent development. It has been estimated that the volume of urban nonresidential building construction in 1928 was twice that of 1912 although lumber consumption was about the same in both years. Thus the relative displacement of lumber by other materials was 50 percent.2 In urban residential const-ruction, the relative displacement of lumber wa<J also very high, probably in excess of 25 percent, largely a result of the development of multifamily housing.
1 A National Plan for American Forestry, S. Doc. No. 12, 73d Cong., 1st sess., 1933, vol. 1, p. 249.
' Op. cit., pp. 250-253.
It is also notable that, despite the large increase in industrial production during this period, the industrial use of lumber declined from 11.2 billion board feet in 1912 to 10.3 billion in 1928. Other materials of all kinds encroached upon the use of lumber for all industrial purposes although in certain areas the expansion of output was large enough to require an increase in the absolute amount of lumber used. This occurred in some of the largest areas ofindustrial demand; e. g. boxes and crating, furniture, and motor vehicles; but such gains and those arising out of new industries were more than offset by the decreased consumption in minor industries as is shown in table 3.
Table 3.-Lumber Consumed in Fabricated Products and by Wood-Usin~ Industries, 1912 and 1928
Products 1912 1928 ----·--------·------------1----
Boxes and crates ...... ____ .. _____ ......... -----·---· _____ _ Car construction ______________________________________ ----Furniture ......... ____ .................. ----·····--·-·--·· Vehicles and vehicle parts:
N onmotor -·-· .. __ .... ____ ... __ . _ ............ __ ....... -Motor .... ------------- ........ -------··---····--------
Mft. b. m. Mft. b. m. 4, MO, 016 4, 981, 230 1, 262, 090 1, 009, 408
944,678 1, 198,612
569,144 170,000
80,841 867,875
Total of 4 principal industries .... ___________________ 7, 495,928 8, 137,966
'Voo.d('~W~re, noyelties, and dairymen's, poulterers', and apmnsts supphes_______________________________________ 405,286 183,336
Agricultural implements.................................. 321,239 142,943 Chairs and chair stock ..... __ ... __ .............. ____ ------ 289, 791 165,392 Handles ................................. --------------·--· 280,235 124,654 l\Iusical instruments ...... ----·-----·----·---------------- 260,195 107,502 'l'anksandsilos ....................... ---·-----------··--- 225,620 66 328 Ship and boat building.................................... 199,598 128:342 Fixtures ....... -------·-------------------------........... 187, 133 130,030 Caskets and coffins. _____________ .---------------------·--· 153,395 156, 108 Refrigerators and kitchen cabinets.-------··------------·-· 137,616 ' 145,745 Matches and toothpicks ............................... ---- 85,442 ' 123,426 Laundry appliances....................................... 79,502 I 38,674 Shade and map rollers ....... -----·----······----------·--- 79,2921 24,236 Paving material and conduits. ______ ---·-··--··--·-------- 76,067 3, 350 Trunks and valises __ ----------·--·-·---·-·-······------·-- 74,668 21,346 \lachine construction ........ -----------··---·····--·--··- 69,459 39,627 Boot and shoe findings____________________________________ 66,240 48,742 Picture frames and moldings______________________________ 65,478 20,947 Shutters, spools, and bobbins ....... ----------------···--- 65,148 44,022 Tobacco boxes ... -----····-·------------------------------- 64,127 38,429 Sewing machines ..... ------··----·----··------------------ 59,947 12,760 Pumps and wood pipe____________________________________ 55,827 10,831 Pulleys and conveyors____________________________________ 35,863 900 Toys ....... ------------------··--------······------------- 28,927 39,410 Gatesandfencing......................................... 27,451 1.572 Sporting and athletic goods ....................... --------- 25, 192 29,973 Patterns and fiasks ... ------------------·--------····--··-- 24,299 29,996 Bungs and faucets _____________________________ .. 21,112 2,980 Plumbers' wood""ork ________________ ............ __________ 20,313 16,273 Pencils and pen holders................................... 20,041 39,982 Eh:ctrical machinery and apparatus.·-----------------··-- 18,189 66,750 :\fine equipment.......................................... 16,988 22 Professional and scientific instruments.------------------- 15,030 15,510 Brushes .. ----------------···------------------------------ 12,879 17,033 Dowels ...... ----------------------------···--··----------- 11,981 15,087 Elevators ... -------------------------------------------·-- 10,019 4!\ Saddles and harness ............. -------------------------- 9, 218 751 Play~round equipment .. ---------------···-------·--···--- 9, 065 4, 672 Butchers' blocks and skewers ......................... ---- 8,197 4, 888 Clocks .. ----------·----·-------------------------------·-- 7, 894 3, 511 Signs and supplies_________________________________________ 6, 888 48,597 Printing materiaL_--·-··----------------···---·------·--· 5, 325 5, 984 Weighing apparatus .. ----------···------------------------- 5,022 1g Whips, canes, and umbrella sticks ..... -------··------------ 4, 947 1, 250 1;rooms and carpet sweepers ....... ----------··----·--···· 2, 277 28,452 I• !rearms ...... ---------------------·---·-----·-···-------· 2,094 1, 741 Artificiallimbs ..................... -...................... 687 698
Ifr~~~~~fipe~: :::::::::::::::::::::::::::::::::::::::::::: 4i~ ~: 61! Motion pictures and theatrical scenery --------------------
1_._--_-_--_-·_·_--_-
1 ___ 16_, _22_3
Total of 50 minor industries......................... 3, 651,767 2, 179,545
Total. all uses ............... -----------·-··-··--···· 11,147,695 10,317,511
Source: A National Plan for American Forestry.
The declining trend of lumber consumption is illustrated by the estimate of future "normal" requirements 3 of from 30 to 34 billion board feet annually, a
• A National Plan for American Forestry, p. 2M.

SFRVEY OF CURRENT BUSINESS 15
substantial decline from the 45-billion peak of 1906-07. Had lumber consumption followed the general trend of industrial expansion, its use would have amounted to 54 billion board feet in 1928 instead of 37 billion.
A Decade of Low Consumption.
For the period 1929-39 the trend of lumber consumption is indicated in table 4. It can be seen that, except in 1929, consumption was much below the estimated normal of 30 to 34 billion board feet. The decline from 1929 to 1932 was of the substantial magnitude that characterized durable-goods industries generally. Since 1932 considerable and almost continuous progress has been made, but in 1939 consumption was still more than 9 billion board feet under the 1929 total.
This failure of lumber to regain its former volume is not merely a concomitant of the depressed condition of the economy. The consumption of lumber in the building and construction field is now at the high point since 1929 and is only slightly below the level attained in that year. But in all the other areas shown in table 4 the difference between 1929 and 1939 consumption is considerable, in large part a result of the displacement of lumber by other materials.
Table 4.-Total Lumber Consumption by Major Uses, 1929-39
Year
I Building I Boxes I I R 'l I Total and con- and !Industrial pura~~os~dg Export structwn cratmg a In
I ~~----~~-----L--1\lillion feet
i 1929 _ _ _ __~ ---;~~--l~~~T--:-.6-45T_6_,o_3_5 -~ --~.-23-4---3.-oG-4 1930 ____ -·-··---· 26,408 12,600 4,038 4,793 2,796 2,271 193L _________ ! 19,070 10,058 3,358 2,290 1,704 1,660 1932 i 13, 105 6, 588 2, 578 1, 425 1, 377 1, 137 1933:=::-:::::::i 15,148 8,412 2,549 1,613 1,299 1,275
1934_ ___________ 1 15,467 1,666 1,337 1035 ____________ 1 19,306 1,580 1,301
8, 133 2, 661 1, 670 11, 427 2, 928 2,070
1936 __ --·------ 23,623 2,016 1,272 14,830 3, 193 2, 312 1937 __ - ----··· 25,093 2,448 1,414 15, 563 3,288 2, 380 1938 - 21, 663 1, 1871 947 19391 ___ ·------ 26,501 1,953 1,087
14,949 2, 741 1, 839 18,044 3,080 2, 337
929_- -- ·--- ---930_ -----------
git::·:·:-:::1 934_ ___________ 1
935 ----------- i 936. ---------- : 937------------ i ~~~~: : :::::::1
I
t 1 0:!9 estimated.
100.00 100.00 100.00 100.00 100.00
100.00 100.00 100.00 100.00 100.00 100.00
52. 10 47.55 52.74 50.27 55.53
52.58 59. 19 62.78 62.02 69.01 68.09
In pereentage of total
13.08 17.00 15.24 18.09 17.61 12.01 19.67 10.87 16.83 10.65
17.21 10.80 15. 17 10.72 13. 52 9. 79 13.10 9.48 12.65 8.49 11.62 8.82
9.11 10.55 8.94
10.51 8. 57 I
10.77 8.18 8. 53 9. 76 5. 48 7.35
I
8. 71 8. 57 8. 70 8.68 8.42
8.64 6. 74 5.38 5.64 4. 37 4.10
Source: Lumber Survey Committee quarterly reports to the Department of Con1merce.
The fact that consumption of lumber in boxes and crating is still less than the 1931 figure is indicative of the increased use of paperboard, plywood, and veneer for this purpose. It is probable that this was influenced to some extent by the shift from rail to truck transportation. The relative decline in industrial c>onsumption has been larger than in any other area and this is in some measure because of the use of alterna-
tive materials. While the Federal Reserve index of durable-goods production was almost 80 percent of the 1929 figure in 1939, the industrial use of lumber was less tnan 40 percent. In the case of railroad consumption the decline in lumber used can probably be entirely accounted for by the decrease in outlays for capital goods and maintenance rather than by further displacement of lumber by alternative materials.
The factors influencing our export trade have been of a different character. Lumber exports in 1938 totaled only 94 7 million feet, the smallest volume in four decades. Although there has been an increase of more than 100 million feet this year, the total is still only one-third that of 1929 when the United States was the major lumber exporting nation of the world. This loss has not been due primarily to a decline in consumption, for world lumber consumption, excluding the Orient, has been fairly well maintained. The United Kingdom imported more lumber in each of the past 5 years than
BILLIONS OF BOARD FEET 3.5
:] __ ~_ I • v
10 [~-----------/--~------------ -
j
.5 c· -----~~~--~~-~~-~;;~-~~~~:;-~-~~=~~-=:~~-=~-~:=--, ............. 0 ' ' ' ' ' ' ' ' ' . ' ' ' ' ' '
1910 'II '12 '13 '14 '15 'If> '11 '18 '19 '20 'ZI '2Z 'Z3 '24 '25 'ZG '27 '28 '29 '30 '31 '32 '33 '34 '3S '36 '31 '38 19)9
Fi!l,ure 11.-Total Exports of Hardwood and Softwood Lumber, 1910-39 (U. S. Department of Commerce, Bureau of Foreign and Domestic Commerce).
NOTE.-Figures for 1939 inelude estimates for December. Data for hardwood and softwood lumber are not reported separately prior to 1918.
in any year since 1913, excepting only 1927, and yet our exports to that market have dwindled. Comparative prices, freight costs, preferential tarifi's and other trade barriers, larger log exports, and, in recent years, the war in the Orient, have been the major factors responsible for the decline in our lumber exports. Imperial preference, adopted in 1931, was particularly important as it transferred a large part of our British and Dominions market to British Colombia.
lt is interesting to note in this regard that, if the World War is a reliable precedent, export prospect<; have not been improved by the renewal of armed conflict in Europe. As can be seen in figure 11, lumber exports dropped precipitously after the outbreak of wat· in 1914 and remained very low until the work of reconstruction after 1918 increased world demand. This decline was immediate; from a total of 235 million feet

16 SURVEY OF CURRENT BUSINESS
in July 1914 exports fell to less than 100 million by October of that year. Of course, even a relative decline of this magnitude is not anticipated from the present low level of exports but, on the other hand, a sizable expansion cannot be expected.
The loss that has been sustained in the boxes and crating, industrial, railroad, and export markets for lumber, means that the fortunes of the lumber industry, particularly the softwood section, are more closely tied to building and construction than they were a decade
FLOOR SPACE-MILLION SQUARE fEET CONSUMPTION- BILLION FEET 160 16
0
I\ -- !~~--~--~ ----
IJ~~~fk \ --\
\ \ \ I ~' /1_/ .......
[\, UJM8£R CONSUMPTION> 'rJ I ~ I ' 'I I/ I \-..-I - I~~~-I\ ~FLOOR,SPAC£ -/ ~ I I I
140
120
100
60
60
40
20
14
12
10
B
4
2
0 1928 1929 1930 1931 1932 1933 1934 11935 11936 ' 1937 11938 11939
Fi~ure 12.-Fioor Space of Residential Construction Contracts Awarded and Consumption of Lumber by Quarters, 1928-39.
Source: Courtesy National Lumber l\Ianufacturers' Association. Floor space, F. W. Dodge Corporation; lumber consumption for 1928 and 1929, U. S. Forest Service, and for 193Q-39 Lumber Survey Committee. Data are adjusted for seasonal variations.
ago. Whereas the construction demand was only little more than 50 percent of the lumber market in 1929 it has been close to 70 percm1t for the past 2 years. It is only because of the heavy demand of the construe·
tion industry that total lumber consumption this year has been able to rise above that of any year since 1929
There is a further significant development. While the quantity of lumber consumed in building and construction in 1939 has been only a little below the 1929 figure, construction activity itself was still much under that of 1929. This fact can be explained by the relatively greater expansion in residential building compared with other types of construction. As can be seen in figure 12, lumber consumption in recent years has become more dependent upon residential building. But several other factors appear to be important. There has been relatively more building in the smaller cities where wood is used more extensively. Architectural styles which use wood in combination \vith other materials for both exteriors and interiors have found more favor with the home builder. It also appears from the little data available that a larger proportion of the houses built have been of frame construction. Furthermore, there is little doubt that the proportion of small lower-priced homes built has been greater and that this activity has provided a large outlet for lumber. For the past several years both lumber manufacturers and retailers, through their national associations, have promoted a project known as the National Small Homes Demonstration, Inc. This project, in cooperation with Federal agencies and other private industry groups, has resulted in stimulating greater interest in housing, especially low-cost housing. The prospects for the lumber industry at this time are to a large degree dependent upon further expansion in this field. The possibilities in this field have already been demonstrated, but only a beginning has been made in tapping this market.

JANUARY 1940 SURVEY OF CURRENT BUSINESS 17
NEW OR REVISED SERIES
Table 1.-AVERAGE WEEKLY HOURS PER WORKER IN FACTORIES AND FACTORY AVERAGE HOURLY AND WEEKLY EARNINGS 1
Month
January-------------------------F<•hrunry -----------------------March.-------------------------April.---------------------------May_---------------------------June.---------------------------July ____ ------------------------
Month
January_-----------------------February __ ---------------------March •. _______________________ _
April._------------------------May----------------------------June. ____________ --- ____ -- __ ----July _______ ---------------------August ___ ----------------------Septem her _____ -----------------Octoher ____ -------------------- _ November----------------------December ___ -------------------Monthly average ______________ _
------------
-
January ____________ ~ __ ----------Fehruary ________________ ·-------March ___________________________ ApriL ___________________________ May _____________________________
June _______ ----------------------July~ __ --------------------------August. ___ ------------ __ --------Septem her ________ ---------------Octo her--------------------------Nov em her_----------------------December _____ ------------------Monthly average _________________
Jan nary--------------------------Fehruary __ --------- ___ ----------March __________________ ---------ApriL ___ --------_---------------May ___ --------------------------June _______ ----- _________________ July _______ ----------------------August. .•. _______ -- ________ ------Septcm ber _________________ --- ___ Oet0her -------------------------Novern her-----------------------December------ __________ --------
Monthly average ______ ----------
Average weekly hours per worker In factories
Hours
1932 1933 1934 1935 1936 1937 1938 1939 Month 1932 1933 1934 1935 1936 1937 1938 1939 -------------- ---------------
38.6 37.6 33.6 35.0 37.3 39.6 33.3 36.6 Au gust__---- __________________ 36.6 3~. 4 33.8 36.6 39.5 38.7 36.5 38.0 ~9. 6 38.3 35.5 36.3 37.3 40 5 34. 4 37.1 September-------------------- 38.9 36.1 33.2 37.4 38.8 37.5 37. I 3R.O 39.0 36.6 36.0 36.4 38.5 41.0 34.7 37.3 October_---------------------- 40.2 3.1. 6 34.1 38. I 40.5 ~7. 6 37.6 39.1 37.7 38.1 35.9 36. I 38.6 40.4 34.3 36.7 November-------------------- 38.9 34.2 33.8 37.6 40.5 35.4 36.6 37.6 40.8 ~5. 4 35.5 39.1 39.7 34. 5 36.9 Decem her ___________ - _________ 38.5 34.0 35.0 38.5 41.1 34.5 37.3 36.8 42.8 34.6 35.3 39.1 39.2 34.5 37.3 35.9 42.6 33.1 35 2 38.5 38.0 35.0 36.7 Monthly average ______________ 38.2 37.8 34.5 36.5 39.1 38.6 35.5
Factory average hourly earnings II Factory average weekly earnings
Dollars
1932 I 1933 I 1934 I 1935 I 1936 I 1937 I 1938 I 1939 II 1932 I 1933 I 1934 I 1935 I 1936 I 1937 I 1938 I 1939
Total, all industries
0.494 0. 421 0.526 0. 557 0. 563 0.587 0.652 0.644 19.60 16.34 17.86 19 83 21.40 2.1.83 21.66 23.80 ,486 .419 .524 • 559 .56! .592 • 647 .643 19.78 16.21 18.83 20.76 21.21 24 . .)4 22.07 24.01 .480 .420 .526 • 56! . 562 .604 . 645 .645 19.29 15. 3~ 19.36 20.90 21.99 25.35 22.23 24. 18 .477 • 416 .536 .562 • 563 .629 .642 • 642 IS. 55 15.98 19.74 20.96 22.44 26. 12 22.05 23.79 • 472 .411 • 541 .562 • 563 • 640 .640 • 643 18.35 17.10 19.61 20.55 22.72 26.22 21.92 23.84 .463 .407 . 543 • 565 .5fJ3 • 644 • 638 • 642 17.62 17. 72 19.23 20 ~2 22.70 2.1. 80 22.07 24. 17 .460 • 411 .549 • 559 .562 .648 • 631 .637 16.95 17. 75 IR 36 19.91 22. 19 25. 16 21. q,1 23.64 • 447 .472 • 547 .558 • 560 • 648 . .625 .634 16.61 18.49 18.68 20.64 22.46 25.64 22.83 24.1i2 .432 . 501 • 550 .5.13 • 557 • 647 .626 . 6% 16.60 18. 21 18 35 20.93 21.97 24.73 23.24 24.72 .427 .508 .546 • 555 .562 . 655 • 634 .645 17. (.) 18. ~6 18.68 21.43 23.20 2/i. 17 2:1.90 25.80 • 426 • 510 .548 • 557 .569 . 656 • 639 -------- 16.75 17.66 18.68 21.59 2.3. 69 23.66 23. 77 --------.426 • 517 • 554 .562 . 583 • 656 • 642 -------- 16.65 17.78 19.58 22.10 24.65 22.68 24.26 --------• 458 • 455 .541 .559 • 564 • 634 .639 -------- 17.86 17.36 18.93 20.85 22.60 24.95 22.70 --------
Durable goods
0. 546 0. 463 0. 538 o .. 183 o. 593 o. 623 0. 705 o. 710 19.60 16.15 18.18 20.99 23.34 26.33 22.90 I 26.53 .539 • 459 . 540 • 584 • 591 • 631 • 702 • 709 19.96 15.87 19 .. 11 22.62 22.80 27.35 23.42 26.78 .532 • 460 . 545 . 587 . 593 • 651 • 702 • 711 19.01 14.97 20. 47 22.70 24.30 28.62 23.69 27.02 .531 .452 . 566 • 588 • 596 .686 • 701 • 710 18.48 15.92 21.30 22.92 2.,. 42 29.87 23. RO 26.92 • 526 • 447 . 575 . 587 • 595 • 691i • 699 • 707 18.72 17.64 21. 19 22.29 25.69 29.90 23.93 26.82 • 511 . 441 • 575 • 592 • 595 • 696 • 696 • 708 17.33 18.52 20.70 21.90 25.56 29.19 23.86 27.26 • 505 • 443 • 577 • 587 • 594 • 705 • 688 • 702 16.60 18. f>2 18.89 21.21 24 .. 18 28. 23 23.32 26.31 .494 ,495 .577 • 585 • 590 • 703 . 685 • 699 15. 83 19.70 19.37 22.21 24. 76 29. 10 24. 84 27.92 • 482 • 522 • 576 • 581 • 588 . 703 . 690 • 703 15. 42 18.81 18.22 22.72 24.46 28.01 25. f>5 2K 18 • 469 • 528 • 572 • 584 • 594 . 710 . 696 • 712 16.57 19.04 19.24 23.66 2fi. 13 28.61 26.86 29.72 • 468 . 527 • 574 . 589 • 604 • 713 . 706 -------- 16.50 18. 12 19. 41 24. 19 26.83 26.47 27.02 --------. 466 • 531 .580 . 592 . 623 .710 • 709 -------- 16.46 18.10 20.61 24.52 27.79 24.59 27.27 --------.508 .485 • 567 . 5871 .597 .6861 .698 -------- 17.66 17.80 19.81 22.72 25.24 28.09 24.77 --------
I
Nondurable goods
0. 458 0.397 0.518 0. 538 0. 538 o. 555 0.609 0. 5!l2 19.59 16.47 17.62 18.87 19.58 21.29 20.47 21.29 . 450 . 396 . 514 . 540 . 537 • 557 • 603 . 59! 19.63 16. 45 18.29 19.14 19.95 21.67 20.83 21.47 . 445 .397 .513 . 542 . 536 • 502 . 601 . 591 19. 53 15.66 1~. 44 19.33 19.84 21.96 20.92 21.58 • 441 • 395 • 513 • 542 • 535 • 575 • 596 .588 18.61 16.02 18.42 19.21 19.58 22. 12 20.49 20.89 • 435 .389 .516 .543 .536 . 587 • 595 • 592 18.03 16.73 18.22 18.94 19. i9 22. 16 20. II 21.09 • 431 .386 • 519 • 544 • 536 • 594 .594 • 590 17. 87 17. 16 17.94 18.89 19.87 22.13 20.51 21. 31 .430 .391 • 528 .538 • 5~6 . 595 • 590 .5R7 17.24 17. 13 17.93 18.74 19.87 21.80 20.84 21.25 .419 • 457 .526 .538 • 536 • 596 • 585 . 585 17. 18 17.60 18. 13 19.26 20.36 21.98 21.24 21.58 .403 .488 • 532 • 532 • 532 • 596 • 582 • 583 17.40 17.77 18.46 19.43 19.71 21.28 21.32 21.54 • 403 .495 . 529 . 532 .536 . 603 • 587 • 590 17.52 17.86 18.28 19.46 20.39 21.36 21.34 22.03 .402 • 500 • 530 .532 • 538 . 602 • 586 -------- 16.92 17.32 18. 14 19. 15 20. 53 20.52 20.84 --------• 4031
• 508 • 535 • 537 . 548 • 607 . 589 -------- 16.78 17.53 18.79 19.85 21.42 20.69 21.52 --------.427 .437 . 523 • 5381 .537 • 585 .5931-------- 18.01 17.04 18.23 19.20 20.09 21.60 20.89 --------
I
t Revised series: Computed by the U.S. DrpartmF'fll oj Labor, Bttreav. o} Labor Statistics. 'The revised srrirs snpercedr those fnrrr erlr pn~lished. and they ditfrr froJP the old series in that (I) the railroad repair-shop group has hcen eliminated, and (2) a more refined system of w<•ieht ing has heen used in the construction of the revi,rd a\·erage hours and average hourly earnings. Revisions have also beeu made in several industries because of changes In the composition of the industry and the reclassification of establishments.
In addition to the data shown above, revisions in the major g-roups and in seiPrted industries hevinning November 193~ appear on pp. 28 and 29 of this issue. 'The Bureau of Lahor f\tatisties has released a mimeograph containing t.al-les of yearly BYrmges from 19:l2-19:lR and rronthly data from January 1938 to 8epterrber 1939
for the separate manufacturing industries and for the major group': this TPimeograph is a,·aiiahle upon re<]nest to the Bureau of Labor StatiBti<-s. Earlier n onthly data will be released at a later date in a special bulletin of the U.S. Department of Labor. This bulletin will contain a more complete description of the revisions and methods used in the construction of the series.
200349-40-3
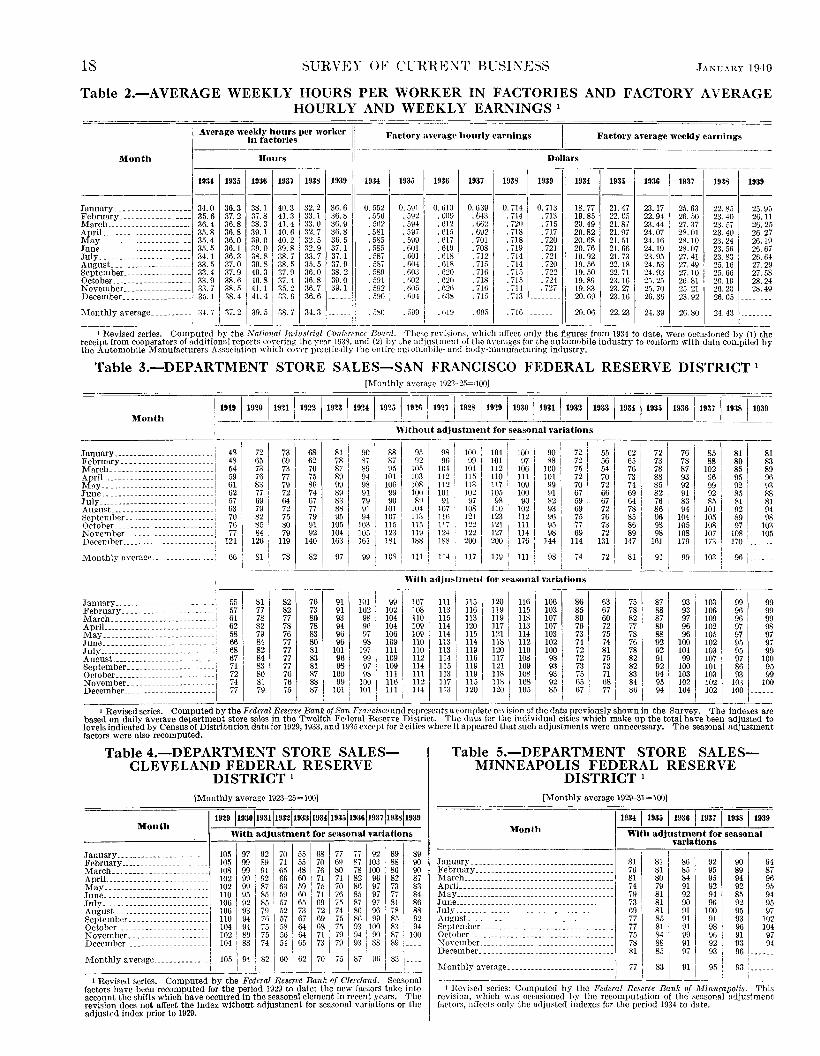
18 SURVEY OF CCRREXT BUSINESS .JAKC\HY 1940
Table 2.-AVERAGE WEEKLY HOURS PER WORKER IN FACTORIES AND FACTORY AVERAGE HOURLY AND WEEKLY EARNINGS 1
11
1 Average weekly hours per worker in factories Factory anragc hourly earnings II Factory average weekly earnings
Month Hours Dollars
' 193~ 19 35 1936 1937 1938 1939 ~. 1934 1 1935 - -;~-;----~ I'
--11 0: g~~ 0: ~~~ 0: gl£ -0--
-------
I - -~---- ---·-·----
937 1938 1939 1934 1935 1936 1937 1938 1939
------ ------ ------------------. 3 38.1 40.3 32.2 36.6 .2 37.8 41.3 33. 1 36.8
. 639 0. 714 0. 713 18.77 21.47 23. 17 25.63 22.85 25.95
. 64:1 . 714 .71:1 19.85 22.05 22.94 26.50 23.40 26.11 January __ .. ---------------February_ .. ____ .. ---------March .. ___________ --------
34.0 36 35.6 37 36.4 36 35.8 36 35.4 36 35.5 36 34.1 36 33.5 37 33.4 37 33.9 38 33. 7 38 3.5. I 38
.8 38.3 41.4 33.0 36.9 . 5112 . 594 .012
I . 581 . 597 . 615
. 662 . 720 . 715 20.49 21.87 23.44 27. 37 23. 57 26.25 ApriL .. ------------------- .s 39.1 40.6 32.7 36. s . 692 . 718 . 717 20.82 21.97 24.07 28.01 23.40 26.27
.0 39.0 40.2 32.5 36.5
.1 39.0 39.8 32.9 37.1 I .585 .599 .617
I .. o85 . not . 619
. 701 . 718 .720 20.68 21.51 24.16 28.10 23.24 26.19
. 708 . 719 . 721 20.76 21.66 24.19 28.07 23.56 26.67 May ... ______ --------- ___ .. June .... _ .. -------- .. -----. July_ ........ -------------- .3 38.8 38.7 33.7 37.1 . 587 . 601 . GIS . 712 . 714 . 721 19.92 21.73 23.95 27.41 23.83 26.64 August._. _______________ __ .0 39.8 38.5 35.5 37.9 , .587 .f>04 .il!K . 7!.5 I . 714 . 720 19.56 22.18 24.53 27.49 25.16 27.29
.9 40.3 37.9 36.0 38.2
.6 40.8 37.4 ;16. 8 39.0
. 5 41. I 35.2 :36.7 39.1
.4 41.4 33.6 36.6
I . 589 . no:; ii''O
1
.591 .no2 :a2n
. .592 .liO.) I . ()21i _ , .• IHO . ~>o4 . o:;~ I
. 716 . 715 . 722 19. 50 22.71 24.93 27.10 25.66 27.58
. 718 . 7L1 • 724 19.89 23.16 25. 2.1 26.81 26.19 28.24
. 716 .'iTt . i27 19.83 23. 27 25.70 25.21 26.20 28.49
.715 . 713 I 20.69 23.16 26.36 23.92 26. 0.5
September----------- .... --October ____ .------- _____ .. . Kovember ________________ _ December _______________ __ --· -- ------ ---- ---
Monthly average ________ -- :H. 7 I 37 .2 39.5 38.7 34.3 -- --i
_ i, . .l~o . S99 ! . nHI ! . 6\)5 . 715 i ----- I 20.06 22.23 24.39 26.80 24.43 i --------
1 Hevised series. Computed by the National Industrial Conference Board. These redsions, wh1ch affect only the figures from 1934 to date, were occasioned by(!) the receipt from cooperators of additional reports co,-ering the yeor J~:;s, and (2J by the adjustment of the averages for the automobile industry to conform with data compiled by the Automobile l\1anufacturers Association which coyer practically the entire automobile- and body-manufacturing industry.
Table 3.-DEPARTMENT STORE SALES-SAN FRANCISCO FEDERAL RESERVE DISTRICT 1
[Monthly average 1923-25=100]
Month ~-~~J ~~-~~~19~1 119221192311924119~;; lt9~611m \192s119~9~193o 11931 11932119331193~ 119351193611937 1193811939-
Without adjustment for seasonal vat·iations
I
98 i wo I I I I
551 62 I 761
I
81 I January _____________ .. __________ : 481
72 73 681 81 90 ' 88 951 104 i 100 I 90 : 72 72 851 81
~~i.fua_r:_-_--~~:::::::::::::::::::i 48 65 69 62 78 s-1 87 92 9f) I 99 I 101 I 97 ' 88 I 72 56 65 73 78 88 so 83 54 73 73 70 87 :,;g \15 ;g~ !
1114 ! 104 I 112 I 1061 100 75 54 76 78 87 102 ' ~~ I 89
ApriL ... ---.------------------ -I ~i I 76 77 75 89 94 I 101 11:? ! 115 I
ml Ill I 101 I 72 70 ! 73 88 93 961 96
Moy .. _____ .. ------- .. ------ 83 79 86 99 98 ' 106 108 I 112 I 113 I 109 I 99 70 721
74 85 92 92 \ 93 " (11 I 99 '
June.---------------- .. -- 62 77 72 74 89 ~~ I 100 I 101 1 102 100 1 HI I 67 66 69 82 91 92 I ~f I 88 July-----------------------------' 57 69 ()4 67 83 ~~ i 89 91 ' ~7 98 t8g i R2 1 59 67 64 76 S3 85 I 81 Au~ust. ......... ____ ...... ___ . _., 63 79 72 77 88 101 104 107 ! 108 110 93 i 69 72 78 86 !l4 101 I
921 94
September ....... ----. __ ........ : 70 82 ';fj 79 95 94 l 107 I 113 ! jj(j I 121 123 1121 96 I 75 76 85 96 104
1051 89 98
October __________ ---- ____ ....... ' 76 85 so 91 105 ]():;: ll5 I 115 i ll7 J'N 121 1 Ill ' 77 73 I 86 98 105 108 97 103 November ______________ 77 84 79 92 104 105 I 123 119 i 124 t22 I 127 ' 114 I ~~ I 69 721 89 98 108 107 I 108 I 105 December. .. ______ .. ___ ._ 121 126 119 140 163 161 i IS! I 188 ! IRS i zoo 1 2oo I 176 i 144 1 114 131 147 161 1 179 173 ' 170 ------
Monthly average ... __ 66 81 78 82 97 99 i lOS I m: 114 I mi 119 i 111 98 i 74 I nl 81 ! 99 i 103 I I ---- ~_l_ ______________________ I I i I I 91 1
I 96 i------
With adjustment for seasonal variations ---------~------
55 81 I 82 76 91 Jill I
99 I January ________________ I February ..... _____ ._ 57 77 82 73 91 102 I 102 ---------March .. -------------- ... ----- .. i 61 78 77 80 93 98 104 ApriL .. ________ ........ -------- 62 82 78 78 94 91\ 104 May .... ---------- .. ------.--- 58 79 76 83 96 n7 106 June .... --------- .. ---------.--- 66 84 77 80 96 98 109 July .. _______ ........ ____ .. _._ 68 82 77 81 101
I
197 111 August--------------------- ---- 67 S4 77 83 96 99 109 September ......... __ ..... _ 71 83 77 81 98 97 109 October _____ ... ___ . ___ .. _ .. 72 80 76 87 100 98 111 November. ...... --------- ...
I 74 81 76 88
I 99 liJO I llG
I December __ . 77 79 75 87 101 Hll I Ill ------------------i I
i 115
1 120 I 107 Ill 1!6 106 86 63 75 87 931 103 991
99 108 113 116 119 115 103 S5 67 78 88 93 106 96 99 110 115 113 ll9 118 107 80 60 82 S7 97 109 96 99 109 114 120 117 113 107 76 72 77 S9 96 102
971 98
109 114 115 121 114 103 73 75 78 88 96 105 97 97 110 113 114 118 112 102 74 74
i~ I 92 100 102 95 97
110 I 113 119 120 110 100 72 81 92 101 103 "j 99 112 114 116 ll7 108 98 72 75 82 91 99 107 97 100
ml m1 119 121 109 93 73 73 82 92 100 101 S6 95
119 I 118 108 93 75 71 83 94 103 103 93 99 112 117[ 115 JJ8 !08 92 I (\5 f>S 84 1 95 102 102 103 100 114 113 I 120 120 105 85 ' 67 77 so I 94 I 104 102 I 100 1------
I I 1 I .. 1 Hevisert series. Computed by the Federal Reserve Bank of San I- ranc1scn and represents a complete rev1s10n of the data prevwusly shown in the Survey. The indexes are
based on daily average department store sales in the Twelfth Federal Heserve District. The data for the individual cities which make up the total have been adjusted to levels indicated by Census of Distribution data for 1929, 1933, and 1935 except for 2 cities where it appeared that such adjustments were unnecessary. The seasonal adjustment factors were also recomputed.
Table 4.-DEPARTMENT STORE SALESCLEVELAND FEDERAL RESERVE
DISTRICT I
[Monthly average 1923-2.1=100]
Month 1929 11930119311193211933119341193511936119371193811939
With adjustment for seasonal variations
January_______________ 105 97192170 55 II GS 77 771 92 89 89 February________________ _____ 105 99 89 71 55 70 69 ~~ 103 88 90 March ... _________________ .. _ 108 99 91 65 48 76 80 78 100 86 90 ApriL________________ 102 99 92 66 60 71 71 82 96 82 87 May_____________________ 102 99 87 6:J 59 75 70 Sfl 97 73 83 June_____________ 110 95 85 .o9 GO 71 76 85 97 77 84 July___________________________ !06 92 85 57 65 i\9 75 87 97 81 86 August_ ________________ ____ 106 93 79 52 73 72 74 86 96 I 78 88 September.__________________ 110 94 76 57 67 69 75 86 99 I 85 1 92 October______________ 104 94 75 58 64 f>S 75 I 93 1
1
!110 I w; I 94 November___________________ 102 89 75 56 64 71 79
1 94 90 1 87 100
December_________________ 104 SS I 74 54 65 73 791 9l 88189 ..
Monthlyaverage ______________ i 105 9111 82160162 70
1. 75187! 9G, 83!----
, I I ' I ' 1 Revised series. Computed by the Federal Reserve Bank d Cleveland. Seasonal
factors have been recomputed for the period 1929 to date; the new factors take into account the shifts which have occurred in the seasonal element in recent years. The revision does not affect the index without adjustment for seasonal variations or the adjusted index prior to 1929.
Table 5.-DEPARTMENT STORE SALESMINNEAPOLIS FEDERAL RESERVE
DISTRICT I
[Monthly average 1929-31=100]
Month 1934 11935 11936 Jt937 11938 11939
With adjustment for seasonal variations
January_____________________________________ 81 81 i 861 92 90 I February___________________________________ 76 81 85 95 89 March ______________________________________ , 81 SO 84 95 94
tr:~l_-_~:::::::::::::::::::::::::::::::::::::1 ~t ~i ~~ 1 ~~ ~; June________________________________________ -
6,,39
81 90 1 96 92 July________________________________________ 81 91 1100 95 August_____________________________________ 77 85 91 91 93 Reptember__________________________________ 77 Sl 91 98 I 96 October.___________________________________ 75 84 99 961 91
94 87 96 95 94 95 97
102 104 97 94 N'onmber____________________________ _____ 7S 881 91, 92 93
December ______ ---------------------------'~ 81 S5 971 93 i 96
Monthly aYerage___________________________ 77 : 83 91 1 95 I 93 i------' He,-ised series: Computed by the Federal Reserre Bank of Minneapolis. This
revision, ''hich was occasioned by the recomputation of the seasonal adjustment factors, affects only the adjustert indexes for the period 1934 to date.

JANUARY 1940 SURVEY OF CURRENT BUSINESS 19
Monthly Business Statistics The data here are a continuation of the statistical series published in the 1938 supplement to the SuRVEY OF
CuRRENT BusiNESS. That volume contains monthly data for the years 1934 to 1937, inclusive, and monthly averages for earlier years back to 1913 insofar as available; it also provides a description of each series, and referrnces to sources of monthly figures prior to 1934. The 1938 supplement may be secured from the Superintendent of Documents, Government Printing Office, Washington, D. C., for 40 cents per copy.
A few series have been added or revised since the 1938 Supplement went to press. These are indicated by an asterisk (*) for the new series and by a dagger (t) for the revised series. A brief footnote accompanying each of these series provides a reference to the source where the descriptive note may be found.
The terms "unadjusted" and "adjusted" used to designate index numbers refer to the adjustment for seasonal variations. Data subsequent to November will be found in the Weekly Supplement to the SuRVEY.
Monthly statistics through December 1937. to-~19391 1938 I gether with explanatory notes and references --- ----.-~---
1
to the sources of the data may be found in the Novcm- No vern- Decem- Janu- Febru-1 Ma ch I 1938 Supplement to the Survey ber ber ber ary ary r
INCOME PAYMENTS t Adjusted index. .....•.••.•...•...... l929=100.. 88.8 TotaL. ____________________________ Mil. of doL 5,817
SaiRries and wages: Adjusted index .................. 1929= 100 .. 1'otaL _____ ------------ ........ Mil. of doL
Commorlity producing industries .. do .. .. Distributive industries ....... __ .... do .. .. Service industries. __ ..... -------- .. do .. .. Government. ___ ... __ .. ------- ..... do ... . Work relief wages .................. do .. ..
Direct and other relief. _______ ......... do .. .. Social security benefits and other labor in-
come ..... ------------ __________ Mil. of doL. Dividends and interest. ................ do .. .. Entrepreneurial income and net rents and
87.5 3,842 1, 433
903 841 531 134 90
129 496
royalties... ______ ............. Mil. of doL 1, 260 Total nonagricultural income __________ do____ 5,231 Arljusted index of nonagricultural in-
come _________________ ....... 1929= 100. _ 89.6
INDUSTRIAL PRODUCTION (Federal Reserve)
Combined index, unadj•rsted ..... 1923-25=100.. • 124 Manufactures, unadjusted ............. do.... • 123
Durable goods• _____________________ .do____ • 125 A ntomobiles. _________ ............. do.___ 108 Cement. __ .............. ___________ do ... _ 90 Glass, plate ........................ do.... 191 Iron and steeL. ____________________ do.... 155
Nondurable goods• __________________ do.... • 122 Leather and products .............. do____ • 107 Petroleum refiningt ................ do .... ---------Rubber tires and tubest ............ do .... J---- ____ _ Blaughtering and meat packing ..... do .... J 111 Textiles ... __ .. _________ .. -------- .. do .. __ 131 Tobacco manufactures ............. do.... 175
::VIinerals, unadjusted .................. do.... • 126 Anthracite ........................... do.... • 62 Bituminous coaL .................... do.... • 102 Iron-<>re shipments ................... do.... 130 Lead .... _______ .... ------------- ...... do____ 86 Petroleum, crnde .................... do.... • 186 Silver ........................ ____ .... do .•.. Zinc ______ ............ __ .............. do.... IIi
Combined Index. ad)nsted ............... do.... • 124 Manufactures, adjusted ................ do.... • 124
DurabiP goods• ...................... do.... • 130 A uto!llobiles ... ------- ............. do.... ?0 Cement.._ ... ____ ................. .do.... 91 Glass, plate ........................ do.... 191 Iron and steeL ..................... do.... Hi7
Nondurable goods• .................. .do.... • 118 LPather and products .............. do.... • 112 Petroleum refiningt ................ do .... ---------Rubber tires and tubest ............ do ... . Slaughtering and meat packlng .... do.... 100 Textiles __ ...... ----------- ......... do.... 126 Tobacco manufactures ............ .do.... 172
Minerals, adjusted .................... .do.... • 124 Anthracite. __________________________ do.... • 60 Bituminous coaL .................... do.... • 91 Iron-ore shipments ................... do.... 155 Lead ... _------- .. ____________________ do.... 83 Petroleum, crude _________________ .... do.... • 188 Silver. _______________ ........ _____ • __ do .... Zinc ____________ ------- ............... do.... 117
Revised •Preliminary.
83.1 5,507
82.4 3,634 I, 248
853 799 531 203 83
126 484
1, ISO 4, 967
84.2
104 103 92
115 83
155 100 113 102 208 100 104 116 167 105 60 86 35 69
153 55 88
103 103 94 96 84
155 108 110 107 208 100 94
112 164 102 58
•77 42 66
r 164 51 88
BUSINESS INDEXES
83.4 6,145
83.0 3,672 I, 244
889 814 527 198 88
124 1,115
I, 146 5, 657
84.7
98 98 85
117 64
153 89
108 104 202 112 101 111 145 103 66 82 0
58 164 86 96
104 104 92 99 82
15.1 101 114 123 201 112 86
117 179 109 67 78 0
57 169 85 94
83.3 5, 703
82.3 3,525 1, 191
841 800 505 188 92
128 827
I, 131 5,244
84,4
100 '99
84 105 42
147 90
111 115 205 110 101 114 157 105
74 83 0
71 164 86 94
101 100 88
105 69
147 93
110 124 205 110 87
109 165 110 69 75 0
70 171 86 89
83.0 5,247
82.0 3,522 1,215
826 796 503 182 93
ml 1, 066 4,848
84.4
99 98
'84 '100
48 133
92 111 126 202 109 83
115 147 105 66 83 0
75 166 108 93 99 97
'84 '100
80 133 88
109 124 201 109 83
109 162 110 61 79 0
73 169 I 100 I 87 I
84.1 5, 727
82.1 3,575 1, 235
850 797 506 187 95
148 772
1,137 5,256
84.8
100 100 86
105 65
138 93
111 125 201 114 84
112 156 102 50 77 0
70 171 94 96 98 96 80 91 90
131 83
110 121 202 114 89
110 164 110
61 77 0
69 173 86 90
1939
April I May I June I July I August I te~b~r !october
83.0 5,654
81.0 3,550 1,212
849 799 510 180 90
133 760
I, 121 5,192
!13.8
95 96 84
106 79 91 87
106 112 208 104
81 100 151 88 83 26 0
70 174 102 94 92 92 76 87 81 83 79
105 115 209 104 90 97
164 95 80 31 0
71 174 101 91
I
83.4 5,432
81.4 3,598 1,235
862 806
1~g I 87
139
~;;;I 84~: I
94 78 88 88 93 79
107 105 211 102 92
104 172 97 73 40 82 so
177 69 90 92 91 71 73 75 89 73
108 113 211 102 94
104 170 98 73 46 55 82
175 71 89
84.1 1 5,918
82.8 3,665 1,281
874 815 530 165 85
145 920
I, 103 5,453
85.4
981 97 85 91 98
112 89
108 104 215 112 86
105 186 105 51 63
132 71
173 105 87 98 97 82 81 79
124 89
110 108 215 112 87
111 170 104 59 71 67 70
170 107 90
83.7 5,695
82.8 3, 516 1, 271
868 810 422 145 85
136 849
1, 109 5,222
85.5
97 95 83 66
100 78 93
105 112 211 111 84
103 171 107 44
~~I 65
178 59 84
101 100 88 87 82 87
100 110 114 212 111 89
111 158 106 53 75 74
681 174 10 I 91
85.4 5,400
84.0 3,560 1, 318
871 813 423 135 87
145 451
1, 157 4,887
86.7
99 99 85 28 98
121 103 111
r130 217 122 80
112 ISO 96 1
53 I 75 I
159 1
~~~ I
78 87
103 104 92 89 76
121 105 115
r 117 218 122 92
120 168 91 53 77 78 71
127 79 93 I
•86.8 r 6,020
r 84.4 1
'3, 7021 '1, 3fi9
r891 821
•507 114 '87
135 805
1, 291 r 5, 374
'87.0
112 110 99 59 98
165 120 119 120 221 123
91 121 181 123
72 90
187 67
179 98 93
111 111 103 85 78
165 121 117 104 221 123 100 121 164 114 71 84 97 71
174 104 '
DS
'88.1 6,204
'86. 7 r 3,867
'1:~~ 835 538
'129 '88
128 r 783
1, 338 5, 519
'88.8
'124 122
'123 '93
99 222 152 122
'119 233 126 97
129 179
'132 '74
'104 218
72 '183
90 106
'121 '121
123 r 78
87 222 157
'119 '108
232 126 99
125 166
r 121 58
r 94 128
70 '181
91 110
•New series. For indexes of durable and nondurable goods production beginning 1919, see table 8, p. 14 of the March 1939 Survey tRevised series. Petroleum refinin~. revised beginning 1934, and rubber tires and tubes, beginning 1936; see table 36, p. 17 of the August 1939 Survey For revised income
r•c::;ments he~inning 1929, see table 41, pp. 15 and 16 of the October 1939 issue.

20 SURVEY OF CURRENT BUSINESS JAN"GARY 1940
Monthly smtistics through December 1937, to-~19391 193~ I gather wath explanatory notes and references ----&<>the sources of the data may be found in the Novem· Novem-1 Derem- Janu- I Febru-1 March I April I 1938 Supplement to the Survey ber her ber ary ary May I June I July I August I te~b~r !october
BUSINESS INDEXES-Continued
AGRICULTURAL MARKETINGS I I I I
Quant!tie' m•rketed: Cou1 bln~rl lnrl~x ...••••••••••••• 1923-25-100 •• 104 99 76 65 56 68 65 81 82 94 85 120 125 Animal pr<~lucto ____________________ .do •••• 90 89 81 77 64 78 81 99 93 88 84 82 87
D11iry products. __ --·-·----------- .do .••. 80 87 91 97 94 104 103 135 145 133 122 100 90 Livestock ...... ------··············do •••. 82 78 67 73 56 66 62 72 62 66 70 78 90 Poultry and eggs ••••••••••••••••••. do .••• 12tl 116 116 so 70 104 123 145 114 91 79 71'> 75 WooL ••• --------------------------do .••. 42 1HO 68 41 50 45 77 193 387 386 266 144 90
ere~: t.iii~ ~= :::::::::::::::::::::::::: ~~:::: 119 108 71 53 4H 57 50 63 71 101 87 159 163 200 154 78 37 34 35 22 23 26 46 75 2fil 278
FruIts .. ---·---- ____ •• _____________ . do ____ 75 79 85 82 78 93 95 92 81 78 80 79 95 Grains ... -------------------------·do .... 68 85 62 51 38 50 50 80 101 184 ll6 120 94 Veg~tahles. ---------------- •••••••. do •••. 66 67 61 77 78 107 89 109 112 49 41 72 82
Oash lncnm~ from farm marketln~rs: Crops and livestock, combined Index:
U nodju~ted ••.•• ___ ••• __ •••••. 1924-29 = 100 .. 78.5 78.0 72.5 68.5 51.0 57.5 55.0 60.0 59.0 63.0 71.0 92.5 96.0
A~~~~~~:::::::::::::::::::::::::::::~~:::: 74.0 69.5 68.0 67.5 60.0 64.0 64.5 65.0 60.0 62.5 71.0 79.0 72.5 62.0 55.5 55.0 55.5 44. 5 49.5 51.5 49.0 45.0 51.0 66.5 70.0 61.5
Llv~stock and products ••.••••••••. do .••. 86 5 84 0 82.0 80.0 76.5 79.5 78.0 82.0 75.5 74.5 75.5 88.0 S:!.li Dairy proilucts. -----------------do .. _. 91.0 85.5 89.5 88 5 85.5 80.0 76.0 76.5 77.0 77.0 81.5 87.0 8!1.0 Meat animals._ ------------------do ____ 87.0 83.5 78.0 79.0 77.5 84.0 75.0 83.5 76.0 73 -s 74.0 89.5 83. Chickens and e~gs ............... do ••.. 74.0 83.5 81.0 67.0 56.5 71.5 70.0 80.0 73.0 75.0 70.0 73.0 66.5
WORLD STOCKS Com blned Index (quantity)t •••.• 1923-25-100 .. (1) 192 189 186 183 181 182 182 190 (I) (I) (1) (')
Cotton, arljust~il. _ .•. -----------------.do .. _. --------- 202 201 202 204 201 205 2ll 223 245 241 --------- --------Ruhh~r. ailjustedt -------------·-------do .... -----io5· 284 255 268 258 248 241 239 227 218 208 --------- -----iii; Silk. ailjn,ted. _------------------------do .... 172 164 144 120 111 101 84 88 98 101 107 Sugar. ailjusted. --------------- ••••.••• do •... 188 192 184 187 191 187 184 185 194
=====i~~r===ii~= ----~---
Tea, adjnst~il. -------------------------do .... 129 127 132 126 118 110 106 105 108 Tin, unailjusted ________________________ do ..• _ 139 102 105 lll 126 127 129 119 115 115 15 Wheat, adjusted. ----------------------do .. __ 169 167 162 151 151 162 166 186 --------- ------- --r--------~-----.--
COMMODITY PRICES
COST OF LIVING
(National Indmtrlal Con[erenu Board)
Combined lndex _____________________ 1023= 100 .. 85.7 85.6 85.8 85.4 85.1 84.9 85.0 84.8 84.7 84.9 84.5 8~.9 • 8.~.8
~~~~-I~~:::::::::::::::::::::::::::::::~~:::: 72 9 73.2 73.0 72.7 72.4 72.3 72.2 72. I 72.0 71.9 71.9 72.2 72.6 79 6 79.5 80.3 79.2 78.4 78.0 78.2 78. I 77.9 78.1 76.7 80.7 • 80.1
Fu~l and light __________________________ do ____ 85.6 85.9 86.0 85.9 85.9 85.8 85.2 84.0 83.4 83.8 84.0 84.4 85.2
~;~.I~r~---_-_-_-_-_-_-_-_-_-_-_-_-_-_-_-_-_-_-_-_-_-_-_-_-_-_-::::~~:::: 86.7 86.4 86.2 86.2 86.1 86.1 86.2 86.2 86.0 86.3 80.3 86.5 86.6 96.8 96.8 96.8 96.8 06.7 96.7 96.7 96.6 96.6 96.9 96.9 97.0 96.8
I PRICES RECEIVED BY FARMERS§ I
I ( U. S. Department of Agriculture)
Com blned index ____ --------------1909-14= 100 .. 97 94 96 94 92 91 89 90 89 89 88 98 97 Chi~kens and e~gs ___ ------------------do ____ 117 131 127 97 91 88 87 85 83 89 90 102 108 Cottr.n and cottonseed _________________ do ____ 75 73 70 71 70 71 70 72 73 73 71 76 74
~:~rr.~~~~-~~~--~~:::::::::::::::::::::~~:::: 117 109 ll2 109 107 100 95 92 94 96 100 107 112 66 71 73 76 78 81 82 85 93 80 70 73 73
Grains .. ______ -------------------------. do .•.. 79 60 63 66 66 66 67 72 73 66 64 83 77 Meat anlmals __________________________ do ____ 107 111 109 112 116 l16 114 112 107 107 101 117 112 Tmrk crops.------------- ______________ do ..• _ 130 102 108 96 108 114 102 110 105 101 101 114 128 Miscellaneous ••..• _ •• ______ ••••••• _____ do __ ._ 98 95 108 109 92 83 86 83 81 89 100 98 94
RETAIL PRICES
U.S. Department of Labor Indexes: Coal: ·
A nthraclte. _ -----------------1923-25-100 .. ·-------- --------- 81.8 ................... -·------- 80.8 --------- --------- 75.1 --------- --------- 75.7 B i turn inous. _ •••••• ________ ••••• __ • __ do._._ -·------ ----77:8- 89.3 ----77:6· ----;6:8· 89.4 ----76:6· ----76:5· 85.2 8fl 9
Food._. _____ . --------------------------do ____ 77.9 78.6 76.4 76.3 ----76:5· ----75:i· 79.0 78.4 J'elrehil<l's lnd~x:
Combined lndex .••.•••••. Dec. 31, 1930=100 •. 91.9 88.9 88.9 89.1 89.1 89.1 89.1 89.1 89.1 89.3 89.5 90.2 91.2 Am:~!~· ____________________________ do ____
~6 4 96.4 96.3 96.3 96.2 96.2 96.0 95.9 95.9 95.9 96.0 06.1 96.3 Men's -----------------------------do ____ 88.7 88.7 88.7 88.7 ~8- 5 88.4 88.4 88.4 88.4 88.4 88.4 88.6 88.7 V. omen's .. _. __ --·-----------------do ____ 90.9 89.2 89.0 890 8k 9 88.8 88.8 88.8 88.9 88.9 89.0 89 5 90.4 Horne furnishlngs ____________________ do ____ 93.5 90.4 90.4 90.5 90.5 90.5 90.5 90.5 90. H 90. ~ 90.7 91.7 92.7
Piece goods .•. ---------- --------------do ____ 85.0 84.4 84.3 84.3 84.3 84.3 84.1 84.1 84.0 84.1 84.1 84.3 84.7
WHOLESALE PRICES
U.S. Derartm~nt of La nor lnil~xes: Con bined index (813 quotatlons) .• 1926=100 •.
Econ<·mic da~sPs: 79.2 77.5 77.0 76.9 76.9 76.7 76.2 76.2 75.6 75.4 75.0 79.1 79.4
Finished products •.• _________ ._. ___ do ____ 82.0 80.5 80.2 80.0 80.2 80.2 80.1 79.9 79.6 79.2 79.1 81.9 82.3 Raw n,a•er'als __ --------------·---do •.•• 72.4 71.5 70.9 70.9 70.9 70. I 68.5 68.9 67.7 67.8 66.5 72.6 72.3 Sernirnanufactur~s •• --------------do ____ 82. I 76.2 75.2 74.9 74.4 74.6 74.4 74.3 74. I 74. 4 74 5 81.8 83.1
Farn• J•roducts. __ --------------·-----do ____ 67.3 67. ~ 67.6 6'. 2 67.2 65.8 63.7 63.7 62.4 62.6 61.0 68.7 67. 1 Grain, _____ ------ --------------·---do ____ 64.1 50.9 54.4 56.3 54.7 54. 5 55.2 59.6 58.2 52.3 51.5 65.1 61.6 Livestock and poultry ---------·---do ____ 66. I 75.2 74.4 78.0 79.2 78.2 75.5 73.2 69.4 69.7 6H.O 76.3 70.5
Foods. _______ .----------------------do ____ 723 74. 1 73.1 71.5 71.5 70.2 68.6 68.2 67.6 67.5 67.2 7.1.1 I 73.3 Dairy products. ______ --·----------. do ____ 80.1 72.5 73.9 71.8 71.6 64.8 58. 1 58.6 60.0 64.6 67.9 74.51 78.9 Fruits and vegetables •••.•...•••••. do ____ 61 2 63.0 60.4 60.9 62.1 63.2 64.3 63.8 62.5 62 0 58.5 62.8 60.2 Meats. ____________ ------------ __ .. do ____ 71.2 81.9 79.9 81.6 83.2 82.5 81.0 78.6 75.7 75.3 73.7 81.0 74.9
Oommoditi~ other than farm product• and foods.-----. _____ ------------1926= 100 .. 84.0 80.6 80.3 80.2 80.2 80.4 80.5 80.6 80.2 80.2 80. 1 82.1 83. s Build in~ materials ________________ . do ..•. 93 0 89.2 89.4 89.5 89.6 89.8 89.6 89.5 89.-5 89.7 8P 6 909 92.8 Brirk and tlle. --------- __________ do ..•. 91.6 91.5 91.5 92.4 92.4 92.5 93.0 91.7 91.1 90.6 90.5 91.0 91.5 Cementt _ ••• _ ..... --------.----.do •••. 91.3 90.6 90.6 90.6 91.2 91.5 91.5 91.5 91.5 91.5 91 3 91.3 91.3 Lnm her--·------------------- •.•. do ..•. 98.3 00.2 90.9 91.7 92.6 92.1 91.5 91.2 90.7 91.8 91.8 93.7 98.0
•Revised. I Temporarily discontinued; for several of the series, European >torks have not been S'<'Ailahl~ ~ince the outbreak of war. tR<•vl•~d series. Comhin~d ind~x of world storks r~vised heginnin~ January 1920: see tahl~ 5. p. 17 of th~ January 19~9 Survey. Cement price lnrl~x revl,ed be-
ginn in~ 192A and data not shown on p.20 of the May 1919 f'un·ey will Bf'!•ear in a 'llhsequent isme; the building materials group and the combined index of all commodities have not heen revised. as the effect of the ehan~~ in rem~nt prices on these Indexes is •mall.
§Data for Dec. 15, 1939: Total 96, chickens and eggs 97, miscellaneous 104.
cotton and cottonseed S2, dairy products 118, fruits 65, grains 87, no eat animals 101, truck crops 96,

JANUARY 1940 SURVEY OF CURRENT BUSINESS 21
gether with explanatory notes and references --- -------- ----,----.-----.-----.----;---.----r---.----,---Monthly statistics through December 1937, to-~19391 1938 I 1939
lo the sources of the data may be found in the Novem- Novem·J Decem- Janu- I Febru-1 M h I A ·1 I M I J I Jul I A tl Sep- I 0 t b 1936 Supplement to the Survey ber ber ber ary ary arc Prl ay une Y ugus tembcr c 0 er
COMMODITY PRICES-Continued
I I
I WHOLESALE PRICES-Continued
U. 8. Department of Labor lndexes-Contd. Combined index-Contd.
Commodities other than and foods-Continued.
farm products
Chemicals and drugs __________ 1926=100 .. 78.0 711.6 76.7 76.7 76.3 76.5 76.0 75.9 75.7 75.0 74.6 77.3 78.1 Chemicals~ _.~ ... ______________ do ____ 81.4 80.2 80.0 79.7 79.4 79.9 79.3 79 4 79.2 78.2 77.5 81.2 82.1 Drugs anrt pharmaceuticals ______ do~--- 75 0 736 73.5 73.0 72.7 72.2 71 9 71.9 719 71.8 71.7 72.8 74.4 Fertilizer materials~~-~_~ ......... do .... 73 0 67. 7 68.6 70.2 69.3 69.1 69.6 69.7 69.5 67.5 67.2 69~ 2 70.6
Fuel anrt lighting materlals ________ do ____ 74.1 73.7 73. 2 72.8 73.0 73. 1 73.4 73 9 73.0 72.8 72.6 72.8 73.9 Electricity ..• ____________________ do ____ -------· 81.8 82.7 62.9 82.8 80.3 81.4 79.3 77.8 78.1 75.8 77.5 75.4 Gas ......... ________________ do .... ------- 84.6 81.6 82.2 81.8 82.2 84. I 86.0 88.9 89.0 86.7 87 2 84.4 Petroleum products ___ .......... .do .... 53 9 51. 5 50.9 50.4 50 7 50.9 51.9 52.5 52.5 52.2 51.7 53.3 54.0
Hi,les and leather products ________ do .... 1040 94.6 93.1 93. I 91.9 91.8 90.9 \H.6 92.3 92.5 92.7 98.5 104.6 Shoes~ . ____ ~ _ ~ ___________________ do_ ... 107. 2 100. 4 100.6 101 2 101. I 101.2 101.2 101.3 101.3 100.8 100.8 10!. ~ 105.7 Hi,!es and sklns __________________ do .... 101 3 85.5 78.8 78.4 72.8 73.8 68.3 72. I 75. 3 76.9 77.2 97. 4 112.4 Leather_ .. ~----------------------do ____ 97~ h 86.9 85.9 85.0 84.2 82.7 82.8 83.1 83.8 84. I 84.0 920 97.8
!Ionse-furnishlng goods.---------- .do ____ 88~ 4 R5. 8 86.0 85.4 8~. 2 85.2 85.4 85.5 85.6 85.6 85.6 86 6 87.8 Furniture_. ______________________ do ____ 82.1 81.9 81.6 80.5 80.5 80.5 81.0 81 0 81.0 81.0 81. I 8!. 3 81.7 Furnishings ___ ... __ . _____________ do ____ 94.2 89.7 90.3 90. I 8g. 8 89.7 89.6 89 8 90.0 90.0 90.0 91.7 93.7
Metals and metal products _________ do .... 9R o 94.9 94.6 94.4 94.3 94.3 94.0 93.5 93.2 91.2 91.2 94.8 95.8 Ir·•n and steel ___________________ do ____ 96 0 96.9 96.8 96.4 96. I 96. I 96.1 95 7 95.2 9.S.l 95~ I 95.5 96.0 Metals, nrmferrous ______________ do ____ 85.1 77.6 76.8 76.7 76.5 76.6 74.7 73.1 72.9 73.3 74.6 84.7 85.3 Plumbing and heating equipment
1926=100 .. 79 3 78.7 78.7 78.7 79.2 79.3 79.3 79.3 79.3 79.3 79.3 79.3 79.3 Textile products ____________________ do ~ ___ 76~ 4 66.2 65.8 65.9 66.1 66.6 66.9 67.5 67. 3 67.6 67.8 71.7 75.5
Clothing .. ---------------------.do ____ 83.8 81.6 81.6 81.5 81.5 81.5 81.6 81.7 81.7 81.2 81.5 81.7 83~ 2 Cotton goods .. __________________ do ____ 74.8 65. 1 64.6 64.3 63.7 63.7 63.4 61.3 64.1 65. I 65.5 70 4 74.3 Hosiery and underwear __________ do ____ 64~ R 59.9 59.3 59. I 58.8 59.9 60.2 60.2 60.1 60 2 61.5 62.8 63.5 Silk and rayon __________________ do .... 47.7 30.3 30.8 32.1 34.7 36. 1 37.8 40.7 39. I 40.2 39.5 4:!. 4 46.2 wo .. len and worsted goods ....... do ____ 90.5 76.4 74.8 74.5 74.7 75. I 75.2 7.i 4 75~ 6 75.4 75.5 84.0 91 3
Miscellaneou• __ ~. __ ~._. ___ . ________ do .... 77.0 73.0 73.1 73.2 73.5 74. I 74.4 74~ 2 73.8 73.4 73.3 76. fl 77.6 Aut.omnhile tires and tubes ...... do .... 55.6 58.8 58.8 58.8 59.7 60.5 60.5 60~ 5 60.5 60.5 60.5 flO. 5 60.5 Paporan•l pu/fs ---------~---.do ____ 88.0 81.5 80.9 81.0 81.1 81.3 81.1 80.4 79.9 79.9 80.0 81.8 86.3
World prices, foo1lstu sand raw mAterials: Corn hlned In <lex t _______________ 1923-25= 100 .. (1) 37.5 36.5 37.2 37. R 37.3 38.4 41.3 41.0 39.6 38.0 (1) (1)
Cot. ton~ -----------------------------·do .... 36 0 33.5 32.0 32.7 33. l 33.1 32.4 35 3 36.4 35.7 34. fl 34.2 34.2 Ru hber. _ -------------------------· . .do~ ___ 47 :l 38.0 37.6 36.9 37. 3 38.1 37.2 37 6 38 3 38.7 39.0 49 7 46.6 Silk._ --------------------------------do ____ 47~ 4 25.2 25.3 26.5 29.5 31.0 33.4 37 6 35.4 37.0 36~ 9 418 45.7 Sur,art _______ .. ____________ -- ___ ----_.do ____ 40.8 28.8 30.4 31.3 30 9 31. g 35.2 40.5 37.4 37.7 32.7 59.7 49.4 'I' ea. ~ --------------------------------do ____ --~---- 66.0 61.2 66.7 67.0 66.6 69.6 68.9 68.8 67.5 74~ 3 --------- --------Tin._--------------------------------do~ ... 103.9 92.0 91.9 92.3 90.8 91.9 93. g 97.5 97~ 2 96.5 97.0 126.8 109.9 Wheat ____ . __________ .. __ ._ .. __ .. do~. __ --------- 42.3 38.1 39.3 41.1
Whole~a!e prices, actual. (See under respective 36.8 38.6 40.4 40.8 34.3 32.4 --------- --------
commodities.)
PURCHASING POWER OF THE DOLL&.R
Wholesale prlces __________________ l923-25= 100 .. 127 2 129.9 130.8 130.9 130. g 131.3 132.1 132.1 133.2 133.5 134.2 127.3 126.8 Retail food prlces ________________________ do ..... 128.4 128.5 127. 2 129.0 130.2 130.9 130.5 130. 7 131. 1 130.7 133.2 126.6 127.6 Price• received by farmers. ______________ do ____ 151. .'i 156. 5 153. 1 156. 5 15~. 7 161.6 IM. 3 163.4 IRS. 3 165.3 166.9 14~ 9 151.5 Cost of living __ --------------------------do .... 118.6 11~.8 118.5 119.0 119.5 119.8 119.6 119.9 120.0 119.8 120.3 118.3 •118.5
CONSTRUCTION AND REAL ESTATE
CONTRACT AWARD~, PERMITS, AND I I DWELLING UNITS PROVIDED
I Value of contracts awarded (F. R. Indexes): Total, unadjusted .. ~ ___________ 1923-25= 100 .. • 65 85 77 70 63 69 76 75 73 73 76 73 '72
Residential, unadjusted ____________ .. do. ___ • 63 54 48 45 51 58 68 65 64 63 66 68 •66 Total, fuljustert ___ .~ ___________________ do .... •72 96 96 86 73 69 67 63 63 67 73 73 '76
Res\flential, adjusted ..... _____ ........ do .... • 65 56 57 55 58 55 58 55 58 62 67 68 •68 F. W. Dmlge Corporation (37 States):t
Total projects _____________________ . _number __ 22.323 17,772 16,027 13.281 13,015 20,233 22,282 23. 244 21.701 21.806 23.270 25, 9R4 22,402 Total valuat.ion ________________ thons. of doL 299, R47 301,679 389.439 251, fi73 220, 197 300,661 310. o:1o 308. 4R7 2R8, 316 299. R83 312. 328 32'1, 227 261.796
Public ownership. _________________ do ____ 14'l,647 178. 948 279, 403 147.916 110. 975 127, 776 159,6M 1~4. 757 127,1\95 136, 543 1.ix. 459 141.216 91,604 Private ownership_ .. ______________ do .... 156,200 122,731 110,036 103, 757 109,220 172,885 170,374 173,730 160,721 163, 340 153, 869 179, Oil 170,192
Nonresidential buildings: Projects.---------- __ ------ ____ .. number __ 3, 242 3,585 3,495 2. 456 2,348 3. 592 3,400 3. 457 4,052 3,R23 3,453 3,650 2. 749 Floor area,. _______________ thous. of sq. ft._ 15,418 21.515 25,503 14.351 12,783 17,944 16,563 12.700 15,418 17,691 12. 268 16.490 15.4!!4 Valuation .. __ --------- ___ ~ .tbous. of doL. 77,769 116,008 139,513 84,999 69.544 97,786 94,656 76,749 92,845 88,501 69,882 82,466 72,684
Residential buildings, a)! types: Projects.---------------------- .number __ 17,756 12.515 10,413 9, 7.>0 9,669 15,438 17,387 18.262 15,942 16,287 18,003 17.589 17.136 Floor area ________________ thons. of sq. ft .. 31,009 23.405 22,720 19.981 19. 176 30. 725 28.382 32.602 27.502 27, 181 31. 165 ~2. 9771 20, 371 V•luation_. ________________ thons. of doL. 116, 5~8 95,253 91,539 80, 163 79,020 125,225 114,405 133,818 Ill, 896 109, 330 127,163 129, 680 118, 303
Public utilities: Projects ... -------------------_ .number __ 350 330 500 258 273 259 323 251 234 254 328 356 294 Vahmtion __________________ thous. of doL. 23,906 19,726 44,312 29,509 18, 518 19, 640 35,336 21,779 9,968 23,092 20,113 39, 663 20, 450
Puhlic works: Projects._.------------------ ... number .. 975 1,342 1, 619 817 725 944 1,172 1, 274 1,473 1, 442 1, 486 1,3R9 1, 223 Vahlation __________________ thous. of doL. 81,584 70,692 114,075 57,002 53,115 58,010 85,633 16, 141 73,607 78,960 95,170 71,418 50,359
Building permits Issued In 1,790 cities:t 73,921 Total hnif,lings_ .. __________________ number __ 60.373 53,615 38,247 38.902 37, 721 62.303 62,775 77.913 71,040 64,537 73.318 67,618
Total estimated cost. .......... thous. of doL 174,501 148,480 147, 791 156,704 149,572 177.903 165,978 204,437 202,429 185, 019 197, 937 179,605 173,649 New residential:
BuiJ,Iings_ .. ____________________ number._ 17, 559 14. 121 11,059 11,652 11,476 18.635 17,697 20.961 19.224 17,884 19,697 16,818 19,571 Estimated cost _____________ thous. of doL. 105,400 74,053 62,767 70, 768 85,719 94.374 87,441 119,600 99,775 96, 114 116,260 87,308 91, ~21
New nonresidential: Buildings ____ . __________________ numher .. II, 915 10, 459 6, 961 6,449 5,690 10. 496 11. 520 13, 711 12.085 11,214 13.037 11,0.53 14.521 Estimat.ed cost. ............ thous. of doL. 46,123 51, 660 63,115 6.1, 399 37,730 F2,886 44,830 51, 162 70,974 59,794 49,096 63,702 52,745
Additions, alterations, and repairs: I 39,829 Buildings ________________________ number __ 30,899 29.035 20.227 20.801 20.555 33.172 36,558 43,241 39,731 35, 439 40,584 37,747
Est.imatert cost_ ____________ thous. of doL. 22,978 22, 767 21,909 24,537 26,123 30,643 33,706 33,674 31,680 29,111 32,580 28,595 28,983
Revised. • Preliminary. t Terupur>~rily discontinued; for sever~! of the series, <leta have not been available since the ontbreak of war. tRevised series. Data on world prices revised beginning 1920; see table 4, p. 17, of the January 1!139 issue. For construction contract awards, see note marked with a
"t" on p. 21 of the July 1939 issue. The data on building permits are based on reports from I, 790 identical cities having populations of 2,500 or more, and supersede those shown In the Survey through the issue of May 1939 which were for 1,7~8 cities in the same sir.e group. The present series include data for 62 additional cities, but tbe total estimated cost of permits issued was increased by only 0.2 percent in 1937. Data beginning January 1936 will appear in a subsequent issue of the Survey.

22 SURVEY OF CURRENT BUSINESS JANUAHY HHO
Monthly statistics through December 1937, to-~19391 193~ I 1939 gether with explanatory notes and references ---1-----.--- ------,-----,-----,----,----,---,---T~---~ I to the sources of the data may be found in the Novem- Novem-1 Decem- Janu- I Febru-1 March I April I May I June I July August Sebp~erm- Oetober 1938 Supplement to the Survey ber her ber ary ary c
CONSTRUCTION AND REAL ESTATE-Continued
CONTRACT AWARDS, PERMITS, AND II
DWELLING UNITS PROVIDED-Con. '
Estimated number or new dwelling units provided In all urban areas:t
TotaL_ ................•...•...•.•. number .......... . !-family dwelHngs .••..•...•......•••• do ............ . 2-lamlly dwellings ........••••••.••••• do ............ . Multifamily dwellings ......•.•.•••••. do ............ .
Engine~rinl! construction: Contract awards (E. N. R.), .•.. thous. or doL 302,215
HIGHWAY CONSTRUCTION
Concrete pavement contract awards: TotaL ...............•........ tbous. sq. yd ..
Roads ................•. --------------do ... . Streets and alleysd" ......•...•....... do ... .
Statu• of hl!!hway and grade crossing projec·ts administered by the U.S. Bureau or Public Roads:
Highways: Approved for construction:
MIIPa!!e .......••••.....•••. no. of miles .. Federal lunds ....•.•....... thous. or doL.
Under ronstruction: Mileage .. _ ............••••. no. or miles .. Federal funds .......•.•.... thous. of doL. Estimated cost. •..•.•••............ do ....
GradA crtlS<;:.fngs: J
Approved for construction: Federal lunds ............•...•.•.•. do ....
1
Estimated cost ....•.•••.......•.... do ..•. Under ronstructlon:
Federal funds .....••.••.......•.... do ... . Estimated cost. ....•..•.........•.. do ... .
I CONSTRUCTION COST INDEXES
Aberthaw (industrial bullding) •..•.. 1914=100 .. American Appraisal Co.:
Average, 30 cltles •••••••••••.•.••.. l913= 100. _ Atlanta .•.••.•••••••••••......•...... do .... New York .....•.•••.•••.•............ do .••. San Francisco ...•..•••...•••••••..... do .... St. Louis .................•••••.....•. do .•..
Associated General Contractors (all types) 1913=100 ..
E. B. Boeckh nnd Associates, Inc.: I Apartments, hotels, and office buildings: I
Brick nnd concrete: I Atbntn ....•.... U. S. av., 1926-211=100 __ New York ....•......•.•••.••..•.•. do ... . Snn Frnnci~co .•.........••.•••.•.•. do ... . St. Lonls .................•.••.•••.. do ... .
Commercial and factory buildings: I Brick and conrrete: 1
:t~_:n~"ork~~ ~: ::::::::::::::::::::: ~~:: :: I BAn FrRnrisco .••.••••••....•••••••. do ..•. l
B~~i<~'::~issieei!·····················-do .... I Atlanta ......•...••..•••••••.•••••. do .. . New York ....•..••••••......••.•.. do ... . SAn Frnncisco ..•.••.••••••••.•••••• do ... . Rt Louis .......•......•••.••••.•••. do ... .
Residences: Brirk·
~t~t~f~~~~~~~~~~~~~~~~~~~~~~~~~~~~~~~: I P'rlft:~ta ...••••.•.••••.•..•...••.... do ..... [
New York ..•.••..•••••....•.•..... do ... . San Frnncisco .•••••••••....•..••.. .do .. . St Louis ............•••............ do ... .
Engineering News Record (all types)§
Federal Home Loan Bank Boord:* Standard 6-room frame bouse:
1913=100.
Con1hine<l index .•.••.....••.•... 1936-100 .. Matrrials .•.......•..•.••••••..•••. do •.•. Labor ••••...•.•.•.•••••..•••.•.•... do ....
REAL ESTATE
Federal Housing Administration, home mort-
Gross mortgages accepted for insurance
3, 718 2, 4n1 1,228
3,100 35,315
6, 746 101,855 205, 183
10,180 11,060
35,112 36, 577
185 173 196 173 188
188
94.9 130.9 117.9 118.7
97.2 13:3.7 122.5 110.8
93.3 130. G 118.0 118.7
86.8 1?4. 3 106 1 110.9
83.7 12:!. 3 100.5 107.9
238.2
106.5 104.4 110.8
gage in~urHnce: I tbous. of doL 65, 013
Premium-paying mortgages (cumulative) tbous. or doL 1,90.1,071
•Revised. §Index as of December 1, 1039, is 238.2. .
22,064 14,781 1, 042 6, 241
217,023
4,f83 2,001 2, 582
3,122 36,231
7, 968 120,453 234,256
13,930 15,159
35,883 36,808
182 169 192 166 184
188
96.5 130.1 115.9 119. 1
98.4 132.8 120.9 120.1
96.5 129.3 115.6 120.5
87.4 122.4 105.4 111.0
84.6 121.2 97.5
108.1
234.4
106.1 103.2 112.1
18,355 11, 517
796 6,042
339,250
4, 270 2, 765 1, 505
3, 390 37,677
7, 514 113, ~28 221,530
12,794 13, 867
35,023 36,026
189
182 169 192 166 184
188
96.1 130.1 116.0 119.1
98.0 132.8 121.0 120.1
96.2 129.3 116.2 120.5
86.3 122.4 105.4 1!1.0
83.1 121.2 97.5
108.1
234.9
106.1 103. 1 112.1
22.096 13. 226 '1,205 '7, 665
311,693
3,190 2,085 1,105
3, 306 36,294
7, .540 113, 466 218,965
13, 572 14,587
36,440 37,932
183 169 192 167 185
188
95.3 130.0 117.6 119.1
97.4 132.6 122.3 120.1
96.0 129.4 117.7 120.4
85.0 122.5 106.6 110.7
81.6 121.3 98. 7
107.7
234.7
106.0 103.0 111.9
58, 250 51, 058 42, 218
1,244,141 1,300,446 11,355,829
I I I I
I
I I
26.150 28,511 26. 9~7 36, 468 30. 224 '12. 202 '19 588 '19. 3.19 '25,861 '21. 796 • L20R '1, 404 '1, 432 '1,899 '1, 443
'12, 660 '7, 519 '6, 146 '8, 708 '6, 985
203,843 285,566 240,735 252,992 262,395
l, 245 2,143 3,385 4, 458 6,855 686 860 2,081 2,179 4, 232 560 1, 283 1,304 2,280 2, 623
3,177 3, 081 3,081 3,615 3,867 35,968 34,9611 35,600 40,769 41,024
7, 721 7,855 8,301 8,463 8, 570 114, 185 115,212 120. 505 122,758 123. 554 221,046 222,630 233,772 238,637 240,218
13,613 12,906 12,107 10,224 11,312 14, 285 13, 374 12,529 10,583 12,191
37.930 38,817 40,6.54 43, 771 42,299 39,777 40,747 42,654 45,723 44,094
. --------- 188 --------- -------·- 187
183 183 182 182 182 169 169 168 168 168 1~2 192 193 193 193 167 167 169 169 169 185 185 185 185 185
188 188 188 188 187
95.2 95. 3 95.3 95.3 95.4 130,1 130.0 130.0 130.6 130. 6 117.6 117. 6 117.6 117.0 116.9 119.1 119.1 119.1 118.6 118.5
97.5 97.4 97.4 97.6 97.6 132.7 132.7 132.7 133.4 133.4 122.3 122.3 122.3 121.4 121.3 120.1 120. 1 120.1 119.7 119.7
96.2 96.0 96.0 95.6 95.7 129. 2 129.4 129.5 129.8 129.9 117. 7 117. 7 117.7 115.3 114.7 120.4 120.6 120.6 118.5 118.5
85.7 85.0 85.0 86.1 86.8 122.2 122.2 122.5 123. 1 123. 1 106.6 106. 6 106.6 104.7 104.7 110.7 110.3 110.3 110.3 110.0
82.5 81.6 81.6 82.8 83.7 121.1 121.0 121.4 121.9 121. 9 98.7 98.7 98.7 9S. 7 98.7
107. 7 107.2 107.2 107.2 106.8
234.3 234.4 234.9 234.7 235.0
106.0 106. 1 105.9 105.6 105. 4 103.0 103.0 102.9 102.7 102.5 112.2 112.4 111.9 111.5 11\.3
41,224 63,486 64, 89~ 73,701 82, 322
•1,400,212 1,450,575 ,1,496,794 11,546,237 1,607,147
I 28.337 33, 9R9 26,624 21,601 23,346 18,597
1, 254 l, 439 1,591 5,482 9,204 6,436
181, 469 311,222 209,337
5, 713 6,161 4,46.5 3, 820 3, 907 3,058 1, 893 2,254 1,407
3, 701 3,130 2, 723 37,802 34,254 30,821
8. 522 8, 554 8,386 124,97.5 123,044 119,472 244, 860 I 242, 924 237,214
11,504 10,M4 1~: ~~~ I 12,414 11,437
40,336 38,579 37,8191 42,052 40,505 39,756
....... ) ....... -[ 19! I 182 I 183 I 1s1 I 168 ' 168 171 ' 193 1 195 1951 1691 169 171 185 184 185
188 187 1ssl
i 94.81 94.8 94.6
130. g 130.8 1:!0.8 116.8 116.8 116.8 118.3 118.4 118.4
97.2 97.2 97.0 133. 8 133.7 132.7 121.2 121.2 121.2 119.6 119.6 119.6
93.3 93.2 93.0 130. 2 130.2 130.2 114.4 114.4 114.4 118.2 118.3 118.3
86.5 86.1 85.4 123.6 123.5 123.5 104.7 104.7 104.7 108.9 109.3 109.3
83.3 82.8 81.9 122. 1 122.0 122 0 98.7 98.7 9R 7
105.4 105.9 105.9
234.9 234.9 235.0
10.1. 3 105.2 105.7 102.4 102.3 102.9 111.3 111.2 Ill. 2
52,603 62,269 62,008
1,658,306 11,723,357 i1,77B,781 :
.
215,062
2, 655 1,067 I, 588
2,824 30,750
7,4i3 110, 543 222,062
10,283 lO, 909
35,435 37, !90
185 173 196 173 188
ISS
94.8 130.8 117.8 118.6
97.2 133.7 122.0 1W.7
93.2 130.5 117. 5 118.5
86.0 123.9 105.4 110.3
82.8 122.8 [19.8
107.2
236.9
106.1 103.6 111.1
74,216
1,837,923
•]'. e" series For data beginnin~ 1936, see table 30, p. 17 ot tbe June 19~9 Sur..-ey. tReviserl series. Data on number of dwelling units provided reYised be~inning January 1937; the more significant revisions were shown in the footnote on p. 22 of the
September 1939 Survey. Further revisions beginning January 1938, which were occasioned by reclas>ifications, will appear when they become available. o"Datn for streets and alleys, formerly shvwn sepnrattly, are available in totaJ onl~ sub~t'lUHH to l.Jerember l!J;)~. ,Data for December 1938 and March, June, and August 1939 are for 5 weeks; other months, 4 wee!".

JANUARY 1940 SURVEY OF CURRENT BUSINESS 23
gether with explanatory notes and references --- ---..,------ ----,---,-----;----,---;------.---,-----.,----,---Monthly statistics through December 1937, to-~19391 1938 I 1939
to the sources of the data may be found in the Novem- Novem-1 Decem- Janu- I Fehru-1 March I April I May I June I July I August I teSmepb-er I Ohcetro-1938 Supplement to the Survey ber her her 1 ary ary
CONSTRUCTION AND REAL ESTATE-Continued
REAL EST A TE-Cont!nued
Estlmat~.d new mortgage loans by all savings and loan associations:t
Total loans ____________________ thous. of doL. Loans classified according to purpose:
Mortgage loans on homes:
86,076 64,070 63,934 55, 567 58,309 73,378 83,425 89,123 94, 154 85,172 95,038 89,732
Construction __ •.•••. _ .. _ •.. _ .•• __ do __ .. 26,607 18, 627 19,152 16,099 16,027 21,254 23,727 26,646 29,919 26,865 29,863 27,854 Home purchase •••••...•.•.••.... do .... 30,434 21, 20.1 20,82'l 17,503 19,118 24,705 29,903 31,289 32,228 29,638 32,282 31,367 Refinancing~ ____ -------------- .. do .... 15,445 12,182 12, ~05 11, 749 12,551 14,871 15,384 15.587 17,123 15,353 17,00!i 16,021 Reconditioning __ ------------ ____ do .. __ 4, 720 4,821 4, 025 3,389 3,593 4, 211 4, 974 6,069 5,802 5,133 5, 909 5, 544
Loans for all other purposes ________ do .... 8,870 7, 235 7,126 6,827 7,020 8, 337 9,437 9,432 9,082 8,183 9, 979 8,946 Loan< classified according to type of associa-
tion: FederaL ___________________ thous. of doL 34,785 24,220 25,019 20,894 22,298 29,811 33,400 36,358 39,094 34,055 40, 645 37,090 State mem hers ___________ -------- .. do .. __ 34,671 26, 115 26, 504 23,071 24,191 30,124 32, 562 35,426 36,465 34,146 37,340 36,989 Nonm~mhers. -------------------.~do .... 16,620 13,735 12,411 11,602 11,820 13,443 17, 463 17,339 18,595 16,971 17,053 15, 653
Loans outstanding of agencies under the Federal Home Loan Bank Board:
Federal Saving~ and Loan Associations, est!-mated total mortgages outstanding
thous. of doL Federal Home Loan Banks, outstanding ad-
1,252,559 1,020,873 1,034,162 1,040,770 1,051,109 1,067,887 1,089,879 1,117,228 1,136,289 1,157,536 1,186,784 1,206,887
vances to member Institutions thous. of doL 168,822 189,685 198,840 178,852 170,614 161,614 157, 176 157,911 168,962 161,537 159.470 163,687
Home Owners' Loan Corporation. balance of loans outstanding ____________ thous. of doL. 2,043,288 2,186,170 2,168,920 2,149,038 2,134,261 2,117,598 2,105,824 2,091,324 2,080,512 2,067,844 2,059,792 2,054,865
Foreclo~urrs: Nonfarm real estate _______________ 1926=100 .. 136 165 159 154 154 173 164 186 168 159 153 147 Metropolitan communit!es _____________ do .... 129 155 151 145 138 157 141 165 161 152 146 136
Fire losses. __ -------------------- thous. of doL. 27,248 28,659 32,758 27,615 29,304 30,682 27,062 27,032 24,191 22,468 22, 792 22,837
DOMESTIC TRADE
ADVERTISING
Printers' Ink indexes (with adjustment for sea-sonal '<'Ariations):
Corn hi ned index _____ .... _______ 1928-32~ 100 __ --------- 83.6 88.0 7fi.4 79.5 84.4 82.2 84.4 85.5 81.7 84.8 82.6 Farm papers ______________ ------- ___ .do ____ 69.3 65.7 70.3 57.6 59.9 56.4 66.2 69.0 65.0 61.8 70.1 66.1 Magazines .. --------------------- .... do ____ 82.0 82.0 78.8 72.6 78.4 80.4 so. 6 80.3 82.0 80.0 78.5 72.8 N ew"pa pers. __ ..... _ .. __ .... _. ___ .. _.do---- 79.9 79.9 86.0 71.5 74.2 79.8 76.0 78.0 79.8 74.0 79.1 77.4 Out door_ .. _._._ .. ___ .• _._._._---- ___ . do---- --------- 6.'.9 71.0 72.2 73.8 82.0 89.0 90.5 76.6 89.8 76.6 83.5 Radio~------------------------------~ do ____ --------- 257.6 261.7 273.6 265.6 262.7 253.3 290.8 329.7 337.7 355.6 333.7
Radio advrrti,ing: Cost of facilities, totaL ......... thous. of doL. 8,036 6, 713 6, 754 7,023 6, 567 7, 404 6, 678 7,034 6,471 5,813 5,859 6,089
Automobiles and accessor!es .......... do ____ 641 600 626 647 617 747 657 745 640 496 520 558 Clothing _________ ~ ___________________ do. ___ 34 18 10 25 33 50 25 66 37 32 58 75 Electric household equ!pment. ....... do ____ 0 0 0 0 0 0 0 0 0 0 0 0 FinanciaL __________ .---------- _______ do ____ 98 26 21 41 53 64 54 74 129 97 109 102 Foods, food beverages, confections ... ~ do ____ 2, 729 2,157 2, 301 2,318 2, 194 2, 501 2, 241 2,277 2,101 1,669 I, 657 I, 860 Bouse furnishing,, etc ________________ do ____ 45 39 39 49 39 38 39 65 18 23 23 48 Soap, cleansers, etc ___________________ do ____ 925 674 653 714 691 818 746 857 792 771 818 813 Office furnishinl's, suppl!es .......... ~do ____ 0 0 0 0 0 0 0 0 0 0 0 0 Smoking materials. ____ -------------·do ____ 1,153 861 853 836 796 8S5 870 921 887 1,000 1,048 969 Toilet goods, medical suppl!es ........ do ____ 2,163 1,990 1,977 2,045 1,859 2,020 1, 781 1,844 I, 718 1,583 1, 498 1, 538 All other .. ____________________________ do ____ 247 349 273 348 285 281 264 186 148 141 128 126
Maga1!ne advertising: 11,529 8, 023 15,715 Cost, total. _____ ~----------------------do ____ 13,826 13,412 11,536 14,243 16,818 13,279 10,131 8,387 11,816
Automobiles and accessories __________ do ____ 2,164 2,142 1, 295 1,186 1,475 2,153 2, 997 2,854 2, 616 1, 635 I, 033 1,322 Clothing. ___ .... _. _____________ . _____ do ____ 755 689 531 272 495 829 1,020 921 715 246 405 989 Electric household equipment ........ do ____ 337 312 470 67 W5 395 808 757 603 170 58 213 Financial~ .. _____ --------- ___________ do ____ 400 426 299 320 376 431 508 435 486 337 245 352 Foods, food beverages, confectlons .... do ____ 2,103 2,143 1,931 1, 457 2,099 2, 255 2,180 2,013 1,893 2,072 1, 695 1, 744 Hous~ furnif:hings, etc ________________ do ____ 874 679 509 194 377 636 1,025 1,035 759 266 215 628 Soap. cleamers, etc ___________________ do ____ 382 363 234 211 500 421 468 471 454 311 370 411 Office furni,hings, supplies ___________ do ____ 203 225 266 122 148 220 203 233 100 64 123 327 Smokin~ matt>rials ___________________ do ____ 704 829 755 654 591 748 684 692 636 622 431 593 Toilet goods, medical supplies ........ do ____ 2, 4i4 2, 210 1, 815 1, 266 2.183 2, 537 2. 508 2, 249 2,187 I, 901 I, 558 2,029 All other _______ ---------------------. do ____ 3,429 3,394 3,424 2, 274 3,096 3, 617 4, 419 4,056 3, 231 2, 507 2, 253 3, 209
Llnea~e. totaL.~ _____________ thous. of lines •. 2,255 2, 251 1,658 1,929 2, 294 2, 591 2, 715 2,356 1, 796 I, 625 1, 784 2,182 New!'lpnper advPrti~ing:
113, 547 118.096 87,418 86,651 Ill, 815 Ill, lAO 112,377 105,086 85.407 90,526 101,937 Linea~e. total (52 cities). _______________ do ____ 113,457 Clas,ified. ____ -----------------------do ____ 20,191 20,233 20,372 19, s.o6 18,318 22. 147 22, 824 22,692 21,785 20,570 21,115 20,884 Display, total ----------------------~do ____ 93, 2n4 93.314 97, 723 67,861 68,333 89, 669 88,335 89,685 83.301 64,838 69,410 81,053
Automotive .• __ . __________ .. _____ .• do ____ 4, .o37 6,1103 3, Slll 2,446 3,458 4, 76S 6.055 6.075 5,345 3, 496 3, 512 3, om FinanrhL ___ .. __ ------- .. __ ....... do ____ 1, 376 1, 449 I, 574 2, 301 1. 403 1. 695 2,105 1, 615 1,663 2,120 I. 349 1, 278 GeneraL. __ •. __ . ____ • __ . _______ ... de---- 18,470 18, 74!) 14.028 12,771 14,024 17,414 17, 61i5 18.538 17,408 13, 999 12. 527 15,045 RetaiL ... ___ .... ------- _____ ...... do ____ 68, sso 66,509 78,540 50,343 49,448 65,792 62,520 63,456 58,886 45,222 52,022 61,663
GOODS IN WAREHOUSES
Space occupied, merchandise !n puhlic ware-houses ___________________ .... percent of totaL. --------- 70.9 69.5 70.8 70.4 70.4 70.2 70.4 70.7 70.2 69.9 69.4
NEW INCORPORATIONS
Business incorporations (4 States) ____ number .. 1,850 1, 793 1,943 2,210 1, 821 2,226 1,874 2,190 I, 712 1, 724 1, 718 1,471
POSTAL BUSINESS Airmail:
Pound mil~s performed _____________ millions .. Money order<:
--------- 1, 252 1, 431 1, 244 1, 221 1,447 1,356 1,435 1,427 1, 386 1, 486 ---------
Domestic, issued (50 cities): N u m her ______________ .... -----. thousands .. 4,150 4,067 4,6.i4 4, 234 4,140 4, 6n2 4,171 4, 248 4,170 3, 907 3, 906 3. 907 Value ________________________ thous. of doL. 38,553 37,996 42,202 39,227 36,900 41,891 38,119 39,229 38, 165 36,858 37,098 37,262
• RevisPd. tReviscd series. For re'<'lsed data on estimated new mortgage loans by all savin~s and loan associations, 1936-37, see table 12, p. 16, of the March 1939 Survey,
93,297
29,255 33,383 15,835
5, 784 9,040
37,8 54 7 6
37,84 17,59
1,231,685
168,65 4
2,049,421
'131 12 0
24,301
82.8 65.8 78.1 77.7 75.8
298.4
8,014 648
72 0
107 2,608
62 923
0 1,170 2,150
273
14,924 2,312 1,136
392 414
2, 206 I, 086
403 204 665
2,422 3,683 2, 378
119,612 22.393 97.220 6,436 I, 767
19,824 69,192
70.4
I, 787
--------
4,288 39,723

24 SURVEY OF CURRENT BUSINESS JANUARY 1940
Monthly statistics through December 1937, to-~19391 1938 I 1939 gether with explanatory notes and references ---- 1---.----- -----.~-·---;~,------,
1;----~;----.-
1---;-
1---;-
1----;
1----,
1;---
lo the sources of the de.ta may be found in the No•·em- Novem-1 Decem· Janu· Febru- March April May June J ly Aug t Sep· Octo· 1938 Supplement to the Survey ber ber ber ary ary u us tern ber ber
DOMESTIC TRADE-Continued
POSTAL BUSINES8-Contlnued
Money orders-Continued. Domestic. paid (50 cities):
Number ............ ____________ thousands .. 14,385 14.028 15,793 12.939 12. 371 15,307 13, 164 13,724 Value ........................ thous. or dol.. 10~. 449 106.097 113, 841 94. 176 88. 734 109,980 95,899 99,757
Foreign, Issued-value •• -------------- .do .... --------- 2, 280 7, 717 2,142 2,027 3,170 2,079 2,066 Receipts. po•tal:
33,478 29,830 30,922 50 selertrrt cities ........................ do .... 32,446 31,426 42,470 28. 537 27.710 50 Industrial cltles ...................... do .... 3, 058 3, 568 5,154 3,667 3,493 3,979 3,618 3,687
RETAIL TRADE•
Automobiles: Value of new passenger automobile sales:
107.7 99.1 96.1 70.8 71.2 106.7 106.3 107.1 Una<ljusted ................... l929-31=100 .• A<ljusted ... __________________________ do .... 102.6 100.0 92.5 91.0 96.0 88.0 79.5 79.0
Chain-store sales: Chaln-t:tore A~e In<lex:
Combined Index (20 chains) 117.0 av. same month 1929-31=100 .. 109.5 112.9 107. 5 108.8 109.8 110.0 110.0
Apparel ch11lns .................... do .... 1~2. 0 121.2 127.0 118.0 112.7 130.0 117.6 119.0 Grocery chain-store sales:
U narljust.ed ..... ______________ 1929-31-100 .. 109.0 96 7 101. I 93.5 98. 7 100.5 102.0 102.9 A djust.ed ............................. do .... 109.0 96.7 98.1 96.4 98.2 99.5 99.0 101.4
Variety-store sales: Comhine<l s11les of 7 chains:
U nac!justcd ... ---------------------do .... 108.1 102.2 193.6 73.6 79.7 85.0 97.6 96.3 Artiuste<l ..... __ .................... do .... !Uti. 5 100.2 104.9 98.7 95.5 98.8 97.1 96.3
H. L. Green Co., Inc.: 3,066 Sale.s ........... ___________ thous. or doL 2,819 5, 9.)2 1, 998 1, 959 2,442 2, 869 2, 733
Stoms operated .. _______________ number .. 133 133 133 133 132 133 133 133 B.S. Kresge Co.:
Sales._ ...... ______________ thous. of doL. 12,3.16 11,972 24,114 8, 801 9,058 10,606 11,940 11,401 Stores operated ................. number .. 085 686 687 680 681 683 683 682
S. H. Kress & Co.: Sales. ..................... thous. of doL_ 7,295 6, 613 14,429 5,055 5,163 5, 969 6, 315 6,818 Stores operated ................ number .. 240 238 238 238 238 238 239 239
Mcrrory Stores Corp.: 3, 622 3,186 7, 003 2, 535 2, 738 3,196 Sales .... __ . ________________ thous. of doL. 3,648 3,300
Stores oprrate<l _________________ number .. 201 200 200 202 202 202 202 202 G. C. Murphy Co.:
4, 219 7, 223 2,686 2, 752 3, 205 Sales _____________________ thous. of doL 3, 594 3,848 3, 741 Storrs operated._ ............... number __ 2U2 201 201 201 201 201 201 201
F. W. Woolworth Oo.: Sales ....................... thous. of doL. 29.952 25.295 50. 379 19,653 20,686 23.104 25,919 24,725 Stores operated. ________________ number .. 2, 019 2,018 2,017 2,014 2,011 2,012 2,008 2,005
Restaurant chains (3 chains): (I) 3, 275 (I) (I) (I) (1) (I) Sales ........ _ .. ____________ thous. of doL. (I)
Stores operated ______ ----------- .. number __ (1) 336 (1) (1) (I) (I) (I) (I) Other chains:
W. 1'. Grant & Co.: Sales ...... ________________ thous. or doL 9,316 '8,634 17,996 5, 531 5, 748 7,164 8, 376 8,496 Stores operated ..... __________ .. number __ 494 489 491 489 489 489 489 491
J. C. Penney Co.: 28,216 38,928 16, 523 14,613 Sales ..................... thous of doL. '27, 208 18,736 21,281 22,233
Stores operated ................. number .. 1,5.54 I, 539 1,539 1, 539 1, 540 1,542 1, 544 1,545
D~0~~!~;ronn\~tnres: Installment accounts
pMcent or accounts recelvahle .. 48.7 17.0 17.2 16 4 16.2 18.6 17.2 17.3 Open accounts ....................... <lo .... 17.7 47 I 46.4 47. I 43.9 46.6 45.3 46.9
Sale•. total U.S., unadjusted ... 1923-25=100 .. 105 99 156 69 69 82 88 87 Atlanta.--------------------------- .. do ____ 142 126 203 91 101 116 119 118 Boston ..... ______ ------ _____________ . do._ .. ss 86 11~ 64 li4 68 75 75 Ch ieag:o ............ --------- ......... do .... gg 96 157 69 67 92 89 89 Cleveland.----------------- .......... do .. __ 107 93 152 67 71 82 92 89 Dallas .... ------------------------ .. <ln ..... 117 118 182 87 89 99 104 105 Kansas ('fty ................... 192.)=100. 88 89 151 67 64 87 82 86 Mlnneapolis .................. 1929-~1 = 100 .. 97 96 147 75 63 97 97 94 Ne" York -------------------1923-25= 100 .. 11.1 106 164 68 71 80 80 85 Phila<lelphlat ...... ________________ .. do .• _ 9.> 82 127 49 52 65 67 70 R lchmoncl. --------------------...... <!0 .... 130 liS 209 77 75 JO,) 102 115 St Lon is . __ .... ---------- ___ .. _.do .... 102 95 143 69 68 82 89 86 San F'ranclscot ... ____________________ do ____ 10.> 108 170 81 83 89 96 93
Sales, total U.S., adjusted ............. do .... 94 89 89 88 87 88 88 &i Atlanta._ ............................ do .... 125 111 119 115 115 125 115 116 Chlca•o. . _____ ...................... rlo .• __ 90 88 94 86 84 98 86 88 Clevelan<l t -------------------------- .<lo .... 100 87 ~9 89 90 90 87 83 DAllas .. --- -------------------.--<lo- ... 101 105 105 IH IO.i to.; 104 105 Minnoapollst _________________ 1M9-31 = 100. _ 94 93 9~ 94 87 96 95 94 New York. . ________________ 1923-25= 100.- 97 89 .n 86 '87 91 89 88 Phlla<lelphlat ---------------------- .. rlo. _ .. 78 '67 70 68 68 70 68 71 St. Lonis .. ------------------------do .... 87 82 87 87 79 88 86 86 San F'ranclscot ...................... do ___ 100 103 100 99 99 99 98 97
Installment sales. New Envlan<l <lept. stores 10.4 perrent of total sales 10.3 7.1 11.6 11.8 10.2 8.5 9.0
Stocks, total U. 8., end of month: U na<ljnsted ..... _ •.. _______ ... 1923-25= 100 .. • 82 78 62 60 65 69 69 68 A<ljrt'te<l. _ .... _. ___ -----------------.do ....
Mafl-nrder a net store sales: • 71 67 66 67 68 68 67 66
Total sales. 2 companies ........ thons. of doL. 108, OP5 93.510 125, 70R 5R. 320 59, ~fl5 85. 497 92,831 101,936 Montgom<'ry Ware! & Co ............ do ____ 47, 7()4 42. 295 57. 0~5 24. 769 24. 964 35. 730 41,595 42,323 Sears. Roebuck & Co ________________ do ____ 60, 330 51 215 68. 622 33 551 34 9 I 4 1 1 ' 0 9, 768 5 ' 236 59, 6 3
Reviser!. • Preliminary.
13,918 12,142 101,345 91,709
2,210 2,069
20.791 25,464 3, 587 3, 271
101.2 87.5 79.0 80.5
111.0 113.0 118.0 126.0
100 8 97.6 99.3 99.6
95.8 91.3 100.8 102.6
2, 712 2, 502 132 132
11,293 10,369 683 685
6, 406 6, 225 239 240
3,420 3,158 202 201
3, 758 3, 564 201 201
24.662 24,340 2,013 2,015
(I) (1) (1) (1)
8, 386 7,298 493 493
22, 235 19,502 1,543 1, 544
16.7 16.0 46.8 45.3
83 60 108 88
76 49 89 61 82 63 90 72 74 61 9~ 69 87 63 65 46
105 73 75 62 88 81 86 86
119 126 91 85 84 86
101 103 95 97 90 89 66 67 82 90 97 99
7. 7 9. 5
64 60 67 67
98.070 77,393 41,102 33, 452 5 76 6, 8 43 941
13, 130 12.624 99,498 97.376
2, 205 1,895
28,233 30.038 3,540 3, 413
63.7 56.5 76.5 83.5
113.0 114.5 124.0 127.0
99.0 107.2 103.1 109.4
89.5 '96.1 101.1 '100. 6
2,446 2, 785 133 133
10,578 11,513 683 683
6,490 6,596 240 240
3,136 3, 354 200 200
3,470 3, 789 201 201
24,123 25.810 2,014 2,015
(1) (1) (1) (1)
7,210 8, 235 494 495
20,693 26, 138 1, 548 1, 552
16.8 17.2 43.6 44.0
69 97 114 133
55 83 77 102 73 96 83 11.) 79 90 89 116 67 97 50 74 86 118 70 98 94 98 89 91
146 142 95 98 88 92
107 104 102 104 90 93 67 74 94 92
100 •95
15.5 11.1
65 71 67 68
87,257 107,493 38,998 44, 743
14, 1 109,0
52 16 33 1, 8
31,9 60 88 3, 7
'96 .5 . 7 •93
'113 1~5
. 3
.0
106 .9 .4 '106
<102 .9 .4 '101
2,8 55 33 1
11,9 6
7,2 2
3, 4 2
4, 0 2
26,5 2,0
(I) (1)
8, 7 4
28,7 1, 5
~8 82
86 40
31 00
90 02
30 18
33 95
22 53
17 .. 47
1 '
1
1 1
1
.0 99 38 85 98 98 16 94 16 04 80 32 96 03 90 16 89 94 03 97 91 69 85 99
' 1
1
I .
12 .4
7i 69
122, 1 91 54,9
; 48, 259 62, 751 67,246
I D!srontinued pending rectipt or revised data from one cooperator. • Reports <bowing percent11ge changes in sales of chain ctruo stores anrt chain men's wear stores are available from the Wa•hington. D. C.,omce or the B•Jreau of Foreign
and Domestic Commerce The llureau of the Census has availat~le percentage changes for (1) Independent stores in 27 States and 4 cities by kinds of business (2) Wbule· salers' sa!~" hy kinris of hnsiness, (3) 1-Ia.nufactnrers' sales, hv kind~ of husine-;s ' '
tRevi.ed series. lnd~xes of departmt•nt ~tore _sales in Si;n Francisco area revised beginning 1919; see table 3, p. 18 of this issue. Seasonally adjusted indexes of departmPnt srore snlrs revised he!!innin!! tml~ for the !vfmrwap(~lis distnct and beginning lH~Q for the Cleveland district; see tables 5 and 4, p. 18 of this issue. Indexes of depart .. ment store sales In Philadelphia revised 1923-37; revisions will appear in a subsequent issue.

JANUARY 1940 SURVEY OF CURRENT BUSINESS 25
gether with explanatory notes and references --- ----,---- ----,----,-----,----,----,----,----,----,----.---Monthly str.tistics through December 1937, to-~19391 1938 I 1939
to the sources of the data may be found in the Novem- Novem-1 Decem- Janu- I Febru-1 March I Apr!'! I May I June Jul" I Augu t I Ser- I Oeto-1938 Supplement to the Survey ber ber ber ary ary • o
8 · 1 tember ber
DOMESTIC TRADE-Continued
RETAIL TRADE-Continued
183. G I 91.31 I Rural sales of general merchandise: Total U.S., unadjusted ........ 1929-31=100 .. 1.59. 7 147.2 100.1 115.0 - 120.2 120.5
Middle West. ___ --------------- ______ do ____ 142.8 135.7 166.41
84.1 89.1 105.2 110.2 113.3 East. _______________________________ .do .. ___ 167.0 144.1 195.9 8'1. 8 97.9 118.6 116.6 118.8 South. ____ .. __________ ... ___ ------- __ .. do ____ 208.2 177.8 202.8 111.3 134.8 141.5 144.8 137.6 Far West. ___________________________ do ... _ 164. i 161.5 211.0 100.2 105.7 11S. 5 125.8 131.8
Total U.S., adjustedt .................. do ____ 122. 7 113.1 114.8 120.0 123.7 131.0 130.8 131.2 Middle Westt ________________________ do .... 108.9 103.5 106. 71
109.9 112. 1 118. 7 11S.O 119.6 Eastt .. _______________________________ do ____ 12!1. 5 111.8 117.6 115.6 119.6 132.0 122.4 129.1 Southt __________________ ----- _______ .do. ___ 151.6 129.5 135.0 140.7 147.3 156.6 164.3 162.2 Far Westt _ .. _________________________ do .... 1:J5. 8 133.1 129. 3 136.4 112.9 114.0 140.9 146.6
EMPLOYMENT CONDITIONS AND WAGES
El\IPLOYl\IENT I Factory, unadjusted (U. S. Department of
Labor) t __ ------------------ .. 19?.3-25=100 .. Durable goods ... _________ ................. ___ .do .. __
Iron and steel and their products, not including machinery ..... 1923-25=100 __
Blast furnaces, steel works, and rolling mills._ ... _____ ..... ___ .... __ •. 1923-25= 100. _
Hardware ..... ___________________ ... do ___ Structural and ornamental metal work
1923-25 =!nO __ 'rin cans t\lld other tinware ______ . ___ do ___ _
Lumber aud allied products ........... do .. .. Furniture ______ ---------- ________ .. do ___ _ Lumber, Sf<Wrnills .... ______ -------·do ___ _
Machinery, not including transportation equipment.. ____ ........... 1923-25= 100 ....
Agricultural implements (including trac-tors) ________________ .. ____ .1923-25= 100 ....
Electrical nmchinery, apparatus, and sup-plies_________ __ _____ ..... 1920-25=100 ...
Engines, turbines, water '"'·hee1s, and windmills ..... ____ .... _____ .. 1923-25 = 100. _
Foundry and machine-shop products 1923-25=100 ....
Radios and phonographs ___________ do .. .. Metals, nonferrous, and products ..... do .. ..
Brass, bronze. and copper products. do .. .. Stone, clay, and glass products _______ do ___ _
Brick, tile, and terra cotta _________ do .... Glass. _________ .. _____ .... __ ------ __ ... do .. __
Transportation equipmcnt ........... do ... . Antomobiles. _ .. _____ .... ____________ .do ..••
Non durable goods. ____________________ .do. __ _ Chemical, petroleum, and coal products
1923-25=100 .... Chemic,>ls ___________________ ....... do .... Paint8 and varnishes _______________ do. __ _ Petroleum refining ... __ ...... __ ------ .. do ... _ Rayon and allied products _________ do ... .
Food and kindred produets __________ do .. .. Raking _________________________ .... do .. __ Slaughtering and meat pncking ..... do .... .
Leather and its manufactures ........ do ... . Boots and shoes ____________________ do ... .
Paper and printing ___________________ do .. .. Paper nnd pulp ____________________ do .. ..
Rubber products _____________________ do __ __ Rubber tires and inuer tubes ....... do __ __
Textiles and their products ___________ do .... Fabrics ____________________________ .do .. __ 'Wearing appareL __________________ do ___ _
Tobacco manufactures _______________ do ___ _ Factory, adjusted (Federal Reserve)t _____ do .. ..
Durable goods. __ ------------------ .... do .. .. Iron and steel and their prorlucts, not
in eluding machinery _____ .. 1923-25= 100 .... Blast furnaces, steel works, and rolling
mills ... ___ . ______ ........ ___ ... 1923-25= 100. _ Hardware _________ ----------- ______ do ___ _ Structural and ornamental metal work
1923-25=100 .... Tin cans and other tinware _________ do ___ _
Lumber and allied products .......... do .... Furniture __________________________ do. __ _ Lumber. sawmills ..... ----------- .. do. __ _
Machinery, not including transportation equipment ______________ .. 1923-25= 100. _
Agricultural implements (including trac-tors) ___ . ______________ .... 1923-25=100.
Electrical machinery, appamtus, and sup-plies__ ________________ .... 1923-25=100. _
Engines, turbines, water vvheelR, and I windmills ____________ ._ .. 1923-25=100 ..
Foundry and machine-shop products 1923-25= 100 ..
Radios and phonograpbs ........... do .. .. Metals, nonferrous, and product~ _____ do ___ _
Rrnss, bronze, and copper products. do .... Stone, clay, and glass produets ________ do. __ _
Brick, tile, and terra cotta ........... do ... . Glass _______________ ... ______________ do ___ _ 'rransport:Jtion equipment ___________ do ___ _
Automobiles. __ .. __ .. ___ .. ___________ .do. __ _ 'Revised.
103.8 98.1
110.9
121.8 106.3
75.9 100.7 7:!1 96.6 65.6
111.2
124.6
100.4
112.6
95.4 179.8 113.1 137.2 85.8 64.6
110.2 102.3 101.7 109.2
122.2 137.6 125.4 123.7 314.0 129.6 146.5 107.9 92.5 89.7
117.5 115.3 94.0 74.6
108.0 100.9 118.8 66.4
103.4 97.2
110.6
122 106
76 103
72.3 92 66
110.7
128
100
119
95 161
109.8 137
85.2 64
110 100.7
99
93.31 82.9
89.5
93.1 88.8
60.1 88.9 li4. 7 84.1 58.6
89.6
101.0
83.9
83.0
76.5 131.3 9-1.9
106.1 77.3 56.3 98.0 92.3
101.9 103.1
114.6 119.3 117.1 120.1 299.9 127.6 145.3 102.3 90.4 87.8
112.3 105.9 82.3 65.6
100.2 91.5
115.3 68.3 92.8 82.1
89.1
93 89
60 91
64.0 80 59
89.2
104
83
87
77 117
91.9 106
76.8 .5G 98
90.6 99
94.0 83.8
90.2
94.4 90.8
61.3 88.4 63. i 84.4 57.0
91.9
110.3
84.6
84.8
79.3 130.4 94.5
105.8 76.2 55.1 99.0 96.9
106.8 103.8
114.3 119.0 117.1 119.2 298.4 123.8 144. 2 104.0 94.3 92.3
113. 2 106.3 83. 5 66.7
101.9 93.8
115.5 66.6 94.4 83.7
90.9
95 91
62 93
65.0 83 59
91.7
110
85
88
79 123
93.1 106
77.8 57 99
93.2 102
92.2 82.3
88.8
94.2 89.2
61.1 87.0 61.4 80.7 55.0
91.5
116.4
82.8
86.6
79.4 119.8 91.7
10:l. 8 71.9 52.5 95.3 96.6
106.1 101.7
113.2 117.5 116.5 118.2 300.3 116.9 141.0 101.4 99.0 97.7
110.6 105.5 81.3 66.6
100.9 92.8
114.4 60.5 94.6 84.4
90.7
95 89
63 94
65.7 84 60
92.3
114
84
92
80 126
93.3 105
79.6 61
100 9fo~ 1
93.6 83.3
90.0
94.8 87.6
63.4 87.9 62.0 83.3 55.0
93.5
127.0
84.3
90.0
80.9 113.2 93.1
104.4 72.1 51.7 95.2 96.8
104.4 103.5
113.4 118.1 117.2 117.5 305.9 114.2 142.2 96.1
103.0 102.4 111.0 106.3 81.5 65.6
104.6 94.1
123.9 63.7 94.3 84.2
90.4
94 87
66 95
65.1 85 59
94.0
123
85
91
81 129
93.4 104
77.4 59 95
92.9 1 98
94.3 84.1
91.3
95.6 87.4
65.6 89.8 62.1 83.4 55.0
94.6
130.5
85.9
93.2
81.6 109.3 93.8
104.8 75.1 53.4 96.4 96.5
103.8 104.0
116.0 118.6 119.7 117.4 303.8 115.4 142.8 94.0
103.9 103.8 111.1 105.9 82.8 66.7
104.9 93.1
127.0 60.9 94.0 83.7
90.7
94 87
67 95
63.2 85 56
94.8
124
86
91
82 130
93.4 104
775~ I 95
91.2 97
94.1 84.8
91.3
95.7 85.0
66.3 92.7 63.9 82.4 58.0
95.0
129.4
86.8
95.7
82.0 104.5 92.9
103.9 78.5 57.6 97.8 96.1
101.8 103.0
116.6 117.0 122.5 117.2 302.4 117.6 142. 7 93.3
100.2 99.6
111.1 106.3 82.1 66.7
101.9 90.7
122.8 63.1 93.8 83.9
90.5
95 84
67 96
64.2 85 57
94.9
122
87
91
82 124
93.2 103
77.9 58 97
91.1 96
93.0 84.0
90.2
94.6 80.1
66.5 93.6 65.0 81.4 60.2
94.9
122.8
86.6
97.4
82.1 106. 5 92.0
104.7 78.5 57.6 97.4 91.2 93.3
101.6
112.9 116.5 123.4 118.1 295.7 120.5 146.1 96. !l 92.5 91.0
111.2 106.7 81.2 66.7 99.4 90.3
115.6 64.2 93.3 82.9
89.6
94 80
67 95
64.8 84 59
94.4
119
86
93
81 121
92.8 104
75.4 55 96
87.2 89
120.0 109.9 122.8 133. 3 137.3 131.7 116.4 133. R 16.1. 8 144. 1
I 93.41 s4. o 1
90.41
95.7 72.1
67.1 97.7 66.3 83.2 60.9
95.6
118.7
86.5
99.0
82.6 119.9 91.3
104.2 ~0.5 61.3 99.0 90.8 91.6
101.8
109.8 116.5 124.3 120.5 286.2 127.2 147.4 99.4 94.1 92.5
109.8 106.1 80.1 66.2 98.0 89.6
112.6 65.2 94.3 83.9
90.3
96 72
66 95
65.3 85 59
95.4
118
87
95
83 122
92.8 105
77.5 57 98
88.9 89
91.1 81.8 ss. 3
103.8 115.2 124.8 110.9 124.1 152.8 140.5
93.5 83.0
89.7
95.3 69.0
68.8 100.2 66.7 84.3 61.1
95.7
113.0
86.8
96.2
82.6 129.6 91.3
104.0 79.7 61. .5 96.3 79.9 76.4
103.5
110.4 117.1 122.2 121.8 297.0 135.0 147.8 100.7 99.7 99.1
110. 1 105.8 78.7 66.6 98.1 91.1
109.5 65.4 95.3 84.7
90 6
96 70
67 95
66.0 86 60
96.1
115
87
95
83 131
94.6 106
78.4 58 98
90.0 90
107.2 99.1
105.8 111.7 134.6 131.1 120.1 1:l2. 7 155.0 146.1
96.3 83.9
92.:l
97.0 75.6
71.5 107.4 68.7 87.5 62.7
96.8
114.4
87.8
96.8
84.1 135.9 94.7
107. 7 80.8 61.8 98.5 75. 2 70.4
108.1
109.2 119.1 122.1 122.7 255. 1 147.0 140.9 100.2 100.7 100.3 110.9 107.0 82.6 6~. 3
103. 5 93.1
122.1 66.6 96.0 85.5
92.5
97 78
69 98
66.4 Sf> 60
97.3
121
88
97
85 126
96.2 109
78.1 57 99
89.6 90
132.6 116.3 126.4 1Gb. 6 162.3 125.4 113. 5 128.6 lf>O. 0 138. 7
'100. 2 '89. 7
'97.1
101.1 '94. 2
73.8 107.0
r 70.0 90.7
'63.4
100.3
116.1
92.2
99.2
'85. 8 150.1
'100. 3 115.2 r 81.7
63.2 100.9 '96. 9 '98. 5 110.2
117.7 123.6 122.1 123.1 300.2 150. 7 148.0 101.3
97.8 96.5
113.2 108. s 86.0 70.0
104.5 93.5
124.8 6U. 4 97.3 88.5
95.7
101 84
71 97
67.4 87 01
99.7
123
92
99
86 129
99.2 115
i9.0 .19
100 98.2
100
160. 3 g 143 ..
15.5. 215. 166.
4 4 5
123.4 113.3 120.7 145.4 138. 7
103.6 '96.1
'106.
115. '99.
76.3 '10G.4
r 72.4 '94. 6 '65. s
'106.
117.8
97.3
105.2
•91. '176. 5 '110. 4
131.1 '84. 8 '64. 8 lOG. 9
'105. 0 '107. 4 '110. 7
122.0 133.6 125. 1
'122. '310. 8 '137. 5 '148.0
102.7 '96. '94. 1
'116. <
'113. 6 '92.4 '73 6
'108. 3 '9R. 8
'124. 7 66.7
'lOi. 2 '94. 5
,. 105.9
115 r 99
75 104
60.4 89 63
,.105. 7
125
97
108
91 145
'107. 0 130
'82.0 61
'106 r 105.3
107
tR"vised series. Rural sales of general merchandise adjusted for seasonal "Variations revised beginning January 1934; see table 37, p. 17, of the August 1939 issue. Data for employment and pay rolls withont ndjnstment for seasonal variations beg;innin~ 1933 :1nd for the entire series on employment adjusted for seasonal variations have been adjusted to the Census of Manufactures for 1935 and 1937. For total, durable, and nondurable goods indexes, see table 42, p. 17, of the October 1939 issue and tables 1 and 2, pp. 15-16, of the December 1938 Survey. For individual industries and industrial groups, data from 1935 to date are available upon request. Earlier figures are correct as shown in tables 76 and 77, pp. 13-18, of the November 1938 issue.
200349-40-4

26 SURVEY OF CURRENT BUSINESS
Monthly statistics through December 1937, to-~19391 1938 I 1939 gether with explanatory notes and references ---
1 1 1 1 1 to the sources of the data may be found in the Nov em- Novem- Decem- Janu- I Febrn- March April May June 1938 Supplement to the Survey ber ber ber ary ary
EMPLOYMENT CONDITIONS AND WAGES-Continued
EMPLOYMENT-Continued
Factory, adj. (Federal Reserve)t-Continued 109.2 103.1 104.7 104.4 103.9 103.8 103.3 103.3 104.2 Nondurable goods ______________ 1923-25=100 •.
Chemical, petroleum, and coal products 121.0 113.3 113.7 113.6 112.9 113.4 114.2 114.4 113.1 1923-25=100 ..
Chemicals. __________ ---- ________ .. do ____ 137 119 12ll 119 120 120 118 117 117 Paints and varnisbes _______________ do ____ 127 118 119 119 118 120 121 119 120 Petroleum refining _________________ do ____ 123 120 119 119 119 119 118 119 120 Rayon and allied products ________ _do ____ 311 297 297 297 301 299 309 302 295 Food and kindred products __________ do ____ 129.4 127.4 128.8 128.8 125.7 127.3 127.0 128.4 129.4 Baking _____________________________ do ____ 145 144 144 144 144 144 144 146 147 Slaughtering and meat packing ____ do ____ 106 100 100 98 96 96 96 98 100
Leather and its manufactures ________ do ____ 99.8 97.6 98. I 98.9 99.0 99.2 97.7 93.7 97.1 Boots and shoes ___________________ _do ____ 99 96 97 98 98 98 97 92 96 Paper and printing ___________________ do ____ 115.8 110.6 111. 1 111.0 111.1 111.4 111.5 I 111. 5 111.1 Paper and pulp ____________________ do ____ 115 106 106 106 106 106 1()6 107 106 Rubber products _____________________ do ____ 93. 1 81.4 82.9 81.4 81.4 82.2 81.3 81.1 80.8 Rubber tires and inner tubes _______ do ____ 75 66 67 67 66 67 67 67 66
Textiles and their products ___________ do ____ 107.8 100.0 102.2 101.9 101.8 101.0 99.6 99.8 101.2 Fabrics ____________________________ do ____ 99.9 90.5 92.3 91.9 91.7 91.0 90.2 91.0 92.0 Wearing appareL __________________ do ____ 120.6 116.9 120.0 119.5 120.2 119.2 116.4 115.2 117.5 Tobacco manufactures _______________ do ____ 63.1 65.0 65.6 65.9 64.8 61.4 64.5 65.1 65.5 Factory, unadjusted, by cities and States:
City or industrial area: Baltimore _____ --------- ______ 1929-31=100 __ 101.8 86.5 87.2 84.8 86.7 89.2 90.3 91.7 91.7 Chicago _______ --------- ______ 1925-27=100 .. 80.3 ~9. 6 70.6 69.7 70.4 70.6 69.8 70.0 70.5 Cleveland ____________________ 1923-25=100 __ 95.7 80.6 82.3 81.8 81.8 82.3 82.2 81.8 81.4 Detroit ___ ------------------- _________ do ____ 105.9 97.6 102.9 100.8 99.3 97.7 96.0 62.4 86.7 Milwaukee ___________________ 1925-27 = 100 .. 102. 7 89.0 92.4 90.6 93.6 94.8 94.5 92.9 94.3 New York_ --------------------------do ____ 95.9 86. 1 86.9 85.4 89. 1 90.5 88.0 85.5 83.6 Pbiladelpblat _________________ 1923-25= 100 __ 87.8 78. 5 81.0 79.8 81. .o 81.1 81.0 80.! 81.1 Pittsburgh t ___ --------------- ________ do ____ 91.1 71.8 72.3 71.0 71.9 72.6 73. 1 71.7 73.6 Wilmingtont _ -------------------- ___ _do ____ 89.6 75. 2 79.6 80.3 81.8 83.0 84.4 83.9 81.0
State: Delawaret __ ----- ____________________ do ____ 98.2 84.3 88.2 89.0 90.5 91.4 93. I 92.8 90.0 Illinois ___ ------------------ __ 1925-27 = 100 __ 87.7 75.3 76.1 75.2 76.8 77.8 77.6 77.6 78. I Iowat __ ----------------------1923-25= 100 __ -------- 127.9 131.0 127.6 128.0 129.0 131.1 131.9 133.2 Maryland ___ ----------- ______ 1929-31 = 100 __ 105.5 '90. 9 91.6 89.4 92.4 94.5 95.5 95.8 95.8 Massacbusetts ________________ 1925-27 = 100 __ 80.5 72.6 73.8 73.0 74.6 74.8 73. 1 71.6 71.2 New Jerseyt __________________ 1923-25= 100 __ 107.4 93.0 94.0 92.8 93.8 94.2 93.7 94.3 95.4 New York ______ ------------- .1925-27 = 100 __ 91.3 80.3 81.3 80.0 81.9 82.7 82.0 80.4 80.9 Ohio ____ ------------------------1926= 100 __ 97.0 84.9 86.4 84.9 86.0 87.1 86.6 85.2 85.5 Pennsylvaniat ________________ 1923-25= 100 __ 91.4 79.2 80.2 78.4 go. 2 80.4 80. I 78.8 79. 7 Wisconsint __ ----- ____________ 192.5-27=100 __ 92.1 81.5 82.4 80.6 82.7 83.6 83.7 84.5 86.9
N onmanufacturing, unadjusted (U. S. Depart-ment of Labor):
Mining: Anthracite ____________ ------ ____ 1929=100 .. 52.2 51.0 51.3 50.0 52.2 51.7 53.0 52.6 51.2 Bituminous coaL ____________________ do ____ 95.1 88.6 89.3 88.7 88.6 87.4 25.9 47.9 78.3 Metalliferous _____________ ----- _______ do ____ 66.5 61.9 62.3 62.6 60.9 61.0 61.5 61.9 61.6 Petroleum, crude, producing _________ do ____ 63.6 68.3 67.8 67.0 66.4 66.2 65.8 66.1 67.0 Quarrying and nonmeta!lic ___________ do ____ 47.0 44.4 41.4 38.3 37.9 40.1 43.0 45.6 47.3
Puhlic utilities: Electric light and power, and manufactured
gas ____________ ----- ___________ 1929= 100 __ 93.4 91.9 91.4 90.0 89.6 89.6 90.3 91.0 92.3 Electric railroads, etc _________________ do ____ 69.7 69.5 69.4 69.2 69.3 69.5 69.1 69.6 69.9 Telephone and telegraph _____________ do ____ 74.8 74.4 74.3 74.1 73.3 73.4 74.1 74.7 75.3
Services: Dyeing and cleaning ________________ do ____ 99.1 102.5 97.9 94.2 92.1 95.4 102.2 107.0 110. 1 Laundries ____________ ----------- _____ do ____ 95.6 93.7 93.4 93.3 92.8 9~. 9 93.5 95.5 98.7 Year-round hotels ____________________ do ____ 92.4 92.5 92.0 91.8 92.6 92.7 93.2 93.9 92.8
Trade: Reta.il, totaL _______________________ .do ____ 89.8 86.9 98.1 82.2 81.5 83.8 85.5 85.7 86.4 General merchandising ____________ .do ____ 109.8 104.5 144.1 90.7 88.8 93,2 96.9 96.8 97.4 Other than general merchandising_ do ____ 84.5 82.3 86.0 80.0 79.6 81.3 82.5 82.8 83.5 Wholesale ____________________________ do ____ 92.7 89.8 90.0 88.3 87.9 87.4 87.3 87.2 88.1
Miscellaneous employment data: Construction employment, Ohio __ 1926=100 .. 44.0 35.2 32.0 28.7 28.6 32.4 35.0 43.0 43.6 Federal and State highway employment:
341, 832 266,629 201, 307 220,923 TotaL ____________________________ number __ 227,233 176,079 169, 155 187,523 252,316 Construction (Federal and State) __ do ____ Jl2, 816 138, 512 103,491 73,116 58,815 58,622 78,394 104,804 130,743 Maintenance (State) ---------------do ____ 114,417 203,320 163, 138 128, 191 117,264 110, 533 109, 129 116,119 121,573
Federal civilian employees: United States ________________________ do ____ --------- 869,389 919, 161 864,342 875. 541 879,504 885,766 903, 112 925,982 District of Columbia~--------------do ____ --------- 119, 107 120,852 120, 229 120, 445 120,873 122,003 122,792 123,541
Railway employees (class I steam railways): TotaL _________________________ thousands __ --------- 977 961 948 958 966 967 974 1, 010 Index:
U narljusted __ ------- _______ 1923-25= 100 __ 58,1 53.8 52.8 52.2 52.7 53.1 53.2 53.6 55.6 Adjusted ___________________________ do ____ 57.7 53.4 54.2 54.4 54.8 54,6 53.6 53.0 54.4 1'rades-union members employed:
All trades _________________ percent of totaL_ 89 84 85 84 85 86 87 88 89 Building ___________________________ do ____ 75 68 67 65 66 68 71 75 78 Metal _________ ----------- _________ do ____ 88 76 78 78 79 82 83 83 84 Printing ___ ----- ___________________ do ____ 92 88 88 88 87 88 90 90 90 All other ___________________________ do ____ 92 89 89 89 90 91 91 91 92 On full time (all trades) ____________ do ____ 72 64 65 65 66 67 69 70 70
LABOR CONDITIONS
Average weekly hours per worker in factories: National Industrial Conference Board (25 in-dustries) t ___________________________ hours __ 39.1 '36. 7 36.6 36.6 36.8 36.9 36.8 36.5 '37. 1 U. S. Department of Labor (87 industries)t
hours •• --------- '36.6 '37.3 '36.6 '37.1 '37.3 '36. 7 '36. 9 •37. 3 • Revised.
105.4 105.9
113.6 111.7 115 119 122 125 121 122 298 254
127.9 129.7 147 146 101 101
98.7 97.4 98 96
111.8 112.0 106 107
79.7 83.6 67 68
104.1 104.9 94. 5 95.4
121.1 121.4 65.7 65.2
92.6 93.8 70.9 72.2 80.3 82.8 59.5 89.4 92.2 94.3 83. I 91.1 81.9 83. I 73.4 76.4 78.1 75.6
89.0 93.7 7R. 3 80.7
129.2 , 129.3 96.7 90.5 73. 3 75.5 94.4 97.7 80.6 84.0 84.7 87.2 so. 9 82. ii 89.2 90.0
44.7 ,. 48.5 79,4 •81.4 60.4 '60.4 67.3 '66. 7 47.5 '48.1
93.2 93.8 69.7 69.8 75.4 '75. 5
106.5 '102. 7 100.0 '99.1 90.3 •89.8
83.6 82.5 91.7 89.8 81.5 80.6 87.9 89.0
50.0 48.0
264, 502 274,949 138,345 142,788 126,157 132,161
928,195 933,386 124,015 124,634
1, 019 1,022
M.1 56.3 54.7 54.9
88 88 76 75 84 85 90 89 91 92 70 71
'37.1 37.9
'36. 7 38.0
JANUARY 19.f0
105.7
116.2 122 123 122 297
128. 1 146 102
96.8 95
112. R 109
86. I 70
103.6 94.2
120.41 64.1
9F. 7 74.3 90.0
107.1 98.0 9.5. 3 83.7 79.2 79.9
99.9 82.3
'129.4 101.5 '76. 8 100.1 87.5 91.1
r 83.7 90.9
49.4 '85. 4 '62. 9
65.0 '47. 9
r 93. i '69.8
75.3
105.2 r 97.8 '91. 3
87.3 100. I 83.9
'90. 5
48.0
277, 'i03 142,868 134,835
940, 130 125,902
1,039
57. 1 55.9
89 75 86 90 93 71
38.2
'38.0
•107.6
'119. 7 132 125 122 309
'126. 8 146 103
r9i.4 r 96
'115. 0 114
91.2 74
'106. 2 '97. 8 120.4 63.5
•101. 0 78. 5 93.3
102.4 96.2 97.8
'88.0 87.9 86.9
98.6 86.0
132.4 '104. 8 '80. 2 105.0 90.6 95.9
'90.0 89.4
51.9 '93. 2
65.4 '64. 4 '47. 8
r 93.5 r 70.0 T 75,2
105.1 •96. 1 '92.
'88. '103. '84. '92.
'48.
8
5 6 5
262,76
0
0 4 6
133,90 128,85
937,351 126, 47
1, 07
59. 57.
1 5
8 7 8
9 4 8
9 7
90 3 2
39. 0
39.
tRevised series. Iowa employment revised beginning July 1937; revisions fl,l'e shown on p, 26 of the March 1939 Survey, Wisconsin employment and pay rolls have been adjusted, beginnin!( 1929, to trends indicated by Census data. Indexes not shown on p. 26 of the November 1938 Survey will appear in a subsequent issue. Other State anrl city employment inrlexes revised beginning with the year specified: Philadelphia, 1932: Pittsburgh, 1932: Wilmington, 1931; Delaware, 1931; New Jersev, 1931; anrl Pennsvlvania, 1932; data not shown on p. 26 of the December 1939 Survey will appear in a subsequent issue. For data on factory employment, adjusted (Federal 'Resen·e) revised see footnote marked with a "t" on p. 25. For U.S. Department of Labor averuge weekly hours per worker in factories, see note marked with a "t" on p. 29. Kational'rn: _dustrial Conference Board data relating to factory weekly and hourly earnings and to weekly hours per worker have been revised beginning 1934 ;see table 2, p. 18 of this ISSUe.

JANUARY 1940 SURVEY OF CURRENT BUSINESS 27
gether with explanatory notes and references ---1---~--- ------,----;------,----,----;-----;-----;-----.----.---Monthly statistics through December 1937, to-~19391 1938 I 1939
to the sources of the data may be found in the Novem- Novem-1 Decem- Janu- I Febru-1 March I A ·1 I M I June July I August I Sep- I Octo-1938 Supplement to the Survey ber her ber ary ary pn ay tern ber ber
EMPLOYMENT CONDITIONS .AND W .AGES-Continued
LABOR CONDITIONS-Continued
fndustrial disputes (strikes and lockouts): Beginning in month ________________ number.. • 165 [n progress during month ______________ do____ " 290 Workers involved in strikes:
Beginning in month ____________ thousands __ In progress during month ____________ do ___ _
Man-days idle during month __________ do ___ _ Employment operations (Social Security
Board):,
p 42 p 125
p l, 600
Applications; Active flle ______________________ thousands __________ _ New _______ --------------------------do____ (1)
Placements, totaL. _____________________ do ____ ---------Private ___________________________ .. do ____________ _
Ratio of private placements to active file percent _________ _
Labor turn-over in mfg. establishments: Accession rate ___ mo. rate per 100 employees .. Separation rate: TotaL _______________________________ do ___ _
Discharge .. ______ ------ __ ------ ••.. do ... _ Lay-ofi ... _ .• __ •. __ -------- ____ .... do. __ _ Quit. __ -------------- ____ .......•• .do ..•.
PAY ROLLS
Factory, unadjusted (U. S. DepHrtment of Labor)t __ --------------------1923-25=100. _
Durable goods. ________ --------- _______ do __ ._ Iron and steel and their products, not in
cluding machinery____ _ .1923-25= 100. _ Blast furnaces, steel works, and rolling
mills __ -------------------1923-25=100 .. Hardware ________________ ---- ______ do. __ _ Structural and ornamental metal work
1923-25=100 .. Tin cans and other tinware ________ do ....
Lumber and allied products __________ do ___ _ Furniture .. ______________ ---- ______ do ___ _ Lumber, sawmills __________________ do ___ _
Machinery, not including transportation equipment. ______________ 1923-25=100 ..
Agricultural implements (including trac-tors) _________ ---------- .. 1923-25=100 ..
Electrical machinery, apparatus, and supplies. _________________ 1923-25=100. _
Engines, turbines, water wheels, and windmills __ . ___ . ________ .1923-25= 100 _
Foundry and machine-shop products 1923-25= 100.-
Radios and phonogrHphs ___________ do ___ _ Metals, nonferrous, and products ____ do ___ _
Brass, bronze, and copper products.do ___ _ Stone, clay, and ~lass products _______ do ___ _
Brick, tile, and terra cotta .....•... do ___ _ Glass ____________________ -------- __ do ___ _
Tramportation equipment ___________ do ___ _ Automobiles ______________________ .do ___ _
Nondurable goods _____________________ do ___ _ Chemical, petroleum, and coal products
1923-25=100 .. Chemicals __________________________ do ___ _ Paints and varnishes _______________ do ___ _ Petroleum refining _________________ do ___ _ Rayon and allied products _________ do ___ _
Food and kindred products __________ do ___ _ Baking ____________________________ do ___ _ Sl"ughtering and meat packing .... do ___ _
Lpn.t.her and its m:::tnufactures ________ do ___ _ Boots and shocs ____________________ do ___ _
Paper and printing ___________________ do ___ _ Paper and pulp ____________________ do ___ _
Rubber products. ____________________ do ___ _ Rubber tires and inner tubes _______ do ___ _
Textiles and their products __________ do .... Fabrics ______ ----------------------do ___ _ Wearing appareL __________________ do ___ _
Tobacco manufactures _______________ do ___ _ Factory, unadjusted, by cities and States:
City or Industrial area: Baltimore._---------- _____ ••. 1929-31 = 100 .. Chicago_. ____________ ------ .. 19?5-27 = 100 .. Mil wan kee _________________________ ._do. __ . New York. __ ---------------- ________ do ___ _ Philadclphiat __ ------------ .. 1923-25=100 __ Pittsburght. _------------------------do .... Wilmingtont-------------------------do ___ _
State: Delawaret----------------------------do .... Illinois ___ --------------------1925-27= 100 .. Maryla~d __________ -------- .. 1929-31 :': 100 __ Massac usetts ______________ •. 1925-27-100 .. New Jerseyt ------------------1923-25= 100 .. New York ____ ----------------1925-27= 100 .• Pennsylvaniat ----------------1923-25= 100 .. Wisconsin t ______ •• _. _ .... __ .. 1925-27 = 100. _
4.10
2. 95 .15
I. 97 .83
101.8 101.2
114.3
127.2 118.7
66.9 104.9 68.8 85.7 61.1
117.3
140.5
109.7
142.3
91.5 170.1 115.0 15fl. 7 78.:1 54.2
120.1) 107.7 109.0 102.4
1:13.0 161.5 132.0 138. 1 310.7 125. 2 137.0 112 .. 1
71.7 f_\5. :{
114.1 124. 7 100.0 86.2 92.9 91.6 89.3 62.9
128.2 67 .. 5
109.4 87.4 85.6 95.2 83.7
92.9 77.8
127.9 78.9
106.4 87.8 90.1 99.4
207 372
43 75
558
7, 529 503 251 178
2.4
4.24
3.14 .10
2.44 • 60
84.4 77.6
81.0
84.3 96.4
48.6 88.8 55.9 68.5 50.0
83.2
101.7
83.7
89.1
65.9 117.3 87.0
103.9 67.3 42.3
103 .• 5 9.5. 6
107.6 92.1
118.3 130.4 116.0 133.7 277.1 120.6 132.9 106.9 66.4 60.0
104.5 103.0 83.0 73.3 80.5 78.4 79.3 61.8
96.8 55.9 89.9 76.0 70.4 61.4 65.5
74.2 62.6 98.7 66.3 83.6 72.9 67.0 81.6
177 310
38 62
513
7,216 477 230 161
2.2
3.22
3.88 .09
3. 21 • 58
87.1 79.6
82.7
85.7 93.2
51.6 89.2 55.7 71.5 48.3
88.5
122.5
86.1
95.3
70.8 118.1 87. 1
103.0 67.0 42.8
104.3 97.7
107.4 95.4
119.3 132.2 117.6 134.2 276.8 118.9 131.5 109.4 74.8 69.8
108.5 103.5 86.8 76.9 85.5 82.4 86.0 61.7
99.4 58.5 92.8 79.0 74.6 62.5 72.2
81.4 64.9
101.9 69.5 86.8 75.8 69.0 83.8
50 '72
'514
7, 434 644 199 130
1. 7
4.09
3.19 .10
2.24 .85
83.7 76.0
79.5
84.5 84.6
50.2 87.9 51.7 63.6 45.7
86.5
120.7
83.5
95.7
69.8 106.3 81.7 96.9 60.4 39.8 96.6 93.2
101.3 92.4
118.8 130.2 115.3 134.6 283.3 113.1 129.5 108.0 83.0 80.0
103.2 102.7 82.2 74.2 83.2 80.1 83.9 51.3
96.0 57.1 88.8 77.6 73.1 61.8 72. 7
81. g 63.2 97.9 68.3 84.7 74.4 67. 1 79.5
67 '87
'543
7,080 483 181 126
l.S
3.06
2. 61 .10
1. 87 .64
86.0 77.7
81.7
85.9 81.6
53.0 87.1 52.7 69.6 44.3
90.8
141.2
86.9
104.0
72.8 96.3 85.3
100.4 61.6 38.6 97.9 91.6 97.3 95.3
118.9 132.0 117.9 132.5 287.8 110.0 130.0 98.5 89.5 87.8
103.6 105.2 81.0 71.0 90.3 82.5 99.6 52.7
99.!; 57.3 95.4 82.0 7o.1 f>4. 7 73. 6
82 .. 1 65.1
102.2 70.9 86. 1 76.8 69.6 85.7
'198 '322
42 '63
'609
6, 749 500 254 185
2. 7
3.34
3.18 .13
2.23 .82
87.6 79.4
83.6
87.3 84.7
55.9 94.0 53.6 69.8 45.7
93.4
146.4
90.1
109.0
74.2 93.4 86.2
102.7 65.5 40.4
100.0 91.7 97.0 96.7
120.6 133.3 122.7 131.6 286.9 111.8 131.3 97.8 89.4 88.3
105.4 105.6 83.2 74.1 91.4 80.6
106.8 53.3
103.2 59.0 97.0 86.9 75.9 65.2 75.6
84.7 67.3
105.3 71.2 88.1 79.4 70.8 86.7
391 '420
•4, 880
6,545 478 270 195
3.0
2. 95
3. 46 .10
2.60 . 76
85.5 79.5
82.0
85.2 79.3
57.7 95.4 55.4 67.0 49.9
92.8
144.5
89.2
111.9
73.5 88.7 83.2 99.9 66.4 43.0 93.8 94.2 99.5 92.2
119.5 130.2 125.6 128.6 278.6 112.1 129.1 96.7 79.8 77.3
104.5 104.7 81.0 71.7 82.0 74.9 90.5 55.0
102.5 57.3 94.7 79.5 72.6 63.4 77.1
86.5 66.2
104.5 68.2 86.0 76.4 67.8 85.3
'230 '382
'93 '454
'3, 528
6,382 516 333 242
3.8
3.29
3.48 .13
2.67 .68
85.0 78.8
80.2
82.3 77.6
57.3 98.2 58.0 66.6 54.2
94.0
134.9
90.6
114.0
75.0 92.3 84.0
i03. 5 67.7 43.8 96.3 87.3 88.0 91.9
119.6 131.3 129.8 132.2 273.0 118.8 136.5 104.7 68.6 63.8
105.1 105.6 80.0 71.6 79.9 75.3 83.5 57.7
107.2 57.8 92.8 77.7 73.6 62.4 76.4
85.3 66.4
107.0 67.0 87.3 74.4 67.5 86.3
6, 283 570 344 251
4.0
3. 92
3. 31 .12
2.46 . 73
86.5 80.7
82.6
85.9 73.8
58.8 103.2 60.1 68.5 55.9
95.4
127.3
91.6
114.3
76.9 104.5 84.0
103.1 70.6 50.1
100.8 88.9 88.6 113.0
118. 7 131.5 128.9 134.4 271.8 123.8 138.1 106.7 74.6 70.4
103.5 104.5 82.1 74.8 79.6 7.5.6 82.3 61.5
110.5 58.7 96.5 76.9 76.1i (i6. 5 75.8
85.0 67.3
110.4 67.5 89.2 75.9 70.4 89.2
'172 '208
'1, 159
6,101 494 286 213
3. 5
4.161
3. 36 .12
2. 54 . 70
84.4 76.0
78.6
82.0 65.4
58.7 102.8 56.4 68.0 50.5
94.0
122.7
91.0
110.2
74.8 113. 6 82.4
103.9 65.9 46.4 91.5 76.6 72. 9 93.7
117.9 130.8 124.0 131.5 28:3.2 128.6 139.1 109.2 83.6 81.9
102.0 101.2 81.5 77. 1 79.3 76.6 79.7 61.8
110.6 59. 1 92.4 76.3 77.6 62.4 71.4
81.1 66.6
110.4 70.1 87.7 75.8 69.2 86.6
'Revised. • Preliminary. , Title changed from U. S. Employment Service. 1 Discontinued by original source.
'75 '112
'1,061
5, 790 558 336 254
4.4
5.06
3. 01 .14
2. 05 . 82
89.7 81.5
88.0
92.7 •80.1
63.9 114.9 62.9 75.5 56.8
96.9
124.0
93.4
113.5
78.4 122.8 '88. 7 110.5 '71.6
50.1 102. 5 78.3 7fi. 0 99.0
'119. 0 136.3 125. 6 135.9 246.6 135. 1 135.3 105.8 84.6 82.9
103. 7 107.7 86.3 78.9
'88. 2 '80. 2 98.3 62.7
114.0 61.3 98.1 85.5 79.1 72.0 li7. 7
7!1. 7 70.3
110.2 72.1 91. R 80.2 74.2 91.6
'158 r 305
5.680 (')
353 287
6.2
6.17
2. 79 .14
1. 58 1.07
'9:J. 8 '87. 9
'92.8
9.1. 3 '113. 9
6:J.3 117.4
r 6::.5 78.1
'50. 5
100.9
125.0
98.4
116.2
80.2 1~9. 0
r 96.5 122. ~
T 71.7 50.4
10.1. 0 r H9. H
'1o:J.4 100.5
'124 .. 1 1:19.7 127 .. 1 1:11. R 28(). 4 U9.6 138.8 107.9
7ll. () 72.4
109. :l ll~. 4 '91.0 T 82.7 T 96, ()
81.0 92. 1 62.9
118.3 62.8 91L4 81i. 4 79.7 72.6 7a.7
Rti. 7 71.7
117.1i 74.2 94.2 82.4 "14.9 90.1
p 186 p 315
p lOll p 130
P I, 500
5, 462 (')
366 :J08
6. 7
5.89
2. 91 .17
1.81 . 93
'101. 6 '99. 7
'112.0
'1?.:1.6 r 109.6
'68.3 111.2 r (),S, 9 r k4. n t 61.8
•111.0
'131. 3
'105. 7
'129. 2
'89. 5 '169. 6 '11~. 6 '151.1
T 79. k r 56.0
'121. 2 '!10. fi '114. 2 'JO:l.S
'(:J:l. 1 '157. 9 T l:i4. (j '140. n ':m:1. 4 r l~9.R T )~6. fi
107.7 7fi.!) 71.1
'll:J. 8 T ]2,1. fi '101.9
T tiO.fi T 93.6 '88. 0 rmt6 '63. 4
126.2 fi7.1
10:l. 4 \)0. t
r,Sf),!)
•92. 7 81.7
H2. 1 77.!1
121l. 9 77. ,I
101. :l R7. -1
•88.8 9fi. 2
tRevised series. For data on factory pay rolls (U. S. Dept. of Labor) seo footnote marked with a "t" on p. 25. For Wisoonsin pay rolls, see footnote marlred with a "t" on p. 26_ Other State and city payroll indexes revised beginning with the year soecified: Philadelphia, 1932: Pittsburgh, 1928; Wilmington, 1930; Delaware, 1932; New Jersey, 1932; and Pennsylvania. 19:12; data not shown in the December 1939 Rurvey will appear in a wbsequent issue.

28 SURVEY OF CURRENT BUSINESS
Monthly st~tistics through December 1937, to-~19391 1938 I 1939 gether with exp1anatory notes and references ---
1 1 1 1 1 1 to the sources of the data may be found in the Novem- Novem- Decem- Janu- Febru- March April May Juno 1938 Supplement to the Survey ber ber ber ary ary
EMPLOYMENT CONDITIONS AND WAGES-Continued
PAY ROLL~Continued
Nonmanularturing, unadjusted (U. 8. Department of Labor):
Mining: Anthracite. ___ -------- __________ 1929= 100 •. Bituminous coaL -------------------.do .... Metalliferous. ________________________ do ___ _ Petroleum, crude, produc!ng _________ do .••• Quarrying and nonmetallic ___________ do ___ _
Put>lic utilities: Electric light and power, and manufactured
gas. ___ ------------------------1929= 100 .. Electric railroads, etc _________________ do ___ _ 1'elepbone and telegraph _____________ do ___ _
Services: Dyeing and cleaning __________________ do ___ _ Laundries. __________ ----------- ______ do ___ _ Year-round hotels ____________________ do ___ _
Trade: Retail, totaL----- ____ -------- ________ do ___ _
General merchandising _____________ do ___ _ Other than general ruerchandising .. do ___ _
W halesale. ____________________ •• ___ ._do_.-
WAGES
42.6 96.6 64.1 59.4 42.9
101.5 70.1 94.3
71.8 82.8 82.5
71.8 95.6 70.5 79.5
Factory averr.ge weekly earnings: I N~twnal. Ir:dustrial Conference Board (25 I _ ,
mdustrtes>t ________________________ dollars__ 2K 49 U. S. D<•pariment of Labort ..••.... dollars .. ---------
Durable goods. ______________________ do .. -- ---------Iron anrl steel and their products, not In-
cluding machinery ___________ dollars .. ---------Blast furnaces, steel works, and rolling
mills __________________________ dollars .. ---------Tiarrlwnre. --··-- _____ ------ _______ do ... - ---------Structural and ornamental metal work
dollars .. ---------Tin cans and other tinware _______ do ____ ---------
Lumber and allied products ________ do ____ ---------Furniture .. ______ ---------------_ do __ -- ________ _ Lumber, sawmil!s ________________ do .•.. ---------
Machinery, not including transportation equipment ... ---------- _____ .do!lars .. ---------
Agricultural Implements (Including tractors) ____________________ dollars_-- ---------
Electrical machinery, apparatus, and supplies ______________________ dollars .. __ -------
Engin~s. turbines, water wheels, and windmills. ___________________ dollars. ___ -------
Foundry and machine-shop products dollars .. ---------
Radios and phonographs _________ do.---~---------Metals, nonferrous, and products .. do ____ ---------
Brass, bronze, and copper p~~?1~;~_1 ________ _ Stone, clay, and glass products _____ do ____ ---------
Brick, tile, and terra cotta _______ do ____ ---------Glass ___________ --------------- ___ do ____________ _
Transportation equipment _________ do ____ ---------Automobiles_------------ ________ do ____ ---------
Nondurable goods. __________________ do ____ ---------Chemical, petroleum, and coal products
do ____ ---------Chemicals._---------- ___________ do ____ ---------Paints and varnishes _____________ do ____ ---------Pelroleum reflning ________________ do ____ ---------Rayon and allied products ....... do ____________ _
Food and kindred products ________ do ____________ _ Baking ______ ----------------- ___ do ____________ _ Slanghteri'!g and m~at packing __ do .• --1---------
Leather and 1ts manmactnres ______ do .••. ---------Boots and shoes __ ----------------do ____ ~---------Paper and printing ________________ do ____________ _ Paper and pulp __________________ do ____ ---------
Rubber products ___________________ do ____ ---------Rubber tires and inner tubes ..... do ____ ---------
Textiles and their products ________ do ____ ---------Fabrics. ______ -------------------do ____ ---------Wearing appareL ________________ do ____ ---------
Tobacco manufactures. ____________ do ____ ---------Factory average hourly earnings:
National Industrial Conference Board (25 lndustries)t._ ______________________ dollars.. . 727
U. 8. Department of Lahort ........ dollars .. ---------Durable goods_-------------- ________ do ____ ---------
Iron and steel and their products, not in-cluding machinery ___________ dollars._ ---------
Blast furnaces, steel works, and rolling mills. _______________________ dollars .. ________ _ Hardware ________________________ do. ___ ---------Structural and ornamental metal work
dollars .. ---------'l'in cans and oth~r tinware ______ do ____ ---------
Lumber and allied products ________ do ____ ---------Furniture .. _____ -----------------do .••. ---------Lumber, sawmills ________________ do .... ---------
, Revised.
36.2 81.4 52.3 63.3 37.2
98.6 68.8 93.0
73.9 79.3 81.3
71.5 91.8 67.3 75.4
26.20 23.77 27.02
26.64
28.48 26.79
26.07 22.50 19.06 19.75 17.80
26.04
27.08
26.69
28.35
25.51 22.40 25.70
27.14 23.82 19.46 25.68 33.64 34.89 20.81
28. 11 ao. 22 27. 3·1 34.86 23.74 24.22 25.21 27.54 17.22 15.41 27 .. 58 23.78 27.58 32.77 16.35 16.35 16.35 16.55
.714
.639
.706
• 757
.842
.fJ89
• 72.5 • 607 • 490 • 524 .460
42.5 80.9 54.1 62.5 33.7
98.2 69.7 92.5
68.3 80.0 81.1
79.2 122.9 70.1 75.7
26.05 24.26 27.27
26.91
28.49 25.31
27.18 22. 7{) 19.86 20.60 17.62
27.00
29.85
27.26
29.73
26.48 22.62 25.81
26.92 21.03 20.06 25.76 32.72 33.22 :21. 52
28.36 :Jo.n 27.80 3.5. 30 23. sa 24.75 2.i.2fi 27. 6[1 18.62 17.11 28.01 23.85 28.40 33.76 17.00 16.82 17. 61 16.92
• 713 . o42 • 709
• 757
.842
. ti67
• 7'27 . 608 . 492 • 526 • 460
38.0 78.2 55.3 60.9 30.2
95.9 71. 1 92.0
65.8 79.6 80.2
69.7 84.0 66.7 75.5
25. t\5 23.80 26.53
26.37
28.18 23.42
26. 59 22.78 18.71 m13 17.50
26.51
27.92
27.05
29.21
26.11 22.15 21.85
25.79 22.98 19.li5 24. 72 31.32 31. 5,i 21.29
28.48 30. t);) 27.:54 :J5. 75 ~4. 22 24.96 25.47 28.05 19.71 18.54 27.87 23.82 27. 59 32.59 16.75 1fi. 55 17.38 15.59
. 713
. fi44
.710
. 755
.S3:; • !iGO
. 731
. 613
.490
. 521
.458
45.2 81.2 53.4 62.7 29.7
96.4 69.9 91.7
63.2 78.6 82.8
68.4 81.0 65.8 74.6
2t). 11 24.01 26.78
20.70
28.47 23.04
26.93 22.33 19. OJ 20.26 17.18
27.27
29.96
27.63
30.50
26.69 21.15 25.48
26. 12 23.43 19.47 25. Ol :w. ()9
30.80 21.17
28.38 00. 8!1 27.84 :J.5. 23 2-1.15 24.83 2:i. 40 26.98 20.19 19.-13 27.89 24.1il 27.ll 31.68 17.35 lfl.81 19.03 15.19
. 713
. f.43 • 709
. sa;, • (\51
. 729
. fi!O
.487
. 523
.452
34.2 77.8 53.6 61.3 33.1
96.8 70.5 91.9
67.7 79.3 81.1
C9.6 83.4 66.8 74.7
26.25 24.18 27.02
27.01
28.81 23.93
27.54 23.57 19.19 20.20 17.57
27.67
30.19
28.09
30.92
27.02 21.14 25.60
26.98 23.72 m59 2.i. 30 30.81 :JO. 87 21. 58
28. 14 31.08 28. :lO 35.20 24. 2-l 25. OG 25.52 27.32 20.12 19.17 28.37 24.43 27.40 32. 54 17.38 !fl .. 56 19.91 16.22
. 715
. fi4.o • 711
. 752
• 731 . 60S . 492 • 527 .'160
43.4 17.6 52.6 60.8 35.9
96.9 69.6 92.1
73.3 79.9 81.9
71.3 86.6 68.1 74.8
2G. 27 23.79 26.92
26.46
28.07 23.05
28.06 2:J.19 19.18 19.74 18.04
27.45
30.00
27.57
30.91
26.70 21.19 2!. 90
26.43 22.06 19.46 23. :l7 31.80 32.33 20.89
27. ()3 30. GG 28.24 31. :;9 :!3. ()4 24.57 25.11 27.23 18.73 17.58 28. OS 2~.11 27.00 31.48 16.36 1.5. 86 17.84 16.08
. 717
.642
. 710
. 752
. 83.5
. 6.)5
. 7:ll
. 611 '
.498 i
. 532 I
.471 I
57.0 20.4 54.1 61.2 39.7
98.8 70. 1 93.7
83.0 83.9 82.4
71.5 86.7 68.3 74.\l
26.19 23.84 26.82
26.17
27.40 23.87
27.71 23.66 19.72 10.86 18.95
27.86
29.56
28.11
30.95
27.23 21.73 25.38
27.18 23.47 19.91 24.1.\ 31.04 31.18 21.09
28.60 31.00 29. 12 :J5. 10 2:3.70 25.48 25.91 28.39 17.43 15.93 28.22 24.25 26.78 31.46 16.36 16.02 17.43 16.60
. 720
.M:l
. 707
• 752
. ~3!i • 651
• 727 . 609 . 502 . 530 . 481
36.1 66.5 53.8 62 .. \ 41.7
100.2 71.2 93.7
81.2 86.9 82.0
72.5 88. 1 6!J. 3 75.8
26.67 21.17 27.26
26.891
28.30 25.21
28.13 23.82 19.95 19.91 19.21
27.97
28.85
28.42
30.57
27.71 21.63 25.52
27.32 23.94 21.25 24.86 31.73 31.94 21.31
29.23 31.07 28.62 34. \l9 24.08 25.13 25.96 28.25 18. 65 17.28 28.10 24.13 27.88 33.06 16. 5l 16.20 17.46 17.19
. 721
.{i42 • 70b
• 756
.84~ • t\55
. 721
. fi04
. 504
. 527
. 484
JANUARY 1940
I I Sep- I July August tember October
25.2 6-±. ii 18. 5 f)]. 9 40.9 i
100. o I 70. fl 9!. 6
77. 1 88.0 79. 1
70.9 83.8 f>S. 2 75.8
26.64 23.64 26.31
25.81
27.12 23.38
27.42 23.12 18.61 19.47 17.08
27. f-5
29.20
28.05
30.36
26.95 21.71 25.ll
27.53 22.58 19. 58 23. 2ti 31.06 :11.50 21.25
28.85 ::>0. 74 28.14 :J3. 91 24.47 24.61 26.05 2S. 54 19.72 18.74 27.57 23.40 28.22 33.84 \fl. 46 16.23 17.14 17.48
. 721 • 637 • 702
• 75!)
. 849
.625
• 722 .605 .498 . 528 1
.473 I
33.8 '74. 6 '53. 0 '62. 0 '42. 9
, 101.1 I '71. 0 '94. 3
73.0 '85. 9 r 79.2
69.4 '81.1
67.0 r 76.2
27.29 24.521 27.92
28.171
30.13 26.10
28.74 24.20 20.14 20.90 18.76
28.07
29.11
28.50
31.01
27.78 22.38 25.98
28.00 24.26 21.17 25.45 33.71 35. 15 21.58
2\J. 49 31.48 28.47 34.76 24.81 23.95 25.49 27.77 19.78 18.74 28.04 24.65 28.52 33.77 17.20 16.63 18.77 17.43
• 720 • 634 .699
. 757
.843
.669
. 726 • 608 • 502 . 529 .481 I
'40. 1 '80.2 '5.5.1 '60.8
42.7
'101.0 r 70. 4 '91. 9
'78. 3 •84..5 '80.4
72.3 88.3 69.0
'78. 0
27.58 21.72 28.18
28.25
29.77 29.85
27.62 24.86 19.95 20.95 18.39
28.23
28.91
28.71
30.97
27.86 22.92 26.69
29.15 24.03 20.66 25.43 33.42 34.63 21.54
28. 8fi 31.08 28.65 3·1. 38 24.49 24. 16 26.00 27.99 18.45 17.04 28.89 25. Gi 28. ~3 34.5.5 16.91 16. 73 17.40 17.43
• 722 .63fl • 703
• 761
• S1.5 0 722
. 72l
.615 • 501 . 530 .479
52.2 '97. 7 '63. 7 '59.0 '45.1
'101. 0 '72. 3 '95. 9
'77. 3 '83. 9 '82. 2
74.2 '92.3 r 70.5 '80. 3
28.24 25.80 29.72
31.15
33.91 27.13
28.87 23.98 20.84 21.72 19.51
29.20
29.92
29.24
32.48
29.27 23.79 28.58
32.21 20.98 22.61 27. 7l 33.87 34.86 22.03
29.50 32. ,51 29.46 35.77 25.00 24.3!) 25.65 27.60 18.74 17.20 29.40 27.19 30.11 3.5. 91 17.60 17.23 18.68 17.57
.724
.645
. 712
• 71i.')
.B47
.676
. 736
. 609 •. 503 . 52~ .484
tRevised SBries. For revisions in National Industrial Conference Board factory weekly and hourly earnings, see note marked with a "t" on p. 26; fo rrevisions in the U. S. Department of Labor data on the same subject, see note marked with a "t" on p. 29.

JANUARY 1940 SURVEY OF CURRENT BUSINESS 29
gether with explanatory notes and references --- ----;---- ----;----,------,----.---.----,----.---.-----,---Monthly statistics through December 1937, to-~19391 1938 I 1939
to the sources of the data may be found in the Novem- Novem-1 Decem- Janu- I Febru-1 Ma ch I Ap il I May I June July I August I tesmepb-er !october 1938 Supplement to the Survey ber ber ber ary ary r r
EMPI,OYMENT CONDITIONS A.ND WAGES-Continued
WAGES-Continued
Factory average hourly earnings-Continued. U. S. Dept. of Labort-Continued.
Durable goods-Continued: Machinery, not including transportation
equipment ................... dollars ..........• Agrieultural implements (including
tractors) .......•. ·--------- .. do!Jars .. --------Electrical machinery, apparatus, and
supplios ........ ____ ·------- .. dollars .. ---------Engines, turbines, water wheels, and
windmills .... ________________ dollars .. ---------Foundry and machine-shop products
dollars .. ---------Radios and phonographs _________ do ____ ---------
Metals, nonferrous, and products •. do .... --------Brass, bronze, and copper products
dollars .. ---------Stone, clay, and glass products ...... do .... ---------
Brick, tile, and terra cotta ........ do .... ---------Glass ............. ________ ........ do .... ---------
Transportation equipment. ........ do .. __ ---------Automobiles._ .....•......... _ ... do ....•..•.••. _
Nondurable goods ..... __________ .. __ .do .•.. ___ ....•. Chemical, petroleum, and c0al prodncts
doliars ... ________ _ Cbemicals ........................ do ............. . Paints and varnishes _____________ do .... ~---···---Petroleum refimng _______________ do .... ---------Rayon and allied products ....... do .... ________ _
F~~k~~~-~-i~~~~~-~~~?-~~~~~:::~===~~::::I::::::::: Slaughtering and meat packing ... do .... ________ _
Leather and its manufactures ...... do .••. ________ _
p~:~:~~~H~~~~~:::::::::::::::~~::::I::::::::: Rubber products ___________________ do .... ________ _
Rubber tires and inner tubes ..... do .... ---------Textiles and their prodncts ......... do .... ---------
Fabrics ........ _ ................. do .•.. ________ _ Wearing appareL .....•.......... do ..•• ________ _
Tobacco manufactures ....•..•...... do .•........... Factory average weekly earnings, by States:
Delaware ..•.•.................. 1923-25=100.. 91. 'l Illinois ••.•. --------------------1925-27=100.. 96.3 Massachusetts ..... __________________ .. do. _________ _ New Jersey ...................... l923-25=100.. 119.5 New York ...................... l925-27=100 .. _______ _ Pennsyl vania ................... 1923-25= 100.. 110.8 Wisconsin t ....•.......•........ l925-27=100.. 107.9
Miscellaneous wage data: Construction wage rates (E. N. R.): §
Common labor. _____________ dol. per hour.. .GR5 Skilled labor -------------------------do.... 1. 4G
Farm wages without board (quarterly) t dol. per month ....
Railway wages (average, class I) dol. per hour .. ________ _
Hoad·bnilding wages, common labor: United States, averoge ....... dol. ver hour .. _______ _
East North CentraL ............... do .... _______ _ Ea.st South CentmL ............... do ... . ~!\fiddle Atlantic. _____________ ....... <to .. __ Mountain ..... ---------_ ............ <lo ... . New England ____________________ .. do ..... ·------ _ Pacific ................... ____________ do .... _______ _ South Atlantic ..................... do .... _______ _ West North CentraL .............. do .... __ _ West South CentraL. ....... __ ..... do .... _______ _
ALL PUBLIC RELIEF
Total, exclusive of cost of'adrninistration, ma-terial. etc.t ..................... mil. of doL--------·
0 bligations incurred for: Special types of public assistance ...... do .... ________ _ General relieL _______________________ oo .... --------·
Subsistence payments certified by the Farm Security Administration ....... mil. of ool..
Earnings of persons employed on Federal work programs
Civilian Conservation Corps ... mil. of doL Works Progress Administration:
Operated by W. P. A.t ............. do .... ________ _ Operated by other Federal agencies!_ <to .... '-·----- __
National Youth Administration: Student aid. -----------------------do ..•.... _____ _ Work projectst ...................... do .......... .
Other Federal work and construction projects t ........................ mil. of dol __ .. _ .. __ ..
'Revised. • Less than $500,000.
. 719 . 721
. 794 . 803
. 730 . 736
. 7SG . 79J
. 711 • 712
. 5S2 . 582
. 652 .670
. no . 707 • fl45 • 049 .531 .537 . 722 . 72:3 . 907 . 901 n~2 . H24
• 5SG • 53U
• 7-10 • Tl\1 . 776 . 7~1 .69.5 .G!J!J . 979 . 97-l • (j.jl • 6ll • 611 . 617 . 611 . 6) 5 • f1'35 0 679 . 53:; . 526 . 50S . 499 . 766 . 770 .612 .61:; . 756 .. 7f)5 . 952 .IJ6l
::~~I ::t,g .5,0 .520 .4G~ .400
85.2 89.2 90.1 92. G 91.5 94.3
HiS. 6 111.5 90.7 93.3 96.7 98.8
100.1 101.8
• 682 • 682 1.43 1.43
• 735 • 735
.40 .38
.59 . 63
.29 . ~7 • 50 I .51 . 55 .53
:ih I :~ • 27 • 26 .46 .43 • 3G .36
326
44 36
21
172
325
45 41
. 724
• 794
• 744
. 788
.713
.591
.607
• 701 .651 .540 .ns .898 . 921 .592
. :41
. 780
.699
.9SO
.G:l7
.62R
. 617
.n:-n
. 525
.498
. 7fi8
.616
. 770
.957
.484
. 4Gl
. 527 AS!
89.0 91.3 93.8
110.2 93.0 98.1 98.6
. 682 I. 43
34.92
. 740 I .37 • ,)9 ' .28 • 52 • 53 • 51 .6(i .27 4''
• 3.1
31G
4fi 44
2
21
15r. 5
§Constrnction wage rates as of Dec. 1, 1939, common labor $0.685. skilled labor $1.46.
• 7:;5 • 728
• 743 . 745
• 787 • 788
. 711 . 715
. 577 . 578 • 666 667
• 701 • 705 .619 .652 .542 .5H • 720 • 716 . 897 . 900 • f12,4 • 92G . .5D1 • 5!)1
• 738 • 72~ • 7RO • 780 .697 .698 .970 .973 .640 .641 . 632 • 6:!fl . 615 . 615 . C84 6SU . 522 . -524 .496 .wo • 768 • 771 . Gll . 614 . 7fil . (6:~ .953 .957 .188 . 48!) . 461 . 4.5!) . 5:lR • 541 .4Tl .474
88.3 89.6 92.0 93.9 95. 3 95.4
110.8 112.8 93. 7 95.9
100.3 101.2 103.6 103. 7
. 680 . 680 1.43 1.44
• 750 • 726
.35 .35
.60 .60 • 28 • 27 .5<3 .57 • 51 • 5·1 .48 . 50 • 67 • G5 . 27 . 27 .41 .40 . 38 . 37
310
46 45
2
21
150 4
2 4
341
318
46 '47
2
18
158 5
35
• 72G
. 795
• 742
• 792
• 714 i .5Sf> .670
. ?Oi
.648
.535 707
.897 • 92>l .583
. 721
.777
. 697
. 973
. 647
.027
.en
. 69i
. 52!
. 501
.772
.612
. 760 • 917 .4SO .158 .518 • 474
89.8 92.5 93.4
110.7 93.1 96.9
101.9
.683 I. 44
35.42
.732
.39
. 62
.30
.54 • 55 .57 .67 .28 .42 . 37
309
46 41
20
146 6
40
• 725 • 725
. 787 • 7RO
• 744 . 744
• 787 . 782
• 710 • 71G • 5S9 . 583 • 67~{ . 671
. 70~ . 707
.644 .617
. 534 . 5:JS
.706 .711
.89! .895
.!l:ll .ml:;
. 5g2 590
. 740 • 757
. 77G . 777
. 701 .697
. 970 . 972
.P,47 .643
.fl:ll .622
.617 .018
.689 . fi91
. 528 . 529
. .504 . 505
. 774 .776
.616 618
. 700 . 7(\5
. 944 . 947
.478 .4n
. <160 . 459
.511 .499
.473 .4H
88.9 91.4 92.8 93.4 93.5 94.9
111.8 113. 0 92.6 m. 8 97.5 101.0
102.1 102.6
. 682 . 684 1.44 1.44
.720 .719
.40 .41
.60 . 63 • 28 . 29 .51 . 51 . 55 . 5G .52 .49 .63 . 65 .28 . 28 .45 .45 .37 .37
308
46 39
2
20
141 7
2
46
47 37
19
133 7
2 4
54
. 724
. 785
• 743
779
.715
. 576
.672
. 715
.616
.5'H
. 7]()
.886
. 928
.587
. 7f)(i
. 783
. 704
. 985
.fn9
. 613
. 624
.687
. 522 '4\18 . 772 .615 . 7i'2 .956 .472 .460 .4HG .•!76
88.2 92.3 95.8
112. 1 9!.0 97.3
•97.1
. 6841 1. 44
3G. 2G
• 724
. 43
.flO I .29
.• 12
.56
. 49
. 65
. 29
. 47
. 35
279
48 36
120 2
0 3
61
. 721 . 722
. 781 • 778
• 737 . 741)
. 778 . 787
.714 .715
.576 .577
.668 .674
.710 .714
. GIG .G47 .539 .510 . 714 . 718 .888 . 89.1 . 93G . 934 585 • 583
. 7M . 741
. 7g5 . 781
. 701 . 704 . 975 . 96\J . M:l . C46 • 5DG • 5~5 624 . 6~0
.llSS . G86
.520 . 5;)2
. 502 • 508
. 768 . 771
. 61~ . 620
. 770 . 7fiS
. 956 . 95\1
. 4.8:1 . 482
.4()0 . 461 • 52B . 519 .472 .475
82.4 83.9 94. 6 94..1 95.6 06.7
113. 3 ll3. 5 95.4 9t I
103.0 101. ,) •101. 8 O<J.l
• 68,5 . GS5 l.H 1.44
. 111 . nt . 43 . 41 .m .60 . 30 .10 . 51 . 53 . 57 .. )il . 47 '.45 .li4 .6-1 . :lO .'I!J .46 . Hi . :n . :n
276
48 38
19
108 3
54
17
. 721
. 782
. 733
. 796
.718
.573
. 691
. 755
.Go2
. 5f):~
. 727
.889
.n~:)
. 590
. 740
. 7-SH
.7l4
. n7:)
.flHi
.608
.ll20
.(i81
. 5:l~ • 508 .1n .6':W . 7()1)
. 0()2
. 48ft • 4()3 • 52!) . 475
90.3 98.2 96.6
11\i. 7 !lG.4
'ilL 1 107.6
.G85 1.44
36. 13
• 729
.43
.5H
. 31
. 51 • 57 . 48 . 64 .:lll .47 .38
2fi0
4S 39
4
tRevised series. For revisions in U. S. Department of Lahor factory weekly and hourly earnings, and hours worked per week, see table 1 p. 17 of this issue. Farm wages revised beginning 1913; see table 53, p. 18 of the November 1939 issue. Data on all public relief revised beginning with January 1933; The historical record can be obtaineo from the most recent Social Security Bulletin together with the issue for August 1939. The revised series differ from those previously published in that they include, in aodition to earnings of persons certified as in need of relief, the earnings of all other persons employed on work or construction projects financed in whole or in part from Federal funds. Wisconsin weekly earnings revised beginning January 1929; data not shown in the December 1939 Survey will appear in a subsequent issue.

30 SURVEY OF CURRENT BUSINESS JANUARY 1940
gether with explanatory notes and references --- ----,,---,----,-----,-----,----.---.----,----;-----Monthly statistics through December 1937, to-~19391 1938 I 1939
to the sources of the data may be found in the Novem- Novem-1 Decem- Janu- I Febru-1 I I I I I I Sep I 1938 Supplement to the Survey ber ber ber ary ary March April May June July August temb~r October
BANKING
t~.cceptances and com') paper outstanding: Bankers' acceptances, totaL _____ mll. of doL_
Held by Federal Reserve banks: For own account ___________________ _do ___ _ For foreign correspondents _________ do ___ _
Held by group of accepting banks: Tota!_ _______________________ mil. of doL
Own bills ________________________ do ___ _ Purchased bllls _____ ------------ __ do ___ _
Held by others _________________ , _____ do ___ _ Commercial paper outstandlng _________ do ___ _ rricultural loans outstanding of agencies su
pervised by the Farm Credit Adm: Grand totaL _____________________ mil. of doL_
Farm mortgage loans, totaL _________ do ___ _ Federal land banks ________________ do ___ _ Land Bank Commlssioner_ ________ do ___ _
Loans to cooperatives, total• ________ do ___ _ Banks for cooperativeR Incl. Central
Bank __ --------------· _____ mil. of doL Agricultural Marketing Act revolving fund _______________________ mil. of doL
Short-term credit, totaL ______________ do ___ _ Federal Intermediate credit banks, loans
to and discounts for: Regional agricultural credit corps.,
prod. credit ass'ns, and banks for co-operativesci" ______________ mil. of doL_
Other financing lnstitutions _____ _do ___ _ Production credit ass'ns ____________ do ___ _ Regional agr. credit corps __________ do ___ _ Emergency crop loans _____________ do ___ _ Drought relief loans ________________ do ___ _
Joint Stock Land Banks in liquidation __ do ___ _ Bank debits, total (141 cities) _______ mil. of doL_
New York City _______________________ do ___ _ Outside New York City _______________ do ___ _
223
0 0
172 103 69 51
214
3,067 2, 605 1, 910
695 95
73
21 366
165 33
157 8
116 53 70
31,676 13,041 18,636
Federal Reserve banks, condition, end of mo.: Assets (resources) totaL __________ mil. of dol .. _ 18,740
Reserve bank credit outstanding, total mil. of doL Bills bought _______________________ do ___ _
Bills discounted. __________________ do ___ _ United States securities ____________ do ___ _
Reserves, totaL _____________________ do ___ _ Gold certificates ___________________ do ___ _
Liabilities, total ________ ------------ ____ do ___ _ Deposits, total ______________________ do ___ _
Member bank reserve balances, total mil. of doL
Excess reserves (estimated) ______ do ___ _ Federal Reserve notes in circulation __ do ___ _
Reserve ratio ________________________ percent._ Federal Reserve reporting member banks,
condition, Wednesday nearest end of month: Deposits:
Demand, adjusted _____________ mil. of doL Time ________________________________ do ___ _ Domestic interbank __________________ do .. --
Investments. total , ____________________ do ___ _ U.S. Government direct obllgations __ do ___ _ Obligations fully guaranteed by U. S.
Government_ ________________ mil. of doL_ Other securities , ____________________ do ___ _
Lonns, total, __________________________ do ___ _
2,650 0 8
2, 552 15, 295 14, U76 18,740 12,865
11,628 5,160 4,862 86.3
18,972 5, 2:32 7,894
11,503 8, 713
2, 408 3, 3S2 S,656
Commercial, Industrial, and agricultural loans, ______________________ mil. of doL 4,~7~
Open m~rket paper ___________________ do ___ _ To brokers and dealers In securities
mil. of doL Other loans for purchasing or carrying secu-
rities_------- _________________ mil. of doL Real estate loans _____________________ do ___ _ Loans to banks ______________________ do ___ _ Other loans, _________________________ do ___ _
Money and interest rates: Bank rates to customers•:
660
499 1, 189
36 1, 579
In New York City ________________ percent__ ---------In seven other northern and eastern cities
percent__--------In eleven southern and western cities
percent__---------Bond yields (Moody's): Aaa __________________________________ do ___ _
Baa _________________________________ do ___ _ Discount rate (N.Y. F. R. Bank) _______ do ___ _ Federal land bank loans ________________ do ___ _ Federal intermediate credit bank loans __ do ___ _ Open market rates, N.Y. C.:
Acceptances, prime, hankers. ________ do ___ _ Call loans, renewal (N.Y. S. E.) ______ do ___ _ Commercial paper, prime (4-6 months)
percent__ Time loans, 90 days (N.Y. S. E.) _____ do ___ _ Treasury bills, 91 days (yield). _______ do ___ _ Treasury notes, 3-5 years (yield) _____ do ___ _
3.00 4. 85 1.00 4. 00 1. 50
!in 1. 00
~-% 1~4 . 0.5 . 64
273
0 (•)
222 124 98 51
206
3, 229 2, 751 1, 990
760 112
86
25 366
167 35
148 12
117 55 89
29,463 12,425 17,039
15,293
2, 584 1 7
2,564 1!, 970 11,613 15,293 9, 935
8,876 3,383 4, 385 83.6
16,013 5,124 6, 212
13,008 8,103
1, 682 3. 220 8, 317
3,866 338
712
572 1, 169
117 1, 543
1. 70
2.68
3. 20
3.10 5.23 1.00 4.00 2.00
Vi• 1 00
%-% IH .04 • 71
270
0 (•)
212 121 91 58
187
3, 210 2, 735 1, 982
753 112
87
24 363
168 34
148 11
116 55 87
39,966 18,879 21,087
15, 581
2, 601 1 4
2, 564 12,166 11, 798 15,581 10,088
8, 724 3,205 4,452 83.7
1.5, 986 5, 160 6,061
13,219 8, 266
1. 732 3, 221 8, 430
3,843 328
848
560 1, 169
115 1, 567
1. 70
2. 95
3.23
3.08 5. 27 1.00 4.00 2. 00
'VI• 1.00
% 1H . 03 .67
FINANCE
0 0
204 122 82 52
195
3,185 2, 719 1, 973
746 105
80
24 362
164 33
148 11
115 55 85
32,393 14,533 17,860
15,639
2, 607 1 5
2, 574 12,382 11,948 15,639 10,420
9, 215 3,644 4, 339 83.9
16.048 5. 183 6, 359
13,209 8,173
1, 789 3, 247 8, 233
3, 767 324
792
535 1,174
99 I, 542
1. 73
2. 97
3. 32
3.01 5.12 1.00 4. 00 2. 00
Vi• 1.00
~-% g:( .03 • 65
248
0 0
198 122 76 50
195
3,178 2, 710 1, 969
741 98
74
24 370
167 34
155 11
116 54 85
27,581 12,380 15,201
15, 862
2,598 1 4
2,564 12,561 12,125 15,862 10,571
8,936 3, 387 4, 353 84.2
15,965 5, 202 6, 414
13, 408 8, 143
2,019 3, 246 8,186
3, 773 313
799
523 l, 136
92 1, 550
1. 70
2. 69
3.26
3.00 5.05 1.00 4.00 1.92
Vi• 1.00
H-% 1% .03 . 63
245
0 0
191 117
74 54
191
3,173 2, 694 1, 960
734 91
66
23 389
175 35
168 10
121 54 83
34,486 16, 274 18, 211
16, 186
2,587 1 4
2, 564 12,951 12, 553 16, 186 10,919
9,157 3,559 4,380 84.7
15,991 5, 217 6, 466
13. 3S8 8,096
2,026 3, 2fl6 8,191
3, 814 305
764
531 1, 140
91 1, 543
2.13
3.05
3. 77
2. 99 4.89 1.00 4. 00 1.50
Ho 1.00
~2-% g:( . 03 . 51
238
0 0
189 118 72 49
192
3,172 2,683 1, 955
728 86
61
23 403
183 36
178 10
125 54 82
30,143 13,311 16,832
16,766
2, 595 1 3
2, 571 13,476 13,103 16,766 11,376
9,900 4, 098 4,458 85.1
16,660 ,), 248 6, 627
13.714 8, 341
2, 026 3, 347 8,071
3, 841 302
648
539 1, 148
60 1, 533
247
0 0
192 124 68 55
189
3,166 2, 671 1, 948
723 84
60
23 411
187 38
183 10
125 54 80
31,928 14, 165 17,763
16,922
2, 573 1 4
2, 564 13,673 13,326 16,922 11, 535
10,029 4, 218 4,477 85.4
16,965 ,), 235 6,675
13,554 8, 237
2, 055 3, 262 8,126
3, 822 308
721
539 1,156
59 1, 521
3. 02 2. 97 5.15 5. 07 1.00 1.00 4. 00 4. 00 I. 50 I. 50
Vi• ~16 1.00 1.00
%-% H-% 1% 1H . 03 .03 • 50 . 42
•Less than $500,000. ci"To avolcl duplication. these loans are excluded from the total•.
245
0 0
191 122 69 53
181
3,158 2,658 1, 941
718 83
60
23 417
190 40
188 10
125 54 79
33,988 15,312 18,676
17, 172
2, 579 1 5
2, 551 13, 874 13, 524 17, 172 11,701
10,018 4,140 4, 511 85.6
17,220 5, 237 6, 747
13,862 8,423
2,148 3, 291 8,089
3,833 303
648
543 1, 161
51 1, 550
2.15
3.05
3. 62
2.92 4.91 1. 00 4.00 1.50
Vie 1.00
*"% 1H .03 • 39
236 235
0 0 0 (•)
188 119 69 48
194
3,148 2,647 1, 934
713 85
62
22 417
189 41
188 10
125 54 77
30,477 12,794 17,683
17,348
2, 486 1 5
2, 488 14,230 13,878 17,348 11,952
10, 507 4, 553 4. 530 86.3
17,462 5, 243 7, 012
14,078 8, 515
2, 241 3, 322 8,166
3,887 313
655
526 1,168
74 1, 543
191 128 63 44
201
3,134 2, 637 1, 928
708 84
61
22 414
188 42
185 10
124 54 76
30,613 13,118 17,496
17,823
2, 446 1 5
2, 426 14,661 14,321 17,823 12,247
10, 918 4. 758 4, 631 86.9
18. 096 5, 247 7.167
14, 233 8, 565
2,286 3, 3R2 8, 209
3, 996 317
608
519 1, 174
49 1, 546
2.89 2. 93 4. 84 4. 85 1. 00 1. 00 4.00 4. 00 1. 50 1. 50
Vie Vi• 1.00 1. 00
~-% ~-% 1H H4 .04 .05 .45 . 48
216
0 (•)
177 115 62 39
209
3,109 2,626 1, 923
704 88
65
22 395
180 38
174 9
121 54 75
33,664 15, 138 18, 526
18,602
2,878 1 6
2, 80,1 15,013 14,679 18,602 12,953
11,655 5, 352 4, 720 85.0
18, 333 5, 231 7,667
14,069 8, 437
•) 23° ~: 400 8, 350
4, 229 316
533
510 1, 180
35 1, 547
2.04
2. 78
3.31
3. ~5 5.00 l. 00 ·tOO 1. 50
~1n 1. 00
%-% 1% .14
1. 07
221
0 (•)
179 111 6 4
20
3, 08~ 2, 61. 1,91
69[ 93
iO
22 376
170 34
153 8
118 53 73
32, ill 13, 683 19, 029
18,779
2, 801 0 6
2, 73ii t.o,1iS 14, 838 18, 779 12,988
11.973 5, 55o 4, 773 85.5
18, 55ii 5, ?49 7, 954-
14. 207 8, 684
2, 2:l2 :;, 291 t;, 521
4, 310 31,
6o:
51 1, 18
:w 1, 559
3.l!i 4.8R 1.00 4. 00 1. 50
*New series: Data beginning; 1928 not shown in the December 1939 Survey will appear in a subsequent i.,sue. Quarterly figures beginning .March 1939 are not strictly comparable with earlier data. For explanation of new series, se~ the November 1939 issue of the Federal Reserve Bulletm.
,See note marked with a,., .. on p. 30 of the July 1939 issue. •Includes a small amount of Federal intermediate credit bank loans (direct) not shown separately.

.JANUARY 1940 SURVEY OF CURRENT BUSINESS
Monthly statistics through December 1937, to-~19391 1938 I 1939 gether with explanatory notes and references ---to the sources of the data may be found in the Novem· Novem-1 Decem- Janu- I Febru-1 March I A ·1 I M y I Jun I J 1 I A t I Sep- lo t b 1938 Supplement to the Survey ber ber ber ary ary pn a e u Y ugus tem her c 0 er
FINANCE-Continued
BANKING-Continued
Savings deposits: Savings banks In New York State:
Amount due depositors ......••• mil. of doL. U.S. Postal Savings:
5, 547 5,359 5, 405 5,417 5,431 5,478
Balance to credit of depositors ________ do ____ 1, 274 1,250 1, 252 I, 259 1,263 1,266 Balance on deposit In banks __________ do ____ 55 87 86 83 81 80
COMMERCIAL FAILURESt
Grand totaL ________________________ .number .. 886 984 875 1,263 963 I, 057 Commercial service, totaL _____________ do .... 28 48 37 54 32 49 Construction, totaL .• __________________ do ____ 46 55 48 54 45 50 Manufacturing, totaL __________________ do ____ 190 196 175 218 177 203
Chemicals and drugs _________________ do .... 9 6 11 7 12 6 Foods ________ . _______________________ do ____ 49 44 33 43 42 51 Forest products.--------------- ....•. do ____ 13 13 21 17 18 20 Fuels._. _____ ------- _________________ do. ___ 4 0 3 9 6 3 Iron and steeL ______________________ do .... 8 10 8 12 9 1l Leather and leather products _________ do .... 9 10 5 12 9 7 MachinerY---------------------------do ____ 7 12 11 17 11 15 Paper, printing, and publishing ______ do ____ 12 15 8 15 I6 13 Stone, clay, glass and products _______ do .... 9 7 4 8 4 8 Textiles .. ______ . _____________________ do. ___ 36 51 44 41 31 48 Transportation equipment ___________ do ____ 3 8 3 3 0 4 Miscellaneous __ . __________ . ________ •• do ____ 31 20 24 34 19 17
Retail trade, totaL. ____________________ do .... 525 586 527 802 618 634 'Vholesale trade, totaL _________________ do ____ 97 99 88 135 91 121
Liabilities, grand total.. ______ ... thous. of doL 11,877 12,302 36,528 19,122 12,788 17,851 Commercial service, totaJ. _____________ do ____ 494 1,158 I,628 I, 912 262 I, 106 Construction, total.. .. _________________ do .... 746 713 797 615 968 I, 228 Manufacturing, total. __________________ do •• __ 4,177 4, 434 6, 285 6, 803 4, 985 7, 867
Chemicals and drugs _________________ do ____ 123 90 185 81 125 54 Foods .. _____ . ________________________ do. ___ I, 214 703 I, 743 I, 636 I, 482 3, 248 Forest products ______________________ do ..•. 149 909 489 387 237 742 Fuels. _______ ------- ------------·----do. ___ 72 0 !56 357 306 755 Iron and steel. _______________________ do ____ 313 429 524 I,090 255 305 J,eather and leather products _________ do ____ 68 92 169 575 118 86 Machinery --------·------------------do .... 213 162 704 713 255 302 Paper, printing, and publishing ______ do .... 93 333 89 267 512 185 Stone, clay, glass and products ..•.•. .do ____ 219 270 116 335 112 155 Textiles .. __ ._ .. ______________________ do. __ . 469 892 540 650 1,055 I, 612 Transportation equipment ___________ do .••• 122 149 1,206 26 0 145 Miscellaneous ________________________ do •.•. 1,122 405 364 686 628 278
Retail trade, totaL ____________________ do ____ 4, 505 4, 613 4,142 7, 731 5, 251 5, 618 Wholesale trade, totaL _______________ _do ____ I, 955 I,484 23,676 2,061 I, 322 2,036
LIFE INSURANCE
(Association of Life Insurance Presidents)
Assets, admitted, total:t ____________ miJ. of doL --------- 22,620 22,729 22,850 22,929 23,018 Mortgage loans, totaL _________________ do .... 4,361 4, 381 4,395 4,403 4,410
Farm._---------------- ______________ do ____ 673 670 670 669 667 Other. _______________________________ do ____ --------- 3,688 3, ill 3, 725 3, i34 3, 743 Real estate holdings ___________________ do ____ --------- I, 790 I, 751 I, 743 I, 740 I, 738 Policy loans and premium notes _______ do ____ --------- 2,650 2,636 2,628 2, 621 2,611 Bonds and stocks held (book value) total
12,629 12,869 12,884 12,950 mil. of doL --------- 12,999 Government (domestic and foreign) .. do ____ --------- 5,603 5, 794 5,857 5,895 5,903 Public utility __ ------ ________________ do ____ 2,950 3,004 2,957 2,974 2, 995 Railroad. __ ------------ _____________ do .... 2, 726 2, 649 2,653 2,657 2,671 Other ________________________________ do. ___ --------- 1, 350 I,422 1,417 1,424 1,430
Cash ... ____ ---------------------------.do ____ --------- 821 635 747 759 810 Other admitted assets __________________ do .... --------- 369 457 453 456 450
Insurance written: ffi Policies and certificates, total number
865 1,089 thousands .. 724 648 675 842
?n"X~,ft;:ra·c~~~~~~~~~~~~~~~~~~~~~~~~~~gg~=== 41 34 71 30 23 33 455 608 755 357 399 499
Ordinary ___ -------------------------do .. __ 228 223 264 262 252 310 Value, totaL ___________________ thous. of doL. 587,498 671,262 974,920 729,937 570,491 645,019
Group __ ----------. ____ ---------- ____ do ____ 44,027 43,754 91,294 51,899 40,365 45,205 IndustriaL. _________________________ do .. _. 128, 121 182,690 226,085 99,363 109,871 138,396 Ordinary __ --------------------------do ____ 41.'), 350 444,818 657, 54! 578,675 420,255 461,418
Premium collections, totaL ______________ do .... 247,397 248,595 355,603 277,860 250,374 287,539 Annul ties _____________________________ .do ___ . 23,412 28,515 50,208 35,905 22,491 25,817 Group __ .------------- -----------------do .. __ 10,854 10, 001 12,148 12.914 11,667 13,019 IndustriaL ____________________________ do __ .. 52,800 55,034 96,493 65,146 56,981 62,960 Ordinary ___ ---------------------------do ••.. 160, 331 155,045 196,754 163,895 159,235 185,743
(Life Insurance Sales Research Bureau) t Insurance wrltten,ordinary, totaL thous. of doL •• 537,951 585,093 902,741 729,766 532,032 577,293 New England __________________________ do ..•• 41,938 43,989 61,883 58,827 43,632 44,852
Middle Atlantic __ . ____________________ do .... 150, 742 175,485 2Sl, 685 194,457 140,911 159,747 East North CentraJ. ___________________ do .... 122,522 123,754 188,369 174,370 122,242 130,647 West North CentraL __________________ do .... 54,246 57,794 93, 598 76,498 54, 148 55,913 South Atlantic. ____ --------------------dO---- 5I,Om 52,065 78,758 63,300 48,038 53,050 East South Central. ___________________ do .... 20,133 23,573 33, 643 27, 101 20,386 22,845 West South CentraL __________________ do ____ 40, 588 45, 281 67,709 53,202 42,233 45,997 Mountain .... __________________________ do •... 14,043 15,104 22, 278 17,806 13,677 15,848 Pacific. __ ----------------------- ___ ... .do ____ 42, i36 48, 048 74,818 64,295 46,765 48,304 Lapse rates _______________________ l925-26= 100 .• --- _ ..... --------- 101 --------- ---------. ---------
'Revised.
5, 463 5,471 5, 514 5, 519
I,264 1,262 1, 262 1, 268 76 73 68 58
I, 064 1, 028 847 885 43 42 48 25 51 62 50 35
208 189 158 186 4 4 7 3
58 51 38 49 17 21 11 14 11 I 5 6 12 10 12 6
9 4 11 5 16 8 8 14 13 l1 12 19
1 8 5 6 38 52 29 40
2 4 4 I 27 15 16 23
629 608 506 548 133 127 85 91
17, 435 14, 664 11,460 14,128 490 875 494 330 744 I, 154 1,150 361
8, 286 4, 877 4, 459 6, 701 100 !07 97 32
1, 441 I, 848 1, 056 2, 368 339 525 214 212
1, 164 100 341 1,017 363 316 312 53
1,837 28 199 213 563 281 276 773 666 407 216 260
8 212 79 263 1, 022 803 1,144 1,130
388 44 45 58 395 206 480 322
5,526 5,R18 3, 734 4, 668 2, 389 I, 940 1,623 2,068
23,100 23,199 23,275 23,398 4,416 4,424 4,435 4,442
667 666 664 659 3, 749 3, 758 3, 771 3, 783 I, 743 1, 746 I, 745 I, 747 2,605 2, 598 2, 585 2, 573
13,428 13,065 13, 127 13, 358 5, 952 5, 977 6, 057 6,079 3, 003 3,007 3,139 3,163 2,675 2,684 2, 699 2, 702 1,435 1,459 1,463 I, 484
827 858 727 780 444 446 425 428
716 812 841 687 20 33 134 26
464 496 461 427 232 283 245 234
550,666 604,445 729,749 506,380 36,981 43,278 194,223 23,862
129,051 137,073 128,568 118,218 385,634 424,094 406,958 3fl4, 300 243,414 257,965 268,472 248,077
19,838 22,809 25,496 27,712 10,450 11,302 11,528 10,497 61,263 59,846 61,255 55,554
151,863 164,008 170,193 154,314
495,650 '532,089 524,925 462,423 37,658 40,608 41,314 36,030
140, 175 148,804 142,293 124, 598 109,638 117,143 116,689 102,981
49,272 53,372 53,078 48,575 45,771 50,104 51,134 42,233 19,070 21,059 21,811 18, 277 38,401 42,221 40,791 37,658 13,663 14,406 14,935 13,659 42,002 44,372 42,880 38, 412
--------- --------- 93 ---------
5, 529 5, 557
1, 271 1, 267 56 , 55
859 7.58 41 34 46 45
151 133 4 7
39 32 18 14
I 4 8 2
11 3 5 8
12 10 3 fl
31 22 1 4
18 21 528 4f,2
93 R4 11,259 9,402
491 498 765 927
4, OG9 3, 17,1) 38 124
I, 642 5G9 521 415 40 ~1(\
337 18 311 28 51 192
269 59 20 9R
535 342 16 95
289 419 4, 461 3, 700 1, 473 1,102
23,489 23, 008 4,460 4,472
663 (i/)2 3, 797 3, 810 1, 750 1, 751 2, 5G4 2, 557
13, 485 13, f-53 6,123 6,110 3, 202 3, 2.)9 2, 705 2,697 I, 455 1, 4~7
809 837 421 438
942 642 261 24 431 417 250 20{\
584, 595 509,897 83,901 59,401
119,068 115, 935 381,626 334, 5G1 244,706 234,418
23,472 18,248 IJ, 292 11,320 54,271 !i9,970
155, 671 144,880
479,794 442, !W7 34, 3M 3:l, 4\!3
123,012 llS, 713 107,019 95, 351
51,080 45, 61J 48,480 43, fl95 19, 729 19,741 38,831 :10,567 14,842 12, 7fi6 42, 437 36, i40
5, 55'
1, 27 0 5
91 6 9 2
4() 175 11 4 0
3 8
14
(
ll 1
' 3' 3 2 4 2
55, 10 9
0 )
16, 14 73\
1, 09, 6, G,"
121 1, 47 2
7 I, 39 Ill 2(i' 2
2 5 I 0 6 6 r,
29' 1, 45
42 17 50 12 :12
4, 52( 3,12
23, 71 4, 1S
1 6 2 4 l
06' 3, R2 1, 75: 2, 54,
13,68 t),09t 3, 401 2, 69 1,49 2
0 8
80 43
79 0 I 4 5 5 g
5 48 25,
637,67 75, 92,
l::J5, 76 425,97 238,49
9 7 2 9 1
20, 87' 10, 7S 57, Oflf
149,77
513,991 43, I:l(
152,54 122, H~
5-1, 33'
s s 9 s 3 s l 8
52, 59 19, 41. 40, OK 14,74: 44, 2:l
--------- ------ ----------
tRevised series. Data on commercial failures revised beginning June 1934; see table 3, pp. 17-18 of the December 1938 iHsue. Data for insurance written, ordinary (Life Insurance Sales Research Bureau) revised for the period 1936-38 to include a small amount of intermediate insurance omitted from the original compilation. Revised data not shown on p. 31 of the November 1939 Survey will appear in a subsequent issue.
:137 companies having 82 percent of total assets of all United States legal reserve companies. @40 companies having 82 percent of total life insurance outstanding in all United States legal reserve companies.

32 SURVEY OF CURRENT BUSINESS
Monthly statistics through December 1937, to-~19391 1938 I gether with explanatory notes and references --- , ------ -
1 to the sources of the data may be found in the N"ovem- Novem-1 Decem- .Tanu- I Febru- 1 M· reb 1938 Supplement to the Survey ber ber 1 ber ary I ary I - ~ I April I May I June
FINANCE-Continued
MONETARY STATISTICS Foreign exchange rates:
Argentina _______________ dol. per paper peso .• Belgium ________________________ dol. per helga __ Brazil, officiaL _______________ dol. per milreis __ British lndia __________________ dol. per rupee __ Canada ________________ doL per CanadJan doL_ Chile ___________________________ dol. per peso __ France _________________________ dol. per franc __ Germany ________________ dol. per reichsmark __ Italy _____________________________ dol. per lira __ Iapan ___________________________ doL per yen __ Netherlands __________________ doL per guilder __ Spain _________________________ doL per peseta __ Sweden _______________________ dol. per krona __ United Kingdom ___________________ dol. per£ __ Uruguay _________________________ dol. per peso __
Gold:
0.298 .165 . 061 .301 .878 .052 .022 . 401 .050 .234 . 531 .100 .2:l8
3. 925 .658
o. 314 .169 .059 .352 . 992 .052 .026 .400 .053 .274 .543 .051 .243
4. 708 .620
Monetary stock, U. S _____________ mil. of doL 17,217 14,162 Movement, foreign:
o. 311 .168 .059 . 349 . 991 .052 .026 .401 .053 . 272 . 544 .050 . 2<ll
4.670 . 615
14, 416
0.311 .169 .059 .349 .992 .0.52 .026 .401 .053 . 272 • 542 . 046 .240
4. 669 .614
14, 5\l9
o. 312 .169 .059
. 350 I .995
.052
.026 • 401 .053 .273 . 536
(1) . 241
4.686 .616
14,778
Net release from earmark, __ .. thous. of doL. 90,873 10
167,991
-7,375 -62, 387 14, 106 -48,553 Exports. ______________________________ do ___ _ 14 16 81 15 lm ports .. _______________________ • _____ do_--- 177,782 240, 542 156, 427 223, 296
Production: Union of South Africa, totaL ___ ftne ounces __ --------- 1,024,057
Witwatersrand (Rand) ______________ do ______________ 944,035 Receipts at mint, domestic (unrefined)..do____ 274,843 333,027
Currency in circulation, totaL ______ mil. of doL. 7, 413 6, 750 Silver:
Exports§ ________________________ thous. of doL. 437 Imports. ________________________________ do____ 4, 183 Price at New York. __________ dol. per fine oz__ . 348 Production, world ___________ thous. of fine oz .. _______ __
Canada _________________ ------------- .do ___________ . _ Mexico _______________________________ .do .. __________ _ United States__ _______________________ do ____ --------.
823 24,987
.428 16, 159 2,023 2, 781 2,879
Stocks, refinery, end of month: United States _________________________ do ____ --------- 4, 492 Canada _______________________________ do ______ ------- 633
CORPORATION PROFITS (Quarterly)
Federal Reserve Bank of New York: Industrial corporations, total (168 cos.)t
mil. of doL _________ ---------Autos, parts, and accessories (28 cos.).do _____________ ---------Chemicals (13 cos.)t __________________ do ____ -------- ---------Food and beverages (19 cos.) _________ do ____ --------· ---------Machinery and machine manufacturing
(17 cos.) ______________________ mil. of doL --------- ---------Metals and mining (13 eos.) __________ do .... _________ ---------Petroleum (13 cos.) ___________________ do ____ --------- ---------Steel (11 cos.) ________________________ do ____ --------- ---------Miscellaneous (55 cos.) _______________ do ____ --------· ---------
Telephones (91 cos.) (net op. income) ____ do _____________ -------- _ Other public utilities (net income) (52 cos.)
mil. of doL _________ ---------Interstate Commerce Commission:
Railways, class I (net income) __________ do _____________ ---------Standard Statistics Co., Inc. (earnings):
Combined index, unadjusted•t----1926=100 __ --------- ---------Industrials (119 cos.) _________________ do _____________ ---------Railroads (class l)•t----------------do ____ --------- ---------Utilities (13 cos.) _____________________ do ____ --------- ---------
Combined index, adjusted•f ___________ do ____ --------- ---------Industrials (119 cos.) __________________ do ____ --------- ---------Railroads (elass I)•t-----------------do ____ --------- ---------Utilities (13 cos.) _____________________ do ____ --------- ---------
PUBUC FINANCE (FEDERAL)
1.028,774 1,033,939 985,843 946,895 953, 91G 910,084 235,337 233,806 195, 780
6,888 6, 712 6, 697
1, 344 1, 671 2,0.54 21,533 10.328 9, 927
.428 .428 .428 19,511 19, 108 21,822 1, 552 1, 575 ], 454 4, 922 4, 281 6, 794 I
4,624 4, 669 5, 26S
2, 409 4,075 4,806 698 676 652
r 179.6 --------- ---------78.4 --------- ---------
' ~g: r 1::::::::: ::::::::: 5. 6,1
_________ ---------
4.1 --------- ---------4.7 --------- ---------
~H !::::::::: ::::::::: I
54.1 --------- ---------
53,7
76.7 69.3 31.9
123.0 76.2 79.0 29.2
113.2
0.312 0.312 0. 312 .168 .168 . 170 .059 .059 (') . 351 .350 . 349 . 996 . 995 . 996 .052 .052 .052 .026 .026 . 026 . 401 . 401 . 401 .053 .053 .053 .273 . 273 . 273 . 531 . 531 . 5:36
(1) (I) . llO . 241 . 241 . 241
4. 685 4. 681 4. 681 , 6!7 I . 616 . 616
15,014 15, 509 15, 878
10,720 -114,842 -251, 57~ 53 231 30
365, 436 606, 027 429, 440
1,073,084 lr.or7,50S 1,084,859 989, 97 4 93R. 961 1,000,181 209, 778 227, 642 219. 161
6, 764 6, 8671 6, 919
1, 923 2, 054 611 7, 207 7, 143 6, 152 . 428 . 428 . 428
20,070 117,469 18,197 1, 637 1, 411 !, 559 4. 906 2. 515 4. 586 I 5, 067 5, 336 3, 701
7, 432 8, 66911 9, 90;) 615 255 1"'7
r 1·1fi. 9 -----~--- ---------69.5 --------- --------
' 24.2 --------- ---------1 15.8 ---------~---------
J i 1:::::::::,:::::::::1 ~: g ::::::::: :::::::::1
iU 1:::::::::c::::::: I
d :::: ::::::J::::::::: 60.4 65.0
d 25.4 124. 7 6~. 4 68.7
d 19.8 113.4
=== ~= I ~~ ~-~
0.3121 .170 .061 . 3491 .998 . 052 . 026 I . 401 . O:i3 . 273 . 532 .110 . 241
4. 682 .616
16,028
-102,596 19
240,450
1,058.989 977,752 201, 111
6, 966
303 11,770
. 420 26.122
1, 766 Ir, 274 5, 493
4, 935 316
r V"iS.1 eu
r 20.4 '20. 3
'.'>.4 2. 7 7. 6 7.4
24.2 60.4
51.3
d 48.2
62.0 69.8
d28. 5 116.2 57.0 62.1
d 26.9 118.1
0.312 .170 .061 . 349 . 998 .052 • 026 . 401 . 053 . 273 . 533 .110 . 241
4. 681 . 616
16, 182
-166,212 9
278,645
l,CS4,334 0ao. soo 281,317
7, 0.11
640 5, .131 . 349
21,871> 2, 099 8, 004 3, 200
6, 348 250
JANt:ARY 1940
o. 311 (') . 170 0.170 .061 .Olll .344 . 299 . 995 . 913 . 052 .052 .026 .023 . 399 .395 . 053 . 051 • 269 • 23,5 . 535 .5:{2 .110 .105 . 240 . 233
4. 611 3. 0}5 . 607 (')
16,390 16,823
152, 125 2,836 13 15
259,934 326,089
1,Cn9,S!G _________
1,015.64:3 1---------202. 130 302, 866
7, 098 7, 249
937 4, 365 . 360
'22, 522 2, 703 6, 971 4, 226
4,180 489
1, 202 4, G:JD . 370
23.313 2,fJ/9 6,536 5,145
5, 461 530
p 140.6 l' 13.0
32. ,'\ p 22.2
7.0 3. 3
11. g 22.1
• 28. (i 60.1
48.6
57.7
• 66.6 p 6~.0
• 34.5 •16. 7
0. 29S .167 .ora • 3Q:J .S93 .052 . 023
(') . 050 . 235 .511 .101 .23S
4. Oll (')
17,002
79,51() 15
69, 741)
--------
42~. Z96 ,, v28
1, 773 7, 2G8 . 357
2, g;:;
4,874
3, .18P 715
Debt, gross, end of mo _____________ mil. of doL. 41,305 38, 607 39, 439 39, 641 39, 864 39,990 40,068 40, 286 40,445 40,666 40, 896 40,858 41,036 Public issues:
Interest bearing• ____________________ do____ 36,512 34,981 35,755 35,892 35,949 Noninterest bearing* _________________ do____ 498 535 528 534 533
Speeial issues to gov't agencies and trust funds* __ ---------------- _______ mil. of doL. 4, 295
Obligations fully guaranteed by the U.S. Government:d'
Amount outstanding by agencies, total. mil. of doL
Federal Farm Mortgage Corporation_ do __ __ Home Owners' Loan Corporation ____ do ___ _ Reconstruction Finance Corporation.do ___ _
5. 707 1, 269 2, 817 1,096
3,090
4, 993 1,388 2,888
511
3,156
4, 992 1, 388 2,888
509
3, 215
4, 987 1, 383 2,888
509
3, 382
5, 410 1, 381 2,888
819
35,994 543 I
3,4541
5,410 1, 381 2, 888
819
36,038 538
3,492
5,410 1, 380 2,888
819
36,089 531
3, 666
5, 409 !, 379 2, 888
820
36,122 554
3, 770
5,450 1, 379 2, 928
820
36,200 548
3, 918
5, 480 I, 379 2, 958
820
36,261 540
4, 094
5, 583 1, 379 2,858
820
36,279 516
4,063
5,456 1, 279 2,831
820
36,417 510
4,109
5,448 1,279 2,82~
820 Expenditures, total, including recovery and
relieft _______________________ .thous. of doL 691,006 678, 588 870,278 693, 385 662,464 879,300 786, 517 744, 8?9 972, 569 807, 325 822, 049 793,302 764,458 General (including recovery and relief)*tdo____ 632,573 622, fJOO 809,351 649, 573 601,971 796, 139 722, 342 686,824 886, 855 639, 232 , 745, 269 728, 837 701,893 ReYolving funds, net• _________________ do____ 5, 066 6, 842 3. 742 4, 685 10,365 5, 599 7, 992 7, 451 8, 474 856 1 16,679 5. 264 8, 785 Transfers to trust accounts• ____________ do____ 53, 000 48, 500 48, 500 38, 500 50, 000 68, 000 55, 000 50, 094 56, 004 167, 103 66, 100 50, !50 53, 000 Debt retirements* __ ------------ _______ do____ 367 745 8. 685 626 127 9, 562 1, 182 530 21, 235 134 0 9, 051 779
Receipts, total t __________________________ do____ 406, 967 381, 644 704, 494 308, 152 417, 349 73Y, 391 268, 343 396, 781 612, 522 307, 846 419, ~so 718. 7\lO 321, 5ll Customs _______________________________ do ____ 29,049 27,338 25,121 24,318 22,361 29,266 29,437 25,3181 24,517 25,528 27,213 35,595 32.418 Internal revenue _______________________ do ____ 339,615 304, 572 662,252 315,845 333,518 691.401 279, U87 315,037
1
568,646 300,091 397,421 624,254 292,241 Income taxes.. _______________________ do____ 33,721 35,912 4i3, 804 50,754 55,872 1 495,906 38,832 43, 533 351,958 4
732
.. 273504
.1
~93~.·. 74-4,77
329.093 35.482 Social security taxes• _________________ do____ 113,177 81,979 2, 939 98.992 125,870 3, 855 69,684 93,044 16, 252 12,308 1 68,578 'Revised. d Deficit. •Preliminary. ,Or increase in earrnarkert gold(-). •Kumber of companies included varies slightly. • Quotations notavailableJannary25-May 14, 1939. 'Quotations not reported AprillO, w;;g, through June8,1939. 'Quotations not available September !-October 16,1939. • Quotation not available September I, and September 3-November 5, 1939. • Previously published figures based on incorrect quotations; quotations not available
through November 28, 1939. 'New series. New items for Federal gross debt beginning June 1916 appear in table 21, p. 16, and for Federal expenditures beginning July 1931 in table 22, p. 17, of the
April1939 Survey. Data on receipts from social security taxes beginning June 1936 wili appear in a subsequent issue. tRevised series. The Standard Statistics Co. index of railroad earnings and the comhined index have been re\"ised beginning 1932; oee table 25, p. 18, of the April 1939
Survey. Total Federal expenditures and receipts revised beginning July 1931; see tables 22 and 23, p. 17, of the April1939 Survey. The Federal Reserve Bank of New York corporation profits, industrial total and chemicals, revised beginning with 1928; data not shmvn above will appear in a subsequent issue.
§Reviser] series. Data revised for 1937: see table 19, p. 14oft he A pril1939 Survey. d'lncluded in the total but not shown separately are guaranteed debentures of certain other Federal agencies. t"General" and "recovery and relief" not reported separately by Treasury Department after June 1939.

JANUARY 1940 SURVEY OF CURRENT BUSINESS 33
Monthly statistics through December 1937, to-~19391 1938 I 1939 gether with explanatory notes and references ----
1 1 1 1 1 1 1 to the sources of the data may be found in the Novem- Novem- Decem- Janu- I Febru- March I April May I June July August Sepbteerm- Obcetro· 1938 Supplement to the Survey ber ber ber ary ary
PUBLIC FINANCE (FEDERAL)-Con. I Receipts, total-Continued. I
Interntll revenue-Continued. : Taxes from: I
Admis>ions to theaters, etc .. thous. of doL.I Capital stock transfers, etc _________ do ...• J
Sales of radio set•. etc ------------ do ___ _ Government corporations and credit agencies:t
Assets, other than interagency, total
2,11R 1, 275
578
mil. of doL.·--------Loans and preferred stock, totaJ.. ____ do ____ --·---·--
Loans to financial institutions llnel. pre-ferred stoek) ________________ mil. of doL. -------- _
Loans to railroads _________________ .do .•.. ---------Horneand bousingmortgageloans __ do .... --------Farm mortgage and other agricultural
I oans. _ --···-----· __________ mll. of doL. ----·----
U ~M. o~~][gatioi:i8 ".iirect"ii.iiiriiiii" gu~~an: -~-- -------teed ___ . _. _. ________________ mil. of doL ---------
Business property. __ --------------·--do .••• ---------Pro(.Jcrty held for sale ________________ do ..•. ------· .. All other '"sets ____ ------------------do ____ -----·---
Liabilities. other than interagency, totaL do .... ----· ___ _ Bonds, notes, and debentures:
Guaranteed by the U. S .•••••••.... do .••. ---------Other ... ·---···--·--------------do •.••
Other liabilities Incl. reserves ...••••.. do .... --------Privately owned Interests .. ------------do --- --------Proprietary Interests of the U.S. Government
mil. of doL ------·-Reconstruction Finance Corporation, loans out-
standing, end of month:t Orand total.. __________________ thous. or doL I, 762.094
Section 5asamended, total.. ________ do .... 689,603 Banks and trust companies, including
receivers ___ . _____________ thous. of doL_.
1
Building and loan associatlons ..... do ..•• In-;urance companies _______________ do ___ _ Mortgage loan companies •..•. _____ do .••• Railroa<ls,lncl. receivers ___________ do .•.. All other under Section 5 __________ do ....
Emergency Relief and Construction Act,
100. 7i3 3. 375 2 .. 57i
134. 432 444.314
4,13:>
total, as arnended ...•. -~_thous. of dol.. 4~,478 Self-liquidating projects (including t1nanc-
lng repairs). ___________ .thous. of dol.. 42,664 Financing of exports of agricultural sur
pluses --------------- __ .. thous. of doL. Financing of agricultural commodities
and livestock ____________ thous. of dol.. Direct loans to business (Incl. (.Jarticipa-
63
751
tions) .... ________________ .. thous. of doL. 130, 02o Total Bank Conservation Act, as amended
thous. of doL. Drainage, levee, irrigation, etc.• .....• do .... Other loans. ___ -------------- ________ do ...•
CAPITAl, FLOTATIONS
New Security Registrations,
(Stcur!tie• and Exchange Commisaion)
New securities effectively registered under the Securities Act of 1933, total. __ .thous o! doL.
Estimated grosg proceeds (total registration, less secunties reserved !or conversion), total ... _ .. _. -----------------thous. of doL
Type of St>curlty: Common stock ____ ----- ______________ do ___ _ Preferred stock. ______________________ do ... . Certificates of participation, etc •....• do ... . Secur~d honds. __ --------------------do ... . Debentures and short-term notes ..... do .•.•
Type of registrant: E xtraeti ve in<l ustrles. ---- ..••.•...... do .•. _ Manufacturing in<lustrles ____________ do .•.. Financial an<l Investment. ___________ do ..•. Transportation and communications. do .... Electric llght and power, gas, and water
thous. of doL. Other---------------------------- .. __ do ...
Securities not presently Intended to be offered for cash sale for account of re<tistrants:
Registered for account of others thous. of doL.
Registered for options and for other subse· quent !ssuance ............. thous of doL.
Other securities not intended for cash sale ____ ...... ______________ thous. of doL.
Selling and distributing expenses: Commissions and discounts ~ thous. of doL. Other selling and distributing expenses
thous. of doL 'Re'l'ised.
541,423 83,750
273,814
114,924
113,994
33. 443 3. :J91
121!45 41l. RJ.1 17,700
0 9. 929
40, 77H 7,823
54, 95."i 511
855
298
688
4,092
654
FINANCE-Continued
1.985 2, 226
568
11, 33-~ 8,1i02
1, 321 503
2, 326
3,486 865
845 452 679 8fi6
7,016
2,020 1, 754
593
11,451 8,M2
1, 344 511
2,335
3, 486 886
855 45~ 689 889
7,048
1, 564 1, 650
576
11, 615 8, 5Tl
1,314 fil2
2, 329
3,469 902
868 460 698 961
7,117
1,503 1, 394
404
11,650 8,1i09
1, 291 6118
2,327
3,460 923
874 465 708
1,095 7, 588
1, 007 1,0R3
353
11,696 8,523
1, 278 505
2, 324
3,456 960
885 468 712
1,108 7,592
1,3R5 1, 259
287
11,688 8,497
1, 292 509
2, 323
3, 459 913
849 472 712
1, !57 7,592
1,606 1, 273
279
11,703 8, 511
1. 297 WI
2, 325
3, 447 941
850 476 713
1, 151 7, 581
1, 491 735 258
11.706 8, 465
1, 311 493
2, 331
3,438 892
853 481 708
1, 199 7, 6.11
1,534 813 292
11,823 8,861
1, 299 493
2,332
a,n1 I, 007
871 483 709 900
7, 507
1, 513 1, 124
402
12,017 8, 900
~J~?I 3, 765 1, 033
876 531 704
1, 008 7,886
1,852 1, 210
590
11,967 8, 923
1,272 492
2,347
3, 744 1,068
879 535 69.5 934
7, illS
1, 728 2,1106
467
12,105 8,956
1, 273 489
2,363
3, 738 1,093
879 642 689
1,039 7,845
4,994 4,992 4,987 5,410 5,410 5,410 5,410 5,471 5,291 5,489 5,356 5,449 1,323 1,317 1,327 1,369 1,374 1,379 1,382 1,389 1,349 1,34.5 1,357 1,357
100 n9 757 809 8os so3 1oo 101 867 1, os2l 1, os4 1, 039 382 381 383 384 386 387 389 387 390 391 393 395
L~ ~m ~m Lm Lm L~ Lm L• L~ Lm LD L~
1.749,~80 •1,808, 288 •1,770,33.) •1,71!4.88~ •1.769,810 •1,718.801 •1,723,167,•1,747.482 •1,766,222 •1,768,904 I, 783.404 1,787,434 689,533 70~. 484 6116,999 ' 664, 117 '673, 38f• '682, 521 '67i\, 434 '677, 933 '677, 46'l '677. 408 677, 916 679,064
124. 427 2,029 3,008
126. 4i6! 428.041
5, 611
205,848
190, 105
15,047
696
103,287
'547, 255 80,834
123, 124
I I
303,280
249,989
51,526 21,441 10.354 4fi, 8fi5
119,804
4, 548 31,9~1 42,528
4, 239
103,219 63,475
I i I
7,3341
23,9311
6.::;1
I, 180
120. 778 I, 908 2. 992
140,644 436,094
6,067
201,604
1!8, 067 116. 120 • 112. 92G • 110. A-57 • 108, 2'20 I, 959 1, 921 ' 1. 95S • 2. 94'2 '3. 027 2 9r,41 2. Ql!l '2, 8S7 '2. Sii9 • 2 S36
100.280 '101,2?5 '110,:lfl2 '117.0~' '120 745 437. 789 436. 139 439,560 443.840 436, 612
5, 940 5, 797 '5, 6b0 ' 5, 131 r 41 H94
207,948 205,598 '197, 466 ' 131, 34~ ' 134,495
' 104. 3~7 '3. 32i '2. 817
' 124, 550 4:l9, 1\19 •3,6.58
' 103, 40.1 ' 102. 12i , 3, 2n2 ' 3. 41l.> , 2, 787 , 2. 662
' 125, 573 ' 126, ~42 438, 8t;~ ' 438. 831l •3,573 •3,541
'63, 682 '62, 152 '61, 577
180.8621182, 149
20, 047 25, 047
181,814 • 173, 682 • 107, 538 • lOS, 995
1
. '39, 441 • 40, 108
•oo •oo ~oo ~m •• ~~ 40,835
19,989
752
107,:::1109,:::
' 584, 890 ' 578, 793 80. 9911 82. 275
124, 907 12.1, 280
I
I i
I 144, 625i 142, 735
•140, 7091 142. 137
23.124 18 .. 166 12,968 57.413 16, 061
8, 281 11,096 36,639
0
82.280 2, 414
10,215
~I 4,3871
681
8, 737 38. 762 22.826
900 70,913
523 10. 2r.2 22, 300
0
108,512 450
3,388
I, 610
0
4, 213
917
738 737 764 764
110,432 • 111.313 '112, 1621 • 114, HI
• 574, 791 , 572, 97:; , 576, 91\9 , .177, 723 82. 451 '82. 512 '82. 9>0 '83. 01'<
127,489 '132, 0081 ' 132, 511' ' 137. 326
I I
i
I
.. ~·~ .. ,~I ""·"'I m . ..,i 21,366 69,242 277, 6571 55, 588
9. 645 2, 707 3, 875 5,139
0
0 6, 821 6, f.60 1,827
5,090 969
971
420
3,615
1,190
215
12, 393 I, 741 4,008
28. 488 22,613
280 35,763
4, 758 0
Tl, 506 935
4,862
170
1,930
2, 767
627
47,438 27,900
1. 766 116.991 83,562
342! 14~. 4501
6, 271 5,305
117,7121 1,5771
I i
11, 525i !
2,0861'
28,379
4, 6791
1, 4431
20,473 22,260 3, 406 9.449 . 0
234 3, 779
17, 024 250
31.60.5 2,696
3. 777
219
20,365
2, 128
235
'760
' 116, 639 ' 121, 364 ' 122, 859
'577. 49~ '570. 6.)1 '566. 919 ' 83. 042 '83, 333 '83. 433
' 228, 688 ' 25i, 256 ' 255, 708
l !
275,410 232,712 298,571
271, 720 227, 545 293, 650
29,307 12. 675 10.586
144. 872 74,279
12,290 93.097 21,941
3, 921
124, 971 15,500
13, 549
3,192
2,068
6, 678
1, 621
16, 385 48.3115 10, 7.19 39, 675
ll2, 421
702 88,942 ~4. lll2 28, 834
82,914 1, 992
l, 999
286
37, 1781
5, 006, I
942!
18, 749 11,628
0 163, 101 100, 172
2, 747 33. 4401 3, 8941 4, 548
217,1491 31,870
11,870
1591 I
4,13411 6, 031
1, 253·
101. 186 102. 126 3, 487 3. 433 2. 652 2, 615
127. 647 i30. 167 438. R3.5 436. r.w
4, 109i 4, 073
62, 209· 62, 801
41, 586 42, 679
19, 871 19,371
752 751
125, 7531126,862
566. 534 564, 556 83. 5021 83. 482
267, 491 270, 669
l
35, 181 30, 636
26, 888 28, 461
12,172 I, 936
800 10.380 1,600
1,58211 3. 485
19,444 380
0 1,997
I, 448
62:11
2. 053 I
1281
11.317 2,200 1,000
13,444 500
1,523 8,818 2. 927 1, 750
11,194 2, 250
3,578
11,194
181
1,247
202
• The total Includes $12,576,000 of face amount installment certificates. , Series differ !rom current presentation of the Securities and Ex.-hange Commission, due to a reclassification of certain items, but data as shown here are comparable
throul!hout \Vheo Parlier ctata are available on the new br1~is. t,hey will hf' presentect in the Survey. *New series. Data for drainage, levee, irrigation, and similar districts beginnig December 1933 will appear in a subsequent issue of the Survey; this series was formerly
included with "Other loans." tRevi~ed series. Details for assets of Government corporations anri credit 11genries ha\""e been revised beginning June 1937 due to changes in the uncierlying U.S. Treasury
DeparTment compilatiuns and are not comparahle with the Reries shown in the 1938 Supplement. Se,·eral new series on loans and other assets have been brought out. No changes have been made in the series on liabilities. Data not shown on p. 33 of the November 1938 Sun-ey will appear in a subsequent issue. For Reconstruction Finance Corporation loans out,standing, minor revisions beginning August 1934 will appear in a subsequent issue.
~oo:H~l-10-5
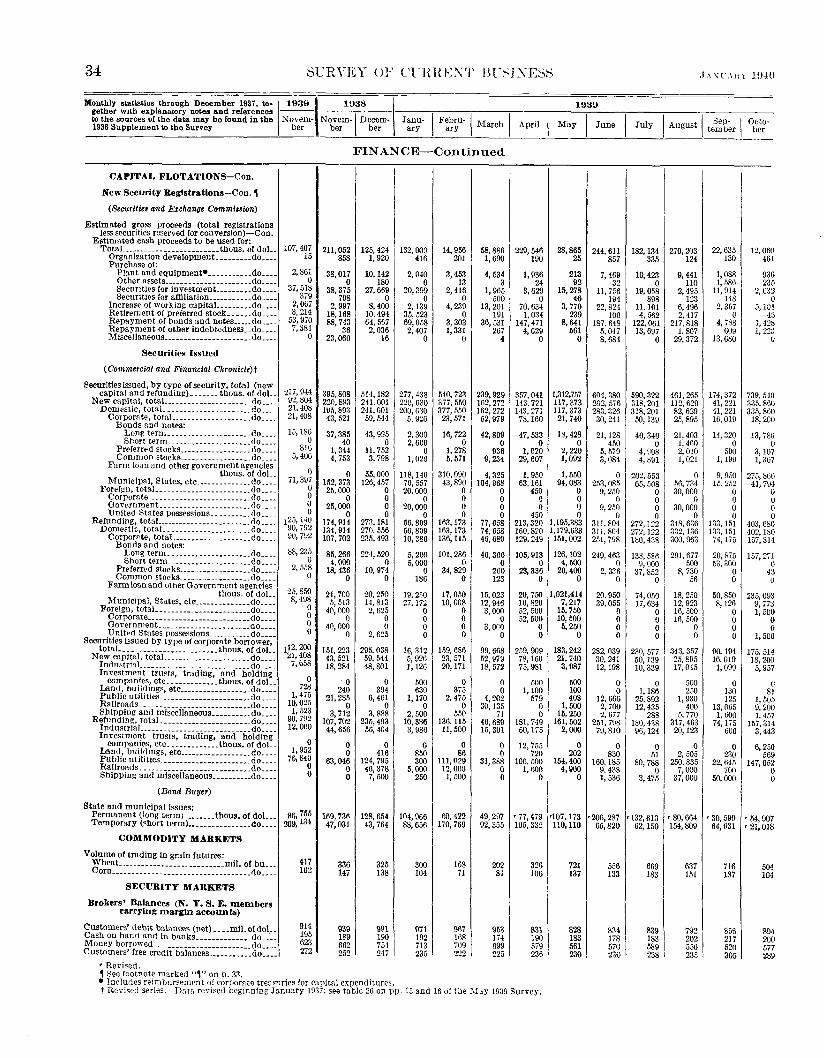
34 Sl'RVEY OF CTHHE.:\T Bl~~J XESS .hSL\HY UHO
1939 Monthly statistics through December 1937, to-~19391 1938 I gether With explanar.ory notes and references --- -------to the sources of the data may be found in the Novem- Novem-~ Decem- Janu- I Febru-~ March I 19SS Supplement to the Survey ber ber ber ary ary April I May I June I July I August I te~~~r I 0b';t
FINANCE-Continued
CAPITAL FLOTATIONS-Con. I
New Security Registrations-Con. ,
(Securlliu and Exchange Commi~tion)
Estimated gross proceeds (total registrations less securities reserved lor conversion)-Con.
Estimated cash proceeds to be used for: 107,407 TotaL .. ----------~-----------thous. of doL 21I,052 125,424 132,009 14,956 58,886 229,546
Organization development_ __ ~--~--do ____ 15 858 1, 920 416 201 1,690 190 Purchase of:
Plant and equ!pment• ___________ do~--- 2,861 38,017 10, 142 2,040 3,453 4, 534 l, 936 Other assets ______________________ do ____ 0 0 180 0 13 3 24 Securities lor investment _________ do ____ 37,518 38,375 27,669 20,399 2,416 1, 965 3,629 Securities for affiliation __________ .. do ____ 379 798 0 0 0 500 0 Increase of working capitaJ.. ________ do ____ 2,067 2, 997 8, 400 2,139 4,239 13,201 70,634 Retirement of preferred stock ....... do ____ 3, 214 18, 168 10,494 35, 523 0 191 1. 034 Repayment of bonds and notes ......... do ____ 53,970 88,743 64,567 69,058 3.303 36,531 147,471 Repayment of other indebtedness .... do ____ 7, 384 36 2,036 2, 407 1, 331 267 4,629 Miscellaneous ______________________ do ____ 0 23,060 16 0 0 4 0
Securities Issued
(Commercial and Financial Chronicle)t
Securities issue<l, by type of security, total (new 217,944 capital and refunding) _______ thous. of doL .. 395,808 514, 182 277,438 540,723 239,929 357,041
New capital, totaL.--~----------------do ____ 92,804 220,893 241.001 220,630 377, 550 162,272 143.721 Domestic, totaL _____________________ do ____ 21,408 195,893 241,G01 200, 630 377, fi50 162,272 143, 271 Corporate, totaL-------------- ____ do ____ 21,408 43, 521 59,544 5, 926 23,571 52,979 78. 160
Bonds and notes: Long term_-------- ____________ do ____ 15, 186 37,385 43,995 2,300 16,722 42,809 47,533 Short term _____________________ do ____ 0 40 0 2,600 0 0 0 Preferred "tocks __________________ do ____ 816 1, 344 11,752 0 1, 278 936 1, 020 Common stocks __________ -------_ do ____ 5,40() 4, 7.13 3, 798 1, 026 5, 571 9,234 29,607
Farm loan and other government agencies 0 thous. of doL 0 55,000 118, 146 310,090 4,325 1, 950 Municipal, States, etc ______________ do ____ 71, 397 152, 373 126, 457 76,557 43,890 104,968 63, 161 Forei11n, totaL _______________________ do ____ 0 25,000 0 20,000 0 0 450
Corporate ___ ---------------- ______ do ____ 0 0 0 0 0 0 0 Government. ______________________ do ____ 0 25,000 0 20,000 0 0 0 United States possesslons __________ do ____ 0 0 0 0 0 0 450 Refunding, totaL ______________________ do ____ 125, 140 174, Pl4 273,181 56,809 163,173 77,658 213,320 Domestic, totaL_------------------ ~ .. do ____ uo,7n 134,914 270, 556 56,809 163,173 74, 658 160,820 Corporate, totaL __________ ··-- ______ do ____ 90, 792 107,702 235, 493 10,386 136, 115 46,689 129,249
Bonds and notes: 88,235 Long term _____________________ do ____ 85,266 224,520 5, 200 101,286 46,366 105,913 Short term _____________________ do ____ 0 4,000 0 5,000 0 0 0 Preferrt•d stocks _________ ------- __ do ____ 2, 558 18, 436 10,974 0 34,829 200 23,336 Common stocks ______ , ____________ do ____ 0 0 0 186 0 123 0
Farm loan and other Government agencies 25,850 thous. of doL 21,700 20,250 19,2.50 17,050 15,023 20,750 Municipal, States, etc ______________ do ____ 8,498 5, 513 14,813 27, 172 10,008 12,946 10, R20
Foreign, totaL ____ ---------- _________ do ____ 0 40,000 2, 625 0 0 3,000 52,500 Corporate __________________ ------ __ do ____ 0 0 0 0 0 0 52,500 Government _______________________ do ____ 0 40,000 0 0 0 3, oco 0 United States possesslons ___________ do ____ 0 0 2,625 0 0 0 0 Securities issued by type of corporate borrower,
112,200 total. ___ ·-------------------thous. of doL_ 151,223 295.038 W,312 159, 686 99,668 259,909 New capithl, totaL _____________________ do ____ 21,408 43,521 59, 544 5, 926 23,571 52, 979 78,160 InduotriaL ___________________________ do .. ___ 7,658 18,284 48,801 1, 126 20,171 18, 572 75,981 Investment trusts, trading, and holding
0 companies, etc __ ----------- thous. of doL_ 0 0 500 0 0 500 Land, builrlings, etc __________________ do ____ 728 240 394 630 375 0 1, 100 Public utilities ________ ----- ____ ---- __ do ____ 1, 475 21,285 6,461 1,170 2, 475 4,202 579 Railroads ___________________________ _cto ____ 10,025 0 0 0 0 30,135 0 Shipping and miscellaneous __________ do ____ l, 523 3, 712 3, 888 2, 500 550 71 0 Refunding, totaL----- _________________ do ____ 90.792 107,702 235,493 10,386 136, 115 46,689 181, 749 Industrial ___________________________ . do ____ 12,000 44,656 56,404 3, 986 11,500 15,301 60, 175 Investment trusts, trading, and holding
0 companies, etc _____________ thous. of doL .. 0 0 0 0 0 12,755 Land, buildmgs, etc __________________ do ____ 1, 952 0 416 850 So 0 720 Public utilities_------------------- ___ do ••. _ 76,840 63,046 124,795 300 111,029 31,388 106, 500 Railroads_--------- __________________ do ____ 0 0 46,378 5,000 12,000 0 1.600 Shipping and miscellaneous __________ do ....... 0 0 7, 500 250 I, 500 0 0
(Bond Buyer)
State and municipal issues: ~e.m Permanent (long term; ________ tbous. of doL __ 169,736 128,654 104,966 60,422 49,297 • 77,479
Tempor~ry (short term) ________________ do ____ 209, 47,031 43,764 88,656 170, 769 92,355 105, 332
COMMODITY MARKETS
Volume of trading in grain futures: 417 Wheat__ _________________________ mil. of bu ___
336 325 300 168 202 326 Corn __________________________________ _cto ____ 102 147 138 104 71 81 106
SECURITY MARKETS
Brokers' Balances (N. Y. S. E. members carrying margin accounts)
Customers' debit balances (net) ____ miJ.ofdoL .. 914 939 991 971 967 953 831 Cash on hand anrl in banks ______________ do .... ·-- 195 189 190 192 168 17·1 190 Money borrowed_ ·---------------------do ____ 623 662 754 713 709 699 579 Customers' free credit balances ___________ do ____ 272 252 247 235 222 225 236
'Re-vised. , See footnote marked "1" on n. 33. • Includes reimbursement of corporate treasuries for capital expenditures. t Revised series. Data revised beginning January 1937; see table 26 on pp. 15 and 16 of tlle :\lay 193~ Survey.
I
28,865 244,611 182, 134 25 857 335
213 7,469 10,423 92 32 0
15,278 11,756 19,058 46 194 898
3, 770 22,824 11. 101 239 100 4, 562
8,641 187. 648 122, 061 561 5,047 13,697
0 8, 684 0
1,312,757 604,380 590,322 117,373 292, 576 318,201 117,373 283.326 318,201
21,740 30,241 50,139
18,428 21,128 40,340 0 450 0
2,220 5, 579 4, G08 1, 092 3,084 4, 891
1, 550 0 202.553 94,083 253,085 65,508
0 9, 250 81 0 0 0 9, 250 0 0 0 0
1,195,383 311, 804 272,122 1,179,633 311, 804 27Z, 122
151,002 251,798 lEO, 438
126, 102 249, 463 133, 51'6 4, 500 0 9,000
20,400 2, 336 37,852 0 0 0
1,021,414 20.950 74, 050 7,217 39,055 17, 634
15,750 0 0 10,500 0 0
5, 250 0 0 0 0 0
183,242 282, 039 230, 577 21,740 30,241 50, 139
3,987 12, 198 10,339
500 0 0 100 0 1,186 403 12,666 25,892
1,500 2, 700 12, 435 15,250 2, 677 288
161,502 251,798 180, 4'l8 2,000 79,810 96,124
0 0 0 202 830 51
154,400 160, 185 80,788 4,900 9,438 0
0 1, 536 3,475
•107,173 •206, 287 0\32,613 110,110 65,820 62, 150
721 556 669 137 133 183
828 834 839 183 178 183 561 570 589 230 230 238 I
270,203 22,635 124 130
9,441 1,088 110 1,586
2,495 11,914 123 148
6,496 2, 357 2,417 0
217,818 4, 788 1, 807 609
29,372 13,680
461,265 174,372 112,629 41, 221 82,629 41,221 25,895 16,019
21,403 14,320 1, 460 0 2,010 500 1, 021 1, 199
0 9, 950 56,734 15,252 30,000 0
0 0 30,000 0
0 0 348,636 133,151 332,136 133, 151 300,963 74, 175
291,677 20,875 590 53,300
8, 730 0 56 0
18, 2.50 50,850 12,923 8,126 16,500 0 16, 500 0
0 0 0 0
343, 357 90,194 25,895 16.019 17,045 1,099
500 0 250 130
1, 930 125 400 13, 065
5, 770 1,600 317,463 74,175 20, 123 600
0 0 2, 505 230
250,835 22,645 7,000 700
37,000 50,000
• 80,664 • 30,590 154, 809 64,931
637 716 151 187
792 856 202 217 556 520 235 305
I I
12,0~ 0 l 46
93 6 23
2, 63
5,10 0 1 3 ~
4 1, ·12 1 'J•)
739,54 335,86
0 0 0 0
33.1, 86 18,20
13,78 6 0 7 7
3,10 1, 30
275,86 ti ,j 41,79
403,68
0 u 0 0 0 0 4
402,18 157,31
157,27 1 u :J u
4
235, 0. O:J 3 0 0 0 0
9, 77 1, 50
1, 50
175.51 4 00 57
18,2 5, 9
1, 5 9, 2 1, 4
0 81 05 00 57 14 43
157,3 3,4
6,2 50 69 52 0
5 147,0
0
• 54,9 07 8 '21,01
5 04 04 1
8 94 00 77 89
2 5 2

JANUARY 1940 SURVEY OF CURRENT BUSINESS 35
Monthly statistics through December 1937. to-~19391 1938 I gether with explanatory notes and references --- ---.---to the sources of the data may be found in the Novem- Novem-1 Decem- Janu- I Febru·l M h I 1938 Supplement to the Survey ber ber ber ary ary arc
FINANCE-Continued
SECURITY MARKETS-Continued
Bonds Prices:
Average price of all listed bonds (N. Y. S. E.) dollars .. 91.24 00.34 91.27 91.03 91.85 91.80
Domestic ..•. ----------------------- .do ..•• 95.05 93.33 94.35 94.25 95.01 94.99 Foreign .. ____ --------- ....•.. ---- __ .. do •••• 51.23 61.02 60.11 58.55 59.68 58.43
Standard Statistics Co., Inc. (60 bonds) dol. per $100 bond .. 83.0 82.1 81.1 81.9 82.1 83.1
Industrial (20 bonds) ................. do ..•. 87.0 86.9 86.0 86.2 86.4 87.1 Public utilities (20 bonds) ............ do ...• 101.8 99.3 98.7 99.7 100.7 101.3 Rails (20 bonds) ...................... do .••. 60.2 60.2 58.6 59.7 59.0 60.9 Domestic municipals (15 bonds) ...... do .... 117.5 116.6 116.5 117.3 117.3 117.9
U.S. Treasury bondst .................. do .... 104.6 104.0 104.1 104.4 104.8 106.0 Sales (Secnrities and Exchange Commission):
Total on all registered exchanges: Market value .............. thous. of dol.. 135,.515 139,760 146,188 157,278 126,687 179,440 Face value. ________________________ do .... 193,891 207,719 259,364 224,622 166,855 245,123
On New York Stock Exchange: Market value .. ----------- ... __ . __ .do .... 105,994 107,389 116,550 119,160 86,903 137,021 Face value. ------------------------do .... 159,374 169,415 221,469 178,731 121,222 195,394
Sales on N.Y. S. E., exclusive of stopped sales (N.Y. S. E.) par value:
Total. ___ ---------- .... thous. of dol.. 151,685 155,868 217,609 159,611 118,993 185,513 U.S. Oovernment ........... do .... 5,628 4,419 6,535 7,581 4,871 11,889 Other than U.S. Government:
Total. _____________________ do .... !46, 057 151,449 211,074 152,030 114, 122 173,624 Domestic .••.... _ ......•. do ..•. 12:!,230 130,133 185,528 131,490 96,722 139,909 Forei!':n ...• __ .... _ ....•.. do .•.. 22, &27 21,316 2.5, 546 20,540 17,400 33,715
Value, Issues listed on N.Y. S. E.: Face value, all issues .••.......... m!l. of dol.. -~2. 435 50,301 lil, 554 51,587 51,466 52,670
Domestic issues ___________ --------- __ do ____ -17. 8()9 45,640 46,920 46,933 46,862 48,071 Foreign isc:.ues ________________________ do ____ 4, 5fin 4, 661 4,6:34 4,654 4,604 4, 599
Market value, all issues ...•......•..... do .... 47,839 45,442 47,053 46,958 47.271 48,352 Domestic issues ..............•..• ___ .do ..• _ 45,.100 42,597 44,268 44,233 44; 524 45,665 Foreign Issues ............ ------ ...... do .... 2, 339 2,844 2, 785 2, 725 2, 748 2,687
Yields: Bond Buyer:
Domestic municipals (20 bonds) ... percent .. 2. 72 2.83 2. 78 2. 76 2.80 2. 72 Moody's:
Domestic (120 bonds). ---------------do .... 3. 70 3.95 3.95 3.86 3. 81 3. 74 By ratings:
3. 00 Aaa (30 bonds) .........••.•...... do ..•. 3.10 3.08 3.01 3.00 2.99 Aa (30 bonds) ................•... do .... 3.16 3.46 3.42 3. 32 3. 26 3. 22 A (30 bonds) .................•... do .... 3. 78 4.02 4.02 3.97 3. 94 3.87 Baa (30 honds) ................... do .•.. <1. 85 5. 23 5.27 5.12 5.05 4.89
By groups: Industrials (40 bonds) ............ do .•.. 3. 2.1 3.39 3.40 3. 31 3.29 3.29 Puhlic u1ilities (40 bonds) .•...... do .... 3. 41 3.65 3.63 3.57 3. 52 3.48 Rails (40 bonds) ........••........ do .... 4. 44 4.83 4.82 4. 70 4.63 4.46
Standard Statistics Co., Inc.: Domestic municipals (15 bonds) ...... do ..•. 2. 69 2. 74 2. 75 2. 70 2. 70 2. 67
U. S. Treasury bondst -----------------do .... 2. 46 2.50 2.49 2.47 2.44 2. 34
Stocks
Cash dividend payments and rates (Moody's): Annual payments at current rates (600 com-
panles) -------------------·----mil. of doL 1,573.0.1 I, 328.16 1,315.04 1, 316.25 1,329.91 1, 334.15 Nurnher of shares, adjusted ......... milllons .. 935.03 929.10 935.03 935.03 935.03 935.03 Dividend rate per share (weighted average)
(600 cos.) __ -----------··-----··----dollars __ 1.68 1. 43 1. 41 1. 41 1. 42 1. 43 Banks (21)_ ------·--·---·------------do .... 3.01 3.00 3. 01 3.01 3.01 3.01 Industrials (492 cos.) ................. do .... 1. 61 1. 29 1. 28 1. 28 1. 30 I. 30 Insuranc~ (21 cos.). __________________ do ••.. 2. 39 2.24 2. 31 2. 31 2. 31 2.31 Public utilities (30 cos.) .............. do ____ 1. 9.) 1. 94 1. 92 1. 91 1.91 1. 92 Rails (31\ cos.) .. _____ ------- .......... do .•.. 1. 25 1.05 .85 .90 .90 .90
Dividend declarations (N.Y. Times): TotaL_----··------- ............ thous. of doL 659,512 509, 160 247,569 194,118 303,839 186,095
Industrl•ls and mlsc •...........•.... do .... 608,149 486,396 229,916 181,480 289,412 182.522 Railroads .... __ .. ---------- .......... do .•. _ 51,362 22,765 17,653 12,638 14,427 3,573
Prices: Average price of all listed stocks (N.Y. S. E.)
Dec. 31, 1924= 100. 63.2 64.1 66.2 62.6 64.4 57.0 Dow-Jones & Co., Inc.: (65 stocks)
dol. per share .. 51.01 50.32 49.32 49.13 48.68 48.99 Industrials (30 stocks). ............... do .... 149.98 151.96 150.12 146. 87 !44. 60 145.06 Puhlic utilities (15 stocks) ............ do .••. 2-'· 68 23.35 21.94 23.30 24.94 24.84 Rails (20 stocks). _____ ---------------do .••. 33.38 31.29 30.52 31.20 30.31 31.07
New York Times (50stocks) ............ do ..•. 108. 5\J 105.29 105. 36 102.73 102.22 100.59 Industrials (25 stoeks) ................ do .... 192. 28 186.99 186.99 181.82 181. 21 178.01 Railroads (2.'> stocks). ----------------do .•.. 24.90 23.59 23.74 23.64 23.24 23. 18
Standard Statistics Co., Inc.: Comhln~<i Index (420 stocks) .... 1926=100 •. 94. 2 94.7 92.0 91.8 90.1 91.7
Industrials (350 stocks) __ .......... do .... 110.9 113. 6 110.6 109.3 106.3 108.0 Capital goods (107 stocks)*_ ...... do ..•. 137.2 142. 6 139.4 136.4 130.9 133.3 Consumer's goods (194 stocks)* ... do .... 102.0 102. 1 98.5 97.8 96.5 98.7
Puhlie utilities (40 stocks) __________ do ..•. 87.3 80.9 77.9 81.2 83.8 85.8 Rails (30 stocks) ................... do .•.. 31.6 30.0 28.8 29.8 28.0 29.7
Other issu~s: Banks. N.Y. C. (19 stocks) ........ do .... 58.7 49.6 47.7 50.0 51.1 53.5 Fire and marine Insurance (18 stocks) do ____ 91.9 87.4 85.3
86.1 I 85.7 87.0 Sales (Securities and Exchange Commission):
Total on all registered exchanges: M!ll'ket valne .................. mil. of doL 844 1,306 1, 225 1, 129 655 1,058 Shares sold ..................... thousands •. 35, 252 53,496 52,913 47,393 26,057 40,384
1939
April I May I June I July I August I te~~~r joctoher
91.56 92.92 92.08 93.15 94.83 96.09 95.34 96.46 57.40 59.73 57.79 58.46
79.4 80.2 81.4 81.6 83.8 84.8 86.2 86.3 99.7 101.0 101.6 102.1 54.5 54.8 56.2 56.4
116.4 118.1 118.6 118.3 106.6 108.3 109.1 108.9
119,057 125,737 127,703 121,420 165,925 167.691 169, 641 162,425
92,210 93,060 91,785 87,837 133,554 130,243 129,260 123,949
122,804 123, 104 126, 570 119,431 7,459 7,390 6,821 5,137
115,345 115.714 119,749 114,294 93,396 98,423 102. 189 100,622 21.949 17,291 17, 560 13,672
52,564 52,647 52.751 52,610 47,975 48, OM 48, 166 48,032 4,589 4, 591 4,585 4,S78
48,128 48,921 48, 571 49.007 45, 493 46, 179 45,921 46,331 2,634 2, 742 2, 649 2,676
2. 78 2.66 2.66 2. 67
3.84 3. 78 3. 71 3.66
3.02 2. 97 2. 92 2.89 3.22 3.16 3.13 3.07 3. 97 3. 92 3. 8ft 3.83 5.15 5.07 4. 91 4.84
3.35 3.30 3. 23 3.17 3. 51 3. 45 3. 42 3.39 4.66 4.60 4.47 4.42
2. 75 2.66 2. 63 2.65 2.30 2.17 2.13 2.16
1, 337.76 1, 339.27 1, 382. 43 1,391.46 935.03 935.03 @35. 03 935.03
I. 43 1. 43 1. 48 1.49 3. 01 3.01 3.01 3. 01 1. 31 1. 31 1. 37 1. 38 2. 33 2.33 2. 39 2. 39 I. 92 1.92 I. 94 1.94 .90 .90 .90 .87
154,076 377,394 220,175 181,033 147,635 358,417 200.698 167,167
6, 440 18,976 19,477 13,866
56.6 60.2 57.0 62.2
42.68 44.43 45.66 46.82 127. 73 132. 56 136. 52 139. 26 22.0.'> 23.05 23.66 24.96 25.75 27.02 27.59 28.29 90.46 94.19 96.95 99.74
161. 51 167.73 173. 12 178.03 19.41 20.67 20.79 21.45
81.9 83.1 86.0 86. 1 95.9 97.0 100.5 100.6
115.4 115.5 120.0 120.9 88.7 91.5 95.4 96.2 80.0 82.4 84.7 84.9 24.8 25.0 25.9 25.7
50.4 53.7 55.2 5.5.0
81.0 84.3 89.3 89.8
882 603 556 774 42,614 2a, 131 I 21,916 30,892
I 90.!;9 88.50 94.05 92.41 54.50 47.29
81.0 80.9 85.8 85.0
101.7 98.6 55.5 S9.0
116.5 107.1 108.2 101.9
122,908 417,429 159, 770 498, 100
89,189 384, 237 121, 165 409,821
111, 394 480,789 8, 730 227, 101
102,664 253,688 85,001 227,997 17,663 25,691
52,209 52,466 47, 642 47,917 4. 567 4, 549
47,297 46. 4~1 44,808 44,279
2, 489 2, 151
3. 21 3.30
3.67 3. 95
2. 93 3. 25 3. 11 3. 49 3.80 4.05 4.85 5. 00
3.21 4. fi8 3. 40 3. 70 4.41 3. 57
2. 75 3. 29 2.21 2. 65
1, 422.99 1,423 82 935.03 935.03
1. 52 1. 52 3. 01 3.01 1. 42 1. 42 2. 39 2.39 1.94 I. 95 .90 . 90
310,284 193,698 296, 168 191,364 14,116 2, 334
57.9 65.9
46.47 50.47 137.88 150.72 25.68 24.36 27. G7 31.97 99.44 110.38
17R 21 19S. 86 20.68 24.91
86.3 92.4 100.5 109.4 121. 5 138.1 96.9 98.3 87.0 84.3 25.4 29.7
54.0 58.7
88.2 87.6
7ti9 2, 205 31, 762 93, 435
90.79 94.59 50.55
82.9 86.4
100.5 61.6
110.7 102.6
162,275 229,653
131,901 194,212
170.089 14, 203
155,886 134,81 21,07
6 0
52,45 47,92
4, 53 47,62 45,33 2, 29
2 2 1 1 1 0
2.9
3. 8
3
3
3.1 3.3-0
4 8
3. 9 4.8
3.43 3. 5 4. 5
7 1
3.0, 8 0 2.6
1,442. 4 935.0
1.5
5 3
4 3.01 1. 45 2. 39 1. 95 .90
199,969 192,915
7, 053
f5.8
51.80 152.15 25.64 34.27
1!0. 33 194.82 25.84
95.3 112.7 141.9 101.6 86.0 32.9
59.9
90.7
1,184 43,293
*New series. For data beginning 1926 see table 24, p. 18. of the April1939 Survey. tRevlsed series. Revised dats for U.S. Treasury bond prices beginning 1931, and U. S. Tressury bond yields beginning 1919, appear In tables 17 and 1~. p. 18, of the
March 1939 Survey.

36 SURVEY OF CURRENT BUSINESS JANUARY 1940
Monthly statistics through December 1U37, to-~ HI;JH I l9;JS I 1939 get her with explanatory notes and rf"ferences ---
1 1 1 1 1 to the sources of the data may be found in the Novem- '<ovem- Decem- Janu- Fehru- 'larch A ·1 M I J I J 1 I A I Sep- I Octo-1938 Supplement to the Survey ber her her arr ary " pn ay une u Y ugust tember ber
FIN AN CE-Continued
SECURITY MARKETS-Continued
Stocks-Continued
Sales (8. E. C.)-Continued Total. on all re"istered exchanges-Con.
On New York Stock Exchange: Market Vd!Ue. _______________ mil. or doL. 723 Shar~s sol<L __________________ thousands 27,445
Ex.·lusive of odd lot and stoppe<l g,;Jes (N Y. Times) ___________ thousands.. 19,220
Shares listed, N. Y S. E.: MarkPt value, all listed shares ____ m!l. of doL. 45,50.1 Number of shares listed ____________ millions__ 1,432
Yields: Moody's, common stocks (200) ______ percent__ 4. 5
Banks (15 stocks) ____________________ do____ 4.2 Industrials (125 stocks) _______________ do____ 4. 4 ln•urance (10 stock•) __ . ______________ do____ 3. 9 Public utili tie• (25 stocks) ____________ do____ 5. 3 n~n· (2o stocks) ____________________ do____ 4.6
Btandar•i Statistics Co.1 Inc., preferred stocks: Industrial•. hlgh-graae (20 stocks) ___ percent. 4. 98
Stockholders (Common Stock)
American Tel. & Tel. Co., totaJ. _____ number .. ---------Foreign __ . ___ .. ___ ..... ______ ---------- tlo ___ _
Pennsylvania Railroad Co., totaJ. _______ do ___ _ For.i!!'n. ______ . ________________________ do ___ _
U.S. St•el Corporation, totaJ. ___________ do ___ _ Foreil!:n. _ .. _ .... _ .. _-----------------_.do ____ ---------Shares held by hrokers ______ percent of totaL ---------
1,157 41,923
27.923
46,031 1,427
3.8 50 3. 3 3. 9 5.9 3. 6
4.92
1, 065 39,954
27,490
47.491 1,424
3. 6 4. 8 3.1 4.1 5. 7 2.9
I 4.94
646.671 7. 173
214. 532 2. 874
168. 399 3, 0~4 24.89
I I
37. ~~~ I 25,!86
44,884 1,425
3.8 4. 8 3. 4 4 1 5.6 3.li
4. 94
56! 1 19, 538
13,877
46.271 1, 426
3. 7 4. 6 3. 3 4 0 53 3.2
4.94
---------~---------
---------1------------------)---------
916 779 523 31, 150 33,775 17,897
24, 565 20, 247 12, 933
40. 921 40, 673 43, 230 1, 427 1, 427 l, 427
4. 2 4. 2 4.0 4. 8 4. 8 4. 4 3. 8 3 9 3. 7 4. 3 4. 4 4. I 5. 8 5. 7 5. 4 3. 9 4. 0 3. 7
4. 92 4. 99 4. 94
645,033 --------- ---------7. J.o3 --------- ---------
213. 143 --------- ---------2.853 --------- ---------
167. 650 --------- ---------
24. 78 ---------2, 9981 ________ _
FOREIGN TRADE
INDEXES Exports:
Total value, unarljusted ________ l923-25=100.. 77 Total value, adjusted __________________ do____ 67
U. S. merchandise, unadjusted: Quantity ---------------------------do____ 116 Value .. _ ---------------------------do.... 77 Unit value _________________________ do____ 67
Imports: Total v~lue, unarljnsted ________________ do____ 73 Total value, adjnsted __________________ do____ 73
lm ports for consumption, unadjnstetl: Quantity -------------------1923-25= 100.. 119 Value _____ -------------------~-- __ do____ 67 Unit value _________________________ do____ 57
Exports of agricultural products, quantity: Total:
U nar!jnsted _______________ .. 19!Q-14= 100. ____ ---- __ A<i]llsteol. ________ ._----------------do ____ ---------
Total, excluding cotton; Unadjllsted __ -------- ______________ do----Adjusted ____________ • ________ -- ____ do •• __
VALUE§
66 58
106 67 63
55 li5
99 54 54
81 62
90 83
I nl 67 I
I
mi 72 i
641
53 ,. 54
99 52 53
68 54
84 78
~~ I I
91 56 62
55 55
100 li3 53
68 61
99 98
58 63
92 58 63
49 49
89 48 54
61 66
87 95
71 !' 70
113 71 63
59 53
112 60 54
68 69
92 92
Exports, incl. reexports __________ thous. of doL 292,582 252,231 208,756 212,908 218,559 268,364 By ~rand divisions and countries:
Africa _ ... __ .. _---------------------do ___ _ Asia and Oceanla ____________________ do ___ _
J armn ... ____ --------------------·---.do __ -. Europe._----------------------------- do. __ .
France ___ ------------------------- .do ___ _ Germany. -------------------------do ___ _ Italy .. _______ ---------------------do .... United Kingrlom. __________________ do ___ _
North America. northern ____________ . do .... Canada __ ... _ ...... _______________ do. __ _
North America, southern ____________ do ___ _ M rxico ____________________________ do ___ _
South A merlca _______________________ do ___ _ A rgPn tina ________ ----------------_. do ___ _ Brazil _ ---------------------------.do. __ _ Chi!e .. ____ ------ _______________ ._.do ___ _
By e~onomlc claoses (U.S. mdse. only):
_s, n2~ oR, fi11
2.), 2il:~ 104. 3!JU 13 2:lU
• 3 6. 020
31, 48'\ 52. 11:1 51, ~(j2 ~9. 510
8. 700 38, OX!\ 9. XX7
10, ROH 3,625
9, 767 48, 494 19. 104
!10, 192 13,788 ~. 620 5. 0\JI
43,2:18 38, 992 38 .. o13 21,473
5, 239 23.314 6, 796 5, 143 1, 741
13,185 61. 5\ll 28, 528
112, 672 II, 134 8, 317 5, 141
46, 825 29, 067 2R. 4.oR 23, 705 5, 829
28, 538 7, 736 6, 749 2,139
8,075 42, 445 17,6n 95, 830 10,818 e. su5 4. 381
42. 462 27,061 26. fl84 20,801 5 .. os1
18.695 3,114 4,968 1, 736
8, 523 46.406 17,484 95. 445 10,6.03 5, 176 3, 889
38. 678 26. 258 25. 71\4 20, 453
5, 9?8 21,472 4,067 5,120 1, 480
Total ______________________ thous.ofdoL 286,8~1 249.694 266,171 210,258 216,036 Crude materials ___________________ do____ 5R.31~ 59,867 4Y,376 36,391 36,485
Cotton. unmanufactured _________ do____ 30. ;;r,a 25,016 19.048 14,975 13,732 Foocl•tuffs. total. _________________ do____ 22. 6c.r. 29. 4i4 28,422 31,051 26, 5!\3
Foodst•tffs. crutle ________________ do____ n, 3~6 12,045 11, 170 16,443 11,402 Foodstuffs anrl heverages, mfrs __ do. ___ 17.270 17, 429 17, 2:>2 14,608 15, !51 Fruits »nd preparatlons __________ do____ 5, 7:l~ 10. 116 10, OliO 7, 227 6, 404 M Pat< antl fats. __________________ do____ 4. 0-'7 4. 113 4, 204 4, ii96 4, 145 Wht'at and •lour _. _______________ do____ 3. 07B 4. 473 4 .. \88 8, 201 7, 4113
Manuf11cturns, semi- _______________ do____ 6:1.200 :l9. 955 50.499 3.0, 4.o2 34,868 Man~tfaetures. ftnisbed _____________ do ____ 14~. 7!6 120. 3V9 137,874 107, :lfl5 llR. 128
Autos and parts __________________ do____ 19.870 25,417 29. I C. I 21, ~96 25.33,\ Gasoline ------------------------do____ 7, 5~1 8.1\16 12.292 7, 449 6, 3R7 Machinery. __ --··-----------------do____ ~S. 6:l7 ~4. 5.00 40, 908 31. 217 34, R05
General imports, total ____________________ do ____ 2:l5. 402 176,181 171,474 178.201 158,035
11,560 60,505 23,573
108. 143 12.614
6, 446 5, 056
41.874 33,092 32. 298 27, 598
7, 991 27, 407
5, 281 6, 664 2,188
264, 578 40,072 16.958 27.966 12,287 15,679
7. 017 4. 724 6, 406
4.5. 6o8 150, 882 28. 5114
8, 378 49, 390
190,437 By grand dldsions and countries: l
Africa._ ------------------------------do____ 9. 0~3 4, n69 4,1451 3. 741 6, 479 6.964 Asia and Oceania ____________________ do____ 77, R!J.> 56,033 52, 130 51.818 42. 7RO 59,952
Japan __ ----------------------------do____ 18.985 14,053 12,020 11, 285 7, 896 9, 707
§Revised series, Data revl.sed for 1937; see tahltlll 19 and 20, pp. 14 and 15 of the April!939 Survey,
61 64
98 61 62
58 53
107 58 54
47 55
72 78
66 70
107 66 62
63 61
111 61 55
52 62
91 95
230, 917 249, 259
10,101 49, 243 16. 147 88,809 12,468
4, 806 4, 130
34. 311 35.055 34. 53.5 23.462
6, 320 24, 277
4. 068 6,007 1, 479
221. o97 26,016 9, 185
23.621 9. 810
13.811 6. 656 3, 698 5, 459
41.0118 136. 951
24,921 6, 813
43, 882 186, 195
8. 57t 51,162 10,607
8,530 54.165 21,394 97,955 12,044 6, 294 4. 460
37.410 43. 583 42. 637 22. 356 ti, 296
22.669 4, 918 5, 417 1,621
245,913 30,243
7, 4.o8 26.927 10.808 16. 119
5, 844 4, ~-11 7. 601
48. 247 140. 495
23. 753 10. 119 44.401
202, 502
8,640 59,454 10,747
474 16,050
11,967
41, 005 1,429
4. 4 4. 5 4.1 4. 2 5. 7 4.1
4. 87
642. 293 7. 104
212. 3.o8 2. 832
169.079 3. 288 25.54
~51 101 I 631 62
55 58
102 56 55
35 46
56 63
677 669 1, 970 1, 045 24, 519 24, 554 75, 192 34,998
1g, 066 17, 372 57, 081 23, 734
44, 762 41, 653 47, 440 47, 374 1, 430 1, 430 1, 431 1, 431
4.1 4.5 3.9 4.0 ~4 ~6 ~9 ~0 ~8 ~2 ~6 L7 4. 0 4. 3 4. 1 4. 0 5.2 5.5 6.4 5.3 3.5 4.1 2.8 3.0
4.88 4.921 5.14 5.09
I I --------- --------- 639,0191----------------- --------- 7, 003 ----------------- --------- 2ll, 014 1----------------- --------- 2,807 -~----------------- --------- 168, 176 ----------------- --------- 3, 286 ----------------- --------- 26.00 ~---------
60 69
99 61 62
52 57
98 53 55
36 51
60 66
66 72
108 67 62
54 57
102 56 55
51 63
69 70
76 72
117 76 65
56 59
112 63 56
881 81
71, 66 1
87 72
131 87 66
67 65
116 65 56
111 82
83 72
236, 058 229, 62S 250,839
8, 376 43,360 12, 126
113. 954 22, 269 6.8f>8
288, 573 i 332, 079
8, 959110, 385 9. 996 49,971 14, 7fJ9 85, 711 10. 807
5. 299 4. 263
36. 604 40, 452 39. 874 23. 358
7. 922 26,571
6. 113 5.193 2, 651
233,359 25.713 6. 157
19. 52! 6. 026
13.495 3. 523 4, 997 4. 079
48.462 139.664 20.387 9. 4.'i3
42, 191 178, 953
4,469 57,080 11,237
10,270 43, 8fi6 12, 55! 87 787 14,894
5, 4116 3. 721
33.452 41.008 40.074 21.850
5. !,C,5 24, 847
6, 268 6, 242 1, 596
226,737 29.667
5, 970 19, ~19 4, 671
15, 048 4, 423 5, 221 3,837
45,994 131.357
18, .520 7, 628
43, 654 168,925
4, 497 53,040 8, 716
3. 027 47, 434 43. 162 42,332 20, 120
4, 606 21,867 4, 675 5,135 1, 818
248. 148 36,499 11, Sf>9 24,329 8, 384
15,945 7, 199 4, 0~6 5, 46.\
53. 504 133,817
14. -'93 8, 746
43,611 175,756
5, 702 54,339 13,171
50, fi32 62, 780 19,347 23. 367
121,301 127, 690 12, 132 12. 555
607 39, 090 4, 834 6. 301
60. 339 52. U24 5-3, 165 62, 84 7 52. 156 61, 715 29, 116 33, 102
5, 781 8. 579 25, 401 32, 960 4, 94 2 6, (189 5, 997 8, 609 2, 020 2, 667
284, 041 66.847 35,661 28. 786
7, 477 21,309 9,014 4, 434 4, 270
58,993 129.415
12, 457 9, 728
40, 143 181, 46i
3, 341 60,511 19, 520
323, 168 78, 449 47, 2-04 37, 760 10.213 27, 547 13,777
4, 876 3, 604
64,537 142. 422 18.900 9. 2!\6
42, 316 215,281
5, 229 64, 197 20,438

JANUARY 1940 SURVEY OF CURRENT BUSINESS 37
Monthly statistics through December 1937, to-~l!l:J91 l!l:JR 19:19 gether with explanatory notes and references --- --
1 1 1 to the sources of the data may be found in the Novem· Novem·l Decem. Janu· I Febru·l I I I I A Sep· 0 1 S I h S b b l ary ary March April May June July ugust teiuber ctober 938 upp ement to t e urvey er er >er
FOREIGN THADE-Continued
VALUE §-Continued I I I I General ImPorts-Continued.
By grand divisions and countries-Continued. Europe ...................... tbous. or doL. 60,344 54,623 53,609 51,273 47,722 52,298 57,574 58.946 46,009
}'rance ............................. do ..•• 6, 31~ 5,191 5. 5R6 4, 703 5, 234 5, 692 5. 411 7,122 4. 903 Germany .......................... do .... 2. (i!'(i 6, 923 6, 21\6 5, 231 4, 930 5, 171 13,829 2,1;85 3. 349 Jtaly ............................... do .... 4,9M 3, 656 3,397 3, 266 2. 669 3,976 3.289 3,2X9 2. 711 l'nlted Kln~dom ................... do .... 13. 577 12.898 12.251 11,331 10,995 11,971 11,572 15,192 II, 664
North America, northern ............ do .... 36, 109 25, 8~9 24,300 26, 1~6 20,302 23, 5.i9 2r., 163 2H, 850 26, 9R4 Canada ............................ do .... 34, R~3 25.232 23,554 25.222 20,129 23,128 25.671 28, ~23 26, 533
North America, southern ............ do .... 15. 16fi 12,566 12, 753 17.924 18,650 22. n2 19,406 22,178 19, 29\l Mexico ....... ··-·-···-·········----do .... 5, ~!\2 3,084 4. 748 5. 429 5, 270 6, 326 4, 442 3,995 4,3R5
South A rnerica ••••••. ----------------do .••. 37.0fi~ 23,051 24,538 27.309 22.1112 24.932 23,319 24, 434 25. 1~2 Argentina ... __ ......... _. __ ........ do. ___ R,6R9 3, 566 4, 252 6,633 6,086 5, 460 4. 357 4,3.>5 3. 9.,2 BraziL ............................ do .•.. 12, ~91\ 9,150 9,191 8,420 7,M7 9, 421 7,867 7,420 9.1f0 Chlle ............................... do_, __ 6,629 1,567 2,457 3, 277 2,272 2,583 3,813 2, 750 2,468
By eronomic classes (Imports Cor consump-tion\:
Total ........................ tbous. or dol.. 214,454 171,61>2 165,522 169,323 152,528 191,226 185,800 194,193 178,405 Crude rnaterlals .................... do .... 75, ~86 52,355 53,465 53.890 48,073 59, 5(17 54.940 62, 2i7 54.725 Foodstuffs, cru<le .................. do .... 27,881 23,788 2~. 093 26. 774 22.947 28,205 24.053 25,886 22, ,,18 FoodR~utfs and heverages, mfrs._ •. do .••• 21.777 22.995 20,887 16,638 18.635 2fo, 2!16 21\.036 26,062 27. 72.' M anuractures, sernJ.. .............. do .••. 48,614 35,172 35,265 37,158 34,047 38,822 37,936 39,857 3~.'113~ Manufactures, finished ............. do .... 40,795 37,342 32,812 34,864 28,827 38,396 43,836 40, 411 34,804
TRANSPORTATION AND COMMUNICATIONS
NSPORTATION TRA
Exp
Operating re'<'enu Operating Income
ress Operations
e .•.•••••••••••• thous. of doL. ........................ do .••.
Elect ric Street Railways
sh rate ................ cents .. Fares, average, ca Passengers rarrieO Operating revenu
t ................ thousands .. es .............. thous. of doL
Class
Freight-carloadln
I Steam Railways
gs (Federal Reserve): Combined in de x, unadjusted ••. 1923-25=100 ..
Coal. ....... . ........................ do ••.. Coke_ ....... . -----···---------------·do .•..
ts. _. __ ................ .do .••. aln products ........... do ....
Forest produc GraiP.s and gr Livestock .... Merchandise,
.... ----------·-- .•••••. do .... I. c. L .................. do ....
Ore ........ .. ........................ do .... M lsrellaneou s ........................ do .....
Com hlned In de x, adjusted ............. do .... Coal. ...... .. . .. .. .. •• ....... _ ...... __ do .... Coke ........ . . ....................... do ....
ts ...................... do .... aln products ........... do ....
Forest produc Grains and gr Ll vest.ock _ ... Merchandise. Ore ........ MlsC<'llaneou
. . . ··-·-·----------··-··do .... ,I. c. L .................. do .... .. _ •••••• ---••••••• ___ ••. do. __ . s .. ___ .... _. _ ..... _ ...... do. __ .
Frelght·carloadin gs (A. A. R.):, Total cars .... . _ .................. thousands ..
Coal. ...... .. ........................ do ..•. Coke ...... . ......................... do ...•
rt.s ... _ .................. do .... Forest produ Grains and gr aln products ........... do .... Livestock __ _ . _ .... ··--···------····-··do ... _ Merchandise ,I. c. L ................. do ..... Ore ___ ...... ......................... do ..•. MlscellanMus ........................ do ....
us, totaL ................ do .... Freight-car surpl Rox cars.----Coal cars ......
. __ ---··· ................... do ..... • .. . -----............. __ do •••.
ons: Financial operatl Oper.t.tng reve nues, total •••••• tbous. of doL.
Freight ... . • -----····----- .......... do .... Passenger .. . ......................... do ....
nses .................... do .... erating lncome .......... do ....
OpPrating expe Net railway op Net income ... Operating resu
.. -··--·- ................ do .... Its: d 1 mlle. __ ...... mil. or tons.. ton-mile .. _------·---- eents ..
Frel~ht carrie RevPnue per Passengers ca rrl~d 1 mlle .•••••.•• mllllons ..
Wa terway Traffic Canals:
------------------
7, 864 789,420
83 87
100 50 sa 50 64
105 91 82 80
100 51 88 41 63
191 89
3,040 601
47 142 14R 67
616 182
1, 236 lOR 47 35
368,027 310. 434 29. 2R9
256, 170 70,346
--------~
---------------------------
9,240 11,338 8,586 131 920 71
7.889 7.888 7. 888 775, 461 838,707 790. 120 55,274 60,028 56,869
70 64 63 76 78 76 58 58 64 39 37 37 76 72 71 53 40 40 62 59 59 41 23 22 76 67 65 69 69 69 70 69 67 58 53 M 40 43 42 81 83 79 44 41 41 61 61 62 74 92 102 74 74 76
'2, fi28 2,949 2,302 '509 664 515
26 35 30 109 131 10.~ 137 163 129 69 67 53
594 708 561 6.5 44 33
1,018 1,138 878 175 221 218 85 106 106 51 71 67
•319,629 318,336 aos, 7e9 • 264, 120 2M,320 246,803 • 30,176 37.913 34, 7R5
•231,204 232,704 232.946 • 49, 6!12 49,373 32,891
7,422 22,225 • 8, 721
28,471 28,133 28,152 1. 004 .981 . 964 1, 564 1,928 1, 790
8,499 0,107 9,165 9,454 9,374 72 76 67 59 69
7.873 7.873 7.864 7.864 7.8fl4 737, 164 835, 136 788.941 811, 584 763.038 63,361 59,702 56,628 58,222 55,383
62 63 58 62 67 76 66 36 44 58 62 57 47 40 47 35 36 39 41 42 64 67 68 73 89 31 32 37 36 30 60 62 62 61 61 22 21 31 81 108 64 70 72 73 74 67 66 60 62 67 65 62 43 51 68 46 55 56 42 51 36 36 38 40 40 70 73 76 81 90 38 40 40 40 36 62 62 61 61 61 93 86 75 58 64 75 73 70 70 71
2,297 2,390 2,832 2, 372 8,149 529 478 350 297 503
30 29 29 19 28 gg 105 140 121 lfil
116 125 159 137 202 42 42 61 49 bO
577 612 775 612 744 34 33 58 121 209
870 967 1, 261 1, 016 1, 261 209 202 26.i 211 175 102 05 86 90 79 63 67 146 87 65
276,904 315,091 ~82,118 302,618 321,617 ~24. 819 257,469 224.588 243, 641 2M. 763 30. 237 31.201 31.791 31,758 38. 436
220,620 240, 359 227, 622 237,411 241. 7Rfi 18,591 34, 317 15. 2oH 25, 101 39.095
• 24,364 • 10, 505 • 27.896 d 18, 594 4 !, 685
25.553 28,831 23.983 25,737 28,465 .972 .988 1. 035 I. 04.; . 9~7
1,555 1,618 1, 681 1, 725 2,075 i
44,496 48, 1fi0 5,146 5, i08 3, !175 3, 7\li 2, 264 2,080
II. 0~1 10,990 26,993 26, 6SI 25,M7 25,970 18,530 18, 4!10 3, 627 3, 534 21.~70 22,394
3, 207 4, 787 6,657 8, 281 1,822 1,691
170,451 180, ~i9 50,041 60, 9fo2 21.759 20,778 27. 799 27,605 36,912 31\,H.>l 33,939 35,383
8,899 9,105 68 63
7.864 7. 864 710, 186 722, 9R7 51,907 52,699
70 71 64 69 52 57 43 44
Ill 90 34 37 61 62
112 125 74 75 69 70 76 78 62 69 43 42 80 75 39 37 62 62 59 67 72 74
2,549 2,689 429 476
24 27 118 126 200 170
44 48 583 61~ 167 192 983 1, 034 166 131 79 70 53 34
332,436 844,400 265, OR6 276, 707 41,269 3!1,821
241,962 247, fo22 49,012 54, M~6 6,578 10,053
29,824 81,389 971 . 962
2,355 2, 283
41,516 3. 851 l,SI5 2, 401
10,967 34,233 33, 125 19,6.15 3,4r.O
22.206 3, 803 8. 3.11 1,813
199,483 67,606 19, 4fi5 38,412 38.275 35,725
9,696 62
7. 864 747, 175 54,561
85 89 78 49 99 57 65
149 92 77 85 82 45 88 45 63 85 82
3,844 740 4.;
171 219
SIO 780 277
1, 523 70 33 16
3RI, 118 314,400 37, 146
2.ol, 167 86, 43.5 41,078
36, 115 . 941
2,097
53,85 3 4 7 3 5
26
2,!19 1, 55 5,12
14,60 40,4 39,82 7 22,029 4,:l79
29,548 5,055
II, 390 3, 728
207,140 70,500 24,898 27,722 45,416 38,604
9,560 74
7. 864 814,965 59,309
89 96 95 52 87 62 65
160 9 8 8 9 5 8 4 6
10
7 0 7 5 0 7 4 2 8 ~ 8
r 3, 37 5
6 6 2 5 4 0 3 8 8 4 5
67 4
15 16 8
64 25
1, 35 6 3 I
419,71 35.1,10 33,36
271, .i3 !OJ, 61
7 4 7 8 6
56,521
40,06 ----------------
.......... thous. of short tons .. 485 327 348 342 326 317 362 363 396 369 414 434 51 Cape Cod..... 3 e ..................... _ .do ..... --------- 845 0 0 0 0 101 735 586 538 687 615 71 New York Stat 7 .••••••••. thous. of long tons .. 2, 473 2,224 2,374 2,393 2,207 2, 664 2,473 2, 539 2, 437 2,318 2,385 2, 446 2, 38 Panama, total. 6 Is ...................... do ••. _ 1, 031 789 807 753 689 873 892 I 921 905 806 971 1,034 1, 03 In U.S. vesse 7
r Revised. • Deficit. ,Data for December 1938. April. June and Sentember 1939 are for 5 weeks: other months, 4 weeks. tFor comparable monthly fi~•Jres. January 1929-Decemher 1936, see table 10, p, 15 of the March 1939 Survey. Data shown In that table beginning January 1937 have been
revised; seep. 37 o' the April 193!1 Survey §Revised series. Data revised for 1937; see tables 19 and 20, pp. 14 and 15 of the .April 1939 Survey.

38 SURVEY OF CURRENT BUSINESS JANU.\UY 1940
1939 Monthly statistics through December 1937, to-~19391 1938 I gether with explanatory notes and references ---to the sources of the data may be found in the Novem- Novern-1 Decem- Janu- I Febru-1 March I April I 1938 Supplement to the Survey ber ber ber ary ary M I J I J I I A a t I Sep- ! Octo-ay une u Y u~us tem ber I ber
TRANSPORTATION AND COMMUNICATIONS-Continued
I I I I TRANSPORTATION-Continued
Waterway Traffic-Continued I Canals-Continued
St. Lawrence ............ thous. of short tons .. 1, 073 1,065 5 0 0 0 50 1,189 1,161 I, 119 1, 284 Sault St. Marie ......................... do .... 10,438 4,466 323 0 0 0 43 5, 799 8,622 9, 598 10,552 Suez. _________________ thous. of metric tons .. (') 2,270 2,422 2,166 2,277 2, 561 2,569 2,416 2, 220 (') (') Welllmd ................. thous. of short tons __ 1, 535 1,652 181 0 0 0 200 1,324 1, 580 1, 659 I, 713
Rivers: Allegheny ____________________________ •. do. ___ 303 244 180 175 135 199 101 136 230 242 234 Mississippi (Government barges only) __ do ____ 192 215 171 183 124 136 169 67 145 191 228 l\fonon~ahela. ___ .. ____________________ do ____ 2,494 1, 710 1, 798 1, 568 1, 557 1, 742 348 661 1,688 I, 704 1, 949 Ohio (Pittsburgh district) ______________ do ____ I, 427 991 1,074 1,003 880 1,114 469 655 1, 265 1, 400 I, 411
Clearances, vessels in foreign trade: 5,424 6, 241 Total, U.S. ports ________ thous. of net tons ____ --------- 5, 678 5,062 4, 670 4, 734 5, 280 6,667 7,082 7,280
Forei!!n. ____ -------------------------do ____ 4,037 3, 813 3, 539 3, 607 4,160 4,038 4, 766 4, 971 5, 280 5, C51 United States ______________ ------ ____ do ____ -- 1, 641 1,249 1,132 1,127 1,263 1,242 1,475 1,696 1, 802 1, 729
Travel
Operations on scheduled airlines: 49,445 63,361 Passenger-miles flown _______ thous. of miles .. 67, 031 46,090 41, 594 38,403 35,002 53,483 70,199 72,918 75, 145
Passengers carried __________________ number _ 171,5.17 113. 621 99, 119 89,002 81, 131 117,071 133,469 162,682 li9, 055 18.5, 643 194,418 Express. _________ ------------- ______ pounds .. 844,413 685.389 761,090 577,982 564.928 685,274 663,884 725,061 824,630 725,922 933,965 Miles flown. _________________ thous. of miles .. 7,408 5, 776 5,665 5, 453 5,032 6,125 6,268 7,122 7,183 7, 541 7, 639
Hotel~: Average sale per occupied room _______ dollars .. 3.44 3.47 3.26 3. 21 3.28 3.15 3.37 3.20 3. 34 3. 29 3.39 Rooms occnpied ____________ percent of totaL. 61 60 54 64 63 64 63 63 62 57 61 Restaurant sales index_ ____________ 1929=l00 .• 97 94 88 88 86 84 99 90 95 85 93
F oreign travel: 19,556 31,909 25,374 19,800 Arrivals, U.S. citizens ______________ number __ --------- 15, 649 16. 614 25.590 20,889 29,872 44,501
Departures, U.S. citizens ______________ do ____ 16,103 18. 765 24,307 28,224 21,673 21, 575 19,011 24, 788 42, 246 38,573
f~1~~~~~s ~ ::::::: ::::::::::::::::::::~~:::: --------- 2,157 2, 663 2,344 1, 479 1, 702 1, 851 2,077 3,168 3,163 7, 006 6,844 8,042 5, 661 5, 959 8,076 7, 063 6,049 4, 512 4, 694 2, 950
Passports issued _________ --------- ______ do .• -- 1, 641 5, 589 5,184 5, 927 4,865 8,383 8,839 16,080 21,013 10, 393 7, 444 N ational Parks:
Visitors. __ . ----------------------------do ____ --------- 77,750 57,677 74,8.34 62,848 72.280 164, 736 248,075 471,624 916, 175 875,682 Automobiles. ___ ---.----------- ________ do ____ --------- 23,783 16,798 20,587 17,618 21,779 48,892 73,402 136,576 249,905 238,296
p ullman Co.:• Revenue passenger-miles _________ thousands _ --------- 585.289 687,369 793,229 654,896 715,420 684,444 631,529 769,819 801, 514 764, 706 Passenger revenues _____________ thous. of doL. 3; 912 4,488 5, 263 4,473 4, 769 4, 447 4,147 4,842 4, 990 4,855
COMMUNICATIONS
Telephone: 102,646 Operating revenues. ___________ thous. of doL. --------- 9~. 531 101, 552 99, 234 96,064 101.610 100,(183 102,119 99,824 101, 793
Station revennes_ -------------------_do ____ 64, 897 66,188 65,815 64, 504 66,491 66, 162 66,875 66,521 64,690 6.1, 060 Tolls, message. ______________________ do ____ --------- 24,959 26,591 24,731 22,954 26, 498 25,275 27,101 26,923 26,383 27,942 Operating expenses _______ ---- ___ ---- __ .do ____ 67,434 69,444 67, 281 64. 155 68,456 65,683 68,983 68, 1S4 67,738 68,650 Net operating income ________ ~ ________ do ____ 1~. 946 18,835 18, 527 18,438 19,479 20,576 19,832 20,027 18,398 19,268 Phones in service, end of month ___ thousands __ 17, 593 17,704 17,735 17,808 17,897 17,974 18,055 18,072 18, 102 18,160
Telegraph, mble, an-t radiotelegraph carriers: Operating revenne. totaL ______ thous. of dol. --------- 10, 751 12,408 10, 549 9, 987 11, 577 11.012 11,735 11, 721 10,676 11, 583
Telegraph carriers, totaL _____________ do ____ 9,114 10,553 8, 829 8, 436 9, 717 9,383 10,065 10,113 9,189 9, 887 Western Union Telegraph Co .. revenues
588 502 514 from cahle operations __ .. thous. of doL. 522 570 527 463 501 451 542 Cahle carriers. ___ .. __________________ do ____ 830 976 856 7.56 901 768 790 774 707 802 Radiotelegraph carriers. _____________ do ____ --------- 807 879 864 795 960 861 880 834 780 893
Opera tin~ expenses _________ ----- ______ .do. ___ --------- 9,991 10, 756 9, 816 9, 319 10,031 9,8091
10,289 10, 142 10,028 10, 146 Operating income ______________________ rlo ____ 69 1, 041 I 15 d 17 814 512 699 ~~! d 77 69.1 Net income. _________________ ---- ______ do._ .. '774 291 • 884 • ?34 (•) 4387 •229 d 951 d 222
I
CHEMICALS AND ALLIED PRODUCTS
CHEMICALS I Akohol. denatured:
Consumption _____________ thous. of wine gaL. 13,068 10,308 10, 434 6, 722 6, 558 7, 578 7, 523 8, 203 7, 944 7, 395 9, 202 Protlurtion _____________________________ do ____ 13,060 10, 186 10,478 6, 827 6, 446 7,616 7, 719 8,490 8,166 7,437 9,190 Storks, end of month ___________________ do ____ 1,479 1, 233 1, 279 1, 379 I, 260 1, 294 1,485 1, 766 1, 982 2,015 2,007
Alcohol, ethyl: 18,655 Produrtion _______________ thous. of proof gaL. 21,787 15. 164 16, 781 17,067 14,650 17,438 17,857 16,838 17, 643 18,539
Stocks. warehoused, end of month ______ do ____ 14,168 23,277 20, 8P5 24,433 26,072 27, 741 29,625 31,078 30,860 32,232 32,919 Withdrawn for denaturing _____________ do ____ 22,944 17,249 17,391 11,401 11, 198 13,202 13,253 15,031 15,029 13,823 16,050 Withdrawn, tax paid ___________________ do ____ 2,282 2, 439 1, 841 1, 691 1, 363 1, 851 2,074 2,009 1,858 1, 765 1, 780
Methanol: Rxport.s. refined§._---------- .. ______ gallons __ 12:l, 995 12,648 25,990 24,355 26,359 10,806 24,195 18,441 108,084 195,034 28,373 Price, refined, wholesale (N. Y.).dol. per gaL. 0 36 0 36 .36 . 36 .36 0 36 0 36 .36 .36 0 36 0 36 Production:
Crutle (wood distilled) _______ thous. of gaL. 480 344 357 352 336 365 389 354 344 378 360 Synthetic. ______ ------------------- .. do ____ 4,612 2, 618 2, 844 2, 463 2, 267 2, 407 2, 276 1, 779 2, 295 2, 495 2,679
Explosh•es, shipments _____________ thous. of lb .. 35,477 29,385 28,415 29,258 26,592 27,801 26,341 29,315 30,210 27,652 32, iOO Sulphur production (quarterly):
Louisiana _______________ --------_ .long tons .. -------- 68,900 ------- ~- --------- 83,260 --------- --------- 105,895 -------- ---------Texas __________________________________ do. ___ --------- --------· 478,774 --------- --------- 405,263 --------- --------- 357,819 --------- ---------
Sulphuric acid (fertilizer manufactures): Consumed In production of fertilizer
108,889 106,137 short tons __ --------- 147,592 148,289 142,451 138,273 119,081 112,593 104,378 115,119 Price, wholesale, 66°, at works
dol. per short ton __ 16.50 16. 50 16.50 16.50 16. 50 16. 50 16.50 16.50 16.50 16. 50 16.50 Production _____________________ .. short tons .• 171, 106 176,923 181, 386 169, 769 169,952 145,689 155,902 140,580 139,248 161, 791 Purchases:
From fertilizer manufacturers ________ do ____ --------- 31,182 20,604 20,418 18, 751 11,951 15,021 8,853 10, 5351 18,635 19,252 From others __________________________ do ____ --------- 18,494 27,515 22, 343 23, 778 17, 508 16, !i42 20,771 25,614 17,067 15, 568
Shipments: 38,123 To fertilizer manufacturers ___________ do ____ l·-- .. -.. - 3i, 752 33.080 38.085 39, 167 35. 100 33,202 36,9661 2.3, 804 45,396 To others ___________________________ _do ____ .... _. _ .. 38, 447 I 40,915 40, 850 35. 545 42, 864 35, 528 38,835 43, 369 45, 376 43, 316 '
• Revised. • Deficit. • Less than $500. 1 Temporarily not aYailable.
! I
1, 216 11,493
(') 1, 564
279 150
2,077 1, 355
6, 306 4, 537 1, 769
75. 800 192,544 981,462
7, 442
3. 35 64 89
40,295 26,656 5, 518 2,301 1,843
433,014 131, 631
736,325 4, 679
103,843 65,696 29,361 67,210 22,386 18,263
14, 117 11,079
900 1, 417 1. 622
10,548 2, 683 1,877
12,848 12,625 1, 776
18, 104 25,913 22,315 2,187
28,337 0 36
405 2, 640
35,933
106,795 372,655
134, 287
16.50 153, 897
30,040 33,590
37,574 44,089
1,21 12,35 (!) 1, 74 8
0 1 7 3
32 • 18
2, 45 1, 44
---------------------
77,46 194,21 948,50
7,62
3. 3 6 9
8 6 1 6
9 7 3
-------------------------------
1, 75 9
9 6
247, 14 7!, 36
696, 18 ~ 4, 46t
105, 52 68, 45.
0 :l R 28, 31c
69.151 22,24 0 18, 35,
12,35 9,99
68 1,09 1, 26.
10,14t 1, 41.
50.
15,45 15,18 1, 49
20,96 17,97 26,03 2, 24
263,58 .3
46 4,15
40,61
--------------
175,33
8 6
2
16.5 0 ?4 205, o.
31,7 I "4 49 40,0
42,83 57,41
5 0
•New series. Data for Pullman Co. revenue passenger milos beginning 1915 and passenger re-;enues b1~ginn1ng 1913 are given in table 7, p.lS, of tbe January 1939 Survey \Revised series. Data revised for 1917: see table 19, p. 14. of tbe -~oril1939 Survey.

JANUAUY 1940 SURVEY OF CCRRENT BUSINESS 39
gether with explanatory notes and references --- -----;---·-.----,---;--.....:.-7---;----,----;-----,---Monthly statistics-through December 1937, to-~19391 1938 I 1939
to the sources of the data may be found in the Novem- Novem-1 Decem-~ Janu- I Febru·l I I I I I I Sep I 1938 Supplement to the Survey her ber ber ary ary March April May June July August tember October
CHEMICAI ... S AND AJ ... LIED PRODUCTS-Continued
FERTILIZERS
Consumption, Southern states thous. of short tons ..
Exports, total§. ---------------------long tons •• Nitrogenous§_. __ . __ ..•......•.•••.• _ •.. do._._ Phosphate materials§ _____ •. ------- __ .. do ... . Prepared fertilizers§ ...... _________ •.•.. do ... .
Imports, total§ .. ··-----------------------do ..•• Nitrogenous, total§.-------------- ____ •. do ••. _
Nitrate of soda§ ______________________ do .•.. Phosphates§ ..... __ ... __ .----------- __ . do .. __ Potash§ __ .. ----------------------------do ___ _
108 79,270
7, 538 55,009
486 109,670 101,335 66,407
2, 799 4, 214
Price, wholesale, nitrate of soda, 95 percent (N.Y.). ------------------------dol. per cwt.. 1. 450
Potash deliveries• ---·--------------short tons .. "56, 110 Superphosphate (bulk):
146 147,587
2'), 207 123.339
413 116,298 50.231 4,851 6,046
58. i30
1.450 69,798
217 133,295
25. 119 101, 186
72 149,798 78,124 32.336
3, 421 66,897
1. 450 101,438
436 8.1, 542 11,317 71,045
83 141,898 118, 159 63,854
903 20,186
1. 450 2,489
627 85,095 15, 645 66,552
340 109,932 101,396 54,552
969 6, 795
1. 450 2,632
1, 476 123,687
6. 723 97,983
476 138, 782 116,806 42,920 3, 599
17, 235
1. 450 5, 250
1, 271 136,328
5, 365 123, 270
343 191,057 167, 558 115, 188
1, 462 16,580
1. 450 8, 379
312 148.095
12,142 112,773
302 145,432 99,074 62,010
7, 033 10,415
1. 450 8, 674
86 136,016 12,655
105,934 268
109,737 90,541 59,332
594 16,425
1. 450 17,337
48 1M.800
8.067 137,446
447 90, 102 45,632 18,479 2, 321
41,234
1. 450 26,632
43 141,171 26.618
106.607 349
7fl, 002 45. 795 9, 481
408 29,087
1. 450 38,956
148 123, 792 27,157 76,904
697 88,276 71,447 10, 445
392 15,877
1. 450 54,762
190 112,699 18,974 78,418
1, 921 110,046 91,431 42,204
2, 549 14,571
I. 450 '72,622
Production ..... __________________ short tons .. ---------Shipments to consumers. ______________ do ____ ---------Stocks, end of montlL ..• _____________ .do .... ---------
326, 794 343,204 322. 211 312, 284 301,694 286, 747 17,717 17,147 29,310 54,893 161,202 216,671
1,322,306 1,361,127 1,298,883 1,288,536 1,106,679 815,911
277, 437 243, 402 243, 356 279, 107 305, 538 406, 809 m~ ~- ~- am ~m ~w 778, 758 871,109 924,045 963,431 1,012,067 1,122,492
NAVAL STORES Rosin, gum:
Price, wholesale "H" (Savannah) dol. per bbl. (280 lbs.)__ 5. 34
Receipts, net, 3 ports ......... bbl. (500lbs.) .. ---------Stocks, 3 ports, end of month .•........ do .... --·------
Turpentine, gum, spirits of: Price, wholesale (Savannah) ..... dol. per gaL. --------Receipts, net, 3 ports ........•. bbl. (50 gal.) __ ---------Stocks, 3 ports, end of month __________ do .... ---
OILS, FATS, AND BYPRODUCTS
Animal Fats and Byproduct• and Fish
Animal fats: Oils (Quarterly)
Consumption, factory ...•....•.. thous. of lb .. Production ..... __ ----------------------do ____ ..... __ .. Stocks, end of quarter __________________ do ____________ _
Greases: (Consumption, fact.ory __________________ do ___________ .. Production .... ------------------------do .... ---------Stocks, end of quarter ... _______________ do ____________ _
Shorteniu~s and compounds: Production ......... --------------------do ............ . Stocks, end of quarter __________________ do .... ________ _
Fish oils: Consumption, factory __________________ do .... _____ ... . Production ..... ---· --------------------do ____ ---- .... . f\tocks, end of quarter .. ________________ do .....
Vegetable Oils and Products
V eget1\ble oils, total: Consumption, crude, factory (quarterly)
mil.oflb •• ---------Exports ...... --·-----· __________ thous. of lb.. 16,022 Imports, t<"~tali. -----·-··------·---------do .. __ 81,674
Paint oils§ _________ --------- __________ do.... 6, 943 All other ve~etable oit~i--------- ______ do____ 74, 731
Production (quarterly) ..•..•........ mil. oflb .. --------Stocks, end of quarter:
Crude _____________ ----- ... __ .----- ... do ••.. -- .. -. ---Refined .. -------------------- ___ •. __ .do .. __ . - .... - ..
Copra: Consumption, factory (quarterly)
short tons .. ---------
4.89 97,664
660,252
.29 18,364
134,460
2,204 94,982 15,414 79, 568
Imports ________________________________ do.... 31,790 15,437 Stocks, ~nd of quarter •.•• ______ ........• do .•.. ---------
Coconut cr copra oil: Consumption, lactory:
Crude (quarterly) ............. thous. of lb .. ---------Refined (quarterly) __________________ do .••• ________ _
In oleomargarine .•.•• ______________ do.... 2, 154 7, 023 Lmportst---------- --------------------do.... 34,744 39,792 Prorluctton (<1uarterly):
Cr'!de ____________ .... ------ _________ .do .. __ . __ . ____ _ R~finPd _____ --··----····---- ___________ do ____________ _
StocKs, end of quarter: Crude ___________ -----------·--------·-do ••.. ________ _ Refined ____________________ ------ •... do ____ .. ___ ....
Cottonseed: Consumption (crush) ... thous. of short tons •. Receipts at mills ........•. ____________ do __ _ Stocks at mills, end ofmontb _____ ..... do ___ _
Cottonseed cake and meal:
643 664
1,287
'633 '623
,. 1, 565
Exports ...•. -·- ------------------short tons .. 1, 4m 1, 235 Production __________ ·----------·------- do .... Stocks at mills, end of month ____ •••.•. do ..•.
Cottonseed cil, crude:
288, 050 '285, 692 206,931 •315,102
4. 34 48,095
678,731
. 28 10,593
133,921
222,460 505.816 312,725
44,480 87,253 61,276
370,759 55,662
71,664 102, 193 256,352
997 2, 656
92,613 10, 52.) 82,089
977
870 663
58,414 26. 745 36,525
150,922 78,573
7, 204 34,725
73, 68f 82,743
202, 30J 13,332
534 327
1, 353
4. 90 20,473
657,839
.25 2, 390
123, 584
2,815 91,692 11,414 80, 278
20,967
7,244 23, 101
451 152
1,054
4, 468 407 237. 933 205, 49~ 313,3-18 289,286
5. 21 5. 65 13, 757 19, 367
4,86 43, 810
615,381
4. 94 4. 96 5. 19 5.05 57,640
672,880 642, 825 609, 502 57, 079 61, 744 61,096
625, 138 639, 914 659, 878
.26 1, 908
118,954
4,136 85,466 8,169
77,298
17,491
5, 295 29,122
367 95
782
189 169,766 245,221
.29 3, 256
109,626
233,456 501, 165 346,321
48,182 86,419 54,170
354,692 51, 163
66,512 47,713
242,725
952 3, 994
98,010 10, 708 87, 302
832
860 760
.24 9, 799
107,339
.24 14,638
104, 759
----~~262" ---4~3i4" 60, 455 97, 275 12, 136 9, 382 48, 319 87, 894
59,473 22,630 ·-ii;ii4a· --2ii;sso· 35,816 --------- ---------
154,408 --------- ---------64,957 4, 729 ---3;428' ---2;964"
41, 370 22, 889 38, 450
75,457 75,064
202,322 13, i35
399 136 518
3~9 18R, 051 196,544
256 73
336
506 115,729 177,134
199 58
194
81 93,845
173,019
.24 15,884
102,941
217,899 503, 947 403,809
47,438 92,964 54,943
300,076 55,350
66,138 8, 983
180,364
816 3, 673
91, 633 10,755 80,878
593
732 759
52, 114 12,514 36,081
137,891 .53, 074 2,129
37,556
66,388 68,213
226,894 12,315
98 45
140
124 43,272
151, 259
.24 14,692
102,126
'24 13, 754
102,285
--- 2;5,59· ··-a:sii5-79, 467 86, 413 9, 841 10. 292
69, 625 76, 121
19,928
1, 559 21,215
72 52
120
46 34. 293
120,794
3, 773
1, 763 32,898
151 227 196
675 68,229 97,085
5. 48 60, 289
679, 127
. 26 16, 369
101, 111
254, 196 480, 143 318,481
54, 120 93,078 52, IVY
5. 44 54,574
630,926
.27 14,605 93,317
1os. 331 l-36, 539 ·--
68,0221--68,402
221,405 I
il2 7, 908
51, 620 11, 277 40,343
583
661 523
49,469 7, 533
13,881
113,265 52,359
3, 113 10,988
61,949 70,338
197, 485 12,100
524 1,141
813
1, 318 232,352 124, 374
I I
24,745 64,593 12,402 52,191
17,222
2,167 17,774
712 1, 165 1, 266
2,335 320,927 197,618
PrO'luction ...... ---------------thous. oflb •. 201,656 •194, 737 163.035 145,077 116,438 129,265 84, 753 68,322 32,817 23,691 45,3.55 162,480 Stocks,endofmonth ....••......•...... do ...• 184,062 '170,072 175,377 178,203 180,666 177,466 164,945 137,785 88,828 73,353 62,000 110,701
220,362 }56, 8i4
Cottonseed oil, refiued: Consumption, factory (quarterly) ______ do ..•• _________ 301. 398 .. •. • 285,230 ·-------- --------- 272.970 354,226
Inoleomar!farlne ________________ ..... do.... 9,701 10,807 10,577 ---9;884 - 9;4i2 9,678 7,584 6,781 6,708 ···5;522· ---6;986- 9,034 Price, summer, yellow, prime (N. Y_)
8, 689
dol. per lb.. . 099 . C71 . 074 . 071 , 067 . 069 Production ______________________ thou~. of lb.. 163,052 '161, 897 141,823 133.022 110. 4n t:ll. 956
. 066 98.803
658, 332
.066 82,011
639,328
.065 78,683
614, 470
. Q61 41,519
558, 855
'055 54,666
494,718
. Oil . OfJS
Stocks, end of month •••••.....• _ •.•.... do.... 490, 215 '503, 617 .163, 794 609, 950 633, 329 6{2, 463 93, 924 163, 315
411, 791 I 433. G37
Revised. • Preliminary. •New serie~. Data are on basis of potassium oxide content: figures begin!lin• 1928 not snown on p. 39 of the August 1939 Survey will appear in a subsequent issue. §Revised series. Data for 1937 revised; see tables 19 and 20; pp. 14 and 15 of the April1939 Survey

40 SURVEY OF CURRENT BUSINESS
Mouthly statistics through December 1937. to-~ 19391 193S I 1939 g~ther with explanatory notes and references ---
I Fehru·l I I I I to the sources of the data may be found in the Novem- Novem-1 Derem- Janu· March April May June 1938 Supplement to the Survey bcr ber ber ary ary
CHEMICALS AND ALLIED PRODUCTS-Continued
OILS, FATS, AND BYPRODUCT8-Con.
Vegetable Oils and Products-Continued
Flaxse~rl: Import~§- ---·-------·-----·----thous. or bu .. 682 1, 565 1,474 2,111 2, 248 2,031 1,416 1,155 1,802 Mlnnrapolls:
RP-f'Pii't~ .•• --------- __ ------- ________ do ____ 318 205 136 107 38 62 35 61 73 Sh 1 pmen ts ••••••••• __ .•.••.••.• __ ••• _do .... 42~ ).~2 80 47 30 64 58 38 20 8 tor ks _ ••••••••••••••••••••••••.• __ ._do .• __ 4, 059 732 637 524 452 319 283 280 225
Duluth: RPeripts. _ ••••••••••••••••••••.•••••. do ..•• 541 152 1 (1) 1 1 1 (1) 99 8htprr·~nts ••••••••••••••••••••••••••. do_ ••• 5fifi 620 8 2 0 82 29 0 41 Sto.-k•. _ ..... : ..•••.•••.•••.•.•..•.•. do .... 1, 084 •118 112 110 111 29 2 2 59
011 m 111• r qn•rterly): Con,mnption _. ___ ----·-···········--do .••. --------. 7, 206 --------- --------- 7,112 --------- --------- 6. 207 Stork•. pn<l of qtmrter ..... -··-----_.do .... -------. 2,389
----~~99" --------- 2, 521 ···Ts9· --·Tsa· 1,958 Prlco. wh<'lesnle, No. I (Mpls) •.. dol. per hu •• 1. 84 1.84 190 1. 92 1. 97 1.81 Pr..<lnctlon (crop ~st.) ...•...... thous. of bu .. • 20.330 u 8,152 --------- --------- --------- --------- --------- ---------
Llns~<l cnke and meal: Export•§ ... ____ ._._--·---··-··--------do .••• 30.914 47.302 51,820 50,734 50,180 17.219 50,396 40,849 48,733 Shipments from Mlnneapolls .•••••••••. do •••. 21,480 7, 913 9, 760 8,320 5, 720 7, 920 8,280 7, 280 7,000
LlnRePd oil: Consumption, factory (quarter!y) ..••.. do ..•• --------- 72.419
----~ii85" --------- 76.fl74 ----~ii89
91.360 Price, wholeAAle fN. Y.) .••••••••. dol. per lb .. .098 .083 .086 .085 . 088 .089 093 Prorluctlon lquarterly) __________ thous. of lb .. --------- --------- 139.10fl ··-a;9ao --------- 139.209 · ··-ii;4so 124.823 Shipment• from Mlnneapolls __________ do ____ 10,680 4, 771 3. 209 3,900 7. 200 9, 780 6. 360 Stoch at factory, end of quarter ........ do ..•. 141,785 --------- --------- !61, 251 --------- --------- 130,310
Oleomor~arine: Consumption (tax-pat<l withdrawals) •. do •.•• 27,719 29,812 29,991 30,350 27,774 29,032 23,622 22,827 20, 745 Price, wbolesale, standard, uncolored (C'hl·
.140 .140 ca~o) ___________________________ clol. ppr lb .• .128 .150 .143 .140 .140 ,)3.') .135 Production ... _____ --------------thous. or lb .. 27,886 30,221 30,373 30, 3!9 27,701 29,417 23,325 22,699 21, 111
Veg-etahle shortPnlng-s: Price, wholesale, tlerces (Chi.) ___ dol. per lb .. .099 .098 .096 .093 .091 .095 .093 .093 .090
PAINT SALES
I Plastic paints, cold water paints, and calc!-tninPs:
Pla<tic paints ................... thous. or doL --------- 34 30 82 33 44 46 45 43 Colo water p~ints:
In rtry form ...••••••••••••..•••••••.. do .•.. ---- ----~ 115 113 126 144 187 210 230 206
In paRte form .•..••.••••••••••••••.... do .... --------- 190 1~9 211 219 316 317 338 309 C~lcim inPS _. _ .........•.•... -........•• dO .•.. --------- 226 222 235 251 280 282 305 281
Paints, varnish, lacquer, and fillers: 24.229 Total ______ ._ .. _-------·----·----·-- .. do .. __ --------- 2~. 280 20.515 24, 415 31.~M 32.666 40, 1~8 36.886
CIRB•Ifie<l, totaL •••..••••....•.••••.. do ____ --------- 18, ~67 15, O:l6 17.828 17. 3Q5 23,003 23.8:JO 28. M6 26.197 In rlu<trtaL •••••.•.••••..•••.....•. do_ ••• --------- 8. 397 7. 417 8,180 7. 982 9, 626 9, 469 9, 611 9. 781 'l'ra de .... _ .•••.•.••••..•• __ •••••. __ do_ .• _ --------- 9, 970 7, 619 9, 648 9, 413 13, 377 14. 360 18,935 16,416
U n class! fled ___ •..•••.. ______ .• _____ ._ do ••• _ --------- 6, 914 5,478 6,401 7,021 8,551 8,836 ll, 592 10,690
CELLULOSE PLASTIC PRODUCTS
Nltro-~ellnlo<e, sheets, rods, and tuhes: 24e 242 Consumption• .• ----------------tbous. of lb •. 346 228 257 342 287 249 297
Prori11<>tion .••. ------------------_._._do ___ . 1. 361 1, 018 789 923 1,049 1, 315 1, 116 1,036 957 ShipmentsO". __ ------------------ ______ do .... 1, 244 1,008 937 956 977 1,171 950 940 1,000
OeUnlo<e-aretato sheets, rods, and tubes: 7 6 C'on~umptfon• •. __ --··------- .tbous. of lb .. 10 H 9 14 12 10 9
Pro<l nrtion .. ---·-·-···--··-··-·--·--do ____ 725 1, 332 1,112 896 9R9 1,078 508 491 446 8h1pm~nts0" __ . ____ -----·-·----------do ..•. 793 1, 251 1,032 856 1, 0141 I, 029 522 509 378
Mnnl<lln~ composition:• 758 725 871 963 736 795 Pro<lnetlon ..••••..•••.•••••••••••••. do .•.. 1,199 1,031 782
Shipments, ___ ..• _ ..•....••• __ •.••••.. do •.. _ 1,119 956 671 682 770 810 600 704 703 I
ROOFING
Asphalt prepared rootlng, shipments: 2,076 1, 439 Total ... __ --------·---·-·-tho us. or squares .. --------- 2,583 1, 410 2,910 3,2"9 2, 714
2,8871 Grit rolL. _____ ---------------------. do .. __ ~--------
630 515 359 374 692 785 720 831 Shinr1•• la11 types) •.••..•••.•....••. do ____ -------- 83R 527 358 391 F91 1, )50 1,057 1, 058 Smooth roiL_ •.• __ ..• -------- .•••.•.. do._ •. 1, 117 1,035 721 645 1, 327 I, 355 938 998
ELECTRIC POWER AND GAS
ELECTRIC POWER
Production. totalt--------------mll. or kw .·hr .. 11,654 10,303 10,882 10,641 9,654 10,567 9,955 10,341 10,529 By •ource:
e, 976 6,899 Fuel. ___ ••.•.•••••••••••••••••••••.. do ... _ 8. 4.11 6, 760 5, 828 6, 116 5, 5R2 6,176 6, 743 Water power ... ---···················do •••. 3,202 3, 543 3,906 8, 742 3,826 4, 450 4,393 4,165 3, 786
By type of pro<lucer: Privately and municipally ownecl puhllc
utilities _________________ mil. of kw .·hr __ 10. n6 9, 660 10,205 9,965 9,043 9, 900 9, 321 9,686 9,820 Other pro<lne<>rs. ------------------- <lo .... 917 643 677 676 611 667 634 655 709
SaiP• to ultimate consumers. totalt (Rdlson Electrtr ln•tttute) .•.......•. .mll. or kw .-hr _. --------- 8, 475 8. 779 8, ~06 8, 324 8, 398 8. 240 8, 2~2 8, 577
Re•l<lential or <lomestlc . -·-----·------do ____ --------- I, 723 1. 843 1. 987 1. 815 1, 71~ 1, 700 1, 604 1, 627 Commercial anrl tn<lnstriaL ••.•••••••.. do ____ --------- 5, 849 5, 940 5, 800 5, 615 5, 751 5, 704 5,867 6,169 Pnhlir •treet anrl hi~hway ltg ..•••••••. do ..•. --------- 197 206 192 166 )59 134 121 111 Oth~r pnhlir authorities .. _____________ do .... 194 205 203 194 202 192 193 194 Sales to railrnads and rallways .•..•••.. do .... 479 547 531 493 524 473 461 441 Inter<lopartmental. ••....•.••......•... do ___ . -------·- 34 38 42 42 41 39 36 35
.JANUARY 1940
I August I ~~~~~r I July Octo-ber
1,1231 1, 511
67 8,100 28 3~9
231 2, 659
(1) 801 58 144 2 659
--------- -------------~~57" -··T54---------- ---------
44,M9 50.163 6,360 16,400
--·-:o9o- ····:os6-
5,880 ···s;ioo---------- ---------
20,114 21,206
.135 .135 19,262 21,608
.090 .089 I I I
44 46
1M 1M 227 2R7 206 255
29,472 33,087 20,769 23.413
8, 199 9, 309 12. 569 14, 104 8, 703 9,674
221 1 326 979 1, ()69 847 1,065
6 71 561 1,041 537 815
645 I, 034 604 967
2,633 3, 923 737 l. 115 926 1, 176 970 1,632
10,651 11,228
7,179 7. 1n1 3,472 3, 527
9,846 10,329 804 900
8, 583 8. 9.13 I, 620 1, f\20 6,187 6,/>26
115 12g 197 202 433 443 32 35
-----1 i
452
2, 709 648
5,4.56
2.032 l, 170 1, 521
6,R14 6, 383
1. 75 ---------
40. f\00 23,280
88.397 .099
134.326 14,700
112,475
27,918
.124 28, 105
.104
49
171 '2~9
279
'36. 960 '25, 515 ' 10. 420 '15.095 ' 11,445
328 1, 164 1,156
7 706 677
1, 312 I, !53
3,R671 1, 125 ], 289 1, 453
11,116
7.997 3,118
10.260 856
9. 274 I. 7.15 6, t:H9
149 224
4~~ I
sn 67£ 367
5,154
948 1. 31)() 1, 10!1
1. 86 --------
14, 52!1 19,720
.102
15,000
23,676
.123 23,781:
.104
40
17~ 270 233
34.540 24,995 10.976 14.020 9,544
311 1,315 1,232
14 713 684
1,410 1,333
4, 611 l, 291 l, 52(J 1,800
•11.8 64
•8, 7 27 38 3,1
10,9 74 9(1 •8
9,6 l, 7
40 82 1\1 n9 29 79 30
6,9 1 2 4
'Revised. 1 Less thon liOO bushels. b Decem her I estimate. u Final estimate for the crop year •'l•w <erie.. For <lat• on nitro-relluln•e cnn<nmption. eeiht1ose-acetat~ consumption ANI "'"'"I"~ rom positions beginning 1935, see table 15, p.18 of tbe March 1939 Survev tRedsed series. For electric power sales, eee note marked with a "t" on p. 41 of the July 1939 Survey. ·' §HP,.·i~ed sflriM. DatA ror 193i rt'd::::ect; set' tRhl .... JH anJ 20. pp. 14 anrl l!) o' thf> April JQ3H Sun·~y O"lnclu<'les ronRnmption in repurtin2 com pony plants. ,F.,rln<'IPs consumption In reportinfl company plants tFor electrir power pro<lnctlon, ~e• note marke<l wll h a .. , .. on p. 41 of the July 19~P ~ur~ey. Revise<l <lata on production "by type or producer," referred to therein, are
shown be~:inning June 1938 on p. 40 of the August 1g39 Survey; data beginning 1920 wlll be published when available.

JANUARY 1940 Sl'RYEY OF CCHRENT BUSINESS 41
Monthly statistics through December 1937, to-~19391 1938 I 1939 gether with explanatory notes and references ---
1 1 1 1 1
I I I I I to the sources of the data may be found in the Novem- Novem- Decem- Janu- Fehru- March April May June July August teSnelpb~-r October 1938 Supplement to the Survey ber ber ber ary ary ~
ELECTRIC POWER-Continued
Revenues from sales to ultimate consumers (Edison Electric Institute) ..... thous. of doL.
GAS§
Manufactured gas: Customers, total.------------ ••.• thousands ..
Domestic._ .. ---------------------· .. do .•.. Honse heating ______ -------------- .•.. do .... Industrial and rommerciaL •.•.•..... do .....
Sales to consumers ...•.•....••. mil. of cu. ft.. Domestic._. -------------------------do .. __ House heating_. ---------------------do ..•. Industrial and commerciaL •.•..•..•. do ....
Revenue from sales to consumers thous. of dol..
Domestic. __ . ------------------------do .... House heating_ ----------------------do .... Inc!ustrial and commerc!aL •.•....... do ....
Natural gas: Customers, totaL. ---------------thousands __
Domestic ...• ---------------- ........ do ... _ Industrial and commerciaL .......... do ____
Sales to consumers ............. mil. of cu. ft .. Domestic._.-------------- ____ ....... do ____ lndl., com!., and elec. generatlon ..... do ..•.
Revenues from sales to consumers thous. of doL
Domestic ____ ---------------· ........ do .•.. Indl., com!., and elec. generation ____ do ....
ALCOHOLIC BEVERAGES
I Fermen Prod Tax·] Stock
Distilte Pro Ta Im Sto
ted malt liquors: uction. -------------------thous. of hbL.I
r~~;;::~:~:'.~l~::~~==============~~==== duction ............... thous. of tax gaL.
x-paid wlthdrawals ................ do .... ports• --------------- thous. of proof gaL. cks. ___________________ thous. of tax gaL.
Wbis Pro 'I' a Im Sto
kv· d.u.ction .. __ ... ___ ------ ••.......... do. ___
x-paid withdrawals ..... ___________ do .... ports• ............... thous. of pro<•f gaL. cks ___ -----------------thous. of tax gaL. ed spirits and wines, production, total Rectifi
thous. of proof gaL. ky* ..... ______________ ... ------· .. do .... Whis
lndicat All sp
Wh
ed consumption !or beverage purposes: irits•t---------------thous.of proof gaL.
. isky•t ••.... ---------- ____________ do .... Still w
Prod TaxImpo Stock
lnf'S: uction• ______________ thous. of wine gaL_ paid wlthdrawals• ................. do ____ rts• _________ ---- ____ ---------- ____ do ____ s• ... ----·------------------------do ....
Spark! ing wines: uction• ____________________________ do _____ Prod TaxImpo Stock
paid withdrflwals* __ ---------------do .... rts• .......... _ .•... _ .. __ •.•• ____ •. do .... s• .... __ •• --------.------------- •. do ....
DAIRY PRODUCTS
'umption, apparentt ....... thous. of lb .. Butter
Cons Price Prod Rece Stock
, wholesale 92-score (N. Y.) dol. per lb .. uction, creamery (factory) t _ thous. of lb._ ipts, 5 marketst ................... do ____ s, cold storage, creamery, end of month
thous. of lb ..
;,mption, apparentt --------------do .... Cheese
Cons lmpo Price
rts. _________ ···-- __ .. __________ ..•. do .... , wholesale, No.1 Amer. (N.Y.)
Prod Am
Rece Stock
Am Conde
doL per lb .. uction, total (factory)t .•••. thous. of lb .. erican whole milkt ·--------------do •.•.
ipts, 5 markets ..............•.••.. do ..•. s, cold storage, end of month ••.••• do .•.• erican whole milk ...•.....••..••. do ..•.
E~~ nsed and evaporated milk: rts: ndensed (sweetened) ....... thous. oflb •.
Ev Price
aporated (unsweetened) ........... do ..•. s, wholesale (N.Y.):
Co ndensed (sweetened) ______ dol. per case .. aporated (unsweetened) ........... do ____ Ev
rRevised.
ELECTRIC POWER AND GAS--Continued
I I
------ ... 192, 178 198,991 201,330 190,210 186,714 185,987 183,112
9, 947 9, 894 9,986 --------- 9,926 9,886 9, 914 9, 907 9,241 9, 254 9,201 9, 225 9,218 9,197 9,285
--------- 220 227 212 219 210 218 224 456 458 465 461 467 467 466
--------- 30,459 34,600 34,761 33,662 33,600 32,626 30,303 --------- 16,041 16,196 17,211 16, 687 16.647 16, 242 15. 755 --------- 4,847 8, 306 8.101 8,004 7,122 6,074 4, 421
9,365 9. 853 9,250 8, 785 9,641 10,144 9,969
--------- 30,881 33,310 33,734 32,811 32,450 31,586 30.707 --------- 21,807 21,923 22,125 21,038 21,054 21,252 21,845 --------- 2, 790 4, 763 5,196 5,429 4,902 3, 840 2, 519
6, 151 6,478 6,292 6,227 6,368 6,368 6, 231
7,156 7,178 7,190 --------- 7,194 7, 220 7,163 7,194 --------- 6, 637 6, 655 6, 603 6. 615 6,636 6,626 6,655 --------- 554 563 550 546 555 549 533 --------- 107,536 126,093 129,398 134, 515 127,377 113,379 101.438 --------- 29,135 42,881 49,177 51,291 46,791 36,510 27,415 --------- 77,633 81,704 78,736 81,770 79,303 75,465 72,581
--------- 36,226 45, 619 50,279 51,197 47,979 41,034 34,644 --------- 20, 280 I 27, 751 32,141 32,6191 30,2181 24.845 19,873 --------- 15,801 ! 17,630 1 17,899 18,331 17,520 15,958 14,550
I I I
FOODSTUFFS AND TOBACCO
I I I
I 3,685 3, 735 3, 541 3,645 3, 482 4, 497
4. 641 I 5. 651 3,826 '3, 775 3, 669 3,104 3, 031 3, 822 3, 985 5,079 7, 696 7, 367 7_,083 7, 470 7, 774 8, 265 8, 746 9, 086
14,921 22,188 17, 230 11,874 10,700 13,022 10,940 10,756 13, 485 11,738 9, 714 6, 248 6,112 8,566 7, 5931 6,868
1, 058 1, 381 1. 691 667 676 831 776 845 506,894 501,045 505,414 510,194 513,462 516,755 519,162 521,251
8, 946 10,572 II, 003 9, 204 8, 724 0, 993 8, 5131 7, 972 10,385 9,5.19 7,665 5,007 4, 996 6, 791 5, 728 4, 866
912 I, 215 1, 459 571 582 706 678 7'30 465,934 4G6,175 466,785 470,251 472,93-1 475,150 477,136 478,741
5, 362 4, 774 2,9731 2,683 3,817 3,670 I 3,425 --------- 4,445 i 3, 898 2, 375 2,192 3,078 2,800 2,496
--------- 15,038 I 13, liS 8,192 7, 743 10,771 9, 775 9,137 --------- 13,351 11,425 6,988 6,816 9, 357 8,122 7,142
--------- 73,578 24,154 5,008 1, 678 1,026 1,003 1,103 ---------- 7,395 8, 730 5,066 5,022 5,883 5,171 4,994
379 406 476 247 194 292 310 229 ------- 137,224 128,047 122, 601 117,094 111, 357 105,776 100,933
--------- 26 37 15 9 25 43 70 -----·so· M 78 16 11 13 13 I 17
83 138 23 19 22 261
37 --------- 608 fi54
548 I 546 558 587 639
I !50, 368 '152, 683 '153.150 145, 7f6 139, 555 153,186 152,961 180, 150
.30 . 27 .28 . 26 .26 . 24 . 23 . 24 112,285 116,835 122.855 128,303 121,065 139, 331 145,123 193,701 45, 197 50,495 53,269 1 55,705 53,955 60,091 59,385 77,966
89,752 160,632 128,770 Ill, 354 92,780 78,909 70,909 84,437
51,043 53,410 51, 593 56,741 57, 241 62,3561 64,704 77,595 6, 344 5,925 4,083 4,001 4,425 4,881 3,927 4,353
.18 .14 .15 .14 .14 .14 .14 .14 42,300 42,729 40,376 39,168 37,992 47,775 54,600 77,300 30,145 30,017 28,258 28,171 27,175 34,281 41,145 60,640 10,614 10,537 10,998 10, 753 11,492 11,960 11, !57 14, 402
112,211 127,440 120, 174 106,411 91,485 81,653 75, 345 79,272 90,254 109,738 102,563 90,401 77,270 68,812 62,866 64,750
145 259 355 104 91 306 142 148 1, 876 2,034 2,198 1, 522 2,007 1, 785 1, 710 2,508
5.00 5.00 5.00 I 5.00 5.00 5.00 5.00 5.00 3.10 2.90 2.90 2.90 2.90 2.90 2.90 2.90
§See note marked with a "t" on p. 41 of the June 1939 Survey.
186, 166 186,600
9, 979 9,995 9, 290 9,316
214 202 465 466
27.917 25,652 16,600 15,541 1, 587 948 9, 606 9,007
29, 56! 27,662 22,253 21, 105 1, 2:!2 788 5, 990 5,683
7,163 7,152 6,650 6, 651
510 499 87,413 86,376 18,862 16,013 67,378 69,210
28,559 26,235 15, 197 13,011 13,193 13,035
6, 271 5,637 5,656 5, 538 9,447 9,330
8, 304 5, 381 6,456 5, 605
772 632 522,058 520,429
5, 774 3, 711 4, 885 4, 343
666 534 478,900 477,149
2,9t10 2, 930 1, 977 2,014
8, 699 '7. 570 6, 767 6,131
677 914 4, 684 4, 247
207 154 94,861 91,048
39 19 25 20 3f> 20
I 647 646
152,862 145,612 24 . 24
200,135 179,275 84,566 77,460
131,609 165, 183
70,249 57,671 3, 781 3,134
.15 '15 86,170 73,400 68.320 58,400 14,322 13,786 98,850 117,598 8!,262 97,448
195 215 1, 799 2, 338
5. 00 5.00 2. 90 2.90
I I
189,225 198,947
10,016 10, 081 9, 336 9,388
206 221 464 463
24,879 26,828 14, 7C2 16, 367
756 876 9, 305 9, 461
26,606 28,615 20,121 21,786
663 837 5, 731 5,909
7, 191 7, 232 6, 689 6, 727
501 503 88, 739 92,700 15,015 15, 491 72,233 75,835
26, 278 26,855 12,465 12, 433 13,597 14,221
5, 450 4,3921 5, 715 4, 921 8, 836 8,112
6, 390 I 10,244 6, 663 8, 772
710 1, 843 518,487 514,433
4, 392 4, 98.1 5, 098 6, 793
612 1, 599 475,371 • 472,499
3,189 4, 005 2, 332 3, 258
'8, 709 '11, 959 7,104 10,309
5, 211 44,293 5,053 6,195
J.o2 420 87, 127 99,817
16 21 21 34 26 84
639 625
157, 235 152, 571 . 24 . 28
164,960 134,515 69,674 55,208
172,825 154, 504
61,789 71,492 3, 435 5, 762
. 15 .17 65,920 57,400 52,420 45,075 14,579 16,527
125,019 116, 561 103,594 1 97,530
194 276 1, 976 3, 414
5. 00 5.00 i 2. 90 2. 90
201,7 09
!0,09 9, 38
24 45
0 3 4 3 3 6 9 7
29,89 17, 11
2, 38 10,22
30,78 22, 5I 1,84 6,31
6 3 8 8 • 8 7, 29
6, 76 7 5.
102,57 19,41 81,74
"\) 2 4 8
31,06 14,96
6 7 5 15,89
4, 23 7 9 4
4,16 7, 99
17,94 6 6 3 6
11,06 1, ll
510,60
7,07 8, 55
4 0 9 3
95 469,17
5, 20 2 9 4,32
13,70 12,00
3 7
105,59 8,01
37
9 I 0
139, ogc
2 5 5
59
7 0 9 7
'147, 95 5 29
5 7
121, 59 49,35
'128, 11
r 67,74 11,63
,I
4 7
54,00 8 0 0 5 fj 7
41,31 15, 14
'l14,73 '93, 98
36 3, 71
4 5
5.0 3.1
0 0
*New series. Earlier data for the new series on alcoholic beverages appear in tables 2·-8, pp. Ui-18 of the July 1939 Survey. tRevi•ed series. For 1937 revisions in consumption and production of butter, consumption of cheese, and production of Americ·an cheese, seep. 41 of the December 1938
issue; 1938 revisions not shown in the December 1939 Surve¥ will appear in a subsequent issue. For total production of cheese see table 50, p. 17 of Novemuer 1939 issue; fivures shown there are correct except for 1938 revmons shown m the footnote IIHhcated by a "t" on p. 41 of the December 1939 Survey. Data for production and consumption of hutter and cheese are preliminary for 1938-39. Total indicated consumption for beverage purposes of all spirits and whiskey revised in their entirety; exports should not have been deducted from the tables as stated in footnote 1, table 6, p. 17 of the July 1939 Survey; revisions not shown on p. 41 of the October 1939 Survey will appear iua subsequent 1ssue.
~Fnr comparable monthly llgures beginning 1919, see table 14, p. 17, of the March 1939 Survey.

42 SURVEY OF CURRENT BUSINESS JANUARY 1940
Monthly statistics through December 1937, to-,19391 1938 I 1939 gether with explanatory notes and references --- ---...,----- ----,----,---;:------;----.-----,-----,----,---:----tothesourcesofthedatamaybefoundinthe No.cm- ~ovem-~Decem- Janu-1 Febru-1 Ma•ch I Apr!'! I My June I July jAugustj Sep- \Octo-1938 Supplement to the Survey ber ber ber ary ary • a . tember
1 ber
FOODSTUFFS AND TOBACCO-Continued
DAIRY PRODUCTS-Continued
Condensed and evaporated milk-Continued. Production:t
Condensed (sweetened): Bulk goods __________________ thous. of lb .. Case goods. ____________ .• _____ ..•.. do.---
Evaporated (unsweetened) ___________ do .... Stocks, ma,nufacturers' end of manth:
(I) 2,354
125,529
Condensed (sweetened): Bulk goods __________________ thous. of lb.. (1) Case goods _________________________ do____ 5,990
Evaporated (unsweetened), case goods thous. of lb .. 188,290
Fluid milk: Consumption in oleomargarine ......... do.... 5, 337 Price, dealers', standard grade* .doL per 100 lb.. 2. 22 Production (Minneapolis and St. Paul)
thous. oflb .. -------·Receipts:
Boston (incl. cream) __________ thous. of qt .. ---------Greater New York (milk only) _______ do .... 121,848
Powdered milk: Exports§. -----------------------thous. of lb .. Product.iont----------------------------do ... . Stocks, mfrs., end of mo.~--------------do ... .
FRUITS AND VEGETABLES
544 20,021
7, 548
ll, .192 3,163
102,056
11, 701 7, 854
284,375
5, 838 2.23
26,700
15,327 118,582
673 24,624 37,194
I
13, 157 3,138
114,739
9, 235 7,139
205,073
5,830 2.23
32,002
14,342 118,277
549 28,038 33,259
12,847 3,421
129,452
8, 536 6,101
150,311
5,856 2.23
36,421
13,988 123,868
473 25,006 32,860
11,505 3.036
137,882
7, 202 4, 985
120, 397
5,422 2. 21
34,829
12, 681 112,501
519 22,890 32,318
15, 408 3,075
181,094
5,809 4, 959
109,882
5,861 2. 20
40,237
13,906 125, 570
689 28,233 30,972
15,420 3, 283
202,090
6,135 4,608
22,007 2, 899
262,957
7, 910 6, 437
134, 625 209, 044
4, 561 4, 498 2.15 2.11
39, 031 44, 144
13,322 121,682
696 31,190 32,102
14,648 132,670
1,069 38,877 31,982
21,059 2, 755
265,586
11, 416 7, 764
292,393
4,112 2.10
41,873
13,897 134,712
739 38,572 25,861
16,615 2, 894
223,953
12, 504 8, 570
16,817 2, 461
194, 162
10,986 8, 001
341, 686 355, 071
3, 870 4. 315 2.10 2.12
34, 051 28, 599
14, 947 129,851
637 29,079 27,613
15, 375 118, 956
798 23,5661 18,298
15,170 4, 398
159,880
7, 741 6,039
(1) 3, 479
143,988
(1) '6,312
135, 135 '175, 646
5, 297 4, 5:ls 2.15 2. 19
25, 226 26, 043
13.258 122, 715
823 22,432 11,963
13,883 128,697
796 r 20, 7~~ '8, 449
• I Jl -"'PP es: Production (crop estimate) _____ thous. of bu .. --------- ---7,-36·i/' 13J,·~~~ 5,625 ---4,-785- ---4·,·8-48-- ---3·,·o·5·5-- ---2.-053-- _____ 9_7_6 __ ---i,-oo7· ·----97i·\---4,-ii:i3- --io,-2i6 Shipments, carlott ___________ no. of carloads__ 7, 794 Stocks, cold storage, end of month
thous. of bbL. 10, 2·19 10, 272 8, 736 6, 903 5, 079 3, 046 1, 569 555 0 0 0 3, 366 ' 10, 102 Citrus fruits, carlot shipmentst.no. of carloads.. 13,718 14,410 18,938 18, 747 18,444 22,939 20,387 17,683 16,426 10,853 9, 154 7, 203 11,852 Onions,carlotshipmentst .....•.......... do .... 1,988 2,359 2,105 2,485 2,184 2,380 3,094 3,383 2,147 1,111 1,668 3,343 '3,132 Potatoes, white: 1
~~~';l';~~~~~e(:;'Jgnc~ti~~ie5:::~~ft6'~~- 1gp ~~:: '366: ~gg 112--.-
059o-:-1' 3ll·.·ig~ ~~--,-17-·.- 55-~~1- --/7-·.- ·3~
1
4-:-~--2-15-·.-33-71-57-- ---118-~. 80
9_8_ 03-- ··2
1
2-~. 68-83-03-- 231.,
5973o5
· -i~---~~- ---~·.-~~:- --i~·--~~~- --i~·.-~~~ Shipments, carl ott ___________ no. of carloads.. 12,441 •
i I GRAINS AND GRAIN PRODUCTS I Exports, principal grains, incl. flour an• I meal§ 1
1
I thous. of bu .. l 5, 709 1.5,111 11, 495 20, 385 15, 521 1.5, 435 11, 368 16, 372 6, 600 8, 389 10, 830 8, 372 ' 11, 281
Darley: I I 1 Exports, Including malL _____________ do.... 153 736 6491 3G8 7241 436 124 614 206 265 713 709 909 Prices, wholesale, No.2 (Mpls.):
Stra,ight _______________________ dol. per bu.. .52 .50 .52. .54 .55 .54 .51 I .55 .53 .45 .46 :~85 I .53 Malting ______________________________ do ...• l ·54 . 56 . 57\' . 60 . 55 . 56 . 57 . 56 . 60 • 47 . 48 " . 55
Production (crop estlmate) _____ thous. of bu .. '276.298 -------- •253,005 --------- --------- --------- _________ --------- --------- --------------------------- --------Receipts,priucipalmarkets. ___________ do ..•. 6,732 5,764 5,846 6,670 3,846 5,967 4,579 4,474 3,791 4,823 20,062 13,546 8,744 Stocks, commercial, end of mo ....•••••. do.... 20, lOG 16,187 15,015 13,752 11,726 10,182 8, 874 5, 745 6, 210 8, 253 16,904 19,421 20,398
Corn: Exports, including meaL __ ... _________ do____ 1, 266 Grindings _______ --------------------- .. do .. __ 6, 333 Prices, wholesale: i
No.3, yellow (Kansas City) ___ dol. per bu .. No.3, white (Ch!cago) _______________ do ___ _
. 53
.60 Weighted average, 5 markets, all grades•
dol. per bu._ . 51 Production (crop estimate) ___ .. thous. of bu .. '2,619,137 Receipts, principal markets ____________ do____ 26,723 Shipments. prineipal markets __________ do____ 15,893 Stocks, commercial, end ofmo __________ do____ 38,202
Oats: Exports, including oatme~L __________ do ___ _ Price, wholesale, No.3, white (Chicago)
dol. per bu.. . 39 PrOd!Jctlon (cr~pestlmate) ..... thous. of bu .. '93~·~g Receipts, prmCipal m~rkets ____________ do.... , Stocks, commercial, end of mo. ________ do____ 13,199
117
Rice:
6, 032 3, 729 6, 5471 6, 724
. 46 . 48
.47 .54
.46 . 50 --------- 112,562,197
32, 698 20, 262 16, 356 10,969 46, 645 52, 644
1,405 147
7,050 6, 340
(•) . 53
. 51
2, 721 5, 256
. 46
.51
. 47
3, 798 5, 780
. 46
. 51
. 47
1, 6113 5, 798
(•) . 53
. 49
1, 207 6, tlO
267 5, 945
608 4, 929
1, 121 6, 693
1, 855 8, 094
5, 580 8,113
(•) (•) (•) . 471· . 52 . 50 . 55 ( •) . 50 ( ') . 57 . 59
. 52 . 51 • 46 . 47 i . 56 • 50
--i4;373- --io;2i6- --ia;os5- --i2;562- ·23;333- --i7;:isi· --ii;s64· ---ii;sso· --22;655- ··ai;6o9 8, 827 5, 398 8, 473 8, 656 20, 170 17,042 12, 759 12,077 11, 584 13, 135 ~- ~~ ~m ~~ ~- ~~ •w ~m ~* nw
353 130 114 112 61 93 101 61 133 '162
.W .29 .U .W .U .U .M .M .29 .W .M .M ··4;199· ' 1'~86~J --T22i- --T3o4- ---5;769- ---4;461- ---ii;3o:l" ---4;5-lo- ---6;673- --i8;625- --i2;52s- --·6;26i 17,676 16,919 15,545 14,649 12,601 10,312 6, 784 5, 695 5, 551 14,681 16,104 14,552
Exports~------------ _______ pockets (100 lb.).. 89,926 223, 534 298, 935 306, 891 Imports§ _______________________________ do.... 58,363 34,816 39,991 46,344
302, 302 302, 102 274, 893 283, 341 41, 296 67, 608 90, 116 84, 857
241,755 75, 647
220,315 83,257
216,072 70,691
381,765 37,528
304,543 8, 568
Price, wholesale, head, clean (New Orleans) dol. per lb.. . 037
Production (crop estimRte) _____ thous. of bu .. 052,306 Southern States (La., Tex., Ark., and Tenn.):
Receipts, rough, at mills thous. of bbl. (162 lb.).. 1, 375
Shipments from mills, milled rice thous. of pockets (100 lb.)__ 1, 083
Stocks, domestic, rough and cleaned (in terms of cleaned rice) end of month
thous. of pockets (100 lb.).. 3, 410 California:
Receipts, domestic rough ____ bags (100 lb.)__ 167,793 Shipments from mills, milled rice_ ... do____ 65,521 Stocks, rough and cleaned .. __ (in terms of
Rye: cleaned rice), end or mo .•. bags (100 lb.) __ 574,503
Exports, including- flour ________ thous. or bu __
1
0 Price, wholesale, No.2 (Mpls.) .. dol. per bu.. . 51 Production (crop estimate) _____ thous. of bu __ '39, 249 Receipts, principal markets ____________ do____ 1, 295 Stocks, commercial, end of mo .......... do____ 9, 954
' Revised. • Less than 500 bushels. I Discontinued by reporting source.
.003
1,458
1,158
3, 983
.033 fl52,506
912
977
3, 983
444, 297 212, 534 182, 438 136, 365
.033
891
1, 250
3, 695
262,200 129,003
. 033
898
1, 064
3, 586
.033
545
938
3, 244
169, 184 229, 760 118,478 143,617
.033
428
802
2,894
.033
681
1,024
2, 595
160, 345 203, 44 7 136, 287 144, 414
.033
368
912
2,092
.033
180
758 I I
1, 552
197, 332 270, 965 97, 767 130, 025
382, 460 366,012 393, 811 375,056 350, 435 301,497 264,633 258,494 268, W9
21 (•) I 0 (•) (•) (•) (•) (•) I (•) .w .a .M .o .a .a .M .oo .a
1
----949·' 5U~~ -----942- -----.5ii- ---i:24i- -----79.5· -·-i;ii45- --T955 ~--T47o·-
8, 102 8, 369 8, 126 7, 637 7, 630 I 7, 153 6, 813 7, 384 I 7, 708
.033
390
972
996
486,207 174,422
389,027
.040
1,805
1, 146
1, 706
497,338 224,541
466,045
. 038
2,360
1,122
3,029
354,776 123,603
544,057
0 (•) ' 1 . 42 . m : . 52
"3;455- ---3;iiio·l---2;o53 9, 246 9, 857 I 10, 577
'December 1 estimate. • No quotation. • Final estimate for the crop year.
tFor comparable monthly figures beginning 1918, see table 13, p. 17 of the March 1939 issue. *New series. Data for price of milk beginning 1922 and average price or corn beginning 1918 appear in tables 38 and 39, p. 18 of the August 19.39 Smvey. tRevised series. For revisions in condensed and evaporated milk production in 1937, seep, 41 of the December 1938 Survey; 1938 revisions not shown in the December
1039 Survey will appear in a subsequent issue. Revisions for 1938 for carlot shipments not shown in the December 1939 Survey will appear in a subsequent issue. §Revised series. Data revised for 1937; see tables 19 an<J 20, pp. 14 and 15 of the Aprill939 issue.

JANUARY 1940 SURVEY OF CURRENT BUSINESS 43
Monthly statistics through December 1937, to-~19391 1938 I 1939 gether with explanatory notes and references ---
1 1 1 1 1 1 1 1
tothesourcesofthedatamaybefoundinthe Novem- Novem- Decem- Janu-1 Febru- March April May June Jul Au tj Sep- Otb 1938 Supplement to the Survey ber her her ary ary Y gus tember c 0 er
---~----~----~-----~----~----~---
FOODSTUFFS AND TOBACCO-Continued
GRAINS AND GRAIN PRODUC'J's- I Continued
Wheat: Exports:
Wheat, including flour§ ...•.. thous. of bu.. 4,173 6, 917 4, 893
6, 970 12, 613 11, 946 11, 087 9, 468 14, 489 6, 033 7,414 2, 977
8, 935 5, 675 4, 629 1, 701 Wheat only§. ----------------------do.... 1, 452 4, 430 10, 217 8, 782 8, 487 5, 874 10, 672 3, 929 5, 903 2, 530
Prices, wholesale: No.1, Dark Northern Spring,
(Minneapolis) ............... dol. per bu.. . 01 No.2, Red Winter (St. Louis) ...••.• do.... . 02 No.2. Hard Winter (K. C.) •........ do.... . 86 Weighted av .• 6 markets, all grades .. do.... . 88
Production (crop est.), totaL •.. thous. of bu .. '754, 971 Spring wheat ...•.......•..•......... do .... '191, 540 Winter wheat ________________________ do .... '563, 431
Receipts, principal markets ...•........ do.... 12,190 Shipments, principal markets .•...•.... do.... 14,936 Stocks, end of mo. world est ....••••.... do.... (1)
Canada (Canadian wheat) ...••.•••.• do.... 315,296 United States. total• ............•.... do .... --------
CommerciaL __ --------------------do.... 141,986 Country mills and elevators• ______ do .... ---------Merchant mills• -------------------do .... ---------On farms• ___ ----------------------do ...• ---------
Wheatflour: Consumption (Russell) ________ thous. of bbL.----- .... Exports§ ... _____ . _________________ ..... do .. __ 579 Grindings of wheat ............. thous. of bu .. -----.---Prices, wholesale: 1
Standard patents (Mpls.) ___ .. dol. per bbL. 1
Winter, strai~ht (Kansas City) ...•.. do .... Production:
5. 70 4.28
Flour, actual (Census) ....... thous. of bbL. --- ...... . Operations, percent of capacity ___________ ---------
Flour (Russell) .............. thous. of bbL.--- -----Offal (Census) ................ thous. of lb .. ----- ---
Stocks, total, end of month (computed by Russell). __________________ thous. or bbL. .. ----
Held by mills (Census) ....••...•.... do .... -----
LIVESTOCK I Cattle and calves: 'I
Receipts, principal markets.thous.or animal• __ , 1, 912 Disposition: I
Local slaughter -----------------------do .... l Shipments. totaL------------------- .do .. __
Stocker and feeder .. ---------------do .... ] Prices. wholesale (Chicago): I
Beef steers• .........••..... .dol. per 100 lb .. ! Steers, corn fed._-------------- ...... do .••. 1 Calves, vealers _______________ ........ do ... .
963 973 549
9.6~ 9. 86 9. 75
H~~ I Receipts, principal markets.thous.oranimals.. 2, 847 Disposition: '
Local slaughter------------------- __ .. do .•.. Shipments, totaL_--------- ... ____ ... do ... .
Stocker and feeder ...•.............. do ... . Prices:
Wholesale, heavy (Chl.) .... dol. per 100 lb .. Hog-corn ratio•
bu. or corn per cwt. of live hogs __ Sheep and lambs:
Receipts, principal markets.thous.of animals .. Disposition:
Local slaughter ..•.............•...•.. do ... . Shipment•, totaL ....••.•.....•...... do ... .
Stocker and leeder •••...•.......... do ... . Prices, wholesale (Chicago):
Ewes .......••••.••..•••.... dol. per 100 lb .. Lambs . ___ .. _ ------------- .......... do. __ _
MEATS Total meats:
Consumption, apparent •......... mil. oflb .. . Exports• __ . _. __ ...... ----- __ . ___ ...•... do ... . Production (inspectedslaughter) •....... do ... . Stocks, cold storage, end or month ...•• do ... .
Miscellaneous meats .• ___ •........... do ... . Beef and veal:
Consumption, apparent .•••..... thous. of lb .. Exports§ ....... _______ .•••. _. ______ .•.. do ... . Price, wholesale, beer, fresh, native steers (Chica~o) ---------------------dol. per lb ..
Production (Inspected slaughter) .thous. of!b .. Stocks, beef, cold storage, end ofmo _____ do ....
Lamb and mutton: Consumption, apparent .•...........•.. do ... . Production (inspected slaughter) ..•••.. do ... . Stocks, cold storage, endofmonth ...•..• do ... .
Pork (including lard): ConsumptiOn, apparent ________________ do .•.. Exports, totaL ••.• ------------- ____ .... do ....
Lardt .. ------------------------------do .•.. Prices, wholesale:
Hams, smoked (Chicago) .....•. dol. per lb .. Lard, In tierces:
Prime, contract (N. Y.) ____________ do ... . Refined (Chicago) .•••....•••...•..• do ... .
2,177 665 40
5. 95
12.5
1, 907
944 984 429
4.39 8.84
1,159 37
1, 285 561 69
457,978 1, 269
.150 472,202 66, 92b
58.388 59,088 4,190
642, 168 33,008 25,706
. 185
.067
.078
• 73 . 77 .66 . 70 .63 .67 .65 . 68
--------- •931, 702 -------- •243, 569 -------- •688, 133 19, 110 14, 892 21, 696 18, 252
439, 820 484, 150 162, 375 161, 1R1 -------- 656,242 136, 204 128, 7 48 -------- 138, 598
--------- 107,706 ---------· 281,190
9, 445 431
40,324
4. 91 3.80
9, 22G 540
38, 357
5. 06 3. 84
.80
. 73
.71 • 73
. 78
.73
.60
.71
ll, 900 9, 512 12, 758 9, 251
467, 360 412, 390 150,376 144,817
108, 936 05, 4 7 4
8, 350 510
38,755
5.10 3.82
'9, 089 673
35, 447
4. 95 3. 66
. 77
. 73
. 69
.71
13,748 11,113
379,820 139,071 446, 104 82,687 91.846 82,481
189, 090
8,689 553
41,068
4. 79 3. 54
. 78
. 76
. 70
.72
16,000 11,174
3.o9, 730 134, 085
8, 201 765
37,698
4. 87 3.47
8, 838 8, 416 8, 476 7, 757 8, 951 56.0
9,142 730,612
8, 244 59. 2 54. 0 57. 2 57. 0 55.7
8,916 665,468
9, 286 9, 266 8, 711 8, 512 704,995 672, 015 681, 624 625, 888
6, 200
1,900
989 927 473
10.03 10.75 10.29
2, 607
1, 903 691
33
7.65
18.1
1, 945
996 968 415
3. 73 8.38
1,092 33
1,177 484 54
461, 485 1,192
5, 700 4, 317
1, 465
843 632 309
10.13 11.60 9. 63
2, 570
1, 848 726 43
7. 17
16.0
1, 552
890 673 155
3. 78 8. 59
1,040 34
1, 227 671
72
415,788 1, 795
.172 .170 467, 980 416, 041
52, 637 58, 187
56,375 56,997 3,171
574, 142 27,075 16,009
.200
.077
.090
.14,281
.14,684 3, 541
570,273 27,258 19,198
.200
.074
.086
5, 550
1, 635
975 608 259
10.35 11.59 10.38
2, 699
1,928 7.14
41
7.18
15.4
1, 746
1,063 677 113
3. 97 8.63
1,057 42
1,202 791
76
434,239 1,105
.172 425,605 53, 126
61,709 61, 123 2,025
561,329 36,966 28,520
.200
.073
.084
5, 300
1, 294
807 496 213
10.17 11.36 11. 19
1, 971
1, 398 566 38
7.66
16.4
1, 546
953 595 82
4. 38 8. 54
5,200 3, 86-5
1, 542
952 579 253
10.29 II. 44 10.34
2, 205
1, 654 547 45
7.30
16.0
1, 766
1, 046 720 110
4. 78 8. 66
5,150
1, 467
869 581 2R3
10.02 11.22 9. 56
1, 996
1. 509 485
44
6. 91
14.5
1, 993
900 1,082
251
5.66 9.36
899 1, 064 943 37 39 30
927 1, 067 955 784 758 758 68 63 63
377, 363 450, 183 402, 876 841 1, 047 710
.177 . 173 .168 368, 125 439, 576 390, 623 46, 404 40, 970 36, 866
58,558 58,452 2, 773
463,239 32,727 24,483
• 200
.073
.081
63,777 63,451
2, 412
51,198 50,790
1, 956
550, 289 488, 486 33, 022 25, 591 22, 157 17, 531
.200
.070
.081
.203
.067
.077
.86
.83
. 76
.80
25,525 16, 851
319,890 112,987
8, 549 812
39,066
5.23 3.60
I .84 .73 .71 . 75
44,016 14,423
318,340 98,123
295,492 81,334 38,291 85,020 90,838
8, 783 448
38,927
5.16 3.58
8, 516 8, 440 55.4 55.0
'9, 31! '9, 293 693, 372 699, 737
5,100
1, 737
1,068 647 240
9.68 10.59 9. 68
2,410
1,822 575 48
6. 68
13.2
1,951
1,070 884 235
4. 60 9.38
1, 105 42
1,127 761
65
5,000 3,641
1,476
934 546 187
9.22 9.66 9.13
2,105
1, 535 560 43
6.39
11.9
1, 711
913 804 167
2. 97 9.25
1,073 43
1,083 749 68
. 78
.69
.67
.68
99,006 30,840
(I) 89,281
. 76
.69
.65
.72
43,924 22, 791
(1) 135,793
149, 372 166, 289
8, 003 944
38,833
4. 74 3. 41
9, 552 645
43,746
4. 90 3. 36
. 93
.88
.86
.90
38,995 24,495
(1) 274, 841 794,074 161,987 162,542 137, 332 332,213
11,279 669
51,101
5. 76 4.36
.88
.88
.83
.86
19,799 16,856 (')
335,445
-i5i;oi5
9, 946 623
43,025
5.58 4.20
8, 432 9, 522 11, 191 9, 428 57. 4 60. 3 75.9 61. 5
'9, 063 '10. 347 ' 12, 148 ' 10, 779 689, 557 772, 787 890, 697 752,851
5, 150 5, 300
1,667
971 664 2421
9.30 9. 53 9. 68
1, 948
1, 394 546 35
6. 03
13.1
2,042
983 1,040
261
3.17 8.85
1, 053 48
1, 033 699 69
1, 764
972 795 375
9.09 9.26
10.03
2, 007
1, 451 550
36
5. 75
12.0
2, 392
968 1, 419
504
3. 38 7.93
1, 138 39
1,037 573 66
5, 500 4,058
2, 1!7
1,019 1, 074
546
10.23 10.68 11.09
1, 995
1, 458 534 39
7. 54
12.6
2, 625
1,064 1, 564
613
3. 59 9. 07
1,132 40
1,065 478 59
5, 710
2, 438
1,124 1, 270
743
9.87 10.07 10.78
2, 458
1 82 '617
37
6.97
13.7
2, 607
1, 075 1, 520
603
3. 85 9. 00
1,170 31
1,162 452
58
479, 125 452, 721 452, 940 476, 716 503, 357 '494, 208 ~~ ~ill ~~ ~M ~00 ~~
• 166 .159 .156 . 151 . 166 .152 499,306 49,242
466, 306 444, 337 445, 800 469, 534 495, 867 34, 650 33, 591 33, 456 33, 027 36, 917
55,539 55,398 1, 791
570,476 36,990 25,303
.207
.069
.079
53,193 53,238 1,837
566,926 37,403 22,682
.206
.065
.075
53,010 53,073
1,893
547,518 42,223 25,339
.203
.061
.071
56,028 56,599
2, 459
605,525 33,028 22,848
. 203
.060 I
.075 I
62, 517 ' 61, 603 63, 030 62, 147 2, 965 3, 499
566, 582 '613, 248 33, 848 2.5, 700 24, 693 19,001
. 200
. 083
.104
. 209
.071
. 083
~::;i~~~ies ' Decem berT !_estimate. • Final estiJl!ate for the crop year. t Temporarily discontinued. p. 18 or the June 19{~8~~;a on Umted States wheat stocks b~gtl)nlng 1923, see t~ble 29, p. 17 of the June 1939 Survey. For data on hog-corn ratio beginning 1913, see table 33, 40, page 1_8 of the_ August ~~~9 i;;~!~ on exports of meats hPgmnmg 1913 appear m table 46, p. 16 of the November 1939lssue. For price of beef steers beginning 1913, see table
t Revtsed senos. Data on exports f 1 d · d · · §Revised series Data re . · d, 0
193a7~ revtse for periOd 1913-37 t? mclude neutral lard; revisions are shown in table 47 p. 16 of the November 1939lssne. · nse .or , see table 19, p. 14 of the Aprtll939 Survey.

44 SUllVEY OF CURRENT BUSINESS JA~t'ARY 1940
gether with explanatory notes and references --- i-::~-~=-~-~---;----.--~~=----.-----.----;------Monthly statistics through December 1937, to- II 19391 1938 I 1939
to the sow-ces of the data may be found in the IJ Novcm- Novern-1' Decem-~ Janu- I Febru-1 March I April I May I June I Jul" I August I teSmcibJ-er \october 1938 Supplement to the Survey ber ber ber ary ary ' _
FOODSTUFFS AND TOBACCO-Continued
MEATS-Continued
Pork (includin~ lard)-Continued, Production (inspected slaughter) total
• thous. oflb .. Lard. __ •••..... _______ • _____________ . do .. __
Stocks, cold •torage, end of month ..... do .•.. Fresh and cured ..•....•............. do .... Lard. __ .. ------ __ --------·------- ___ .do •• __
7.53,.188 137. ;24 420,897 332,357 88,540
POULTRY AND EGGS Poultry:
Receipts, fi markets _____________ thous. of lb.. 81,135 Stocks, cold storage, end ofmonth ..... do ••.. 12i,030
Eggs: Receipts. 5 markets _________ thous. of <'8Ses __ 608 Storks. cold storage, end of month:
SheiJ. ______________________ thous. of csses.. 1, 580 Frozen ..••• ----------------- __ thous. of lb.. 87, i89
Co('Oa: TROPICAL PRODUCTS Imports ..... ----------------------long tons.. 28,366 Price, spot, Accra (N.Y.) ________ dol. per lb .. ---------
Co1'f~e: CleBrRnces from Brazil, totaLthous. of bags __
To United States. __ . ------·---------do ___ _ Imports Into Unitell States ............. do .•..
I, 596 862
1,560 Price, wholesale. Rio No.7 (N.Y.)
dol. per lh__ • 054 Receipts at ports. Brszll .•.•.. thous of hags__ 1, 712 Visible supply, total. excl. Interior of Bra• II
thous. of hags __ ---------United States ________________________ do.... 930
Sugar: Raw sugar:
Cuba: Stocks, total, end of month
tho us. of Spanish tons __ 804 United States:
Meltlngs 8 ports .............. long tons__ 247,328 Price, wholesale, 96° centrifugal (N. Y.)
dol. per lb .. Rereipts:
From Hawaii and Puerto Rlro long tons ..
Importst .•••••..••.•... _______ •...•. do ___ _ Storks at refineries. end of month. do ___ _
Refined sugar (United States):
• 030
122,525 65,188
365,491
Exports ___________________ ------- ___ .do ____ ---------Price. retail, ~fin. fN. Y.) .... dol. per lb.. .056 Price. wholesale, gran. (N. Y.) ...••• do.... .048 Receipts:
From Hawaii & Puerto Rlco .. lon!' tons ..
r m/r~r~sf~,-h~t~ ~~~~~~~~~~~-~ ~ ~~~~~~ gg ~~~~ ~: From Philippine Islandst. •••.... do ....•.
Tea: Imports ____________________ ..... thous. of lb .. Price, wholesale, Formosa, fine (N.Y.)
dol. per lb .. Stocks In the United Kingdom .. thous. of lb ..
MISCELLANEOUS FOOD PRODUCTS
1, 284 18, 588 13,948 4, 153
9, 953
(1) (1)
Candy, sales by manufacturerst.thous. of dol.. 24,966 Fish:
Landings, fresh fish, prln. ports.thous. oflb__ 35,848 Salmon, canned, shipments ............ cases __ ---------Stocks, cold storage, total, 15th of month
thous. of lb.. 84,506 Gelatin, edible:
Monthly report for 7 companies: Prortuction ... _______ . ______ ...•.•. _.do. __ _ Shipments ..•...•.. ____ ...•....•..... do. __ . Stocks._ ..... ______ ----------------- .do ....
Quarterly report for 11 companies:
1, 558 1, 194 5, 335
Prortuction .•• _----------------------do .... ---------Stocks .... ----------- ____ ---------- •. do .... ---------
Leaf: TOBACCO
fl51, 636 105. 533 3i3, 641 299, 142 74,499
74,802 118,088
574
1, 439 78,091
8. 930 .0480
1, 218 775
1,386
.055 1, 421
7,409 858
784
292,036
.030
56, 139 104,365 215,388
5,003 .050 .045
I, 339 6,805
802 2,532
8,404
.280 231,628
23,656
34,701 539,699
93,024
1,364 1, 226 5, 317
Exports§ .. __ ------------------- .thous. oflb__ 30,457 55,167 Imports, incl. scrap§ ___________________ do .... l 8,425 5,641 Production (crop estimate) ________ mil. of lb.. '1, 770 ---------Stocks. total, incl. Imported types, end of
quarter ________________________ mil. oflb .. --------- ---------Flue-cured, fire-cured, and air-cured .. do .... ---------Cigar types. _____ ...... --------------do .... ---------
Manufactured prorlucts:
756,532 134,776 537. 525 430. 104 107,421
65, 85-' 139, 108
760
302 62,903
15,887 .0462
1, 451 785
1,325
.053 1, 700
7,836 914
750
247,226
.029
98. 03R 43,318
194,732
4, 472 .05C .044
9. 47P 2, 748
328 1, 014
7,603
.280 243,223
21,243
27,112 716,458
90,711
1, 518 1, 242 5, 593
5,234 8,004
54, 217 4, 797
• 1, 376
2, 343 1, 946
298
715,179 132.533 fl5R, 4~9 526, 411 132,078
23.286 133, 531
1,041
136 50,345
18,143 .0437
1,191 662
1, 423
.053 1. 295
7, 816 855
725
261,257
.029
62.317 60,868
199,056
4,018 .050 .042
4. 1R3 2, 613 1, 643
551
7,698
.280 252,634
17, 717
23, OiO 524,250
77,088
1,554 1, 301 5,845
28,013 5,820
500, 7~91563, 699 90. 03R 99, 442
667.419 652,456 542. 138 523. 204 125, 281 129, 252
16.744 116,229
989
165 44,476
33. 297 .0460
1, 222 697
1,086
.0.12 1, 033
7, 740 860
1, 407
247, 112
.028
122, 9flQ 107,931 241,039
5, 344 .049 .0421
17, 7::t4 8, 083 5, 223 2, 786
7, 931
17,825 90,987
1, 649
1,105 50,465
43, i92 .0468
1, 305 694
1, 497
. 051 1, 279
7, 757 867
2, 580
371,979
.028
IR3, R>O 205,908 236, 666
5, 532 .049 .044
16, flfi2 22,782 18,922 3, 690
8, 5i6
. 280 . 280 234, 468 205, 084
18, 195
25, 652 487, 357
62,253
1, 437 1, 335 5,948
37,502 5,492
18,886
30,983 525,662
40,423
1, 538 1, 557 5, 929
6,340 8,909
44,333 6, 592
2, 367 1, 912
334
513,150 91,858
656,746 527.213 129,533
lR, 217 70,568
2,065
3.357 88,867
32,052 .0448
1, 232 610
1,017
.051 1, 341
7, 916 805
2, 621
401,523
.029
IR4, 440 180,469 271, 306
3,641 . 049 .044
1R,076 19,615 10,706 8, 829
6, 866
. 280 182,681
16,223
41,554 524,393
29,756
1, 546 1,178 6, 296
21, 777 4, 783
605,478 106,945 659.587 520, 251 139,336
24,427 e6, 796
2,311
5,880 117,900
28,889 .0446
1,638 767
1,187
.052 1,498
8,249 860
2,263
328,213
.029
585,804 !06, 218 645, li3 496, 796 148,377
28,494 67,470
1,589
6, 977 141,456
14, 130 .0436
1, 563 774
1,302
.053 1,290
7, 960 857
2, 0381
304,631
. 029
137,011 127. 764 152,564 217,426 357, 250 382, 443
14, 529 .050 .044
23,352 31,799 19,384 11,015
8, 7S5
.280 168,308
15,169
43,546 257,564
35,295
1, 641 1,418 6,520
24,502 7, 765
6, 557 . 050 . 044
9, 799 38,839 25,303
11, 1921
6, 724
.280 I 161, 255
I 12,696 I
38,323 221, 785
46,965
1, 444 1, 468 6, 496
6,323 9, 478
17,146 6,865
2,137 1, 705
318
534,284 94,453
594,581 454,766 139, 815
27,712 64,918
1, 161
7,024 144, 359
16,093 . 0433
1, 217 724
1,055
. 051 1, 616
8,079 781
1, 846
362, 129
. 029
510,693 91,676
471,310 360,932 110,378
25,429 62,870
967
6, 598 135,928
23,311 .0438
1, 357 731
1,056
.051 1, 267
8,017 846
1,570
349,987
. 029
115, 750 84, 140 281, 731 250, 265 351, 005 293, 908
8, 723 .050 • 043
3, 846 34, 511 32,8.}5
1, 557
6, 798
. 280 158,739
11,185
41,665 211,672
59,940
15,940 6, 463
3, 778 • 050 .043
2, 527 41,251 36,430 4,482
7, 499
(1) (1)
15,256
45,789
72,765
33,773 7, 541
506,341 88,611
379,020 300, 226 78,794
600,&05 102,914
•34', 3Y3 '272, 655 , 68,738
29, 985 37' 224 63, 164 , 79, 228
788 619
5, 430 , 3, 519 121,471 , 104, 282
13,707 .0610
1, 632 917
1,095
.052 1,523
7,918 643
1, 294
376,814
. 037
27,215 .0537
2,088 1, 317 1,469
.053 2,058
8, 334 846
1,082
337, 292
. 034
163.801 137, 264 306, 639 171,338 280, 086 305, 164
8,997 .064 .056
10,726 63,979 59,120 4, 710
7,307
(1) (1)
24, 272
39,208
18,995 .060 .052
3, 550 16, 045 12,696 3,288
7, 653
(1) (I)
23,442
38,406
79, 383 I · 83, 296
978 1, 387 5,080
4,114 7, 974
45, 576 6,491
2, 216 1,819
289
1,400 1, 509 4, 970
28,532 6, 724
Consumption (tax paid withdrawals): Smallcigarettes .................. millions .. 14,461 13,506 12,656 13,863 11,782 14,244 12,269 15,445 16,595 14,260 16,571 14,790 15,384 Large rigars ____________________ thousands.. 505,098 515,859 333,982 349,497 361,233 437,584 403,042 470,580 486,721 427,533 500,807 486,865 551,230 Manufactured tobacco and snuff
. t § ththous. ofdlb.- 42686, ~3666 53108, 994403 5277, !2106 42561,919144 62253, 48"8.59 5269, 594 25,628 59302,489951 59330,211087 6~~· ~4966 63431,929311 731~· 537661 4f~.· :? Exports, c1gare tes -------------- ousan s.. •" , 6,- , , 2,225 424,857 , , • , , Production, manufactured tobacco: 23, 450 29 823 26, 326
T~hie -cutch-ewing·_-_-~~=====~=~~-o-~~-.d~~~:: ::::~:::: 28, ~g 24, ~~g 23, ~~g 22, m 26,~~~ 22, ~~~ 127, ~~ 27, m 400 '408 348 Plug _______________________________ do .•.. _________ 4,266 4,290 3,419 4,145 4,322 4,076 4,974 g~~ g~~ ~·~~~ i:m ~~~~i~~~~:~~--~~:~=~=~::::::=~:~~:~~::=: ::::::::: 1t ~g~ ~t l~& ~~: i;~ 1 ~~: m ~u~f ~~: ~~~ 1~: ~~~ 17.979 1 15,261 19:357 17.503 Twist ....... : ______________________ do .••. --------- 415 440 400 4il 491 426 534 484 405 560
482
, Revised. 'December 1 estimate. • Final estimate for the crop year. 1 Temporarily discontinued; data not availabl~ since the outb:eak 01
b':earuent t Revised series. Data on imports of raw and refined sugar revised begmnmg 1913; data not shown on p. 44 of the November 193D Sun ey wIll appear Ill a su • q
IssueiFor monthly data heginning 1928, corresponding with monthly averages for 1928-33 ~hown In the 1938 Supplement, see table 7, P 17, of the January 1939 issue. &'RPd~Prl seri~~ Datfl rPt"i<:Prl for Htn: <:pp tfl.hlP~ Hl anrl 'lO. PP 14 fl.nrl Ifi of the April Hl~9t~$11P . . ~ .
•New series. Data on total imports of refined sugar beginning 1913 not shown on p. 44 of the December 1939 Survey Will appear m a subsequent Issue.

.JANUARY 19-!0 SURVEY OF CURRENT BUSINESS 45
gether with explanatory notes and references --------,------ ------.----,------,----.---,-----,-----:-----,----.,---Monthly statistics through December 1937, to-~19391 1938 I 1939
to the sources of the data may be found in the Noyem- Novem-1 Decem- I Janu- I Febru- I M h I A .1 I May I June I July I August 1
1
Sepbteerm-J Obcetro-1938 Supplement to the Survey ber ber ber ary ary ! arc pn
----~--~-----~---~----~--~----~--~----~--~----~---
FOODSTUFFS AND TOBACCO-Continued
TOR ACCO-Continued I troducts-Continued. I
ale: I -~---_-_-_-_-: ~---_-_-_-_-_--------~~ ~·- ~)~~- !i~~ ~ ~
Manufactured ~ Prices, wholes
Cigarettes. Cigars ____ _
I
l COAL Anthracite:
Exports§ _________________ thous. ollong tons .. Prices, composite, chestnut:
Retail __________________ dol. per short ton .. Wholesale ..... _. __ . _____________ . ___ .do. ___
Production ______________ thous. of short tons._ Shipments. __ ------------- ___________ .. do ... _ Stocks, end of month:
In producers' storage yards ........... uo .... In selected retail dealers' yards
Bituminous: number of days' supply __
Exports§. _______ ----- ___ .thous. of long tons._ Industrial consumption, total
thous. of short tons .. Beehive coke ovens. ----------- __ .... do .... Byproduct coke ovens _______________ do .... Cement mills ______________________ ... do ..... Coal-gas retorts .. ----------- _______ .. do .. ___ Electric power utilities .. _____________ do ____ Railways (class I) __ ------------._ ... do ____ Steel and rolling mills ________________ do ____ Other industrial .. __ -------------- ___ .do. ___
Other consumption: Vessels (bunker) _______ thous. of long tons .. Coal mine fueL ....... thous. of short tou, __
Prices: Retail, composite, 38 cities
dol. per short ton .. Wholesale:
Mine run, composile. ______________ do .... Prepared sizes, composite __________ do ....
Production ______________ thous. of short tons .. Stocks, industrial aud retail dealers, end of
month, totaL _______ thous. of short tons __ Industrial, totaL. _____________ . ______ do. ___
Byproduct coke ovens. ____________ do ...• Cement mills. _____________________ do ____ Coal-gas retorts._ ... ____ ----- ______ do ____ Electric power utflities _____________ do ..•• Railways (class I) __________________ do ____ Steel and rolling mills. _____________ do ____ Other industriaL .... ______________ do ____
Retail dealers, totaL _________________ do ....
COKE
Exports ______ --------. _____ thotls. of long tons._ Price, beehive, Connellsville (furnace)
Production: dol. per short ton ..
Beehivef ________________ thous. of short tons .. B yproductt ___ ..... __ •... ________ ...... do.---Petroleum coke __________________ ...... do ....
Storks, end of month: Byproduct plants, totaL .. ____________ .do ...•
At furnace plants. _____ ------- _______ do ____ At merchant plants ___________________ do ____
Petroleum coke .. ---------------------.do ____
PETROLEUM AND PRODUCTS t
Crude petroleum: Consumption (runs to stills) ... thous. of bbL. Imports§ . ___________ ---------- __ ...... do ____ Price (Kansas-Okla.) at wells ... dol. per bbl.. Production._ ---------------- .thous. of bbL. Refinery operations. ______ .. pet. of capacity __ Stocks, end of month:
California: Heavy crude and fuel. ..... thous. of bbl._ Light crude. ___________ ------ ______ do ....
East of California, totaL _____________ do ____ Refineries ___ .. ________ ------ ...... do .... Tank farms and pipe lines ......... do ....
Wells completed ___________________ number .. Refined petroleum products.
Gas and fuel oils: Consumption:
Electric power plantst _ .... thous. of bbL. Railways (class I) __________________ do. ___ Vessels (bunkP-r) __________________ do ____
Price. fuel oil (Oklahoma) ____ dol. per bbL Produrtion
Residual fuel oilt .. ________ thous. of bbL
5. 513 46.056
126
9.160 3,946 3, 329
---------
---------1, 715
---------------------------
---------
178 ---------
---------4.333 4. 428
42,835
------------------------------------
------------------
52
.5. 250
346 4,567
2, 607 836
1, 771
---------2,848 .960
------------------
---------------------------------------------
---------3,083 (!)
---------Gas oil and distillate fuels, totaL .. do .... ---------
•Revised. 1 No quotation.
I I I
I
i I I I
! I
I I I I I
I
I
5. 5131 5. 5131 .5. 5131 5. 513 5. 5131 5. 5131 5. 513 46.056 46.056 46.056 46.056 46.056 46.()56 . 46.056
I
FUELS AND BYPHODUC'I'S
! I
i 1541 1271 143 165 143 137 336
--9:713" 11.49 --------- --------- 11.35 --------- ---------9. 706 9. 731 9. 698 9.642 9.078 9.154
3,803 4, 533 4, 953 4,114 3, 604 5, 296 5,073 3, 167 3, 849 4, 047 3, 382 3, 232 4, 842 4, 206
1, 901 1,458 1,046 761 408 86 238
51 37 29 25 22 35 61
1,092 489 277 282 348 207 250
24,928 26,533 26,185 24, 183 25,786 22,390 20,518 110 123 121 Ill 107 31 39
4,622 4, 742 4, 751 4,346 4,855 1,114 3,383 441 342 212 244 368 402 416 138 144 149 137 143 131 125
3,530 3,684 3,595 3,051 3, 168 2, 827 3,032 6,604 7,161 7,149 6, 545 6, 970 6,042 5, 915
803 &17 858 759 805 823 678 8,680 9,500 9,350 8, 990 9,370 8,020 6, 930
129 81 68 921
105 88 79 265 266 261 249 259 74 122
8. 68 --------- --------- 8. 68 --------- ---------4. 299 4. 298 4. 290 4. 286 4. 283 4. 421 4. 464 4. 565 4. 557 4.544 4. 520 4. 491 4.345 4. 300
35,925 36,541 35,530 33,910 35,290 10, 747 17,880
40.817 40,720 39,720 39,887 40,505 31,746 25,413 3:l. 317 33,670 33, 270 34,087 35,225 28,226 22,613 7,173 7,462 7, 374 7,373 7,222 4,434 2, 598
346 349 350 403 414 321 275 264 252 236 220 217 179 129
8,413 8, 491 8,379 8,456 8, 760 7,642 6, 740 5, 311 5, 629 5,819 6, 736 7, 603 6,387 5,198
650 687 742 879 1,029 803 545 ll,lGO 10,800 10,370 10,020 9, 980 8,460 7,130 7, 500 7,050 6,450 5,800 5, 280 3,520 2,800
381 27 25 23 21 18 37
3. 750 3. 750 3. 750 3. 750 3. 750 3. 750 3. 750
67 76 77 71 69 20 25 3, 278 3, 363 3, 367 3,078 3, 439 2, 915 2,396
153 142 126 117 128 142 132
3. 745 3, 610 3, 330 3,116 3, 037 2, 967 2, 751 1, 307 1, 291 1, 241 1, 242 1,198 1, 091 951 2, 438 2, 319 2,089 1, 874 1,839 1. 876 1,800
678 708 717 705 694 734 716
97,309 97,964 99,614 87,797 98,917 99.303 105,755 2, 3,08 2, 678 1, 371 1, 343 1, 736 2, 788 4, 186
.960 .960 . 960 .960 .960 .960 .960 98,567 102,287 102,490 93,475 106,768 105,510 110,541
79 77 78 76 77 80 83
87.399 87,222 87,595 87,002 86,294 86,075 85,580 3.6.064 37. 193 36,927 38,323 39,383 39,699 39.878
228.741 229, 140 227, 134 227,098 229,079 230.926 230,279 40.386 41, 221 42.540 41,777 41.154 40.180 40.445
188, 3!i5 187,919 184,594 185, 321 187,925 190,746 189,834 1,572 1, 419 1,385 1, 338 1,252 1, 419 I, 656
1, 193 1, 243 I, 236 1,116 1, 134 1, 242 1, 346 4, 010 4, Ill 3. 957 3, 640 4,033 3, 890 3, 870 2, 771 2,925 2, 587 2,904 3,076 3. 341 3, 520 -925 . 925 . 895 .850 .850 .850 .850
24,573 25,197 25,800 21.476 25,040 24,750 27,022 12, 793 13,873 14,135 12,797 13,539 13, 301 12, 353
I I I
I ! I
i I
5. 5131 5. 5131 5. 513 5. 5131 5.513 46.056 46.056 46.0.';6 46.056 46.056
I I I
1941 130 I I
400 1 160 261
10.55 --------- --------- 10.64 9.148 8. 667 8. 601 8. 649 9. 031 3, 530 2, 912 3,8:l2 4, 776 '4,919 2, 959 2, 611 3,147 4, 287 4, 333
559 716 1,129 1,172 1, 219
71 61 48 47 57
984 1, 192 l, 209 1, 525 1, 746
21,521 21, 772 23,437 24,980 29,491 81 72 69 117 399
4, 361 4, 748 5,177 5, 517 6,400 530 559 547 503 526 123 124 128 130 138
3, 317 3, 541 3, 842 4,025 4, 470 5, 748 5, 903 6,075 6, 492 7,459
671 665 719 766 979 6,690 6,160 6,880 7,430 9,120
99 97 92 140 158 191 200 238 261 310
8. 29 --------- ----·--- 8. 45
4. 246 4. 243 4. 246 4. 271 4. 332 4. 238 4. 275 4. 306 4. 362 4 436
27,900 29. 135 34,688 38,150 45,950
26,991 29,725 33, 624 30,943 41,919 22,761 24,665 27,424 30,24:1 34,169
3, 548 4, 535 5, 632 6, 220 7, 250 286 342 357 399 351 170 192 229 250 274
6,695 7, 002 7,500 7, 923 8, 380 4,484 4, 242 4, 224 4, 338 5,032
518 512 542 573 642 7,060 7, 840 8, 940 10,540 12, 241) 4, 230 5,060 6, 200 6, 700 7, 750
I 43 39 661 95 71
3.750 3. 750 3. 750 3. 750 5.125
52 46 44 75 '256 3,090 3,365 3, 666 3, 904 4, 527
142 145 143 Ill 165
2,657 2, 772 2, 921 2,812 2,600 931 945 916 868 806
1, 726 1, 827 2,005 1, 945 1, 794 710 733 682 668 652
104,687 106.899 107,632 105, 505 110,980 3, 279 3, 061 2. 942 3, 235 3,093 -960 -960 .885 . 960 .960
104,607 110, 937 80,865 108, 168 114, 198 85 84 84 85 86
s2, 927 I 8S, 049 85.655 84.039 82,718 38,902 38.427 38.072 37. 372 35,533
226, 4(\2 223, 558 192.985 189.341 187.579 41,463 41,817 37.441 35.781 36,922
184,999 181, 741 155, 544 153, 560 150,657 1, 608 1, 641 1, 561 1, 652 1, 786
!: ggg 1-- 4;65o 1, 354 1, 557 1, 668 3, 999 4, 050 4, 014 3, 343 3, 207 3,026 3. 061
I 2, 254
.850 . 850 _ 85o I (!) (1)
I 24,836 25,644 25.299 I 26.302 I 27,594 13,530 12,688 13,246 12,975 15,017
tRevised series. Petroleum and products revised for 1937; see table 9, p. 15 of the March 1939 Survey. Revisions for 1938, which are minor, will appear in the 1940 Supplement. Beehive and by-product coke production revised for 1937; see p. 45 of the December 1938 Survey. Gas and fuel oils, consumption in electric power plants, revised for 1938: seep. 4.<; of the Jnne 19~9 Survey
§Revised series. Data for 1937 revised: see tables 19 and 20. pp. 14 and 15 of the April1939 Survey.

46 SURVEY OF CURRENT BUSINESS JANUARY 19-10
gether with explanatory notes and references --- ----,--- ------,,-----,.----,---.....,----.,.-----,----,-----,-----,---Monthly statistics through December 1937, to-~1S391 1938 I 1939
lo the sources of the data may be found in the Novem- Novem-1 Decem- Janu- I FeLru-1 March I April I May I June I Jul" I August I teSmepbe: r ,. Octo her 1938 Supplement to the Survey ber ber ber ary ary J
FUELS AND BYPRODUCTS-Continued
PETROLEUM AND PRODUCTSt-Con.
I Refined petroleum products-Continued. Gas an<l fuel oils-Continued.
Storlrs, end of month: Residual fuel oil, east of California
thous. of bbL --------- 30,935 26,991 24.309 21,952 19, 288 19, 534 21,397 22,480 25,025 Gas oil and distillate fuels, totaL .. do .... --------- 32,069 27,873 24, 550 21,731 20,115 21,058 22,088 25,659 27,581
Motor fnel·~ Demand, domestic .•••••.•.. thous. of bbL. --------- 44,991 41,619 37, 7f>7 31,595 42,520 43, 977 49,547 49,812 50,508 Prodnctioo, totaL ••••.•............. do ____ --------- 48,201 48, 02~ 49,120 43,409 48,367 48,837 51, 384 50,861 51,896
Benzol. ___ -------------------------do ____ --------- 181 186 185 170 192 1fi2 130 174 191 Straight run gasoline _______________ do ____ --------- 20,397 20. 794 21,125 18, 455 20,663 20,922 22, 767 21, 782 22,502 Cracked gasoline _________________ . .do .. __ --------- 23,379 22.701 23,MG 21,037 23, 2~0 23, -'21 24,207 24,810 25,028 Natural gasoline. __ --------------·-do ____ --------- 4, 244 4, 345 4, 264 3, 747 4, 232 4, 232 4, 280 4,095 4,175
Natural gasoline blended _________ do ____ --------- 4, 222 4, 2R5 3, 637 3, 229 3, 243 2. 983 2, 646 2, 682 2, 909 Exports_-·---- ________________ .•.•.. .do .•.. 2, 348 3, 205 4, 607 2, 764 2, 569 3, 523 2, 900 3,915 3,884 2, 987
Gasoline:, Price, wholesale, tank wagon (N.Y.)
dol. per gnL .125 .124 .119 .119 .119 .118 . 114 .118 .111 .107 Price, wholesale, refinin~ (Okla.) _____ do ____ . 052 .046 . 04~ .041 .042 . 04.1 . 047 .049 .050 .050 Price, retail, service stations, 50 cities_ do ____ --------- .133 .134 .133 .133 .133 .134 .135 .136 ---2;ii2" Retail distr!butlont ___________ .. mil, of gaL. 1, 762 1, 745 1, 548 1, 427 1, 734 1, 796 2,042 2, 006 Stocks, end of month:
Finished gasoline, totaL ... thous. of bbL --------- M,083 M,949 73,817 79,691 81, 189 81.623 78,342 74,395 71,824 At refineries. ---------------------do ____ 39,376 41, 805 49,419 54, 589 55, 464 55,172 52,076 47,972 44, 196
Natural gasollne ___________________ do _____ ------- 5, 742 4,830 4, f>47 4, 708 4, 721 5, 484 6, 212 6, 749 7,123 Kerosene:
Consumption, domestic ____________ _do ____ --- 5, 368 6, 813 5, 980 5, 901 5, 201 5,042 4. 368 3, 570 3, 710 Exports§________________ _ _________ do ____ 563 323 783 776 515 523 691 631 460 753 Pri!'e, wholesale, water white 47°,refinery
(Pennsylvania). _____________ dol. per ~aL. .050 ,OliO . 040 .049 .052 . 053 .053 .053 .053 . 051 Production ___________________ thom. of bbL. --------- 5, 419 5, 739 5, 702 5.174 5, 900 5,813 5, 909 5, 439 5, 390 Stocks, refinery, end of month. ________ do ____ --------- 9, 676 7, 799 6, 711 5, 452 5, 605 5, 663 6, 551 7,949 8, 855
Lubricants: Con~umption, domt1Stic ______________ do ____ --------- '1, 738 1, 831 1, 609 1, 653 1, 987 1, 770 2,132 1, 902 1, 982 Price, wholesale, ryl!nder. refinery (Penn-
sylvanla) ____________________ dol. per gaL. .168 .105 .105 .105 .105 . 105 . 105 .105 .105 .105 Production ___________________ thohs. of bbL. 2 .. ?3.? 2, 384 2, 527 2. 522 2,664 2, 672 2, 856 2,800 2, 755 Stocks, refinery, end of month ________ do ____ --------- 7, 817 7, 695 7, 762 7, 951 7,800 7, 886 7, 630 7,427 7, 179
Asphalt· Imports§ ____ -------- ___________ short tons .. 3, 455 3, 461 2.078 2. 869 9, 662 3, 232 l, 521 2, 505 3,024 1, 726 Production ___________________________ do ____ 322,700 242.400 244.400 189,300 308,200 374,900 477,800 48.?, 800 509,400 Stocks, refinery, end of month._ •..... do ____ --------- 447,600 480,900 532,000 572,000 650,000 688,000 672,000 642,000 596,000
Wax: Production ____________________ thous. oflb __ -------- 37,520 36,120 35,280 33, 320 44,800 35,000 34,440 39,480 28,840 Stocks, rcftnery, end of month ________ do ____ --------- 131, 772 129,340 128, f>27 117, 711 117,537 119,301 I 113,925 111,604 109,322
LEATHER AND PRODUCTS
HIDES AND SKINS
Imports, total hides an <I sklns§ ••.. thous. or lb .. 31,360 24,440 25,657 32,826 28,189 29,196 25,454 27,026 22,563 22,682 Calf and kip skins§ _____________________ do .•.. 1, 980 3,440 3,972 3, 563 2,809 2,380 2,505 1, 939 2,302 2, 685 Cattle hides§ _____ ---------- •• ··-·---·- .do •. __ 13,062 10,767 9, 588 13,528 13,200 11,771 11,374 10,388 8,034 7,128 Goatskins§. ___________ ----- ---···-··---do .• __ 4, 576 6,122 6,075 6,317 6,189 6, 769 5, 260 6, 332 5, 214 5, 236 Sheep and lambskins§ __________________ do ____ 8, 586 2,685 4,468 7,001 3,975 4,436 4,858 5,189 4, 385 4, 619
Livestock (federally inspected slaughter): Calves ____________________ thous. of animals .• 450 457 417 415 385 478 457 509 448 417 Cattle •.•. _________________ ._._. __ •• ____ do ____ 837 858 758 761 653 774 677 814 778 782 Hogs ___________ ------------------------do .••. 4,437 3, 913 4,346 4,043 2, 890 3, 229 2,931 3,416 3,185 2, 778 Sheep and lambs _______________________ do ____ 1, 469 1,453 1,347 1,456 1, 361 1,473 1, 224 I, 392 1,401 1,399
Prices, wholesale (Chicago): Hidee, Eaclrers', heavy, nativesteers.dol. per lb •• .146 .141 .123 .121 .104 .107 .097 .105 .110 .115 Calfsk ns, packers', 8 to 15 lb .•.....•.. do .•.. . 214 .163 .157 .163 .154 .154 .145 .156 .164 .161
LEATHER Exports:
Sole leather -----·-·-------------thous. of lb .. 446 42 26 6 14 92 46 82 47 53 Upper leather§ __ , ____________ thous. of sq. ft..
Production: 4,623 3, 416 3, 689 3,097 3, 492 4, 197 3, 585 3, 816 3,640 3, 428
Call and kip •• ________________ thous. of skins __ --------- 1,138 1, 284 1, 319 1,326 1, 329 1,168 1,187 1, 227 1, 064 Cattle hides _________________ thous. of hides __ 1, 787 1,884 1, 936 1, 943 1, 955 1, 672 1, 736 1, 715 1, 619 Goat and kid .....•.••...••.. thous. of skins __ --------- 2,634 3, 245 3,185 3,170 3, 623 3,463 3, 473 3, 666 3,323 Sb~ep and lamb ..••••.•.•.••••••.....•• do ____ --------- 2,872 2,899 2,899 3, 236 3,115 2, 774 3, 015 3,015 3, 096
Price•, wholesale: Sole, oak, scoured backs (Boston)
. 290 1 dol. per lb .. . 36R . 3241 . 318 • 315 . 303 1 .291 . 290 . 294 . 305 Chrome, calf, B grade, compositet
doL per sq. ft.. .453 '. 394 '.392 '.395 '. 392 '. 300 '. 390 '. 391 '' 392 '. 392 Stocks of cattle hides and leather, end of month:
TotaL ________________ thous, or equiv. hides .. --------- 13,885 13,996 13, 602 13,375 13,009 12,813 12,905 12,976 12,899 In process and finished _______________ do ____ 10,074 10,301 9,868 9, 699 9, 229 9,026 9,078 9,151 9,059 Raw ______ -----------·----·--·····---do ..•.
1
___ ------ 3,811 3,695 3, 734 3, 676 3, 780 3, 787 3, 827 3,825 3,840
LEATHER MANUFACTURES
Gloves and mittens: I
153,409 1174,9371148,420 149, 591 1184,099 Production (cut), totaL .••.•.• dozen pairs.-~--------- 162,797 135, 759 119,257 161,643 Dress and seml·dress _________________ do .•.. --------- 102,725 74, 065 63,177 93,123 103,739 81,850 88, 480 111, 927 104,988 Work __ -------------- ________________ do ••.. --------- 60,072 61,694 I 56,080 I 60, 286 71, 198 66, 570 61, Ill 72, 172 56,655
r Revised.
I I I
26,111 29,282
53,828 52,161
210 22,371 26,180 3,400 3,002 3, 580
.107
. 051
2,183
66, 44R 41,046 6,624
4, 436 802
.om fi, 783 9, ~~l
I, 963
.105 3,056 7,069
1, 670 577,300 529,500
31,080 108, 173
25,093 1, 8C,7 9, 308 5, 362 5, 370
414 823
2, 792 1, 457
.116
.160
65 2, 905
'1, 15.1 '1, 949 '3,397 r 4, 205
.305
• .392 I • 12,606 '8, 876
3, 730
I I
I I
i 26,249 26,JOg 30,018 30,951
49. 3·17 49,687 51,890 54,974
225 259 21,833 23, 611 25,700 26,623 4,132 4, 481 3, 237 4,358 3,609 2. 967
I '1141 .124 . 053 -053
-------~"!"-------
~~~I ~.:'" 41, 423 43, 516 5, 891 5,140
4, 638 J
560 !
. J50 I 5, 806 9,952
2,207
.134 2,854 6, 704
4,150 550,400 475, oou
40.320 89.584
i
24,578 1, 585
10, 611 4,013 4,807
427 880
2, 88.5 1, 635
'140 .2n
54 4,83D
1, 074 r 1, 811
3,065 , 3, 770
. ~HS
•. 4lv
r 12,.523 '8. 708 r 3,81.5
5,019 I, 089
.050 6,141 9,967
2, 656
'166 3, 575 6,639
1, 742 541,800 472,000
45,080 81,147
21,34 1, 50 8,87 5,02 4,51
8 3 3 5 7
48 89
3, 54 l, 585
.16 '24
226 5, 757
1,156 1, 924 3,697 3, 938
'374
'' 463
12,489 8, 740 3, 749
2o6, 1~4 I 201. 356 209,026 130, 500 I 130, 109 lii3, 362 75,634 t 71, 2'17 '"- 664
tJo'or petroleum and petroleum products, see note mao ked wit.h a "t" on u,4,;_ Retail distrihution of gasoline reviserl for 1937-38; data not shown on p. 46 of the June 1939 ~~~::Y will appear in a subsequent issue. Wholesale price of chrome, calf, J3 grade leather rcYise,J beginning January 1938; data not shown a Love wiil appear in a subsequent
, 'l'he gasoline statistics in the above table have been rearranged and data on the production of benzol have been added. With this series included, It Is possible to derive figures of total rnoduction of motor fuel<. as shown here. Data for l'enzol pro<iuction heu:nninrr 1925 appear in table 52, p. 18, of the November 1939 issne.
§Revised series. Data revised for 1937; see tables 19 and 20, pp, 14 and 15 or the April 193D Survey.
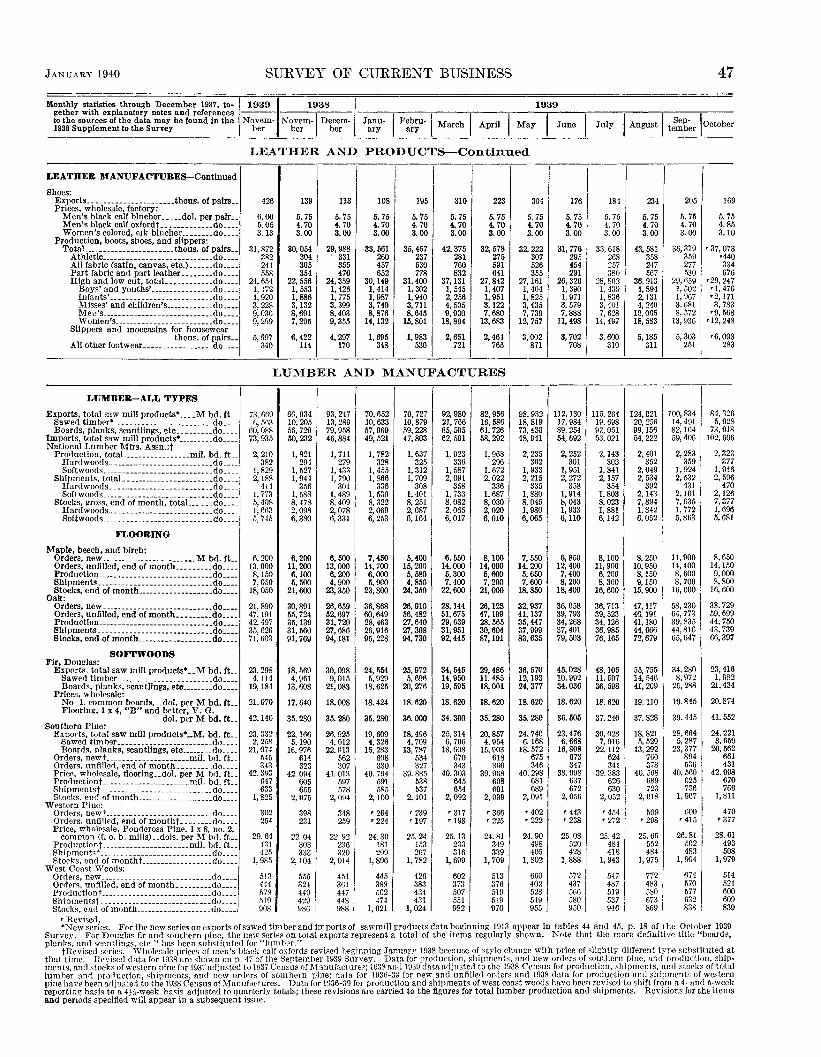
JANUARY 1940 SURVEY OF CURRENT BUSINESS 47
gether with explanatory notes and references --~ 1---.---- ------,-----,-----,,---.---=~--.-----;----.---.---Jlionthly statistics through December 1937, to-~19391 1938 I 1939
to the sources of the data may be found in the Novem- Novem-1 Decem- Janu I Febru I I I I I I I Sep I 1938 Supplement to the Survey ber ber ber ary- ary • March April May June July August temb~r October
LEATHER AND PRODUCTS-Continued I
I I LEATHER MANUFACTUREs-Continued
1081 Shoes:
Exports ______________________ thous. of pairs __ 426 139 113 195 310 223 304 Prices, wholesale, factory:
Men's black calf hlucher ..... dol. per pair .. 6.00 li. 75 li. 75 5. 75 5. 75 5. 75 5. 75 5. 75 Men's black calf oxfordt------··----.do .•.. 5.05 4. 70 4. 70 4. 70 4. 70 4. 70 4. 70 4. 70 Women's colored, elk blucher_ _______ do ..•. 3.13 3.00 3.00 3.00 3.00 3.00 3.00 3.00
Production, boots, shoes, and slippers: Tota'----·--···-···-···-----thous. of pairs .. 31,872 ao, 054 29,988 33,561 35,457 42,375 32,578 32,222
Athletic ..... _____ .. ____ .. _ ......... do ...• 382 304 331 260 237 281 275 307 All fabric (satin, canvas, etc.) ...••. do .... 241 305 355 457 530 760 591 526 Part fabric and part leather ..••.•.. do .... 558 354 476 652 778 832 641 355 High and low cut, total. .•......•.. do .... 24,654 22,556 24,359 30,149 31,400 37,131 27,842 27,161
Boys' and youths' --·-······-·-··-do .... 1, 172 1, 553 1,426 1, 414 1, 302 1, 545 1, 407 1, 404 Infants' ________ ----------·-····--do ..•. 1, 920 1,886 1, 775 1, 987 1, 940 2, 256 1, 951 I, 825 Misses' and children's ___________ .do ..•• 3, 228 3,132 3, 399 3, 740 3, 711 4, 505 3,122 3,435 M e1' 's _________ ......••..•.••••... do .•.. 9,036 8,691 8,403 8,876 8,645 9, 930 7,680 7, 739 Women's ________________________ .do .... 9, 299 7,295 9,355 14,132 15, 80I 18,894 13,683 I2, 757
Slippers and moccasins for housewear thous. of pairs .• 5, 697 6,422 4, 297 1, 695 1, 983 2, 651 2,461 3,002
All other footwear ..•............•.. do .... 340 114 170 348 530 121 I 765 871
LUMBER AND MANUFACTURES
I r
LUMBER-ALL TYPES
Exports, total saw mill products• ____ M bd. ft._ 73,669 66,934 93,247 70,652 70,727 92,980 82,956 98,932 Sawed timber• ------------------------do .••. 6, .163 10,205 13, 289 10,633 10,879 2I, 766 I6, 586 18,819 Boards, planks, scantlings, etc ......... do ____ 60,088 56,729 79,958 57,969 59,228 65,505 61,726 73,430
Imports, total saw mill products• •........ do .... 73,935 50,232 46,884 49,521 47,803 62,591 58,292 48, 941 National Lumber M!rs. Assn.:t
Prorluction. totaL •.........•.... mil. bd. ft._ 2, 210 1, 821 I, 711 1, 782 I, 637 1.923 I, 968 2, 235 Hare! woods .. __ ....•... _ ..•.... ______ do .. __ 382 294 279 328 325 336 296 302 Softwoods ________ ·-·-·-· •••••.•••.•.. do .• __ 1,829 1, 527 I, 433 I, 455 1, 3I2 1, 587 1, 672 I, 933
Shipments, total. ..............••.....• do .... 2,188 I, 944 I, 790 1, 866 I, 709 2, 091 2,022 2, 215 Hardwoods. ___ ···-·-·· __ -··- .••••••. do ____ 414 356 30I 336 308 358 336 335 Softwoods ______ .. _._ •.•.•. _. ___ ._ .•.. do ____ 1, 773 1, 588 1,489 1, 530 1, 401 1, 733 1,687 I, 880
Stocks, gross, end of month, totaL ..... do .... 5, 408 8, 478 8, 409 8, 322 8, 251 8, 082 8,030 8, 045 Hardwoods .. ____ •. ···----· .......•.. do .. __ 1, 663 2, 098 2, 078 2,069 2, 087 2, 065 2,020 I, 980 Softwoods ______ .... __ ------·-·_. ____ .do. ___ 5, 745 6, 380 6, 331 6, 253 6,I64 6, 017 6,010 6, 065
FLOORING I Maple, beech, and birch:
Orders, new ________________________ M bd. ft._ 6, 200 6,200 6,500 7,450 5,400 6, 550 8,100 7, 550 Orders, unfilled, end of month ....•.•.. do .... 13,000 11,200 13,000 I4, 700 I5, 200 I4, 000 14,000 14,200 Production ..•.. __ ...• ---·-···-····· __ •. do ••.. 8,150 o,IOO 6,200 6,000 5, 580 5,300 li,600 5, 650 Shipments_--·· ____ ··-···-··- ....••.••. do ••.. 7,050 5,500 4,900 5,900 4, 850 7, 400 7,200 7,600 Stocks, end of month ......••..•••.••••. do .... I8, 050 2I, 600 23,350 23,800 24,350 22,600 21,000 I8, 850
Oak: Orders, new_ --·-----·-·---·-·····--····do .••• 21,890 30, 89I 26,659 36,868 26,910 28,144 26,128 32,937 Orders, unfilled, end of month ••••..••• do ..•. 47,191 55,724 52,697 60,649 56,482 51,675 47,199 41, 137 Production _______ ...••...........•••••. do .•• _ 42,497 31i,I39 31, 720 28,463 27,640 29,639 28,565 35,447 Shipments _________ ---············-·· .. do ..•. 35,626 3I,560 27,686 26,916 27,308 31,951 30,604 37,999 Stocks, end of month .....••.••••....... do .•.. 71,603 01,769 94, 18I 95,228 94,730 92,445 87,I91 83,635
SOFTWOODS Fir, Douglas:
Exports, total saw mill products• .. M bd. ft.. 23,298 IS, 569 30,098 24,1i54 25,972 34,545 29,486 36,570 Sawed timber--·----- ________________ do ____ 4,114 4, 961 9,015 5, 929 5, 696 14,950 11, 485 I2, 193 Boards, planks, scantlings, Pte ________ do .... 19,184 I3, 608 21,083 18,625 20,276 19,595 18,001 24,377
Prices, wholesale: No 1. common boards, .. dol. perM bd.!t .. 21.070 I7. 640 18.008 I8. 424 18.520 I8. 620 18.620 18.620 Flooring, 1 x 4, "B" and better, V. G.
dol. p~r M bd. ft .. 42,140 35.280 35.280 35.280 36.000 34.300 35.280 35.280 Southern Pine:
Exports, total saw mill products• _M. bd. ft .. 23,332 22,166 26,925 19,609 18,496 25,314 20,857 24,740 Sawed timber·····--- __ ............... do .•.. 2, 25R 5, 190 4, 012 4, 326 4, 709 6, 706 4, 954 6,168 Boarrls, nlanks, scantlings, etc ______ .do ____ 21,074 I6, 976 22.913 15,283 13, 787 18,608 I5, 903 IS, 572
Orders, newt. .... _________________ mil. bd. ft.. 545 614 li62 608 534 670 618 675 Orders, nnfillerl, Pnd ofmonth .......... do ..... 343 323 307 330 327 343 3o0 346 PricP, whol<>sale, flooring __ dol. perM hd. ft .. 42.393 42.09-1 41.013 40.764 39.885 40.303 39.968 40.298 Productiont.-----·--·--··--------mil. bd. ft .. 647 605 597 591 538 645 608 681 Shipmcntst ____________________________ do .•.. 633 655 578 585 537 654 601 689 Stocks. end ofmonth ___________________ do .•.. 1,825
Western Pine: 2, 075 2,094 2,100 2,101 2,092 2,099 2,09I
Orrlers, newt _________ ------ ____________ do .... 302 398 348 '264 '239 '317 '366 '402 Orders, unfilled, end of montht. -------do ____ 254 23I 259 '224 '197 '198 '225 '222 Price, wholrsale, Ponrlerosa PinP, 1 x 8, no. 2,
29.64 common (f. o. b. mills) ... dols. perM hd. ft .• 22.04 22.92 24.30 25.24 25. 13 24.81 24.90 Productiont --·-·-----------------mil. bd. ft.. 4:)1 303 2:)6 lSI 153 233 349 498 Shipmentst ___ ... -----·----------------do ____ 425 333 :)20 299 2fi7 316 339 405 Storks. end of montht __________________ do .... 1, 985 2, 104 2, 014 1,896 1, 7~2 1, 699 1, 709 1, 802
West Coast Woods: Orders, new ________________ ---·-··-··--do .... 513 555 451 445 426 602 513 660 Orrlers, unfilled, end of month ......... do ....
1
444 324 361 388 383 373 376 402
§~vg~~~7~/.-::::::::::::::::::::::::::j~:::: 1 578 449 447 502 434 507 519 528 519 4291 448 474 431 551 549 549
Stocks, end of month ___________________ do .•.. 908 986 988 l,02I I, 024 982 970 955 'Revised.
176 184 234
5. 75 5. 75 li. 75 4. 70 4. 70 4. 70 3.00 3. 00 3.00
31,776 33,618 43, 581 295 268 358 454 257 247 291 380 567
26,326 28,802 36,913 1, 390 1, 439 1, 894 I, 971 I, 836 2,131 3, 579 3,10! 4, 240 7,888 7, 628 10,065
11,498 14,497 18, 583
3, 702 3, 600 5,I85 708 310 an I
112, 130 I15, 264 124,021 I7, 984 19, 6~8 20,256 89, 254 ft2, 051 99, !56 54,692 5:l, 021 54, 222
2, 252 2,143 2, 401 301 303 352
1, 95I I, 841 2,049 2, 272 2,I57 2, 534
358 354 392 1, 914 1,803 2,143 8, 043 8,023 7, 894 I, 933 I, 88I I, 842 6,110 6,142 6,052
6, 850 8,100 8, 250 I2, 400 11,900 IO, 950 7,400 6, 200 8,150 8, 200 8, 300 9,!50
18,400 I6, 600 15,900
36,058 36,713 47,117 39, 793 39, 523 46,191 34,268 34,126 41,180 37,401 36,985 44,666 79,503 76,165 72,679
45,028 48,105 55, 755 10,992 11.507 14, 546 34,036 36,598 41,209
I8. 620 18. 620 19.110
36.505 37.240 37.828
23,476 30,028 18,821 6, 668 7, 916 5, 529
16,808 22, 112 I3, 292 673 624 760 347 341 378
38.998 39.383 40. 568 637 626 689 672 630 723
2,056 2,052 2, 018
'443 '454 509 '238 "272 '208
25.08 25.42 25.65 520 484 552 428 418 484
1,888 1, 943 I, 975
572 547 772 437 487 483 566 519 5SO 580 I 537 ~~~ I 950 946
205
5. 75 4. 70 3. 00
36,379 359 277 530
29,659 1, 502 I, 967 3, 681 8, 572
13, 936
251 5, 3031
IOO, 834 I4,4Ul 82,164 59,406
2,283 359
I, 924 2,532
431 2,101 7,635 1, 772 5,863
11,900 14,400 8,600 8, 700
I6, 000
58,230 64,773 39,835 44,816 65,647
34,280 8,972
25,288
I9.845
39.445
28,664 5,287
23,377 894 536
40.560 625 736
I, 907
600 '415
26.8I 502 483
I,994
674 570 577 632 838 l
16
5. 7 5 5 0
4.8 3.1
'37,07 •44
3 0 4 6 7 6 1 3 8 8
33 67
•29, 24 •1, 47 •2,17 3, 78
•9, 56 •I2, 24
•6,09 28
3 3
84,32 6 8 8 6
5, 92 73,91
102,60
2, 323 37
1, 94 2, 59
47
7 6 6 0
2,126 7,377 1,696 5,68I
8, 650 14,150 9,000 8,800
I6, 600
38,729 59,699 44,750 ~3. 739 66,397
23,416 1,982
21,43 4
20.874
41.55
24,22
2
I 9 2 1
3,65 20,56
66 431
42.99 8 0 6 1
67 76
1, SI
47 r 37
0 7
28.61 49 50
1, 97
3 8 9
514 521 600 609 839
*New series. For the new serie< on exports of sawed timber and imports of sawmill products data beginning 1913 appear in tables 44 and 45, p. 18 of the October 1939 Survey. For Douglas fir and southern pine, the new seriee on total exports represent a total of the items regularly shown. Note that the more definitive title "boards, p1anks, anrl scantlings, etc." has been substituted for "lumhPr."
tRevised series. Wholesale prices of men's black calf oxfords revised beginning January 1938 beceuse of style change with price of slightly different type substituted at that time. Revised data for 1938 are shown on p. 47 of the September 1V39 Survey. Data for production, shipments, and new orders of southern pine, and production, shipments, anrl stocks of western pine for 1937 adjusted to 1937 Census of JV! auufacture'; 1933 and 1939 data adjusted to the 1938 Census for production, shipments, an<l stocks of total lumher and pro,luction, shipments, and new orders of southern pine; data for 1936-39 for new and unfilled orders and 1938 data for production anrl shipments of western pine ha,·e been arljnsterl to the 1938 Census of Manufactures. Data for 1936-39 for production and shipments of west coast woods have been revised to shift from a 4- and 5-week report in<; basis to a 4~:\-week basis adjusted to quarterly totals; these revisions are carried to the figures for total lumber production and shipments. Revisions for the items and periods specified will appear in a subsequent issue.

48 SURVEY OF CuRHE~T BUSINESS JANUARY 1940
Monthly statistics through December 1937, to-~19391 193S I l9:!9 gether with explanatory notes and reft::rences --- · I
I Febru- i I I I
I I S0p- I to the sources of the data may be found in the Novcm- \Tovem-( Decem- i Janu- :March April l\fay J•me July 1938 Supplement to the Survey b0r her 1 her r.ry ary i I
Au~ust I tember !October
LUMBER A~D :\IA~U FACT URES-Continuell
SOFTWOODS-Continued
Redwood, Cali!ornia: I Orders, new ________________ M bel. ft._ 22,005 2!i, ~~9 22, 134 ~4. 270 20.875 32,098 26, ~87 26,846 24,498 23, 168 32,085 39,727 '30, 782 Orders, unfilled, end or month __________ do ____
1
:H, 44,; 2~ 6\14 2.1. 3i0 34, 562 30,6H 32, ·lR5 ~9. 676 28.181 24, ;,53 28, 377 28,404 41,027 ' 39 092 Prod uctinn ___________ . _ _ ___ .. _-·· ______ do ____ 31, 20! :l:J, lflfi 27, 2Rl '2.~. 2fil 2G, ~72 2S, 585 27. 9:l0 31,614 28, 262 25, -!21 32,989 30,295 - 33,358 Shipments _________ ----------- _______ do ____ , 28, 010 '25. 02q HJ.r61 :~:), Rll ~·- 2-l:l
30.822 zg. uuo 27,806 27, 4C9 2~. 497 32,405 26, 772 '32, 603 Stucks, end of month ____________________ do ____ ! 2l)S. 007 :m-t. 3.;~, 313. cc,7 'W9, 310 307, 494 :JOO, 378 2\18,052 299,887 I 295, 551 2913, 426 298,707 299, 3581' 296, 462
FURNITURE I I All districts: . I i
Plant operatlOns ________ percent of normaL.! 67.0 :;g 0 58.0 56.0 56.0 '57.0 53.0 53.o 1 50.0 51.0 59.0 63.0 66.0 Gran<l Rapids district: I
Orders: ' Canceled __________ percent of new orders .. 7.0 6.0 7. 0 4. 0 5.0 5. 0 6.0 7.0 2.0 4.0 3.0 3.0 5.0 New ............ no. of days' production .. 23 19 12 19 14 14 10 11 25 16 20 23 26 Unfilled, end of month ............ do .... 35 18 13 21 19 16 13 13 28 30 30 31 35
Plant operations ........ pcrcent of normaL. 65.0 61.0 62.0 58.0 53.0 53.0 42.0 47.0 47.0 50.0 56.0 56ig I 63.0 Shipments_ .. ____ no. of days' production .. 20 15 13 12 13 15 12 11 13 13 18 21
Prices, wholesale: 79.3 I Beds, wooden .. _________________ 1926=100 .. 77.9 77.6 77.6 77.6 77.6 77.6 77.6 77.6 77.6 78.1 78. 1 77.9
Dining-room chairs, set or6 __________ do .... 102.3 102. 3 I 102.3 102.3 102.3 102.3 102.3 102.3 102.3 102.3 102.3 102. 3 102.3 Kitchen cabinets ..... ________________ do .... 88.1
87.61 87.6
88.1 I 88. 1 88. 1 88.1 88.1 88. 1 I 88.1 88.1 88.1 88.1 Living-room davenports ______________ do .... 87.2 87.2 87.2 87.2 87.2 87.2 87.2 87.2 87. 2 87.2 I 87.2 87.2 87.2
Steel furniture (see Iron and Steel Section). I ! I
J'IIETALS AND MANUFACTURES ------------
I I I IRON AND STEEL i
359, 690 14 74, 360 1394, 008 Foreign trade:
Exports (domestic) total§ __________ long tons .. --------- 469, 5961490, 095 362,672 532,641 588,856 513,664 477,078 575,613 591,856 Scrap .. _ ...... --------------------- .. do ____ 273,440 323, 691 227,884 224, 913 312,262 240, 124 384,881 398, 888 350,066 291,896 330.680 336, 775
Imports, total i---. ___ .. ______ . ________ .do._ .. 15, 216 27,627 2S. 767 27,664 19,149 25, 369 44,083 28,142 32, .oR7 30,851 28,328 29, 874 19. 189 Scrap_.-------------- ________________ do .... 837 4, 749 6, 519 3, 333 1, 413 780 2, 769 3,971 2, 537 3, 335 3, 729 3, 216 2,305
Price, wholesale, iron and steel, composite 36. 391 36. 37 dol. per long ton .. 37.50 36.36 36.37 36.40 36.34 35.80 35.69 35.82 35.95 36.67 37.62
Ore Iron ore:
Lake Superior district: I Consumption by furnaces 3,150 i 2,853 4,185 5, 271 thous. of long tons .. ii,478 3,041 2, 927 3, 317 2,800 2,246 2, 830 3,143 3, 775
Shipments from upper lake ports ..... do ____ 5, 504 I, 4Rl 0 O' 0 0 57 3,601 5. 573 6, 310 6, 955 7, 865 9. 201 Stocks, end of month, totaL .. ________ do .... 40,732 37,456 34,579 31.689 28,840 25,872 22,791 23,071 25,861 28,507 32,714 35, 853 39,005
At furnaces. __________ , ___________ do ____ 35, 5111 32,166 29, 456 1 26,646 23,912 21.054 18,306 18,835 21.610 24, 196 28,365 31, 203 33,944 Lake F.rie docks ____________________ do ____ 5, 216 5, 290 5,1231 5,043 4, 928 4,818 4,485 4,236 4, 251 4, 311 4,349 4,650 5,121
Imports, t.otal§ ________________________ do .... 304 198 187 180 179 203 162 217 189 222 213 179 203 Manganese ore, imports (manganese content)§
27 10 26 24 18 thous. of long tons .. 26 30 I 21 11 17 15 43 57
Pig Iron and Iron Manufactures
Castings, malleable: Orders, new.------------- ________ short tons __ 51,778 36,643 35,633 38,105 33, 234 35,997 29,183 27,702 29,041 29,892 40,005 64,732 63,835 Produrtion _____________________________ do ____ 59, 143 35,351 38. 802 35,372 34,786 39,615 31,640 30,840 30, 781 28,836 40,212 41,427 54, 263
Perrent of capacity---------------------· ___ 69.6 43.0 46.0 43.5 42.9 47. 5 38.8 37.8 37.0 35.3 47.9 50.5 66.3 Shipments ___ ------------------ .. short tons __ 34,038 35, 563 36,434 36,403 34,698 39,807 33,666 32,657 32,565 26, 169 33,289 39,215 49,807
Pig iron: Furnaces !n blast, end or month: Capn~ity ·---------------long tons per day __ 124,085 75,795 71,315 70,23.5 74,285 77,460 60, 160 60,515 72,495 79,765 87,715 105, 525 120,565 Number .... ------------------------------- 191 121 117 118 121 123 102 107 118 130 138 169 188
Prices, wholesale: Basic (valley furnace) ____ dol. per long ton .. 22.50 20.50 20.50 20.50 20.50 20.50 20.50 20.50 20.50 20.50 20.50 21.50 22.50 Composite.··-------- ________________ do ____ 23. 15 21.15 21.15 21.15 21.15 21.15 21.15 21.15 21. 15 21.15 21.15 22.35 23.15 Foundry, No.2, northern (Pitts.)
dol. per long ton .. 24.89 22.89 22.89 22.89 22.89 22.89 22.89 22.89 22.89 22.89 22.89 23.89 24.89 Production _______________ thous. oflong tons __ 3, 720 2, 270 2, 211 2,175 2,060 2, 395 2,056 1, 718 2,118 2,356 2,660 2, 879 3, 628
Cast-Iron boiler9 and radiators: BoilPrs, round:
Procluction ____________________ thons. of \b __ 2, 2~3 2, 233 1, 338 1, 573 1, 807 2,198 1, 916 1,930 1, 950 1, 387 1. 946 2,181 2,688 Shipments ... ____ .. ---------------- __ do ____ 2, &<2 3,083 2, 182 1, 642 1, 376 1,113 1, 203 1,051 1, 427 1, 749 2, 537 4, 634 5, 445 Stocks, end of month _________________ do .... 11, 9n5 16,877 16, 114 15,986 16,491 17, 579 18,301 19,084 19, 421 19,056 18, 4C,3 16,010 13,264
Boilers, s(juare: Proc!uction. _______ ---------- _____ •.• .do .... 17.273 Hi,388 10,128 12,881 13,801 19,960 15,339 16,429 16, 194 15, 284 21,442 20,696 20,925 Shipments -------------- ____________ do ____ 23. 7.>1 20,027 15,081 12, 276 9, 246 10,406 9, 448 11, 744 14. 577 16,807 25,360 35, 5~J3 39,869 Stocks, end of month _________________ do ____
Radiators: 80,391 104,021 98,831 99, 128 104,303 114,878 119,839 124,462 126, 130 124,581 120, 651 105,757 86,890
Convection type: Sales, Ind. heating elements, cabinets,
and grilles thous. sq. ft. heating surface .. 660 608 498 442 305 340 476 556 729 811 1,106 915 792 Ordinary type:
Prod notion_--------- ____ . __________ do ____ 5, 647 4, 765 3, 955 4, 896 4, 711 5, 593 4, 3->0 4,276 4, 655 4,187 5, 299 5, 299 6. 754 Shipments .... ---------------------do ____ 7. 824 5, 697 4, 815 3, 814 2, 950 2, 887 3, 103 4,207 4, 730 5, 280 7, 231 9, 209 10. 387 Stocks, end of month _______________ do ____ 21,424 26,394 25,624 28, 279 30,800 33,612 34,875 34,963 34,975 33, 902 32,007 28, 133 24,543
Boilers. range, galvanized: Orders:
New __________________ number of boile.rs ... 80. 265 70,862 47,882 61.003 50,876 57,928 69,772 68,191 59, 277 53,914 66,082 133, 384 98, 692 Unfilled, end of month, totaL _______ do ____ 48. U99 37, 170 20,626 15, 026 12.604 10, 145 19,442 20,638 16. 245 19,671 16, 6Y4 61,494 51,226
Production. __ ----- __ -------- ____ . _____ .do. ___ 84. !81 83,716 70,232 64,094 56,476 60,421 53, 4M 67,610 62.996 47,894 69,656 86,069 110,988 Shlpm~nts ..... _ .. ____________________ do .•.. 82, 492 80,.074 64.426 66,603 53,298 60,387 60,475 66,995 63, 670 50,488 69,059 88,584 108,960 Stocks, end of month ___________________ do ____ 30,677 31,819 37,625 35, 317 38,495 38,463 31,442 32,057 31,472 28,878 29,475 26,960 28,988
Steel, Crude and Semlmanufactured
Castings, steel: Orders, new, total.. ______________ short tons .. 99,899 30,428 38.342 42,024 30.360 41.367 34, 100 41,660 37,774 34, 804 39,698 96, 687 119,687
Percent of capacity---------------. __ ....... 89.2 27.2 34.2 :17.5 27. l 36.9 30.4 37.2 33.7 2L 1 35.4 86.3 106.9 Railway specialties _____________ short tons .. .52, 146 7, 1281 14, 749 12.606 6, 848 11,125 9, 6551 12, 621 11,872 7. 721 n, 912 42,213 58.530
Production, total ----------------------do .... 85. 755 29,994 36,130 38.928 36,471 40,219 35,94-1 41,359 40. 272 34,168 42,428 43, .>90 72,096 P~rcent of capacity--------------------- ____ 76.6 26.8 32.3 34.8 32.6 35.9 32. 1 36.9 ll~g6g ! 30.5 37.9 1 38.9 64.4 Railway speclalties _____________ short tons __ 36,615 7, 207 11,282 12,804 10,060 \0,173 9, 751 12,506 8, 498 10,229 I 12,449 26,391
'Revised. lRevlsed series. Data revised for 1937; see tables 19 and 20, pp. 14--1.5 of the April193P issue.

JANUARY 1940 SURVEY OF CURRENT BUSINESS 49
Monthly statistics through December 1937, to-~19391 1938 I 1939 gether with explanatory notes and references --- -----.----- -----,,----.----,-----;---.:.;_;....:. __ -,.----.,------,-----.~---to the sources of the data may be found in the Novem- Novem-1 Decem- Janu- I Febru-1 M h I Ap 1·1 I M I June I July I August I' Sep- Octo-1938 Supplement to the Survey ber ber ber ary ary arc r ay tember ber
METALS AND MANUFACTURES-Continued
IRON AND STEEL-Continued Steel, Crude and Semlmanufactured
Continued Ingots, steel:
Production ...........•.. thous. of long tons .. Percent of capacity .............•...........
Bars, steel, cold-finished, carbon, shipments short tons ..
Prices, wholesale:
5,463 92
67,977
Composite, finished steeL ....... dol. per lb.. . 0263 Steel billets, rerolling (Pittsburgh)
dol. per long ton •. Structural steel (Pittsburgh) ..... dol. per lb .. Steel scrap (Chicago) ...... dol. per gross ton ..
U.S. Steel Corporation:
34.00 .0210 17.66
3,558 60
37,673
.0268
34.00 .0210 14.20
Earnings, net.. ------------·---thous. of doL .......... ····--·--Shipments, finished steel products
thous. of long tons.. I, 27I
Steel, Manufactured Products Barrels and drums, steel, heavy type:
Orders, unfilled, end of month ...... number .. 966,519 Production ___ ... __ -···-···-···--------do .... I,575,168
Percent of capacity-------------------······ 91.2 Shipments ......... _ -·-··--··-····-·number .. 1,592,000 Stocks. end of mont.h ............•....•. do.... 49,745
Boilers, steel, new orders: Area.- .. ---------------------thous. or Sfj. ft._ Quantity_------. -------------------number __
Furniture, steel: Office furniture:
Orders: New -----------------------tbous. or doL. Unfilled, end or month _____________ do ___ _
Shipments .. ______________ .. ________ .. do ..• _ Shelving;
Orders: New.--··--·- _______ .-----··- __ .... do ...•. Unfilled, end of month. ____________ do ... .
Shipments. ___ . ________ .. _. ________ .. do ... . Plate, fabrkated steel, new orders:•
801 659
2,075 I,315 2,142
660 575 487
680
248,376 788,040
49.0 799,678 24,603
635 947
1,813 1, 064 I, 707
335 255 442
Total... __________________________ sbort tons.. 25,995 20,213 Oil storage tanks ..................... do.... 9,107 3, 629
Plumbing and heating equipment, wholesale price (81tems). .. _________ ............ dollars. ___ ____ __ 233.97
Porcelain enameled products, shipments , thous. of doL ---------
Spring washers, shlpments _______________ do.... 234 Steel products, production for sale (quarterly):
675 I86
Merchant bars ........... tbous. of long tons ........... ·--------Pipe and tube .... ______________________ do .•.. -····-··- ·--------Plates. ___ . ____ . ______ ------- ..••... __ •. do .••• ___ • ____ _ Rails ..... ______________________________ do .•••. ____ .. _. Sheets, totaL -------------·------------do •••• --------
Percent of capacity------------------------- --------Strip;
Cold rolled _____________ thous. or long tons .. --------· ---------Hot rolled. ··------------------------do ____ ----·-··- ---------
Structural shapes, heavy _______________ do •... ___ ··---- ··-------Tin plate __ .. ____ ._ -------·------------do ••.. ___ ...... ---------Wire and wire products ..••..........•. do .•.. ________ _
Track work, shipments ____________ short tons.. 6, 640
NONFERROUS METALS AND PRODUCTS
Metals Aluminum:
Import'. bauxite§. _______________ long tons .. Price, wholesale, scrap, castings IN. Y.)
dol. per lb .. Babbitt mota! (white-base antlfrlotlon bearing
metal<): Consumption and shipments, total
thous. of lb .. Consumed In own plants ............. do ___ _ Shipments ... ____ . ___ . ____ ._. __ .. ____ do. __ _
Copper: Exports, refined and manufactures§
short tons __ Imports, total§ ..... __ .. _______ . ___ . ____ do ___ _
For smeltin~. refining. and export§. do ___ _ Product of Cuba and Philippine Islands
short tons._ All other§ .... _____ .... ___ .------ ...... do ___ _
Priee, whole•ale. electrolytic (N. Y .)
Production: dol. per Jb __
Mine or smelter (Incl. custom lnta.ke) short tons._
Refinery ... --------------------------do ..•. De\iverie3. refined, totaL .............. do ... .
Dome,tic_ -----·--··------------·····do .. --Export ...... _____ ... -··-·-----------do ___ _
Stocks, refined, end of month __________ do ___ _ Lea<1:
Import•, total, except manufactures (lead con-
Ore:
54, 801
.0950
2, 456 794
1, 661
41,049 I9, 937 17,451
1, 364 I, I22
.1228
(1) (1) (1) (') (1) (')
2,514
33,737
.0808
1, 596 597 999
31,285 16, !54 15.568
I72 413
.11031
73,205 66,846 M.r-m 51,397 13,260
269,488
3,131 53
36,315
.0268
34.00 .0210 13.75
I9, 792
69·1
519,375 830,979
51.7 822,746 32,696
892 1, OI2
1,852 977
1,982
315 205 357
28, 2I8 5,950
233.97
645 I77
616 611 452 105
1,812 69.0
I60 384 395 374 6I7
2,840
41,060
.0800
I, 606 648 958
40,741 22, 1S2 21,731
I 56 244
.1103
72,709 68,071 47. 804 38,977
R, 827 289,755
3,174 53
39,618
.0268
34.00 .0210 13.85
2,989 54
38,571
.0268
34.00 .0210 14.06
789 678
438,746 749,070
47.5 746.510 34,717
1, I31 1, 264
I, 966 1,132 I, 8I3
368 253 318
20,511 4,081
233.99
610 I85
33,660
. 0750
1, 725 644
1,080
25, 503 IS, 551 18,076
IOO 374
.1103
6Q, 170 66,316 54.827 51,0.?9
3, 7R8 301,244
421,037 552, 189
35.0 556, OG9 30, 58e
817 892
I, 782 I, I40 I, 775
388 292 349
22,903 7,401
234.64
771 I80
35,397
.0713
1,460 359
1.101
23.807 11,1134 10, 509
145 979
.1103
60,707 59, 452 51. 577 48.267 3 310
300,119
3,405 55
42,808
.0268
34.00 .0210 I4. 25
15, 88I
768
351,203 709,252
44.4 710,228 29,610
6I7 660
1, 798 I, 052 1,886
499 317 474
29,784 7, 723
234.82
959 215
672 595 491 293
1,654 60.1
125 243 459 422 674
6,481
40,300
. 0713
I, 783 531
1, 252
27,364 I9, 365 I8, 450
105 8IO
.1103
61,752 66,718 55.025 50,803
4. 222 320,812
2,974 52
36,287
.0268
34.00 .0210 I3. 38
2, 923 47
34,287
.0264
34.00 .0210 I2. 80
701 723
277,719 800,292
50.1 799,404 30,498
765 834
1,619 952
1, 707
399 327 389
35,844 5,429
234.82
853 181
38,288
.0703
I, 380 338
1, 042
28.162 20, fl51 19,728
ISO 742
.I027
62,548 o8, 368 46. 667 42. 484 4 IR3
332, .?13
2.?7, 961 814,298
51.1 8I2, 843 31,867
877 983
I, 780 1, 016 1, 716
507 387 447
34,036 10,976
234. 77
851 17I
51,027
.0688
I, 602 425
1, I77
36,303 I9, 040 I8, 128
9 903
.0083
68,600 68, 536 63, 894 51,225 12, 6fJ9
337, 155
3,125 53
35, 615
.0262
34.00 .0210 I3. 56
I5, 881
733
208,000 833,378
52.3 822, 61i8 42,587
I, 032 I,098
1,902 1, 207 1, 714
420 360 451
33,959 13,481
234.77
826 I83
595 620 505 386
I, 492 52.7
110 210 474 556 650
6,832
43,629
.0688
I, 749 611
I, I37
39,350 23. 248 21,992
I84 1, 072
.0978
59. 672 61, 719 63,862 53, 573 10.289
335,012
5, li9
3,163 55
32,809
.026I
34.00 . 02IO I3. 56
676
235,772 719,055
45.1 725,669 33,025
772 I, 033
1, 737 I, 382 1,567
400 358 360
31,364 8,188
234.71
951 149
44,805
.0688
1, 6I3 517
I, 096
35,168 21,123 18,646
135 2,342
.0998
54,532 57, 339 75,808 59.681 I6, 127
3I6, 543
3,864
3, 763 61
42,895
.0261
34.00 .0210 I3.88
804
247,729 826,941
51.9 825, 55I 34,407
890 I, I75
I, 813 1,308 I,887
404 328 433
21,828 8, 229
234.87
1,151 184 '
40,644
.0702
I,999 629
I, 370
45,840 16,176 15, 582
I36 459
.I026
(1) (1) (') (1) (1) (1)
3,019
4, 231 71
55,495
.0261
34.00 .0210 I6. 22
985
771,714 1,163,465
73.0 1,166,980
30,892
1, 752 1,380
2,049 1, 350 2,007
411 331 408
39,751 11,498
235. 19
984 233
559 814 554 188
I, 753 65.6
152 183 561 587 588
4, 916
33,133
. 0713
3, I33 74I
2,392
35, 69t} Ii, 015 I6, 664
128 224
.1164
(') (1) (1) (1) (1) (1)
4, 391
5, 394 9I
67,599
.0263
34.00 .0210 I9.05
1, 219
1,188,543 I,M9,056
91.0 1,5I3,362
66, 586
1,089 997
2, 136 I, 383 2,104
520 402 449
37, 766 10,991
235.33
I, 128 262
5, 658
45,660
.0713
2, 635 789
1,846
26,806 I5, 360 13, OI2
I,464 885
.1222
(1) (1) (') (1) (1) (1)
4, 063 tent)§ ... _______________________ sborttons.. 2,762 4,482
1
. 4,24IIU,998 15.485 13,257 16,593 10,961
Receipts. teart content of domestic ore. do____ 34, 71R 35, 885 37, 6M 31, 593 31,748 30, 614 33, 589 32. 300 31, 268 35,063 35, 612 35, 936 Shipments, Joplin districtt _________ do ____ ::::::::: 5, 4I9 4, 544 9, 695 6, 314 3. 926 3, 734 •4, 692 •4, 104 3, 49I 4, 484 3, 415 4, 380 'Revised. . 1 Temporarily not available. • Data are for 46 IdentJCal manufacturers; beginning January 1938dataareavailable from thereportsoftbe Bureau ol the Census for 26 additional small establishments. 'As reported by 21 rnanufactD;rers through December 1938; subseq•wmly. 2 of these ceaserl operations. For 1937 and I938, data are available from the reports of the
Bureau of the <;:enm' for 34 additiOnal establishments, and, beginning January 1939, lor 80 additional establishments. tDat:: for N~vember 1938, !March, May, August, and November 1939 are for 5 weeks: other months, 4 weeks. §Revised senes. Data rAVlsed for 1937; see tables I9 and 20, pp. I4 and 15 ol the Apri!I939 Survey.

50 SURVEY OF CURRENT BUSINESS JANUARY 1940
Monthly statistics through December 1937, to-~19391 1938 I 1939 gether with explanatory notes and references --- · ---,,~--,,.----.---,,---.,----.---.----:----...----to the sources of the data may be found in the Novem- Novem-j Decem- Janu- Febru- March I April May I June I July I A rr st I Sep- I Octo-1938 Supplement to the Survey her ber ber I ary ary u~u. tember ber
METALS AND MANUFACTURES-Continued
NONFERROUS METALS AND PRODUCTS-Continued
Metals-Continued
Lead-Continued. Refined:
Price, wholesale, pig, desllverlzed (N. Y .) dol. per lb ••
Pr(}(luction from domestic ore .. short tons .• Shipments (reported)_ ---------------do .... Stocks, end or month _________________ do .•..
Tin: Consumption or primary tin In manufactw-es
0 .. )50 44, 74R 64,365 58,061
long tons .. ---------Deliveries ______ . __________ --------- ___ .do____ 7, 8i0 Importshbars, blocks. etc .. __ ·---------do·--- 7, 62~ Price, w olesale, Straits (N. Y.) .. dol. per lb.. fi 224 Vlsibiesupply, world, end of mo. t ___ long tons.. 38,035
United States ________________________ do____ 3, 383 Zinc:
Ore, Joplin district:, Shipments. __ . _________________ short tons .. ---------Stock•, end of month _________________ do ____ ---------
Price, wholesale, prime, western (St. L.) dol. per lb.. . 0650
Production, slab, at primary smelters short tons ..
Retorts In operation, end ofmo ..•.. number .. Shipments, total _________________ short tons __ Stocks, refinery, end or mo _____________ do ___ _
Miscellaneous Products
53.524 46.867 64,407 61,522
Brass and bronze (Ingots and billets): Deliveries .. ______________________ short tons__ s. 4g7
Plumbing fixtures, brass, shipments Orders, unfilled, end or month ........•.. do ____
1
13, 459
thous. of pieces __ --------Radiators, convection type, sales:
Heating elements only, without cabinets or grllles _______ thous. or sq. ft. heatlngsurfare__ 94
Inclncilng heating elements, cahfnets, and grilles _____ thons. Of SQ. ft. heating surface ..
Sheets, hrass, wholesale price, mfll dol. per lb._ Wire cloth (brass, bronze, and alloy):
Orders, new __________________ tbous. of sq. ft __ Orders, unfilled, end or month _________ do ___ _ Shipments. __ ------------------- _______ do ___ _ Stocks, end ormonth ___________________ do ___ _
MACHINERY AND APPARATUS Alr-conrtitioning systems and equipment:
Orrters, new:
870 .191
329 I, 829
616 612
Totalt ________________________ tbous. of doL ---------Air-('(lnr!ltlonlng group _____________ do ____ ---------Fan-I(Tonpt __ • __ .---------- ________ do ___ _ Unit-heater I(Tonp __________________ do ___ _
Electric overhead cranes: Orrters:
New __ --------_-------- ______________ do ___ _ Unflllerl, end of month _______________ do ___ _
Shipments .... ________________________ .do ___ _ Exports. machinery. (See Foreign trade.) Founrtry equipment:
Orders: New----------------------. ___ 1922-24=100 .• Unflllerl. end of month _______________ do ___ _
Shipments ______________ ._ ... _._. ______ .do ___ _ Fuel equipment:
011 hurners: Orrters:
1\ew. --------- _________________ .number __ Unfilled, end of month _____________ do ....
Shipments_ --------------------------do .. __ Stock<, enrt or month _________________ do ___ _
PuJverl1.ers. orrters, new _______________ _do ___ _ MechaniNI! stokers, sales:
445 2, 390
719
192.7 246.9 170.1
18,758 3, 639
20,085 18,165
42
f'la<se< 1, 2. anrt 3 ____________________ do ____ ---------CJasse< 4 and 5:
Nnmher ... ------------------------------- --------Horsepower._--------------------------··- ---------
Machine tools, orrlers, new t av. mo shipments 1926=100 ..
Pumps and water systems, domestic, shipments:
Pitcher, other band, and windmill pumps units ..
(1)
Power pumps, horizontal type _________ do ____ ---------Water systems. Incl. pumps ____________ do .. __
Pumps, measuring and dispensing, shipments: Gasoline:
B anrt-operat~d. ______ ---------- _____ units __ -- _--- --. Power ... _ ---------------------------do ____ ---.-----
011. grease, and other: Hanrl-operated ________ ---------------do ____ --.------Power __ -----------------------------do ___ _
0. 0509 35,958 42,005
115, 134
4,160 3, 535 4, 448 .4623
37, 145 5,060
42.636 17,299
.0492
40,343 36. 243 43.693
120,778
4, 759 13,740
1,359
110
570 .175
419 780 458 446
2, 885 819 837
1, 228
179 1,052
207
89.7 87.0 94.5
11.409 2, 564
11. 518 21,421
12
7,689
228 34,533
112.2
26,572 893
12,803
8.18 8,412
14, R53 2. 367
I
o. 0484 30.988 33.908
]]5, 902
4, 330 3. 400 3, 555 .4618
37,712 5,157
34,428 12,251
.0450
45,345 38. 793 39,354
126, 769
4,347 11,463
1, 218
109
491 .174
360 752 392 450
3, 211 I, 112
871 I, 228
377 1,171
257
141.9 126.0 102.8
8,435 2,155 8, 824
21,326 19
4, 752
219 40,117
146.5
24,889 865
10,402
649 7,652
I
I i '
o. 04831 38,299 40,180
117,214
4,230 4. 330 3, 971 .4638
39. 100 4,624
27,389 12,602
.0450
44,277 39.500 42.639
128,407
I 4,9261 9, 240 '
I, 391
37
410 .173
505 868 388 478
I
I 3, 3351
l.ml 168
1,173 166
122.5 151.4 96.3
9, 616 3. 033 8, 738
21,885 16
3, 398
189 34,909
150.8
41,191 464
14,738
740 5, 858
10. 708 10. 2\!7 I I, 480 1 2, 071
o. 0481 36.391 34, 421
122, 112
4,410 4,105 6,097 . 4562
40.035 5,486
33. 220 I 8, 652
.0450
39,613 39.459 39,828
128,192
4,662 i 8, 161
1, 419
4:: I .173
352 805 404 504
2, 674 I, 205
821 648
201 1,131
244
135.5 175. I 112.2
7, 981 3, 340 7, 674
22,850 10
2,375
186 38,932
167.1
31. 485 740
14, 2.o9
1,005 6,156
11,9821 2,981
0.0482 37,790 40,871
122,035
5, 270 4, 755 5, 208 . 4621
37, 788 5,806
35,189 10,503
.0450
45,084 38.251 45,291
127,985
5,818 14,571
1, 505
47
497 .173
484
8531 427 532
I 4, 8031 2, 865 1,073
864
284 9Q3 270
146.6 193 6 128.1
11.806 4. 475
10, 671 21.790
33
3, 669
168 34,811
185.4
42,693 732
16,222
1, 582 8,878
1~. 078 4,305
o. 0478 36.704 37.903
123,394
~. 190 5, 980 3,814 . 4720
37,224 3,385
31,049 9, 294
.0450
43,036 38. 763 40.641
130,380
4,657 14,037
1,330
I 5:: I
.170
347 768 422 549
4, 527 3,014
U55 558
823 1, 504
312
146.2 208.6 131.0
11, 346 5,181
10,640 21,619
8
3,427
164 32,540
155.6
38,468 I, 463
16,889
I, 346 9, 637
13,919 3, 544
• Revised. • Nominal. ' Discontinued hy reporting source.
0. 0475 43,026 40,124
129,270
5,920 5, 90.1 5, 118 .4902
33,715 3, 387
39,733 7,851
.0450
42,302 36,331 39,607
133,075
4, 543 12,688
1, 554
101
717 .165
481 830 413 560
4, 979 3,193 1, 318
468
438 I, 755
174
108.9 173.1 144.3
15,284 5. 456
15,009 20,214
23
5,023
215 49,255
219.8
44,216 731
20,773
I, 601 12,017
17,085 3,332 I
0. 0480 37, 237 38,710
129,636
5, 780 4, 925 6,020 . 4885
30.039 4, 388
31,212 6, 749
.0450
39,450 36, 291 37,284
135, 241
5,026 11,065
I, 577 I
138
814 .165
366 750 444 582
5, 931 3, 901 ], 509
521
274 I, 813
215
134.9 159.2 148.5
17,901 6, 451
16,906 19, 947
17
7, 599
267 56,419
211.6
55,048 953
23,067
1,129 11,430
15,612 3,186
0.0481i 34. 926 42,635
124,017
5.140 5, 275 6, !79 .·1852
29,615 5,339
26.248 i, f.Ol
.0452
39.669 35,491 43, 128
131, 782
5,035 14,625
I, 532
125
657 .167
468 823 392 624
4, 691 2,818 1,327
546
383 1,917
280
114.0 135.6 135 5
17,838 6, 952
17,337 18,854
11
9, 246
279 51,722
230.9
52,336 964
19,029
875
9, 4191 14,053
2,011
0. 0504 36,5.16 45,025
117,985
5, 900 6, 295 4, 735 . 4876
26, 338 3, 613
35,748 9, 503
.0472
40,960 34, 443 49, 928
122, 814
6,006 15,542
I, 721
68
787 .168
413 793 439 637
4, 657 2, 631 1, 336
690
844 2, 414
347
131.6 123.1 143.8
22. 748 li, 040
24, 660 19, 642
14
14,682
0. 0545 35,086 59,889 97,473
'6, 570 5. 050 4,427 (•)
31,168 3, 413
30,285 9, 958
.0610
42.225 37.729 69, 424 95,615
7, 539 22,499
2,109
105
986 .183
1, 270 1, 513
547 593
5, 743 3, 328 1,422
993
484 2, 474
375
184.4 174.9 132.6
I
36.279 I 5. 9671 35. 352
16,460 53
19,959 I 3i6 439
63, 899 1 86, 714
206.5 (')
52,897 1, 138
19,890
731\ 9, 275
12, 4681 2, 449
47,439 860
18, 452
902 7, 624
12,551 2. 703
0. 550 38.903 66,060 73,963
7,630 6, 040 5,427 . 5525
38,206 3, 536
36,734 7, 204
.0650
50,117 43,109 73,327 72,405
8, 993 17,878
I, 992
80
891 .190
1,178 2,125
564 638
6,121 3, 322 1,387 1, 412
569 2, 665
378
220.6 224.7 170.7
33,657 4, 9G6
34,658 16,675
38
17,846
376 63, 2(i4
(!)
43, 90~ 9·1~
17,444
768 8, 611
14, i85 7,895
tRevised series. Data for "driving m•chanisms for f(eneral fan use" have been removed from the fan group beginning January 1936. Revisions not shown on p. 50 of the May 1939 issue will appear In a subsequent issue. Beginning January 1939. data on air-cnnd:tioning systems anrt equipment are available for from 252 to 267 manufacturers; figures shown here are for 125 of these whoseorrle•s In January 1939 amount"d to more than R!i percent of the total for 2!i2 mannfaetnrerq. World visible supply of tin revised be· ginning January JU35 to Include stocb of refined tin at all European smeltero; data not shown on p. 50 of the November 1939 issue will appear in a subsequent issue.
,Data for November 19~8. March, Mi!y, August, and November HJ:l9 are fori\ weeks: other month<. 4 werks. tA new series based on the operations of manufacturers accounting for about 60 percent of the total dollar sales of machine tools has been compiled beginning January 1939,
Available data are as follows (percent of capacity): Jan., 52.5; Feb., 5fl.l; Mar. 58.7; April61.2: May 63.6; June 65.5; July 65.8; Aug. 72.6; Sept. 74.6; Oct. 84.9; and ~ov. 91.2.

JANUARY 1940 SURVEY OF CURRENT BUSINESS 51
gether with explanatory notes and references --- ---.----- ---.----.-----;---..,---.-----;---..,----.---;---Monthly statistics through December 1937, to-,19391 1938 I 1939
to the sources of the data may be found in the Novem- Novem-1 D<lcem- Janu- I Febru-1 March I April I May J n I J ly I 'ug st I Sep- I Octo-1938 Supplement to the Survey ber ber ber ary ary u e u .... u tembcr ber
METALS AND MANUFACTURES-Continued
MACHINERY AND APPARATUS-Con. I Pumps, steam, power, centrifugal, and rotary: !
Orden, new --------------------thous. of dol..: Water-softening apparatus: i
Shipments, domestic .. ------ .. ________ units .. Woodworking machinery: I
Orders: 1 Canceled ..................... thous. or dol .. New .. -·····----·--------------------do .... Untilled, end of month ............... do ....
Shipments: ~uanttty _____________ number or machines ..
alue .... -----·--------------thous. of dol.. ELECTRICAL EQUIPMENT
Battery sales (replacement only) :• Unadjusted._ ------------------1934-36= 100. _ Adjusted .... _____ ---- ____ --------._._ .. do. ___
Electrical products:• Industrial materials, sales billed._ .1936= 100 .. Motors and ~en era tors. orders received .. do .... Transmis.ion and distribution equipment,
orders received .................. 1936=100 .. Furnaces, electric, Industrial, sales:
Unit .. ---·-·---- ____ ------. ___ ._ .. kilowatts .. Value __________________________ thous. of doL
Electrical goods, new orders (quarterly) thous. of doL
Ironing machines, sales• ................. units .. Laminated products, shlpments .. thous. of doL. Motors (1-200 hp.): BiiUn~s (shipments):
A. 0.-------- ........ -----------. ___ .do .... D. 0 ......... ------ _ •• ------ ........ do ....
Orders, new: A. C-------·-------------------------do .... D. C---------------------------------do. _ ..
Power ~able, paper Insulated, shipments: Unit ·----------------------------thous. of ft .. Value __________________________ thous. of doL
Power switching equipment, new orders: Indoor .. -----._ .. ___ .... ____________ .dollars .. Outdoor.------ ...... --·---------------do ..••
Ran<res. hilled sales. _____________ thous. of doL Refrirrerators, household. sales ........ number .. Vacuum cleaners, shipments:
Floor._ --------------------------------do .... Hand-type_ ... _ ------. ____ .. ______ ..... do ...•
Vulc9nized fiber: Consumption of fiber paper ..... thous. of lb .. Shlpmentst. _ ... __ .. -------- .. tho us. of doL
Washing machines, sales• ............... units .. -----
OD PULP wo Consumption and
Total, an grades. shipments•• ................. short tons ..
Chemical: ................. ______ do .... Sulphate ....
Sulphite, tots Bleached .. Unbleached
!. ____________________ do .... -----------------------do ____ ....................... do ....
Soda ....... .. Gronndwood ..
Imports· Chemical§ ...... Ground wood§ ..
Production:
....................... do ....
........................ do ....
....................... do ...
....................... do ....
Total. an grades. ......... ____ .......... do .... Chemical:
....................... do .... Sulphate .•. Sulphite, tota Rlea~hed .. Fnbleached
Soda ........
I. .................... do .... .................. _._ .. do .• _. ........ ____ ... __ . ____ do ....
....... __ ........ ______ do .... Ground wood .. ....................... do ....
Stocks, enrl of mon Total, all grades.
th• ······-····-------------do ..•.
Chemical: .. ------------ ........ .do .... Sulphate ...
Sulphite, tota Bleached ... Unblel\ched
Soda .. __ ....
I. ...... ______ ........ do .... ......... _____________ do ... _ ... __ ................. do ....
__ .. __ .. ________________ do .... Groundwood __
Price, sulphite, unb _ .... _ ... ___ . __ ..•. _ .. do .... Jeached ..... dol. per 100 lb .. PAPER
Total paper: Paper Incl. newsp rlnt and paperboard:
Production. __ _ _________________ short tons .. Paper, excl. newsp r!nt and paperboard:
Orders. new ___ _ -----------------short tons ..
1, 330
I, 481
6 652
I, 346
232 505
-----··------------
---------------------------
4,153 368
-- ~------9, 990
------------------------··-----------
------------------126,480 355,056
1, 4i2 ---------
108,338 32,728
2, 594 748
102,990
656,047
266,207 207,787 131,003 76.810 42,928
139, 125
249,886 22, 163
648,401
265, OIR 201, om 131,581 75.760 42,841
133,175
123,766
21,809 78.884 47,982 30.810 3, 790
19.283 2. 28
------------------
Production ••••• Shipments.----
_ ---------------------do. ___ ---------_-----·--------------·do •. __ ---------
970 1,155 I, 204 1,282 1, 2581 1,230 1, 236
1, 038 1,077 I, 108 1,082 1,698 1, 122 1, 217
3 4 13 14 1 5 (•) 456 612 363 410 445 393 484 720 910 863 836 896 923 898
172 236 190 216 209 152 216 388 418 397 422 384 360 510
168 149 100 78 73 72 84 120 132 127 122 121 132 151
81.9 79.2 79.6 79.2 90.8 80.5 84.1 67.6 72.1 69.2 67.8 99.3 77.5 77.5
73.1 79.4 81.0 108.3 129. 1 103.0 117.2
1,17A 2, 356 3,147 I, 235 4,681 1, 934 2, 789 67 110 1115 98 215 161 194
-------- 160,374 --------- --------- 197,654 --------- -------··-8, 226 9, 210 8,208 8, 016 11,607 9,047 8,433
851 876 838 812 968 830 849
1,506 1, 713 1,436 1, 508 2,050 1, 986 2, 053 305 446 330 449 557 534 519
1,605 1, 733 1, 574 1, 762 2, 356 2,062 2,319 651 659 540 404 739 546 428
603 476 271 353 637 700 566 588 502 273 312 662 696 674
55,627 91,720 51,124 47,458 87,019 75,161 89,809 124,927 138,840 109,799 223,286 197, 175 279,093 346,530
1, 047 1, 006 2, 230 2,103 2, 263 I, 939 2. 395 32,103 47, 599 150,108 198,528 251,644 260,204 273,966
89, 772 95,521 78, 753 87,140 122, 785 100,487 91,055 29,734 30,632 23,846 25,182 29,470 24,539 23,322
1, 565 1, 385 1,410 1, 561 2,070 1, 575 1, 749 422 383 4ii8 470 528 466 4.58
84, 192 67, 502 109,909 129,885 152, 725 116, 199 105,266
PAPER AND PRINTING
522,863 539,061 499,076 484,507 546,949 527,307 524,391
214,796 211,884 196,419 199,931 228,680 221, 196 204,220 151,635 174,546 145,040 1~6. 667 156, 107 148,801 152, 108 90,486 115,442 89.511 85,120 97,156 93,498 94,398 61,149 59, 104 55, 529 51,547 58.951 55,303 57,710 32.575 31,996 32,643 31,526 34,705 32, 946 33,713
123,857 120, 631i 124,974 116,383 127, 457 124,364 134, 350
166,091 171.520 150,510 103, 504 117,800 78, 534 140, 131 17,491 17,366 20,076 7, 312 17,326 9, 867 18, 562
533,423 522,220 533,442 484,605 543, 411 521, 590 535,149
217,896 212,884 207,259 200, 502 228,632 212, 559 201,123 157. 724 152.498 !58, 913 132, 662 149,019 142,401 161,601 93,782 95.845 100. 337 79, 698 92,729 88, 250 103, 464 63,942 56, 653 58. 576 52. 964 56,290 54. !.51 58, 137 32,632 31,917 32.255 31,075 34,561 32, 768 34,748
125,171 124,921 135, 015 120,366 131, 199 133,862 137, 677
200,002 183,161 217, 526 217,624 214, OS5 208,369 219, 127
35,728 36,728 47,568 48,139 48.091 3Q, 454 36,357 114. 253 92,205 106.078 102,073 94.985 88,585 98,078 76, 549 56.952 67,778 62, 356 57.929 52,681 61,747 37,704 35. 253 38,300 39,717 37,056 35,904 36,331
4, 905 4, 826 4, 437 3, 986 3, 842 3. 664 4, 699 45,116 49,402 59, 443 63,426 67,168 76, 666 79,993
2. 00 2.00 2.00 2.00 1. 95 1. 95 I. 95
957,377 849, 764 843, 063 873,441 1,036,734 912. 676 959,841
514,201 437, 1281436,048 41)8, 274 542,497 436,980 477,034 534,542 444, 728 442, 405 463, 770 535, 229 462. 299 498,197 532,175 441, 194 446, 265 460,019 542. 734 447, 500 479,108 '
1,673
1,282
(•) 417 905
224 411
111 163
86.6 87.8
102.0
3, 228 213
205,567 7, 216
901
2,410 574
2,504 549
652 718
92,347 217,846
2, 025 268,848
80,660 19,014
1, 735 441
120,076
502,887
202,204 146,993 91,164 55,829 30,031
123,659
152. 719 17,403
507,857
201, 3f>4 153, 526 97,308 56,218 31,164
121. 803
224, 097
35,517 104, 611 67,891 36,720
5, 832 78, 137
1. 95
898,307
454,900 441,236 449,987
1,090 1, 585
I, 306 1, 236
5 29 4~8 432 980 948
!57 269 357 435
133 176 139 132
78.2 91.6 76.0 94.3
121.2 108.8
1, 332 l, 921 97 182
-------- ---------7, 741 11, 3HO
805 906
2, 0.)3 2, 398 538 524
2,128 2, .595 406 569
716 783 773 860
90,302 67, 963 283,614 259,436
1,428 1, 799 164,211 94, 734
61, 492174. 333 15, 197 22, 268
1, 725 1, 971 437 528
104, s11 I 132. 297
495,390
208, 187 143,487 91,428 52.059 28, 303
115, 413
137, 431 19,694
472,095
206,479 132, 4GO 82,527 49,933 26,846
106,310
200,803
33,809 93, 584 58,990 34, 594 4, 376
69,034 1. 95
553,
235. 154.
9G, 57, 32,
130,
130. 19,
535,
233. 1.)8. 97, 61. 33,
110,
182,
653
709 174 894 280 9fll 809
920 649
230
197 341 283 o.IS 013 679
379
31, 97, 59. 38,
4, 48,
297 751 379 372 427 904
1. 95
1,469
1, 512
5 620
1,145
218 418
239 154
98.5 '116.4
'154. 4
3,279 291
212, 001 10. 5f>5 1, 019
2,361 474
2, 725 1,102
676 781
71,449 24<1, 535
1,891 73, 149
93,851 2o, 8o7
1,
1,
1,
809
450
1 571 266
288 509
219 129
1 1 23.0 36.5
1.
6,
59.8
103 438
----11, 1,
2,
3, 1,
----------
88, 321,
1, 62,
106, 31,
161 296
535 555
151 403
48.') 761 714 055
539 362
2, 2841 2, 548
138, 992 1 !1_2,
722 660 830
594,710 659,794
240, 011 270,749 187, 725 207, 517 119,799 131,641 67,926 75,876 36,216 42,705
130, 758 138,823
136, 843 194,615 23. 574 21,527
554,607 648,929
233.789 26S, 672 171,094 205, 701 109,200 130,265 61,894 75,436 36. 234 42,136
113,490 132,420
142,276 131,111
2.5, 075 22,998 81,120 79,304 48, 780 47,404 32,340 31,900
4, 445 3, 876 31,636 25,233
2.13 2.28
861,310
429,745 419,773 437,246
1,04
535,
6,4.591"1,026,542 1,150,490
601 '737,095 574, 31il 233 ' 503,84~ 565, 433 276 '532,220 580, 163
523. 519,
'Revised. • Less than $500. • Pulp used in the prorlncing mills and shipments to the mark~t. *New series. Data on battery sales beginning 1934 appear in table 35, p. 17 of the August 1939 issue. Sale< of washing machines and ironers beginning 1929 appear in
table 43, p. 17 of the October 1939 issue. For data on electrical products beginning 1934, see table 32, p. 18, of the June 1939 Survey; data are furnished by both member and nonmember companies rather than member companies atone as therein stated.
\Revised series. Data revised for 1937; see table 20, p. 15 of the Aprill939 Survey. t Revised series. Data on vul~anlterl fibre shipments revised beginning 1934; data not shown on p. 51 of the January 1939 Survey will appear in a subsequent Issue.

52 SURVEY OF CURRENT BUSINESS JANUARY 1940
Monthly statistics through December 1937, to-~19391 193S I 1939 gether with explanatory notes and references ---- · ---,-------,----;----,-----.---,----,----.,.----,---to the sources of the data may be found in the Novem- Novem-1 Decem· I Janu· I Febru·l March I April I May I June I July I August I te8mepb-er !october 1938 Supplement to the Survey ber her her ary ary
PAPEH AND PRINTING-Continued
PAPER-Continued I I
.. 00, I
I I I I I i
Book paper:t
15, 7691
I
16,3051 I Coated paper: I
Orders, new ...•...•.....•.•..• short tons .. --------- 16,612 17,911 i 19,5531 17, 126 17,276 I 15,744 Orders. unfilled, end of month •.•.. do .... ------·--- 3,410 2, 714 I 3,071 3, 552 I
4:gjii I 3, 238 2,861 ' 3.090 3, 647
Prodnction _ .• _ .................... do .•.. --------- 17,057 17,096 I 16,8451 17,796 ! 17,754 18,579 15. 634 14,306 Percent of potential capacity_ .......... --------- 62.4 62.6 I 63.3 71.6 71.7 68.6 66.5 64. g 55.9
Shipmonts .....•...........•.. short tons .. 16,730 17,5631 17,319 17,6421 19,919 17,902 17,409 15, 771 15,097 Stocks, end or month .............. do •.•. --------- 14,018 12,776 12,070 12, 4 721 12, 581 12,433 13,762 15, 13Y 14, 211
Uncoated paper: Orders, new ....................... do .... --------- 87,923 86.840 I 94.160 I 88,218 102, 810 92,712 83,692 89,681 79,210 Orders, unfilled, end of month .•... do .... --------- 33,730 34,958 40,314 36. 931 I 38. 053 39,252 28, 179 32,755 30,324 Price, wholesale, "B" grade, English fin·
s.45 1 ish, white, f. o. b. mills.dol. per 100 lb .. 5. 70 5.45 5. 45 I 5. 45 5. 45 5.45 5.45 5. 45 5. 45 Production .................. short tons .. 02,187 85,779 i 89,642 oo8~~i I 1027~8~ 00,289 96,088 87,953 79,345
Percent of potenthl capacity ........... --------- 73.8 68.7 72.5 77.7 77.4 73.9 68.8 Shipments .. _ ................ short tons .. 89,321 86,076 91,667 89, 377 1 104, 196 88,980 89,393 84,862 82,516 Stocks, end of month ............... do .... 109,975 109,604 107,518 107,602 106,435 106,381 • 58,282 • 60, 981 ' • 57, 770
Fine paper: Orders, new .......................... do .... --------- 48,225 32,750 34, 511 35,064 48,124 33,294 37,294 31,538 30,967 Orders, unfilled, end of month ....•.. do .... --------- 16,174 12,692 11,864 11,187 14, 227 12,280 9, 523 8, 796 10,827 Production .........................•. do ... _ -------- 45, 149 37,813 36,001 36,680 45,046 38,075 43,043 33, 491 29,342 Shipments ........................... do .... l_ ------- 46, 526 35, 158 35,803 36,022 46, 511 36,935 41,166 32, 216 29, 69! Stocks, end of month ................. do .... l- ·--··---- 71.948 74,378 65,480 65,384 63,976 66,573 61,504 62,669 60,539
Wrapping paper: Orders, new .......................... do .... l ........ 189. i\30 142,220 148,562 163, 622 186,433 "' "l"" "" 146,4041140,746
~~2J~~tl:,~:~e-~:~~~-~f-~~~-t~~::::::~~::::l::::::::: f>9, 322 68,956 64,300 71,599 62.718 58, 629 64, 050 64. 100 59, 354 191,105 151,076 151, 374 161, 510 19t, 280 159,353 184, 727 140,193 135,976
Shipments ........................... do _________ .... 189,695 149,033 149,088 159, 334 l95, 555 152, 265 180, 344 147,601 142, 166 Stocks, end or month ................ do ............. 124,683 126, 365 126,551 12Y, 835 126,936 132, 148 136, 617 128,990 1115, 283
Newsprint: Cana<la:
244, 65512QO, 17 4 Exports .......................... -.do .... _ ------- 245,813 211,452 193,624 152,437 217,651 162,352 244,400 Production ........................ do .... 288,726 245,295 209, 75~ 208,382 200,631 220,648 220,843 250.015 240, 545 227' 630 Shipments from mills_ ............. do .... 287,869 264,421 225,472 201,852 178, 236 205,099 214. 255 274, 635 232, 261 1221, 743 Stocks, at mills, end of month ...... do .... 193, 466 177, 157 161,438 167,968 190, 363 205,912 212, 500 187,880 196, 164 202,051
United States: Consumption by publishers ........ do.... 181,259 176,322 177, 134 160,916 !53, 346 174,096 179, 542 178,543 170. 980 I 172, 861 Imports§ .......................... do .... ; 261,667 229,284 209,782 183,050 144, 308 i 189, 360 I 209, 597 250,668 216, 580 i 201, 99! Pri!'e, whole•ale, .rolls, contract, dest.ina- 1 . ' 1
' t10n (N.Y. bas1s) .. dol. per short ton.. oO.OO 50.00 50.00 50.00 50.00 50.00 ! 50.00 50.00 50.00 ! 50.00 Production ................... short tons.. 78,886 78,390 75,855 77,264 70,868 79,929 77,393 85, 872 80.562 i 74,932 Shipments from mills .............. do.... 81,410 76,278 77,974 72,967 71,926 81,616 77,463 84.443 8i, 628 ! 75) 354 Stocks, end of month:
At mills .... ___ ................... do .... 13,399 20,702 18,583 22,880 21,822 20, 135 20,065 21,494 17,428 l 17,006 At puhlisherst ................... do. ___ 295, 589 291,477 284,661 2o7, 155 251,041 223,469 206,727 229, 142 230,443 1 252,664 In transit to publisberst .......... do... 50,656 44,628 30,677 36,872 13,449 32. 580 I 37.253 39,251 47,737 1 43,459
Paperboard: • Consumption, waste paper ........... do .... l339,335 243,924 221, 768 233,311 247,710 292,474 262,918 264, 348 259. 996 i 255, 830 Order•, new __ ......................... do .... 414,224 327, 168 334,711 342, 408 338,030 429, 545 . 347, 575 372,893 383, 371 1382, 682 Orders, unfilled, end of month ........ do.... 204, 800 89,586 94, 411 109,099 112, 801 124,420 97, 340 I 93, 643 95,058 108,427 Prodnction~ ·-- ............ _ •...•.... do .... 482,808 344,445 I 329, 181 323,394 338,803 421, 576 372, 984 375, 772 376, 509 366, 605
Peroent of cap>lCity....................... 81.8 66.3 60.1 61.2 67.8 73.4 69.1 64.2 66.61 63.9 Stocks of waste paper, end of month: At mills ...................... short tons .. 215,850 274,951 290,648 282,095 262,344 248,595 255,354 259,423 255, 677 257, 889
PAPER PRODUCTS
I Coated abrasive paper and cloth: I Shipments ·------------···--········reams .. 87,504 72,029 62,309 81,867 77,477 85,778 85,267 80,246 80, 115 i 76,903 I
Paperboard shipping boxes: Shipments, totaL .............. mil. of sq. ft .. 2,997 2, 547 2, 239 2, 222 2, 304 2,827 2, 395 i 2, 627 2,6241 2,444
Corrugated ........................... do .... 2,820 2, 385 2,081 2, 075 2,145 2, 640 2, 218 . 2,430
']l: I 2, 242
Solid flber .............................. do ..•. 177 163 158 146 !59 187 177 197 202
PRINTING
Book puhlications, totaL ....... no. of editions .. 885 900 1,118 659 876 945 1, 222 835 636 . 798 New book5 ....... - ...................... do .... 786 790 961 602 691 803 1, 043 708 537 i 669 New editions ........................... do ..•. 99 110 157 , '" I ,., 179 121 99 1 129
Continuous form stationery ..... thous. of sets .. 144,291 119,903 125, 811 Ill, 211 107, 557 128, 508 108, 597 116,9351128, 5831 112, 194 OpPrations (productive activity) .... 1923=100 .. 84 89 87 I 92 s6 871 84 81 76 Sales books, new orders ....... thous. of books .. "i9; 387 16, 256 14, 788 15, 998 I 16, 286 16, 889 16, 041 16, 498 16.466 ' 16,549 I
I
RUBBER AND PRODUCTS
I 15, 559 I 3, 695
17, 737 69.9
16,287 14,971
107,028 41,701
5.45 98,180
78.7 gr., 337
• 59,839
40,831 10,470 43,122 42,448 61, 132
195,375 67,038
187,921 191,030 112,542
i 235, 487 236,975 224,367 214, 659
!
33,887 12,862 19, 401
75.0 20,328 13,807
149,857 77,330
5. 45 101,148
85.8 108, 744 • 50,209
74,053 41,103 40,941 42, 303 59,739
265,252 151, 552 169,259 178,678 111,603
I
23,872 12,813 24,343
91.4 24,291 13,848
125, 511 85,832
5.65 118,967
m .. 9
9 119,489 a 49,39
44,731 40,80 44,41 46,35 57,75
191,25 154,64 185,94
2 0 5 2
0 7 4 2 0
191,00 106,97
228, 163 i 270, 49 253, 230 1 280, 98
3 5 0 9
267, oos 1 289, 26 200,884 i 192,60
159,647 177,078! 195,51 195, 644 250,005 : 282, 58
I I .10.00'
80,000 79,060
17,916 277,589 39,862
314,316 454,817 119,502 443,226
72.4
246,219
86,401
2, 635 2, 911
27ti
746 617 127
126, 5&2 78
17,414
50.00 i 11,309 1
78,559 !
50.0 78,59
0 1 4 79,36
16, 696 i 11\, 92 283,292 1,285, 33
3 3 3 47,776 50,05
320,073 365, 39 628,272 41)7,83 290,467 285,93 445,337 506,46
75.51 85.
214,352 1 21s, 64 9
94,993
2,815 3,059
244
1,204 9GG 238
137,299 18
18,947
102,18
3, 41 3,17
24
88 77 11
162,23 7
20,28
--
2 2 0 0
-----------------------.----.---,---~------------,----,---,----,----,---
49, 050 48. 143 . 46 234 . 4° 3651 50 165 44. 166 44.377 47.259 I 43.880 50.481 i 50. !50 ~ 55.764
CRUDE AND SCRAP RUBBER Crude:
Consumption, totaL_ ............. long tons.. 54,322 For tires and tubes (quarterly) ....... do ............ _
Imports, total, including latex§ ........ do.... 42,372 Price, smoked sheets (N.Y.) ..... dol. per lb.. . 202 Shipment•. world ___ .............. long tons __ ........ -Stocks, world, end of month .. ~--··--··-do ........... ..
Afloat. total ......................... do .. .. For United f-:tatcs .................. do .... I14,044
Lon<lon e.nd LiverpooL .............. do .... '---British Malaya ...................... do.... 60, n9 United States ......................... do .... I18,535
Reclaimed ruhber: Consumption ....... _ .. _ ................. do ... _ Production ___ ------ __________ -------- __ do ___ _ Stocks, end of month ..................... do ....
1
.
Scrap ruhber: Consumption by reclaimers (qu<~r.) .... do .... ,.
lF:,(;(lf) 20,7.35 22, 3C~
'Revised. • Estimated.
32,924 ~U~! --36;857- --3~8~61 ~~:n~ -3i-s54 .. 45;784 ·~u~~ ~--37;222· .. as;4osl--s7;5ot"~"'45;34o . 163 . 163 . 158 . 1.59 . 161 :!59 .1611 . 1£4 . 165 . 167 1 . 213 ' . 199
68, 000 58, 000 81\, 000 77. 000 I 75, Q(lO 74, 000 70, 000 I 66.000 84, 000 92,000 I 94.000 Jl3, 000 512,000 483.000 498,COO 480,000 461,000 438 000 1430,000 408.000 141\1,000 '397,00(1
11'397,000 [414,000
92, ooo so. roo 10.1, ooo lOti, ooo 1
102, ooo gg' ooo 96, oco 88, ooo 105, ooo 120, ooo '134, ooo i 17:l, ooo 51, 114 I 4fi, 105 48, 210 5.1, 814 55,981 57.9181 54,046 51,274 52,990 6G, 717 i 68,310 : 100,500 90, 073 86, 853 so. 643 75. 517 1 72, n.s 68,931 66,020 I 63,878 57, 234 '44, 917 , ' 39. 3c9 I 38, 2r,9 87. 531 84, 49\J 90, 142 87 gog I s1 274 I 77 683 74, 3os '75, 419 83,010 71, I9.s 1 7u. 2:s 71, oo2
242, 592 231,,500 221,880 210:093 205:214 192: G~8 I 193,651 180,343 i 173,395 161,233 '1
147, 2SfJ o'l31, 240
t:J, 522 13,096 13.000 12,626 ~ 15,322 I 13, :J9] I 13,517114,870 'I' 13, 542 16,846 ·I' 1D, P53 18,\153 15,124 15,?99 13,7113 1" 093 · 14,5281 14,527, 14,769 15,871 12,588 17,21-1, 17,\J:.o; 20,896 17,083 23, 000 ' 21,960 2J: 390 I 19,955 : 22,628 ! 22,771 I 23,058 ~ 21,339 ' 20,645 : 21, ]b5 • 21,829
......... ! 36,248 [ .•..••.•. i ......... i 36,4961 ••••.••.. 1 ......... 1 34,204 [ ......... I ........ I 38,321 : ....... .
•f'hange In Inventory due to physical check-up. Fi~ures prior to May 1939 not comparable with !ater data. . . . . . . tRevised series. For book paper, 'ee note marked w1th a "t" on p. 51 of the July 1939 Sun·ey. Stocks of newspnnt at pubhshers, and m trans1t to pubhshers, reVIsed
for 1937 and 1938; revisions not shown on p. 52 of the April1939 Survey will appear in a subsequent issue. §Data revised for 1Y37; see table 20, p. 15 or the Aprll 1939 Survey.

.JANUARY 1940 SURVEY OF CURRENT BUSINESS 53
Monthly statistics through December 1937, to-~19391 1938 \ 1939 gether with explanatory notes and references ---
1 1 1 to the sources of the data may be found in the Novem- Novem-1 Decem-\ Janu- I Febru-1 '·Iarch I April I May June I J 1 A t Sep- I Octo· 1938 Supplement to the Survey . b<lr ber ber ary 1 ary " ___ ....__u_.Y _ _.__u_g_u_s__,_t_e_m_b_e_r_,__be_r_
RUBBER AND PRODUCTS-Continued
TIRES AND TUBES I I
f
Pneumatic caslngs:t Production .. ____ ..... _ ........ __ . thousands._ 4,867 4,139 4, 729 4, 581 4, 344 5,137 4, 211 4, 418 4,870 4, 510 5, 492 5,007 5,431 Shipments, totnL ________________ ..... do ....
1
4, 244 4,405 4, 154 4,163 3. 739 4, 583 4,356 4, 753 5, 750 5, 056 4, 919 5,621 5,188 Original equipment• _________________ do ____ 1, 823 1, 777 1. 707 1, 685 1, 472 1, 747 1, 529 1, 415 1,370 809 611 1, 249 1,805 Replacement equlpment• ............ do .... 2, 273 2, 544 2,348 2, 397 2,156 2, 723 2, 719 3, 239 4,267 4, 162 4, 205 •4,227 3, 237 Exports• ______ ....................... do .... 148 84 99 1 81 Ill 113 108 100 113 85 103 146 146
Stocks, end of rnontiL ................. do .... 9, 244 7, 924 8, 451 ! 8, 932 9, 573 10,109 9,998 9, 919 8, 909 8, 300 8,891 8, 364 8,657 Inner tubes:t
Production __ ------------ .............. do .... 4, 513 4, 029 t 351 f 4, 098 3, 681 4, 470 3, 841 3,848 4,320 4, 043 4, 918 4, 512 5,073 Shipments, totaL .... _---------- ...... do .... 3, 940 4,138 3, 859 1 3. 936 3,335 4,015 3, 927 4,154 5,123 4,285 4,432 5,025 5,012
Exports• ... _ ...... ___ ............... .do .... 127 55 55 71 65 74 82 67 ~6 62 65 98 108 Stocks, end of month .................. do .... 8, 214 7, 665 s. w6 I 8, 069 8,-115 8,901 8, 837 8, 840 8,044 7,819 8, 238 7,846 7, 717
Raw material consumed: ! _____ ___! Crude rubber. (See Crude rubber.) Fabrics (quarterly) _____________ thous. oflb .. -·------- -------- os, 376 I -------- 59, 801 --------- --------- • 62,419 --------- .. -------- --------- --------
I RUBBER AND CANVAS FOOTWEAR i
Production, totaL ______________ thous. of pairs .. 6,049 5, .113 5, 523 •, 4. 807 4, 953 5, 897 5, 2161 5,033 4,866 3,280 5, 090 4, 713 5,332 Shipment•, totaL ....... _________________ do .... 5,473 6, 139 5. G35 i 4, 778 4, 629 5, 214 4,414 4,017 4,192 4, 894 6, 213 6, 452 5, 916 Stocks, total, end of month .. ____________ do ____ 15, 195 15,695 16. 1R3 I 16, 157 16, 582 17,281 18, os3 I 19,055 19,729 18, 115 16,956 15,218 14,619
I
STONE, CLAY, AND GLASS PRODUCTS
PORTLAND CEMENT
I. 6671 Price, wholesale, composite ....... dol. per hbL_ (1) I. 667 I. 667 I. 667 (1) (1) (!) (1) (1) (1) (1) (1) Production. ____________________ thous. of bbL. 11,053 10, 184 I 8, 066 5, 301 5, 505 8,171 9, 674 11, 185 11,953 12,644 12,369 11,937 '12, 539
Percent of capacity _______________ ............ 52.1 48.2 36.9 24.3 27.9 37. 4 45. 7 50.9 56.5 57.9 56.6 56.3 57.2 Shipments ... ____ .. ______________ thous. of bbL. 10, 146 8, 573 6,290 5, 640 5,044 8, 467 9, 65-l 12,748 12, 715 11,755 13,401 13, 104 '12,829 Stocks, finished, end of month _______ .... do ____ 20,776 22.179 23,947 23.611 24,092 23,786 23, 837 22,2.51 21, 477 22,361 21, 327 20,160 '19, 869 Stocks, clinker, end <>f month_ ... _______ .do .... 4,880 4. 963 5, 282 5. 563 5, 986 6, 447 6, 568 5, 728 5, 797 5,928 5, 727 5, 25·1 '4,854
CLAY PRODUCTS
Bathroom accessories: I 806 I Production .. ____ -------- ____ thous. of pieces .. I 1, 022 1,189 953 831 728 583 762 814 1, 027 1, 1681 1,148 1, 282
Shipments _________ .-------------- __ ... do ... _ 958 1, 070 891 795 673 720 552 792 819 908 1, 213 1,160 1, 215 Stocks, end of month .................. .do _____ 375 195 ' 219 255 321 350 374 377 382 388 376 397 i 369
Common brick: I Price, wholesale, composite, f. o. h. plant
dol. per thous .. 12,083 12.039 12.046 12.023 12.024 12.032 12.026 12.077 12.118 12.059 12.038 12,038 12,043 Shipments ... _____ .. _______ .. thous. of brick __ 151,568 133, 184 101,056 95,920 166,380 178,903 209, 716 199, 945 1 Tl, 165 189, 287 •167, 348 183, 164 Stocks, end of month ___________________ do .... --------- 482.032 478,260 476,359 455,859 39i, 838 374, 572 351, 155 361, 264 393,393 416,302 r451, 390 466,051
Face brick: Shipments .. _._. ___ ------------- .. __ ... do .. __ --------- 45, 701 37,307 34,499 28,785 57, fl24 62,982 79,349 69,489 62, 658 66,906 '62, 527 64,274 Stocks, end of month __________________ do ....
1
......... 272,200 283,017 292, 5~5 I 300, 546 290,906 277,291 256,825 252,395 248, G73 245,967 r241, 785 236,770 Floor and wall tile shipments:• 1
3, 996 3, 261 3, 5491 3, 562 4, 969 4, 639 4, 737 5, 028 6, 331 '5, 587 5,665 Quantity _____________________ thous. of sq. fL. ________ 5,169 Value __________________________ thous. of doL. --------- 1,129 9.56 981 959 1, 285 I, 208 1, 282 1, 423 1, 359 1, 663 l, 500 1, 506 Vitrified paving brick:
Shipments ................... thous. of brick ... --------- 7, 206 7, 191 4, 276 2,007 3, 994 3, 612 6, 647 6, 844 6, 386 9, 038 8,149 8, 969 Stocks, end of month ___________________ do .... --------- 51, 323 48,127 48, 763 48,585 47,336 45, 761 43,002 44,079 44, 214 44, 169 43,719 42,156
Hollow building tile: Shipments .... _._ .. _____ .... _ ..... short tons .. --------- 54, 762 46,815 50,024 43,643 72, 546 81,994 105, 173 96, 28S 95.180 107,771 '90,184 89,700 Stocks, end of month ................... do .... --------· 335, 707 347. 147 342,408 348,792 340,348 327,847 307,810 306,435 305; 242 319,464 •316, 376 324,886
GLASS PRODUCTS I Glass containers: t
Production ................... thous. of gross .. 4,300 '3, 712 r 3, 519 '3,585 '3.386 '4,125 4, 071 4, 51fl 4, 662 '4,593 4, 8021 4, 250 I 4,891 Percent of capacity--------------- ____ ...... 69.1 64.6 58.8 55.8 55.7 61.4 65.4 69.7 72.0 73.6 71.4 GS. 3 75.5
Shipments ................... thous. of gross .. 3,884 •3,481 '3,046 '3,464 '3,320 '3, 931 3, 978 4, 485 4, 618 '4, 158 '4, 766 4, 979 4,471 Stocks. end of month ................... do .... 8,374 '7, 743 '8,130 8,179 8,192 '8,316 8, 336 8, 293 8, 209 '8,572 8,548 7, 739 8, 061
lllum inating glassware: Shipments, totaL .............. thous. of doL. (2) 532 443 443 357 396 (') (') (l) (2) (2) (2) (') Residentie1. _________________________ do ____ (') 288 227 217 185 201 (') (') (') (') (') (') (') Commercial __________________________ do ____ (') 133 125 130 107 116 (') (') (2) (') (2) (2) (')
Mtscellaneons .............. __________ do .... (') 111 91 97 65 79 (') (2) (l) (2) (2) (2) (2) Plate glass, polished, production. tho us. of sq. It. 15,812 12,883 12,691 12,209 10,165 11,867 7, 268 8, 036 9,289 6, 212 10,450 13,663 18, 369 Window ~lass:
Production_. ________________ thous. of boxes .. 1,143 883 1,003 943 809 912 740 729 720 690 867 914 1,121 Percent of capacitY------------------------- 70.5 54.4 61.7 i 58.1 49.8 56.1 45.6 44.8 44.3 42.6 53.4 56.2 69.1
GYPSUM AND PRODUCTS
l Crude: Imports __________________________ short tons .. --------- 247,673 -------- --------- 40,423 --------- --------- 291,810 --------- --------- 445,756 I _______ Production_ ......... ------- .. _ ......... do .. _. --------- 683, 127 -------- --------- 541,183 ---------- --------- 845,524 ---------1995, 760 ----Calcined production ..................... do .... --------- 534,415 --------- --------- 533,440 --------- --------- 773, 634 --------- 840,245 .. . -
Gypsum products sold or used: Uncalcined ............................. do .... --------- 192,931 ·-------- --------- 139,248 --------- --------- 244,163 --------- 286,391 Calcined:
Lath ..... ------------------tho us. of sq. ft .. --------- 214, 151 --------- --------- 207,418 --------- --------- 297,267 --------- --------- 342,060 Wallboard.------------------------- .do .... --------- 89,678 -------- --------- 95,981 --------- --------- 113, 721 --------- --------- 102,400 Keene's cement ................. short tons .. --------- 4, 884 -------- --------- 5, 506 --------- --------- 7, 781 --------- --------- 7, 949 All building plasters ................. do .... --------- 333, 730 -------- --------- 331,702 -------- --------- 486,494 --------- ·-------- 533,790 ~'or manufacturing uses ______________ do .... 36, 517 --------- --------- 26,233 25, 515 --------- ......... , 23,210 Tile ........................ thous. of sq. fL --------- 4, 885 -------- ·-------- 5, 228 -------- ------·-- 8, 581 --------- 9, 026
1
.
• Revised. • Estimated. 1 Discontinued by compilers; data on an Index basis appear on p. 20. J Discontinued by reporting source. •New series. For data on floor and wall tile beginning 1935, see table 31, p. 18 ol the June 1939 Survey. For the new series on pneumatic casings and inner tnbes see
tables 27 and 28, pp 16-18 of the May 1939 Survey. tRevlseil serie-s. Data for pneumatic casings and inner tuhes revised for 19~6. 1937. and 1938: see tahlos 27 And 28, pp, 16-18 of the May 1930 Survey. Data for glass
containers revised beginning 1936: the revisions, which for the most part ara small, will appear in tlJe 1940 Supplement.

54 SURVEY OF CURRENT BUSINESS JANUARY 1940
Monthly statistics through December 1937, to-~19391 1938 I 1939 geth.r witb explanatory notes and references ---
1 1 to the sources of the data may be found in the Novcm- Novem- Decem- Janu· I Febru-j March April I May I June I July I August I Sepbtecrm-1 Obectro-1938 Supplement to the Survey ber her ber ary ary
TEXTILE PRODUCTS
CLOTHING I Hosiery: Production •.•.•••••••• thous. of dozen pairs .. ! 12, 9R7 11, 731 10,863 11, 2351 11,374 13,198 Shipments .• _ .•.••• ---------------- .... do. ---1 12 451 11,973 10,641 10,211 10,535 13, 142 Stocks, end of month .•••••••.•........ .do •••• 24,721 19,843 20,217 21, 301 22,201 22,317
COTTON
Consumption._ .. --------------------- __ bales._ 718, 721 596,416 565,627 598,132 562,580 649,940 Exports (excluding linters)§ ..•. thous. of bales .. 584 480 368 290 264 330 Imports (excluding linters)§ .............. do .... 11 14 11 12 8 10 Prices received by farmers ........ dol, per lb ... .088 .085 .082 .083 .082 .083 Price, wholesale, middling (New York) .. do .... .098 .091 .087 .089 .090 .090 Production:
0 innings (running bales)• ____ thous. of bales __ 11,112 11,231 11,412 11,553 -~--- ---~
•11, 623 Crop estimate. equivalent 500-lb. bales .. do .... • 11. 792 -------- • 11,944 --------- --------- ---------
Movement Into slght.. ................... do .... 2, 288 1. 739 802 437 41R 428 Stocks, world, end of month* ............ do .... (') '40, 729 '38,331 '35, 898 '33, 567 '31, 005
American cotton _____ .................. do .... (1) '21, 545 '20, 605 '19, 626 '18, 713 '17, 670 In the United States.. _______________ do .... --------- '19,218 '18, 286 '17,399 r 16, 570 '15, 626
On farms and in transit ............ do .... --------- '1, 985 • I, 319 '1,085 '949 '803 Warehouses ••• ---------------------do .... --------- '15, 554 '15, 302 r 14,721 '14, 101 '13, 446 Mills. _______ ----------------------do .... --------- I, 679 '1,665 'I, 593 1, 520 '1,377
In foreign countries. -----------------do .... (1) '2, 327 '2, 319 '2, 227 '2, 143 '2, 044 Foreign cotton.---------------- ........ do .... (1) ' 19, 184 '17, 726 '16, 272 '14, 854 '13, 335
COTTON 1\IANUFACTURES
Cotton cloth: Exportst ___ ................. thous. of sq. yd .. 35,564 26.329 28,634 20. 768 27,618 33,135 Imports§. __ . __ ........... -------------- do .... 11,859 4, 912 6,188 8,534 9, 210 10,108 Prices, wholesale:
14.93 Mill margins• ................ cents per lb .. 10.78 10.69 10.46 10.051 10.11 Print cloth, M x 60 ............ dol. per yd .. , . 053 .045 .043 .043 .042 .043 Sheeting, unbleached, 4 x 4 ........... do .... l .068 .054 . 051 .050 .050 .050
Finished cotton c!oth:t I Production:
Blenched, plain ............... thous. or yd .. --------- 134,661 141,266 127,165 126,641 144,021 Dyed colors. ___ .................. _ ••. do .... 100,200 102,504 91, 115 93,483 109,652 Dyed, black .... ------------------ .... do .... --------- 6, 617 6, 369 4, 780 5,130 6, 633 Printed ____ --------------------------do .... 109,130 118,926 107,900 106,396 127,815
Spindle activity: 22,774 Active spindles._._ .............. thousands._ 22.447 22,433 22,497 22,533 22,503
Active spindle hrs., totaL ........ miL of hrs .. 8,803 7, 564 7,185 7, 642 7, 164 8, 243 Average per spindle in place ........ hours .. 353 290 276 295 277 319
Operationst ................. pet. of capacity __ 101.3 83.4 82.3 85.7 87.8 86.7 Cotton yarn: I
Price, wholesale, 22/1, cones (factory) _ dol. per lb.. . 2t9 .240 .225 .220 .224 . 225
Price, wholesale, 40/s, southern. spinning I dol. per lb .. --------- .341 . 338 .335 . 335 .335
RAYON AND SILK I Rayon:
915 Deliveries, yarn, unadjustedt ... 1923-25= 100 .. 595 691 745 735 670 Imports§ ________________________ thous. of lb._ 5,67i 2,031 1, 781 2,877 3, 395 3, 955 Price, wholesale, 150 denier, first quality
.53 (N. Y ) ________________________ dol. per lb .. . 51 . 51 .51 -51 -51 Stocks, yarn, end of mo.• .......... mil. of lb .. 7. 5 40.0 39.5 39.4 39.5 41. 1 I
Silk: I Deliveries I consumption; ______________ bales .. 32,241 41, 599 35,204 40,816 33,219 37,863 I Imports, raw ___________________ thous. of lb .. 5,423 6,437 5, 542 5,039 3, 040 3, 555 Price, wholesale, raw, Japanese, 13-15 (N.Y.)
3.:i94 dol. per lb .. 1.801 1.809 1.9qf) 2.H4 2. 218 Stocks, end of month:
92,527 Total visible supply _______________ . __ bales .. 150,718 149,778 124,354 98,078 86,816 United States (warehouses) ........ do .... 41,927 46,218 53,278 48,554 38, 178 23, 116
WOOL Imports (unmannfactnred)§ ....... thous. of lb .. 22,909 16,302 18, 162 21,938 17,274 25,441 Consumption (scoured basis):,
26,426 ~~r;:~~f~~~~~ ~ ~::::::::::::::::: ::::::: g~:::: 23,512 29,688 25,941 22,449 21,110 9, 238 7, 716 9,501 9, 784 8, 776 V,856
Operations, machinery activity (weekly aver-age):,
Loom<: Woolen and worsted:
Broad ............. thous. of active hours .. 2.043 1, 530 1, 777 1,924 1,942 1, 580 Narrow ___ ----------------------- .. do .... 101 86 82 79 78 75
Car12et and rug. ---------------------do .... 213 172 178 186 209 213 Splnn mg spindles:
80,173 Woolen __ ----------------------------do .... 71,285 72,928 73,480 73, 130 60, 041 Worsted ... --------------------------do .... 103,3:13 86,385 97,458 87,770 82,226 77,747
Worsted combs .. ----------------------do .... 157 147 150 129 137 124 Prices, whole•ale:
Raw, territory, fine, scoured ...... dol. per lb .. 1. 06 . 74 .73 .73 . 73 • 72 Raw, Ohio and Penn. tleeces ........... do .... .47 .32 • 31 -31 .32 .30 Suiting, unfinished worsted, 13 oz. (at fac-
tory) __________________________ dol. per yd .. 2.178 1.624 1. 634 1. 634 1.646 1. 683 Women's dress goods, French serge, 54" (at
mi!l) ___________________________ dol per yd __ 1.163 1.040 1.015 1. 015 1. 015 1.015 Worsted yarn, 32's, crossbred stuck (Boston) I
dol. per lb .. 1. 46 1.12 1.11 1.10 • 1. 13 1.13 • Revised. • Total crop. • As of Decem her 1. I Data unavailable due to war situation.
11,024 11.796 11.218 9,819 12,448 10, 577 10,891 10, 294 9, 483 12,924 22,823 23,789 24,773 25,109 24,634
543,187 606,090 578,436 521,353 628,448 178 143 114 107 219 13 14 12 16 13
.082 .085 .087 .088 .087
.088 .096 .099 . 097 .094
--------- --------- --------- 137 1,402 --------- -----87ii' 276 296 328 565 '28, 656 '26, 155 '23, 723 '21, 462 (') '16, 766 '15, 772 '14, 826 '14, 030 (') '14, 921 '14, 171 ' 13, 487 '12, 956 23,534
'718 '646 '595 '550 11,154 '12, 948 '12, 393 '11, 920 ' 11, 591 11,774
r 1, 255 1, 132 '972 '815 606 '1,845 '1, 601 '1, 339 '1, 074 (1)
'11, 890 ' 10,383 '8,897 '7,432 (1)
29,726 23,980 26,982 28,674 23,878 6,566 5, 581 7,151 6, 750 6, 776
10.01 9.33 9.84 10.52 11.41
:~:~ I .042 .045 .047 .047 .049 .052 .053 .053
131, 715 127, 104 127,634 137, 722 ~~~:~~ . 98,292 89,020 90,267 102.281 4, 962 5, 782 5, 843 6, 543 i, 305
109,250 108,736 90,265 87, 281 99,242
22,123 21, 970 21,771 21,939 22,012 6,895 7, 573 7, 399 6, 621 7, 908
269 297 290 262 313
84.71 81.11 82.5 81.9 85. I
.225 .228 • 235 . 238 .240
. 335 . 335 .335 .346 -349 ' I
664 669 867 925 792 i 3,457 3,322 4,159 3, 503 3,423 I
. 51 . 51 -51 . 51 I
, 52 I
43.4 41.5 32.6 24.9 18.9
27,802 26,150 26.256 26,134 33,095 3, 943 3, 592 4,050 2, 614 4,495
2.393 2.689 2.534 i 2. 648 2.641
77,238 61,601 60,709 73,348 81,060 20,738 24,201 19,209 25,748 25,000
18,826 20,542 14, 771 14,054 16,709
1C, 567 20,244 23,7721 27,489 24,707 8,159 5,852 6,291 7, 984 9,604
I 1, 338 1, 573 1, 791 1, 759 1,698
62 69 73 69 82 198 175 178 155 199
72,489 55,704 63,248 73, 739 77,201 67,613 79,174 82,819 71,306 77,698
95 117 136 132 145
.89 .69 .71 .72 . 73
.28 .30 .32 .32 . 331
1.683 1.683 1. 683 1.683 1. 683
1.015 1.0lo 1. 015 1.015 1. 015 1
1.13 1. 13 1.13 1.13 1.15 : • Total ginnings to end of month indicated.
12, 12 24,
624,
6,
2, (' ('
22, 7,
14,
(1 (I
30, 11,
334 13, 194 820 13, 156 147 24.186
902 686, ~:16 649 886
10 I 14 091 _ os; 093 . 093
687
761
~ 383 409 151 823 ) )
023 189
10,085
3, 093 (1) (1)
20,830 3, 972
15,441 1, 417 (1) (lj
40,494 11, 774
14. 56 054 063
15.83 .055 . 069
153, JOG,
8. 113,
22, 7,
g
3,
1
36, 7,
2.
89, 27,
26,
25, 8,
1,
74, 81,
025 Gi8 056 380
232 695 306 2 .. 1)
266 .
389
924 108
-53 3.0
869 2fJ2
993
160 760
625
006 847
549 81
196
103 611 144
1 .02 .45
1.
1.
1
906
101 !
. 38 I
173,256 l20,41i0
8, :l22 124,201
22,659 8, 581
312 97. 9
• 2i7
. 404
'!J(J9 4,062
. 53 9.4
41,858 6, 930
3. 271
89,135 35,935
19,832
33.984 ll. 274
81,748 105, 604
167
109 -49
2.178
1.163
1. 53
t Revi~ed series. Cotton spindle activity revised beginning August 1933; see table 18, p. 1~, of the March 1939 issue. Data on rayon deliveries revised beginning January 1936; re.isions not. given on p. 94 of the February 1939 Survey will appear in a subsequent issue. Data on cotton cloth exports revised beginning 1913; see table 48, p. 16, of the Nm·ember 1939 issue.
~See note marked with a"~" on p. 54 or the July 1939 Snrvey. *New series. The data on cotton storks shown here are comp!led by the New York Cotton E:rchanqe and replace the data compiled by the Commercial and Financial
Chronicle. Data beginning 1920 appear in table 34, pp_ 15 and 16 of the August 1939 Survey. Dflta on total stocks of foreign cottons and total world stocks of all cottons beginning August 1931 and all other series beginning August 1938 haYe heen revised. Revisions not shown above will appear in a subsequent issue. For cotton cloth mill margins data beginning 1925 are shown in table 51, p. 18 of the November 19:l9 issue. Data on rayon yarn stocks, poundage basis, have been substituted for the series formerly sbown, which was on basis of number of months' supply. Figures beginning January tno not shown on p. 94 of the February 1939 Survey will appear in a subsequent issue,
§Revised series. Data revised for 1937; see tables 19 and 20, pp. 14 and 15 of the Apr;j 1939 Survey. ,Data for December 1938, January, April, July, and October 1939 are for 5 weeks; other months, 4 weeks.

JANUARY 1940 SURVEY OF CURRENT BUSINESS 55
1939 lllonthly statistics through December 1937, tc• I 19391 1938 I gather with explanatory notes and references ~--- -- __ _:_:_ __ _ tc the sources of the data may be found in the Novem Novem-1! Decem- Janu- I Febru-1 M reb I A ·1 1938 Supplement to the Survey ber ber ber ary ary a prJ I May I June I July I August I te~~~r joctober
TEXTILE PRODUCTS-Continued
WOOL-Continued
Receipts at Boston, totaL ••••••••• thous. of lb .• ---------
~gr'!l~"J~~::: ::::: ::::::::::::::::::::::~~:::: ~. ~01 Stocks, scoured basis, end of quarter, total
24,341 21,239 3,103
thous. of lb •• --------- --------Woolen wools, totaL ••••.•••••••••••••. do •••. --------- ---------
Domestic_. ------·-------------------do •••• --------- ---------Foreign . _._-------------------------do _____________ ---------
Worsted wools, totaL •••••••••••••••••• do ____ --------- ---------Domestic _____________________________ do .... _________ ---------Forei~:n. --------------·--------------do .•.. ____________ •• ----
MISCELLANEOUS PRODUCTS
Buttons, fresh-water peart Production __________________ pet. of capacity __ •... ____ _ Stocks, end ofmonth •••••••• thous. of gross .. -----·---
Fur. sales hy dealers. ____________ thous. of doL. •1, 940 P:yroxylin·coated textiles (artitlcial leather):t
Orders, untllled. end ofmo .. thous.llnear yd .• Pyroxylin spread.·-------------· tho us. of lb .. Shipments, billed .••.•.•.•.• thous. linear yd ..
3,132 5,413 5, 556
36.3 r 7,163 r 1,292
1,917 4, 289 4,168
13,678 15,539 9,009 5, 374 4,670 10,164
115,655 ---------46, 6S6 ---------37,065 ------·--9,621 ---------
68,969 ---------52,517 ---------16,452 ---------
'28.9 23.0 r 6, 795 6, 480
1, 524 2,479
2,145 2, 451 4,692 5, 270 4,561 4, 785
11,820 13,608 17,173 6,660 5,939 10,241 5,160 7,669 6,932
--------- 94,1i06 ------------------ 39,019 ------------------ 29.458 ------------------ 9, 561 ------------------ 55,487 ------------------ 33,452 ------------------ 22,036 ---------
39.2 39.2 34.6 6, 507 6,607 6,641 2,900 3, 552 2,293
2,223 2,188 2,252 5,079 5,402 4,643 5,119 5, 506 4, 576
31,461 25.641 5,820
---------------------------------------------------------------
'25.6 r 6, 280 r 2, 695
1,887 4, 727 4, 759
TRANSPORTATION EQUIPMENT
AIRPLANES
Production. total, __ -------------- ..•• number __ --------- 204 276 208 266 352 379 475 Commercial (licensed)_. _______________ do •••• --------- 159 174 136 152 220 270 319 For export. _________ ------------ _______ .do •••• 62 45 102 72 114 132 109 156
I
AUTOMOBILES Exports:
Canada: Assembled, totaL _________________ number .• 4,874 2, 747 5,024 8,499 6,043 6,315 2,274 5,480
Pnssrnger cars .•••.•••.•.••••••••••• do •••• 2,386 2,406 3,835 5,806 4, 222 4,526 1, 592 4,075 United States:
Assemhled, total§ __ --------·-··------do .••. 19,676 29,043 34,978 23,958 27,351 30,048 27,087 25,220 Passenger cars§----- ________________ do ____ 10, 678 20,172 21,322 15,126 16,193 17,984 16, 213 14,430 Trucks§ ..•• __ • _____________________ do ____
8, 998 8,871 13,656 8,832' 11,158 12,064 10,874 10,790 Financing:
Retail purchasers, totaL ••••••. thous. of doL. --------- 86,047 92,452 76. 390 I 76. 776 113,847 114,696 133,707 New cars _______ ----------------------do .•. _ 51,266 54,933 40, 694 40,374 64,350 66,064 75, 3G4 Used cars_ ---------------------------do ____ 34,260 37,955 35, 281 35,975 48,915 48,014 57,649 Unclassified ----- ____________________ do ____ 521 564 415 427 .?82 618 754
134, t5o I tz4, 021 Wholesale (mfrs to dealers) ____________ do ____ 126,650 158,289 153,007 150,433 140,284 Fire-extinguishing equipment, shipments:
Motor-vehicle apparatus ..•.••••.... number .. 67 44 73 441 58 83 65 76 Hand-type. ____________________________ do .•.. 33,737 '28,149 27,479 30,649 ' 29,878 35,331 34,790 35,501
Production: Automohilcs:
Canada, totaL------------------- •... do .... 18,412 17,992 18,614 14,794 14,300 17,549 16,891 15,706 Passenger CflfS. __________________ •• do .. __ 9,882 15,423 14,198 11,404 10,914 12,689 12,791 11,585
United States (factory sales), totaL •.. do .... 3M, 782 372, 413 388,346 342. 156 303, 217 371,940 337, 372 297.508 Passenger cars. ____ ----------- _____ do. ___ 285,252 320,344 326,006 281.465 243, 000 299,703 273,409 237,870 Trucks ... _.----------------------- .do ____ 66, 530 52,069 62,340 60,691 60,217 72,237 63,963 59,638
Auton while rims ______________ thous. of rims .. 1, 783 r I, 705 1,818 1, 714 1,443 1, 730 1, 348 1, 244 Registrations:
New passenger cars _________________ number __ 231, 5il 200,853 226,973 203,212 164,942 248,038 268,335 280,834 New commercial cars __________________ do ..•. 41,286 23,943 31,474 37, 715 33,279 45,083 46,063 45,381
13ales (General Motors Corporation): To consumers In U. s __________________ do .••. 162,881 131,387 118,888 88,865 83,251 142,062 132, 612 129,053 To dealers, total* __ --------------------do .••. 200,071 185,852 172,669 136,489 133, 511 161,0!\7 142,002 128,453 To U.S. dealers ________________________ do ....
180, 133 159, 573 150,005 116,964 115,890 142,743 126, 275 112,868 Accessories and parts, shipments:
Comhined lndex. _____________ Jan. 1925=100 .. 135 136 138 148 139 147 136 128 Original equipment to veblcle manufac- '' turers __________ . __ . _______ Jan. 1925-100 ..
154 150 157 160 140 153 129 120 Accessories to wholesaler. ____________ do .•.• 107 126 129 131 140 142 132 115 Service part• to wholesalers .......••• do ____ [167 142 121 129 129 141 150 154 Service equipment to wbolesalers .... do .... 91 88 83 91 95 105 105 108
! JtAILWAY EQUIPMENT
(Association of American Railroadt)
Freight cars, end or mo.: 1, 641 Number owned. ___ . _____________ thousands .• 1,686 1,682 1,672 1,668 1,664 1,662 I, 657
Undergoing or awaiting classified repairs 159 233 225 225 214 221 thousands .. 231 231
Percent or total on line ___________________ 9.8 13.9 14.0 13.7 13.7 13.0 13.5 14.2 Ordel"3, unfilled .... _ --------------------cars .. 19,981 4,335 5,080 6,637 6, 788 6,502 6,391 9,261
Locomotives, end or mo.: Undergoing or awaiting classifl.ed repairs
6, 9R5 8,084 8,053 8,149 number •• 8,133 7,881 8,175 8,640 Percent of total on line ..• ------------------ 17.0 19.1 18.6 19.1 19.1 19.3 19.4 20.6
Orders, unfilled. ____________________ number .• 94 17 30 25 63 62 61 63 ( U. S. Bureau o( the Censm)
Locomotives:t Orders, unfiiiPd, end or mo., totaL.number .. 184 94 100 100 123 132 148 169 Dome~tic, totaL ___ ----------------_ .do .. __ 140 86 92 88 113 122 138 160
Electric.-------------------------_ .do. ___ 113 75 84 83 68 62 78 100 Steam. _____ -·----_ ••• ______ •• __ • __ .do ____ 27 11 8 5 45 60 60 60
55,614 55,355 51,401 51, 247 4,213 4,109
123.096 ---------39.602 ---------31,357 ---------8. 245 ---------
83.494 ---------63,128 ---------20,366 ---------
'28.6 26.3 6,232 5,873
r 2,686 r 2, 405
2,087 2, 243 4, 710 4, 351 4,387 3,971
679 329 530 207 149 122
I
6,027 4,821 4, 630 3,040
27,087 19, 183 16, 213 8, 375 10, 874 10,808
130, 671 114,481 73,022 64,003 57,028 49,932
621 545 118,268 96,621
90 75 37, 606 35,527
14,515 9,135 10.585 5,112
309,720 209. 343 246. 704 150,738 63,016 58, li05
1,020 681
243,741 229,308 40,482 44,747
124, 618 102.031 139,694 84,327 124,048 71,803
125 110
115 94 113 113 166 154 108 97
1,654 I, 653
22a 229 13.7 14.0
10,062 8, 448
8.382 8, 059 20.1 20.3
60 72
151 150 143 146 80 r 86 63 60
39,228 35,287 3, 941
---------------------------------------------------------------
'32.1 '5, 681 r 3,155
2,415 5,581 5,143
578 440 138
6,154 4, 804
11, 592 3, 985 7,607
109.739 59,265 49,903
571 44,564
76 38,821
3, 475 1, 068
99,868 61,384 38,484
971
182,633 43, 523
76,120 12, 113 7,436
117
96 104 166 106
1, 650
225 13.8
8, 754
8, 337 20.0
63
122 118
72 46
24,410 19,046 5,363
118,054 40,721 31,923 8, 798
77,333 57,080 20,253
'40.4 5, 697
r 3,155
4, 562 6, 243 5,807
486 424
62
1, 913 934
7,834 4, 493 3, 341
88,176 44,248 43,512
417 61,973
77 35,804
3, 921 3,494
188, 7.?1 161, 62.5
27, 126 1, 585
141,633 32,983
56,789 53,072 47,606
128
133 94
173 106
1, 644
195 12. 1
23,028
8, 12.5 19.6
68
136 132 90 42
11,991 (')
46.5 5, 784 2, 571
r; 3,578 6,371 6,482
----------------
4 3
1,20 58
2 6
18, 140 9,461 8,679
102,743 56, 567 45,643
534 125,717
77 38,471
9,640 7, 791
313,377 251,819 61,558
1,882
212,586 37,923
110,471 144,350 129,821
146
159 106 183 101
I, 642
168 10.4
28,906
7, 558 18.3
64
'165 •140 '110
30 r Revised. v Preliminary I Temporarily not available. •New series. Data represent sales to Uuited States and Canadian dealers only; discontinued series included overseas shipments, which are no longer available. Data on
the new basis not shown on p. 55 of the December 1939 Survey will appear in a subsequent issue. t R1•d.;;ed SPries. 08.t9. on pyTnxvlin-ro~tPrl textilE'S r"vi~ed hee:innlnz Jam1rtry 19:N: SI'P note rnnrkeiJ with a "t" on p, 55 of the Novemher 19~9 Survey. Dn.tn. on shipments
and untllled ordel"3, locomotives, revised beginning January 1939 on the basis or a more definite segregation between reilroad locomotives shown above and mining and industrial electric locomotives shown on p. 56 Quarterly data beginning 1939 are available from the Bureau of the Census for Diesel-electric, Diesel·mecbanical, and gasolinemechanical or steam locomotives, in addition to the data for industrial electric locomotives sbown on p. 56 which are for 1 rolley or third·rail and storage-battery locomotives.
,Excludes military planes for domestic use. §Revised series. Data revised for 1937; see table 19, p. 14 of the April1939 Survey.
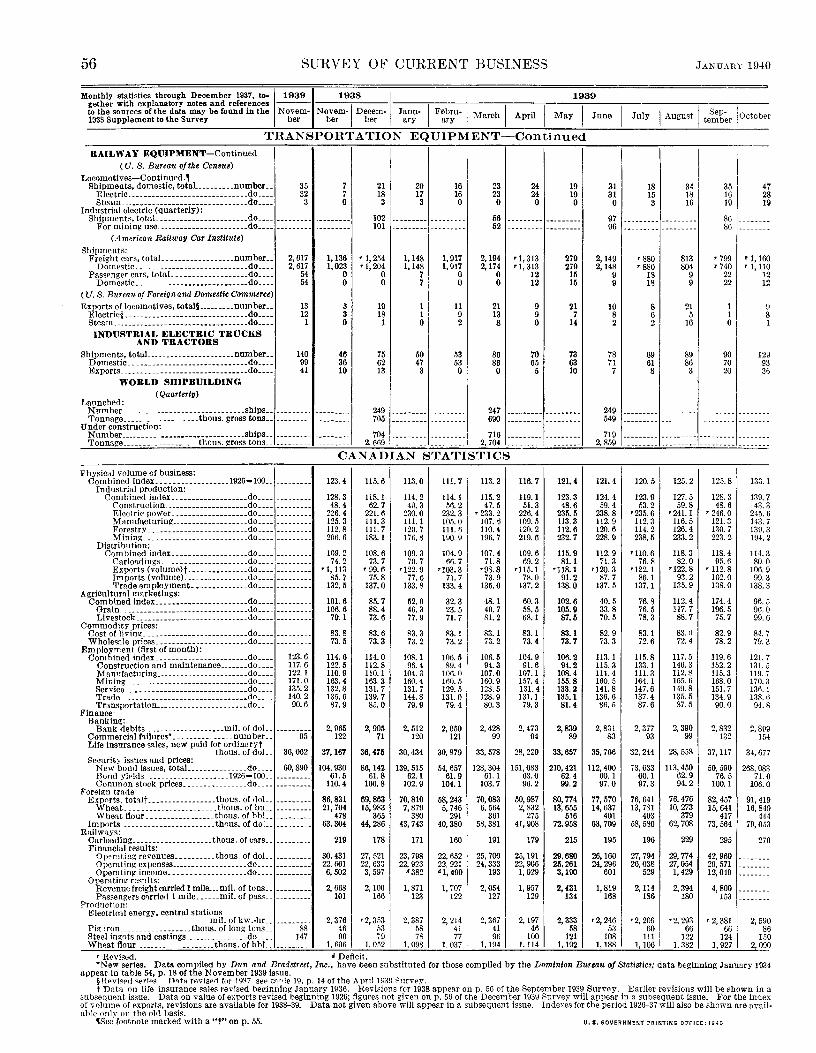
56 SURVEY OF CURRENT BUSINESS JANUARY 1940
gether with explanatory notes and references --- ----,------ -------c----,------,------,-----,.-----,------,--------,----Monthly statistics through December 1937, to-~19391 1938 ~- 1939
to the sources of the data may be found in the Novem- Novem-1 Decem- Janu- I Febru-1 March I April I May I June I July I August I tesmelbl·er !!October 1938 Supplement to the Survey ber ber ber ary ary
TRANSPORTATION EQUIPMENT-Continued
RAILWAY EQUIPMENT-Continued (U.S. Bureau of the Census)
Locomotives-Continued., Shipments, domestic, totaL .....•.. number .. 35
Electric .............•••.••.••.•...... do.... 32 Steam_ -------------------------···-··do.... 3
Industrial electric (quarterly):
Sht~;."~~l~1~o~~~--~~~::::::::::::::::::~~:::: ::::::::: (American Railway Car Institute)
Shipments: Freight cars, totaL ...............•. number ..
Domestic._._ ......•..•...•.......... do ... . Passenger cars, totaL .••....•.•.•..•... do ... .
Domeetic ......... __ . __ • __ ---- ••• __ •• do._ ..
(U.S. Bureau of Foreign and Domestic Commerce) Exports of locomotives, total§ ....•.... number ..
~ l:~~~i~~:::::::::::::::::::::: ::::::::: ~~=::: INDUSTRIAL ELECTRIC TRUCKS
AND TRACTORS Shipments, totaL ..........•.......•.. number •.
Domestic._ ..•..... ---------------- .... do .•.. Exports_._ ............. __ .• ____ ._. ___ .. do .. _.
WORLD SHIPBUILDING (Quarterly)
Launched:
2,617 2,617
54 54
13 12
1
140 99 41
Number ............................... ships .. -------·· Tonnage ................... thous. gross tons •. ---------
Under construction: Number ....... _ .. ----··-···--------- .. ships .. ---------Tonnage... ............. tr.ous. gross tons __ ---------
7 21 7 18 Q 3
102 101
1,136 '1, 2.54 1,023 '1,204
0 0 0 0
3 19 3 18 0 1
46 75 36 62 10 13
249 705
704 2, 669
20 16 23 24 17 16 23 24 3 0 0 0
--------- --------- 56 ---------·-------- --------- 52 ---------
1,148 1, 917 2,194 '1, 313 1,148 1, 917 2,174 '1, 313
7 0 0 12 7 0 0 12
1 11 21 9 1 9 13 9 0 2 8 0
50 53 86 70 47 53 86 65 3 0 0 5
--------- --------- 247 ------------------ --------- 690 ------------------ --------- 716 ---------
--- I 2, 704
CANADIAN STATISTICS Physical volume of business:
Combined index .... ______________ 1926=100 .. --------- 123.4 115.6 113.0 lll. 7 113.2 116.7 Indus trial production:
Comhine<l in<lex .. -----------------do ____ --------- 128.3 118. 1 114.2 114. 1 115.2 119.1 Construction _________ ..• --- •••••• do ... _ --------- 48.4 62.7 40.3 56.2 47.5 51.3 Electric power .. -----------------do .... --------- 226.4 221.6 230.0 232.3 '233. 2 226.4 Manuf»cturing _________________ ._do ... _ 125.3 111.3 111.1 105.0 107.6 109.5 Forestry .. _______________________ do .... --------- 112.8 111.7 120.7 111.6 110.4 120.2 Mining_ ····---------------------do .... --------- 206.6 183. 1 176.8 190.9 196. 7 219.6
Distribution: Com hi ned index._ -----------------do .... --------- 109.2 108.6 109.3 104.9 107.4 109.6
Carloa<lings. -------------------do ____ --------- 74. 2 73.7 70.7 66.7 71.8 69.2 Exports (volume)t ------------ ... do ____ --------- '1, 113 '99. 6 '122. 9 •103. 3 •98.8 •115.1 Imports (volume) ________________ do .•.. 85.7 75.8 77.6 71.7 73.9 7g. 0 Trade employment. _____________ do .... 132.5 137.0 133.8 133.4 135.0 137.2
Agricultural marketings: Com blued index. ___ ------------ ....... do .. -. 101.6 85.7 52.0 32.3 48.1 60.3
Grain _------------------------------do .... --------- 106.6 88.4 46.3 23.5 40.7 58.5 Livestock .. _________________________ .do ... _ --------- 79.1 73.6 77.9 71. i 81.2 68. 1
Commodity prices: Cost of living_ ------------------------·do .... 83.8 83.6 83.3 83. 1 83. 1 83.1 Wholesale prices .. -------- -------------do ____ --------- 73.5 73.3 73.2 73.2 73.2 73.4
Employment (first of month): 123.6 Com hi ned index. _______ .. __ ........... do .... 114.6 114.0 108.1 106.5 106.5 104.9
Construction and maintenance ....•.. do .... 117.6 122.5 112.8 96.4 89.4 94.3 91.6 Manufacturing _____ .... __ . ___________ do .•. _ 122. 1 110.9 110.1 104.3 106.0 107.0 107.1
re~~~~t _-_. _. _. ~ ==~~=~= ::::::: ::::::====~~== :: 171.0 163.4 163.3 160.4 150.5 160.9 1.57.4 135.2 132.8 131.7 131.7 129.5 128.5 131.4
Tra<le _--------------------------·--·do .... 140.2 135. 6 139.7 144.8 131.0 128.9 131.1 Transportation _____ . ___ ... -- _________ do ... -
Finance· 90.6 87.9 85.0 79.9 79.4 80.3 79.3
Banking: Bank debits _------------------mil. of doL. --------- 2, 965 2, 905 2, 512 2, 050 2,428 2, 473
Commercial hilnres• ---------- _____ number .. 95 122 71 120 121 99 94 Life insurance sales, new paid for ordinaryt
tho us. of doL. 36,062 37,167 36,476 30,434 30,879 33,578 28,229 Security issues and prices:
New bono iS>ues, totaL .............. do .... 60,890 104,930 86,142 139, 515 54, 657 128,304 151,083 Bond yields . -- ................. 1926=100 .. --------- 61.5 61.8 62. 1 61.9 61. 1 63.0 Common stock prices _________________ do ____ 110.4 106.8 102.9 104.1 103.7 96.2
Foreign trade: Exports, totalt -----------------thous. of doL. --------- 86,831 69,863 70,810 58,243 70,083 50,987
Wheat ___ . -------------------thous. of bu __ 21,704 15,983 7, 879 5, 746 6, 564 2,8~2 Wheat flour _________________ thous. of hhL. --------- 478 365 380 291 361 275
Imports _________________________ thous. of doL. --------- 63,304 44,286 43,743 40,380 58,381 41,908 Railways:
Carloading ____________________ thous. of cars .. --------- 219 178 171 160 191 179 Financial results:
Operating revenues. ________ . tho us of doL. --------- 30,431 27,521 23,798 22,652 25,700 25, 191 Operating expenses ________________ ... do .... --------- 22,661 22,633 22, 923 22,921 24,333 22,906 Opemtiu!' income ..... --------------do ____ 6, 502 3, 597 d382 •1, 490 193 1, 029
Oper!ltinu rP-~nlt~: Revenue freight carried 1 rnlle ... mil. of tons .. --------- 2, 668 2,100 1, 871 1, 707 2, 054 1, 957 Passengers carried 1 mile ______ mil. of pass .. 101 166 123 122 127 129
Production: Electrical energy, central stations
2, 3671 mil. of kw.-hr .• --------- 2, 3761 rZ, 3f>3 2, 387 2, 214 2,197 Pig iron _________________ thous. of long tons __ 88 46 53 58 41 41 46 Steel ingots and castings ______________ .. do._ .. 147 90 79 78 77 96 100 Wheat flour _____ _ _______ thons. of bbL. --------- 1, 606 1. 0.12 1, 098 1. 037 I, 194 I. 114
' R~v1sed. • Defimt.
19 19 0
------------------
279 279
15 15
21 7
14
73 63 10
---------------------------
121.4
123.3 48.6
235.5 113.3 112.6 232.7
115.9 81.1
•118.1 91.2
138.0
102.6 105.9 87.5
83.1 73.7
106.2 94.2
108.4 155.8 133.2 135,1 81.4
2, 839 89
33,657
210,421 62.4 99.2
80,774 13,655
516 72,958
215
29,680 25,261 3,190
2, 431 134
2,333 58
121 1,192
31 18 34 35 47 31 15 18 16 28
0 3 16 19 19
97 --------- --------- 86 96 --------- --------- 86
2,149 '880 813 '799 '1, 160 2,148 '880 804 '740 '1,110
9 18 9 22 12 9 1~ 9 22 12
10 8 21 1 9 8 6 5 1 8 2 2 16 0 I 1
78 69 89 90 129 71 61 86 70 93 7 8 3 20 36
249 --------- --------- ---------'------ -549 --------- --------- ;;;;;;;;;[;;;:; 719 2, 859
I 121.4 120.5 125.2 125.8 I 133.1
124. 4 123.9 127.5 128.3 139.7 59.4 53.2 59.8 48.6 43.3
238.8 •235. 6 •211.1 '246. 0 245.6 112. 9 112.3 116.5 121.3 143.7 120. 6 114.2 126.4 130. 7 139.3 228.9 238.5 283.2 223.2 194.2
112.9 •110. 6 118.3 118.4 114.3 71.3 76.8 82.0 95.6 so. 0
'120. 3 '122.1 '122. 8 '112. 8 106.9 87.7 86.1 93.2 102.0 99.3
137.5 137.1 135.9 138.0 138.3
40.5 76.8 112.4 174.4 96.5 33.8 76.5 JI7. 7 196.5 96.0 70.5 78.3 88.7 75.7 99.6
82.9 83. I 83.1) 82.9 84.7 73.3 72.6 72.4 78.2 79.3
113. 1 115.8 117.5 119.6 121.7 115. 3 133. 1 146.3 152.2 131.5 111.4 111.3 112.8 115.3 1W.i 160.5 164.1 165.6 168.0 170.3 141.8 147.6 149.8 151.7 136.1 136. 6 137.4 135.5 134.9 138. 6 86.5 87.6 87.5 90.0 94.8
2, 831 2, 377 2, 390 2, 832 2,809 83 93 99 132 154
35,766 32,244 28, 558 37,117 34,677
112,400 i3, 633 113,450 50,590 268,083 60. 1 60.1 62.9 76.5 71.0 97.0 97.3 9•1.2 100.1 106.0
77,570 76,641 76,476 82,457 91,419 14,637 13,781 10,273 15, 641 16, 849
401 403 379 417 444 63,709 58, 5SO 62,708 73,564 79,053
195 196 229 295 270
26,160 27,794 29,774 42,960 --------24,296 26,038 27,054 29,571 --------
601 529 1, 429 12,049 --------1, 819 2,114 2,394 4, 800 --------
168 186 180 153 --------
•2, 246 •2, 206 •2, 293 '2, 381 2, 590 53 60 66 66 86
108 111 122 124 1.10 1,188 1,106 1,~82 1, 927 2, 090
*New series. Data compile<l by Dn1l and Bradstreet, Inc., have been substituted for those compiled by the Dominion Bureau of S1atiBtia; data beginning January 1934 appear in table 54, p. 18 of the November 1939 issue.
§ HPvi~f'.fl St'TiP~ D<lt!i rflvisrri for 1\r-n set-> tnnle 19. p. 14 of the April 19:10 81ITVf'Y. t Data on life insurance sales revised beginning January 1936. Revisions for 1938 appear on p. 56 of the September 1939 Survey. Earlier revisions will he shown in a
subsequent issue. Data on value of exports revised beginning 1926; figures not gh·en on p, 56 of the December 1939 Survey will appear in a subsequent issue. For the index of volume of exports, revisions are available for 1938-39. Data not given above will appear in a subsequent issue. Indexes for the period 1926-37 will also be shown are available only on the old basis.
1See footnote marked With 8 Ht" OD p. 55. U.S. GOVERNMENT PRINTING OFFICE: f940

INDEX TO MONTHLY BUSINESS ...... ;
CLASSH'i'I<:ATION, BY SECTIONS
Monthly business statistics: Busincs!t. io.d.e.xe& ------------------Commodity prices~ .. v ·- ___________ _
Construction and real est.et~-------Dom~sti.c trade .•.... __ ··- ______ ... ____ _ Etr~pb:;.~ 'l'':.·~nt cc.;nt.:Htions and wage-s __ Fin-1.nce __ . _ ·---·----··----~------·-
~?~:;;!_~~-!(:~~,.;~!~[;;['~ -~:~J :~~~~; t~.1-,_;~~ i-c~ ti-,;r;s~. Sttltis.<·h-:-.; !.J1"; in.J~-.·lJual indnst.rit-2:
C:b:e'n;cnh r·.:~d nlh:J tn~c-Ju,::t~·--E;e-:·n··; fH_,.,_.,-r FlqJ. J~;,g _ _ _ }:,_, 1-:tart:; .~n:l .~,)(m1;:- 0_. r:, .. (_-; 1 i·: l t ~-'<, ;,.,-.,-., : -..:;- ·: t 0 •• :;;;.~-~-~, vr~·;_ :-~·-,:~.L·r~ .. .:_
trJl
Pn~e 19 2!l n 23 ~< 3~)
3\) :17
C'.A'l2IFI<:::,,:r.'ION, HY INDiVIDUAL SERIES
Abrasive pB,er an.d. doth (eoated)--·~---~--Acceptances ...... _ .. _ ~ ___ ~ __ -- __ -·- _ .. _ ~. ____ _
Page 52 30
Accessories--Automoblle __ -- ... ---··- ______ _ Advertisb.g ....... _ .. -· ______________________ _ Agriculturai proJ.ucte, cash income received
55 23
front rnHrketings oL.___________________ 20 Agricultural wages. loan3 _________________ 29,30 Air-cond!t!oning cquiprnent_ ____________ .. _ 53 Air maiL .•. ---·-···----------------··--- 23 Airplanes .. --··------------------------- 38,55 Alcohol, denatured, ethyl, methanoL______ 38 Aluminum ______ ... -----------------··---·-- 49 Anima! fats~ greases-----------~--------- 39 Anthradte mining _________ ---·----- 19, 26, 28,45 Apparel, wearing ______ 20, 24, 25, 26, 27, 28, 29,54 Asphalt._. __ .• -- .••• ------------_------ 46 Automobiles_ . __ . _____ 19, 23, 24, 25, 27, 28, 29, 55 Babbitt meteL.------------------------- 49 Barley_ .. ___ .•. ___ .... _------------------ 42 Bathroont at:ceesories_ ------------------- 53 Beef and veaL .. -------··---------------- 43 Beverages, fermented malt liquors and dis-
tilled spirits-------------------------- 41 Bituminous coaL-------------- ... 19, 20, 26, 28,45 Boilers .•..•. _____ . __ -------------·------ 48, 49 Bonds, prices, sales, value, yield$ __________ 30,35 Book publication________________________ 52 Boxes, pape•·---------------------------- 52 Brass. ____ -··- ••• _---------------------- 50 Brick. ____ --_--------_----------------_ 53 Brokers' loans------------------------~·- 30 Bronze.··-- ______ ••.. __ ------------------ 50 Building contracts awarded _______________ 21, 22 Building costs----··---------------------- 22 Building matelia1s __ ~·----------------- 20, 47,53 Building permits isaued __________________ 21,22 Butter_ .. __ •. _. ______ ------------------- 41 Canadian statistics_·--_---·-------_------- 56 Canal traffic.------ ___ .----------------- 37, 38 Candy ...... -----···--------------------- 44 Capital flotations ..•.. -------------------- 33,34 Carl.:mding•-··-. _. ---· ----- __________ ----. 37 CRttle and calves_________________________ 43 Cellulose ;:-Iastic products __________ ------_ 40 Cernent ____ --~---··-·~------------------ 19,53 Chain-store sa.i.es________________________ 24 Chees~-- . _____ . __ .. ---- _ ---------------- 41 Cigars and cigarettes _____________________ 44,45 Civil-ser,vke eraployees___________________ 26 Clay pro•luct•----··------------- 25, 27, 28, 29,53 Clothing _______________ 20, 24, 25, 26, 27, 28, 29,54 CoaL __ . __ .------.------------- 19, 20, 26, 28,45 Cocoa_--------------------------------- 44 Coffee_ .. _--~·-··-------------------------- 44 Coke .. _____ .. _ ... --·-··--_----·------------ 45 Collections, department stores ___ . _ __ _ _ _ __ 24 Cotnmerda1 failures_-------------------- 31 Commercial ~!,')JeL~-----~·--------------- 30 Constn;·~t-ion:
Contracts awa::de-:1~ lndexes _____________ 21,22 Costs .. _____ -----------------------~--- 22 }Iighway~ _. _ ··---- --- ___ -------------- 22 Wag~ r .. -~tes ____ --·· ___ --- .. _________ ---- 29
Copper---------··--·------------------- 49 Copra ~n·:'. '''Jconut oil___________________ 39 Co!";t-of-l,ving index: ____ --~ ____ -----··------ 20 Cottonf f4W and tnanufac:tu:res _________ 20, 21,54 Cottonseed. cake and. 1neal, oiL_____________ 39
Page Crops _______ ---- .• __ .. ___ -- 19, 20, 42, 43, 44, 54 Currency tn circu!atioa~--~-------··-~-~-· .. 32 Dairy product•. ··--- -------··-----···· l!>, '<0, 41,42 Debits, bank.···--·-·------------····--··. 30 Debt, Uni~ed Statc:"f Q,?v::.·onrnent__ _ ·- 32 Dcl.sc.ware, e:np,!.:;yrnentj 'i.)ay tolla. _ __ 26, 27. 29 Dei)::t::-t~ncnt-~;tcre 33.1c~ anr: ~;to..:k:,-1 ~,. _ 24 Dcpusits. bank ____ , .• -·· ·------··~·--- 31 f)~s;mte;;-. industri?.! 27 Dividend payw.!.::n~ ~L.. . .. .. _... 35 Eu:1.bi':~1, fa::, ;):'Yt ,','"~'::"d[;(' ,..,.:e~~~d.v find
hourlJ_____ ~B,29
1"}, 20f44 51
'"'' .. ·~0. 41 37
26 26 38 49 22 32 32 38
. 36 , :;o, 2:r, 28
20 37 20
:f';;:d(;'Lfl. ;;;:~~U.:~\'t· lt<:'~;~i;.._: ~:..::-H1;~. !H. .. ~J
'P 33 22:29
30
ti ,ticc·, 30 .l<'ertiii..:l"":":t_ --·· _ ... _.. 39 .:t~·ir~"-exti!1~lli~hi.G~_: equiprne:1~ ... _ 55 Fire iv;se:L ___ ._.. . ~ _" 23 F~~h IJii;; ~].;.lJ. fi£~h ___ •. __ .. __ - __ .. _ _ ~~ ·1, 44 .Fla~:~cNl _ _ __ -· --··--. ___ 40 Fborint~. oak, n11.1ple, ~>e~d1. >3:n,f ~1In·h .• -··· _ 41 Flour, '<'h"aL ••... ··-··------ •........ -----· 43 Food pnxh.Ict::L _ .. ~ ____ -~ .. --·- '20~ 2.5~ 2:5l 28, 29,41 Footwear_----------··-~----~---~- ____ 46, 47, 53 Foreclo3urt.s. real estate _______ ----------- 23 Foundry equipment .. ----.~~·------.,··-·----- 50 Freight cars (equipme<>t)__________________ 55; Freight carJ.oadings, card, ind~xes .. __ ---··- _ _ 37 Freight~car surplus_----------··------ 37 Fruits-------------·------~--------··- ·-- 20,42 Fuel equipment. ••.•. ----.-----·-----___ SO· Fuels .. __ .. ____ . _ ..• __ - •.. _ .. _ .. _- __ .• _. _. _ _ _ 45, 46 Furniture._._···----------- •.. __ . __ .• _ .• _ 48 Gas. customers 1 sales, revenues____________ 41 Gas and fuel oil•------------------------- 45,46 Gasoline ________ ---- __ ----------_______ 46 Gelatin, edible. _______ ----··- ___ ----_____ 44 General Motors sales______________________ 55 Glass and glassware---··-······-- 19, 25, 27, 28, 29,53 Gloves and mitten•------------------··--- 46 Gold ____ ----- ___ ---- ___ ------__________ 32' Goods in warehouse•------------------···- 23 Grains ____________________________ 20, 34, 42,43 Gypsum __________________ -------·-·----- 53 Hide• and skin•---------·--------···---·-·- 21,46 Hogs ___ • ___________ ------_____________ 43 Home loan banks, loans outstanding_______ 23 Home tnortgage insurance _____ ,. ___ .~__,_..,___ 23
8E~1~~g=_~ :=.~::=.:::::::::::::::::::::- ~8: ~~: ~i Illinois, er.nployeesj factory earnings _____ 26, 27, 29
~:.;.;:~~~t~ -r-ec~ipt.~~~=::::::::::::::::::: 36' ~~ "Income payments_---------------------- 19· Incorporations, business_~_------------~-~- 23 Industrhl production, indexes_____________ 19 Installment sales, New England___________ 24 Insurance. life--------------------~------ 31 Interest and money rates__________________ 30 Iron ore, crude, manufactures ______________ 19~ 48 Kerosene ______ .... ___ --- ____ .--------_._ 46 Labor turn-over, dispute•---------·-------· 27 Lamb and mutton -~-------------------- 43 Lard ____ .• __________ ----------_________ 43 Lead.-------·· ___ . _____________ ... ___ J. 9, 49, 50 Leather _________ .---- 19, 21, 25, 26, 27, 28, 29, 46 Leather, artificiaL~··--------~------ ... ------ 55 Linseed oil, cake~ and m.eaL______________ 40 Livestock __________ ----- •. -----. _____ .19, 20,43 Loans. agricultural, brokera', real estat.e ___ 2:~, 30,33 Locomotives __ ._. ____ •• ---_------ _______ 55, 56 Looms. woolen, activitY----------- ... ~-.. --._ 54 Lubricants __________ ·- •.. _ •• ----- __ .. ___ 46 Lumber_------------------------ Z(), 25, 27, 28,47 Machine activity, cotton, W(h)L_ ... _ -~·----"-· 54 ~1achine tools, orders____________________ 50
~:~~~i~~~Y~d;c~trsr;g::::~==~:::::: .. :~~=:· :28' ~g lVlanufactui"ing indext~S-------w-------~---- 19 t,1.arketings, agriculturaL __ ··--·- .. --------- 20 },1aryland, employment. pay rolls~ ___ ··-·- .. _ :2'6, 27 1\Iassachu.sett3, cmployn•.e-nt. pay roHs .. __ ... 26. 27 !v!eats. ______ -····--- ... _ . __ . ···-- ... ___ 19, 20,43 !vietnls ... ______ .. _ _ _ 19, 21) 25, 27, 28, :29, 43, 49, 50 MethanoL ___ . __ ... --.---·---------··--·----- 38 JVfexico. silver production_·--------~-------- 32 Milk .... _______ .. -------------- .• _ .. _---- 41,42 rviinerals_-- --- ----·-- ---------- 19, 1:6, 1:8, 45, 49· Naval stores __ -···---------------------- 39 Nether!ands, exchange rate3 .. --- .. --------- 32

EPARTMENT OF COMMERCE ' '
UARR \:. L. HOPKINS, Secretary
1FOREIGN AND DOMESTIC COMMERCE JAMES W. YOUNG, Director
Washington Dlvilsions and Chiefs
::JJ.alti-ll,t; 0/tloe:: Robert Sevey.
r•:-~t'~:All•l~rir:!l: Griftlth Evans. ~:·,·'•w!l .. l""': John 11. Payu.~.
Amos E. 'l'aylor.
rfJ~~ftj~IJ'~: Fletclwr H. l:bwls.
Sertilk,~ IAat-tott: G+~Orl!fP
omce aml
Bulldiug. Chur<:h
Foreign 7'arif!s: Henry Chalmers.
Purcign Trade Sta-tisUcs: Bernard Rnrton.
FurcRt Product8: Phillips A. Hay· ward.
Leather ami Rubber: Everett G. Holt.
Machinery: L. M. Lind.
Marketinu Rt!MIIwoh: ~elson ~!il:<•r.
M~tals an-<1 Mir;e;•ak: W11lter A. Jans~en.
Motion Picture: Nathar, D. Golden. National Income: Roher t R. ~a than.
Regional Infor-m aNon: U.u!s Dom· eratzky.
SpeclaltieB: Hora~ B. McCoy.
Temtile8: Edward T. Pickerd. Tobaooo: B. D. Hlll. Transportation: Tho~. E. I.y<>n~.
Cooperative Offices
i Cntl<'l' •llre<:t >,npervislon of Wabhington headquartu>,
•'indnmlli. Ohio. Emn,n fl••rkr. Chamb~r of Commt'rC(; !Jnlltling. j 'PU.Vf!l'. t~ok:., Elil~beth Pettu:;, !'H8 cu~tcjmhons~. lndiai'lUJOJi~. Ind., Franrls W••lls. •'hnmh,•r of Comm?r(:~ Bnlltling. Alilwauke!•, \"\"i~ .. II. 'V. Gr:hrk~. l\ii!wankPe Assoda1lon of CfH:tHr,t•I·c•:. :IIohil(>, Ale!., A'"'i'' Ho·.•:artl, U. R Courthou~e and Custr:mlwu•e Huilding. Huc!H•Her, K Y., And1·ew P. Moody. Cl,ambP.r of Cormner···e. ~avaiJnah. G,t., Jn~f'tlh H. S.t0\"11111 40:l n. ~. PfJ~,t OffiC'f· .&rjd (\'HlrthtJUr:;f:'
Bllildillg,
\Yllmil'gton. D--L. ).!a,-caret V. Dr.nnH!y, <ll!l K~w Fi;dHal B·~ildlng . . Tointly snpPn'bNI by di~triet offic~.s and local cotnJnerctal organlzntions.
Addre's: l·'ot·d~n Tl'ude Secr<'ta:y, Chamber of Commerce, with followiiW ,x.·t•ptim,s: (1) United Chambers of Commerrl'. {2) As~ocia
tion of Commerco>, (:!) Manufacturers' .Association. (4 \ Maine Stat{' ('hnmber of Commere<', (5) Department of Conservation and Develop. ment, ({l) Depanm~nt of .Agriculture and Commerce.
Akron. Ohio Kenkuk. Iowa Rockford, l:J. ~\nni:<ton, ,\ln. I 1) Lake Chari""· La. (2) Sr;n Antoni<'. T'••x. Baltimore, ~Id. \:!) Laredo, Tex. ~an Di<•go. Calif. Benumont. 'J'ex. Longview, '\VaslL ~an .Juan. P. H. ! 6 i Binghamton, :-i. Y.. Lowell, Mass. Spokane, Wasi,_ Bridi':<:Pilrt. Conn.\:;) :.\!.illll!~ .l<'la. i'ipriugfield. :6!i:<s. CharJvttP, N.C. Xew Haven, COUll. Syracuse. K Y. Chattanooga, TP!Hl. (:~ 1 Xewark_~ N.J. T.nem:na. 'Wash. Columlms, Ga. Oaklano, Calif. Tampa, Flh. Cf\IUmbtN, OLio Oklahoma City, Okla. Tol<•do, Ohln J);;yrt)t:. Ohio Oruaha, :t'\ebr. Tr~·r:ton~ 1\ ,T, fcrh·, P:L Pensacola, .l<'la. WaH•r·bury. Co:·.L. Fort :;;"iiti:l, .\rk Portland, )iaine (1) Wichita. !\an; J~,<,rt '\'orth, Tex Providence. R.I. ,Y,·r~'·1?f1t-. M~·:'-'~. 1 ;rn.1n:..h\irO. --;.\, <-:. Hnleh::h. N.C. (3) II~.Htf,,rd. Cullil. (:;! Ricl,1nOnd, Yn..