January 11, 2008 Confidential Tsubakimoto Chain Co. Initiatives for 2008 Providing Clarity and...
13
January 11, 2008 Confidential Tsubakimoto Chain Co. Initiatives for 2008 Providing Clarity and Excitement
-
Upload
nathan-oliver -
Category
Documents
-
view
214 -
download
0
Transcript of January 11, 2008 Confidential Tsubakimoto Chain Co. Initiatives for 2008 Providing Clarity and...
January 11, 2008
Confidential
Tsubakimoto Chain Co.Initiatives for 2008Providing Clarity and Excitement

2
Tsubakimoto Chain's Stock Price in 2007
1 2 3 4 5 6 7 8 9 10 11 12
600
650
700
750
800
850
900
950
• 2007 was a volatile year for TC due to various factors
• However, we hope that TC’s fundamentals will continue to remain strong and that 2008 will be a prosperous year for the company
2007 Review and 2008 Prospects2007 Review and 2008 Prospects
What are the reasons for the weak stock price?
May 14: Announced solid FY3/07 results and buyback next day
Aug. 9: “BNP Paribas Shock”*
Source: FactSet *BNP Paribas froze three funds exposed to the stumbling US subprime mortgage market
Nov. 14: Announced H1 FY3/08 results and downgraded full-year sales forecast
Nov. 9: Yen strengthens to 110 yen level
Oct end: Oil price exceeds $90/B
Aug. 17: Yen strengthens to 115 yen level
3
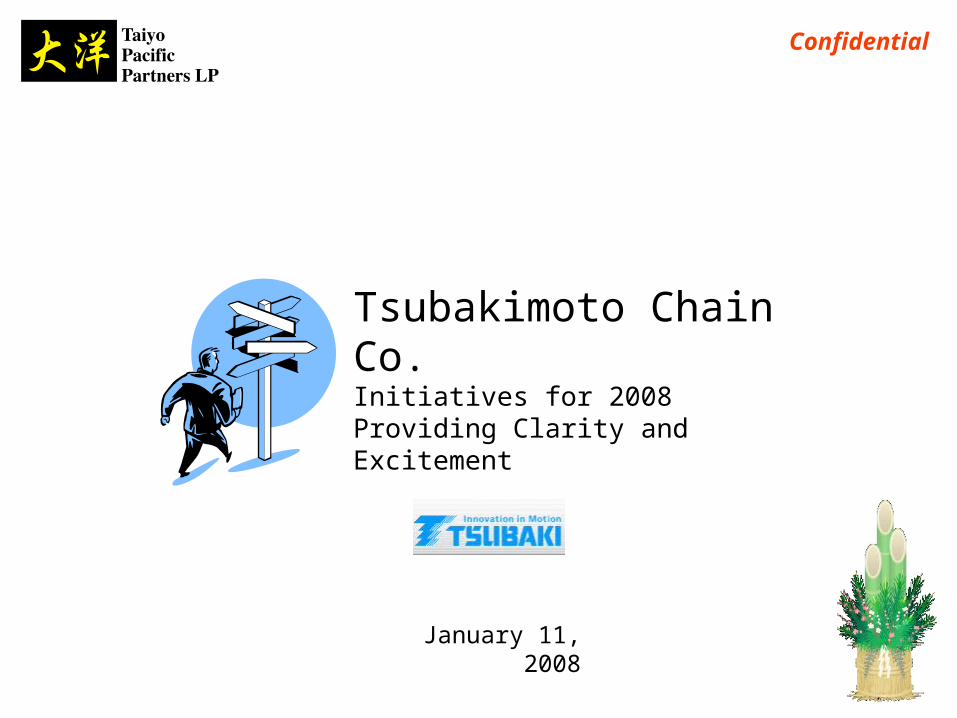
FX Rate and Oil Price in 2007
105
110
115
120
125
1 2 3 4 5 6 7 8 9 10 11 12
JPY/USD
50
60
70
80
90
100
USD/Barrel
FX Rate (LHS) Oil Price (RHS)
Indexed Stock Price
Jun-07 Jul-07 Aug-07 Sep-07 Oct-07 Nov-07 Dec-07
Source: FactSet
60
70
80
90
100
110
Tsubakimoto Toyota
Indexed Stock Price
Jun-07 Jul-07 Aug-07 Sep-07 Oct-07 Nov-07 Dec-07
Source: FactSet
60
70
80
90
100
110
Tsubakimoto TOPIX Machinery
Indeed, Weakness Can be Explained a Lot by Market FactorsIndeed, Weakness Can be Explained a Lot by Market Factors
TC share price has high correlation with industry benchmarks and Toyota’s share price
Correlation of 0.85Correlation of 0.90
Source: FactSet and Bloomberg Note: Oil Price is WTI Crude Future Feb08

4
Jul Aug Sep Oct Nov Dec
70
75
80
85
90
95
100
105Tsubakimoto Chain Co. (6371-JP) 70.9Japan TOPIX 1st Section / Machinery (188378) 79.1Japan TOPIX 1st Section / Transportation Equipment (188380) 82.8Japan TOPIX 1st Section (180460) 83.1
Indexed Price29-Jun-2007 to 28-Dec-2007 (Daily)29-Jun-2007=100; Local
Data Source: Exshare ©FactSet Research Systems 2008
Underperformance
Nevertheless, Overall Market Weakness is Not the Only Factor at PlayNevertheless, Overall Market Weakness is Not the Only Factor at Play
• Since July 2007, TC’s stock price has declined around 30%, which is greater than those of the benchmarks
TOPIX Machinery
TOPIX 1st Section
Tsubakimoto
This decline suggests concerns market participants have on TC and its business environment
TOPIX Transportation
5
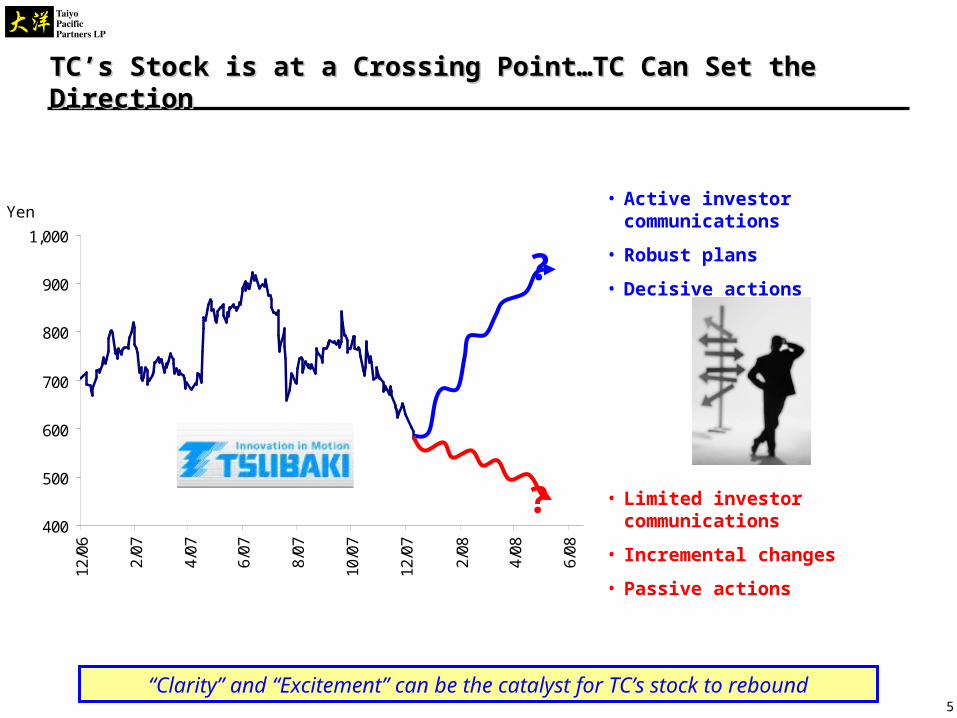
TC’s Stock is at a Crossing Point…TC Can Set the DirectionTC’s Stock is at a Crossing Point…TC Can Set the Direction
“Clarity” and “Excitement” can be the catalyst for TC’s stock to rebound
400
500
600
700
800
900
1,000
12/0
6
2/07
4/07
6/07
8/07
10/0
7
12/0
7
2/08
4/08
6/08
• Active investor communications
• Robust plans
• Decisive actions
• Limited investor communications
• Incremental changes
• Passive actions
?
?
Yen
6
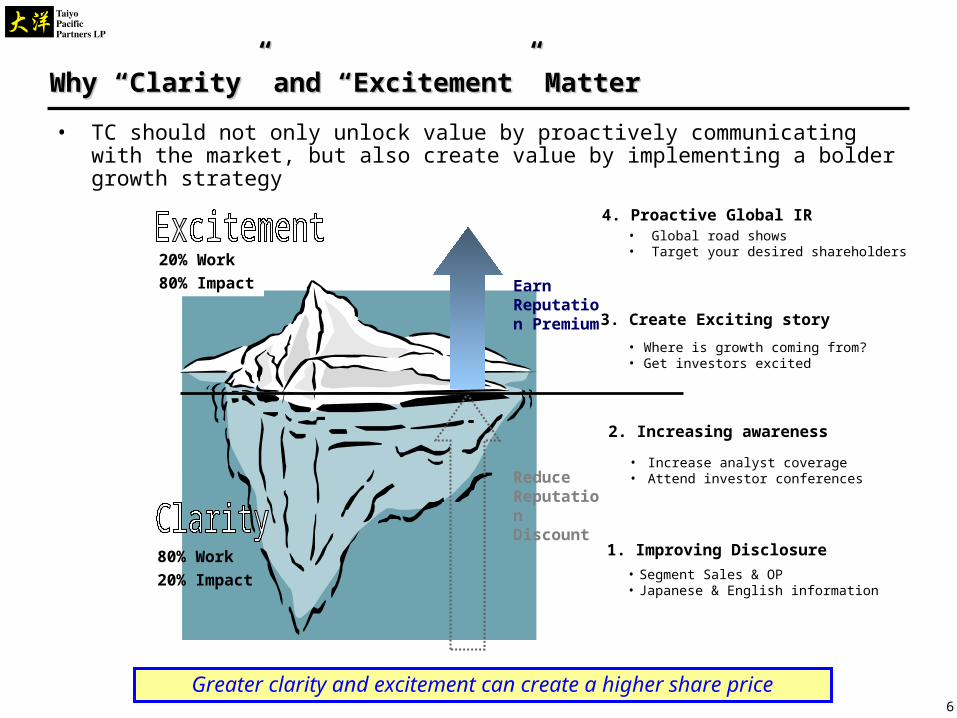
Why “Clarity” and “Excitement” MatterWhy “Clarity” and “Excitement” Matter
Greater clarity and excitement can create a higher share price
Earn Reputation Premium
Reduce Reputation Discount
1. Improving Disclosure
4. Proactive Global IR
• Segment Sales & OP• Japanese & English information
• Increase analyst coverage• Attend investor conferences
• Where is growth coming from?• Get investors excited
3. Create Exciting story
2. Increasing awareness
• Global road shows• Target your desired shareholders
80% Work
20% Impact
20% Work
80% Impact
• TC should not only unlock value by proactively communicating with the market, but also create value by implementing a bolder growth strategy

7
Clarity – Negative “Subprime” PerceptionClarity – Negative “Subprime” Perception
Market Noise
“Subprime”
Hike in
oil price
Yen
appreciation
Investor Perception TC Downgrade (as 1HY result announcement)
Original Forecast
Sales: Y170.0bn OP: Y17.6bn
New Forecast
Sales: Y164.0bn (ΔY6.0bn) OP: Y17.6bn
By Business
Sales Forecast
Current Situation
Chain Δ3.1%Growing as domestic demand stays firm for machine tools, auto, and steel industries
Auto Parts
Δ2.0%Solid growth driven by brisk exports, offsetting slow down in Japan
Precision Δ6.1%Losing competitiveness in products while IT-related demand is sluggish
Materials Handling Δ5.0%
Order of large-scale projects from both auto and IT industries slowing down
TC should emphasize that the downgrade came from ex-”subprime” issues and that the core business remains strong
• Decline in consumer confidence
• Slow down in US auto sales
Source: Company IR material, analysts comments, Taiyo

8
Clarity – Analysts ConcernsClarity – Analysts Concerns
TC should address “Off-The-Record” concerns to rebuild clarity and confidence
UBS
Ms. Yamazaki / Mr. Hoshino
Rating: “Buy” / TP¥1,050
• H1 results better than initially planed by company
• Further expansion likely in chains biz
• Making progress in materials handling biz
KBC
Mr. McDonald
Rating: “Neutral” / No TP
• Some positives backed by global successes of Japanese automakers and growth in some Asian markets
Macquarie
Mr. Hayami
Rating: “Outperform” / TP¥950
• H1 results came in better than expected
• Strong global auto production should drive power transmission biz
Okasan
Mr. Shibata
Rating: “Above Average” / No TP
• Growth rate of auto parts biz likely to top company’ forecast thanks to growth in NA
• Likely benefit significantly from shift to chains from belts in engines
Nikko Citigroup
Mr. Sakurada
Rating: “Hold” / TP¥760
• Benefiting significantly from growth of Japanese automakers
• Profitability in materials handling biz is improving
• Why not disclose monthly and/or quarterly order data?
• Why is full year OP guidance so rigid?
• What is TC-Emerson’s competitive advantage and strategy in speed reducers?
• Can TC dissolve the Emerson relationship and enter the US precision market?
• What is TC’s strategy for its materials handling business?
• Are there any immediate catalysts?
“On-The-Record” “Off-The-Record”
9
Build New Business?
Future
?
Auto PartsChain Others
Strengthen Current Business
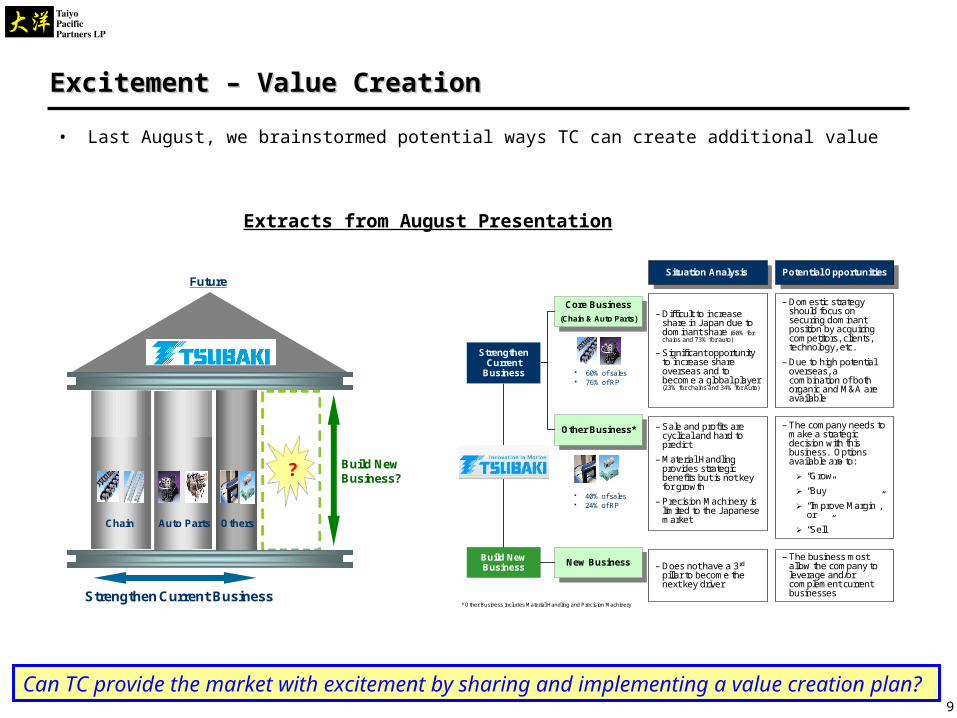
Excitement – Value CreationExcitement – Value Creation
Can TC provide the market with excitement by sharing and implementing a value creation plan?
• Last August, we brainstormed potential ways TC can create additional value
Build New Business
Other Business*Other Business*
Core Business
(Chain & Auto Parts)
Core Business
(Chain & Auto Parts)
Situation Analysis Situation Analysis
New BusinessNew Business
60% of sales 76% of RP
40% of sales 24% of RP
* Other Business includes Material Handling and Precision Machinery
Potential OpportunitiesPotential Opportunities
– Domestic strategy should focus on securing dominant position by acquiring competitors, clients, technology, etc.
– Due to high potential overseas, a combination of both organic and M&A are available
Strengthen Current
Business
– Difficult to increase share in Japan due to dominant share (60% for chains and 73% for auto)
– Significant opportunity to increase share overseas and to become a global player (23% for chains and 34% for Auto)
– The company needs to make a strategic decision with this business. Options available are to:
“Grow”
“Buy”
“Improve Margin”, or
“Sell”
– Sale and profits are cyclical and hard to predict
– Material Handling provides strategic benefits but is not key for growth
– Precision Machinery is limited to the Japanese market
– The business most allow the company to leverage and/or complement current businesses
– Does not have a 3rd
pillar to become the next key driver
Extracts from August Presentation

10
760
900
612 561
468
1,050
1,2001,122
1,374
941
200
400
600
800
1,000
1,200
1,400
1,600
P/En EV/EBITDA P/B DCF AnalystConsensus
TC’s stock price will remain undervalued without any actionTC’s stock price will remain undervalued without any action
TC needs to reduce the 37% undervaluation gap
Current Share Price
Yen
Source: FactSet and Taiyo AnalysisNote: Data as of Jan. 9, 2008. 2-year High and Low data for P/En, EV/EBITDA, and P/B
Historically Cheap
Intrinsically Cheap
“Street” Cheap
Avg. 705
Avg. 993
Avg. 842
Avg. 1,050
Avg. 905
Avg. 846
Avg. Y934
Y586
Fair Value Estimate
Δ37%
11
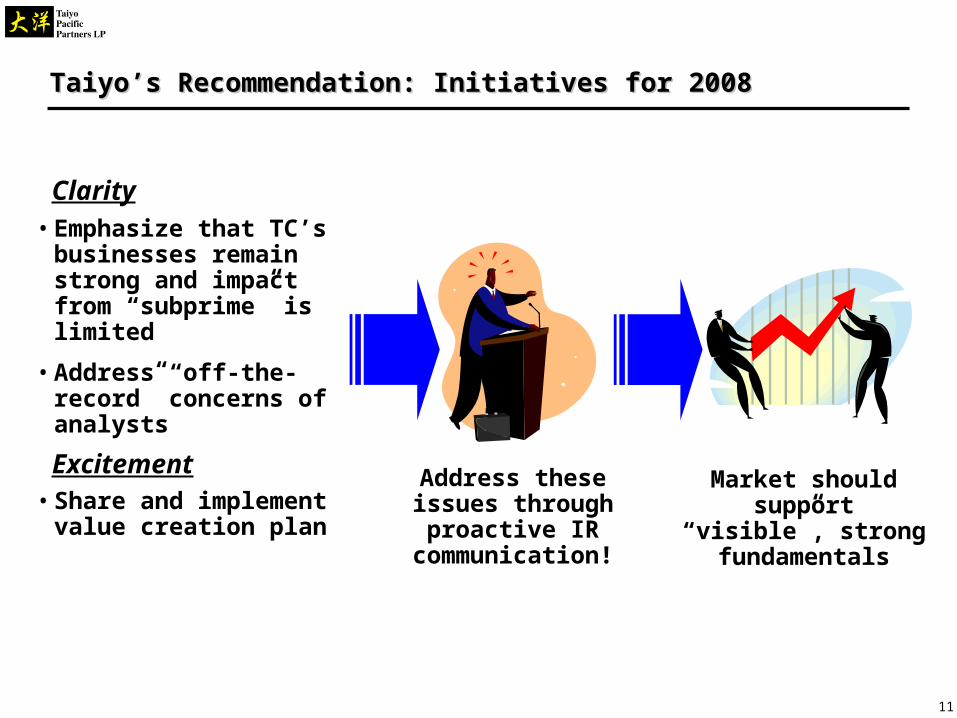
Taiyo’s Recommendation: Initiatives for 2008Taiyo’s Recommendation: Initiatives for 2008
Address these issues through
proactive IR communication!
Market should support “visible”,
strong fundamentals
Clarity
Excitement
• Emphasize that TC’s businesses remain strong and impact from “subprime” is limited
• Address “off-the-record” concerns of analysts
• Share and implement value creation plan
12
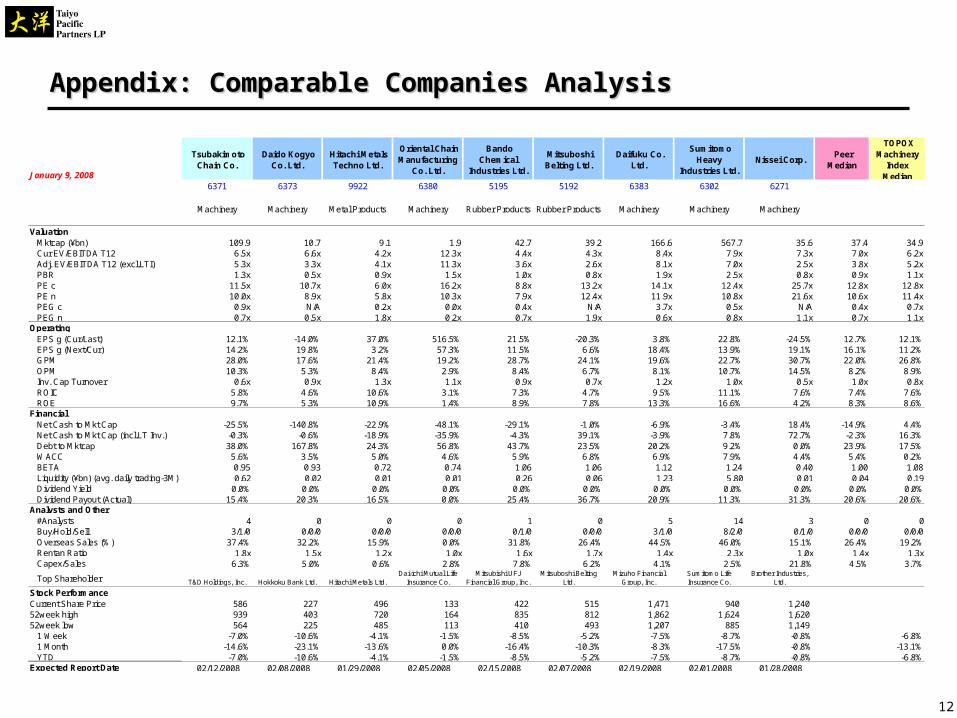
January 9, 2008
Tsubakimoto Chain Co.
Daido Kogyo Co. Ltd.
Hitachi Metals Techno Ltd.
Oriental Chain Manufacturing
Co. Ltd.
Bando Chemical
Industries Ltd.
Mitsuboshi Belting Ltd.
Daifuku Co. Ltd.
Sumitomo Heavy
Industries Ltd. Nissei Corp.
Peer Median
TOPOX Machinery
Index Median
6371 6373 9922 6380 5195 5192 6383 6302 6271
Machinery Machinery Metal Products Machinery Rubber Products Rubber Products Machinery Machinery Machinery
ValuationMktcap (¥bn) 109.9 10.7 9.1 1.9 42.7 39.2 166.6 567.7 35.6 37.4 34.9Cur EV/EBITDA T12 6.5x 6.6x 4.2x 12.3x 4.4x 4.3x 8.4x 7.9x 7.3x 7.0x 6.2xAdj. EV/EBITDA T12 (excl.LTI) 5.3x 3.3x 4.1x 11.3x 3.6x 2.6x 8.1x 7.0x 2.5x 3.8x 5.2xPBR 1.3x 0.5x 0.9x 1.5x 1.0x 0.8x 1.9x 2.5x 0.8x 0.9x 1.1xPE c 11.5x 10.7x 6.0x 16.2x 8.8x 13.2x 14.1x 12.4x 25.7x 12.8x 12.8xPE n 10.0x 8.9x 5.8x 10.3x 7.9x 12.4x 11.9x 10.8x 21.6x 10.6x 11.4xPEG c 0.9x N/A 0.2x 0.0x 0.4x N/A 3.7x 0.5x N/A 0.4x 0.7xPEG n 0.7x 0.5x 1.8x 0.2x 0.7x 1.9x 0.6x 0.8x 1.1x 0.7x 1.1x
OperatingEPS g (Cur/Last) 12.1% -14.0% 37.0% 516.5% 21.5% -20.3% 3.8% 22.8% -24.5% 12.7% 12.1%EPS g (Next/Cur) 14.2% 19.8% 3.2% 57.3% 11.5% 6.6% 18.4% 13.9% 19.1% 16.1% 11.2%GPM 28.0% 17.6% 21.4% 19.2% 28.7% 24.1% 19.6% 22.7% 30.7% 22.0% 26.8%OPM 10.3% 5.3% 8.4% 2.9% 8.4% 6.7% 8.1% 10.7% 14.5% 8.2% 8.9%Inv. Cap Turnover 0.6x 0.9x 1.3x 1.1x 0.9x 0.7x 1.2x 1.0x 0.5x 1.0x 0.8xROIC 5.8% 4.6% 10.6% 3.1% 7.3% 4.7% 9.5% 11.1% 7.6% 7.4% 7.6%ROE 9.7% 5.3% 10.9% 1.4% 8.9% 7.8% 13.3% 16.6% 4.2% 8.3% 8.6%
FinancialNet Cash to Mkt Cap -25.5% -140.8% -22.9% -48.1% -29.1% -1.0% -6.9% -3.4% 18.4% -14.9% 4.4%Net Cash to Mkt Cap (incl.LT Inv.) -0.3% -0.6% -18.9% -35.9% -4.3% 39.1% -3.9% 7.8% 72.7% -2.3% 16.3%Debt to Mktcap 38.0% 167.8% 24.3% 56.8% 43.7% 23.5% 20.2% 9.2% 0.0% 23.9% 17.5%WACC 5.6% 3.5% 5.0% 4.6% 5.9% 6.8% 6.9% 7.9% 4.4% 5.4% 0.2%BETA 0.95 0.93 0.72 0.74 1.06 1.06 1.12 1.24 0.40 1.00 1.08Liquidity (¥bn) (avg. daily trading-3M) 0.62 0.02 0.01 0.01 0.26 0.06 1.23 5.80 0.01 0.04 0.19Dividend Yield 0.0% 0.0% 0.0% 0.0% 0.0% 0.0% 0.0% 0.0% 0.0% 0.0% 0.0%Dividend Payout (Actual) 15.4% 20.3% 16.5% 0.0% 25.4% 36.7% 20.9% 11.3% 31.3% 20.6% 20.6%
Analysts and Other#Analysts 4 0 0 0 1 0 5 14 3 0 0Buy/Hold/Sell 3/1/0 0/0/0 0/0/0 0/0/0 0/1/0 0/0/0 3/1/0 8/2/0 0/1/0 0/0/0 0/0/0Overseas Sales (%) 37.4% 32.2% 15.9% 0.0% 31.8% 26.4% 44.5% 46.0% 15.1% 26.4% 19.2%Rentan Ratio 1.8x 1.5x 1.2x 1.0x 1.6x 1.7x 1.4x 2.3x 1.0x 1.4x 1.3xCapex/Sales 6.3% 5.0% 0.6% 2.8% 7.8% 6.2% 4.1% 2.5% 21.8% 4.5% 3.7%
Top Shareholder T&D Holdings, Inc. Hokkoku Bank Ltd. Hitachi Metals Ltd.Dai-ichi Mutual Life
Insurance Co.Mitsubishi UFJ
Financial Group, Inc.Mitsuboshi Belting
Ltd.Mizuho Financial
Group, Inc.Sumitomo Life Insurance Co.
Brother Industries, Ltd.
Stock PerformanceCurrent Share Price 586 227 496 133 422 515 1,471 940 1,240 52week high 939 403 720 164 835 812 1,862 1,624 1,620 52week low 564 225 485 113 410 493 1,207 885 1,149
1 Week -7.0% -10.6% -4.1% -1.5% -8.5% -5.2% -7.5% -8.7% -0.8% -6.8%1 Month -14.6% -23.1% -13.6% 0.0% -16.4% -10.3% -8.3% -17.5% -0.8% -13.1%YTD -7.0% -10.6% -4.1% -1.5% -8.5% -5.2% -7.5% -8.7% -0.8% -6.8%
Expected Report Date 02/12/2008 02/08/2008 01/29/2008 02/05/2008 02/15/2008 02/07/2008 02/19/2008 02/01/2008 01/28/2008
Appendix: Comparable CompaniesAppendix: Comparable Companies AnalysisAnalysis

DisclaimerDisclaimer
Taiyo Pacific Partners LP (“TPP”) does not make any warranty, express or implied a) as to the accuracy or completeness of the contents of this report, or b) as to the results of using any information contained herein.
In no case shall TPP have any liability to any person in respect of any loss, claim, damages, costs or liability arising from reliance on any information contained in this report or use of this report.
This report is indented only for the use of addressee and may contain information that is TPP’s work product, privileged and confidential.
Copyright: This report is protected by U.S., and other copyright laws. Information contained herein may not be reproduced, distributed, transmitted, displayed or broadcasted without the prior written consent of TPP.