James Halse Young People Analysis, DCSF [email protected]
27
Winning the War of Attrition? Sampling, response analysis and weighting using the National Pupil Database James Halse Young People Analysis, DCSF [email protected]
-
Upload
karen-horn -
Category
Documents
-
view
24 -
download
1
description
Winning the War of Attrition? Sampling, response analysis and weighting using the National Pupil Database. James Halse Young People Analysis, DCSF [email protected]. Overview. The way we were – sampling from school records for the Youth Cohort Studies (YCS) - PowerPoint PPT Presentation
Transcript of James Halse Young People Analysis, DCSF [email protected]
Winning the War of Attrition?Sampling, response analysis and weighting using the National Pupil Database
James Halse
Young People Analysis, DCSF
Overview
The way we were – sampling from school records for the Youth Cohort Studies (YCS)
A new way of sampling for the Longitudinal Study of Young People in England (LSYPE)
Analysis of response rates and non response bias using NPD
Weighting for non-response on LSYPE Applying the lessons learned to the next cohort of
the YCS

The way we were - the YCS
Youth Cohort Studies were a multimode panel study of young people starting in the spring after year 11 and following these young people 1, 2 and 3 years later
In theory a simple random sample - the Department wrote to all schools and asked for names and addresses of pupils born on 3 dates within any month (e.g. 5th, 15th, 25th)
Issued sample drawn from information provided by schools Some attempt to correct for school non-response For cohorts 11 and 12, attempt to increase the number of young
people from ethnic minorities by over sampling in LAs with high proportion of pupils from minority ethnic groups
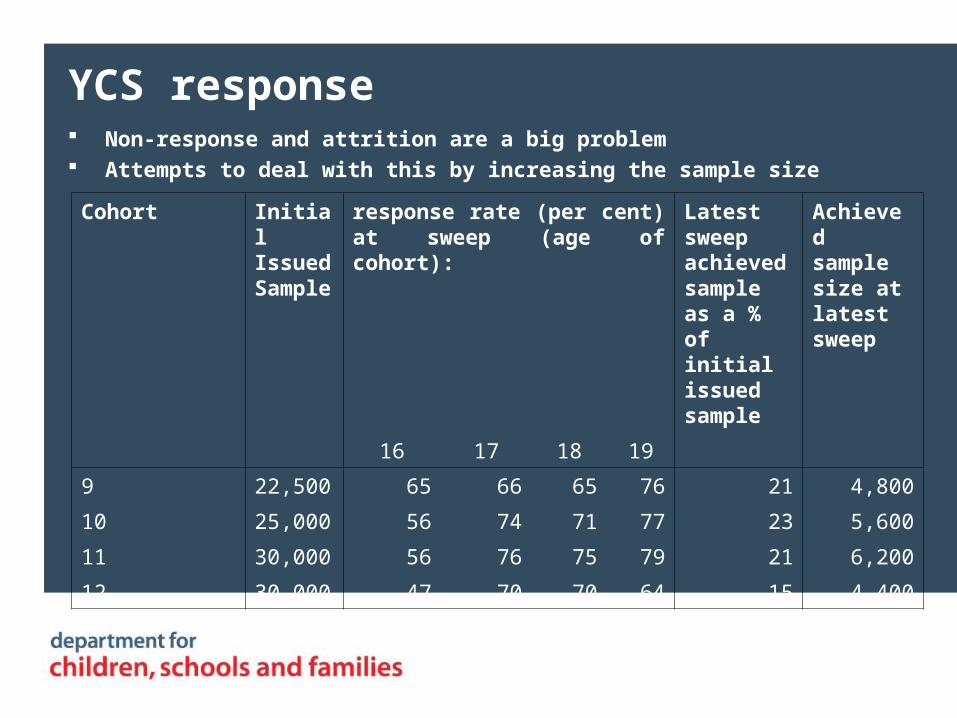
YCS response Non-response and attrition are a big problem Attempts to deal with this by increasing the sample size
Cohort Initial Issued Sample
response rate (per cent) at sweep (age of cohort):
Latest sweep achieved sample as a % of initial issued sample
Achieved sample size at latest sweep
16 17 18 19
9 22,500 65 66 65 76 21 4,800
10 25,000 56 74 71 77 23 5,600
11 30,000 56 76 75 79 21 6,200
12 30,000 47 70 70 64 15 4,400
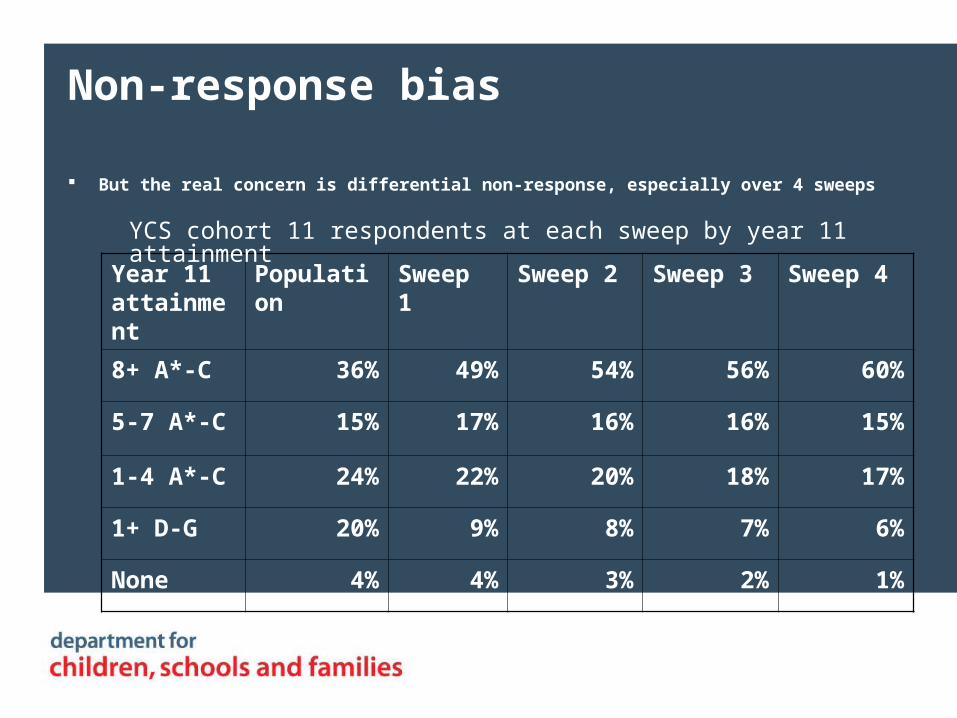
Non-response bias
But the real concern is differential non-response, especially over 4 sweeps
Year 11 attainment
Population Sweep 1 Sweep 2 Sweep 3 Sweep 4
8+ A*-C 36% 49% 54% 56% 60%
5-7 A*-C 15% 17% 16% 16% 15%
1-4 A*-C 24% 22% 20% 18% 17%
1+ D-G 20% 9% 8% 7% 6%
None 4% 4% 3% 2% 1%
YCS cohort 11 respondents at each sweep by year 11 attainment
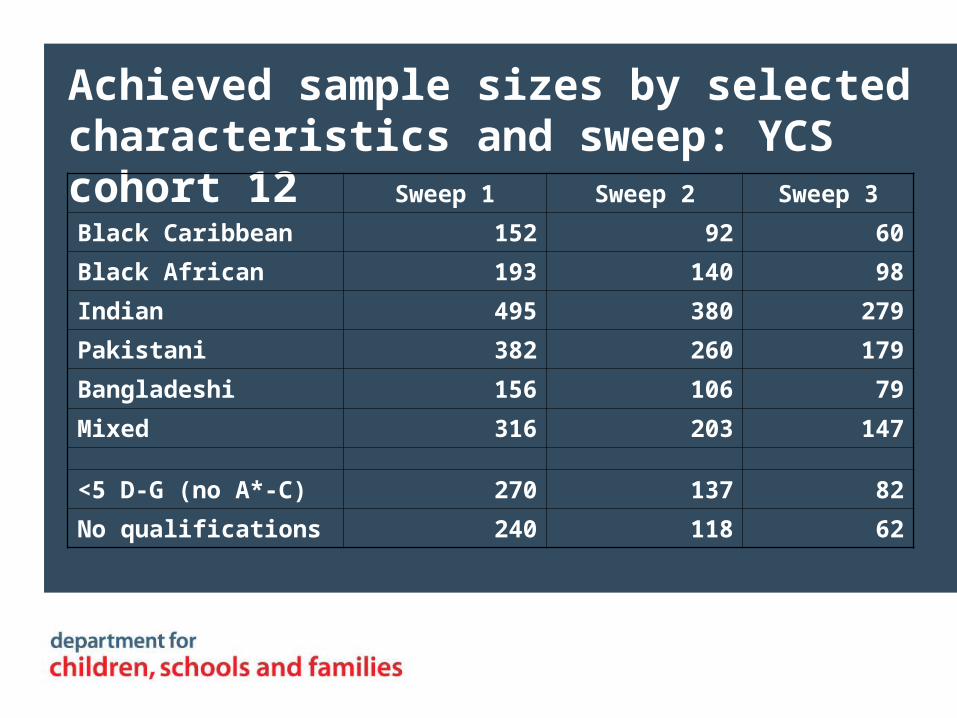
Achieved sample sizes by selected characteristics and sweep: YCS cohort 12 Sweep 1 Sweep 2 Sweep 3
Black Caribbean 152 92 60
Black African 193 140 98
Indian 495 380 279
Pakistani 382 260 179
Bangladeshi 156 106 79
Mixed 316 203 147
<5 D-G (no A*-C) 270 137 82
No qualifications 240 118 62
YCS: Weighting for non-response
Cell weighting at sweep 1 (attainment, region, school type and sex)
CHAID for sweep 2 onwards using information collected at previous sweeps
Lowest response rate is at initial sweep, but this is the stage at which we have least information for non-response weighting
Problems with the YCS
Burden on schools to provide details for sample frame Boosting number of sample members from LAs or schools with
high proportion of minority ethnic pupils was inefficient Declining response rates and differential non-response led to
very small sample sizes for some groups by 3rd or 4th sweep Little information for sweep 1 non-response weighting Large differentials in non-response weights leading to large
design effects and reduced sample efficiency (55% efficient at 11.4)
Things can only get better: the Longitudinal Study of Young People in England (LSYPE) Similar to YCS in that it is a study of transitions from compulsory
education, but:– Face to face– Started when pupils were in year 9 (age 13/14)– Plan to continue till young people are aged 25– Includes interviews with parents– Much more detailed (e.g. attitudes to school, bullying, parental
employment histories)– Used incentives (conditional at wave 1, unconditional thereafter)
For LSYPE use a 2 stage Probability Proportional to Size (PPS) design with schools as PSUs
Sample drawn directly from PLASC But had to approach schools for contact details so drew a large
enough sample to allow for some non-cooperation from schools
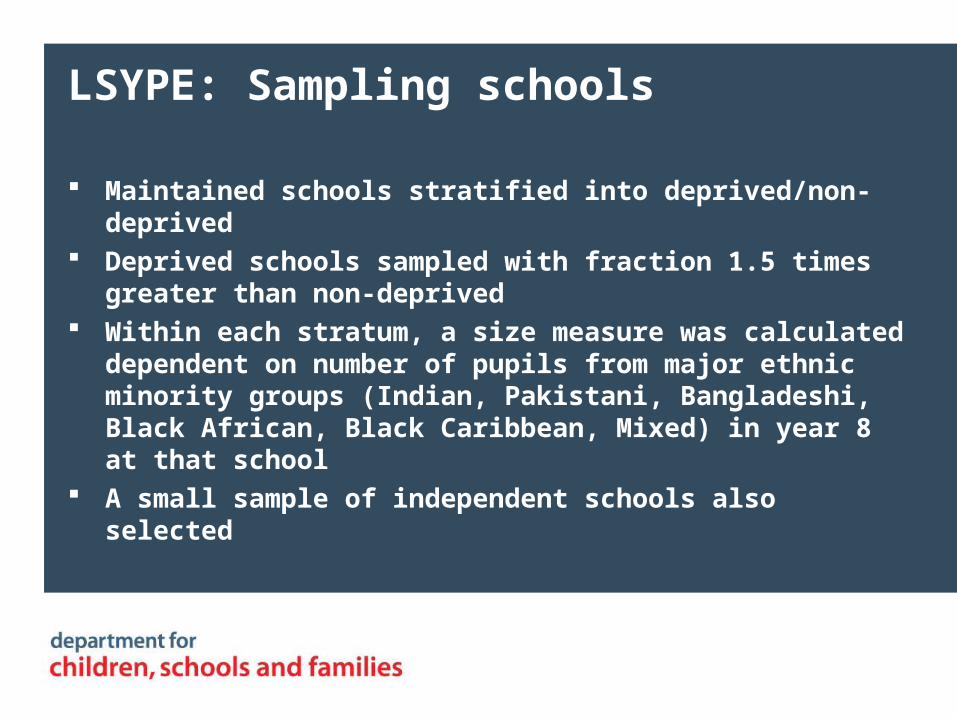
LSYPE: Sampling schools
Maintained schools stratified into deprived/non-deprived Deprived schools sampled with fraction 1.5 times greater than
non-deprived Within each stratum, a size measure was calculated dependent
on number of pupils from major ethnic minority groups (Indian, Pakistani, Bangladeshi, Black African, Black Caribbean, Mixed) in year 8 at that school
A small sample of independent schools also selected
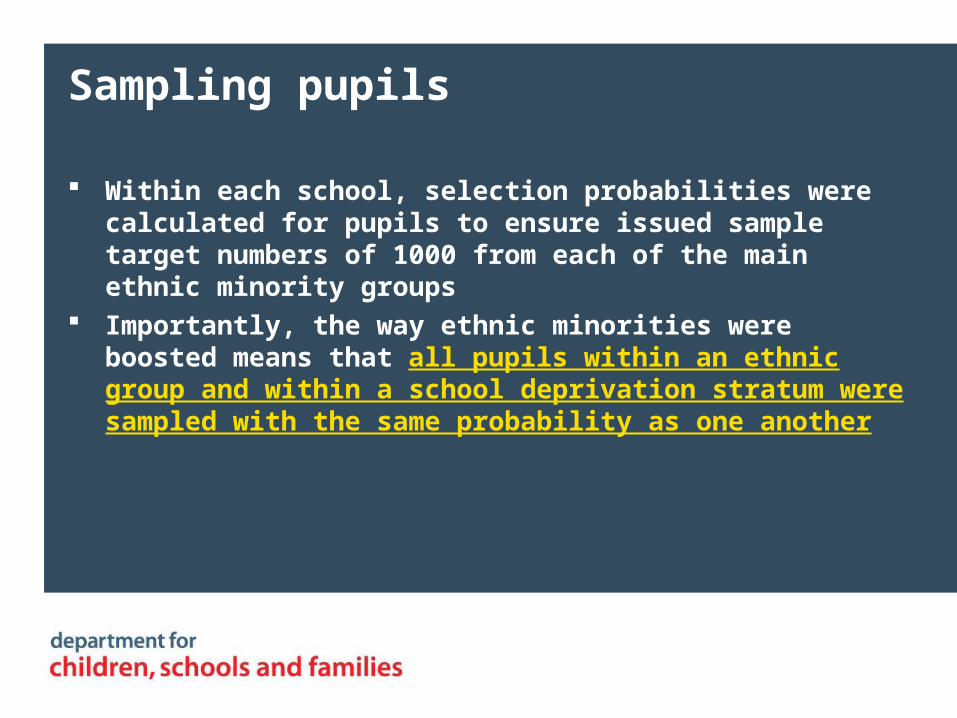
Sampling pupils
Within each school, selection probabilities were calculated for pupils to ensure issued sample target numbers of 1000 from each of the main ethnic minority groups
Importantly, the way ethnic minorities were boosted means that all pupils within an ethnic group and within a school deprivation stratum were sampled with the same probability as one another
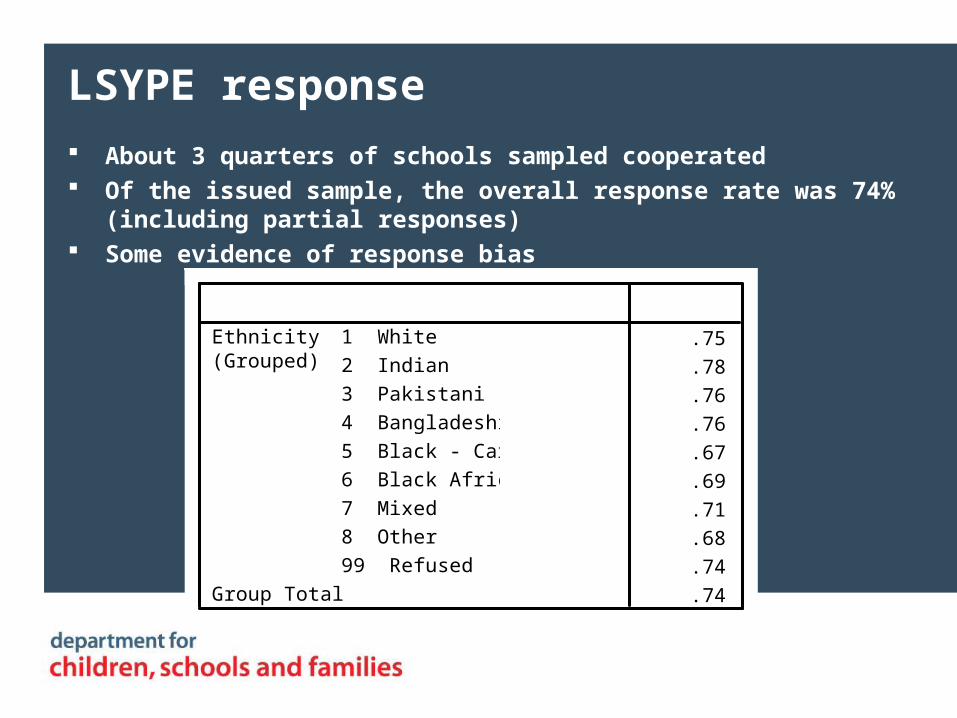
LSYPE response
About 3 quarters of schools sampled cooperated Of the issued sample, the overall response rate was 74% (including
partial responses) Some evidence of response bias
.75
.78
.76
.76
.67
.69
.71
.68
.74
.74
1 White
2 Indian
3 Pakistani
4 Bangladeshi
5 Black - Caribb
6 Black African
7 Mixed
8 Other
99 Refused
Ethnicity(Grouped)
Group Total
Analysis of LSYPE response
Use NPD to analyse school non-response and pupil level non response separately
Run logistic regression models to find variables associated with propensity to respond
Start with variables in sample frame and add attainment variables
For school non-response, significant terms in the model were deprivation strata and whether or not the school was in London
For pupil non-response, significant terms are attainment, ethnicity and region, plus an interaction between white and region
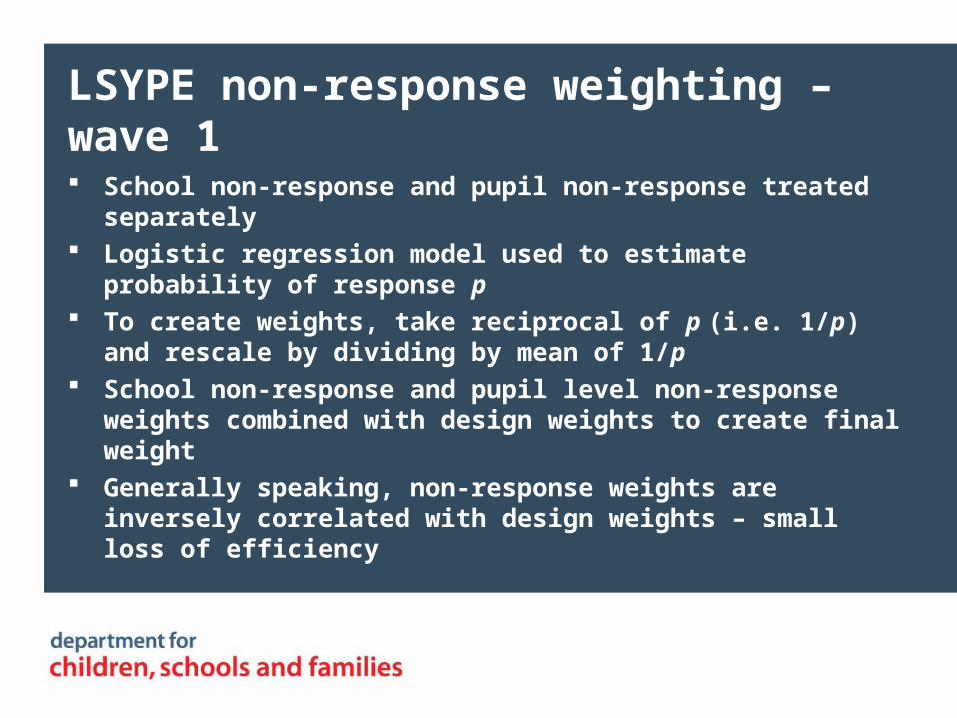
LSYPE non-response weighting – wave 1
School non-response and pupil non-response treated separately
Logistic regression model used to estimate probability of response p
To create weights, take reciprocal of p (i.e. 1/p) and rescale by dividing by mean of 1/p
School non-response and pupil level non-response weights combined with design weights to create final weight
Generally speaking, non-response weights are inversely correlated with design weights – small loss of efficiency
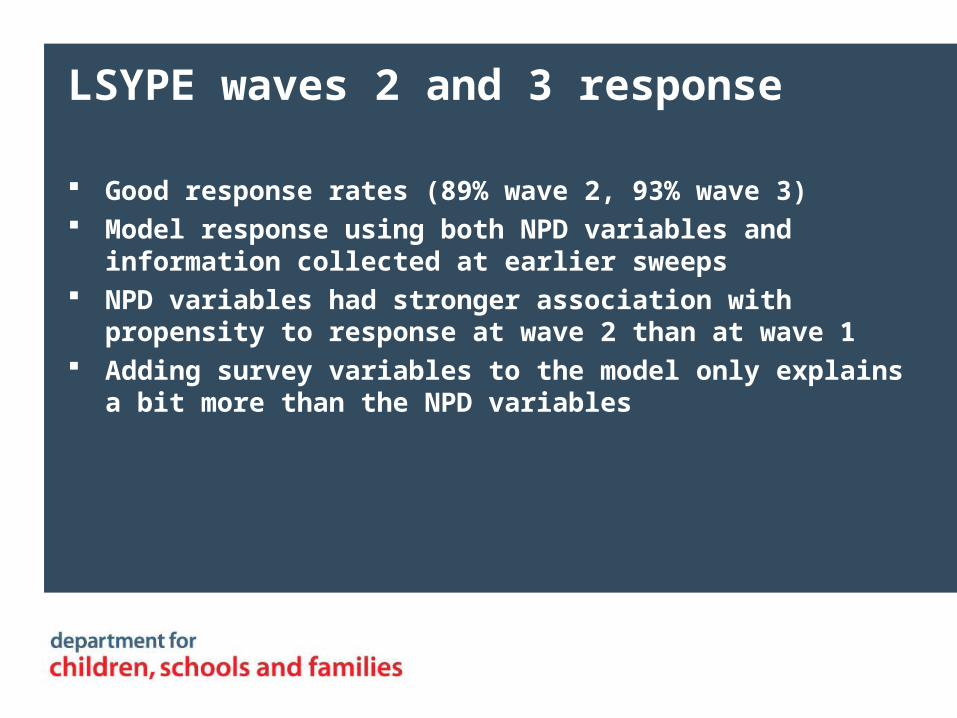
LSYPE waves 2 and 3 response
Good response rates (89% wave 2, 93% wave 3) Model response using both NPD variables and information
collected at earlier sweeps NPD variables had stronger association with propensity to
response at wave 2 than at wave 1 Adding survey variables to the model only explains a bit more
than the NPD variables

YCS 13
Similar sample design to LSYPE:– Face to face– 2 stage PPS design– Over sample ethnic minorities using school census
But:– Over sample low attainers (defined as those with no A*-Cs and
less than 5 D-Gs) by a factor of 2– Postcode sectors are PSUs as opposed to schools (smaller
design effects)– Full address collected through school census by-passing need
to go through schools
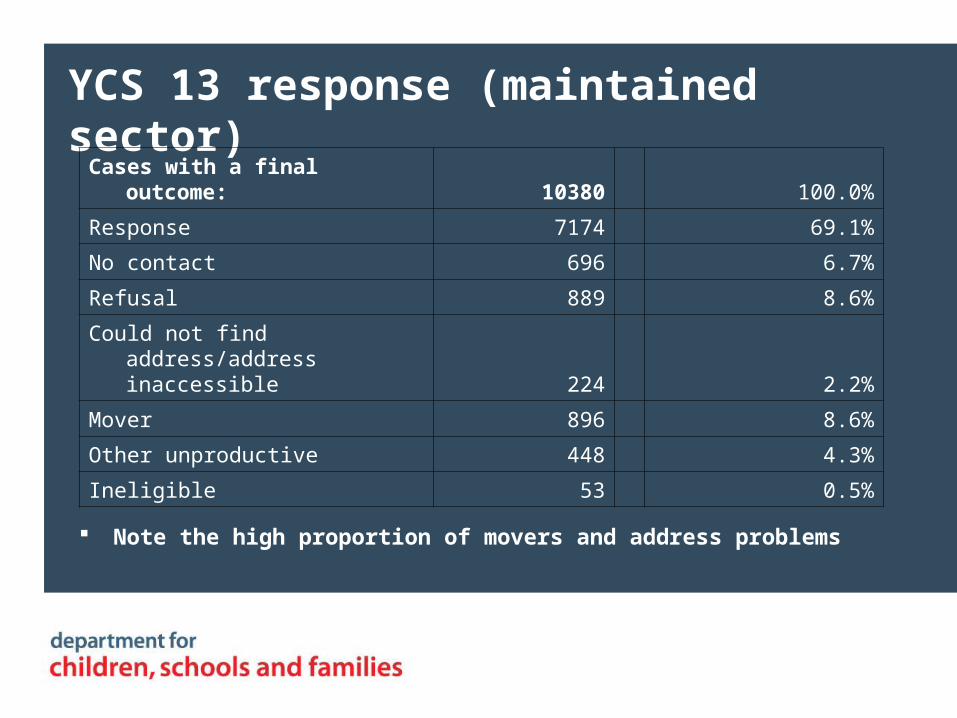
YCS 13 response (maintained sector)
Note the high proportion of movers and address problems
Cases with a final outcome: 10380 100.0%
Response 7174 69.1%
No contact 696 6.7%
Refusal 889 8.6%
Could not find address/address inaccessible 224 2.2%
Mover 896 8.6%
Other unproductive 448 4.3%
Ineligible 53 0.5%
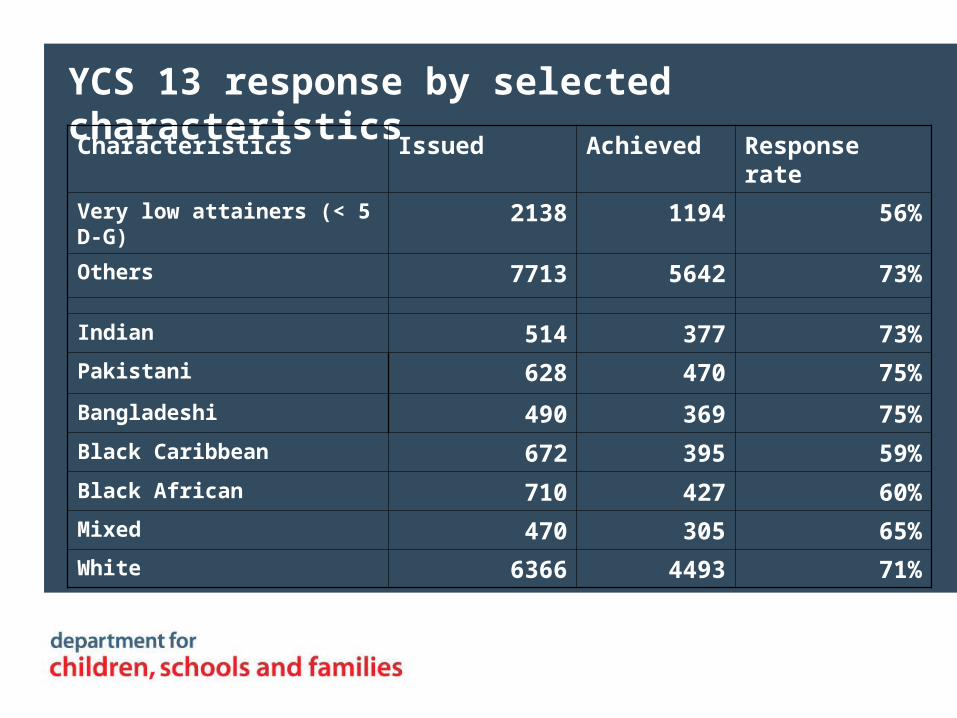
YCS 13 response by selected characteristics
Characteristics Issued Achieved Response rate
Very low attainers (< 5 D-G) 2138 1194 56%
Others 7713 5642 73%
Indian 514 377 73%
Pakistani 628 470 75%
Bangladeshi 490 369 75%
Black Caribbean 672 395 59%
Black African 710 427 60%
Mixed 470 305 65%
White 6366 4493 71%
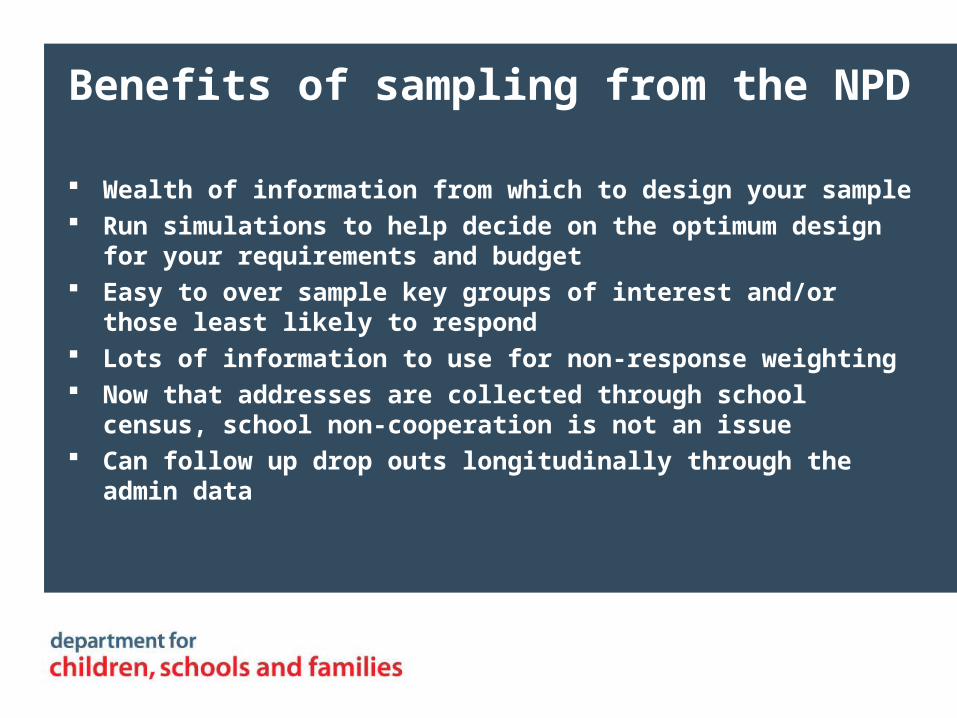
Benefits of sampling from the NPD
Wealth of information from which to design your sample Run simulations to help decide on the optimum design for your
requirements and budget Easy to over sample key groups of interest and/or those least
likely to respond Lots of information to use for non-response weighting Now that addresses are collected through school census,
school non-cooperation is not an issue Can follow up drop outs longitudinally through the admin data

Drawbacks of sampling from the NPD
Address information missing or not up to date…but 2006 was the first year in which schools were required to supply addresses in the school census so this should improve
Data quality in school census is a potential problem, e.g. discrepancies between census report and self reported ethnicity
Any questions?
For more information on LSYPE see our page at ESDS longitudinal: http://www.esds.ac.uk/longitudinal/access/lsype/L5545.asp
YCS downloads and documentation:
http://www.esds.ac.uk/search/indexSearch.asp?ct=xmlSn&q1=33233
LSYPE sampling technical slides
Taken from “A new method for sample designs with disproportionate stratification” paper given to AAPOR annual conference 2005 by Peter Lynn, Patten Smith and Iain Noble

Sampling Method for LSYPE
Construct size measure Si in each PSU (school):
Si = ∑(Nik(nk/Nk))
Where:
Si = the size measure for PSU i;
Nik = the number in sub-population group k in PSU i;
nk = number required in issued sample in sub-population group k;
Nk= number in sub-population group k in the population.
Select m PSUs with probability proportional to Si:
P(PSU) = mSi/∑ Si
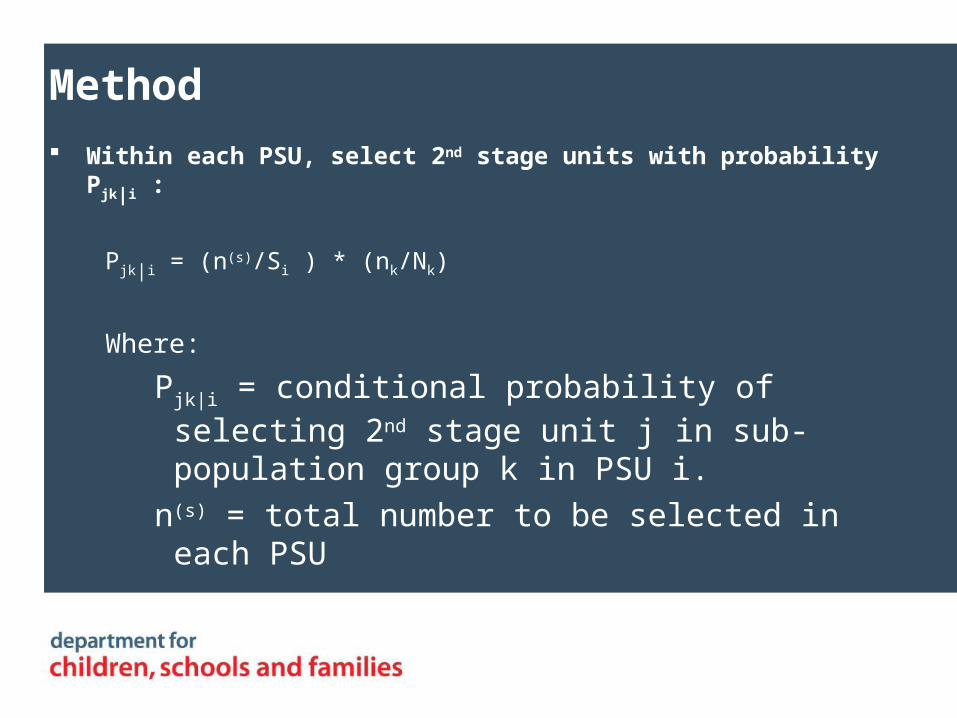
Method
Within each PSU, select 2nd stage units with probability Pjk|i :
Pjk|i = (n(s)/Si ) * (nk/Nk)
Where:
Pjk|i = conditional probability of selecting 2nd stage unit j in sub-population group k in PSU i.
n(s) = total number to be selected in each PSU
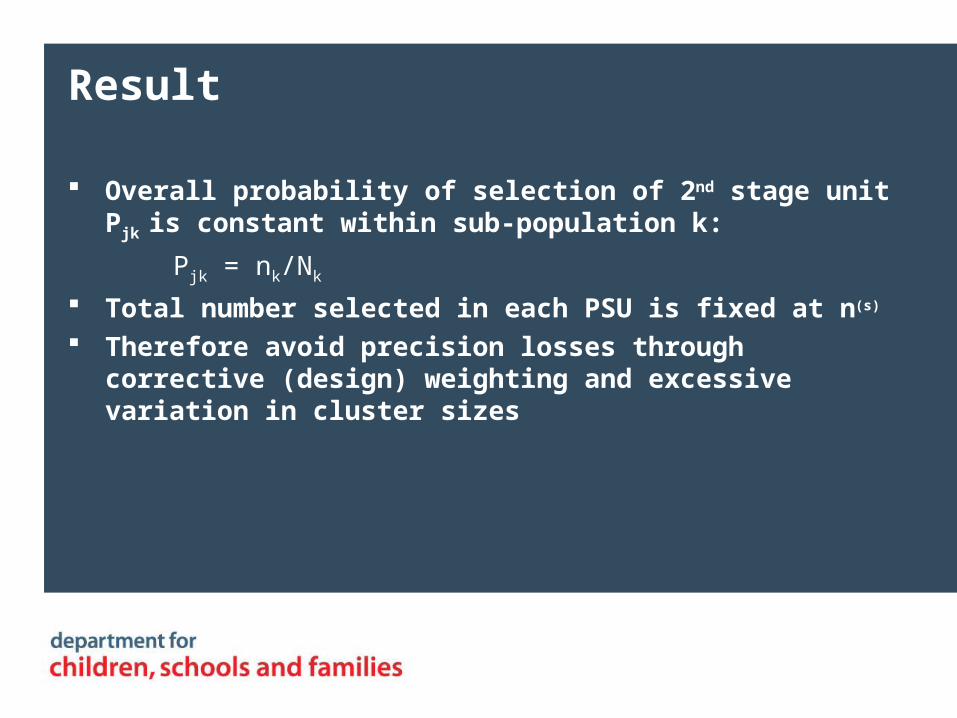
Result
Overall probability of selection of 2nd stage unit Pjk is constant within sub-population k:
Pjk = nk/Nk
Total number selected in each PSU is fixed at n(s)
Therefore avoid precision losses through corrective (design) weighting and excessive variation in cluster sizes
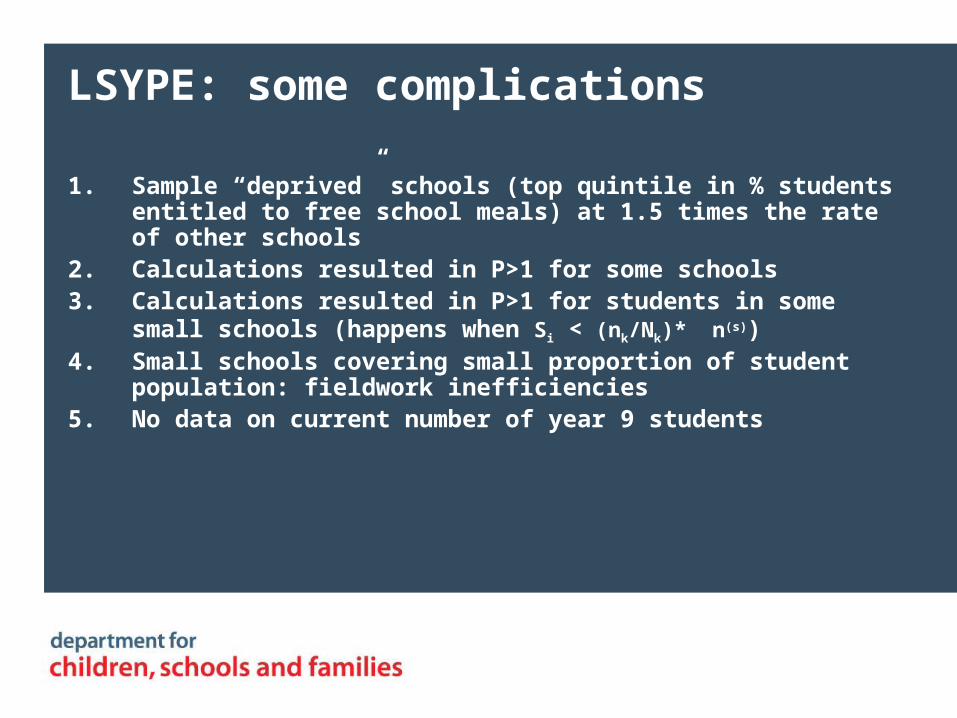
LSYPE: some complications
1. Sample “deprived” schools (top quintile in % students entitled to free school meals) at 1.5 times the rate of other schools
2. Calculations resulted in P>1 for some schools3. Calculations resulted in P>1 for students in some small schools
(happens when Si < (nk/Nk)* n(s))4. Small schools covering small proportion of student population:
fieldwork inefficiencies 5. No data on current number of year 9 students
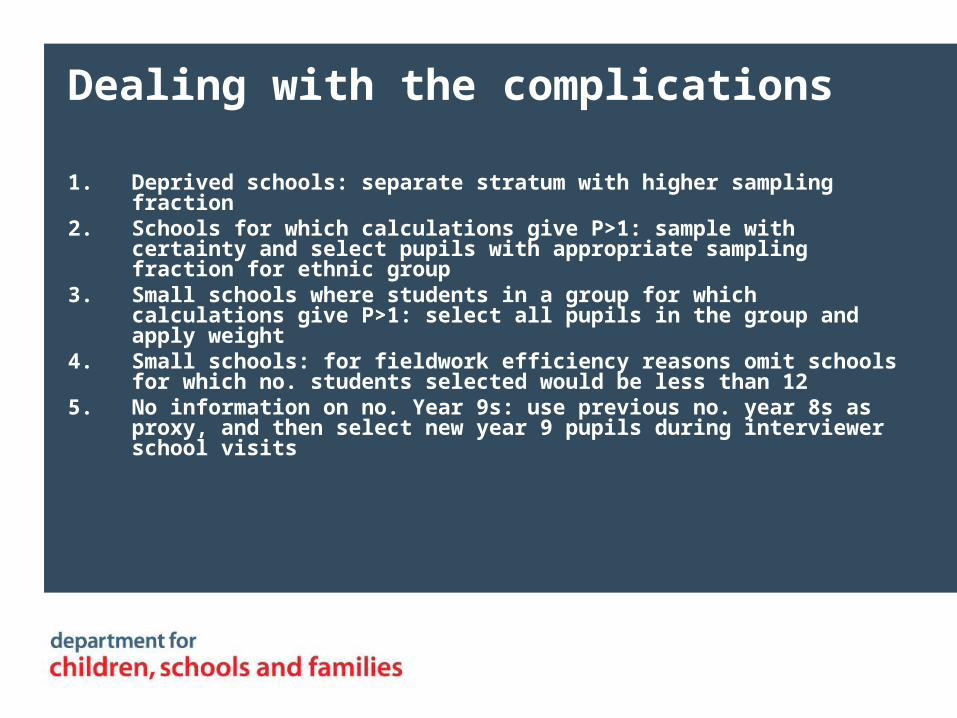
Dealing with the complications
1. Deprived schools: separate stratum with higher sampling fraction2. Schools for which calculations give P>1: sample with certainty and select
pupils with appropriate sampling fraction for ethnic group 3. Small schools where students in a group for which calculations give P>1:
select all pupils in the group and apply weight4. Small schools: for fieldwork efficiency reasons omit schools for which no.
students selected would be less than 125. No information on no. Year 9s: use previous no. year 8s as proxy, and then
select new year 9 pupils during interviewer school visits