Jamaicans in Boston
16
imagine all the people Jamaicans CITY OF BOSTON Martin J. Walsh Mayor 2016 Jamaicans in Boston “imagine all the people” is a series of publicaƟons pro- duced by the Boston Redevelopment Authority for the Mayor’s Office of Immigrant Advancement. The series provides a comprehensive profile of Boston’s diverse immigrant communiƟes and their numerous contribu- Ɵons to the city’s social, cultural and economic land- scape. It is part of an ongoing effort to celebrate immi- grants and gain insight into how they shape our city. Jamaican restaurant in Dorchester, photo: Phillip Granberry Jamaican-born coaches at Valeo soccer club located in Newton, Boston, Somerville, and Jamaica
-
Upload
digaai -
Category
Government & Nonprofit
-
view
119 -
download
0
Transcript of Jamaicans in Boston

imagine all the people
Jam
aica
ns
CITY OF BOSTON
Martin J. Walsh
Mayor 2016
Jamaicans in Boston
“imagine all the people” is a series of publica ons pro-duced by the Boston Redevelopment Authority for the Mayor’s Office of Immigrant Advancement. The series provides a comprehensive profile of Boston’s diverse immigrant communi es and their numerous contribu-
ons to the city’s social, cultural and economic land-scape. It is part of an ongoing effort to celebrate immi-grants and gain insight into how they shape our city.
Jamaican restaurant in Dorchester, photo: Phillip Granberry
Jamaican-born coaches at Valeo soccer club located in Newton, Boston, Somerville, and Jamaica

2
There have been three significant waves of Jamaican immigra on to the United States since the beginning of the twen eth century. The first oc-curred between 1900 and 1924—when the Na onal Origins Act severely re-stricted immigra on to the U.S.1 Caribbean immigra on to the United States would plummet from 10,630 in 1924 to 321 the following year.2
The second wave picked up steam during World War II: star ng in 1943, mi-grant workers were brought in to help with the U.S. war effort by working in agriculture. At first, a majority of migrants were directed to Florida, but many would relocate to other states. Many tobacco workers who were working in Connec cut chose to move to Boston and New York a er their contracts expired in 1950 instead of returning to the Caribbean. Post-war migra on to the United States was again reduced in 1952 with the passage of the McCarran-Walter Act, which upheld the quota system, and much of Caribbean emigra on was rerouted to Great Britain.3
The third wave began with the 1965 passage of the Immigra on and Na on-ality Act, which led to increased Caribbean immigra on to the United States, especially as Great Britain had begun to block immigra on in 1962. As a re-sult, Jamaican immigra on to the United States almost doubled from 1970 to 1980.4
Es mates from the 2014 American Community Survey (ACS) show that 705,804 foreign-born individuals from Jamaica reside in the United States, which has been the leading des na on for Jamaican emigrants. Other prima-ry des na ons include England and Canada. Over 60 percent of foreign-born Jamaicans in the United States reside in New York and Florida.
Massachuse s has the seventh largest Jamaican popula on in the United States. According to the 2014 American Community Survey (ACS) there are an es mated 16,964 Jamaicans living in Massachuse s today. Other popular states for Jamaican migra on are New Jersey, Georgia and Connec cut.
Boston College’s Jamaica Magis service trip

3
Nearly 60% of
foreign-born
Jamaicans in
Boston are
between the ages
of 35 and 64.
Share of Foreign-Born Jamaican Popula on by State
According to the 2014 American Community Survey (ACS) 7,063 Jamai-cans reside in Boston.5 Jamaica is the sixth largest country of origin for Boston’s foreign-born popula on. Overall, Jamaicans in Boston cons -tute 4.4 percent of the city’s total foreign-born residents.6 Dominicans and Chinese comprise the largest share of the city’s foreign-born popula-
on, followed by Hai ans, Salvadorans, and Vietnamese.
Boston’s foreign-born Jamaicans, though sca ered throughout the city, live mostly in the neighborhoods of Dorchester (38 percent), Ma apan (26 percent), and Hyde Park (17 percent). Other neighborhoods with smaller concentra ons are Roxbury, Roslindale, and Jamaica Plain.7
The U.S. Census Bureau’s ACS Public Use Microdata Sample (PUMS) al-lows for the detailed socio-economic analysis of specific popula ons. For smaller popula ons like foreign-born Jamaicans in Boston, a 5-year sam-ple is required to limit varia on due to sampling error. The analysis that follows uses 2009-2013 ACS PUMS data.
Jamaican migra on has historically been dispropor onately female, and 53 percent of foreign-born Jamaicans in Boston are female. Almost 66 percent of foreign-born Jamaicans in Boston are either married (38 per-cent) or divorced/separated (18 percent) or widowed (10 percent). Ap-proximately 60 percent of all foreign-born Jamaicans are between the ages of 35 and 64, and the median age of the popula on is 48 years. The majority of foreign-born Jamaicans (52 percent) are naturalized U.S. citi-zens.
Source: U.S. Census Bureau, 2014 American Community Survey, PUMS, BRA Research Division

4
35% of foreign-
born Jamaicans
have a high school
educa on as their
highest level of
educa on.
Educa onal A ainment of Boston Residents 25 Years and Older
Educa onal A ainment
Approximately 23 percent of foreign-born Jamaicans in Boston ages 25 years or older have not completed high school. This share is higher than all foreign-born residents (28 percent) and over twice the share for the na ve-born popula on (9 percent). Approximately 35 percent of for-eign-born Jamaicans have a high school diploma as their highest educa-
onal a ainment.
While 41 percent of foreign-born Jamaicans 25 years or older have a ended college, only 18 percent have completed at least a bachelor’s degree, compared with 29 percent of the foreign-born popula on, and 52 percent of the na ve born. With respect to advanced degrees, only 5 percent of foreign-born Jamaicans living in Boston hold a graduate/professional degree or higher, compared with 14 percent of the foreign born and 22 percent of the na ve born.
U.S. Census Bureau, 2009-2013 American Community Survey, PUMS, BRA Research Division Analysis

5
Nearly 25 percent of foreign-born Jamaicans in the workforce are em-ployed in service occupa ons.8 The next two largest occupa onal catego-ries are health care prac oners & support (20 percent) and construc on, extrac on, maintenance, and transporta on (15 percent). Foreign-born Jamaicans work in a more diverse set of occupa ons compared other for-eign-born popula ons. However, similar to other foreign-born popula ons, Jamaicans are under-represented in managerial and professional occupa-
ons: 12 percent for Jamaicans compared with 18 percent for the total for-eign-born popula on and 28 percent for the na ve born.
Occupa ons by Na vity
U.S. Census Bureau, 2009-2013 American Community Survey, PUMS, BRA Research Division Analysis

6
A greater share of
Jamaicans are
employed in private,
non-profit
organiza ons than
other foreign-born
and na ve-born
popula ons.
In total, 75 percent of foreign-born Jamaicans par cipate in the labor force compared with 68 percent of the total foreign-born popula on and 69 percent of the na ve-born popula on.9 Compared to other popula ons in Boston, Jamaicans are slightly less likely to be self-employed—4.8 percent--compared to 7 percent for the total foreign-born popula on and 5.9 percent for the na ve born.10 An es mated 64 percent of foreign-born Jamaicans work for private, for-profit companies, which is more similar to the na ve born than other for-eign-born popula ons. An addi onal 22 percent work for private, nonprofit organiza ons, and 9 percent are employed in the public sector (local, state and federal government).
Employment Type by Type of Employer
U.S. Census Bureau, 2009-2013 American Community Survey, PUMS, BRA Research Division
7
Economic Impact
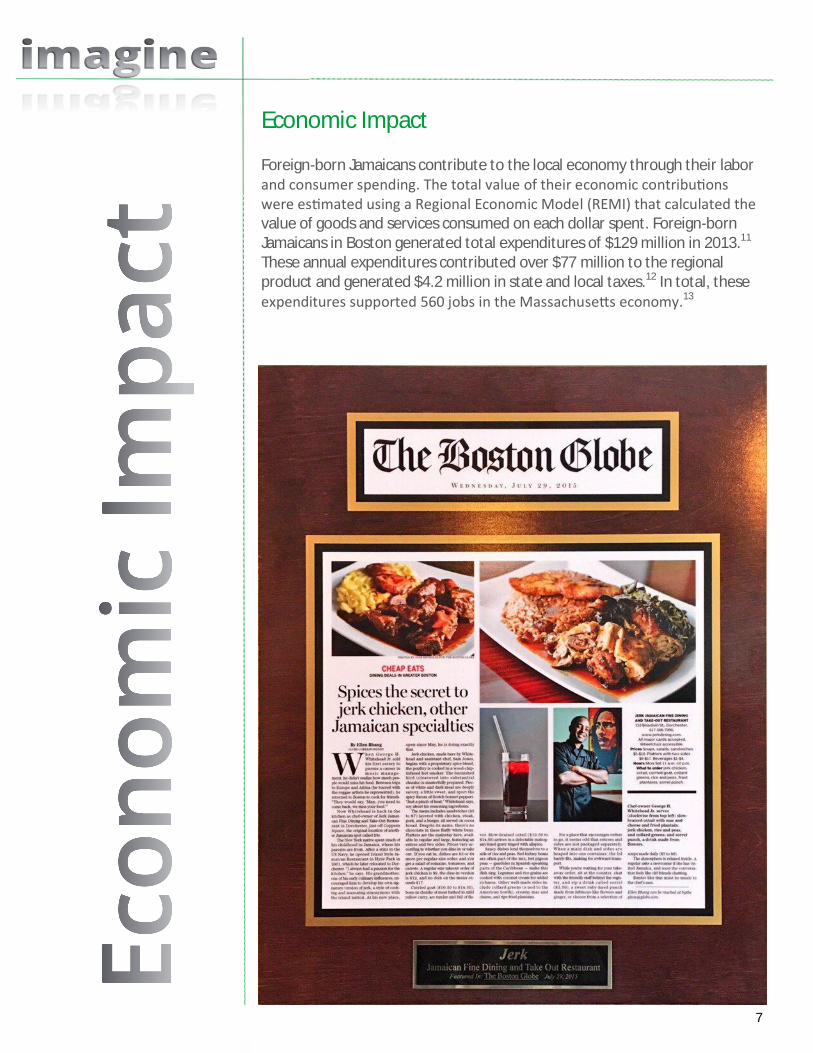
Foreign-born Jamaicans contribute to the local economy through their labor and consumer spending. The total value of their economic contribu ons were es mated using a Regional Economic Model (REMI) that calculated the value of goods and services consumed on each dollar spent. Foreign-born Jamaicans in Boston generated total expenditures of $129 million in 2013.11 These annual expenditures contributed over $77 million to the regional product and generated $4.2 million in state and local taxes.12 In total, these expenditures supported 560 jobs in the Massachuse s economy.13

8
Age
Gender
Marital Status
Source: U.S. Census Bureau, 2009-2013 American Community Survey, PUMS, BRA Research Division Analysis
Imagine all the people: Jamaica

9
Housing Tenure*
Housing Costs*
Medical Uninsurance
*Housing data are based on the householder’s na vity.

10
Collec vely,
Jamaicans
contributed close
to $77 million to
the regional
economy in 2013.
Approximately 35 percent of foreign-born Jamaicans have achieved a middle class standard of living, compared with 45 percent of Boston’s na ve-born popula on, and 29 percent of all foreign-born. A family income four mes the poverty line is used as a proxy for a middle-class standard of living. The actual income needed to achieve this standard depends on the size and composi on of the family. For a two-person family in 2014, a middle class income would be at least $62,920.14 In contrast, 13 percent of foreign-born Jamaicans live below the federal poverty level compared to 20 percent for the city’s na ve-born popula on.
Even though originally se led by the Spanish who imported African slaves, Jamaica was a Bri sh colony un l 1962. As a result, Jamaicans speak English and language acquisi on does not hinder their labor force par cipa on. Along with their high labor force par cipa on, this might account for their economic success compared to other foreign born.
Household Income Compared to Poverty Threshold
Standard of Living
U.S. Census Bureau, 2009-2013 American Community Survey, PUMS, BRA Research Division Analysis

11
Labor force participation: Defined as the share of the working-age population that is either currently employed or seeking workLabor, Bureau of Labor Statistics, 2014.
There is no agreement among researchers regarding the reasons for variations in the self-employment rates among different immigrcited include human and financial capital of individual immigrants, high rates of solidarity and social capital in some immigthe opportunity structure encountered by immigrant entrepreneurs.

12
Children of Jamaican Origin The 2009-2013 American Community Survey es mates 2,146 children in Boston are of Jamaican origin.15 Children of Jamaican origin in Boston are predominate-ly na ve born – 92 percent. However, 49 percent of Jamaican children live with foreign-born parent(s). In comparison, 40 percent of all Boston’s children live with foreign-born parent(s).
Jamaican children with foreign-born parent(s) are less likely to live poverty. Slightly less than 15 percent of Jamaican children with foreign-born parent(s) compared to 28 percent of all children in Boston are below the federal poverty level ($23,850 for a 4-person household in 2014).
Jamaican-born Jus n Masterson playing for the Boston Red Sox
Jamaican Associates, Inc. Boston pumpkin picking trip

13
Even though Massachuse s is not a leading des na on for Jamaicans who mi-grate to the United States, they are the sixth largest foreign-born popula on in Boston. Foreign-born Jamaicans in Boston contribute to the economy, culture, and civic life of Boston. Foreign-born Jamaican labor force par cipa on is great-er than other foreign-born popula ons, and they are more likely to work in the non-profit sector. They have a smaller share of their popula on living below the federal poverty level than others in Boston
Jamaican Associates, Inc. Boston—2014 Jamaican Independence Day Gala

14
1N. Samuel Murrel, “Jamaican Americans,” Countries and their Cultures. 2“Caribbean Migra on,” In Mo on: The African-American Experience. Schomburg Center for Research in Black Culture. 3“Caribbean Migra on,” In Mo on: The African-American Experience. Schomburg Center for Research in Black Culture. 4Alex Glennie and Laura Chappell, “Jamaica: From Diverse Beginning to Diaspora in the Developed World,” Migra on Policy Ins tute (2010). 5 The ACS’s American Fact Finder website reports that there are an es mated 7,063 foreign-born Jamaicans in Boston. However, ACS Public Use Microdata Sample (PUMS) data for Boston reports a lower es mate of 5,938. Both are popula on es -mates, and contain a margin of error due to sampling technique. Lower survey re-sponse rates due to documenta on issues may result in an undercount of the popu-la on. For more informa on on American Fact Finder please see: h p://fac inder.census.gov/home/saff/main.html?_lang=en . 6 U.S. Census Bureau, 2014 American Community Survey, PUMS data, BRA Research Analysis (2016). 7 U.S. Census Bureau, 2009-2013 American Community Survey, American Fac inder, BRA Research Analysis (2016). 8 This analysis organizes occupa ons into 12 categories. Managerial and Profession-al contains categories of Management, Business, Science, and Arts Occupa ons, Business Opera ons Specialists, Financial Specialists, Computer and Mathema cal Occupa ons, Architecture and Engineering Occupa ons, Life, Physical, and Social Science Occupa ons, and Legal Occupa ons. Healthcare Prac oners & Support contains the categories of Healthcare Prac oners and Technical Occupa ons and Healthcare Support Occupa ons. Service Occupa ons contains the categories of Protec ve Service Occupa ons, Food Prepara on and Serving Occupa ons, Building and Grounds Cleaning and Maintenance Occupa ons, and Personal Care and Ser-vice Occupa ons. Construc on, Extrac on, Maintenance, and Transporta on con-tains the categories of Construc on and Extrac on Occupa ons, Extrac on Work-ers, Installa on, Maintenance, and Repair Workers, and Transporta on and Materi-al Moving Occupa ons. Other categories consis ng of Farming, Fishing, and Forest-ry, Military Specific, and long-term unemployed are excluded. 9 Labor force par cipa on: Defined as the share of the working-age popula on that is either currently employed or seeking work. U.S. Department of Labor, Bureau of Labor Sta s cs, 2016.

15
10 There is no agreement among researchers regarding the reasons for varia ons in the self-employment rates among different immigrant groups. Reasons cited include hu-man and financial capital of individual immigrants, high rates of solidarity and social capital in some immigrant communi es, as well as the opportunity structure encoun-tered by immigrant entrepreneurs. 11 BRA Research Division Analysis, 2014, Regional Economic Model, Inc., REMI calcula-
ons. 12 BRA Research Division Analysis, 2014, Regional Economic Model, Inc., REMI calcula-
ons. 13 BRA Research Division Analysis, 2014, Regional Economic Model, Inc.,REMI calcula-
ons. 14 Following the Office of Management and Budget's (OMB) Sta s cal Policy Direc ve 14, the Census Bureau uses a set of money income thresholds that vary by family size and composi on to determine who is in poverty. If a family's total income is less than the family's threshold, then that family and every individual in it is considered in pov-erty. The official poverty thresholds do not vary geographically. U.S. Census Bureau (2016). 15 The U.S. Census defines origin as “the heritage, na onality, lineage, or country of birth of the person or the person’s parents or ancestors before arriving in the United States.
Denzil McKenzie, Honorary Consul for Boston Jamaicaconsulboston.org

16
Produced by the Research Division
Alvaro Lima, Director of Research Jonathan Lee– Deputy Director
Chris na Kim – Research Manager Phillip Granberry – Senior Researcher/Demographer
Ma hew Resseger – Senior Researcher/Economist
Kevin Kang – Research Associate Kevin Wandrei – Research Assistant
Interns: Michael Bratsis
Jingwan Wang Cyan O’Garro
Map by the Digital Cartography & GIS Alla Ziskin
Brian P. Golden, Director