
Jail Pop Exploratory Studydiscover.pbcgov.org/criminaljustice/PDF/rpu/Research and...We also...
14
Prepared by : Damir Kukec Date: July 16, 2009 (Updated) Research and Planning Manager Criminal Justice Commission Exploratory Study of the County Jail Population: HIGHLIGHTS (Working Draft) Prepared for: Corrections Task Force, Criminal Justice Commission
Transcript of Jail Pop Exploratory Studydiscover.pbcgov.org/criminaljustice/PDF/rpu/Research and...We also...

Prepared by : Damir Kukec Date: July 16, 2009 (Updated) Research and Planning Manager Criminal Justice Commission
Exploratory Study of the County Jail Population:
HIGHLIGHTS
(Working Draft)
Prepared for: Corrections Task Force, Criminal Justice Commission

RESEARCH & PLANNING PAGE I
Table of Contents
Introduction: ..................................................................................................................................... 1
Method .............................................................................................................................................. 1
Findings .............................................................................................................................................. 2
Admissions..................................................................................................................................... 2
Inmate Characteristics ............................................................................................................... 3
Admissions Characteristics ............................................................................................................. 6
Case Type ..................................................................................................................................... 6
Inmate Status ............................................................................................................................... 7
Aggregate Bond ......................................................................................................................... 8
Length of Stay .............................................................................................................................. 9
Offense Categories ................................................................................................................... 10
Releases into the Community ..................................................................................................... 11

RESEARCH & PLANNING PAGE II
Acknowledgments
The Research and Planning Unit, Criminal Justice Commission would like to thank the Corrections staff from the Palm Beach County Sheriff’s Office for their support and willingness to answer our endless questions. In particular, we would like to acknowledge Major Chris Kneisley, Lieutenant Robert Manley, Sandra Smith, and Denise L. Ellis. We also owe a great debt of gratitude to John Young, the computer systems analyst who maintains the Booking Information Retrieval System (BIRS) at the Sheriff’s Office. Special thank you to Katherine Hatos and Candee Villapando, Criminal Justice Analyst, Criminal Justice Commission who were instrumental in developing the syntax for coding derived variables and charge categories and acquiring “corporate knowledge”. Finally, I would like to thank all Research and Planning Staff who reviewed the report and provided their helpful comments.
RESEARCH & PLANNING PAGE 1
Introduction: The purpose of this exploratory study is to review the data maintained by the Corrections Bureau, Palm Beach County Sheriff’s Office inmate database Incarceration Inmate Management and Cost Recovery System (IMACS). It is our hope that the dissemination of these findings will generate discussion and interest so that we may improve and enhance the type of information we provide to support policy and program development. More specifically, these data were developed to inform the policy discussions of the Corrections Task Force, Alternatives to Incarcerations Committee and were recently used by the Re-Entry Committee to submit a federal grant application in late April 2009.
Method
The following findings are based on an extract from the IMACS Charge Information Table based on “bookings” that occurred between January 1, 2005 and December 31, 2008. The date of extract is April 21, 2009, 14:00:00.
These data were then aggregated to calculate the number of unique admissions and inmates that entered the County jail during the above noted period. It is important to note that these data do not include inmates that were already in the jail as of January 1, 2005 when examining the four year cohort of admissions and inmates. When examining the number of days in custody, readers should know that these lengths are calculated using “booking date & time (hh:mm:ss)” along with “release date & time (hh:mm:ss)” expressed in days.
Readers should also be aware that the Research and Planning Unit has used the jail data to derive new variables. For example, using the Inmate Id Number, Booking Date and Booking Time, we derived the variable Admission by aggregating the individual booking records reported by the Corrections Bureau. As a result, the statistics noted below may not match exactly the operational data maintained by the Corrections Bureau, as these data include the derived variables and the dataset is “frozen” as of the date of extract. Lastly, the research dataset will also exclude data that appear invalid, such as release dates occurring before the booking date. Admissions involving Criminal Registrants are not included in these data. Regardless, these data are an important part of better understanding the jail population characteristics and activities.
The Research and Planning Unit welcomes your input, so please do not hesitate to contact us at (561) 355-4943 or [email protected].
RESEA
Finding
Admissi
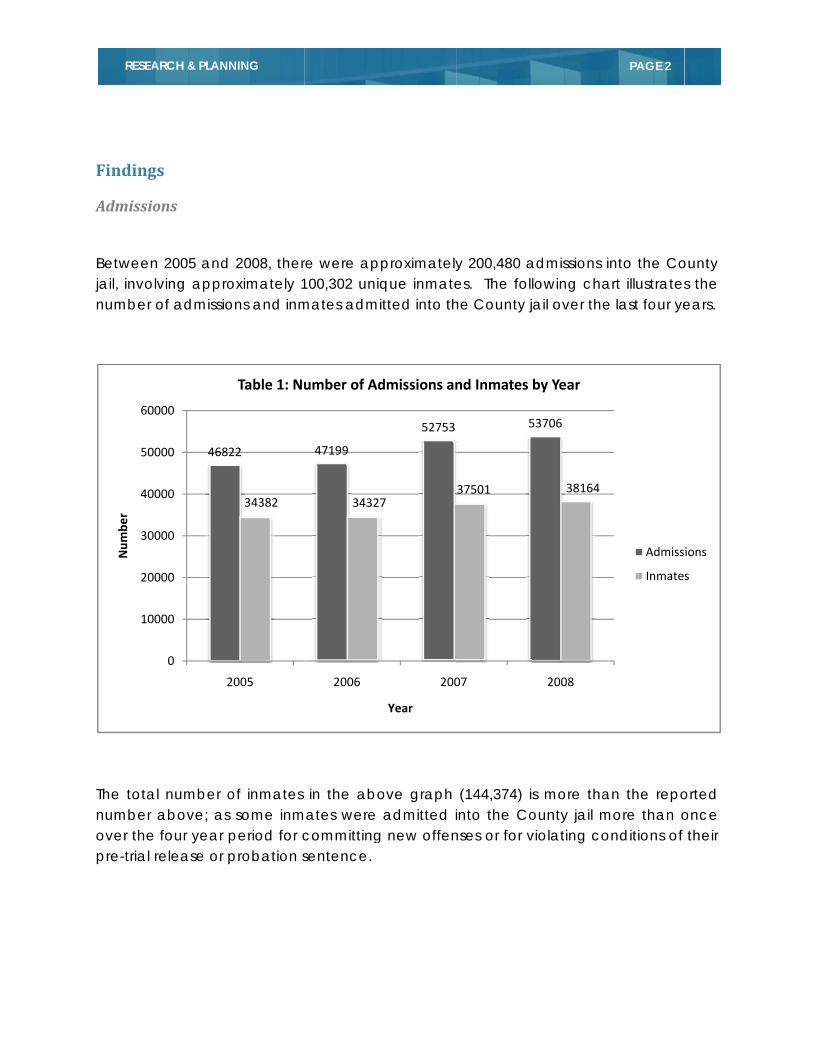
Betweenjail, invonumber
The totanumber over thepre-trial
10
20
30
40
50
60
Num
ber
ARCH & PLAN
gs
ions
n 2005 andolving appro of admissio
al number o above; as
e four year release or
468
0
0000
0000
0000
0000
0000
0000
2
NING
d 2008, theroximately 1ons and inm
of inmates s some inmperiod for cprobation s
22
34382
2005
Table 1: Nu
re were ap100,302 uniqmates admi
in the abomates were
committingsentence.
47199
34327
2006
umber of Ad
proximatelyque inmateitted into th
ove graph admitted i
g new offen
52753
7
200
Year
dmissions an
y 200,480 aes. The follhe County j
(144,374) iinto the Co
nses or for v
5
37501
07
nd Inmates
admissions ilowing chaail over the
s more thaounty jail mviolating co
53706
38164
2008
by Year
PAGE 2
into the Coart illustratese last four ye
an the repomore than oonditions of
Admiss
Inmate
ounty s the ears.
orted once their
ions
s

RESEARCH & PLANNING PAGE 3
Inmate Characteristics
We also examined the sex, race, and age group of individuals admitted into the county jail. Understanding the characteristics of the jail population may benefit those who operate the jail as well as those who may want to implement programs or policies targeting a specific population. The majority of inmates entering the county jail are male (76,916), while almost 23% were female (23,362).
77%
23%
Table 2: Sex of Inmates Admitted, 2005 to 2008
Male
Female

RESEARCH & PLANNING PAGE 4
The following chart shows that the majority of inmates admitted into the jail are reported as White (68,306) between 2005 and 2008. In comparison, approximately 32% of the inmates were reported as Black (31,877). The remaining race categories were virtually unreported when compared to White and Black.
68.10%
31.78%
0.01% 0.08% 0.03%0.00%
10.00%
20.00%
30.00%
40.00%
50.00%
60.00%
70.00%
80.00%
White Black American Indian/Alaskan
Native
Asian/Pacific Islander
Unknown
Percen
t
Reported Race
Table 3: Inmates Admitted by Race, 2005 to 2008
The above graph suggests that Blacks appear to be overrepresented in the inmate population as Blacks make up roughly 13% of the population in Palm Beach County. We also examined the variable “language spoken” to further explore the ethnic makeup of inmates admitted to the county jail between 2005 and 2008. Regrettably, this variable is not as robust as Race; however, we found that when language spoken was reported, it showed that 84% of the inmates reported speaking Spanish, and 10% reported speaking Creole.

RESEA
Not surpadmitteshow thFurthermtend to
0
5
10
15
20
25
30
Percen
t
ARCH & PLAN
prising the 1d into the cis group to
more, the g“age out o
7.5%
0.0%
5.0%
0.0%
5.0%
0.0%
5.0%
0.0%
17 & Unde
T
NING
8 to 24 yeacounty jail bo be the mraph suppo
of crime.”
27.0%
r18 to 24
Table 4: % In
ar old age between 20
most criminoorts the ove
16.0%
21
25 to 29 30
mates Admi
group repo005 and 200ogenic, wherall trend t
1.9%
17.8%
to 39 40 to 4
Age Gro
itted by Age
orted the h08. This reflen compahat as an in
%
7.5%
49 50 to 59
oup
e Group, 200
highest numects schola
ared to othndividual g
1.8%0
60 to 69 70
05 to 2008
PAGE 5
mber of inmarly works wher age grogrows older
0.4% 0.1%
0 to 79 80+
mates which oups. they
%
+

RESEARCH & PLANNING PAGE 6
Admissions Characteristics
Case Type
Over one-third (73,601) of all admissions are related to felony offenses according to the data. It is important to note that unless otherwise specified, the data have been sorted by Most Serious Offense in situations where the admission contains more than one charge.
36.72%
28.91%
12.19%
7.49%
6.16%
5.92%
0.88%
0.83%
0.48%
0.16%
0.10%
0.09%
0.04%
0.02%
0.01%
0.00% 5.00% 10.00% 15.00% 20.00% 25.00% 30.00% 35.00% 40.00%
Felony
Misdemeanor
Failure to Appear FTA
Traffic Misdemeanor
Booked for Other/Transit
Violation of Probation
Violation of Contempt of Court
Ordinance
Violation of Supervised OR
Bench Warrant
Bond Surrender
Sex Predator/Offender
Failure to Comply
Military
Career Offender
Valid Percent
Case Type
Table 5: % Admission by Case Type, 2005 to 2008
RESEA
Inmate
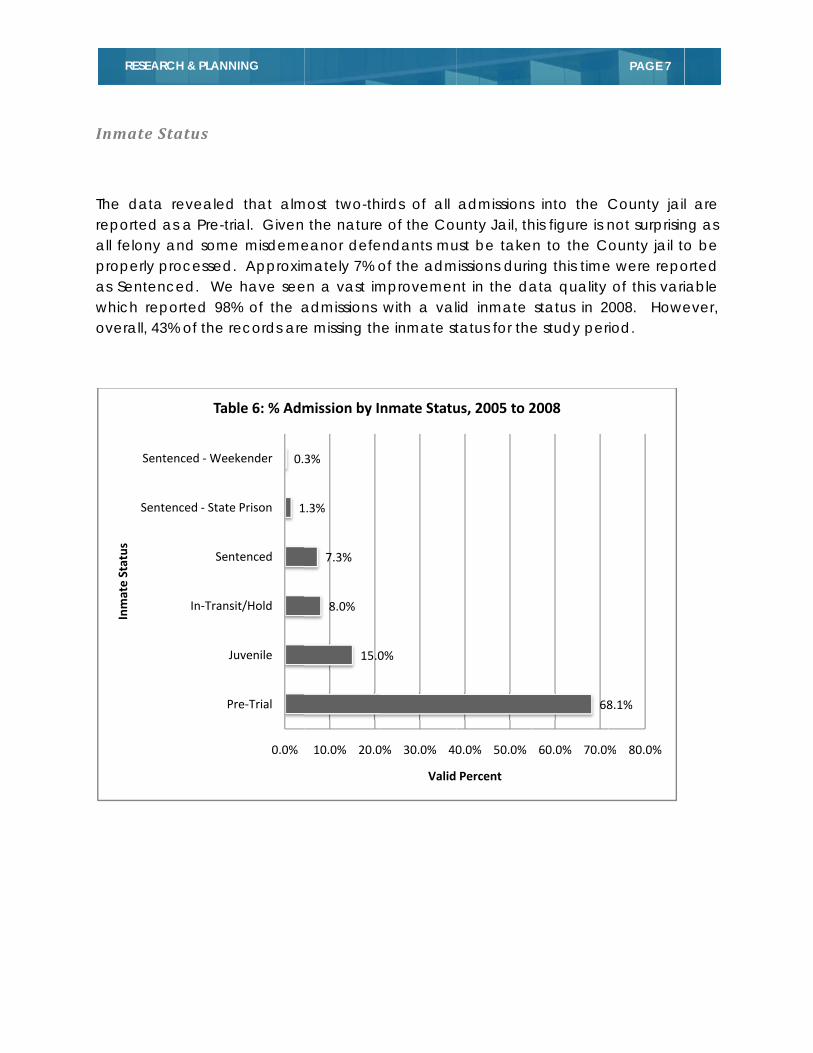
The datreportedall felonproperlyas Sentewhich reoverall, 4
Se
Se
Inmate Status
ARCH & PLAN
e Status
ta revealedd as a Pre-ty and som
y processedenced. Weeported 9843% of the
P
In‐Tran
Se
entenced ‐ Stat
entenced ‐We
Ta
NING
d that almtrial. Given
me misdemed. Approxime have see8% of the arecords are
1
0.
0.0%
Pre‐Trial
Juvenile
nsit/Hold
ntenced
te Prison
ekender
ble 6: % Adm
most two-th the nature
eanor defemately 7% oen a vast imadmissions e missing th
15.0
8.0%
7.3%
1.3%
3%
10.0% 20.0
mission by I
irds of all e of the Coendants muof the admmprovemen
with a valhe inmate st
0%
0% 30.0% 40
Valid
nmate Statu
admissionsunty Jail, th
ust be takemissions durin
nt in the daid inmate tatus for the
0.0% 50.0%
Percent
us, 2005 to 2
s into the Chis figure is nn to the Cng this timeata quality status in 2
e study per
68
60.0% 70.0%
2008
PAGE 7
County jailnot surprisinounty jail to
e were repo of this vari008. Howe
riod.
8.1%
% 80.0%
l are ng as o be orted iable ever,
RESEA
Aggrega
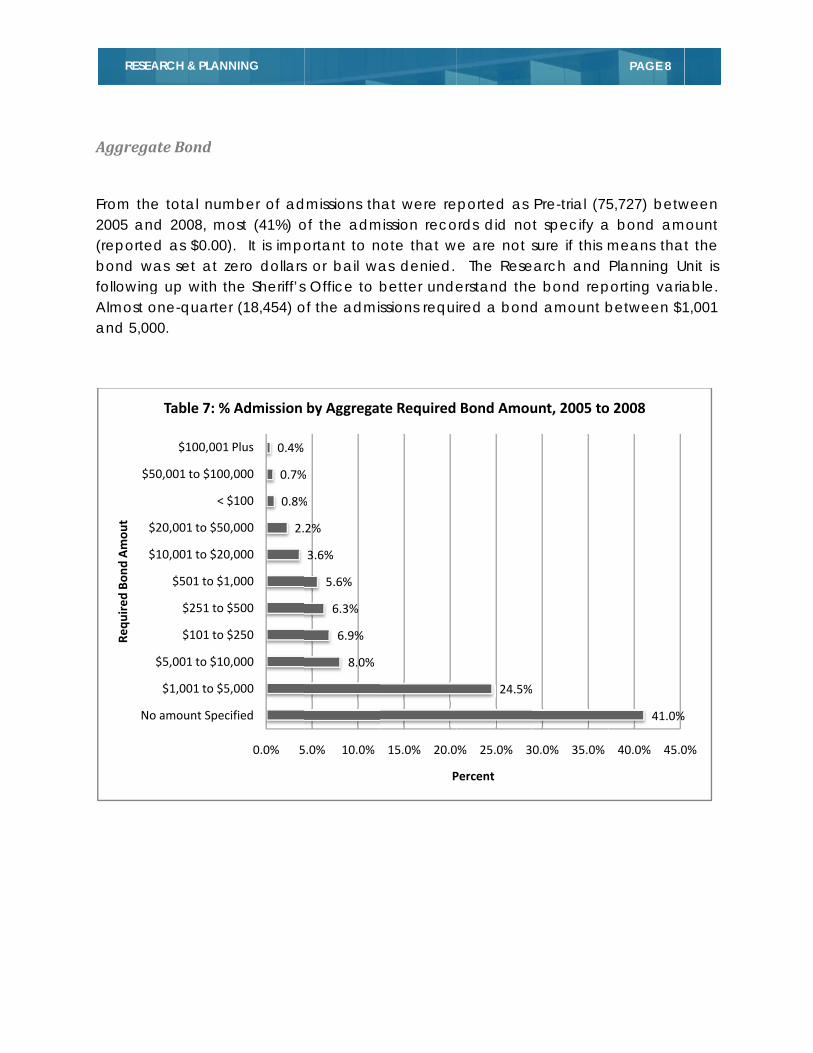
From the2005 an(reportebond wfollowingAlmost oand 5,00
No
$
$
$5
Requ
ired
Bon
d Amou
t
ARCH & PLAN
ate Bond
e total numnd 2008, moed as $0.00)was set at z
g up with tone-quarte00.
o amount Spec
$1,001 to $5
$5,001 to $10
$101 to $
$251 to $
$501 to $1
$10,001 to $20
$20,001 to $50
< $
50,001 to $100
$100,001
Table 7: %
NING
mber of adost (41%) o). It is impozero dollarshe Sheriff’sr (18,454) o
2.
0.8%
0.7%
0.4%
0.0% 5
cified
5,000
0,000
$250
$500
1,000
0,000
0,000
$100
0,000
1 Plus
% Admission
dmissions thof the admortant to ns or bail wa Office to b
of the admi
8.0%
6.9%
6.3%
5.6%
3.6%
2%
%
%
5.0% 10.0%
by Aggregat
at were remission reco
ote that was denied. better undessions requi
15.0% 20.0
P
te Required
eported as ords did nowe are not s
The Reseerstand theired a bond
24.5%
0% 25.0% 3
Percent
Bond Amou
Pre-trial (75t specify asure if this m
earch and e bond repd amount b
0.0% 35.0%
unt, 2005 to
PAGE 8
5,727) betwa bond ammeans thaPlanning U
porting variabetween $1
41.0%
40.0% 45.0
o 2008
ween mount
t the Unit is able. 1,001
%
0%

RESEA
Length o
The Casinmate betweeexcludinadmissiostay. Segrouped
When wMisdemedays in cof 35.6 dAdmissioMisdeme
0
10
20
30
40
50
60
Percen
t
ARCH & PLAN
of Stay
e Type or Inwill have n two Inm
ng weekenons result inentenced ad in 1 to 30
we examineanor Admcustody bedays in cusons, the aveanant Ad
50.3%
2
0.0%
0.0%
0.0%
0.0%
0.0%
0.0%
0.0%
< Day
NING
nmate Statin the Coate Status
nder). Betwn one to 30admissions days in cus
ned the Pmissions, weetween 200stody befoverage nummissions – 1
37.9%
2.1%
32.
y 1 to 30 Da
Table 8: %
tus does seeounty jail. values: Prween 20050 days in c were morestody with a
Pre-trial ane found tha05 and 2008ore being rember of da44.7 and 4
4.5%
0%
14.0%
ays 31 to 60 Day
Length
% Admission
em to have The followre-trial and and 2008ustody, wite evenly da reported
d Sentencat Misdeme8; while Feloeleased. Aays in cust8.4 respect
4.8%
29.6%
ys 61 to 180 Days
h of Stay
by Length o
e an impacwing chart d Sentence
, the vast th 17 days
dispersed, waverage 10
ced Admiseanants repony AdmissAs can be ody increatively.
1.9%
18.2%
181 to 365 Days
GrO
of Stay, 2005
ct on the le illustrates
ed (local semajority (8as the ave
with 34% of09 days in c
ssions acroported an asions reportexpected,
ased for bo
0.7%4.1%
reater than One Year
5 ‐ 2008
PAGE 9
ength of stathe differe
entenced 88%) of Preerage lengf the admicustody.
oss Felony average of ted an ave for Sentenoth Felony
Pre‐Trial
Local Senten
ay an ence only,
e-trial th of ission
and 3.56 rage
nced and
nced

RESEA
Offense
Between(includeTraffic Ototal Cri
Since thclosely. (51%) an
Dr
Offen
se Categories
ARCH & PLAN
Categories
n 2005 andes violent ofOffenses anmes Agains
he Other O We found
nd Violation
Cri
riving Under th
P
Ta
NING
s
d 2008, 22ffenses e.gd Drug Offst the Perso
Offenses cad that bulk n of Probati
Other Of
imes Against P
Property C
Traffic Of
Drug Of
he Influence Of
Public Order Of
Weapons Of
Vice Of
able 9: % Ad
% of all a., Robbery)fenses eac
on, almost o
tegory is so of this cation Admissi
1
0.0%
ffenses
ersons
Crimes
ffenses
ffenses
ffenses
ffenses
ffenses
ffenses
mission by O
dmissions r), and 19% h account
one-quarter
o prevalentegory canons (29%).
4.1%
2.4%
1.7%
1.6%
5.0% 10
Offense Cat
reported C of Admissioed for 11%r are violen
t, we examn be attribu
11.5%
10.9%
0.0% 15.0%
Valid Per
egories , 200
Crimes Agaons were P of Admissi
nt in nature.
mined the uted to Fai
2
19.2%
% 20.0%
rcent
05 to 2008
PAGE 10
ainst the PeProperty Criions. From.
category milure to Ap
26.6%
22.0%
%
25.0% 30
erson imes.
m the
more pear
%
0.0%

RESEARCH & PLANNING PAGE 11
Releases into the Community
The following data describe “releases” (not admissions) for local sentenced inmates only; therefore, other types of inmates such as pre-trial and those inmates released to the Florida Department of Corrections are not included in this analysis. Local sentenced inmates typically include offenders who were sentenced to a year less a day, regardless of the level of the offense (i.e., misdemeanor, felony, or local ordinance).
Overall, between 2005 and 2008, there were approximately 200,188 releases from county jail in Palm Beach County. From the total number of releases, almost four percent (7,991) can be attributed to releases for local sentenced inmates.
From the total number of local sentenced releases, the average length of days in custody for the four year period was approximately 113 days. When we examined the average number of days in custody for each year separately, we found that the average number of days decreased between 2005 and 2008.
At the time of this analysis, there were 53 different zip codes within Palm Beach County that identified specific municipal and county areas. The following 10 zip codes account for over 50% of the valid addresses for releases reported between 2005 and 2008 in Palm Beach County. The following 10 zip codes are listed in rank order (highest number of releases to lowest): 33404, 33407, 33444, 33435, 33460, 33461, 33401, 33463, 33415, and 33409).
From the total number of municipal and county areas (39) used in this analysis, the top 10 areas account for almost 60% of the valid addresses for releases reported between 2005 and 2008. The following municipal and county areas are listed in order from highest number of releases to lowest:
1. Riviera Beach, Palm Beach Shores, Unincorporated 2. West Palm Beach, Mangonia Park, Riviera Beach 3. West Palm Beach 4. Delray Beach 5. Boynton Beach, Ocean Ridge, Briny Breezes 6. Lake Worth 7. Palm Springs, Unincorporated, Lake Worth 8. Greenacres, Unincorporated 9. Unincorporated, Greenacres, Haverhill 10. Jupiter, Unincorporated.


