Jacqui Dowd SCONUL Workshop University of Westminster 17 th November 2009 Performance Measures &...
23
Jacqui Dowd SCONUL Workshop University of Westminster 17 th November 2009 Performance Measures & Metrics at University of Glasgow Library
-
Upload
chastity-blair -
Category
Documents
-
view
221 -
download
0
Transcript of Jacqui Dowd SCONUL Workshop University of Westminster 17 th November 2009 Performance Measures &...

Jacqui DowdSCONUL WorkshopUniversity of Westminster17th November 2009
Performance Measures & Metrics at University of Glasgow Library
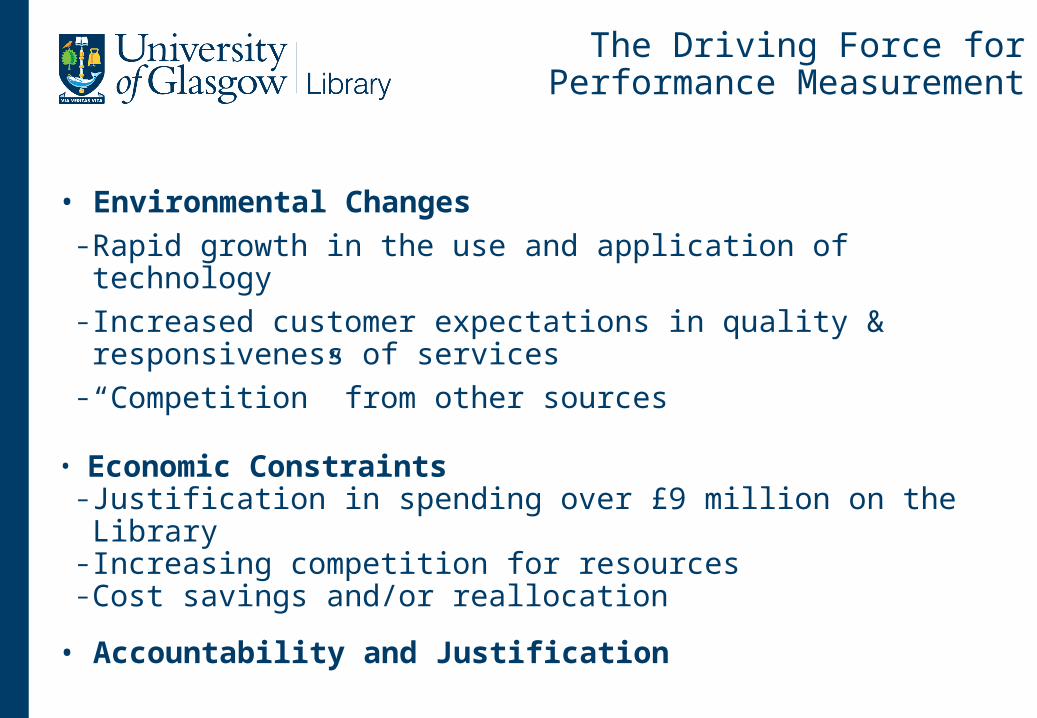
The Driving Force for Performance Measurement
• Environmental Changes–Rapid growth in the use and application of technology– Increased customer expectations in quality & responsiveness of services
– “Competition” from other sources
• Economic Constraints–Justification in spending over £9 million on the Library– Increasing competition for resources–Cost savings and/or reallocation
• Accountability and Justification

The Challenge
Traditional library statistics are no longer sufficient:
• Focused on inputs, collections, acquisitions, expenditures – how big, how many and how much
• No longer describe the library’s function or business
• May not be aligned with the Library/University’s aims& plans
• Do not define or measure service quality

Metrics
The Library needs metrics that:• Describe the impact, outcomes and value from the user’s
perspective
• Indicate what difference we make
• Measure progress/achievement
Metrics that can be used to:• Improve & develop new and existing services
• Identify changing patterns in use and needs
• Market and promote services and facilities• Ensure decision making is based on evidence and not
assumption
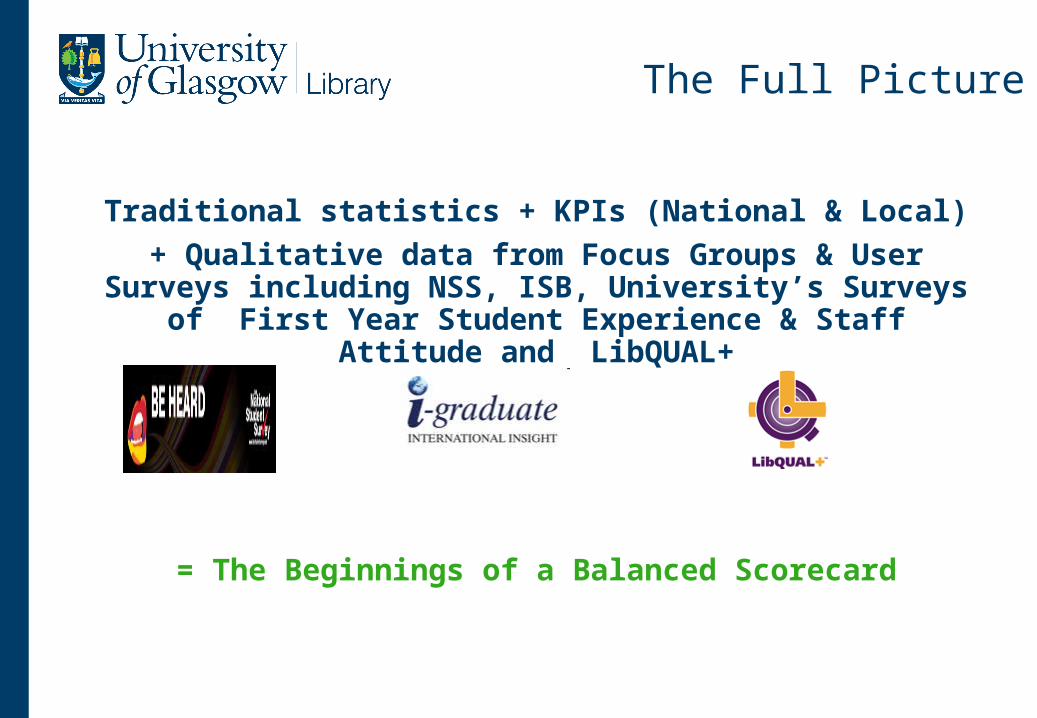
The Full Picture
Traditional statistics + KPIs (National & Local)
+ Qualitative data from Focus Groups & User Surveys including NSS, ISB, University’s Surveys of First Year
Student Experience & Staff Attitude and LibQUAL+
= The Beginnings of a Balanced Scorecard

What is a Balanced Scorecard?
“The balanced scorecard is a strategic planning and management system used to align business activities to the vision and strategy of the organization, improve internal and external communications, and monitor organizational performance against strategic goals.”
Balanced Scorecard Institute
Balanced Scorecard
The Balanced Scorecard
• Has a blend of traditional statistics and newly defined measures to provide a quick and comprehensive picture of the Library’s performance
• Has clearly defined measurements with specific targets indicating success, partial success and failure.

Balanced Scorecard
Glasgow’s Balanced Scorecard is aligned to the Library’s Operational Plan & has four perspectives
• User
• Financial
• Internal Processes
• Staff Development

Balanced Scorecard
Each Perspective has:
• Defined strategic objectives
• A Key Performance Indicator per objective
• Assigned responsibility to a named post/department
There is also space to record the level of success in achieving the KPIs & a commentary to explain the level of achievement if required.

User Perspective
Strategic Objectives
• Maximise client satisfaction with library resources and services
• Optimise access to information resources and services for students and researchers
• Create a supportive environment for University researchers to discover, locate and access information
• Facilitate the development of informed and independent learners
User Perspective
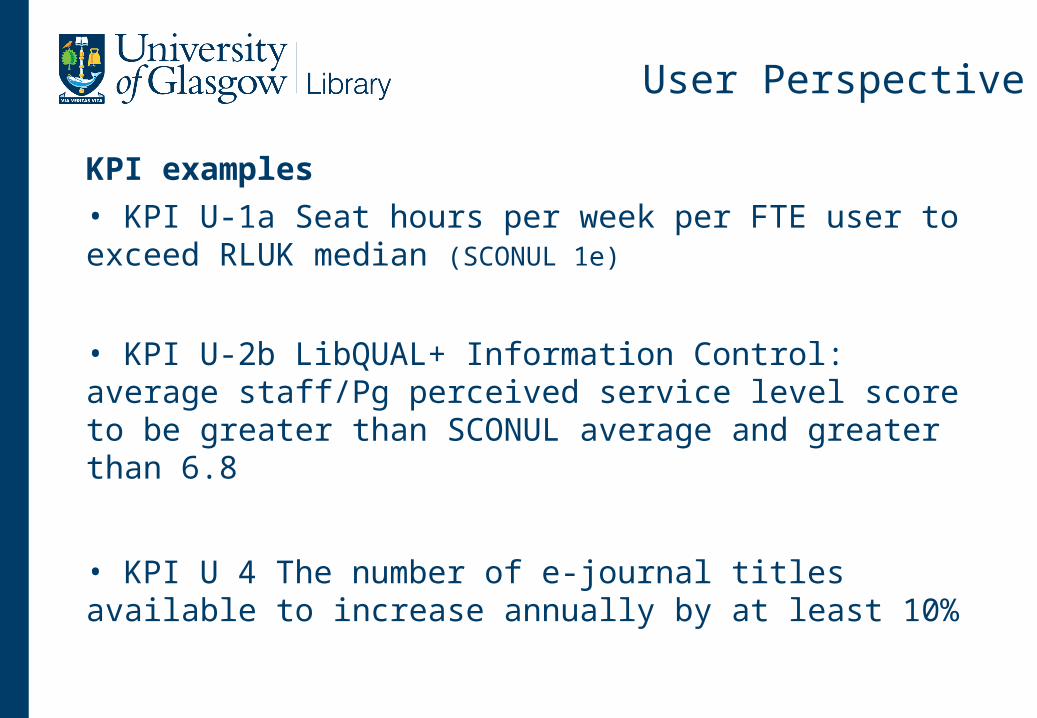
KPI examples
• KPI U-1a Seat hours per week per FTE user to exceed RLUK median (SCONUL 1e)
• KPI U-2b LibQUAL+ Information Control: average staff/Pg perceived service level score to be greater than SCONUL average and greater than 6.8
• KPI U 4 The number of e-journal titles available to increase annually by at least 10%

Financial Perspective
Strategic Objectives
• Secure appropriate funding to maintain and expand services to the University community
• Attract additional funding for service innovation
• Use effective and accountable financial processes

Financial Perspective
KPI examples
• KPI F-1a Information expenditure per FTE student to be no lower than 95% of RLUK median (SCONUL)
• KPI F-2 Library Materials Budget to increase by at least relevant inflation level
• KPI F-3b Library expenditure on Information Provision to be no less than 49% of total Library expenditure and greater than the RLUK median (SCONUL)
• KPI F-5a Cost per download for e-journals to be lower than the previous year

Internal Processes Perspective
Strategic Objectives
• Optimise processes by which we determine priorities and allocate resources to achieve strategic outcomes
• Streamline internal processes through continuous improvement
• Re-engineer internal processes to meet current and anticipated client need

Internal Processes Perspective
KPI examples• KPI I-1a Average number of days between receipt of order in Book Acquisitions and order on Millennium not to exceed 7
• KPI I-2 95% of items to be shelved within 24 hours of return or in-house use during staffed hours
• KPI I-4 100% of E-course material requests, if received within guideline periods and covered by our copyright licence, to be available by the required date
• KPI I-5 Percentage of eligible first time issues from the Main Library via Self Service machines to be no less than 70%
Staff Development Perspective
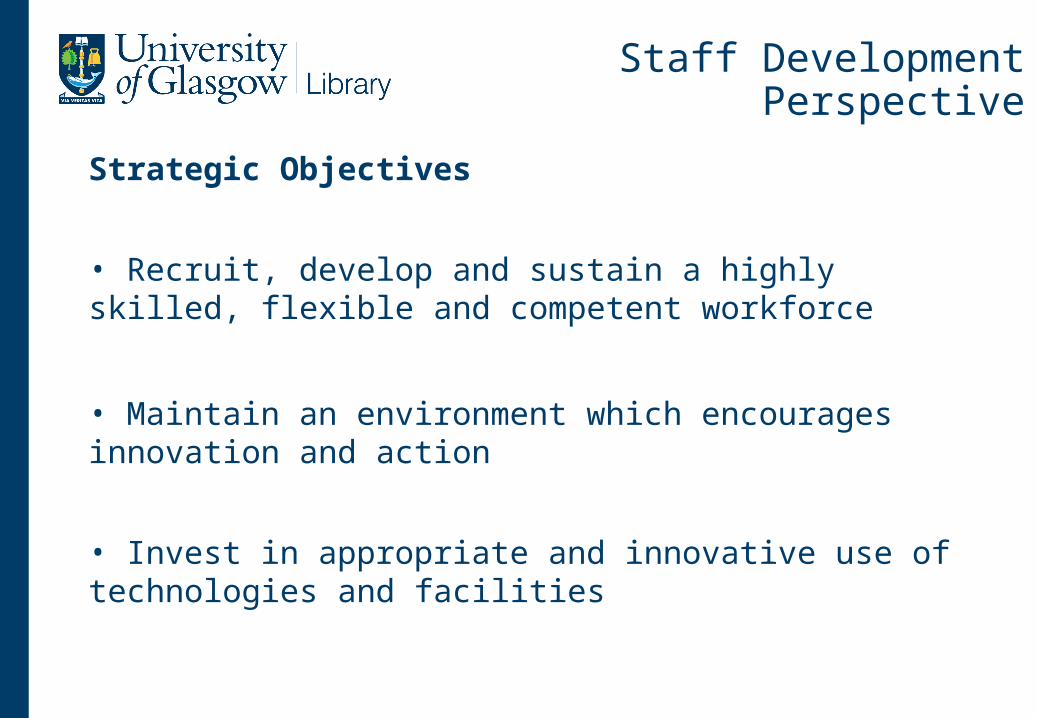
Strategic Objectives
• Recruit, develop and sustain a highly skilled, flexible and competent workforce
• Maintain an environment which encourages innovation and action
• Invest in appropriate and innovative use of technologies and facilities

Staff Development Perspective
KPI examples
• KPI S-1a At least 95% of staff on Grade 4 or above to have a Personal Development Plan
• KPI S-1c At least five staff to have received upgrade/accelerated increment
• KPI S-2a At least 60% of staff to have taken part in one or more training activity arising from P&DR
• KPI S-2b Expenditure on training and development to be at least 1% of salary expenditure

Results
2007-2008 - Pilot
• 39 KPIs
– 20 achieved – 5 neutral
– 6 not achieved – 8 not fully measured/not available -
Current Position
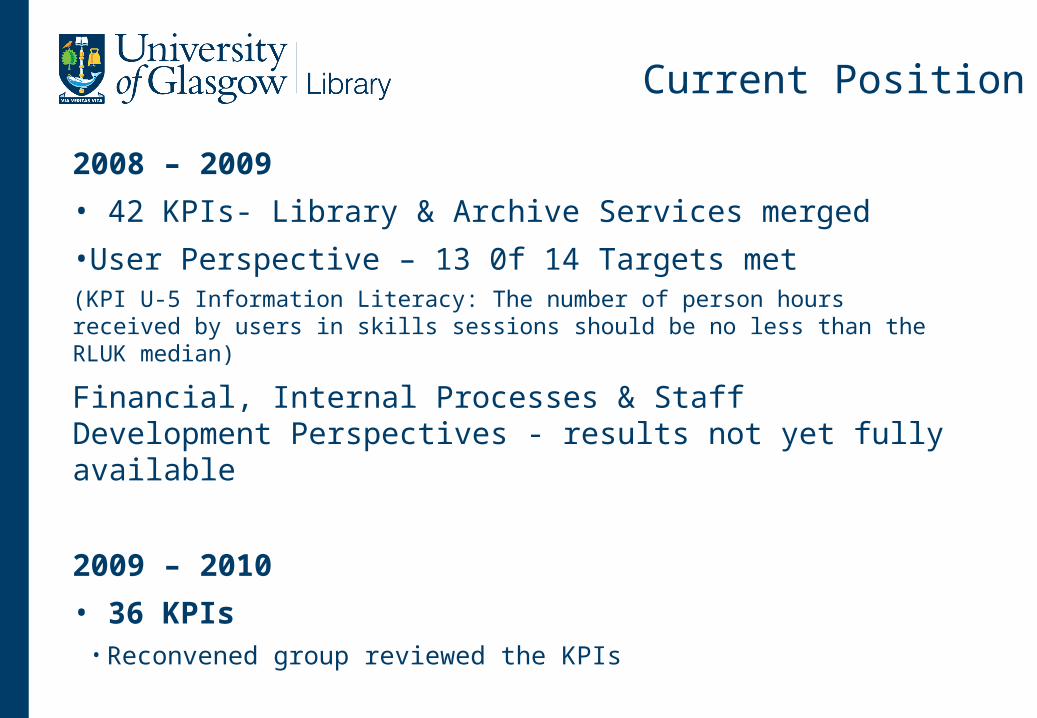
2008 – 2009
• 42 KPIs- Library & Archive Services merged
•User Perspective – 13 0f 14 Targets met(KPI U-5 Information Literacy: The number of person hours received by users in skills sessions should be no less than the RLUK median)
Financial, Internal Processes & Staff Development Perspectives - results not yet fully available
2009 – 2010
• 36 KPIs• Reconvened group reviewed the KPIs

Current Position
2009 – 2010
• 36 KPIs– Reviewed the KPIs
– Revised targets
– Set new targets for new objectives and priorities
– Removed superseded targets

Disadvantages
Dangers & Pitfalls
• Too many metrics
• Too much time and labour – the cost of collection
• Difficult to choose metrics that are:• Relevant to objectives
• Measurable
• Stable from one year to the next
• Comprehensive
• Timely• e.g. SCONUL Statistics

Advantages
The Balanced Scorecard• Encourages a broader look at activities covering a range of Library services
• Not just traditional measures – but still has to have quantitative measures
• Demonstrates that the Library’s services and facilities reflect the University’s strategic goals
• Comparable over time
• Provides a comprehensive picture of the Library performance
• Allows us to commend success
• Identifies shortfalls

Metrics & Measures that Matter
The quantitative and qualitative data we have currently has been used to support/achieve:
• The Physical refurbishment to provide new & innovative study space
• Increase in funding to improve information access by purchasing more E-Journal titles and backfiles
• Increase opening hours