J1.4 A MACHINE LEARNING APPROACH TO FINDING …are pink and non-initiation pixels are simply black....
6
A MACHINE LEARNING APPROACH TO FINDING WEATHER REGIMES AND SKILLFUL PREDICTOR COMBINATIONS FOR SHORT-TERM STORM FORECASTING John K. Williams* and D. A. Ahijevych, C. J. Kessinger, T. R. Saxen, M. Steiner and S. Dettling National Center for Atmospheric Research, Boulder, Colorado 1. INTRODUCTION A major challenge for efficient flight planning and air traffic management is the accurate forecasting of weather that poses a danger to aviation. In support of the Joint Planning and Development Office (JPDO) vision of a single, authoritative source of weather information for all users, the Federal Aviation Administration (FAA) has mandated research and development to combine the best available technologies used by several FAA-sponsored convective nowcast and forecast products into a single Consolidated Storm Prediction for Aviation (CoSPA, Wolfson et al. 2008). To achieve this goal, an objective technique is needed to compare the utility of various predictors and identify a subset that may be utilized in an efficient, skillful algorithm for storm prediction. In this paper, the authors examine the specific problem of combining various NWP model, radar, satellite and derived fields for forecasting thunderstorm initiation in a one-hour timeframe. For this purpose, a machine learning method that creates random forests— ensembles of weak, weakly-correlated decision trees— is used to rank predictor importance and provide a benchmark for potential algorithm performance. Using data collected over the summer of 2007, this technique suggests that the best set of initiation predictors varies based on day, hour, and location, presumably because of different weather characteristics. Random forests are used to help identify meaningful “regimes” that may represent different types of convection, geographical locations or synoptic conditions. Initial results suggest that forecasts tuned to each regime may be combined in a Takagi-Sugeno style algorithm based on fuzzy regime “memberships” to achieve both improved algorithm simplicity and performance. In addition, output from a preliminary random-forest prediction algorithm is evaluated for two case studies. Although this work is still in its early stages, the authors conclude that this approach shows promise and that applying a similar methodology to other elements of CoSPA development may be worthwhile. 2. THE PROBLEM Several automated convective nowcasting systems have been developed for aviation users in recent years, including NCAR’s National Convective Weather Forecast (NCWF; Megenhardt et al. 2004), NCAR’s AutoNowcaster (Saxen et al. 2004) and MIT Lincoln * Corresponding author address: John K. Williams, National Center for Atmospheric Research, P.O. Box 3000, Boulder, CO 80307; email: [email protected]. Laboratory’s Corridor Integrate Weather System (CIWS; Evans and Ducot 2006). Each of these systems has been developed for a particular application, and each has unique strengths. For example, NCWF addresses convective initiation as well as growth and decay, and it produces probabilistic forecasts at the national scale; the AutoNowcaster, so far focused more regionally, enables human interaction as well. Each system has been developed with the guidance of human experts, and uses some version of fuzzy logic expert system (Yager et al. 1987, Delanoy and Troxel 1993) to combine various sources of information to form a forecast. In brief, these fuzzy logic systems encode expert-generated heuristics through transformations of the input data to form predictor fields, which are then combined using weights determined by input data quality or relevance to the perceived scenario. Fuzzy logic is a relatively quick and straightforward way to build a forecast algorithm that exploits human expertise and understanding of the problem domain, and such algorithms often perform quite well. In principle, it is possible to tune the data transformation functions and combination weights to optimize the fuzzy logic algorithm’s performance on a verification dataset. However, in the authors’ experience, this tuning is rarely done rigorously; instead, the algorithm parameters are most often tuned by hand based on a set of case studies. Moreover, the fuzzy logic approach may make it difficult to evaluate the potential benefit of a new source of information: it must first be integrated into the existing algorithm, and if it doesn’t improve the algorithm’s skill, it isn’t immediately obvious whether that is because the information is not useful or the algorithm isn’t utilizing it efficiently. The present study is motivated by the FAA’s mandate to combine the component technologies used by the various convective nowcasting systems to create the best possible CoSPA forecast system. There are a number of challenges in this undertaking. In particular, it is desirable to objectively find a minimal set of the available predictor fields that provide near-optimal forecast skill, preferably without assuming a particular form for the algorithm that combines them. A body of empirically-based techniques, variously called statistical analysis, data mining, or machine learning methods, is ideally suited to addressing this problem. Such techniques “learn” a function that associates a set of potential predictor variables with the field being forecast (e.g., whether a storm will initiate at that pixel in the next hour), and provide a basis for ranking predictor importance, experimenting with different predictor sets, and developing an algorithm structure that recognizes and effectively treats different weather regimes and exploits different scales of predictability. Such methods J1.4
Transcript of J1.4 A MACHINE LEARNING APPROACH TO FINDING …are pink and non-initiation pixels are simply black....
A MACHINE LEARNING APPROACH TO FINDING WEATHER REGIMES AND SKILLFUL PREDICTOR COMBINATIONS FOR SHORT-TERM STORM FORECASTING
John K. Williams* and D. A. Ahijevych, C. J. Kessinger, T. R. Saxen, M. Steiner and S. Dettling
National Center for Atmospheric Research, Boulder, Colorado 1. INTRODUCTION
A major challenge for efficient flight planning and air traffic management is the accurate forecasting of weather that poses a danger to aviation. In support of the Joint Planning and Development Office (JPDO) vision of a single, authoritative source of weather information for all users, the Federal Aviation Administration (FAA) has mandated research and development to combine the best available technologies used by several FAA-sponsored convective nowcast and forecast products into a single Consolidated Storm Prediction for Aviation (CoSPA, Wolfson et al. 2008). To achieve this goal, an objective technique is needed to compare the utility of various predictors and identify a subset that may be utilized in an efficient, skillful algorithm for storm prediction.
In this paper, the authors examine the specific problem of combining various NWP model, radar, satellite and derived fields for forecasting thunderstorm initiation in a one-hour timeframe. For this purpose, a machine learning method that creates random forests—ensembles of weak, weakly-correlated decision trees—is used to rank predictor importance and provide a benchmark for potential algorithm performance. Using data collected over the summer of 2007, this technique suggests that the best set of initiation predictors varies based on day, hour, and location, presumably because of different weather characteristics. Random forests are used to help identify meaningful “regimes” that may represent different types of convection, geographical locations or synoptic conditions. Initial results suggest that forecasts tuned to each regime may be combined in a Takagi-Sugeno style algorithm based on fuzzy regime “memberships” to achieve both improved algorithm simplicity and performance. In addition, output from a preliminary random-forest prediction algorithm is evaluated for two case studies. Although this work is still in its early stages, the authors conclude that this approach shows promise and that applying a similar methodology to other elements of CoSPA development may be worthwhile.
2. THE PROBLEM
Several automated convective nowcasting systems have been developed for aviation users in recent years, including NCAR’s National Convective Weather Forecast (NCWF; Megenhardt et al. 2004), NCAR’s AutoNowcaster (Saxen et al. 2004) and MIT Lincoln * Corresponding author address: John K. Williams, National Center for Atmospheric Research, P.O. Box 3000, Boulder, CO 80307; email: [email protected].
Laboratory’s Corridor Integrate Weather System (CIWS; Evans and Ducot 2006). Each of these systems has been developed for a particular application, and each has unique strengths. For example, NCWF addresses convective initiation as well as growth and decay, and it produces probabilistic forecasts at the national scale; the AutoNowcaster, so far focused more regionally, enables human interaction as well. Each system has been developed with the guidance of human experts, and uses some version of fuzzy logic expert system (Yager et al. 1987, Delanoy and Troxel 1993) to combine various sources of information to form a forecast. In brief, these fuzzy logic systems encode expert-generated heuristics through transformations of the input data to form predictor fields, which are then combined using weights determined by input data quality or relevance to the perceived scenario. Fuzzy logic is a relatively quick and straightforward way to build a forecast algorithm that exploits human expertise and understanding of the problem domain, and such algorithms often perform quite well. In principle, it is possible to tune the data transformation functions and combination weights to optimize the fuzzy logic algorithm’s performance on a verification dataset. However, in the authors’ experience, this tuning is rarely done rigorously; instead, the algorithm parameters are most often tuned by hand based on a set of case studies. Moreover, the fuzzy logic approach may make it difficult to evaluate the potential benefit of a new source of information: it must first be integrated into the existing algorithm, and if it doesn’t improve the algorithm’s skill, it isn’t immediately obvious whether that is because the information is not useful or the algorithm isn’t utilizing it efficiently.
The present study is motivated by the FAA’s mandate to combine the component technologies used by the various convective nowcasting systems to create the best possible CoSPA forecast system. There are a number of challenges in this undertaking. In particular, it is desirable to objectively find a minimal set of the available predictor fields that provide near-optimal forecast skill, preferably without assuming a particular form for the algorithm that combines them. A body of empirically-based techniques, variously called statistical analysis, data mining, or machine learning methods, is ideally suited to addressing this problem. Such techniques “learn” a function that associates a set of potential predictor variables with the field being forecast (e.g., whether a storm will initiate at that pixel in the next hour), and provide a basis for ranking predictor importance, experimenting with different predictor sets, and developing an algorithm structure that recognizes and effectively treats different weather regimes and exploits different scales of predictability. Such methods
J1.4

can also be used to explore different forecast evaluation methods and definitions of “truth”. And, of course, an empirically-based algorithm can be used to establish a performance benchmark: if a forecast logic using the same set of predictor variables does not perform at least as well, that may indicate that it is not using the available information efficiently. Finally, if a new forecast component becomes available, e.g., from industry, this approach will make it relatively straightforward to evaluate whether it is likely to provide benefit and should be integrated into the forecast system. In addition to the practical benefits, if all goes well, this process should uncover patterns and relationships that may help researchers better understand the underlying physical mechanisms.
While the planned CoSPA system has a number of facets, the topic chosen for the present study is the quite difficult problem of predicting one-hour thunderstorm initiation. If a machine learning approach demonstrates promise for this initiation nowcast problem, the authors plan to use it to address convective initiation, growth and decay in the 0-2 hour timeframe as well.
3. RANDOM FORESTS
The technique selected for the present study is random forests (Breiman 2001), a powerful, non-linear statistical analysis or machine learning technique that has previously proven useful for the problem of diagnosing regions of atmospheric turbulence that may be hazardous to aviation (Williams et al. 2007, Cotter et al. 2007). Essentially, random forests are ensembles of weak, weakly-correlated decision trees that “vote” on the correct classification of a given input. The use of an ensemble of such trees minimizes the risk of overfitting the training set, a significant and well-known problem with individual decision trees. In constructing each tree of a random forest, one begins with a “training set” containing many instances of predictor variables along with an associated “truth” value (e.g., 0 or 1 depending on whether or not convective initiation did subsequently occur at the given pixel in the next hour). A “bagged” training sample is selected by drawing a random subset of n elements from the n-member training set, with replacement after each draw. This means that, on average, each tree is trained on roughly 2/3 of the dataset, including duplicates. Then, at each node of the tree, a subset of only m randomly-selected feature variables are chosen as candidates for splitting, contrasting with the usual practice of choosing the best split from all the feature variables. A typical choice for m is the square root of the number of predictor fields. Because not all feature variables are used to train each tree, those not used for training (the so-called “out-of-bag” samples) may be used to evaluate the performance of that tree. This allows the random forest training process to estimate the importance of each variable based on the degradation in classification performance when the variable’s values are randomly permuted among the training instances. Using this technique, the feature variables may be ranked in order
of their importance to the random forest’s performance, providing a helpful starting point for performing selection of a minimal, skillful set of predictors.
Once a random forest has been trained, the trees function as an “ensemble of experts” to make predictions. For example, Figure 1 shows a conceptual diagram of a random forest with 100 trees. When a new data point (or “feature vector”: a set of predictor field values at the point for which the forecast is being made) is presented, each tree will perform a classification. These classification “votes” are then compiled, and can be used to classify the point based on the consensus “winner”, or the vote distribution may be used to derive a probability for each possible class. For example, if 40 trees vote “0” (no initiation) and 60 vote “1” (initiation), one might be able to scale the 60% classification confidence for initiation into a probability, as described in a later section.
Vote: 0
Data pt.
Tree 1
Vote: 1
Data pt.
Tree 2
Vote: 1
Data pt.
Tree 3
Vote: 0
Data pt.
Tree 100…
Vote: 0
Data pt.
Tree 1
Vote: 1
Data pt.
Tree 2
Vote: 1
Data pt.
Tree 3
Vote: 0
Data pt.
Tree 100…
Figure 1: Conceptual diagram of a random forest, an ensemble of weak, weakly-correlated decision trees that “vote” on the classification of each data point.
4. INITIATION “TRUTH” FIELD
In order to use random forests to analyze a dataset or generate a predictive function, it is first necessary to establish a training dataset in which various data instances are associated with the desired class. To generate the truth field for the one-hour convective initiation problem, it is necessary to identify zones of storm initiation and non-initiation. This binary initiation “truth” field was generated by a combination of thunderstorm cell tracking software and spatial filters. Starting with the composite reflectivity field from NSSL (see Zhang et al. 2005) on a 4-km grid, the authors used cell tracking software called TITAN (Dixon and Wiener 1993) to identify the centroids and extents of new storm cells, where a storm was defined as a contiguous or near-contiguous region having composite reflectivity above 35 dBZ. A small circular filter was then applied to expand the initiation region of interest about each initiation point. A sample truth field is depicted in Figure 2.
In order to isolate the storm initiation process, the authors also removed pixels associated with previously identified storm cells; these are depicted as gray areas in Fig. 2. This enabled pixels associated with persistent convection to be eliminated from the subsequent analysis.

Figure 2: Storm initiation “truth” field for 1800 UTC, 27 Jun 2007. Pixels associated with new storm initiation are pink and non-initiation pixels are simply black. As explained in the text, pixels near previous convection (gray areas) are ignored in subsequent analyses. The CoSPA domain is bounded by the green lines.
5. INITIATION PREDICTOR FIELDS
Random forests are well-suited for evaluating the potential skill of a large number of predictors, so as a first run, essentially all of the meteorological fields that were readily available during the summer 2007 were used to train the random forest. In all, 18 predictors from several sources were incorporated. For each pixel, the “feature vector” (or set of predictor fields) included:
• Satellite-measured radiances at different wavelengths (visible, 3.9, 6.7, 11, 13.3 µm), an extrapolation, and a cooling rate field
• Several RUC (e.g., relative humidity and Convective Available Potential Energy, CAPE), and METAR-derived fields (e.g. lifted index)
• accumulated precipitation from radar data analysis
• MIT-LL fields (e.g. boundary detection, air-mass storm identification).
All of the predictor fields were interpolated to the same 4-km grid as the truth field. Additional fields in future operations will include wind shear, surface characteristics, and many others from the archive of 2007 data and future data collection efforts.
6. RANDOM FOREST TRAINING AND RESULTS 6.1 Random forest prediction of initiation
Using data collected in the 2007 convective season (June-August), the random forest technique was trained to use the 18 predictor fields described above to predict one-hour storm initiation at each pixel. A 50000-pixel subset of the 2007 data was used to train a 200-tree random forest to classify each pixel as either a storm
initiation location or a non-storm initiation point. In order to speed up the training process, and because the non-initiation points greatly outnumber the initiation points, a disproportionate percentage of initiation points were included in the training set so that the total number of initiation points and non-initiation points were roughly equal.
Some data were purposefully withheld from the training set in order to have a set of independent cases on which to test the predictive skill of the trained random forest. Figure 3 below shows the results of applying the trained random forest to one of these cases. It shows the number of votes for storm initiation on 27 June at 1800 UTC given the predictor values available at 1700 UTC (one-hour lead time). Note that this is the same case shown in Fig. 2, and the white spaces correspond to pixels that have been removed due to the presence of pre-existing convection. The number of votes can be thought of as a confidence in the prediction of storm initiation. In this case, the greatest confidence (red) is along and just ahead of a cold front entering the northwest quadrant and in a broad area east of the Great Lakes. Moderate values (orange) exist in scattered locations further south.
How does this prediction do when compared to the storm initiation “truth” field (Fig. 2)? Figure 4 shows the skill of the trained forest using traditional contingency table statistics (i.e. hits, misses, false alarms and correct nulls). As the skill scores suggest, there is still much room for improvement; for example, the Gilbert Skill Score (GSS, also known as equitable threat score) is only 0.141. However, considering the high resolution of the data grid and the difficulty of the initiation prediction problem, these scores suggest that the random forest is a promising approach. As a post-processing exercise, one could calibrate the number of votes to be equivalent to probability using a reliability diagram that associates each possible number of votes with the conditional observed frequency of initiation.
Figure 3: Case study results from a trained random forest used as a predictive algorithm, showing number of votes for storm initiation. The embedded white zones correspond to previously-existing convective echo, which has been eliminated from this analysis.
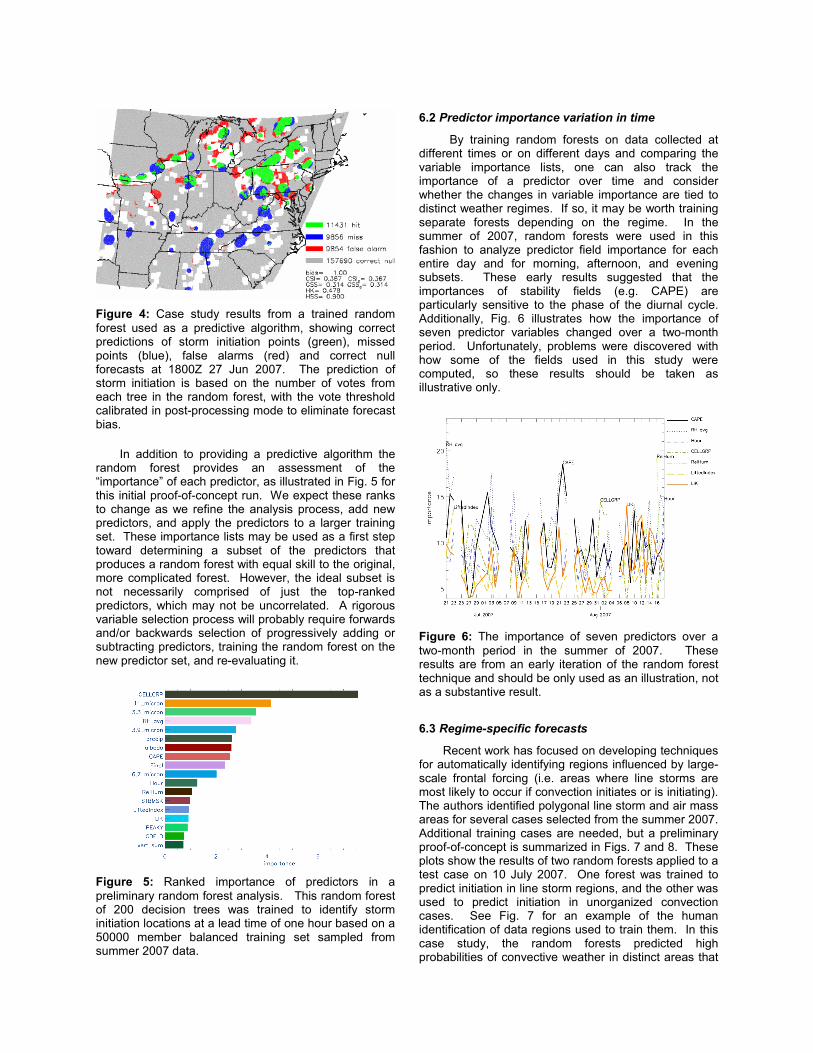
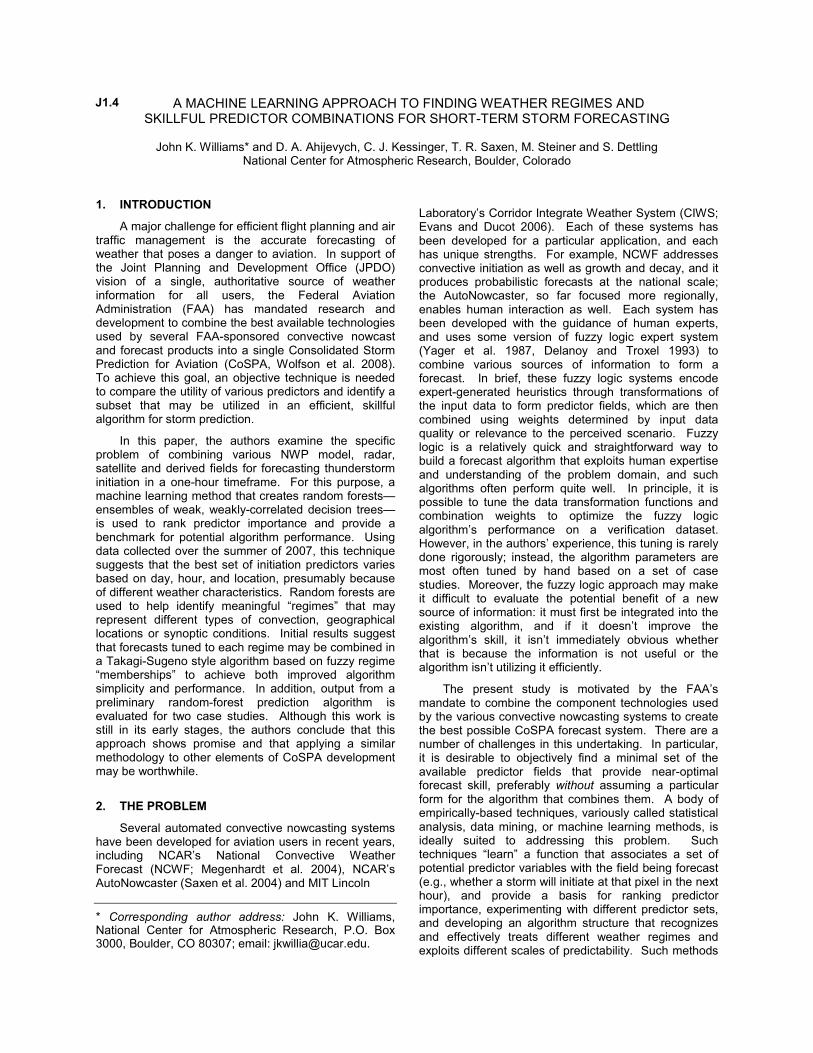
Figure 4: Case study results from a trained random forest used as a predictive algorithm, showing correct predictions of storm initiation points (green), missed points (blue), false alarms (red) and correct null forecasts at 1800Z 27 Jun 2007. The prediction of storm initiation is based on the number of votes from each tree in the random forest, with the vote threshold calibrated in post-processing mode to eliminate forecast bias.
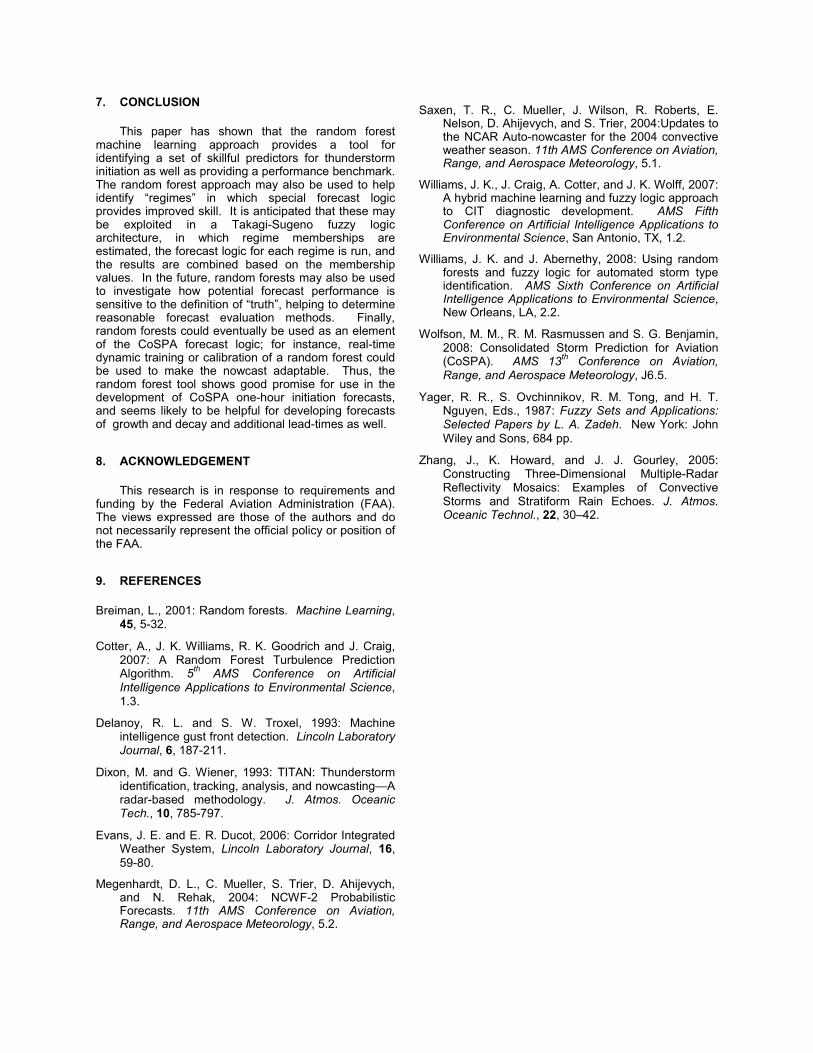
In addition to providing a predictive algorithm the random forest provides an assessment of the “importance” of each predictor, as illustrated in Fig. 5 for this initial proof-of-concept run. We expect these ranks to change as we refine the analysis process, add new predictors, and apply the predictors to a larger training set. These importance lists may be used as a first step toward determining a subset of the predictors that produces a random forest with equal skill to the original, more complicated forest. However, the ideal subset is not necessarily comprised of just the top-ranked predictors, which may not be uncorrelated. A rigorous variable selection process will probably require forwards and/or backwards selection of progressively adding or subtracting predictors, training the random forest on the new predictor set, and re-evaluating it.
Figure 5: Ranked importance of predictors in a preliminary random forest analysis. This random forest of 200 decision trees was trained to identify storm initiation locations at a lead time of one hour based on a 50000 member balanced training set sampled from summer 2007 data.
6.2 Predictor importance variation in time
By training random forests on data collected at different times or on different days and comparing the variable importance lists, one can also track the importance of a predictor over time and consider whether the changes in variable importance are tied to distinct weather regimes. If so, it may be worth training separate forests depending on the regime. In the summer of 2007, random forests were used in this fashion to analyze predictor field importance for each entire day and for morning, afternoon, and evening subsets. These early results suggested that the importances of stability fields (e.g. CAPE) are particularly sensitive to the phase of the diurnal cycle. Additionally, Fig. 6 illustrates how the importance of seven predictor variables changed over a two-month period. Unfortunately, problems were discovered with how some of the fields used in this study were computed, so these results should be taken as illustrative only.
Figure 6: The importance of seven predictors over a two-month period in the summer of 2007. These results are from an early iteration of the random forest technique and should be only used as an illustration, not as a substantive result.
6.3 Regime-specific forecasts
Recent work has focused on developing techniques for automatically identifying regions influenced by large-scale frontal forcing (i.e. areas where line storms are most likely to occur if convection initiates or is initiating). The authors identified polygonal line storm and air mass areas for several cases selected from the summer 2007. Additional training cases are needed, but a preliminary proof-of-concept is summarized in Figs. 7 and 8. These plots show the results of two random forests applied to a test case on 10 July 2007. One forest was trained to predict initiation in line storm regions, and the other was used to predict initiation in unorganized convection cases. See Fig. 7 for an example of the human identification of data regions used to train them. In this case study, the random forests predicted high probabilities of convective weather in distinct areas that

largely mirrored the separation of weather types seen in the observations (Fig 8). In particular, the random forest trained on line-storm cases picks up the area of storm initiation right in the middle of the observed line storms. The random forest trained on unorganized convection cases highlights a different area, showing a large number of votes in the unorganized air-mass thunderstorm region observed further south and east, while almost entirely ignoring the line storm area. These results suggest training random forest initiation forecasts based on different weather types may help capture the distinct physical mechanisms in each regime.
Figure 7: Human-drawn polygonal boundaries around regions of predominantly linear convection (dark blue) and unorganized convection (green). A random forest trained on data from one of these regimes appears to exhibit better performance in that regime, suggesting that distinct regime-specific forecast logic may be beneficial.
6.4 Takagi-Sugeno algorithm architecture
In addition to the human-identified regimes identified above, random forest and other automated clustering techniques are being investigated as possible methods for identifying regimes. Once a set of meaningful regimes is identified and a method is established for estimating regime memberships (e.g., using a separate random forest), a Takagi-Sugeno fuzzy logic “combiner” can be developed, tuned, and evaluated, with the goal of exceeding the performance benchmark established by a “naïve” random forest. The idea here is that, instead of just training a random forest to recognize generic storm initiation, different random forests or fuzzy-logic modules would be applied to targeted areas based on the expected regime or convective mode. The convective mode could be determined by an automated evaluation of radar echo structure (e.g., Williams and Abernethy 2008) or an independent random forest prediction of weather type, based on a training set of human-entered polygons, similar to those shown in Fig. 7.
a)
b)
c)
Figure 8: a) Test case on which the two regime-based random forests were run. This particular day, 10 July, 2007, saw an initiation of convection in a solid line across a wide span of the upper Midwest (WI to MO) around 1845 UTC (solid white contours). The 2-h VIL forecast valid for the same time (color filled) had no chance to predict the new lines since it is based on extrapolation. b) Vote count for storm initiation by the random forest trained on line storm regions. The votes were cast based on 18 UTC conditions. c) Vote count for storm initiation by the random forest trained to recognize unorganized convection initiation. In this case the votes were based on conditions at 17 UTC.
7. CONCLUSION
This paper has shown that the random forest machine learning approach provides a tool for identifying a set of skillful predictors for thunderstorm initiation as well as providing a performance benchmark. The random forest approach may also be used to help identify “regimes” in which special forecast logic provides improved skill. It is anticipated that these may be exploited in a Takagi-Sugeno fuzzy logic architecture, in which regime memberships are estimated, the forecast logic for each regime is run, and the results are combined based on the membership values. In the future, random forests may also be used to investigate how potential forecast performance is sensitive to the definition of “truth”, helping to determine reasonable forecast evaluation methods. Finally, random forests could eventually be used as an element of the CoSPA forecast logic; for instance, real-time dynamic training or calibration of a random forest could be used to make the nowcast adaptable. Thus, the random forest tool shows good promise for use in the development of CoSPA one-hour initiation forecasts, and seems likely to be helpful for developing forecasts of growth and decay and additional lead-times as well.
8. ACKNOWLEDGEMENT
This research is in response to requirements and funding by the Federal Aviation Administration (FAA). The views expressed are those of the authors and do not necessarily represent the official policy or position of the FAA.
9. REFERENCES
Breiman, L., 2001: Random forests. Machine Learning, 45, 5-32.
Cotter, A., J. K. Williams, R. K. Goodrich and J. Craig, 2007: A Random Forest Turbulence Prediction Algorithm. 5th AMS Conference on Artificial Intelligence Applications to Environmental Science, 1.3.
Delanoy, R. L. and S. W. Troxel, 1993: Machine intelligence gust front detection. Lincoln Laboratory Journal, 6, 187-211.
Dixon, M. and G. Wiener, 1993: TITAN: Thunderstorm identification, tracking, analysis, and nowcasting—A radar-based methodology. J. Atmos. Oceanic Tech., 10, 785-797.
Evans, J. E. and E. R. Ducot, 2006: Corridor Integrated Weather System, Lincoln Laboratory Journal, 16, 59-80.
Megenhardt, D. L., C. Mueller, S. Trier, D. Ahijevych, and N. Rehak, 2004: NCWF-2 Probabilistic Forecasts. 11th AMS Conference on Aviation, Range, and Aerospace Meteorology, 5.2.
Saxen, T. R., C. Mueller, J. Wilson, R. Roberts, E. Nelson, D. Ahijevych, and S. Trier, 2004:Updates to the NCAR Auto-nowcaster for the 2004 convective weather season. 11th AMS Conference on Aviation, Range, and Aerospace Meteorology, 5.1.
Williams, J. K., J. Craig, A. Cotter, and J. K. Wolff, 2007: A hybrid machine learning and fuzzy logic approach to CIT diagnostic development. AMS Fifth Conference on Artificial Intelligence Applications to Environmental Science, San Antonio, TX, 1.2.
Williams, J. K. and J. Abernethy, 2008: Using random forests and fuzzy logic for automated storm type identification. AMS Sixth Conference on Artificial Intelligence Applications to Environmental Science, New Orleans, LA, 2.2.
Wolfson, M. M., R. M. Rasmussen and S. G. Benjamin, 2008: Consolidated Storm Prediction for Aviation (CoSPA). AMS 13th Conference on Aviation, Range, and Aerospace Meteorology, J6.5.
Yager, R. R., S. Ovchinnikov, R. M. Tong, and H. T. Nguyen, Eds., 1987: Fuzzy Sets and Applications: Selected Papers by L. A. Zadeh. New York: John Wiley and Sons, 684 pp.
Zhang, J., K. Howard, and J. J. Gourley, 2005: Constructing Three-Dimensional Multiple-Radar Reflectivity Mosaics: Examples of Convective Storms and Stratiform Rain Echoes. J. Atmos. Oceanic Technol., 22, 30–42.