Village Roadshow Limited Hong Kong May 27 th Singapore May 29 th

4-6 October 2010
J. P. Morgan Asia Roadshow
Singapore & Hong Kong
© Contact Energy Limited 22
Important Notice
This presentation may contain projections or forward looking statements regarding a variety of items. Such forward-
looking statements are based upon current expectations and involve risks and uncertainties.
Actual results may differ materially from those stated in any forward-looking statement based on a number of important
factors and risks.
Although management may indicate and believe that the assumptions underlying the forward-looking statements are
reasonable, any of the assumptions could prove inaccurate or incorrect and, therefore, there can be no assurance that
the results contemplated in the forward-looking statements will be realised.
Furthermore, while all reasonable care has been taken in compiling this presentation, Contact accepts no responsibility
for any errors or omissions.
This presentation does not constitute investment advice.
© Contact Energy Limited
Outline
1. Business and market overview
2. Performance
3. Strategy and growth
4. Financial results overview
5. Sector information
3

© Contact Energy Limited
1. Business and market overview
4
© Contact Energy Limited
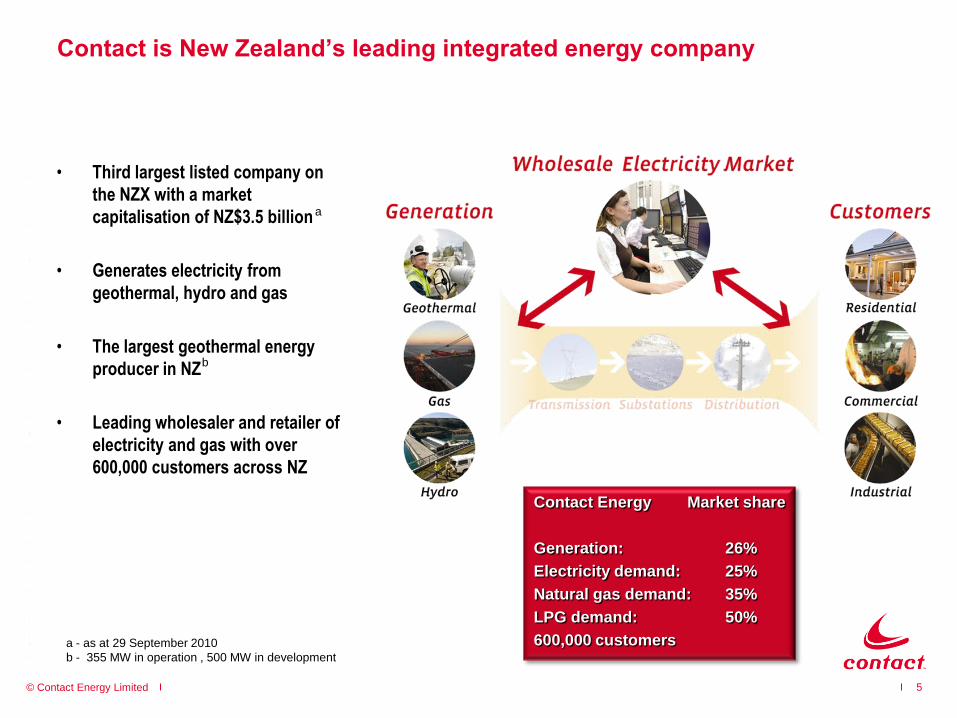
Contact Energy Market share
Generation: 26%
Electricity demand: 25%
Natural gas demand: 35%
LPG demand: 50%
600,000 customers
Contact is New Zealand’s leading integrated energy company
5
• Third largest listed company on
the NZX with a market
capitalisation of NZ$3.5 billion
• Generates electricity from
geothermal, hydro and gas
• The largest geothermal energy
producer in NZ
• Leading wholesaler and retailer of
electricity and gas with over
600,000 customers across NZ
a
a - as at 29 September 2010
b - 355 MW in operation , 500 MW in development
b
© Contact Energy Limited
New Zealand produces the majority of its generation from hydro
6
Generation by hydro sequence - FY12
25,000
30,000
35,000
40,000
45,000
19
95
19
88
19
83
19
98
19
80
19
81
19
84
19
86
19
92
19
82
19
74
20
02
19
85
20
00
19
91
20
01
19
87
19
76
19
73
19
77
GWh
Renewable
(Hydro, Geothermal, Wind)
Thermal balancing requirement
12 TWh
5 TWh
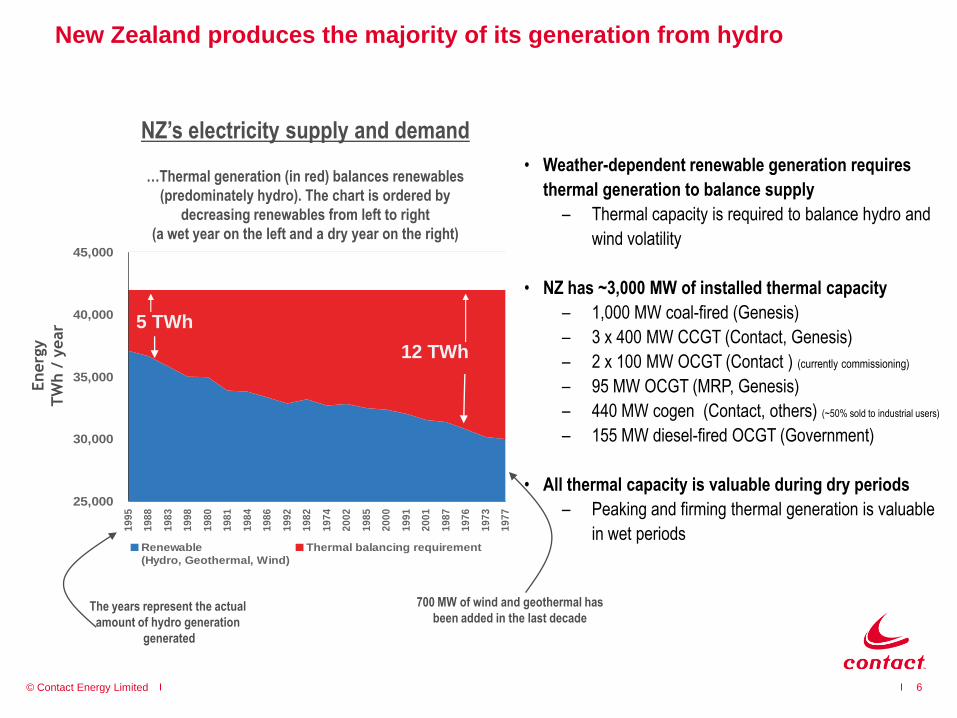
• Weather-dependent renewable generation requires
thermal generation to balance supply
– Thermal capacity is required to balance hydro and
wind volatility
• NZ has ~3,000 MW of installed thermal capacity
– 1,000 MW coal-fired (Genesis)
– 3 x 400 MW CCGT (Contact, Genesis)
– 2 x 100 MW OCGT (Contact ) (currently commissioning)
– 95 MW OCGT (MRP, Genesis)
– 440 MW cogen (Contact, others) (~50% sold to industrial users)
– 155 MW diesel-fired OCGT (Government)
• All thermal capacity is valuable during dry periods
– Peaking and firming thermal generation is valuable
in wet periods
NZ’s electricity supply and demand
…Thermal generation (in red) balances renewables
(predominately hydro). The chart is ordered by
decreasing renewables from left to right
(a wet year on the left and a dry year on the right)
Energ
y
TW
h/
year
The years represent the actual
amount of hydro generation
generated
700 MW of wind and geothermal has
been added in the last decade
© Contact Energy Limited
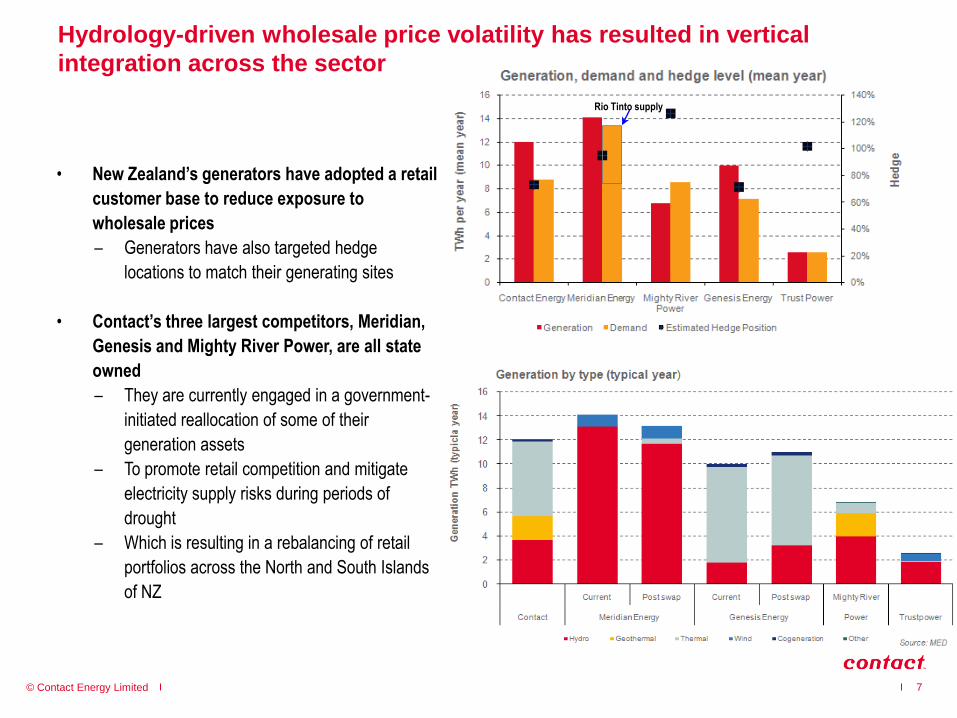
Hydrology-driven wholesale price volatility has resulted in vertical
integration across the sector
• New Zealand’s generators have adopted a retail
customer base to reduce exposure to
wholesale prices
– Generators have also targeted hedge
locations to match their generating sites
• Contact’s three largest competitors, Meridian,
Genesis and Mighty River Power, are all state
owned
– They are currently engaged in a government-
initiated reallocation of some of their
generation assets
– To promote retail competition and mitigate
electricity supply risks during periods of
drought
– Which is resulting in a rebalancing of retail
portfolios across the North and South Islands
of NZ
7
Rio Tinto supply
© Contact Energy Limited
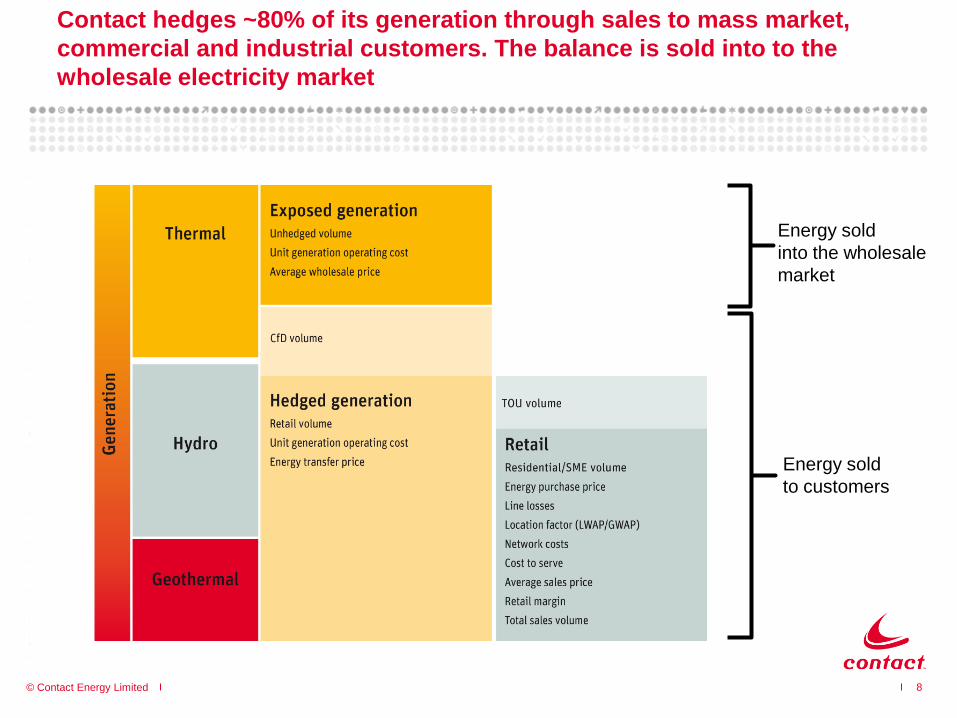
Contact hedges ~80% of its generation through sales to mass market,
commercial and industrial customers. The balance is sold into to the
wholesale electricity market
8
Energy sold
into the wholesale
market
Energy sold
to customers

© Contact Energy Limited
2. Performance
9
© Contact Energy Limited
-
20
40
60
80
100
120
-
100
200
300
400
500
600
2002 2003 2004 2005 2006
$/M
Wh
NZ
$ M
illio
ns
Financial Year
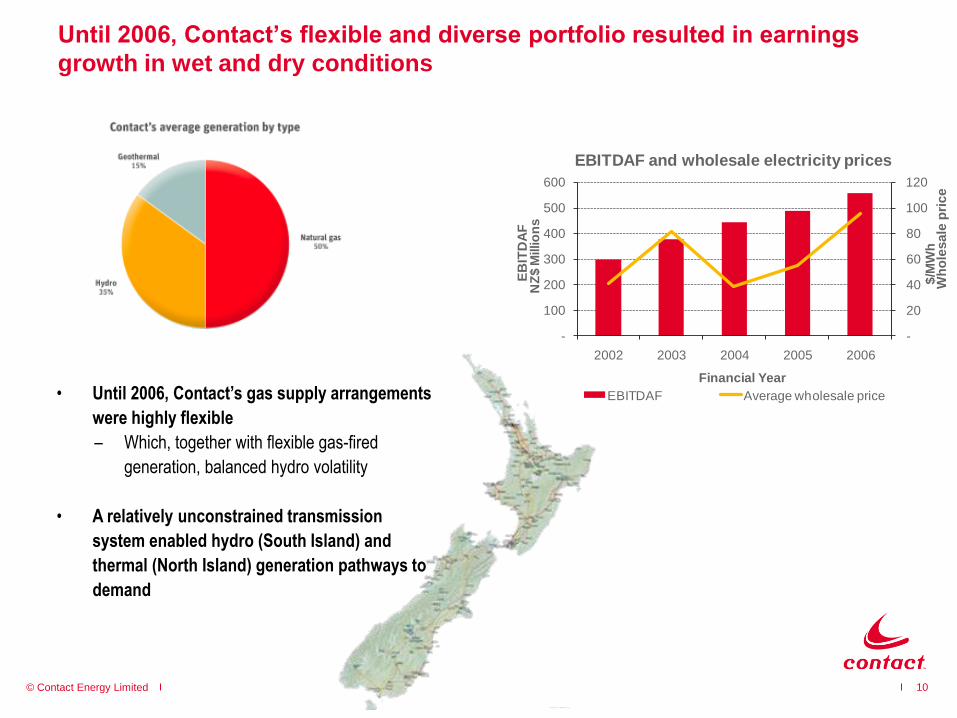
EBITDAF and wholesale electricity prices
EBITDAF Average wholesale price
Until 2006, Contact’s flexible and diverse portfolio resulted in earnings
growth in wet and dry conditions
10
EB
ITD
AF
Wh
ole
sale
pri
ce
• Until 2006, Contact’s gas supply arrangements
were highly flexible
– Which, together with flexible gas-fired
generation, balanced hydro volatility
• A relatively unconstrained transmission
system enabled hydro (South Island) and
thermal (North Island) generation pathways to
demand
© Contact Energy Limited
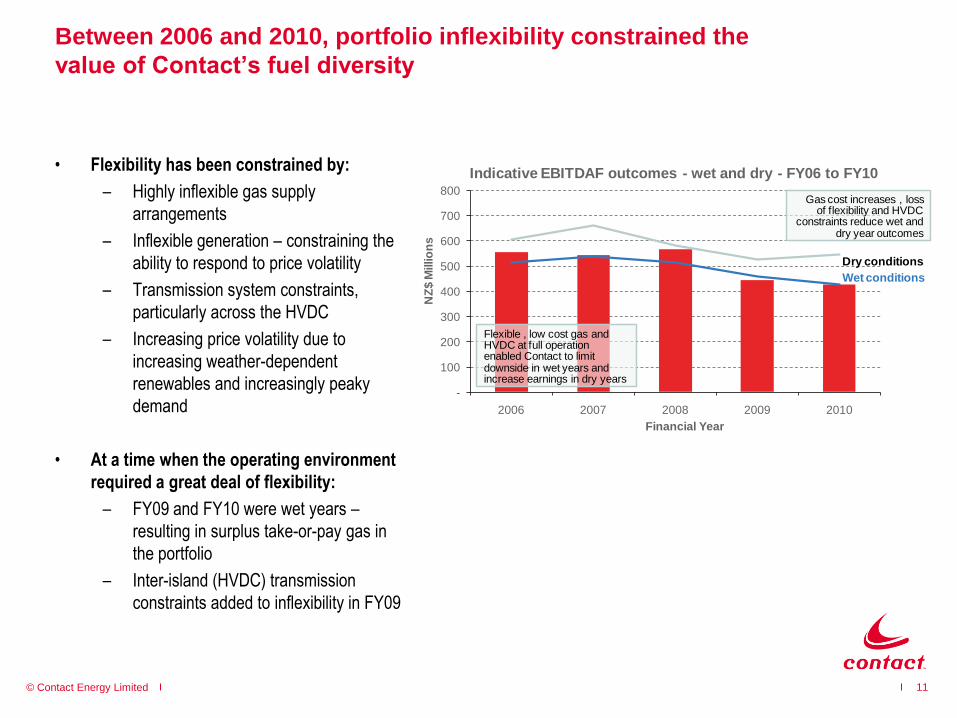
Between 2006 and 2010, portfolio inflexibility constrained the
value of Contact’s fuel diversity
• Flexibility has been constrained by:
– Highly inflexible gas supply
arrangements
– Inflexible generation – constraining the
ability to respond to price volatility
– Transmission system constraints,
particularly across the HVDC
– Increasing price volatility due to
increasing weather-dependent
renewables and increasingly peaky
demand
• At a time when the operating environment
required a great deal of flexibility:
– FY09 and FY10 were wet years –
resulting in surplus take-or-pay gas in
the portfolio
– Inter-island (HVDC) transmission
constraints added to inflexibility in FY09
11
Wet conditions
Dry conditions
-
100
200
300
400
500
600
700
800
2006 2007 2008 2009 2010
NZ
$ M
illio
ns
Financial Year
Indicative EBITDAF outcomes - wet and dry - FY06 to FY10
Flexible , low cost gas and HVDC at full operation enabled Contact to limit downside in wet years and increase earnings in dry years
Gas cost increases , loss of flexibility and HVDC
constraints reduce wet and dry year outcomes
© Contact Energy Limited
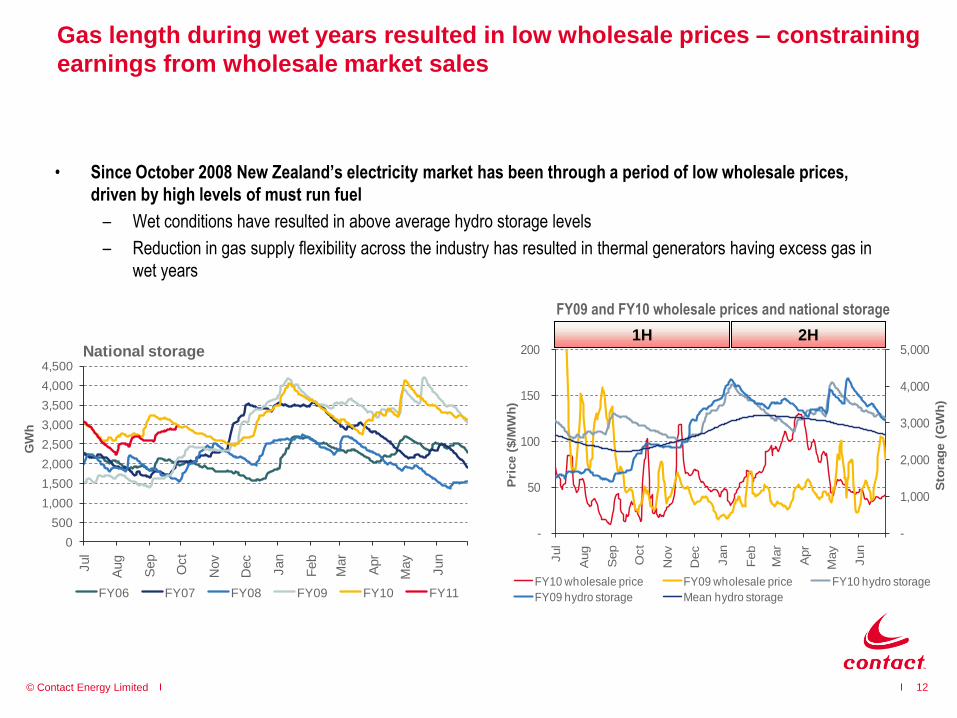
Gas length during wet years resulted in low wholesale prices – constraining
earnings from wholesale market sales
12
• Since October 2008 New Zealand’s electricity market has been through a period of low wholesale prices,
driven by high levels of must run fuel
– Wet conditions have resulted in above average hydro storage levels
– Reduction in gas supply flexibility across the industry has resulted in thermal generators having excess gas in
wet years
-
1,000
2,000
3,000
4,000
5,000
-
50
100
150
200
Jul
Aug
Sep
Oct
Nov
Dec
Jan
Feb
Mar
Apr
May
Jun
Sto
rag
e (
GW
h)
Pri
ce (
$/M
Wh
)
FY10 wholesale price FY09 wholesale price FY10 hydro storage
FY09 hydro storage Mean hydro storage
1H 2H
0
500
1,000
1,500
2,000
2,500
3,000
3,500
4,000
4,500
Jul
Aug
Sep
Oct
Nov
Dec
Jan
Feb
Mar
Apr
May
Jun
GW
h
National storage
FY06 FY07 FY08 FY09 FY10 FY11
FY09 and FY10 wholesale prices and national storage
© Contact Energy Limited
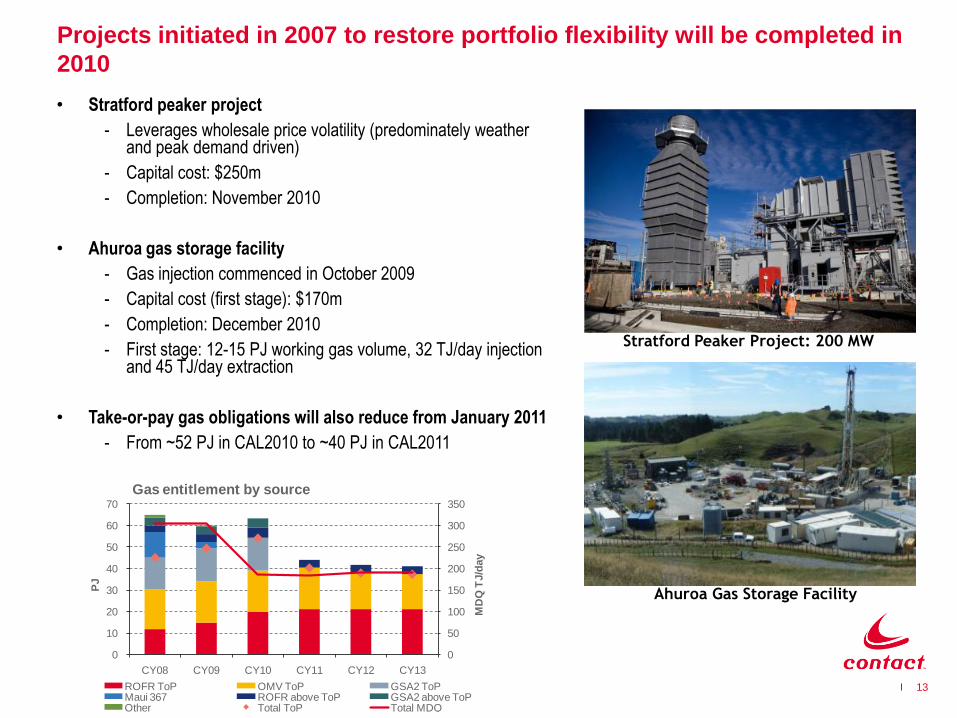
Projects initiated in 2007 to restore portfolio flexibility will be completed in
2010
13
Stratford Peaker Project: 200 MW
Ahuroa Gas Storage Facility
• Stratford peaker project
- Leverages wholesale price volatility (predominately weather and peak demand driven)
- Capital cost: $250m
- Completion: November 2010
• Ahuroa gas storage facility
- Gas injection commenced in October 2009
- Capital cost (first stage): $170m
- Completion: December 2010
- First stage: 12-15 PJ working gas volume, 32 TJ/day injection and 45 TJ/day extraction
• Take-or-pay gas obligations will also reduce from January 2011
- From ~52 PJ in CAL2010 to ~40 PJ in CAL2011
0
50
100
150
200
250
300
350
0
10
20
30
40
50
60
70
CY08 CY09 CY10 CY11 CY12 CY13
MD
Q T
J/d
ay
PJ
Gas entitlement by source
ROFR ToP OMV ToP GSA2 ToPMaui 367 ROFR above ToP GSA2 above ToPOther Total ToP Total MDQ
© Contact Energy Limited
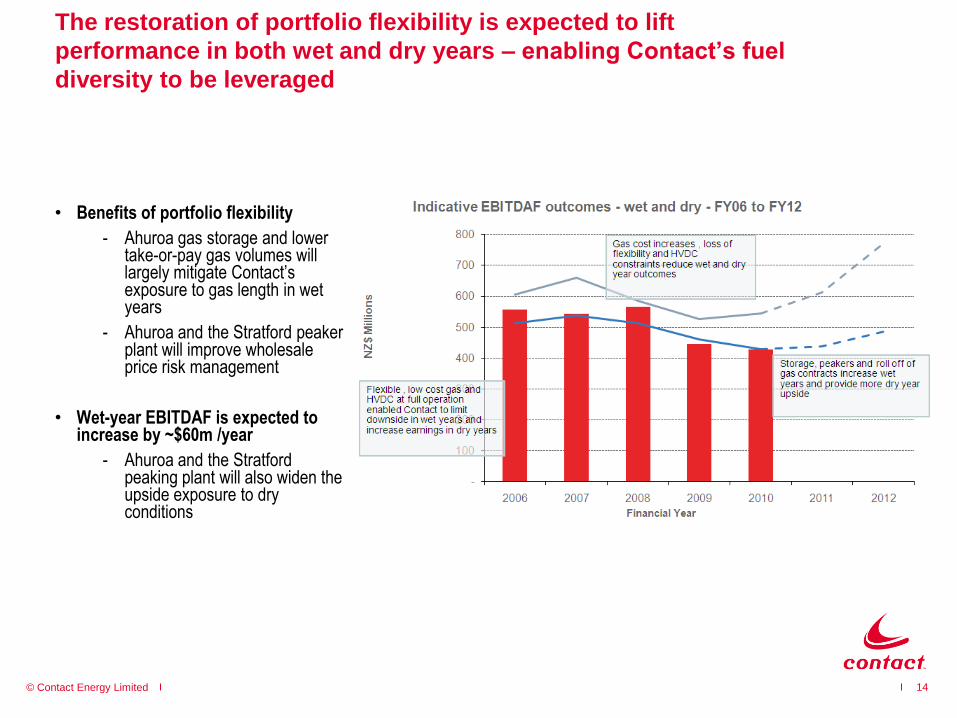
The restoration of portfolio flexibility is expected to lift
performance in both wet and dry years – enabling Contact’s fuel
diversity to be leveraged
• Benefits of portfolio flexibility
- Ahuroa gas storage and lower take-or-pay gas volumes will largely mitigate Contact’s exposure to gas length in wet years
- Ahuroa and the Stratford peakerplant will improve wholesale price risk management
• Wet-year EBITDAF is expected to increase by ~$60m /year
- Ahuroa and the Stratford peaking plant will also widen the upside exposure to dry conditions
14

© Contact Energy Limited
3. Strategy and growth
15
© Contact Energy Limited
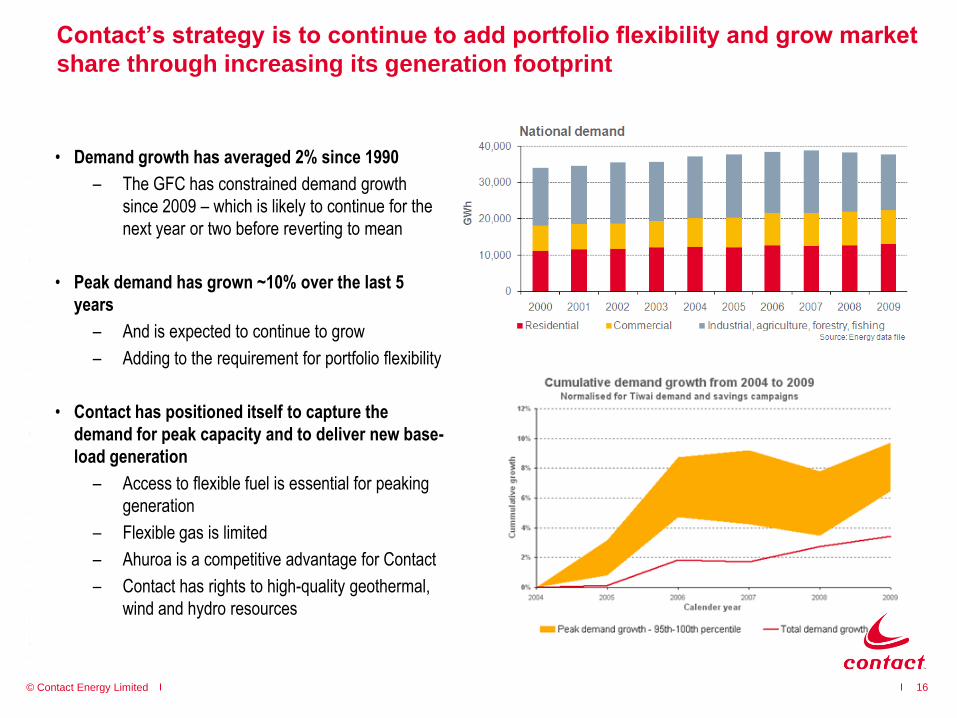
• Demand growth has averaged 2% since 1990
– The GFC has constrained demand growth
since 2009 – which is likely to continue for the
next year or two before reverting to mean
• Peak demand has grown ~10% over the last 5
years
– And is expected to continue to grow
– Adding to the requirement for portfolio flexibility
• Contact has positioned itself to capture the
demand for peak capacity and to deliver new base-
load generation
– Access to flexible fuel is essential for peaking
generation
– Flexible gas is limited
– Ahuroa is a competitive advantage for Contact
– Contact has rights to high-quality geothermal,
wind and hydro resources
16
Contact’s strategy is to continue to add portfolio flexibility and grow market
share through increasing its generation footprint
© Contact Energy Limited
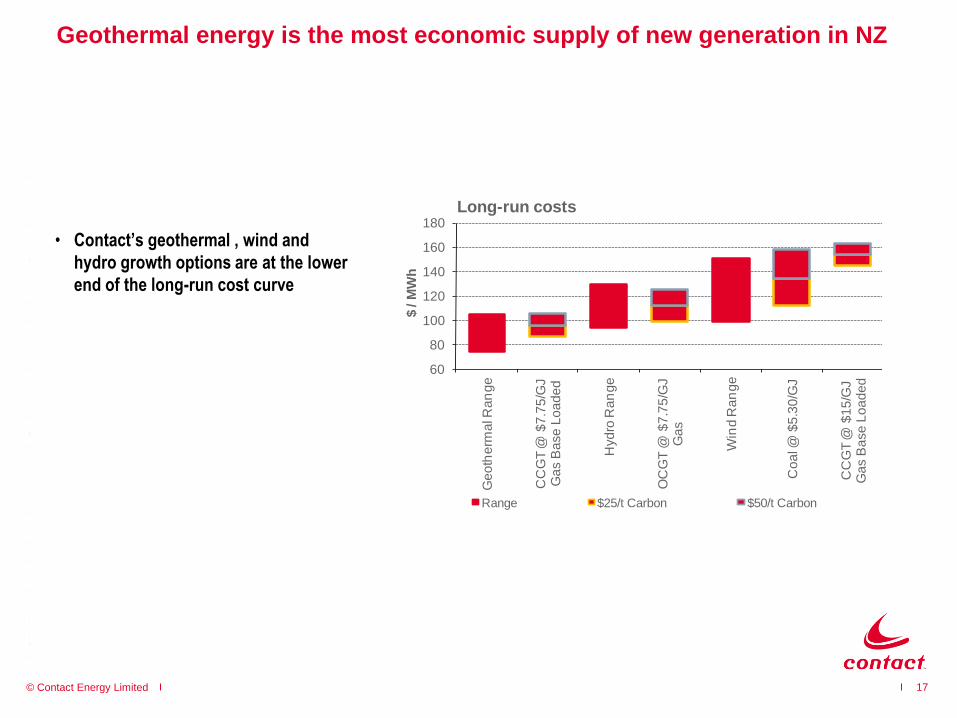
Geothermal energy is the most economic supply of new generation in NZ
17
60
80
100
120
140
160
180
Ge
oth
erm
al R
an
ge
CC
GT
@ $
7.7
5/G
J
Ga
s B
ase
Lo
ad
ed
Hyd
ro R
an
ge
OC
GT
@ $
7.7
5/G
J
Ga
s
Win
d R
an
ge
Co
al @
$5
.30
/GJ
CC
GT
@ $
15
/GJ
Ga
s B
ase
Lo
ad
ed
$ /
MW
h
Long-run costs
Range $25/t Carbon $50/t Carbon
• Contact’s geothermal , wind and
hydro growth options are at the lower
end of the long-run cost curve
© Contact Energy Limited 18
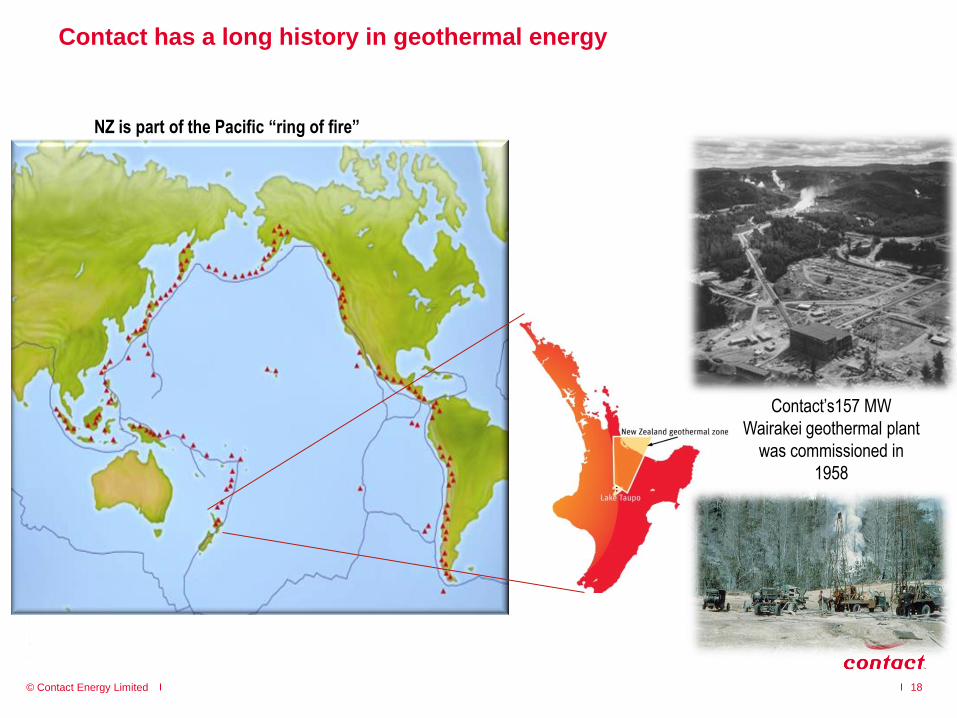
Contact has a long history in geothermal energy
NZ is part of the Pacific “ring of fire”
Contact’s157 MW
Wairakei geothermal plant
was commissioned in
1958
© Contact Energy Limited 19
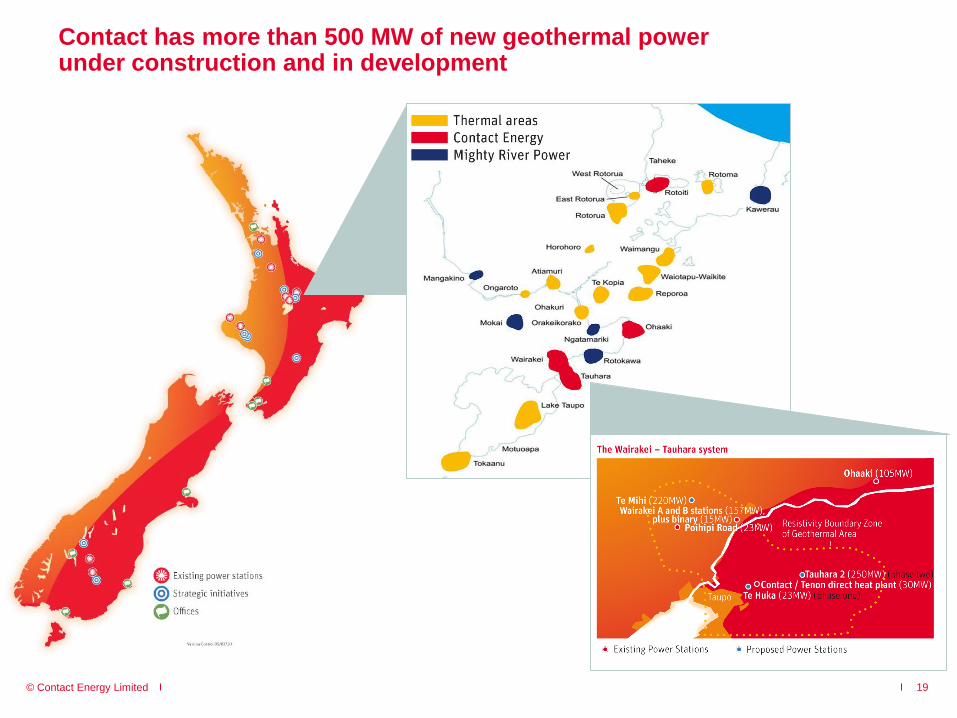
Contact has more than 500 MW of new geothermal power under construction and in development
© Contact Energy Limited
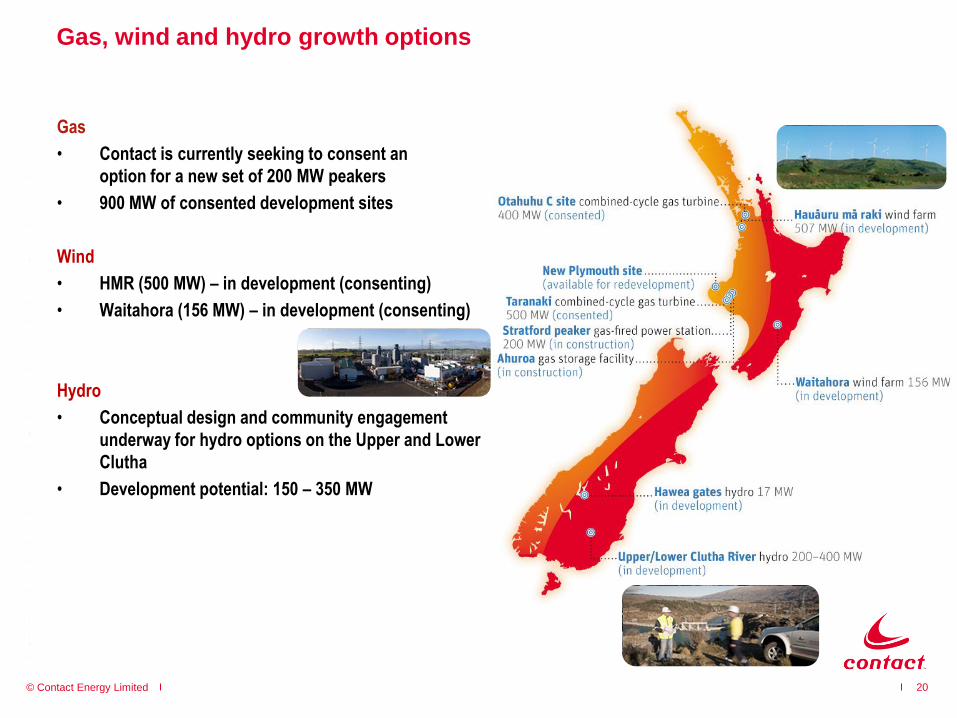
Gas, wind and hydro growth options
Gas
• Contact is currently seeking to consent an
option for a new set of 200 MW peakers
• 900 MW of consented development sites
Wind
• HMR (500 MW) – in development (consenting)
• Waitahora (156 MW) – in development (consenting)
Hydro
• Conceptual design and community engagement
underway for hydro options on the Upper and Lower
Clutha
• Development potential: 150 – 350 MW
20
© Contact Energy Limited 21
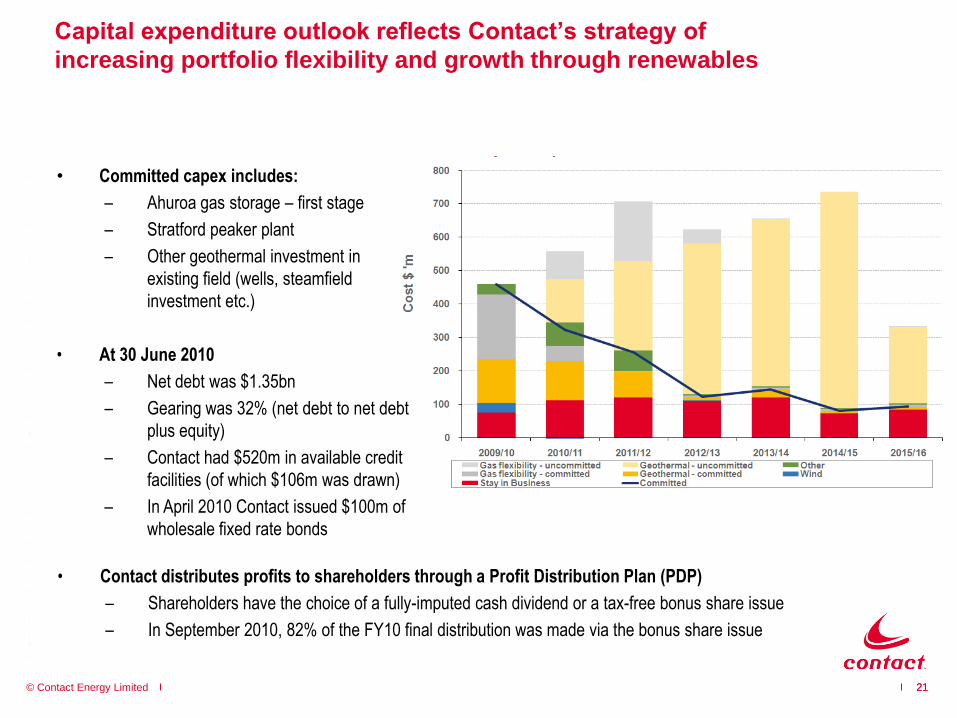
Capital expenditure outlook reflects Contact’s strategy of
increasing portfolio flexibility and growth through renewables
• Committed capex includes:
– Ahuroa gas storage – first stage
– Stratford peaker plant
– Other geothermal investment in
existing field (wells, steamfield
investment etc.)
• At 30 June 2010
– Net debt was $1.35bn
– Gearing was 32% (net debt to net debt
plus equity)
– Contact had $520m in available credit
facilities (of which $106m was drawn)
– In April 2010 Contact issued $100m of
wholesale fixed rate bonds
• Contact distributes profits to shareholders through a Profit Distribution Plan (PDP)
– Shareholders have the choice of a fully-imputed cash dividend or a tax-free bonus share issue
– In September 2010, 82% of the FY10 final distribution was made via the bonus share issue
21

© Contact Energy Limited
4. Financial Results Overview
22
© Contact Energy Limited 23
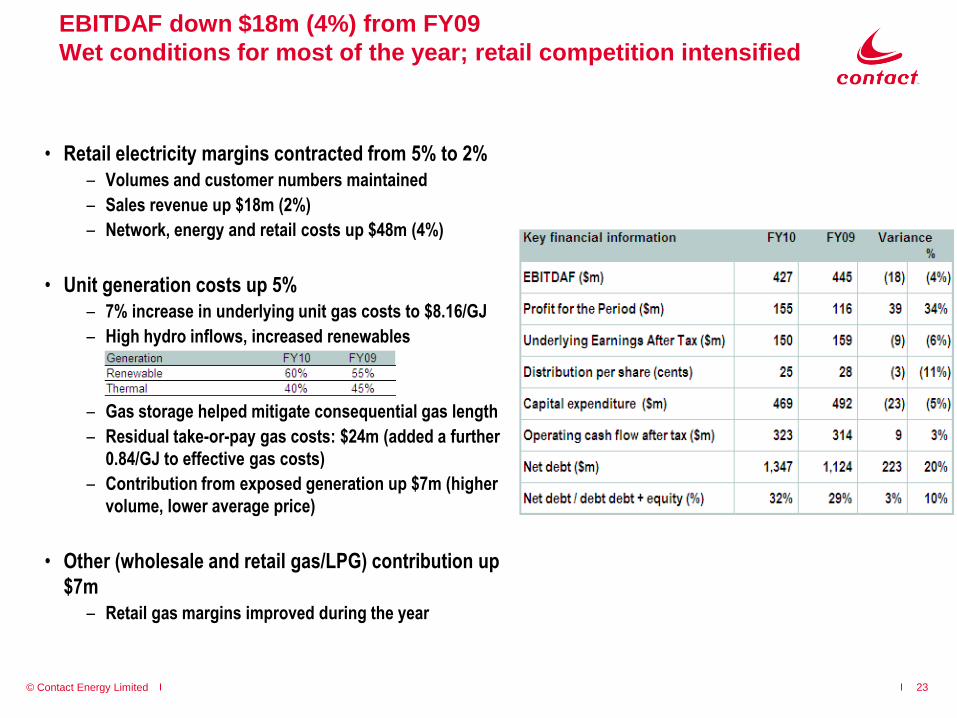
EBITDAF down $18m (4%) from FY09
Wet conditions for most of the year; retail competition intensified
• Retail electricity margins contracted from 5% to 2%
– Volumes and customer numbers maintained
– Sales revenue up $18m (2%)
– Network, energy and retail costs up $48m (4%)
• Unit generation costs up 5%
– 7% increase in underlying unit gas costs to $8.16/GJ
– High hydro inflows, increased renewables
– Gas storage helped mitigate consequential gas length
– Residual take-or-pay gas costs: $24m (added a further
0.84/GJ to effective gas costs)
– Contribution from exposed generation up $7m (higher
volume, lower average price)
• Other (wholesale and retail gas/LPG) contribution up
$7m
– Retail gas margins improved during the year
© Contact Energy Limited 24
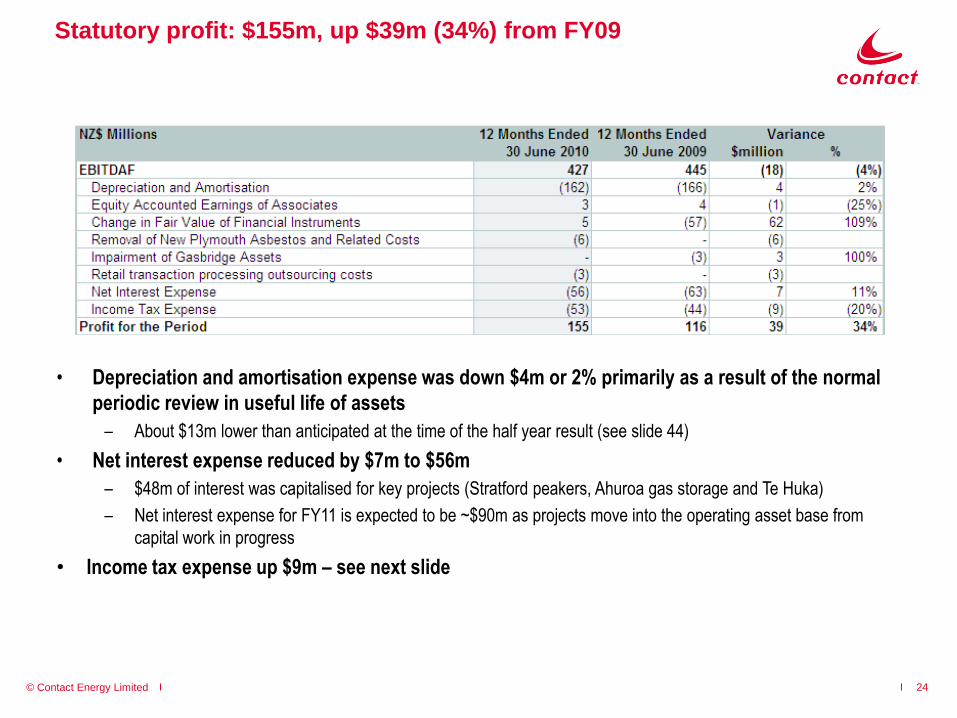
• Depreciation and amortisation expense was down $4m or 2% primarily as a result of the normal
periodic review in useful life of assets
– About $13m lower than anticipated at the time of the half year result (see slide 44)
• Net interest expense reduced by $7m to $56m
– $48m of interest was capitalised for key projects (Stratford peakers, Ahuroa gas storage and Te Huka)
– Net interest expense for FY11 is expected to be ~$90m as projects move into the operating asset base from
capital work in progress
• Income tax expense up $9m – see next slide
Statutory profit: $155m, up $39m (34%) from FY09
© Contact Energy Limited
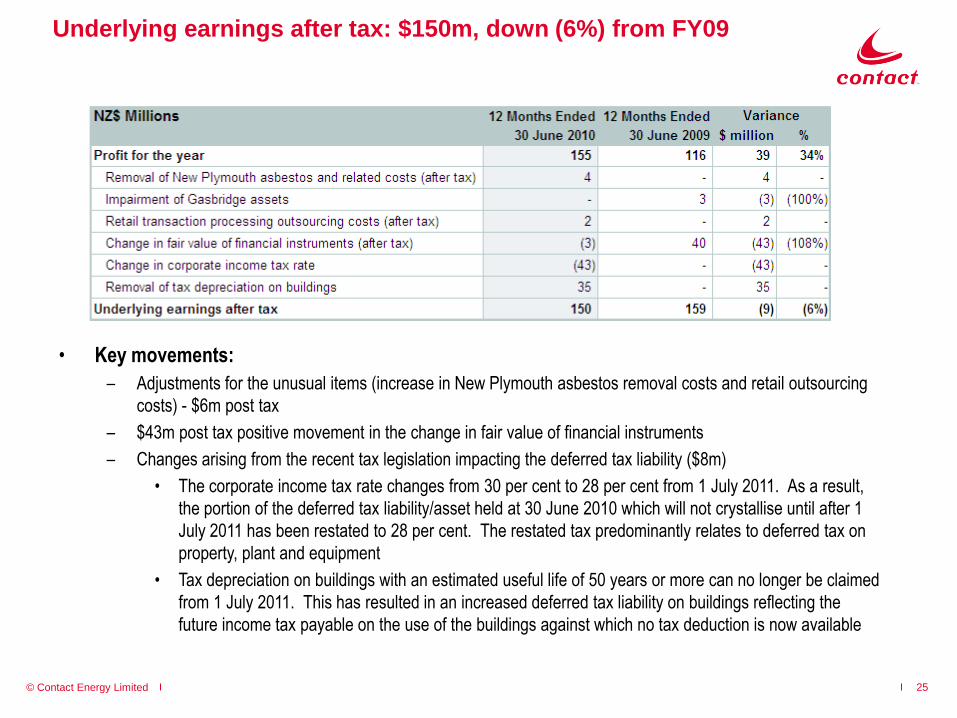
• Key movements:
– Adjustments for the unusual items (increase in New Plymouth asbestos removal costs and retail outsourcing
costs) - $6m post tax
– $43m post tax positive movement in the change in fair value of financial instruments
– Changes arising from the recent tax legislation impacting the deferred tax liability ($8m)
• The corporate income tax rate changes from 30 per cent to 28 per cent from 1 July 2011. As a result,
the portion of the deferred tax liability/asset held at 30 June 2010 which will not crystallise until after 1
July 2011 has been restated to 28 per cent. The restated tax predominantly relates to deferred tax on
property, plant and equipment
• Tax depreciation on buildings with an estimated useful life of 50 years or more can no longer be claimed
from 1 July 2011. This has resulted in an increased deferred tax liability on buildings reflecting the
future income tax payable on the use of the buildings against which no tax deduction is now available
25
Underlying earnings after tax: $150m, down (6%) from FY09
© Contact Energy Limited
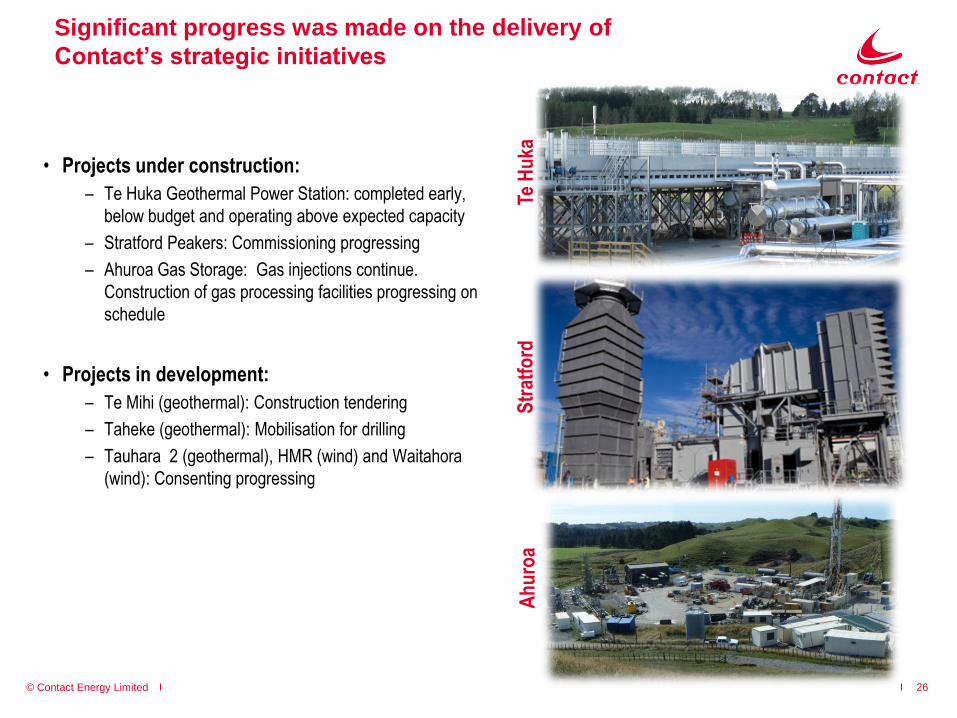
Significant progress was made on the delivery of
Contact’s strategic initiatives
• Projects under construction:
– Te Huka Geothermal Power Station: completed early,
below budget and operating above expected capacity
– Stratford Peakers: Commissioning progressing
– Ahuroa Gas Storage: Gas injections continue.
Construction of gas processing facilities progressing on
schedule
• Projects in development:
– Te Mihi (geothermal): Construction tendering
– Taheke (geothermal): Mobilisation for drilling
– Tauhara 2 (geothermal), HMR (wind) and Waitahora
(wind): Consenting progressing
Te H
uka
Str
atfo
rdA
hu
roa
26
© Contact Energy Limited
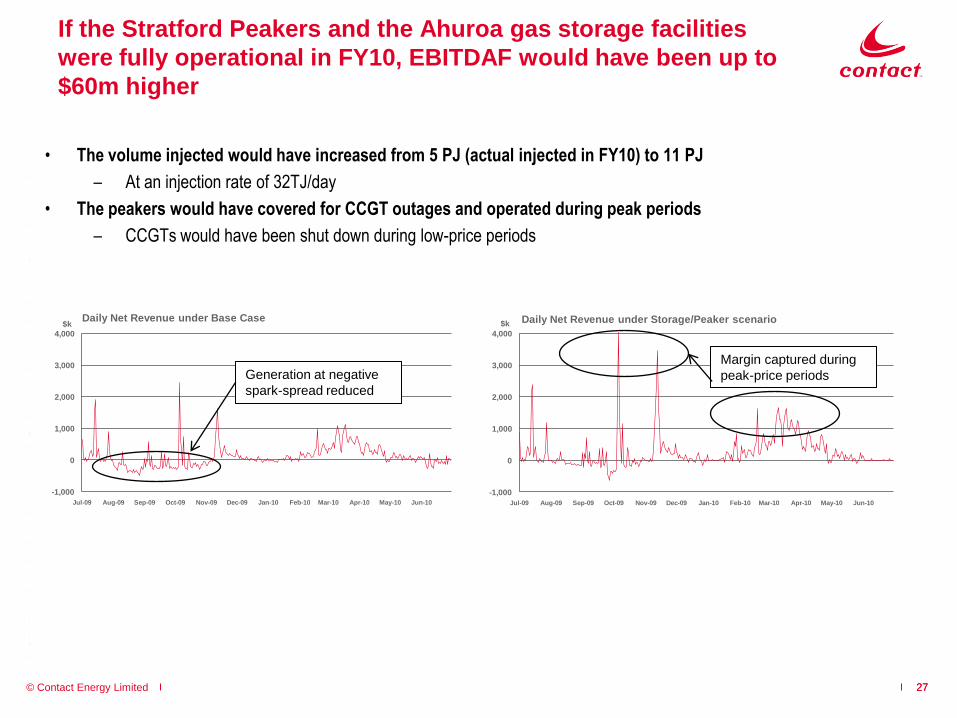
If the Stratford Peakers and the Ahuroa gas storage facilities
were fully operational in FY10, EBITDAF would have been up to
$60m higher
• The volume injected would have increased from 5 PJ (actual injected in FY10) to 11 PJ
– At an injection rate of 32TJ/day
• The peakers would have covered for CCGT outages and operated during peak periods
– CCGTs would have been shut down during low-price periods
-1,000
0
1,000
2,000
3,000
4,000
Jul-09 Aug-09 Sep-09 Oct-09 Nov-09 Dec-09 Jan-10 Feb-10 Mar-10 Apr-10 May-10 Jun-10
$kDaily Net Revenue under Base Case
Generation at negative
spark-spread reduced
-1,000
0
1,000
2,000
3,000
4,000
Jul-09 Aug-09 Sep-09 Oct-09 Nov-09 Dec-09 Jan-10 Feb-10 Mar-10 Apr-10 May-10 Jun-10
$k Daily Net Revenue under Storage/Peaker scenario
Margin captured during
peak-price periods
2727
© Contact Energy Limited
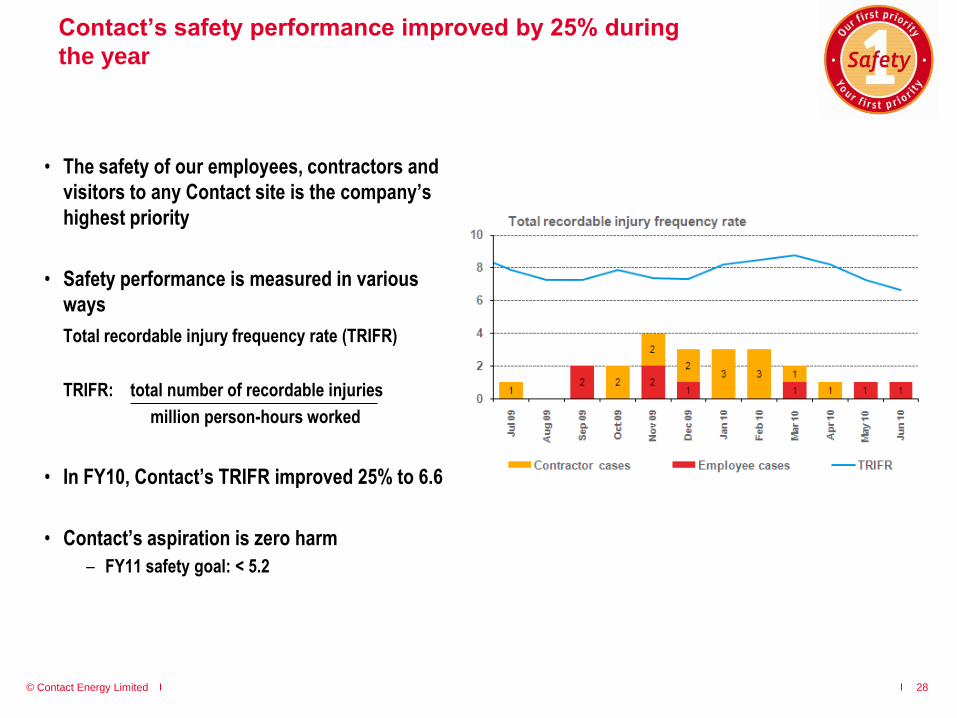
Contact’s safety performance improved by 25% during
the year
• The safety of our employees, contractors and
visitors to any Contact site is the company’s
highest priority
• Safety performance is measured in various
ways
Total recordable injury frequency rate (TRIFR)
TRIFR: total number of recordable injuries
million person-hours worked
• In FY10, Contact’s TRIFR improved 25% to 6.6
• Contact’s aspiration is zero harm
– FY11 safety goal: < 5.2
28

© Contact Energy Limited
5. Sector Information
29
© Contact Energy Limited
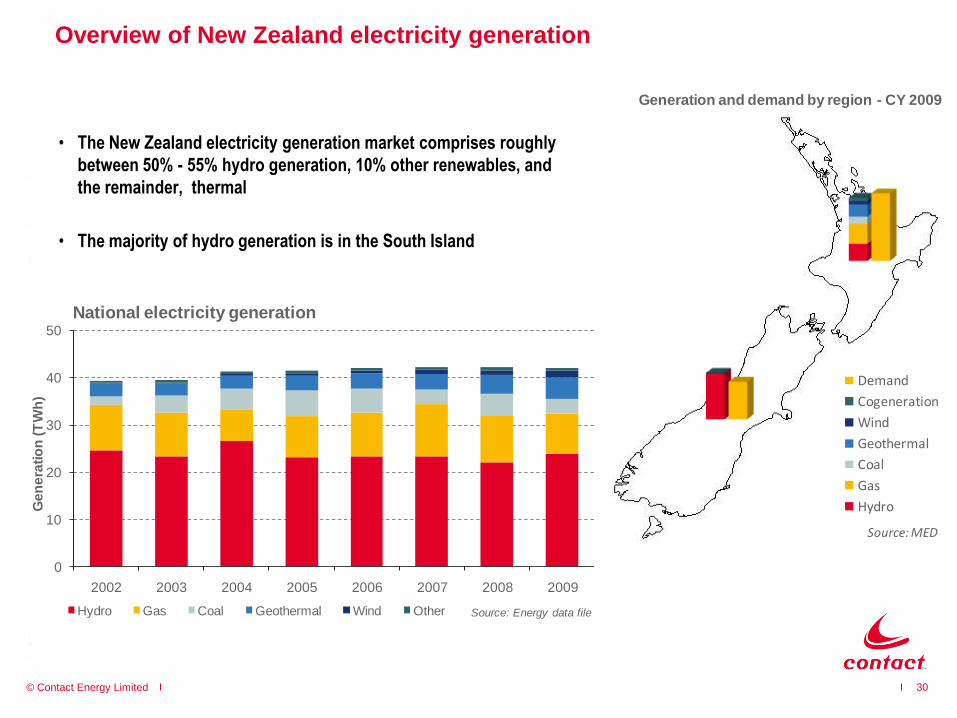
Overview of New Zealand electricity generation
• The New Zealand electricity generation market comprises roughly
between 50% - 55% hydro generation, 10% other renewables, and
the remainder, thermal
• The majority of hydro generation is in the South Island
30
0
10
20
30
40
50
2002 2003 2004 2005 2006 2007 2008 2009
Ge
ne
rati
on
(T
Wh
)
Source: Energy data file
National electricity generation
Hydro Gas Coal Geothermal Wind Other
Generation and demand by region - CY 2009
Demand
Cogeneration
Wind
Geothermal
Coal
Gas
Hydro
Source:MED
© Contact Energy Limited
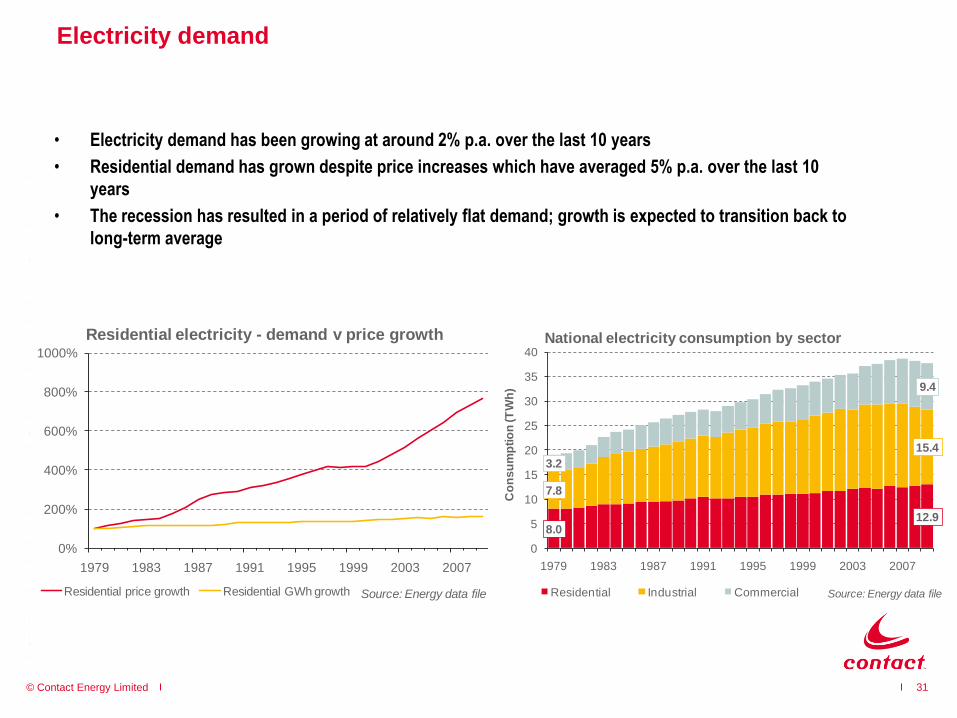
Electricity demand
• Electricity demand has been growing at around 2% p.a. over the last 10 years
• Residential demand has grown despite price increases which have averaged 5% p.a. over the last 10
years
• The recession has resulted in a period of relatively flat demand; growth is expected to transition back to
long-term average
31
8.0 12.9
7.8
15.4
3.2
9.4
0
5
10
15
20
25
30
35
40
1979 1983 1987 1991 1995 1999 2003 2007
Co
ns
um
pti
on
(T
Wh
)
Source: Energy data file
National electricity consumption by sector
Residential Industrial Commercial
0%
200%
400%
600%
800%
1000%
1979 1983 1987 1991 1995 1999 2003 2007
Source: Energy data file
Residential electricity - demand v price growth
Residential price growth Residential GWh growth
© Contact Energy Limited
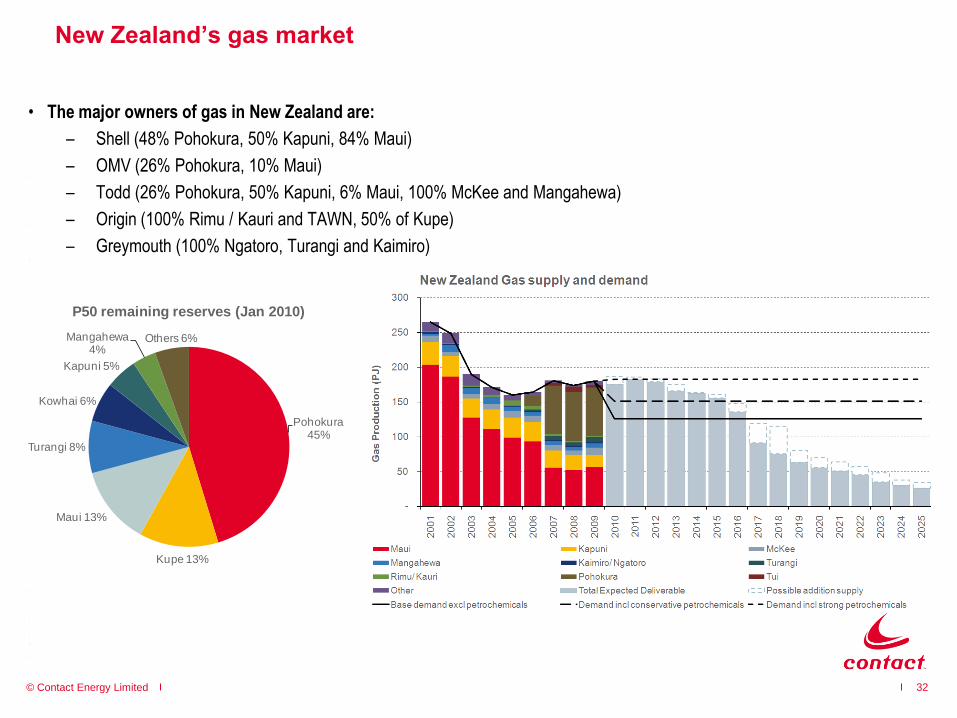
New Zealand’s gas market
• The major owners of gas in New Zealand are:
– Shell (48% Pohokura, 50% Kapuni, 84% Maui)
– OMV (26% Pohokura, 10% Maui)
– Todd (26% Pohokura, 50% Kapuni, 6% Maui, 100% McKee and Mangahewa)
– Origin (100% Rimu / Kauri and TAWN, 50% of Kupe)
– Greymouth (100% Ngatoro, Turangi and Kaimiro)
Source: Energy Data file, July 2010
32
Pohokura 45%
Kupe 13%
Maui 13%
Turangi 8%
Kowhai 6%
Kapuni 5%
Mangahewa 4%
Others 6%
P50 remaining reserves (Jan 2010)