Investigation of Performance Characteristics of a Novel VAWT

J Fluid Mech (2017) vol 813 pp 346ndash381 ccopy Cambridge University Press 2017doi101017jfm2016862
346
Transition to bluff-body dynamics in the wake ofvertical-axis wind turbines
Daniel B Araya1dagger Tim Colonius2 and John O Dabiri3
1Department of Mechanical Engineering University of Houston Houston TX 77204 USA2Division of Engineering and Applied Science California Institute of Technology
Pasadena CA 91125 USA3Department of Mechanical Engineering and Department of Civil and Environmental Engineering
Stanford University Stanford CA 94305 USA
(Received 21 October 2015 revised 13 December 2016 accepted 14 December 2016first published online 19 January 2017)
We present experimental data to demonstrate that the far wake of a vertical-axis windturbine (VAWT) exhibits features that are quantitatively similar to that of a circularcylinder with the same aspect ratio For a fixed Reynolds number (Re asymp 08 times 105)and variable tip-speed ratio two-dimensional particle image velocimetry (PIV) is usedto measure the velocity field in the wake of four different laboratory-scale modelsa 2-bladed 3-bladed and 5-bladed VAWT as well as a circular cylinder With thesemeasurements we use spectral analysis and proper orthogonal decomposition (POD)to evaluate statistics of the velocity field and investigate the large-scale coherentmotions of the wake In all cases we observe three distinct regions in the VAWTwake (i) the near wake where periodic blade vortex shedding dominates (ii) atransition region where growth of a shear-layer instability occurs (iii) the far wakewhere bluff-body wake oscillations dominate We define a dynamic solidity parameterσD that relates the characteristic scales of the flow to the streamwise transitionlocation in the wake In general we find that increasing σD leads to an earliertransition a greater initial velocity deficit and a faster rate of recovery in the wakeWe propose a coordinate transformation using σD in which the minimum velocityrecovery profiles of the VAWT wake closely match that of the cylinder wake Theresults have implications for manipulating VAWT wake recovery within a wind farm
Key words turbulent flows vortex flows wakesjets
1 IntroductionThe wake of a wind turbine is a complex flow that evolves subject to dynamic
interactions among vortices shed from the turbine blades On average there is avelocity deficit in the wake due to the turbine rotation and energy extraction processWithin a wind farm multiple turbine wakes can interact and have a strong effecton the overall power production (eg Porteacute-Agel Wu amp Chen 2013) and dynamicloading of neighbouring turbines (eg Thomsen amp Soslashrensen 1999) This makes anunderstanding of the wake recovery process critically important to optimizing wind
dagger Email address for correspondence dbarayauhedu
Dow
nloa
ded
from
htt
psw
ww
cam
brid
geo
rgc
ore
Cal
tech
Lib
rary
on
31 M
ay 2
017
at 1
934
26
sub
ject
to th
e Ca
mbr
idge
Cor
e te
rms
of u
se a
vaila
ble
at h
ttps
ww
wc
ambr
idge
org
cor
ete
rms
htt
ps
doio
rg1
010
17jf
m2
016
862
Transition to bluff-body dynamics in the wake of vertical-axis wind turbines 347
farm efficiency It has been demonstrated in full-scale experiments that an array ofvertical-axis wind turbines (VAWTs) which spin on an axis perpendicular to theincident flow can significantly increase the footprint power density of a wind farm(Kinzel Mulligan amp Dabiri 2012 Dabiri 2014) The increase in performance ishypothesized to be partially a result of turbine blockage which redirects some of theincident flow to other turbines in conjunction with a VAWTrsquos inherent insensitivityto wind direction However a full understanding of the physics of VAWT wakes iscurrently lacking particularly as it pertains to wake interactions within a wind farmwhich motivates the present study
An interesting aspect of wind turbine aerodynamics is the geometric similaritybetween the swept area of the rotating turbine blades and the surface of a bluffbody Conceptually this forms the basis of the well-established actuator disk theoryoften applied to model horizontal-axis wind turbine (HAWT) aerodynamics (seeeg Hansen et al 2006) The theory has also been applied to VAWTs as an actuatorcylinder model developed by Madsen (1982) In its simplest form actuator disk theoryidealizes a turbine rotor as a porous non-rotating disk that extracts momentum fromthe flow and allows mass to pass through This basic model has been used frequentlywithin numerical simulations of HAWT wind farms (eg Calaf Meneveau amp Meyers(2010)) and also in some experiments eg an analysis by Myers amp Bahaj (2010)where individual turbines were substituted by mesh disks A major limitation of thisapproach however is that it cannot replicate the flow asymmetry caused by theturbine rotation and it also neglects the dynamic behaviour of near-wake vorticesshed from the turbine blades
Several experimental investigations of HAWT wakes have examined the dynamicbehaviour of the flow Medici amp Alfredsson (2006 2008) reported observationsof low-frequency oscillations in the wakes of model HAWTs and hypothesizedthis to be analogous to the vortex shedding that occurs for solid disks Thislow-frequency behaviour is often referred to as turbine wake lsquomeanderingrsquo (egLarsen et al 2008) As noted by Okulov et al (2014) large-scale fluctuations due toatmospheric turbulence are absent in wind and water tunnel experiments indicatingthat wake meandering of model rotors is most likely associated with vortex sheddingdue to inherent wake instabilities Okulov et al (2014) also determined that thedynamics governing the low-frequency oscillations in the wake of a model HAWTwas associated with the precession of a helical vortex core at a constant Strouhalnumber (based on turbine diameter) of approximately 023 similar to the helicoidalvortex structure in the far wake of a sphere Their findings are consistent withthe linear stability analysis of Iungo et al (2013) who found the low-frequencyoscillations in the wake of a model HAWT to be a component of a helicoidallyunstable mode of the hub vortex Given this evidence of analogous wake instabilitiesbetween bluff-body and HAWT wakes it is reasonable to postulate that a similarbehaviour may occur within VAWT wakes as well
Most experimental investigations of the VAWT wake have focused on either theblade-scale or near-wake aerodynamics As a VAWT rotates each turbine blademay be subject to dynamic stall as well as bladendashwake interactions both of whichare functions of the rotation rate (Laneville amp Vittecoq 1986 Fujisawa amp Shibuya2001 Ferreira et al 2009 Edwards Danao amp Howell 2015) Analysis by Dunne ampMcKeon (2015) demonstrated that the essential physics of the dynamic stall processon a VAWT airfoil can be captured using a low-order model identified by dynamicmode decomposition The near wake of a VAWT has been shown to be characterizedby a three-dimensional and asymmetrical mean velocity field with the dynamicsdominated by the vorticity shed from the blades (Battisti et al 2011 Tescione et al2014 Bachant amp Wosnik 2015) Despite these advances what appears to be lacking
Dow
nloa
ded
from
htt
psw
ww
cam
brid
geo
rgc
ore
Cal
tech
Lib
rary
on
31 M
ay 2
017
at 1
934
26
sub
ject
to th
e Ca
mbr
idge
Cor
e te
rms
of u
se a
vaila
ble
at h
ttps
ww
wc
ambr
idge
org
cor
ete
rms
htt
ps
doio
rg1
010
17jf
m2
016
862
348 D B Araya T Colonius and J O Dabiri
is a detailed study of the spatio-temporal evolution of the VAWT wake that extendsto the far field Rolin amp Porteacute-Agel (2015) examined the far wake of a VAWT upto approximately 7 rotor diameters downstream of the turbine with a focus on theboundary layer effects on the wake recovery They observed that the core of thewake is re-energized with downward-entrained momentum due to the presence ofthe incoming turbulent boundary layer Such characterizations of the far wake arenecessary in order to identify its dominant features which has added significancewhen VAWTs are to be placed in close proximity to one another as in a wind farm
The focus of this paper is to present new experimental data that explore thespatio-temporal dynamics of the VAWT wake and to relate these observations tocurrent knowledge of bluff-body wakes Specifically we examine how the turbinewake dynamics changes as either the number of blades or the tip-speed ratio isincreased We use particle image velocimetry (PIV) to measure the velocity in thewake of three different laboratory-scale turbines a 2-bladed 3-bladed and 5-bladedVAWT as well as a circular cylinder of the same diameter and height as the turbinesWe analyse the dynamic characteristics of the wake velocity using spectral analysisand proper orthogonal decomposition We then examine the time-averaged velocityand compare the wake recovery with classical theoretical approximations for turbulentfree-shear flows
The remainder of the paper is organized as follows Section 2 gives a descriptionof the experimental methods including the procedure for the PIV measurementsand subsequent statistical analysis Section 3 presents the results of the wake velocitymeasurements and introduces the concept of dynamic solidity Finally sect 4 summarizesthe significant results of this work and their potential application to wind farms
2 Experimental methods21 Turbine rotor and cylinder geometry
Three model turbine rotors were lsquo3D printedrsquo using a polycarbonate-like material (3DSystems Accurar 60 Plastic) each model was sanded to give a smooth surface finishEach rotor blade consisted of a NACA 0018 airfoil with a 01 m chord extruded toa length of 045 m Each rotor had a diameter of 03 m as measured by a circletangent to the chord of each airfoil A circular cylinder was constructed with the sameheight and diameter as the turbines Acrylic tubing was used for the cylinder body andlaser-cut acrylic sheets were used for the cylinder end caps Together the cylinderand turbine models accounted for four different values of model solidity σ which isdefined as
σ = ncπD
(21)
where n is the number of blades c is the chord length and D is the diameter of therotor The model solidity quantifies how the rotor geometry approximates a cylinderof equivalent diameter Thus it is implicitly assumed that σ 6 1 where σ equiv 1 for thecylinder model For the 2- 3- and 5-bladed turbine rotor σ = 021 032 and 053respectively Figure 1 shows drawings of the cylinder and turbine models along withrelevant dimensions The cylinder model had a blockage ratio of approximately 23 based on its frontal projected area and the cross-section of the channel Since theprojected area of a VAWT changes as it rotates the blockage ratio will also varyperiodically with each revolution The blockage ratio of the 2-bladed turbine rotorvaried between approximately 3 ndash8 over one revolution Similarly the blockageratio of the 3- and 5-bladed rotors varied between approximately 8 ndash16 and13 ndash25 respectively All of the models were mounted using identical hardwareas described below
Dow
nloa
ded
from
htt
psw
ww
cam
brid
geo
rgc
ore
Cal
tech
Lib
rary
on
31 M
ay 2
017
at 1
934
26
sub
ject
to th
e Ca
mbr
idge
Cor
e te
rms
of u
se a
vaila
ble
at h
ttps
ww
wc
ambr
idge
org
cor
ete
rms
htt
ps
doio
rg1
010
17jf
m2
016
862
Transition to bluff-body dynamics in the wake of vertical-axis wind turbines 349
010 010 010
045 045
045045
(a) (b) (c) (d )
FIGURE 1 Drawings of the (a) 2-bladed VAWT (b) 3-bladed VAWT (c) 5-bladed VAWTand (d) cylinder used for the experiment Dimensions are in metres
Rotary torque sensor
Support structure
IR sensor
Acyrlic sheet
Laser sheet (XZ-plane)
Laser sheet (XY-plane)
Turbine
Bearings
Mounting plate
18D
36D
X Y
Z
FIGURE 2 Section view schematic of the experimental set-up D= 03 m
22 Water channel facilityExperiments were conducted in a 40 m long 11 m wide and 06 m deep free-surfacerecirculating water channel facility capable of flow speeds up to approximately26 cm sminus1 The bottom end of each modelrsquos central shaft was attached to a flangemount with Type 316 stainless steel ball bearings This flange was mounted to a thinstainless steel plate that anchored the model to the floor of the water channel The topend of the model shaft was connected to a rotary torque sensor with digital encoder(Futek TRS705) The torque sensor had a 0ndash20 N mminus1 measurement range with amaximum system error of +0020 rated output (ie +0004 N mminus1) in clockwisetorque and minus0025 rated output (ie minus0005 N mminus1) in counterclockwise torqueAn optically clear cast acrylic sheet approximately 18 m in length and spanningthe width of the channel was suspended to be flush with the free surface in order toeliminate surface distortion A cross-section view of the 3-bladed turbine mounted inthe water channel is shown in figure 2
Dow
nloa
ded
from
htt
psw
ww
cam
brid
geo
rgc
ore
Cal
tech
Lib
rary
on
31 M
ay 2
017
at 1
934
26
sub
ject
to th
e Ca
mbr
idge
Cor
e te
rms
of u
se a
vaila
ble
at h
ttps
ww
wc
ambr
idge
org
cor
ete
rms
htt
ps
doio
rg1
010
17jf
m2
016
862
350 D B Araya T Colonius and J O Dabiri
23 Particle image velocimetry set-upThe wake was surveyed using two-dimensional particle image velocimetry (2-D PIV)which is justified provided that the out-of-plane particle motion is minimized Thiswas achieved in the current set-up by aligning the measurement plane with thesymmetry plane of the model parallel to the free stream and by sampling imagesat a sufficiently fast frame rate The flow was seeded with 100 microm silver-coatedhollow ceramic spheres (Potters Industries LLC) which were illuminated by a 1 W532-nm DPSS laser system (Laserglow Technologies) The majority of the velocitymeasurements were taken in a plane parallel to the midheight of each model indicatedin figure 2 as the lsquoXY-planersquo A plano-concave cylindrical lens with a minus39 mm focallength was mounted directly in front of the laser to create a collimated laser sheet inthis plane End plates typically used to minimize three-dimensional effects were notused in the present study Instead the three-dimensionality of the flow was assessedusing PIV measurements in a vertical plane parallel to the central shaft of each modellabelled in figure 2 as the lsquoXZ-planersquo The procedure for the PIV measurements isdescribed in the next section
24 Experimental procedureIn all of the experimental runs the nominal free stream flow speed was U0 =0253 msminus1 ie a Reynolds number based on diameter of ReD asymp 08 times 105 (seedetails of the flow speed calibration in Araya amp Dabiri (2015)) This value of U0is used throughout for normalization purposes As a check for consistency the flowspeed was actively monitored during each test using a current velocity meter (Swoffermodel 2100) placed upstream of the model
A custom-built infrared (IR) sensor was used to detect the starting orientation ofthe model in each data set The voltage signal from the IR sensor torque sensorand encoder were input into a National Instruments data acquisition (NIDAQ) device(USB-6221) which was controlled by LabView (National Instruments) Using thetransistor-transistor logic (TTL) signal from the encoder the NIDAQ device triggereda high-speed camera (Photron APX-RS) with 1024times 1024 pixel resolution to capturetwo images of the flow every 5 of shaft rotation Each image sequence was takenat 125 Hz In the case of the stationary cylinder pairs of images were captured ata fixed sample rate of 177 Hz A total of 4248 image pairs were captured in asingle experimental run which corresponded to a total of 59 turbine revolutions andapproximately 40 cylinder shedding cycles Additionally each turbine data set wasrepeated yielding a total of 8496 image pairs (118 turbine revolutions) per case Theconditions of each experimental test case are described in sect 26
The images were processed using DaVis imaging software (LaVision) to obtain the2-D PIV measurements The image planes were calibrated using a ruler and a wiremesh with equally spaced 254 cm squares A multi-pass PIV algorithm was used witha decreasing interrogation window size and 50 window overlap Two passes weremade with 32 times 32-pixel interrogation windows followed by another two passes madewith 16 times 16-pixel windows the latter of which corresponded to a vector spacing of12 cm in the XY-plane and 07 cm in the XZ-plane A median filter with universaloutlier detection was used to remove spurious vectors output by the PIV algorithmthese were subsequently replaced by interpolation
Figure 3 shows a top view schematic of the nominal position of the 3-bladed turbinealong with the corresponding PIV measurement windows in the XY-plane labelled1ndash9 For all PIV measurements the camera remained fixed and either the optics or
Dow
nloa
ded
from
htt
psw
ww
cam
brid
geo
rgc
ore
Cal
tech
Lib
rary
on
31 M
ay 2
017
at 1
934
26
sub
ject
to th
e Ca
mbr
idge
Cor
e te
rms
of u
se a
vaila
ble
at h
ttps
ww
wc
ambr
idge
org
cor
ete
rms
htt
ps
doio
rg1
010
17jf
m2
016
862
Transition to bluff-body dynamics in the wake of vertical-axis wind turbines 351
1
Flow
2 3 4 5 6 7 8 9
X
Y
485D 12D
34D
FIGURE 3 Top view schematic of the nominal turbine position and corresponding PIVwindows (1ndash9) in the XY-plane D= 03 m
X
Z PIVwindow XZ
47D
27D
18D
FIGURE 4 Side view schematic of the PIV measurement window in the XZ-planeD= 03 m
the turbine model was moved to take measurements at different streamwise locationsThis was justified given the dimensions of the facility which had a hydraulic diameterDH of approximately 1 m The furthest upstream turbine position was approximately17 DH from the inlet giving the free stream flow a reasonable adjustment length inall cases Figure 4 shows a schematic of the 3-bladed turbine model relative to thePIV measurements in the XZ-plane Only one streamwise location was assessed in thisplane
During PIV measurements a DC motor (Pittman GM14904S013-R1) connected tothe turbine central shaft was used in some cases to drive the rotation of the modelthese are later referred to as lsquoloadedrsquo cases In the absence of the motor all of theturbines were tested and capable of self-rotating at equal or higher tip-speed ratiosthan any of the cases examined in the experiment Therefore the motor effectivelyacted as a generator in all of the loaded turbine cases where PIV measurementswere taken Earlier experimental work showed that using the motor in this manneras opposed to a purpose-built generator to apply a load to the turbine shaft had noadverse effect on the wake velocity measurements (Araya amp Dabiri 2015) The motorwas controlled by a constant voltage power supply (Mastech HY3005F-3) capable ofproviding 0ndash30 V at 0ndash5 A
25 Turbine and cylinder power coefficient Cp
The conditions for the PIV measurements were varied according to the rotation rate ofthe model and thus the load applied to its central shaft Figure 5 shows measurementsof the average power coefficient Cp for all three turbines and cylinder as the tip-speed ratio (λ) was varied This power coefficient is a measure of the efficiency of
Dow
nloa
ded
from
htt
psw
ww
cam
brid
geo
rgc
ore
Cal
tech
Lib
rary
on
31 M
ay 2
017
at 1
934
26
sub
ject
to th
e Ca
mbr
idge
Cor
e te
rms
of u
se a
vaila
ble
at h
ttps
ww
wc
ambr
idge
org
cor
ete
rms
htt
ps
doio
rg1
010
17jf
m2
016
862
352 D B Araya T Colonius and J O Dabiri
0
ndash04
04
ndash0805 10 15 20 25 30
FIGURE 5 Measured values of Cp for the 2-bladed VAWT (A) 3-bladed VAWT (E)5-bladed VAWT (lowast) and cylinder () Error bars indicate one standard deviation in themeasured value of Cp Dashed vertical lines indicate the PIV measurement conditions forthe turbines when the shaft is load free
power conversion ie the relative rate of kinetic energy extracted from the flow It isdefined as
Cp = P12ρU3
0A (22)
where P is the average power (W) or rate of shaft work done by the fluid on themodel A is the projected swept area (m2) of the model ρ is the fluid density (kg mminus3)and U0 is the free stream flow speed (m sminus1) The average power was estimated fromthe torque and encoder measurements as P=Tω where T and ω are the instantaneoustorque (Nm) and angular velocity (rad sminus1) respectively The trends in the measuredpower curves for the turbines are consistent with numerical predictions by Roh ampKang (2013) for a straight-bladed VAWT with varying solidity eg decreasing solidityyields a zero crossing in Cp at a higher λ Additionally the relatively large standarddeviation of Cp among the turbines indicated by the error bars is characteristic ofthe fluctuating torque produced by VAWTs which is more pronounced in 2-bladedVAWTs due to the alignment of the torque produced by the blades (Sutherland Bergamp Ashwill 2012)
For Cp gt 0 energy is extracted from the flow on average as in the case of anoperational VAWT Conversely Cp lt 0 suggests that on average energy is added tothe flow This is clearly indicated by the Cp measurements for the rotating cylinderwhich are always negative since torque must be continuously supplied to sustain itsrotation For the turbines however this interpretation is convoluted by torque lossesnot accounted for in the measured values of Cp a more complete discussion is givenin Araya amp Dabiri (2015) In practice frictional losses are always present in theflow meaning that some small amount of power must be extracted from the flow tomaintain steady state turbine rotation even when no shaft load is applied
Dow
nloa
ded
from
htt
psw
ww
cam
brid
geo
rgc
ore
Cal
tech
Lib
rary
on
31 M
ay 2
017
at 1
934
26
sub
ject
to th
e Ca
mbr
idge
Cor
e te
rms
of u
se a
vaila
ble
at h
ttps
ww
wc
ambr
idge
org
cor
ete
rms
htt
ps
doio
rg1
010
17jf
m2
016
862
Transition to bluff-body dynamics in the wake of vertical-axis wind turbines 353
Model Solidity σ Shaft load condition λ
5-bladed turbine 053 Load free 1235-bladed turbine 053 Loaded 1013-bladed turbine 032 Load free 1633-bladed turbine 032 Loaded 1413-bladed turbine 032 Loaded 1202-bladed turbine 021 Load free 1952-bladed turbine 021 Loaded 1612-bladed turbine 021 Loaded 122
Cylinder 1 Load free 0
TABLE 1 PIV measurement conditions
26 PIV measurement conditionsPIV measurements were conducted for the conditions shown in table 1 Theseconditions corresponded to both load-free (ie Cp asymp 0) and loaded-shaft conditions(ie Cp gt 0) where the load here refers exclusively to shaft torque not axial thrustFor the load-free shaft conditions a comparison was made among the wakes ofthe four models corresponding to the four model solidities σ For the loaded-shaftconditions a comparison was made among the wakes of the three turbines while theaverage rotation rate was held fixed at λ = 12 and for each turbine while λ wasvaried
27 Calculation of wake statisticsThe steady characteristics of the wake were evaluated using the time average of thestreamwise component of velocity from the PIV measurements denoted as U Wakedynamics was evaluated using spectral analysis and proper orthogonal decomposition(POD) of both the streamwise (x) and spanwise (y) fluctuating components of themeasured velocity ie uprime and vprime respectively Phase-averaged vorticity ωz was alsocalculated from the phase-locked velocity measurements
A sample of the PIV measurement of U is shown in figure 6 Additionally asegment of the time series of vprime the velocity component used in the spectral analysisis shown in figure 7 This time series was taken from a single point in the flowindicated in figure 6 by a solid black circle Also shown in figure 7 is a dotted linewhich is a temporal (spline) interpolation of the measured velocity with a uniformvector spacing in time This interpolation was a necessary step for the spectraland POD analyses which are more straightforward to implement with a constantsampling rate The PIV measurements were not equally distributed in time becausethey were phase locked to the turbine rotation which fluctuated due to the unsteadyhydrodynamic torque However a temporal interpolation was possible because thecamera trigger signal had a known sample rate of 2500 Hz Thus each TTL pulseto the camera indicated the time stamp for the corresponding velocity field
The power spectra for the spanwise component of the velocity fluctuations (vprime) werecomputed via the method of Welch (1967) For a given streamwise location (x) thespanwise point (y) was selected based on where the root-mean-square (rms) of thevelocity fluctuations was a maximum thus indicating the most energetic point alongthe span In computing the spectra a rectangular window function was used with 50 overlap between windows the frequency resolution was approximately 004 Hz
Dow
nloa
ded
from
htt
psw
ww
cam
brid
geo
rgc
ore
Cal
tech
Lib
rary
on
31 M
ay 2
017
at 1
934
26
sub
ject
to th
e Ca
mbr
idge
Cor
e te
rms
of u
se a
vaila
ble
at h
ttps
ww
wc
ambr
idge
org
cor
ete
rms
htt
ps
doio
rg1
010
17jf
m2
016
862
354 D B Araya T Colonius and J O Dabiri
05
0
ndash05
ndash10
ndash15
10
15
14 22 30
0
ndash03
05
Flow
PIV window 4
10
14
FIGURE 6 (Colour online) Contours of UU0 for the 3-bladed turbine under load-freeshaft conditions (λ = 163) the zero-level contour is drawn in white Measurementscorrespond to PIV window 4 (cf figure 3) The black circle corresponds to the locationof the sample time series in figure 7 Coordinate axes are normalized by the rotordiameter D
05
0
ndash05
0 2 4 6 8 10 12 14 16 18 20
t (s)
FIGURE 7 Time series segment of the measured (mdash) and interpolated (middot middot middot) values ofvprimeU0 corresponding to the sample point in figure 6
28 Proper orthogonal decompositionThe POD was used to identify the dominant spatial features of the spatio-temporallyevolving wake A thorough review of the method within the context of the analysisand modelling of turbulent flows is given by Berkooz Holmes amp Lumley (1993) Thebasic concept of POD is to decompose a dataset into a set of orthogonal modes thatare optimal in the sense that the error in projecting the data onto a finite number ofmodes is minimized In POD often a small number of modes suffice to describe alarge portion of the variance of the data
Many variants of POD have been used to extract coherent structures in turbulentflows The most common approach finds a set of spatial time-invariant PODmodes and their time-varying scalar modal coefficients The modes are given byeigenfunctions of the correlation tensor between observations at different points in
Dow
nloa
ded
from
htt
psw
ww
cam
brid
geo
rgc
ore
Cal
tech
Lib
rary
on
31 M
ay 2
017
at 1
934
26
sub
ject
to th
e Ca
mbr
idge
Cor
e te
rms
of u
se a
vaila
ble
at h
ttps
ww
wc
ambr
idge
org
cor
ete
rms
htt
ps
doio
rg1
010
17jf
m2
016
862
Transition to bluff-body dynamics in the wake of vertical-axis wind turbines 355
space (and different variables) and efficient computation of the modes follows fromthe method of snapshots (Sirovich 1987) This method has been applied in recentstudies that examine wind turbine wakes (eg Andersen Soslashrensen amp Mikkelsen 2013VerHulst amp Meneveau 2014 Hamilton Tutkun amp Cal 2015)
The approach we employ here is lsquofrequency-spacersquo or lsquospectralrsquo POD (eg Picardamp Delville 2000) The advantage of the spectral POD approach for our case isthat distinct modes associated with disparate frequencies such as the blade-passingfrequency and the wake vortex shedding frequency can be obtained independent oftheir potentially disparate energy levels Relevant to stationary flows the spectralPOD problem seeks an orthonormal basis for velocity fluctuations
v(x ω)=Nsum
k=1
akφk(x ω) (23)
where v is the (Fourier transformed in time) two-dimensional velocity fluctuationvector in the plane of the PIV measurements and the vector POD modes φk areconstructed from N observations of the vector field v
(k)(x ω) k = 1 2 N as
eigenvectors ofintC(x xprime ω)φj(xprime ω) dxprime = λj(ω)φj(x ω) j= 1 2 N (24)
where C is the ensemble-averaged cross-spectral density (CSD) tensor
C(x xprime ω)= 1N
Nsumk=1
v(k)(x ω)otimes v
(k)(xprime ω) (25)
Note that this tensor involves correlations between each of the two velocitycomponents at each point in space and every other The velocity field and volumeintegral are then discretized on the PIV grid to yield an algebraic eigenvalue problem
C(ω)Mφ(ω)= λ(ω)φ(ω) (26)
where the elements of the diagonal matrix M are the cell volumes of the PIV gridThe CSD matrix C may be written C = (1N)XX H where for a given frequency ωX is a data matrix whose columns represent the N different realizations and whoserows correspond to each velocity component and each spatial location on the PIVgrid (in any convenient ordering) Consideration of the rank of C permits one to findthe eigenvectors corresponding to non-zero eigenvalues more efficiently by solvingthe smaller N times N eigenvalue problem (1N)X HMXψ = λψ and then reconstructingφ = Xψ Note that the trace of (1N)X HMX is approximately equal to the turbulentkinetic energy (TKE) contained in the frequency bin surrounding ω when integratedover the plane of the PIV measurement
Numerically we estimate the CSD matrix using the Welch periodogram methodusing the same parameters as were used for the power spectra mentioned in theprevious section Specifically we generate realizations of the frequency-space velocityfield using a rectangular window function on overlapping segments of the timeseries and then taking a discrete Fourier transform on each segment with a frequencyresolution of approximately 004 Hz The overlap was chosen as 50 The eigenvalueproblem (26) is then solved frequency by frequency using the method discussed
Dow
nloa
ded
from
htt
psw
ww
cam
brid
geo
rgc
ore
Cal
tech
Lib
rary
on
31 M
ay 2
017
at 1
934
26
sub
ject
to th
e Ca
mbr
idge
Cor
e te
rms
of u
se a
vaila
ble
at h
ttps
ww
wc
ambr
idge
org
cor
ete
rms
htt
ps
doio
rg1
010
17jf
m2
016
862
356 D B Araya T Colonius and J O Dabiri
above Approximate independence of the resulting eigenfunctions and eigenvalueswas established by varying these parameters of the estimation within the constraintsof the available data
In the present experiments the temporal PIV data were collected in differentspatial windows in independent experiments The POD modes must therefore befound independently for each window If we have reached statistical convergencethen we expect the POD modes (at a given frequency) to match reasonably well nearthe boundaries of each PIV window apart from a single complex constant In whatfollows the constant (amplitude and phase) was chosen manually in order to visuallyalign contour plots of the POD modes The reasonable match we obtain at boundariesof the PIV windows (cf figure 12) justifies the approach and shows that our modesare indeed reasonably well converged
3 Results and discussion31 PIV measurements for load-free shaft conditions
Time-averaged PIV measurements of the streamwise component of velocity areshown in figure 8 for the load-free shaft conditions (cf table 1) The velocitymeasurements have been normalized by the free stream speed U0 and the coordinateaxes by the diameter D The contour levels are the same in each plot and range invalues of UU0 from minus03 to 14 Discontinuities in the contours can be observedmainly at the boundaries of consecutive PIV windows which are attributable toexperimental error As described in sect 24 the data collected in each PIV windowwere a different realization of the same experiment Between realizations eitherthe optics or the turbine model was manually moved to a new streamwise locationwhich introduced a small amount of error in the physical location of the boundarybetween PIV windows Additionally although statistical convergence was checked forthe measurement of mean velocity in each PIV window further error was introducedby variable experimental conditions when different PIV windows were measuredon different days The zero-level contour is shown in white Within the immediatevicinity of the cylinder and turbine the large white region in the contour plot is anartefact of shadows created by the model and support structure However downstreamof the model this zero-level contour indicates a region of flow recirculation presentin each of the four cases shown
For the cylinder this recirculation region is attached to the points of separationfrom the surface of the model For the 3- and 5-bladed turbine the recirculationregion is qualitatively similar to that of the cylinder but is detached from the modeland is angled toward the negative y-axis due to the turbine rotation There is alsoa recirculation region present in the wake of the 2-bladed turbine but it is distinctin form to that of the other models extending from approximately tangent to theblade path to just beyond 2D downstream of the turbine centre The presence ofa recirculation region in the wake of each of the turbine models was found to bea function of λ with decreasing λ causing the region to change in size and insome cases disappear completely This trend can be readily observed in comparingthe contour plots of the current section with those of the remaining cases given infigure 29 of the appendix In all cases there is a notable asymmetry of the VAWTwake This is attributed to the stronger shear layer that forms on the side of theturbine where the blades are advancing upstream A surprising result however is thatthe deficit in the wake velocity recovers faster with increasing model solidity (σ )with the fastest recovery achieved by the stationary cylinder there is also a broaderwake with decreasing solidity
Dow
nloa
ded
from
htt
psw
ww
cam
brid
geo
rgc
ore
Cal
tech
Lib
rary
on
31 M
ay 2
017
at 1
934
26
sub
ject
to th
e Ca
mbr
idge
Cor
e te
rms
of u
se a
vaila
ble
at h
ttps
ww
wc
ambr
idge
org
cor
ete
rms
htt
ps
doio
rg1
010
17jf
m2
016
862
Transition to bluff-body dynamics in the wake of vertical-axis wind turbines 357
05 0
ndash05 ndash10 ndash15
1015
ndash2ndash4 0 2 4 6 8 10 12
0
ndash03
05
10
14
05 0
ndash05 ndash10 ndash15
1015
ndash2ndash4 0 2 4 6 8 10 12
0
ndash03
05
10
14
05 0
ndash05 ndash10 ndash15
1015
ndash2ndash4 0 2 4 6 8 10 12
0
ndash03
05
10
14
05 0
ndash05 ndash10 ndash15
1015
ndash2ndash4 0 2 4 6 8 10 12
0
ndash03
05
10
14
(a)
(b)
(c)
(d)
FIGURE 8 (Colour online) Contours of UU0 measured under load-free shaft conditionsfor the (a) 2-bladed VAWT (b) 3-bladed VAWT (c) 5-bladed VAWT and (d) cylinderAirfoil cross-sections for the turbines are drawn to scale
It is important to emphasize that the turbine cases shown in figure 8 were fora turbine free to rotate without an external torque applied to its shaft ie Cp asymp 0From momentum theory (eg Hau 2005) the turbine power coefficient is given asCp = 4a(1 minus a)2 where a is the axial induction factor defined as a equiv 1 minus UrU0where Ur is the speed of the flow at the rotor Similarly the turbine thrust coefficientCT is given as CT = 4a(1 minus a) This implies that as Cp tends toward zero (withincreasing λ) as in figure 8 the induction factor tends toward 1 and CT tends towardzero Empirically the thrust coefficient does not follow momentum theory for largeinduction factor (agt 05) but rather increases above 1 for large a in HAWT wakes(eg Buhl 2005 Leishman 2006 Hansen 2008) This suggests that the measurementsshown in figure 8 are for a rotor with large axial thrust and implies a lsquoturbulent wakestatersquo (eg Eggleston amp Stoddard 1987)
Figure 9 shows the velocity power spectra computed at five different streamwiselocations for each of the cases shown in figure 8 The frequency along the abscissain these plots has been normalized to give the standard definition of the Strouhal
Dow
nloa
ded
from
htt
psw
ww
cam
brid
geo
rgc
ore
Cal
tech
Lib
rary
on
31 M
ay 2
017
at 1
934
26
sub
ject
to th
e Ca
mbr
idge
Cor
e te
rms
of u
se a
vaila
ble
at h
ttps
ww
wc
ambr
idge
org
cor
ete
rms
htt
ps
doio
rg1
010
17jf
m2
016
862
358 D B Araya T Colonius and J O Dabiri
10ndash3
10ndash4
10ndash5
10ndash6
10ndash7
10010ndash1 101
10ndash3
10ndash4
10ndash5
10ndash6
10ndash7
10010ndash1 101
10ndash3
10ndash4
10ndash5
10ndash6
10ndash7
10010ndash1 101
10ndash3
10ndash4
10ndash5
10ndash6
10ndash7
10010ndash1 101
158026 128 027
024 201 020
(a) (b)
(c) (d )
FIGURE 9 Single-point spectra of the velocity fluctuations (vprime) taken at XD = 09(mdashmdash) XD = 17 (ndash ndash ndash) XD = 33 (ndash - ndash -) XD = 73 (- - - - -) and XD = 100(middot middot middot middot middot middot) The spectra correspond to load-free shaft conditions for the (a) 2-bladed VAWT(b) 3-bladed VAWT (c) 5-bladed VAWT and (d) cylinder Dotted vertical lines correspondto the selected near- and far-wake frequencies of the maximum amplitude in the spectra
number for cylinder vortex shedding ie St = fDU0 In the case of the cylinder(cf figure 9d) the streamwise evolution of the spectra shows a dominant peak nearSt asymp 02 that forms and eventually decays with downstream distance in agreementwith existing literature (eg Roshko 1961) For the turbines however there is abi-modal behaviour in the evolution of the velocity spectra with downstream distanceIn the near-wake region of the turbine there is a sharp spectral peak that correspondsto the blade-passing frequency This is consistent with previous investigations ofthe near-wake region of a VAWT which has been shown to be dominated bybladendashvortex dynamics (see eg Tescione et al 2014 Bachant amp Wosnik 2015)Further downstream however the spectra reveal a transition that occurs in the wakewhere the dominant velocity fluctuations shift to a lower frequency of St asymp 026roughly independent of the blade-passing frequency Additionally at its maximumthe amplitude of the far-wake peak reaches very near to that of the near-wake peakwhich suggests that there is a dynamic shift in the energy content of the flow beforemuch of it can be lost to viscous dissipation
An analysis of the dominant POD mode illustrates the spatio-temporal variationof the velocity fluctuations in the wake Figure 10 shows the power spectral densityof the amplitude of the dominant POD mode across a range of frequencies forthe cases shown in figure 8 This approach to the POD analysis was described
Dow
nloa
ded
from
htt
psw
ww
cam
brid
geo
rgc
ore
Cal
tech
Lib
rary
on
31 M
ay 2
017
at 1
934
26
sub
ject
to th
e Ca
mbr
idge
Cor
e te
rms
of u
se a
vaila
ble
at h
ttps
ww
wc
ambr
idge
org
cor
ete
rms
htt
ps
doio
rg1
010
17jf
m2
016
862
Transition to bluff-body dynamics in the wake of vertical-axis wind turbines 359
10ndash4
10ndash5
10ndash6
10ndash7
10010ndash1
10ndash4
10ndash5
10ndash6
10ndash7
10010ndash1
10ndash4
10ndash5
10ndash6
10ndash7
10010ndash1 10010ndash1
10ndash3
10ndash4
10ndash5
10ndash6
158027 128 023
026 201
020
(a) (b)
(c) (d)
FIGURE 10 Spectra of the amplitude of the dominant POD mode for the velocityfluctuations under load-free shaft conditions for the (a) 2-bladed VAWT (b) 3-bladedVAWT (c) 5-bladed VAWT and (d) cylinder The spectra correspond to PIV window 3(E) 4 (times) 5 (+) 6 (lowast) 7 () 8 (6) and 9 (C) Dotted vertical lines correspond to theselected near- and far-wake frequencies of the maximum amplitude in the spectra
in sect 27 Each spectrum corresponds to one of the PIV windows In comparingthe local and global spectra of figures 9 and 10 respectively it appears that thedominant POD mode captures the bluff-body oscillations of the cylinder wake andthe bi-modal oscillations present in the VAWT wake Figure 11 shows a comparisonof the phase-averaged vorticity field with contours of the dominant POD mode atthe blade-passing frequency for each of the three turbines Since the angular positionof the turbine blades in each case is accurately represented in the figure the vortexstructures that are clearly present in the phase-averaged vorticity contours offer adirect interpretation of the structures present in the contours of the spatial modeMore specifically a pair of positive (red) and negative (blue) structures in the spatialmode contour is representative of the spatial extent of a coherent vortex structurein the turbine wake The purpose of including figure 11 is to emphasize that thecoherent structures that we observe from the contours of the dominant POD mode ata given frequency can be interpreted directly as coherent vortices in the flow whichis not always a result of the POD analysis (Kostas Soria amp Chong 2005)
Figures 12 and 13 show contours of the spanwise (vprime) and streamwise (uprime)components of the dominant POD mode at the far-wake peak frequency (cf figure 10)respectively for the same flow conditions as before There is a strong resemblancebetween the spatial mode structure in far wake of the VAWT to that of the cylinderespecially as the turbine solidity (σ ) is increased The structure of the cylinder mode
Dow
nloa
ded
from
htt
psw
ww
cam
brid
geo
rgc
ore
Cal
tech
Lib
rary
on
31 M
ay 2
017
at 1
934
26
sub
ject
to th
e Ca
mbr
idge
Cor
e te
rms
of u
se a
vaila
ble
at h
ttps
ww
wc
ambr
idge
org
cor
ete
rms
htt
ps
doio
rg1
010
17jf
m2
016
862
360 D B Araya T Colonius and J O Dabiri
10 2 3 4 5
10 2 3 4 5
10 2 3 4 5 10 2 3 4 5
10 2 3 4 5
10 2 3 4 5
05 0
ndash05 ndash10 ndash15
1015
05 0
ndash05 ndash10 ndash15
1015
05 0
ndash05 ndash10 ndash15
1015
05 0
ndash05 ndash10 ndash15
1015
05 0
ndash05 ndash10 ndash15
1015
05 0
ndash05 ndash10 ndash15
1015
ndash1
0
1
2
ndash2
ndash1
0
1
2
ndash2
ndash1
0
1
2
ndash2
0
5
ndash5
0
5
ndash5
0
5
ndash5
(a) (b)
(c) (d )
(e) ( f )
FIGURE 11 (Colour online) (ace) Contours of the phase-averaged vorticity for the(a) 2-bladed VAWT (c) 3-bladed VAWT and (e) 5-bladed VAWT (bdf ) Contours ofthe spanwise component (vprime) of the dominant POD mode for the velocity fluctuationsat the blade-passing frequency for the (b) 2-bladed VAWT (d) 3-bladed VAWT and( f ) 5-bladed VAWT Airfoil cross-sections and angular positions are accurately representedin the figure The dashed circle in each plot is for reference and corresponds to the turbinediameter
is consistent with what has been previously reported (see eg Feng Wang amp Pan2011) and the alternating pattern of vortices shed from the cylinder can again beinferred by the pairs of structures within the spatial mode contour ie a single vortexstructure is represented by two spatial mode structures with alternating sign Thisimplies that the far wake of the VAWT is characterized by large-scale structures thatare typically periodic in both space and time and alternate in sign akin to a bluffbody This bluff-body mode tends to be stronger in amplitude on the windward sideof the turbine ie where the stronger shear layer is formed indicating that it islikely caused by an underlying shear-layer instability It also appears as though thedevelopment of these far-wake structures in the VAWT wake is delayed downstreamas the turbine solidity is reduced However in these load-free shaft conditions therotation rate of the turbine was uncontrolled which adds an additional variable toconsider in the analysis These variables are decoupled in the following section
Dow
nloa
ded
from
htt
psw
ww
cam
brid
geo
rgc
ore
Cal
tech
Lib
rary
on
31 M
ay 2
017
at 1
934
26
sub
ject
to th
e Ca
mbr
idge
Cor
e te
rms
of u
se a
vaila
ble
at h
ttps
ww
wc
ambr
idge
org
cor
ete
rms
htt
ps
doio
rg1
010
17jf
m2
016
862
Transition to bluff-body dynamics in the wake of vertical-axis wind turbines 361
0 2 4 6 8 10 12
0 2 4 6 8 10 12
0 2 4 6 8 10 12
0 2 4 6 8 10 12
05
0
ndash05
ndash10
ndash15
10
15
05
0
ndash05
ndash10
ndash15
10
15
05
0
ndash05
ndash10
ndash15
10
15
05
0
ndash05
ndash10
ndash15
10
15
ndash1
0
1
2
ndash2
ndash1
0
1
2
ndash2
ndash1
0
1
2
ndash2
ndash1
0
1
2
ndash2
(a)
(b)
(c)
(d)
FIGURE 12 (Colour online) Contours of the spanwise component (vprime) of the dominantPOD mode for the velocity fluctuations at the far-wake peak frequency (cf figure 10) forthe (a) 2-bladed VAWT (b) 3-bladed VAWT (c) 5-bladed VAWT (d) and cylinder Airfoilcross-sections and angular positions are accurately represented in the figure The dashedcircle in the turbine plots is for reference only and corresponds to the turbine diameterThe solid circle represents the cylinder diameter D
Dow
nloa
ded
from
htt
psw
ww
cam
brid
geo
rgc
ore
Cal
tech
Lib
rary
on
31 M
ay 2
017
at 1
934
26
sub
ject
to th
e Ca
mbr
idge
Cor
e te
rms
of u
se a
vaila
ble
at h
ttps
ww
wc
ambr
idge
org
cor
ete
rms
htt
ps
doio
rg1
010
17jf
m2
016
862
362 D B Araya T Colonius and J O Dabiri
0 2 4 6 8 10 12
0 2 4 6 8 10 12
0 2 4 6 8 10 12
0 2 4 6 8 10 12
05
0
ndash05
ndash10
ndash15
10
15
05
0
ndash05
ndash10
ndash15
10
15
05
0
ndash05
ndash10
ndash15
10
15
05
0
ndash05
ndash10
ndash15
10
15
ndash1
0
1
2
ndash2
ndash1
0
1
2
ndash2
ndash1
0
1
2
ndash2
ndash1
0
1
2
ndash2
(a)
(b)
(c)
(d)
FIGURE 13 (Colour online) Contours of the streamwise component (uprime) of the dominantPOD mode for the velocity fluctuations at the far-wake peak frequency (cf figure 10) forthe (a) 2-bladed VAWT (b) 3-bladed VAWT (c) 5-bladed VAWT (d) and cylinder Airfoilcross-sections and angular positions are accurately represented in the figure The dashedcircle in the turbine plots is for reference only and corresponds to the turbine diameterThe solid circle represents the cylinder diameter D
Dow
nloa
ded
from
htt
psw
ww
cam
brid
geo
rgc
ore
Cal
tech
Lib
rary
on
31 M
ay 2
017
at 1
934
26
sub
ject
to th
e Ca
mbr
idge
Cor
e te
rms
of u
se a
vaila
ble
at h
ttps
ww
wc
ambr
idge
org
cor
ete
rms
htt
ps
doio
rg1
010
17jf
m2
016
862
Transition to bluff-body dynamics in the wake of vertical-axis wind turbines 363
0 2 4 6 8 10 12
0 2 4 6 8 10 12
0 2 4 6 8 10 12
05
0
ndash05
ndash10
ndash15
10
15
05
0
ndash05
ndash10
ndash15
10
15
05
0
ndash05
ndash10
ndash15
10
15
ndash1
0
1
2
ndash2
ndash1
0
1
2
ndash2
ndash1
0
1
2
ndash2
(a)
(b)
(c)
FIGURE 14 (Colour online) Contours of the spanwise component (vprime) of the dominantPOD mode for the velocity fluctuations at both the near- and far-wake peak frequencies(cf figure 10) for the (a) 2-bladed VAWT (b) 3-bladed VAWT and (c) 5-bladed VAWT Ineach case λ asymp 12 Airfoil cross-sections and angular positions are accurately representedin the figure The dashed circle in the turbine plots is for reference only and correspondsto the turbine diameter
32 PIV measurements for loaded-shaft conditionsTo separate the effects of increasing the turbine solidity from varying its rotation bothwere evaluated independently The same procedure was followed as before but onlythe results of the POD mode analysis are presented here the corresponding spectra aregiven in figure 30 of the appendix Figure 14 shows contours of the spanwise velocitycomponent of the dominant POD mode while λ was held fixed and σ was varied Notethat in this figure the dominant mode at two distinct frequencies have been superposedtogether ie the dominant frequency in the near and far wake The combination ofthese two temporal frequencies gives a broad look at the dominant spatial structureof the evolving wake Immediately apparent from figure 14 is that increasing σ leadsto an earlier transition to bluff-body oscillations in the VAWT wake Also apparent
Dow
nloa
ded
from
htt
psw
ww
cam
brid
geo
rgc
ore
Cal
tech
Lib
rary
on
31 M
ay 2
017
at 1
934
26
sub
ject
to th
e Ca
mbr
idge
Cor
e te
rms
of u
se a
vaila
ble
at h
ttps
ww
wc
ambr
idge
org
cor
ete
rms
htt
ps
doio
rg1
010
17jf
m2
016
862
364 D B Araya T Colonius and J O Dabiri
0 2 4 6 8 10 12
0 2 4 6 8 10 12
0 2 4 6 8 10 12
05
0
ndash05
ndash10
ndash15
10
15
05
0
ndash05
ndash10
ndash15
10
15
05
0
ndash05
ndash10
ndash15
10
15
ndash1
0
1
2
ndash2
ndash1
0
1
2
ndash2
ndash1
0
1
2
ndash2
(a)
(b)
(c)
FIGURE 15 (Colour online) Contours of the spanwise component (vprime) of the dominantPOD mode for the velocity fluctuations at both the near- and far-wake peak frequencies(cf figure 10) The contours plots correspond to the 3-bladed VAWT with an averagerotation rate of (a) λ = 120 (b) λ = 141 and (c) λ = 163 Airfoil cross-sections andangular positions are accurately represented in the figure The dashed circle in the turbineplots is for reference only and corresponds to the turbine diameter
is that as σ is decreased there is a sharp increase in the strength of the vortices thatare shed from the blades which can be deduced from the larger amplitude and spatialextent of the mode structure
Figure 15 shows contours of the spanwise velocity component of the dominant PODmode for the 3-bladed turbine while its rotation rate was varied from λ asymp 12ndash16As before the dominant mode at the near- and far-wake peak frequency have beensuperposed together Despite the small range of λ a similar shift in transition isobserved among these cases as was when varying the solidity with the transitionoccurring closer to the turbine with increasing λ This suggests the concept of anapparent solidity for the turbine due to both its geometric solidity as well as itsrotation rate which we derive in the following section
Dow
nloa
ded
from
htt
psw
ww
cam
brid
geo
rgc
ore
Cal
tech
Lib
rary
on
31 M
ay 2
017
at 1
934
26
sub
ject
to th
e Ca
mbr
idge
Cor
e te
rms
of u
se a
vaila
ble
at h
ttps
ww
wc
ambr
idge
org
cor
ete
rms
htt
ps
doio
rg1
010
17jf
m2
016
862
Transition to bluff-body dynamics in the wake of vertical-axis wind turbines 365
33 Dynamic solidity of a VAWTThe effects of geometric solidity and rotation rate can be combined using the conceptof a lsquodynamic solidityrsquo In the limit of λ 1 there is little time for the incident flowto react to the passage of the turbine blades resulting in the turbine rotor appearing tothe flow as like a solid cylinder Conversely when λ=0 the interaction of the incidentflow with the turbine blades is indeterminate since it depends on the orientation ofthe rotor However for a given orientation a larger geometric solidity (σ ) means thatthe turbine rotor approaches the geometry of a cylinder and thus would interact withthe flow accordingly
One way to quantify these limits is to formulate a dynamic solidity parameter σDusing the characteristic scales of the flow We first define a characteristic length scalel as the sum of the gaps in the circumference of the turbine rotor ie l=πD(1minus σ)Using this we define a VAWT time scale tV as
tV = lnU0λ
(31)
where n is the number of blades This represents the time required for the turbineblades to collectively sweep through the distance to close the gaps between theblades Next we define a convective time scale tconv = lU0 which represents theamount of time required for a free stream fluid particle to travel the same distanceThe ratio tVtconv represents the percentage of convection time required to close thegaps between the blades with a smaller percentage resulting in the turbine appearingmore solid to the incident flow We multiply this ratio of time scales by a geometricfactor Rc where R is the turbine radius and c is the chord length to incorporatethe rotor geometry and subtract this quantity from unity to give the definition ofdynamic solidity as
σD = 1minus Rc
tV
tconv= 1minus 1
2πσλ (32)
Note that this definition follows the aforementioned limiting behaviours For a givenrotor geometry and λ 1 σD asymp 1 corresponding to the geometric solidity of a solidcylinder (σ = 1) When λ = 0 σD is indeterminate Similarly if λ lt 12πσ whichis practically insignificant then σD lt 0 which loses physical meaning However forλgt12πσ σD increases monotonically with increasing either σ or λ Figure 16 showshow σD varies with λ and σ for a turbine with fixed chord length (c = 01 m) androtor diameter (D = 03 m) as in the present experiment Also shown in the figureare the conditions measured during the experiment indicated by symbols The relationbetween σD and the transition to bluff-body dynamics in the VAWT wake is exploredin the next section
34 Effect of dynamic solidity on wake transitionFigure 17 shows a plot of Strouhal number versus normalized downstream distancefor all of the cases shown in figure 16 with the addition of the stationary cylindermeasurements Each point in figure 17 indicates the non-dimensional frequency of themaximum amplitude in a single velocity spectrum denoted as Stmax Each spectrumwas computed at a single point in the flow where the rms of the spanwise velocityfluctuations was a maximum This is a convenient way to express all of the dataat once and it illustrates what has already been shown for a few cases eg the bi-modal behaviour of the VAWT wake As the near-wake vortices decay the transition
Dow
nloa
ded
from
htt
psw
ww
cam
brid
geo
rgc
ore
Cal
tech
Lib
rary
on
31 M
ay 2
017
at 1
934
26
sub
ject
to th
e Ca
mbr
idge
Cor
e te
rms
of u
se a
vaila
ble
at h
ttps
ww
wc
ambr
idge
org
cor
ete
rms
htt
ps
doio
rg1
010
17jf
m2
016
862
366 D B Araya T Colonius and J O Dabiri
05 10 15 20
10
0
02
04
06
08
FIGURE 16 (Colour online) Dynamic solidity σD variation with λ and σ Measuredvalues are shown with colours and symbols that correspond to the following the 2-bladedturbine for λ = 195 (times) 161 ( (blue)) and 122 (E (blue)) the 3-bladed turbine forλ = 163 ( (black)) 141 (A) and 120 (E (black)) the 5-bladed turbine for λ = 123(E (red)) and λ= 101 (+)
1 2 3 4 5 6 7 8 9 10 11 12
05
0
10
15
20
FIGURE 17 (Colour online) Normalized frequency of the maximum amplitude in thevelocity spectra Stmax Colours and symbols correspond to the following the 2-bladedturbine for λ = 195 (times) 161 ( (blue)) and 122 (E (blue)) the 3-bladed turbine forλ = 163 ( (black)) 141 (A) and 120 (E (black)) the 5-bladed turbine for λ = 123(E (red)) and λ = 101 (+) and the stationary cylinder (u) Downstream distance X isnormalized by the model diameter D The horizontal dashed line corresponds to Stmax =02 Vertical dashed lines correspond to the location of the streamwise transition points ineach case ie (XD)transition
to bluff-body oscillations in the far wake is indicated in figure 17 by the collapseof the data toward St= 02 indicated by the horizontal dashed line The start of thewake transition in each case is located at (XD)transition indicated by vertical dashedlines in the figure Each (XD)transition location is given by the furthest downstreampoint where the frequency of the dominant spanwise velocity fluctuations is equal to
Dow
nloa
ded
from
htt
psw
ww
cam
brid
geo
rgc
ore
Cal
tech
Lib
rary
on
31 M
ay 2
017
at 1
934
26
sub
ject
to th
e Ca
mbr
idge
Cor
e te
rms
of u
se a
vaila
ble
at h
ttps
ww
wc
ambr
idge
org
cor
ete
rms
htt
ps
doio
rg1
010
17jf
m2
016
862
Transition to bluff-body dynamics in the wake of vertical-axis wind turbines 367
04 06 08 10
05
0
10
15
20
25
30
FIGURE 18 Linear correlation (R2 = 094) between the streamwise location of waketransition ie (XD)transition and dynamic solidity σD
the blade-passing frequency Further downstream of this point there was consistentlya sharp decrease in the frequency of the dominant velocity fluctuations Physicallythis means that (XD)transition marks the streamwise point in the flow where the bladevortices have decayed to the point where they no longer account for the most energeticfluctuations in the flow and a transition to bluff-body oscillations begins to dominatethe wake dynamics The scatter of the data in the far wake is due in part to thespectral resolution which was St asymp plusmn005 for all cases limited by the sample sizeAdditionally the slight increase away from St=02 is speculated to be an effect of theVAWTrsquos rotation In rotating cylinder experiments Lam (2009) observed an increasein the vortex shedding frequency from St= 018 to 029 as the cylinderrsquos rotation wasincreased from λ= 0 to 168
It was found that there exists a strong correlation between the dynamic solidityσD and the downstream transition location (XD)transition deduced from figure 17Figure 18 shows this correlation along with a linear regression fit to the data pointsNote that the transition location for the cylinder is defined to be (XD)transition equiv 0which can be thought of as a transition to bluff-body oscillations that immediatelydominates the wake dynamics The linear regression of figure 18 is referred to insubsequent sections and is given as the following
(XD)transition = 478minus 493σD (33)
When the abscissa of each case in figure 17 is normalized by (XD)transition given by(33) and the ordinate axis by the non-dimensional blade-passing frequency in eachcase Stblade defined as
Stblade = fbladeDU0=(
nU0λ
πD
)DU0= nλ
π (34)
the result is a collapse of the data in the near wake and alignment of the start offar-wake transition This is shown in figure 19 The implication of this finding is thatthe downstream distance at which point the VAWT wake begins to transition to astate dominated by bluff-body dynamics ie Xtransition can be predicted using a simplerelation between the turbine geometry and its kinematics which can be explicitlywritten as the following
Xtransition =D(478minus 493σD) (35)
Dow
nloa
ded
from
htt
psw
ww
cam
brid
geo
rgc
ore
Cal
tech
Lib
rary
on
31 M
ay 2
017
at 1
934
26
sub
ject
to th
e Ca
mbr
idge
Cor
e te
rms
of u
se a
vaila
ble
at h
ttps
ww
wc
ambr
idge
org
cor
ete
rms
htt
ps
doio
rg1
010
17jf
m2
016
862
368 D B Araya T Colonius and J O Dabiri
1 2 3 4 5 6 7 8 9 10 11 12
05
0
10
15
20
FIGURE 19 (Colour online) Ratio of Stmax to the normalized blade-passing frequencyStblade Colours and symbols correspond to the following the 2-bladed turbine for λ= 195(times) 161 ( (blue)) and 122 (E (blue)) the 3-bladed turbine for λ = 163 ( (black))141 (A) and 120 (E (black)) and the 5-bladed turbine for λ= 123 (E (red)) and λ= 101(+) Downstream distance X is normalized by Xtransition given by (35) The vertical dashedline corresponds to XXtransition= 1 the streamwise transition location in the VAWT wake
35 Effect of dynamic solidity on velocity recoveryUntil now the discussion has focused mainly on the behaviour of the wake dynamicsThis section will further explore how this behaviour relates to the recovery of the wakevelocity deficit For a given streamwise location the minimum velocity was found bytaking the minimum across the span (neglecting measurement points near the walls)Figure 20 shows the time average of the minimum streamwise component of velocityUmin measured for the cases corresponding to figure 17 Upon examining figure 20it can be observed that the velocity deficit and its subsequent recovery happen in asimilar manner for all cases However the recovery occurs at a different rate initiallyin each case indicated by the slopes of the curves Additionally we can comparethe absolute minimum of the streamwise component of velocity in the wake takento be the minimum of the velocity profiles shown in figure 20 Figure 21 showsa plot of this absolute minimum velocity versus the dynamic solidity in each caseThere is again a significant correlation between these two variables Physically this isconsistent with the idea that the more solid the turbine appears to the incoming flowthe greater is the initial velocity deficit in the wake
To compare the rate of recovery of the velocity deficit we first rescale the ordinateaxis of figure 20 by the absolute minimum velocity min(Umin) such that all of thecurves have the same initial deficit shown in figure 22 If we then assume that therecovery rate reaches an equilibrium in all cases by 12 D downstream of the turbinecentre (ie the furthest downstream measurement point) and plot this rescaled velocityagainst dynamic solidity the result is shown in figure 23 The strong correlationbetween the final rescaled minimum velocity and the dynamic solidity indicates thatincreasing the dynamic solidity results in a faster rate of recovery of the velocitydeficit in the wake
Since there is a strong correlation between the recovery of the velocity deficitand the dynamic solidity we can rescale the abscissa of the velocity curves by
Dow
nloa
ded
from
htt
psw
ww
cam
brid
geo
rgc
ore
Cal
tech
Lib
rary
on
31 M
ay 2
017
at 1
934
26
sub
ject
to th
e Ca
mbr
idge
Cor
e te
rms
of u
se a
vaila
ble
at h
ttps
ww
wc
ambr
idge
org
cor
ete
rms
htt
ps
doio
rg1
010
17jf
m2
016
862
Transition to bluff-body dynamics in the wake of vertical-axis wind turbines 369
1 2 3 4 5 6 7 8 9 10 11 12
05
0
ndash05
10
FIGURE 20 (Colour online) Minimum streamwise velocity across the span Umin Coloursand symbols correspond to the following the 2-bladed turbine for λ = 195 (times) 161( (blue)) and 122 (E (blue)) the 3-bladed turbine for λ = 163 ( (black)) 141 (A)and 120 (E (black)) the 5-bladed turbine for λ= 123 (E (red)) and λ= 101 (+) andthe stationary cylinder (u) Downstream distance X is normalized by the model diameterD and velocity by the free stream speed U0
ndash05
ndash04
ndash03
ndash02
ndash01
0
01
02
03
04 06 08 10
FIGURE 21 Linear correlation (R2 = 096) between the normalized absolute minimumstreamwise velocity across the span min(UminU0) and the dynamic solidity σD
the (XD)transition location as was done before in figure 19 The result of thistransformation on the measured minimum velocity (cf figure 20) is shown infigure 24 Notably all of the velocity profiles recover at approximately the same rateindicated qualitatively by their slope However the transformation is incomplete sincethe ordinate axis was not scaled Additionally the imperfect scaling of the abscissais attributable to the imperfect means used to predict the transition location ieequation (35) Most important however is that the collapse of the velocity profilesin the transformed coordinate suggests that the bluff-body mode is instrumental inthe recovery of the velocity deficit perhaps because it controls the entrainment ofenergy into the wake
Dow
nloa
ded
from
htt
psw
ww
cam
brid
geo
rgc
ore
Cal
tech
Lib
rary
on
31 M
ay 2
017
at 1
934
26
sub
ject
to th
e Ca
mbr
idge
Cor
e te
rms
of u
se a
vaila
ble
at h
ttps
ww
wc
ambr
idge
org
cor
ete
rms
htt
ps
doio
rg1
010
17jf
m2
016
862
370 D B Araya T Colonius and J O Dabiri
0
02
04
06
08
10
12
14
1 2 3 4 5 6 7 8 9 10 11 12
FIGURE 22 (Colour online) Minimum streamwise velocity Umin rescaled by the absoluteminimum velocity across the span ie min(Umin) Colours and symbols correspond to thefollowing the 2-bladed turbine for λ=195 (times) 161 ( (blue)) and 122 (E (blue)) the 3-bladed turbine for λ= 163 ( (black)) 141(A) and 120 (E (black)) the 5-bladed turbinefor λ = 123 (E (red)) and λ = 101 (+) and the stationary cylinder (u) Downstreamdistance X is normalized by the model diameter D and velocity by the free stream speedU0
04
06
08
10
12
14
04 06 08 10
FIGURE 23 Linear correlation (R2 = 099) between the rescaled streamwise velocity offigure 22 at XD= 12 and the dynamic solidity σD
Furthermore the collapse suggests the possibility of extracting an equation relatingthe minimum velocity UminU0 to the XXtransition position in the wake This isexplored first within the context of classical theory of turbulent free-shear flows thensubsequently compared with previous wind turbine wake studies Invoking Prandtlrsquosmixing length hypothesis Schlichting (1960) derived an expression for the recoveryof the centreline velocity deficit ie the minimum in the wake of a bluff body Fora two-dimensional wake this is given as
uU0sim(
XD
)minus12
(36)
Dow
nloa
ded
from
htt
psw
ww
cam
brid
geo
rgc
ore
Cal
tech
Lib
rary
on
31 M
ay 2
017
at 1
934
26
sub
ject
to th
e Ca
mbr
idge
Cor
e te
rms
of u
se a
vaila
ble
at h
ttps
ww
wc
ambr
idge
org
cor
ete
rms
htt
ps
doio
rg1
010
17jf
m2
016
862
Transition to bluff-body dynamics in the wake of vertical-axis wind turbines 371
05
0
ndash05
10
1 2 3 4 5 6 7 8 9 10 11 12
FIGURE 24 (Colour online) Normalized minimum streamwise velocity UminU0 versusdownstream distance X normalized by the streamwise transition location Xtransition Coloursand symbols correspond to the following the 2-bladed turbine for λ = 195 (times) 161( (blue)) and 122 (E (blue)) the 3-bladed turbine for λ= 163 ( (black)) 141(A) and120 (E (black)) and the 5-bladed turbine for λ= 123 (E (red)) and λ= 101 (+)
and for a circular wake (ie 3-D axisymmetric) as
uU0sim(
XD
)minus23
(37)
where u=U0minusUmin Assuming that the maximum velocity deficit in the wake of theVAWT follows the above form we seek solutions to the following equation
uU0= c1
(XXt
)c2
+ c3 (38)
The coefficients for this power law fit in each case are given in table 2 Note that thecurves were fit to the measured data downstream of the absolute minimum velocityfor each case A curve fit to the cylinder data is also included but this was donewithout applying a transformation to its abscissa since by definition the transitionoccurs immediately at XD= 0 In general the power law appears to be an excellentfit to the measured VAWT data in the transformed coordinate with an R2 sim 099 inall cases This power law trend can also be readily observed in figure 25 where themeasured velocity deficit in the VAWT wake ie uU0= 1minus (UminU0) has been ploton a logndashlog scale These observations are also consistent with several earlier HAWTwake studies where a power law was used to describe the downstream evolution of thewake velocity deficit (eg Houmlgstroumlm et al 1988 Vermeer Soslashrensen amp Crespo 2003Zhang Markfort amp Porteacute-Agel 2013 Iungo amp Porteacute-Agel 2014) The typical formof this power law for HAWT wakes is given in Iungo amp Porteacute-Agel (2014) as thefollowing
1minus Umin
Uhub= A
( xd
)n (39)
where Uhub is a reference velocity Umin is the minimum axial velocity observed ata certain downstream distance (xd) is the downstream distance normalized by therotor diameter A is a constant related to the turbine thrust coefficient and n is related
Dow
nloa
ded
from
htt
psw
ww
cam
brid
geo
rgc
ore
Cal
tech
Lib
rary
on
31 M
ay 2
017
at 1
934
26
sub
ject
to th
e Ca
mbr
idge
Cor
e te
rms
of u
se a
vaila
ble
at h
ttps
ww
wc
ambr
idge
org
cor
ete
rms
htt
ps
doio
rg1
010
17jf
m2
016
862
372 D B Araya T Colonius and J O Dabiri
100 101
100
10ndash1
FIGURE 25 (Colour online) Logndashlog plot of normalized velocity deficit uU0 = 1 minus(UminU0) versus downstream distance X normalized by the streamwise transition locationXtransition Colours and symbols correspond to the following the 2-bladed turbine forλ = 195 (times) 161 ( (blue)) and 122 (E (blue)) the 3-bladed turbine for λ = 163( (black)) 141 (A) and 120 (E (black)) and the 5-bladed turbine for λ= 123 (E (red))and λ = 101 (+) Two dotted lines are drawn for reference one with a minus1 slope andanother with a minus23 slope
Model σ λ σD c1 c2 c3 R2
Cylinder 1 0 1 133 minus0956 minus0068 0983
5-bladed turbine 053 123 0756 214 minus1095 minus0006 09985-bladed turbine 053 101 0703 1615 minus1149 0017 09983-bladed turbine 032 163 0693 171 minus0991 0013 09973-bladed turbine 032 141 0645 1498 minus0902 minus0021 09973-bladed turbine 032 120 0583 1168 minus0684 minus0098 09982-bladed turbine 021 195 0615 1491 minus0579 minus0277 09982-bladed turbine 021 161 0534 1201 minus0587 minus0199 09982-bladed turbine 021 122 0385 0542 minus0622 0033 0987
TABLE 2 Power law coefficients corresponding to (38)
to the rate of wake recovery The typical values for the coefficients are also given as1ltAlt 3 and minus125lt nltminus025 which are within the range of values of coefficientsc1 and c2 in table 2 respectively despite that the latter were obtained for the VAWTand cylinder wakes This further suggests a commonality among the different wakeflows
Additionally the variation of the exponent c2 in table 2 indicates the importanceof considering the three-dimensionality of the flow especially with increasing dynamicsolidity For σD lt 065 the minimum velocity in the wake increases approximately inproportion to Xminus06 which could perhaps be approximated by the previous theoreticalexpressions For σDgt 065 the minimum velocity in the wake increases approximatelyin proportion to Xminus1 including for the cylinder This indicates that for small aspectratio and large dynamic solidity neither 2-D nor 3-D-axisymmetric assumptions arevalid in the VAWT wake This is physically consistent with the idea that the finite
Dow
nloa
ded
from
htt
psw
ww
cam
brid
geo
rgc
ore
Cal
tech
Lib
rary
on
31 M
ay 2
017
at 1
934
26
sub
ject
to th
e Ca
mbr
idge
Cor
e te
rms
of u
se a
vaila
ble
at h
ttps
ww
wc
ambr
idge
org
cor
ete
rms
htt
ps
doio
rg1
010
17jf
m2
016
862
Transition to bluff-body dynamics in the wake of vertical-axis wind turbines 373
05
0
ndash05
10
1 2 3 4 5 6 7 8 9 10 11 12
1 2 3 4 5 6 7 8 9 10 11 12
FIGURE 26 (Colour online) Minimum streamwise velocity Umin rescaled by the absoluteminimum streamwise velocity across the span min(Umin) Downstream distance X isnormalized by the streamwise transition location Xtransition for the turbine data and D forthe cylinder Colours and symbols correspond to the following the 2-bladed turbine forλ = 195 (times) 161 ( (blue)) and 122 (E (blue)) the 3-bladed turbine for λ = 163( (black)) 141 (A) and 120 (E (black)) the 5-bladed turbine for λ = 123 (E (red))and λ= 101 (+) and the stationary cylinder (u)
aspect ratio of the models plays an increasingly dominant role in the wake recoveryas the dynamic solidity increases Furthermore the variation of c2 is likely affectedby all phenomena that can affect the wake Reynolds stresses eg the free streamturbulence intensity since these stresses influence the wake recovery rate To thisend the effect of the three-dimensionality of the flow including an evaluation of theReynolds stresses is explored further in sect 36
All of the measured values including the cylinder data are plotted in figure 26with a proposed scaling of the ordinate axis This rescaling includes subtracting theabsolute minimum velocity in each case min(Umin) as well as normalizing by thetotal velocity deficit Upon examining figure 26 the closeness of the cylinder datato that of the transformed VAWT data offers another interpretation to this coordinatetransformation which is a mapping of the minimum deficit in the VAWT wake ontothat of the cylinder This suggests that a simplified approach to approximate the wakeof a VAWT of arbitrary dynamic solidity could be achieved by applying the inversetransformation to the wake of a stationary cylinder Although this would not accountfor effects such as wake asymmetry it could give a first-order approximation for thevelocity deficit recovery
36 Insight into three-dimensional effectsThus far the analysis has focused exclusively on the 2-D PIV measurements Nextwe examine the out-of-plane (XZ) PIV measurements to provide insight into the three-dimensionality of the flow which was suggested in the last section to be significantfor high dynamic solidity cases
Dow
nloa
ded
from
htt
psw
ww
cam
brid
geo
rgc
ore
Cal
tech
Lib
rary
on
31 M
ay 2
017
at 1
934
26
sub
ject
to th
e Ca
mbr
idge
Cor
e te
rms
of u
se a
vaila
ble
at h
ttps
ww
wc
ambr
idge
org
cor
ete
rms
htt
ps
doio
rg1
010
17jf
m2
016
862
374 D B Araya T Colonius and J O Dabiri
Figure 27 shows time-averaged PIV measurements of the streamwise and verticalcomponents of velocity U and W respectively for each of the previous experimentalcases These measurements corresponded to a single streamwise position XD= 38which was located in the middle of the field of view of the XZ-PIV measurementsAlso shown for comparison in each plot are measurements of the free stream velocitytaken at the same XD location but with the model removed A fully developedturbulent boundary layer profile is observed from these free stream measurementsNear the top of the measurement window there is a slight distortion to the boundarylayer profile as the flow tries to adjust to the Plexiglas sheet used to dampen free-surface effects This effect on the boundary layer profile is negligible given its limitedspatial extent
Qualitatively the flow appears nearly symmetric about the midspan for all casesbut with a significant variation of the streamwise velocity along the Z-axis Despitethe large variation in U along the height ranging from approximately 0 to 06 U0the average vertical velocity never exceeds about 007 U0 This suggests at leasttwo possibilities that may occur in the experiment related to three-dimensional wakeeffects The first is that 3-D effects may have dissipated by this downstream positionsuch that the flow may be reasonably represented by two-dimensional slices at differ-ent heights The second is that since the turbine almost completely fills the height ofthe channel the limited space above and below the turbine may have a similar effecton the flow as using end-plates which tend to suppress three-dimensional effects
It is interesting to note that the cylinder velocity profile shown in figure 27(ef )along with the 5-bladed turbine appears to recover faster than all the other caseswhich is consistent with the previous wake recovery analysis An important questionleft to answer however is how the Reynolds stresses compare in the differentmeasurement planes since this is more telling of which direction provides more of acontribution to the wake recovery The Reynolds stresses ie 〈uprimevprime〉 and 〈uprimewprime〉 at thesame XD location are shown in figure 28 for the cases shown in figure 27 Notablefrom these figures is that the vertical shear stress ie 〈uprimewprime〉 is approximately thesame order as the spanwise shear stress ie 〈uprimevprime〉 but that the maximum shearappears in the uv-plane This indicates that while the vertical velocity fluctuationsplay an important role in the dynamics and recovery of the wake the dominanteffect may be characterized by the spanwise fluctuations as was done in the presentanalysis
4 Concluding remarks
The focus of this work is to expand the fundamental knowledge of the VAWTwake through controlled experimental observations The most important conclusion tobe drawn from this work is that the dynamics in the far wake of a VAWT can bequantitatively related to that of a solid cylinder It was shown how this relation maybe quantified through a newly defined parameter the dynamic solidity σD which is aratio of characteristic length and time scales within the flow Spectral analysis of theVAWT wake revealed it to be characterized by two dominant frequencies of velocityfluctuations The near wake is dominated by the periodic shedding of vortices fromthe turbine blades and the far wake exhibits low-frequency oscillations characteristicof bluff bodies ie near St asymp 026 This finding is consistent with earlier HAWTwake studies eg Chamorro et al (2013) who measured a dominant frequency ofSt = 028 in the far wake of a HAWT and note the similarity to bluff bodies andcircular cylinders Also Okulov et al (2014) found the far wake of a HAWT to be
Dow
nloa
ded
from
htt
psw
ww
cam
brid
geo
rgc
ore
Cal
tech
Lib
rary
on
31 M
ay 2
017
at 1
934
26
sub
ject
to th
e Ca
mbr
idge
Cor
e te
rms
of u
se a
vaila
ble
at h
ttps
ww
wc
ambr
idge
org
cor
ete
rms
htt
ps
doio
rg1
010
17jf
m2
016
862
Transition to bluff-body dynamics in the wake of vertical-axis wind turbines 375
0
02
04
06
08
10
04 06 08 10 0
02
04
06
08
10
0ndash010 ndash005 005 010
0
02
04
06
08
10
04 06 08 10 0
02
04
06
08
10
0ndash010 ndash005 005 010
0
02
04
06
08
10
04 06 08 10 0
02
04
06
08
10
0ndash010 ndash005 005 010
(a) (b)
(c) (d)
(e) ( f )
FIGURE 27 (Colour online) Time-averaged PIV measurements of streamwise U(left column) and vertical W (right column) velocity components at XD = 375Measurements are shown along the Z-axis normalized by the height of the rotor Hwhere ZH= 064 is at the rotor midspan The free stream measurements are indicated bysolid black circles in each plot Data in each panel correspond to the following (ab) the2-bladed turbine for λ= 195 (times) 161 ( (blue)) and 122 (E (blue)) (cd) the 3-bladedturbine for λ=163 ( (black)) 141 (A) and 120 (E (black)) (ef ) the stationary cylinder(u) and the 5-bladed turbine for λ= 123 (E (red)) and λ= 101 (+)
dominated by a self-similar wake that oscillates with a constant Strouhal number ofapproximately 023 independent of the operating conditions
Dow
nloa
ded
from
htt
psw
ww
cam
brid
geo
rgc
ore
Cal
tech
Lib
rary
on
31 M
ay 2
017
at 1
934
26
sub
ject
to th
e Ca
mbr
idge
Cor
e te
rms
of u
se a
vaila
ble
at h
ttps
ww
wc
ambr
idge
org
cor
ete
rms
htt
ps
doio
rg1
010
17jf
m2
016
862
376 D B Araya T Colonius and J O Dabiri
05
0
ndash05
ndash10
ndash15
10
15
0
02
04
06
08
10
0 002ndash002 0 002ndash002
05
0
ndash05
ndash10
ndash15
10
15
0
02
04
06
08
10
0 002ndash002 0 002ndash002
05
0
ndash05
ndash10
ndash15
10
15
0
02
04
06
08
10
0 002ndash002 0 002ndash002
(a) (b)
(c) (d)
(e) ( f )
FIGURE 28 (Colour online) PIV measurements of the Reynolds stresses ie 〈uprimevprime〉 and〈uprimewprime〉 at XD= 375 Measurements of 〈uprimevprime〉 (left column) are shown along the Y-axisnormalized by the model diameter measurements of 〈uprimewprime〉 (right column) are shown alongthe Z-axis normalized by the height of the rotor H where ZH = 064 is at the rotormidspan Data in each panel correspond to the following (ab) the 2-bladed turbine forλ = 195 (times) 161 ( (blue)) and 122 (E (blue)) (cd) the 3-bladed turbine for λ =163 ( (black)) 141 (A) and 120 (E (black)) (ef ) the stationary cylinder (u) and the5-bladed turbine for λ= 123 (E (red)) and λ= 101 (+)
Between the near- and far-wake regions in the VAWT wake there is a transitionwhere it is likely that a shear-layer instability develops this is thought to be the
Dow
nloa
ded
from
htt
psw
ww
cam
brid
geo
rgc
ore
Cal
tech
Lib
rary
on
31 M
ay 2
017
at 1
934
26
sub
ject
to th
e Ca
mbr
idge
Cor
e te
rms
of u
se a
vaila
ble
at h
ttps
ww
wc
ambr
idge
org
cor
ete
rms
htt
ps
doio
rg1
010
17jf
m2
016
862
Transition to bluff-body dynamics in the wake of vertical-axis wind turbines 377
underlying mechanism that leads to the far-wake oscillations in VAWTs just as itdoes for any other bluff body The transition location was found to be stronglycorrelated with σD thus providing a method to predict the wake transition given theturbine geometry and kinematics It is speculated that the linear correlation betweenwake transition and dynamic solidity may be related to the operational regime of therotor which for some of the cases may be characterized as operating in a turbulentwake state In general increasing σD led to an earlier transition in the wake Theseobservations were supported by a POD analysis of the velocity fluctuations whichgave insight into the physical structure of the most energetic wake oscillations Itwas observed that as σD was increased the frequency content and spatial structureof the dominant POD mode approached to that of the solid cylinder in the farwake Furthermore increasing σD consistently led to weaker vortices shed by theturbine This has interesting parallels to what has been observed in rotating cylinderswhere vortex shedding is suppressed when vorticity of sufficient strength is unableto diffuse to the flow outside of closed streamlines which are formed around thecylinder surface due to its rotation (Mittal amp Kumar 2003)
Additionally it was found that an earlier transition in the wake was correlated to agreater initial velocity deficit as well as a faster rate of recovery of this deficit UsingσD a transformation was proposed that closely aligned the velocity recovery profilesof the VAWT wake to that of the solid cylinder In this transformed coordinatesystem the minimum velocity recovery closely followed a power law in accordancewith the theoretical predictions of Schlichting (1960) for turbulent free-shear flowsand also typical of HAWT wakes (eg Iungo amp Porteacute-Agel (2014)) For cases withσD lt 065 the recovery of the minimum velocity was in proportion to Xminus06 whilefor higher dynamic solidity (including the cylinder) the recovery was proportional toXminus1 indicating the importance of 3-D effects The connection between the velocityrecovery and the bluff-body oscillations suggests that these oscillations are moreconducive to entraining energy into the wake This is supported by a look at theReynolds stresses ie 〈uprimevprime〉 and 〈uprimewprime〉 at a fixed streamwise location It was foundthat although the vertical shear stress ie 〈uprimewprime〉 is of the same order as the spanwiseshear stress ie 〈uprimevprime〉 indicating its importance in the wake recovery the maximumReynolds shear stress was consistently found to be in the uv-plane This indicatesthat the dominant effect of the velocity fluctuations on the wake recovery can becharacterized by the present analysis in the uv-plane Furthermore it is reasonableto assume that the aspect ratio of the turbine plays a significant role in the structureof the wake just as it does for circular cylinders Therefore it would be expectedthat the spanwise (y) fluctuations which are dominant in the present analysis wouldbecome more significant in the overall wake recovery as aspect ratio is increased
There is an apparent design trade-off for a single turbine between extracting morepower from the flow and achieving a faster rate of recovery in its wake the latterof which can be estimated by its dynamic solidity It is important to note that thedynamic solidity concept is not as useful in the design of a single rotor as it couldbe in the design of a wind farm The ability to predict the VAWT wake transitionmay impact the layout of multiple turbines within a wind farm since bluff-bodyoscillations may enhance energy entrainment but may also lead to early fatigue ofdownstream turbines The results also suggest a control strategy for influencing thewake recovery which is to artificially initiate the wake transition leading to bluff-bodyoscillations Since the power produced by a single VAWT is a function of its tip-speedratio which also determines its dynamic solidity this information could be used foractive control of the power produced within a wind farm depending on the local
Dow
nloa
ded
from
htt
psw
ww
cam
brid
geo
rgc
ore
Cal
tech
Lib
rary
on
31 M
ay 2
017
at 1
934
26
sub
ject
to th
e Ca
mbr
idge
Cor
e te
rms
of u
se a
vaila
ble
at h
ttps
ww
wc
ambr
idge
org
cor
ete
rms
htt
ps
doio
rg1
010
17jf
m2
016
862
378 D B Araya T Colonius and J O Dabiri
wind conditions Another approach might be to accelerate the decay of the vorticesshed by the blades by perhaps either suction or blowing near the turbine Bothapproaches would potentially allow more rapid development of the bluff-body modethus entraining more energy into the wake and recovering its deficit at a faster rate
Appendix
05 0
ndash05 ndash10 ndash15
1015
ndash2ndash4 0 2 4 6 8 10 12
05 0
ndash05 ndash10 ndash15
1015
ndash2ndash4 0 2 4 6 8 10 12
0ndash03
05
10
14
0
ndash03
05
10
14
05 0
ndash05 ndash10 ndash15
1015
ndash2ndash4 0 2 4 6 8 10 12
0ndash03
05
10
14
05 0
ndash05 ndash10 ndash15
1015
ndash2ndash4 0 2 4 6 8 10 12
ndash2ndash4 0 2 4 6 8 10 12
0
ndash03
05
10
14
0
ndash03
05
10
14
(a)
(b)
(c)
(e)
(d)
05 0
ndash05 ndash10 ndash15
1015
FIGURE 29 (Colour online) Contours of PIV measurements of UU0 under loaded-shaftconditions The plots are in order from top to bottom with decreasing σD (cf sect 33) andcorrespond to the (a) 5-bladed VAWT at λ = 101 (b) 3-bladed VAWT for λ = 141(c) 3-bladed VAWT for λ=120 (d) 2-bladed VAWT for λ=161 and (e) 2-bladed VAWTfor λ= 122 Airfoil cross-sections for the turbines are drawn to scale
Dow
nloa
ded
from
htt
psw
ww
cam
brid
geo
rgc
ore
Cal
tech
Lib
rary
on
31 M
ay 2
017
at 1
934
26
sub
ject
to th
e Ca
mbr
idge
Cor
e te
rms
of u
se a
vaila
ble
at h
ttps
ww
wc
ambr
idge
org
cor
ete
rms
htt
ps
doio
rg1
010
17jf
m2
016
862
Transition to bluff-body dynamics in the wake of vertical-axis wind turbines 379
10ndash4
10ndash5
10ndash6
10ndash7
10010ndash1
024 132 024 113
020 078
10ndash4
10ndash5
10ndash6
10ndash7
10010ndash1
(a)
10ndash4
10ndash5
10ndash6
10ndash7
10010ndash1
(c)
(b)
FIGURE 30 Spectra of the amplitude of the dominant POD mode for the velocityfluctuations under loaded-shaft conditions The figures correspond to (a) the 3-bladedVAWT at λ = 141 (b) the 3-bladed VAWT at λ = 120 and (c) the 2-bladed VAWT atλ = 122 Each spectrum corresponds to PIV window 3 (E) 4 (times) 5 (+) 6 (lowast) 7 ()8 (6) and 9 (C) Dotted vertical lines correspond to the selected near- and far-wakefrequencies of the maximum amplitude in the spectra
REFERENCES
ANDERSEN S J SOslashRENSEN J N amp MIKKELSEN R 2013 Simulation of the inherent turbulenceand wake interaction inside an infinitely long row of wind turbines J Turbul 14 1ndash24
ARAYA D B amp DABIRI J O 2015 A comparison of wake measurements in motor-driven andflow-driven turbine experiments Exp Fluids 56 (7) 1ndash15
BACHANT P amp WOSNIK M 2015 Characterising the near-wake of a cross-flow turbine J Turbul16 (4) 392ndash410
BATTISTI L ZANNE L ANNA S D DOSSENA V PERSICO G amp PARADISO B 2011Aerodynamic measurements on a vertical axis wind turbine in a large scale wind tunnelJ Energ Resour 133 031201
BERKOOZ G HOLMES P amp LUMLEY J L 1993 The proper orthogonal decomposition in theanalysis of turbulent flows Annu Rev Fluid Mech 25 539ndash575
BUHL M L 2005 A new empirical relationship between thrust coefficient and induction factorfor the turbulent windmill state Tech Rep NRELTP-500-36834 National Renewable EnergyLaboratory
Dow
nloa
ded
from
htt
psw
ww
cam
brid
geo
rgc
ore
Cal
tech
Lib
rary
on
31 M
ay 2
017
at 1
934
26
sub
ject
to th
e Ca
mbr
idge
Cor
e te
rms
of u
se a
vaila
ble
at h
ttps
ww
wc
ambr
idge
org
cor
ete
rms
htt
ps
doio
rg1
010
17jf
m2
016
862
380 D B Araya T Colonius and J O Dabiri
CALAF M MENEVEAU C amp MEYERS J 2010 Large eddy simulation study of fully developedwind-turbine array boundary layers Phys Fluids 22 015110
CHAMORRO L P HILL C MORTON S ELLIS C ARNDT R E A amp SOTIROPOULOS F2013 On the interaction between a turbulent open channel flow and an axial-flow turbineJ Fluid Mech 716 658ndash670
DABIRI J O 2014 Emergent aerodynamics in wind farms Phys Today 67 66ndash67DUNNE R amp MCKEON B J 2015 Dynamic stall on a pitching and surging airfoil Exp Fluids
56 (8) 1ndash15EDWARDS J M DANAO L A amp HOWELL R J 2015 PIV measurements and CFD simulation
of the performance and flow physics and of a small-scale vertical axis wind turbine WindEnergy 18 201ndash217
EGGLESTON D amp STODDARD F 1987 Wind Turbine Engineering Design Van Nostrand ReinholdCo Inc
FENG L-H WANG J-J amp PAN C 2011 Proper orthogonal decomposition analysis of vortexdynamics of a circular cylinder under synthetic jet control Phys Fluids 23 014106
FERREIRA C S VAN KUIK G VAN BUSSEL G amp SCARANO F 2009 Visualization by PIV ofdynamic stall on a vertical axis wind turbine Exp Fluids 46 97ndash108
FUJISAWA N amp SHIBUYA S 2001 Observations of dynamic stall on Darrieus wind turbine bladesJ Wind Engng Ind Aerodyn 89 201ndash214
HAMILTON N TUTKUN M amp CAL R B 2015 Wind turbine boundary layer arrays for Cartesianand staggered configurations part II low-dimensional representations via the proper orthogonaldecomposition Wind Energy 18 297ndash315
HANSEN M O L 2008 Aerodynamics of Wind Turbines 2nd edn EarthscanHANSEN M O L SOslashRENSEN J N VOUTSINAS S SOslashRENSEN N amp MADSEN H A
2006 State of the art in wind turbine aerodynamics and aeroelasticity Prog Aerosp Sci42 285ndash330
HAU E 2005 Wind Turbines 2nd edn SpringerHOumlGSTROumlM U D ASIMAKOPOULOS D N KAMBEZIDIS H HELMIST C G amp SMEDMAN A
1988 A field study of the wake behind a 2MW wind turbine Atmos Environ 22 803ndash820IUNGO G V amp PORTEacute-AGEL FERNANDO 2014 Volumetric lidar scanning of wind turbine wakes
under convective and neutral atmospheric stability regimes J Atmos Ocean Technol 312035ndash2048
IUNGO G V VIOLA F CAMARRI S PORTEacute-AGEL F amp GALLAIRE F 2013 Linear stabilityanalysis of wind turbine wakes performed on wind tunnel measurements J Fluid Mech 737499ndash526
KINZEL M MULLIGAN Q amp DABIRI J O 2012 Energy exchange in an array of vertical-axiswind turbines J Turbul 13 (38) 1ndash13
KOSTAS J SORIA J amp CHONG M S 2005 A comparison between snapshot POD analysis ofPIV velocity and vorticity data Exp Fluids 38 146ndash160
LAM K M 2009 Vortex shedding flow behind a slowly rotating circular cylinder J Fluids Struct25 245ndash262
LANEVILLE A amp VITTECOQ P 1986 Dynamic stall the case of the vertical axis wind turbineJ Solar Energy Engng 108 140ndash145
LARSEN G C MADSEN H A THOMSEN K amp LARSEN T J 2008 Wake meandering apragmatic approach Wind Energy 11 377ndash395
LEISHMAN G J 2006 Principles of Helicopter Aerodynamics Cambridge University PressMADSEN H A 1982 The actuator cylinder ndash a flow model for vertical axis wind turbines PhD
thesis Aalborg University CenterMEDICI D amp ALFREDSSON P H 2006 Measurements on a wind turbine wake 3D effects and
bluff body vortex shedding Wind Energy 9 219ndash236MEDICI D amp ALFREDSSON P H 2008 Measurements behind model wind turbines further evidence
of wake meandering Wind Energy 11 211ndash217MITTAL S amp KUMAR B 2003 Flow past a rotating cylinder J Fluid Mech 476 303ndash334
Dow
nloa
ded
from
htt
psw
ww
cam
brid
geo
rgc
ore
Cal
tech
Lib
rary
on
31 M
ay 2
017
at 1
934
26
sub
ject
to th
e Ca
mbr
idge
Cor
e te
rms
of u
se a
vaila
ble
at h
ttps
ww
wc
ambr
idge
org
cor
ete
rms
htt
ps
doio
rg1
010
17jf
m2
016
862
Transition to bluff-body dynamics in the wake of vertical-axis wind turbines 381
MYERS L E amp BAHAJ A S 2010 Experimental analysis of the flow field around horizontal axistidal turbines by use of scale mesh disk rotor simulators Ocean Engng 37 218ndash227
OKULOV V L NAUMOV I V MIKKELSEN R F KABARDIN I K amp SOslashRENSEN J N 2014A regular strouhal number for large-scale instability in the far wake of a rotor J Fluid Mech747 369ndash380
PICARD C amp DELVILLE J 2000 Pressure velocity coupling in a subsonic round jet Intl J HeatFluid Flow 21 359ndash364
PORTEacute-AGEL F WU Y-T amp CHEN C-H 2013 A numerical study of the effects of wind directionon turbine wakes and power losses in a large wind farm Energy 6 5297ndash5313
ROLIN V amp PORTEacute-AGEL F 2015 Wind-tunnel study of the wake behind a vertical axis windturbine in a boundary layer flow using stereoscopic particle image velocimetry J Phys ConfSer 625 012012
ROSHKO A 1961 Experiments on the flow past a circular cylinder at very high Reynolds numberJ Fluid Mech 10 345ndash356
SCHLICHTING H 1960 Boundary Layer Theory 4th edn McGraw-HillSIROVICH L 1987 Turbulence and the dynamics of coherent structures part I coherent structures
Q Appl Maths XLV 561ndash571SUTHERLAND H J BERG D E amp ASHWILL T D 2012 A restrospective of VAWT technology
Tech Rep SAND2012-0304 Sandia National LaboratoriesTESCIONE G RAGNI D HE C FERREIRA C J SIMAtildeO amp VAN BUSSEL G J W 2014 Near
wake flow analysis of a vertical axis wind turbine by stereoscopic particle image velocimetryJ Renew Energ 70 47ndash61
THOMSEN K amp SOslashRENSEN P 1999 Fatigue loads for wind turbines operating in wakes J WindEngng Ind Aerodyn 80 121ndash136
VERHULST C amp MENEVEAU C 2014 Large eddy simulation study of the kinetic energy entrainmentby energetic turbulent flow structures in large wind farms Phys Fluids 26 025113
VERMEER L J SOslashRENSEN J N amp CRESPO A 2003 Wind turbine wake aerodynamics ProgAerosp Sci 39 467ndash510
WELCH P D 1967 The use of fast Fourier transform for the estimation of power spectra a methodbased on time averaging over short modified periodograms IEEE Trans Audio Electroacoust15 70ndash73
ZHANG W MARKFORT C D amp PORTEacute-AGEL F 2013 Wind turbine wakes in a convectiveboundary layer a wind tunnel-study Boundary-Layer Meteorol 146 161ndash179
Dow
nloa
ded
from
htt
psw
ww
cam
brid
geo
rgc
ore
Cal
tech
Lib
rary
on
31 M
ay 2
017
at 1
934
26
sub
ject
to th
e Ca
mbr
idge
Cor
e te
rms
of u
se a
vaila
ble
at h
ttps
ww
wc
ambr
idge
org
cor
ete
rms
htt
ps
doio
rg1
010
17jf
m2
016
862
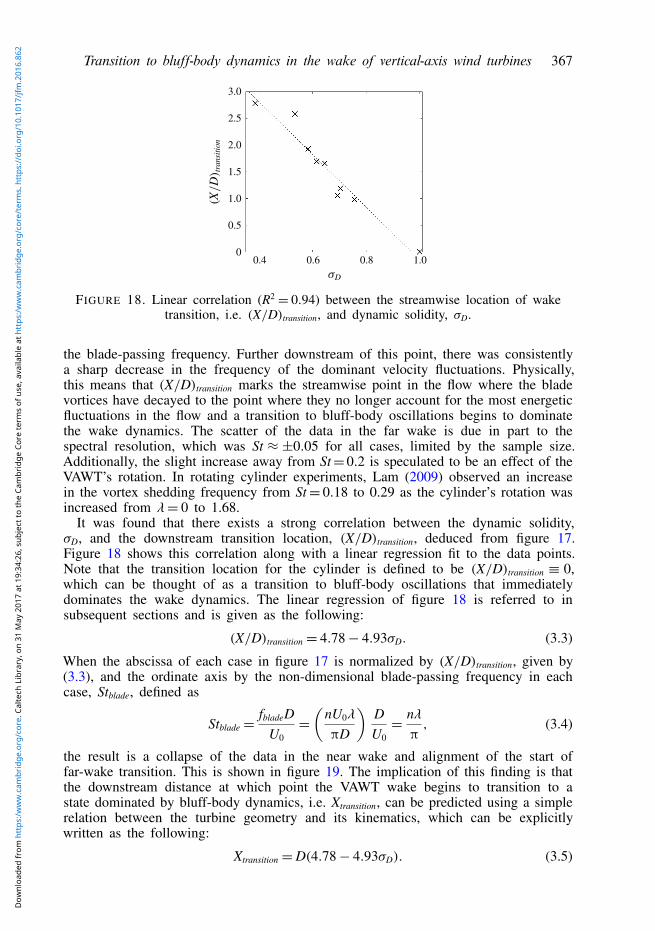
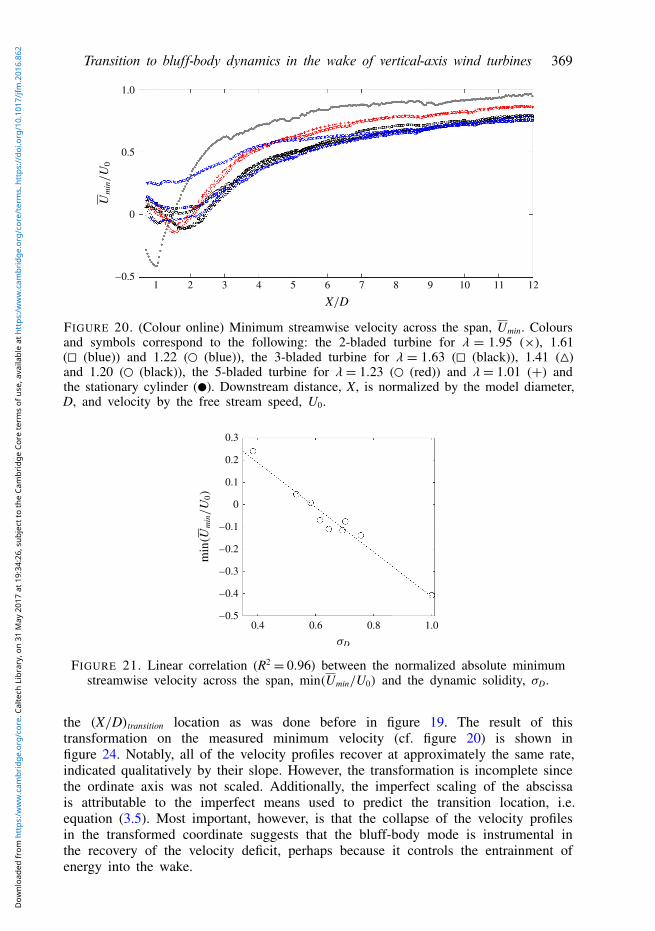