J. Fluid Mech. (2011), . 683, pp. doi:10.1017/jfm.2011.258 ...
40
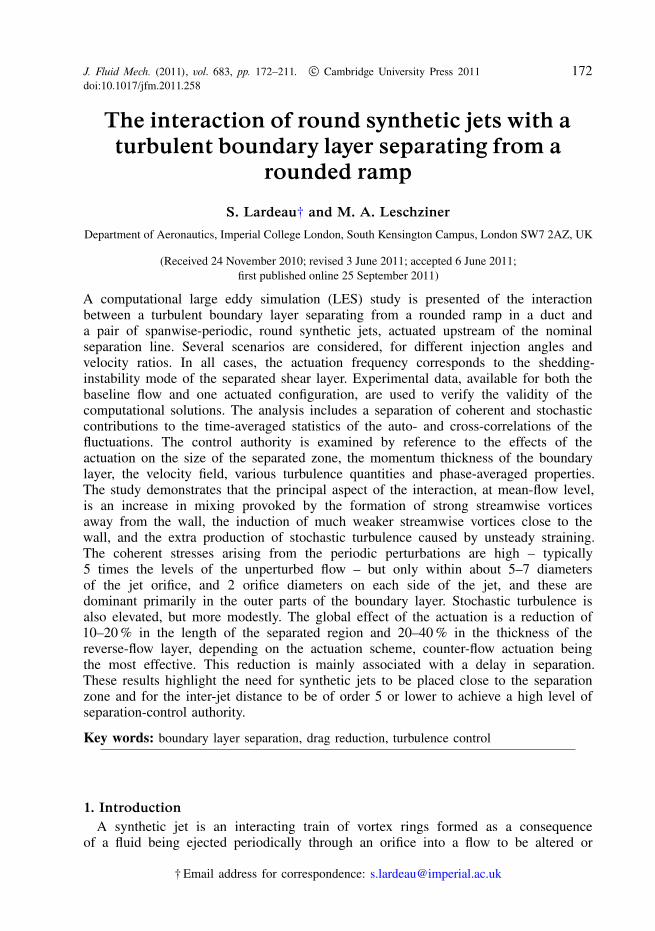
J. Fluid Mech. (2011), vol. 683, pp. 172–211. c Cambridge University Press 2011 172 doi:10.1017/jfm.2011.258 The interaction of round synthetic jets with a turbulent boundary layer separating from a rounded ramp S. Lardeau† and M. A. Leschziner Department of Aeronautics, Imperial College London, South Kensington Campus, London SW7 2AZ, UK (Received 24 November 2010; revised 3 June 2011; accepted 6 June 2011; first published online 25 September 2011) A computational large eddy simulation (LES) study is presented of the interaction between a turbulent boundary layer separating from a rounded ramp in a duct and a pair of spanwise-periodic, round synthetic jets, actuated upstream of the nominal separation line. Several scenarios are considered, for different injection angles and velocity ratios. In all cases, the actuation frequency corresponds to the shedding- instability mode of the separated shear layer. Experimental data, available for both the baseline flow and one actuated configuration, are used to verify the validity of the computational solutions. The analysis includes a separation of coherent and stochastic contributions to the time-averaged statistics of the auto- and cross-correlations of the fluctuations. The control authority is examined by reference to the effects of the actuation on the size of the separated zone, the momentum thickness of the boundary layer, the velocity field, various turbulence quantities and phase-averaged properties. The study demonstrates that the principal aspect of the interaction, at mean-flow level, is an increase in mixing provoked by the formation of strong streamwise vortices away from the wall, the induction of much weaker streamwise vortices close to the wall, and the extra production of stochastic turbulence caused by unsteady straining. The coherent stresses arising from the periodic perturbations are high – typically 5 times the levels of the unperturbed flow – but only within about 5–7 diameters of the jet orifice, and 2 orifice diameters on each side of the jet, and these are dominant primarily in the outer parts of the boundary layer. Stochastic turbulence is also elevated, but more modestly. The global effect of the actuation is a reduction of 10–20 % in the length of the separated region and 20–40 % in the thickness of the reverse-flow layer, depending on the actuation scheme, counter-flow actuation being the most effective. This reduction is mainly associated with a delay in separation. These results highlight the need for synthetic jets to be placed close to the separation zone and for the inter-jet distance to be of order 5 or lower to achieve a high level of separation-control authority. Key words: boundary layer separation, drag reduction, turbulence control 1. Introduction A synthetic jet is an interacting train of vortex rings formed as a consequence of a fluid being ejected periodically through an orifice into a flow to be altered or † Email address for correspondence: [email protected]
Transcript of J. Fluid Mech. (2011), . 683, pp. doi:10.1017/jfm.2011.258 ...
J. Fluid Mech. (2011), vol. 683, pp. 172–211. c© Cambridge University Press 2011 172doi:10.1017/jfm.2011.258
The interaction of round synthetic jets with aturbulent boundary layer separating from a
rounded ramp
S. Lardeau† and M. A. Leschziner
Department of Aeronautics, Imperial College London, South Kensington Campus, London SW7 2AZ, UK
(Received 24 November 2010; revised 3 June 2011; accepted 6 June 2011;first published online 25 September 2011)
A computational large eddy simulation (LES) study is presented of the interactionbetween a turbulent boundary layer separating from a rounded ramp in a duct anda pair of spanwise-periodic, round synthetic jets, actuated upstream of the nominalseparation line. Several scenarios are considered, for different injection angles andvelocity ratios. In all cases, the actuation frequency corresponds to the shedding-instability mode of the separated shear layer. Experimental data, available for both thebaseline flow and one actuated configuration, are used to verify the validity of thecomputational solutions. The analysis includes a separation of coherent and stochasticcontributions to the time-averaged statistics of the auto- and cross-correlations of thefluctuations. The control authority is examined by reference to the effects of theactuation on the size of the separated zone, the momentum thickness of the boundarylayer, the velocity field, various turbulence quantities and phase-averaged properties.The study demonstrates that the principal aspect of the interaction, at mean-flow level,is an increase in mixing provoked by the formation of strong streamwise vorticesaway from the wall, the induction of much weaker streamwise vortices close to thewall, and the extra production of stochastic turbulence caused by unsteady straining.The coherent stresses arising from the periodic perturbations are high – typically5 times the levels of the unperturbed flow – but only within about 5–7 diametersof the jet orifice, and 2 orifice diameters on each side of the jet, and these aredominant primarily in the outer parts of the boundary layer. Stochastic turbulence isalso elevated, but more modestly. The global effect of the actuation is a reduction of10–20 % in the length of the separated region and 20–40 % in the thickness of thereverse-flow layer, depending on the actuation scheme, counter-flow actuation beingthe most effective. This reduction is mainly associated with a delay in separation.These results highlight the need for synthetic jets to be placed close to the separationzone and for the inter-jet distance to be of order 5 or lower to achieve a high level ofseparation-control authority.
Key words: boundary layer separation, drag reduction, turbulence control
1. IntroductionA synthetic jet is an interacting train of vortex rings formed as a consequence
of a fluid being ejected periodically through an orifice into a flow to be altered or
† Email address for correspondence: [email protected]

Interaction of round synthetic jets with separated boundary layer 173
controlled in some sense. The expulsion phase is followed by a suction phase, thelatter not necessarily anti-symmetric to the former, but constrained to result in a zerocycle-average mass flux through the orifice. During the expulsion stage, vorticity fluxand associated circulation (the time-integral of the former) are ejected into the outerflow and propagate away from the orifice. In the subsequent suction phase, the fluidingested into the orifice originates predominantly from the area close to the wallsurrounding the orifice. Hence, this suction does not re-ingest more than a smallfraction of the circulation ejected, and the result of this irreversible and asymmetricprocess is a net unsteady expulsion of vorticity. As the vortices propagate into theouter medium, they interact by merging and diffusing, so that the statistical state is ajet with broadly similar far-field characteristics to those of a continuous jet – albeitweaker in intensity (Smith & Swift 2003).
In a practical setting, a synthetic jet is most frequently realised by oscillating thewall of a cavity bordering one side of the orifice, whilst on the other side, the vorticalstructures leaving the orifice interact with a cross-flowing boundary layer. Practicalinterest in synthetic jets is driven primarily by their potential to reduce or avoid flowseparation from highly loaded aerodynamic surfaces, e.g. in high-lift flight conditions.While such a capability is also offered, in principle, by fence- or chevron-like vortexgenerators, synthetic jets allow on-demand separation control with the working fluiditself, but without the need for a mass source – a combination that is especiallyattractive in aeronautical applications.
The fluid-mechanics features of synthetic jets depend sensitively on severalparameters, each set giving rise to a scenario that can differ substantially from others.The most important variable is the geometry of the orifice, ranging from a long slotto a circular hole. The behaviour of the ejected vortices and the manner in whichthey interact with the cross-flow are more complicated in the case of circular jetsthan slot jets, due to the more pronounced three-dimensionality of the processes inthe former. The interaction is also weaker and more subtle. Other important variablesinclude the position of the orifice(s) relative to the separation location, the angle ofinjection, the cavity and orifice-duct shape, the jet-to-outer-flow momentum ratio, thefrequency of the injection, the temporal variation of the ejection/suction rate withinthe actuation period, the mean and turbulence properties of the boundary layer in thecross flow, the Reynolds number of the jet and the boundary layer and the details ofthe separated flow to be controlled. This complex multi-dimensional parameter spacemakes it extremely difficult to derive general conclusions and guidelines on the controlauthority of synthetic jets and the associated fluid mechanics. Rather, past studiesprovide no more than a sparse knowledge base that yields general pointers, but verylittle by way of quantitative data.
A fairly representative actuation scenario is shown in figures 1 and 2 – the outcomeof one of the simulations discussed in § 4, for a sinusoidal injection into a turbulentboundary layer with the maximum orifice-averaged ejection velocity equal to thefree-stream velocity of the boundary layer, and an actuation frequency correspondingto a Strouhal number Std = 0.032, based on the orifice diameter, d, and the maximumejection velocity, Vr. The figures contain phase-averaged contours of the Laplacian ofthe pressure of the flow at 8 phase values, together covering the ejection phase of thefull cycle, with injection starting at the phase value of zero.
The expulsion stroke first generates a vortex ring that is distorted by the cross-flow– in this case a boundary layer. The head of the ring is then lifted upwards by theMagnus force, while the ring is stretched by the shear strain in the boundary layer,the two effects causing the vortex ring to incline and elongate (Sau & Mahesh 2008)

174 S. Lardeau and M. A. Leschziner
(a)
(c)
(b)
(d )
xy
z
x
y
z
xy
z
x
y
z
xy
z
x
y
z
xy
z
x
y
z
FIGURE 1. Iso-surfaces of the Laplacian of pressure representing the phase-averagedevolution of a round, turbulent synthetic jet at different phases within a single cycle. CaseCref (see table 1). Expulsion phase: (a) 0, (b) π/8, (c) 2π/8 and (d) 3π/8.
towards a hairpin-like shape. What is shown in figures 1(a) and 1(b) is a structure inthe part of the ring in which the motion on the spanwise plane bisecting the orifice isclockwise, reinforced by the shearing motion of the boundary layer. Roughly halfwaythrough the ejection phase, a pinching of the vortex ring occurs, terminating in theformation of a secondary inclined head vortex that is linked to the primary ring byarms with predominantly streamwise vorticity having the same sign as the vorticity inthe legs of the hairpin-like structure. When the ejected vorticity flux is high, as is thecase here, and is typical of low-frequency actuation, the vortex ring cannot containall the vorticity that is ejected, due to saturation effects (Gharib, Rambod & Shariff1998), and the primary ring is followed by a tail of vorticity, as is well brought out infigure 2. Towards the end of the ejection phase, the jet structure is dominated by a pairof vortices, which are the legs of a hairpin-like structure connected far downstream bya head, no longer visible in figure 2, which induces a downwash at its front. Thus, atthis stage, the primary jet-induced motion is an upwash from the jet-centre region anda downwash in the outer regions, as is the case in a continuous jet in cross-flow. Thiscauses an exchange – a mixing – of streamwise momentum by convective secondarycross-flow motion. Also seen in both figures 1 and 2 are thin secondary near-wallvortices, induced by the primary outer vortex as a consequence of the lateral inwardmotion close to the wall of sheared fluid towards the jet centre-plane. In the followingsuction stroke (not included), the tails of the hairpin-like structure are pulled back intothe orifice, elongating this structure further. Otherwise, the suction stroke has an effect

Interaction of round synthetic jets with separated boundary layer 175
(a) (b)
(c) (d)
y x
z
y
xz
y x
z
y
xz
y x
z
y
xz
y x
z
y
xz
FIGURE 2. The same as figure 1, for (a) 4π/8, (b) 5π/8, (c) 6π/8 and (d) 7π/8.
very similar to a sink flow, wherein the fluid that is drawn into the orifice emanatespredominantly from the near-wall layer (Gordon & Soria 2002).
A time-averaged view of the present flow is given in figure 3 by way of contoursof streamwise vorticity, and isolines of streamwise and spanwise velocity. Thisrepresentation brings out statistical similarities between a synthetic jet and a steadyjet in a cross-flow. In particular, the downstream state is characterised by a pair ofstreamwise vortices, corresponding to some of the phase-averaged features observedearlier. One important distinction from a continuous jet is that the time-averaged flowupstream of the jet is marked by a streamwise acceleration, rather than deceleration,because the net zero-mass-flow constraint through the orifice forces the flow intothe cavity on the upstream edge of the jet. The jet is seen to induce significantlateral motions, of order 10 % of the free-stream velocity, and strong distortions in thestreamwise velocity. The latter indicate a deceleration below and within the region ofstrong streamwise vorticity, an acceleration of fluid within a tongue above this region– indicative of the trajectory of the jet – and by acceleration in the near-wall regiondownstream of the jet, as the fast outer fluid is being transported towards the wall.
Past research on synthetic jets, and the related literature, are extensive, butdominated by studies on slot jets, especially in respect of separation control. The stateof the art in this area is best exemplified by the experimental work of Greenblatt et al.(2006) for slot-jet injection into a boundary layer separating from a dune-shaped hump,and a number of computational studies corresponding to this experimental geometry,documented in Rumsey et al. (2006), You, Ham & Moin (2008), Krishnan, Squires& Forsythe (2006) and Avdis, Lardeau & Leschziner (2009). Related simulations

176 S. Lardeau and M. A. Leschziner
0.04
0.9
0.80.7
0.1
0.30.50.40.7
0.8
–0.02
0.04
0.08
–0.06–0.1
–0.02
x
z
xz
y
y
0.6
FIGURE 3. Time-averaged representation of the jet shown in figures 1 and 2. Isosurfaceidentifying the streamwise vorticity ωx = ±1Uin/H; coloured portions of isosurface identify,in red, positive wall-normal velocity and, in blue, negative velocity; contour lines in the topview represent the spanwise velocity W/Uin at y/H = 0.05 from the wall; lines in side viewrepresent U/Uin on the jet centre-line.
for slot-jet injection into boundary layers separating from curved backward-facingramps are those of Neumann & Wengle (2004) and Dandois, Garnier & Sagaut(2007). Most of the studies on slot jets focus on global characteristics, e.g. thereduction in recirculation length depending on injection intensity and frequency, andthe relationship of this global behaviour to the phase-averaged characteristics andtheir interaction with the turbulence field. In a few cases, e.g. Dejoan & Leschziner(2004) and Pamart et al. (2010), attention is directed towards the coupling between theactuation frequency and natural instability modes in the separated shear layer.
There are a number of reasons for the above-described bias towards slot jets,which are discussed by Leschziner & Lardeau (2011). Among them is the fact thatslot jets are held to afford substantially greater control authority on the separationprocess, due to their much larger cross-flow extent and the mass and vorticity ejected.Another reason is that the statistical properties of slot jets are adequately described,in experiments, by the conditions on the spanwise mid-slot plane, and indeed fullydescribed on any spanwise plane in computational studies in which statisticallyspanwise homogeneity is imposed, as is the case in most such studies, whether usinglarge eddy simulation (LES) or Reynolds-averaged Navier–Stokes (RANS) methods.From a computational point of view, slot jets also pose fewer resolution problems thatarise from the major scale disparity between the orifice and the flow to be controlled,due to the predominantly two-dimensional conditions of the near-field flow close to theorifice.
Within the area of round synthetic jets, there have been a number of experimentalas well as computational studies examining the behaviour of such jets in stagnant

Interaction of round synthetic jets with separated boundary layer 177
surroundings. A brief discussion by Saffman (1981), under the heading Dynamicsof Vorticity, of a periodically ejected train of interacting vortices, visualisedexperimentally by Glezer (1981), is perhaps the earliest account pertinent to thefluid mechanics of a synthetic jet discharged into stagnant surroundings. A detaileddiscussion of the fluid mechanics of synthetic jets in stagnant media is given byGlezer & Amitay (2002), based on work by Smith & Glezer (1998). More recentexperimental studies, exploring mainly basic aspects of the formation of the jets and/orstatistical properties of synthetic jets relative to continuous jets, are those of Zhonget al. (2007), Smith & Swift (2003) and Cater & Soria (2002), with a correspondingLES realisation of the last reported by Wu & Leschziner (2009). Simulation studiesby Rizzetta, Visbal & Stanek (1999), Raju et al. (2009), Aram, Mittal & Cattafesta(2010) and Mittal & Rampunggoon (2002), for two-dimensional or high-aspect-ratioslots jets at low Reynolds numbers, are also noteworthy, in so far as they identifythe importance of including the cavity in the computational realisation – in particular,the effect of the cavity flow on the near-field vortical structure during the ejectionphase and the non-uniform conditions across the orifice. While these investigationsbring to light some fundamentally interesting consequences of the manner in which theejected vortex rings form, propagate and interact to form a jet, they are only weaklypertinent to the subject of this paper, simply because the fluid mechanics of suchjets differ greatly from those in a cross-flow. In particular, the manner in which ajet and the vortical structures therein propagate in stagnant surroundings, beyond theimmediate vicinity of the orifice, are dictated purely by mutual interactions amongthe vortical structures expelled and the motions they induce. Moreover, the phase- andtime-averaged states of such jets are two-dimensional, and the control of the flow intowhich these jets are injected is not a relevant issue.
As noted already, few studies target the interaction of round synthetic jets with across-flowing boundary layer, and all but one are for attached conditions – the oneexceptional study involving a boundary layer separating in a laminar state from a flatplate due to contouring of an opposing wall (Ozawa, Lesbros & Hong 2010).
Three studies that examine the formation and development of round laminar jetsinjected into laminar boundary layers are those of Jabbal & Zhong (2008), Zhou& Zhong (2009) and Sau & Mahesh (2008), the former experimental and the othertwo computational. These investigations, especially the latter, are remarkable in sofar as they bring out with striking clarity the frequency-dependence of the shapeand evolution of the vortex rings expelled by the actuation, and of the associatedsecondary vortical structures and velocity fields that are induced. They also highlightsome of the basic fluid-mechanic characteristics, corresponding to those discussedearlier by reference to figures 1 and 2, although the level of correspondence isnecessarily diminished by the absence or presence of turbulence. In particular, Zhou& Zhong (2009) observe two types of vortical structures, depending on the injectionconditions: hairpin structures, at relatively low frequency, and tilted vortex rings athigher frequency. A variety of induced vortices are identified, and these are shown todepend on the injection frequency.
The interaction between round (or square) jets and attached turbulent boundarylayers has been studied experimentally by Gordon & Soria (2002), Schaeffler &Jenkins (2006), Zaman & Milanovic (2002) and Garcillan et al. (2006), whilecomputational investigations include those of Ravi, Mittal & Najjar (2004), Dandois,Garnier & Sagaut (2006) and Wu & Leschziner (2009), the first restricted to very-low-Reynolds-number laminar conditions and the last two being fully turbulent andcorresponding to the experiments of Schaeffler & Jenkins (2006) and Garcillan et al.

178 S. Lardeau and M. A. Leschziner
(2006), respectively. Most of these studies are moderately pertinent to the presentpaper, in so far as they quantify the effect of the actuation on the boundary layerdownstream of the orifice, within a region that lies upstream of the separationline, as is the case in the flow which is the subject of this study. The studiesreveal, collectively, a wide range of interesting features, the most important commonobservations being: the narrowness of the lateral domain within which the jet modifiesthe base flow, extending to only around one orifice diameter or two on either sideof the jet centre-plane, the presence of two major time-averaged vortex pairs, onein the outer portion of the boundary layer, reflecting the trajectory of the jet, andanother counter-rotating pair close to the wall; the occurrence of a mild accelerationof the streamwise flow near the wall, due to streamwise momentum being transportedtowards the centre-plane by the near-wall vortex pairs; the creation of substantialdistortions in the phase-averaged velocity profiles in the near-orifice field, associatedwith near-wall flow acceleration and the presence of a distinct velocity maximum inthe region in which the head of ejected vortex induced flow acceleration; a fairly rapiddecay of the control effect beyond around x/d = 5, following a modest increase ofabout 30 % in the boundary-layer displacement and momentum thicknesses, and thepresence of strong distortions in the velocity field across the orifice, suggesting that itis imperative to resolve the flow below the orifice.
The above review serves to demonstrate that there has been virtually no seriousattempt so far to examine the interaction between round synthetic jets and separatingturbulent boundary layers. Not only is this configuration of considerable fundamentalinterest, it is also practically important, because matrices of circular orifices, asopposed to long slots, permit higher structural integrity to be maintained in patchesof highly loaded aerodynamic surfaces. The present paper thus presents a study ofthe interaction between a pair of round synthetic jets with a turbulent boundarylayer separating from a rounded backward-facing ramp. The study applies LES to anumber of combinations of injection parameters for one and the same ramp geometry,among them injection intensity, pitch angle and frequency. For two sets of conditions,including the unforced baseline flow, the computations are compared with extensivelaser Doppler anemometry (LDA) and particle image velocimetry (PIV) data of Zhang& Zhong (2010). Particular attention is focused on basic fluid-mechanic characteristics,including a distinction between coherent and stochastic contributions to the turbulencefields.
2. The flow configurationThe computational geometry under consideration is shown in figure 4. This
corresponds closely to the experimental configuration of Zhang & Zhong (2010).The only major difference is that the experimental high-aspect-ratio duct was hereapproximated by a spanwise-periodic slab with planes separated by 3.2 ramp heights,H. The duct height upstream of the ramp is 8.52H, and this was included in thesimulation in its entirety. The computational domain includes two circular orifice ductsof diameter d = 0.16H, separated by 10d, and the associated (separate) cylindricalactuation cavities of diameter D = 3.7H. The two jets are discharged 4d (0.64H)upstream of the curved ramp, an arrangement dictated by experimental constraints. Inall above respects, the computed and experimental configurations are identical.
A turbulent boundary layer separates from the backward-facing rounded ramp atapproximately 0.9H downstream of the start of the ramp. The ramp geometry is basedon that used originally by Song & Eaton (2004), but was adapted (by increasing

Interaction of round synthetic jets with separated boundary layer 179
x H
z H
y Hd
Vr
Wall
Wall
0.5
1.5
1.0
0.0
–1.5 –1.0 –0.5 0.0 0.5
–2
0
2
4
6
8
–6 –4 –2 0 2 4 6 8 10 12 14
–6 –4 –2 0 2 4 6 8 10 12 14
0
1
2
3
FIGURE 4. Solution domain and reduced numerical mesh: only every fourth grid line isshown, and the grid embedded in the two circular cavities and orifices is omitted.
the step height) in order to increase the size of the separation bubble, whichwas regarded to be too weak in Song & Eaton’s experiment. This adaptation wasundertaken interactively with the experimental effort, based on preliminary RANS andLES computations.
The ramp shape is described by the following three relations, with the originx/H = 0 being the upstream edge of the ramp:
ywall = (1− R1)+√
R21 − x2 for 0< x/H < 2.3, (2.1a)
ywall = y2 −√
R21
4− (x2 − x)2 for 2.3< x/H < 2.835, (2.1b)
ywall = R2 −√
R22 − (3− x)2 for 2.835< x/H < 2.937, (2.1c)
with R1 = 4.03, R2 = 0.333, x2 = 3.449 and y2 = 1.936. The distance from the bottomwall yw = (y− ywall) is also used throughout the text.
The Reynolds number, based on the ramp height H and the inlet free-stream velocityUin, is 13 700. In the experiment, the boundary layers on both walls evolve overa long stretch of duct, with the ramp being around 25H long, and attain a statevery close to that of a canonical, turbulent flat-plate boundary layer, as verified byLDA measurements. At x/H = −8, the computational inlet, the momentum-thicknessReynolds number is Reθ = 1160, and the boundary-layer thickness is δ99 = 0.9H. Inthe computations, the turbulent boundary layers on the upper and lower walls ofthe duct at the domain inlet were imposed using data from a precursor simulation,

180 S. Lardeau and M. A. Leschziner
——
–1
0
1
2
3
4
50 100 150 200 250
y+0 300
uv u2
urms uvrms uwrms u
–0.4
–0.2
0.0
0.2
0.4
0.6
50 100 150y+
0 200
ProductionTurb. flux
Viscous fluxDissipation
Gain
Loss
(a) (b)
FIGURE 5. State of the turbulent boundary layer at x/H = −4: (a) turbulence-intensity andshear-stress profiles; (b) budgets for the streamwise Reynolds stress uu. Symbols, DNS resultsfrom Jimenez et al. (2010); solid lines, present LES results.
performed with the aid of a recycling method (Lund, Wu & Squires 1998), fora stretch of a boundary layer developing in the actual channel. At a streamwiseposition at which Reθ = 1160, every realisation of the velocity field was stored overa period of 1000H/Uin. This data set was then used to explicitly prescribe the inletconditions. Comparisons between boundary-layer data returned by the present LES atx/H = −4 and direct numerical simulation (DNS) results of Jimenez et al. (2010), fora similar Reynolds number, Reθ = 1100, are shown in figure 5. Agreement is seen tobe close, and this demonstrates the high-fidelity representation of the boundary layerapproaching the ramp.
The synthetic jets are actuated sinusoidally and in phase. This is realised, in theexperiment (Zhou & Zhong 2009), by a shaker-piston mechanism to which onesidewall of each cavity is attached. As the area of the cavity wall is very large,relative to the orifice area, the displacements involved are minimal relative to thecavity depth. Thus, in the computation, the motion of the piston is represented by aweak sinusoidal transpiration on the appropriate sidewall in the z-direction:
Vpiston = V0 sin(
2πt
T
)(2.2)
where V0 is the maximum sidewall velocity and T the period of the actuation. The jetvelocity can be deduced from (2.2) using the simple incompressible-flow relationship:
Vjet = Vpiston
d2/D2. (2.3)
The mass-averaged exit velocity over the ejection phase may be computed from
Vexit = 2T
∫ T/2
0Vr sin
(2π
t
T
)dt, (2.4)
where Vr is the maximum value of Vjet , Vr = π/2Vexit . The Reynolds number, based onVr and d, is Rejet = 2900, which is high compared to other studies (e.g. Sau & Mahesh2008).

Interaction of round synthetic jets with separated boundary layer 181
Case StH Vr/Uin α T L/d Vexit/Uin cµ (%) Symbol
Baseline LES 0 0 0 0 0 0 0 —Refined LES 0 0 0 0 0 0 0 - - -Fine LES 0 0 0 0 0 0 0 – - –Cref 0.2 1 90◦ 5.16 5.2 0.32 0.16 – – –CVr−0.5 0.2 0.5 90◦ 5.16 2.6 0.16 0.08 +CVr+0.5 0.2 1.5 90◦ 5.16 7.74 0.48 0.24 ×Cα−45 0.2 1.0 45◦ 5.16 5.2 0.32 0.16 �Cα+45 0.2 1.0 135◦ 5.16 5.2 0.32 0.16 ◦
TABLE 1. Flow conditions examined.
The normalised stroke length, L/d, corresponding to the length column of fluidejected during the outstroke, is:
L
d= VexitT/2
d. (2.5)
There are several ways in which the jet velocity is used to express the relativeintensity of the actuation. The most popular parameter in the relevant literature is themomentum coefficient, cµ:
cµ = ρjV2exitd
2
ρ∞U2inLref Lz
, (2.6)
where Lref is taken here as the length of the recirculation region for the baselinecase (Lref /H = 3.3), and Lz is the spanwise width of the domain. In the present case,density is assumed to be constant throughout.
In what follows, five actuation scenarios are examined, and these are summarisedin table 1. The first three entries are distinguished by the use of three different gridsfor the unforced baseline case; the difference will be explained in the next section.Case Cref is the principal (reference) actuated case, for which experimental data areavailable. Two parameters are varied relative to that case: the pitch angle α (threeangles from 45◦ to 135◦, with respect to the streamwise direction) and three velocityratios Vr (from 0.5 to 1.5 times the free-stream velocity Uin). Several other controlparameters, including the injection frequency and the shape of the duty cycle, havealso been investigated, but in none of these variations was the effect on the separationdrastically different from the reference case, and the results derived are not, therefore,included in this paper. Attention is drawn to the notation in table 1 that is used toidentify different actuation scenarios. Specifically, the subscripts of the last four casesindicate variations in either injection velocity or angle relative to the reference case.Thus, Cα+45 indicates that the injection angle was increased, relative to the reference of90◦, by 45◦.
It is not claimed that the present study explores, in any systematic sense, thewide parameter space that might be of interest in a practical context. Rather, themain objective is to gain insight into the fluid-mechanic modifications associated withvarying these parameters within reasonable bounds.

182 S. Lardeau and M. A. Leschziner
3. The computational approachThe implicitly filtered LES momentum and continuity equations for incompressible
flow were solved over a general non-orthogonal, boundary-fitted, multi-block finite-volume mesh, supplemented by the immersed boundary method (Udaykumar et al.2001) to cater specifically to the complexities posed by the round orifices and thecavities. In total, the default mesh covering the duct-flow domain contained around11 million nodes, while each cavity was meshed with a further 0.8 million nodes. Thesensitivity to the resolution is addressed below. The variables are stored in a co-locatedmanner. The solution is based on a fractional-step time-marching method, with thetime derivative approximated by a third-order Gear scheme (Fishpool & Leschziner2009). The fluxes are approximated by second-order centred approximations. Withinthe fractional-step algorithm, a provisional velocity field results from advancing thesolution with the flux operators. This is then corrected through the pressure field byprojecting the provisional solution onto a divergence-free velocity field. To this end,the pressure is computed as a solution to the pressure–Poisson problem with the aidof a V-cycle multigrid scheme. In order to suppress unphysical oscillations, associatedwith pressure–velocity decoupling, a practice equivalent to that introduced in Rhie &Chow (1983) is adopted. Fishpool & Leschziner (2009) demonstrate that the loss ofaccuracy associated with the smoothing introduced by this practice is minimal.
While a grid of 11 million nodes, covering the main flow domain, might be regardedas modest, this needs to be seen against the relatively low Reynolds number of theflow simulated, and also the very long simulations that needed to be performed toachieve convergence, not only of the time-averaged quantities, but also the phase-averaged quantities – and this subject to spanwise inhomogeneity preventing spanwiseaveraging.
To explore the sensitivity to grid resolution, two additional simulations for thebaseline case, referred to as ‘Refined LES’ and ‘Fine LES’ in table 1, respectively,were performed. With the ‘Refined LES’ grid, the orifice-oriented refinement (figure 4)was removed, the spanwise grid was made uniform and the separated region (fromx/H = 0 to x/H = 4) was resolved using 130 points in the streamwise direction,compared to 75 points for the original mesh. With the ‘Fine LES’ grid, the overallnumber of nodes was more than doubled to 24 million nodes, with 280 nodes coveringthe streamwise extent of the separated region.
In all three grids, the first grid-cell centre is located below y+ = 1 at the bottomwall, whether y is scaled with the local or inflow friction velocity. The maximumstreamwise cell distance, 1x+, occurs close to the computational inlet and is around35 in the fine grid and 50 in the refined grid. This value drops to below 20 and10, respectively, downstream of x/H = 0, with values of order 5 within the separationzone. The maximum spanwise cell dimension, 1z+, is 10 for both the fine and refinedsimulations. For the ‘Baseline LES’ case, with non-regular spanwise distribution, 1z+
varies from 17 between the two orifices to 5 close to the orifice centres, with 16 × 16cells covering each orifice. Downstream of separation, the ratio of maximum celldimension to the Kolmogorov length (derived from the dissipation rate as part of thebudget) is of order 7 for the fine grid and 11 for the refined grid.
The boundary layer on the upper wall was covered by a coarser grid than thaton the lower wall, with the conditions between the wall and the wall-nearest y+
location of around 25 being covered by a log-law wall function, and with about17 grid nodes covering the boundary-layer thickness. This choice is justified by thefact that the upper boundary layer is far away from the region of interest, is onlysubjected to a weak adverse pressure gradient and is always fully attached. An entirely
Interaction of round synthetic jets with separated boundary layer 183
analogous approach was taken by Frohlich et al. (2005) when simulating the flow ata similar Reynolds number in a much tighter channel with massive separation behindstreamwise periodic hill-shaped obstructions on the lower wall. In that case, thischoice was made after extensive grid-sensitivity trials, and it is now well establishedthat the resulting solution, including budgets, is fully trustworthy.
The subgrid-scale (SGS) stresses were approximated using either the dynamicSmagorinsky model of Germano et al. (1991) and Lilly (1992) or the mixed-timescale model of Inagaki, Kondoh & Nagano (2005), the latter being local, involvingno averaging and hence being computationally cheaper. The dynamic model wasused for all actuated cases, and for the default baseline case, while the mixed-timescale model was adopted in the additional two grid-sensitivity simulations for thebaseline case. The rationale of using the simpler mixed-time scale model for thegrid-sensitivity study is rooted primarily in the observation that this model gavesomewhat lower time-averaged SGS viscosity values than the dynamic model, andthus allowed any grid-sensitivity specifically associated with variations in resolutionto emerge with greater clarity. Moreover, this model is computationally cheaper,which was especially advantageous in the fine-grid simulation. The decision to usethe dynamic Smagorinsky model for the actuated cases – and also, consistently, forthe baseline case computed with the same grid – reflected the prevailing view that thismodel is well founded, on physical grounds, especially for highly perturbed turbulenceremote from equilibrium, and thus preferable to non-dynamic implementations. Forall three meshes examined, the time-averaged subgrid-scale viscosity was found to bebelow 30 % of the fluid-viscosity values in the separated region, declining to below20 % with the finest mesh. This compares with the ratio of the RANS-equivalentturbulent viscosity to fluid viscosity, the former estimated from the RANS (k − εmodel) approximation 0.09ρk2/ε, of 200–300 in the separated zone. In the boundarylayer approaching separation, the maximum subgrid-scale viscosity was well below10 % of the fluid-viscosity value. Consistent with the low values of the modelledviscosity, with both SGS models, the sensitivity of the quantities of interest to thegrid have been observed to be marginal, including in respect of the terms contributingto the turbulence-energy budgets. This will be illustrated in figures to follow. Inparticular, figure 7 contains results obtained with all three grids for the skin frictionand wall-pressure coefficients, the discussion of which is deferred to § 4.
The simulations were performed with an average time step of 1t = 2 × 10⁻³H/Uin
for the baseline case, and 1t = 6 × 10⁻⁴H/Uin for the actuated cases, correspondingto a maximum cell-Courant–Friedrichs–Lewy value of around 0.5. In the latter cases,simulations were run for 50 time units (or about 10 injection cycles) before startingany statistical sampling. The flow was then computed for a further 230 time units(more than 40 injection cycles), during which data for various statistical propertieswere gathered. Statistical convergence was increased by using all symmetry planespossible (three spanwise planes for the actuated cases, and full spanwise averaging forthe baseline flow). For each actuated case, phase-averaged data (denoted by 〈·〉) wereobtained, in addition to time-averaged fields (denoted by .). To this end, each periodwas divided into 16 phase bins, within each of which averaging was performed overall time steps in that bin. This bin-internal averaging further enhanced the convergenceof the phase-averaged data. A quantitative indication of convergence is conveyed bythe observation that the streamwise stress formed with the periodic component of themotion and obtained after 30 and 40 periods did not change by more than 5 %. As willbe shown later, phase-averaged data form smooth fields and profiles, providing furtherindications that the data are well converged.

184 S. Lardeau and M. A. Leschziner
To distinguish periodic (coherent) from stochastic contributions to time-averagedstatistics, a triple decomposition (e.g. Hussain 1983) is adopted:
f (x, t)= f (x)+ f (x, t)+ f ′(x, t), (3.1)
where f is the time-average value, f is the periodic (or non-stochastic) perturbation andf ′ denotes the stochastic component.
The phase-average value is thus:
〈 f 〉 = f (x)+ f (x, t). (3.2)
This is obtained directly from the simulation, allowing the stochastic component to beevaluated. Also, given the time-mean value, the coherent component can readily beobtained.
The momentum equations corresponding to the mean-flow component of thedecomposition in (3.1) are:
DUi
Dt=− ∂P
∂xi+ 1
Re
∂2Ui
∂xj∂xj+ ∂
∂xj(−uiuj − u′iu′j). (3.3)
Equation (3.3) differs from the momentum equation obtained with the classicalReynolds decomposition only by the extra term (−(∂/∂xj)(uiuj)), which is relatedto the interactions of the periodic fluctuations among themselves. Separation can bedelayed either by an increase of the stochastic or the periodic component. These twomechanisms will feature in the discussion to follow.
4. Results4.1. The baseline flow
This section provides a discussion of the unforced baseline flow, so as to setthe appropriate background against which to view the effects of the synthetic jets.Although it is not the primary target of the present study, the flow is interesting andchallenging in its own right, and it deserves to be analysed in some detail, as isdemonstrated in Song & Eaton (2004). The challenge arises primarily from the factthat separation takes place from a gently curving surface and is thus characterised by aconvoluted, time-varying and patchy separation behaviour, and by statistical propertiesaround the time-mean separation line that differ drastically from those of a boundarylayer separating cleanly from a sharp edge.
First, an instantaneous visualisation of the flow is shown in figure 6. Isocontoursof u = 0 are used to identify reverse-flow zones. Upstream of the separation, whichoccurs around x/H = 0.9, the boundary layer is fully turbulent (cf. figure 5). Theseparation line is not well defined, and the ‘jitter’ of the isosurface correspondsroughly to the spanwise spacing, 1z+ = 80 (figure 7d), of the streamwise streakspresent in the incoming, attached boundary layer. Also visible are large ‘blobs’ ofattached flow in the middle of the separation region. Unlike separation from a sharpstep, where large spanwise-homogeneous structures are observed, the behaviour ishere more akin to that of incipient, intermittent separation, and is not accompaniedby distinct Kelvin–Helmholtz-type vortices. Reattachment is very indistinct andintermittent, occurring around x/H = 4.5. Further downstream, x/H > 6, the flowrecovers towards a fully turbulent, attached, boundary layer.
Comparisons between simulations and experimental data are presented infigures 7–10, while further statistical properties derived from the simulations are given

Interaction of round synthetic jets with separated boundary layer 185
–4 –2 0 2 4 6 8 10
–4 –2 0 2 4 6 8 10
x H
(a)
(b)
0 1 2 3 4 5
0 1 2 3 4 5
FIGURE 6. Baseline flow: instantaneous-flow visualisation with vorticity magnitude contours(in terms of multiples of Uin/H) and isosurface of u= 0. (a) Side view; (b) top view.
in figures 11 and 12. To illustrate sensitivity of the solutions to mesh disposition andSGS modelling, figures 7–9 include results from both LES simulations for the baselinecase, with differences between them explained in the previous section.
The streamwise variation of the pressure coefficient Cp and the skin-friction coefficientCf are shown in figures 7(a) and 7(b), respectively. Results are included for all threegrids examined, and differences are seen to be quite modest and confined mainly tothe post-reattachment region. The time-averaged separation occurs at x/H = 0.85, inboth simulations and in the experiment, and the flow reattaches at x/H = 4.15. As iscommon in separated near-wall flows, the wall-pressure distribution features a plateauwithin this region, although its length is short, consistent with the rather thin, elongatedtongue and tail of recirculating flow upstream of x/H = 2 and downstream of x/H = 3.5.The Cf variation shows that the near-wall flow accelerates well upstream of the curvedsection as a consequence of the pressure drop induced by the convex curvature furtherdownstream, reflecting the elliptic nature of the pressure field. While the computed near-wall acceleration appears in excess of that measured, as implied by the single experimentalvalue of Cf at x/H = 0 (deduced from the wall-nearest velocity data in both experimentand simulation), it is curious – if not inconsistent – that the experimental pressure troughis deeper than that predicted, regardless of mesh refinement, suggesting a more intenseacceleration in the experiment. However, it must be borne in mind that Cf is indicativeprimarily of the response of the layer very close to the wall, while the wall pressurereflects the global response of the entire boundary layer when subjected to the effectsof curvature. Thus, the differences observed in figure 7 might be assumed to indicatesome differences in the structure of the predicted and measured boundary layers as theseparation region is approached. While there are no experimental boundary-layer data thatwould allow this inference to be tested upstream of x/H = 0, data beyond that positiondo not provide any indications of defects in the predicted flow field. Nor are there anyindications that an inconsistent normalisation of Cp or a misrepresentation of the boundarylayer on the upper wall is responsible. It is arguably relevant in the present context to drawattention to a recent highly resolved LES study by Garcia-Villalba et al. (2009) of a flowaround a three-dimensional hill. That study also featured significant discrepancies in Cp asthe flow approached the hill crest and progressed towards separation in the leeward side,

186 S. Lardeau and M. A. Leschziner
Separated flow Separated flow
LDA
R(u
, u)
–4 × 10⁻³
–2 × 10⁻³
0 × 100
2 × 10⁻³
4 × 10⁻³
6 × 10⁻³
8 × 10⁻³
0 2 4 6
(a) (b)
(c) (d)
–2 8
x H
x H
= 0
.85
x H
= 4
.15 x
H =
0.8
5
x H
= 4
.15
x H = 4.8
x H = 1
x H = –1
Cf
–6 × 10⁻³
1 × 10⁻²
–0.3
–0.2
–0.1
0.0
0.1
0.2
0.3
Cp
–0.4
0.4
0 2 4 6 8
x H–2 10
Baseline LESRefined LES
Fine LESLDA
0.1
0.2
0.3
1 2 3 4
x H0 5
0.4
yw H
–0.2
0.0
0.2
0.4
0.6
0.8
1.0
100 200 300 400
Δz+0 500
FIGURE 7. Baseline flow: (a) spanwise-averaged streamwise variation of the skin-frictioncoefficient Cf ; (b) spanwise-averaged streamwise variation of the pressure coefficient Cp; (c)spanwise-averaged streamwise variation of height of reverse-flow layer above the ramp wall;(d) spanwise variation of two-point correlation function of the streamwise fluctuations. Linesand symbols: •, experimental results of Zhang & Zhong (2010); —, LES results, baselinemesh; - - -, LES results, refined mesh; – - –, LES results, fine mesh.
despite a correct prediction of the boundary-layer structure. In that study too, resolutionwas demonstrably not the issue. While the two flows contrasted here differ significantly,the comparison serves to illustrate the particular sensitivity of the wall pressure in flowseparating from gently curving surfaces, especially if the separation region is relativelythin. Pleasingly, once separation has occurred, the pressure rise towards the plateau, theplateau itself and the subsequent rise towards reattachment are correctly captured. It isfinally noted that the uneven variation of Cf within the recirculation zone reflects the lackof curvature continuity in the shape of the wall, as expressed by (2.1b).
A good global indicator of the quality with which the separation process as a whole ispredicted is given by the locus of zero streamwise velocity within the recirculation bubble.This is shown in figure 7(c). As is seen, separation is predicted at the correct positionand varies in close accord with the experimental data up to around x/H = 4. While therecirculation region is 3.3H long, it is only about 0.6H high (about twice the thicknessof the reverse-flow layer) – hence, rather thin, as already noted. The zero-velocity locus

Interaction of round synthetic jets with separated boundary layer 187
0.2
0.4
0.6
0.8
0.2
0.4
0.6
0.8
0.4
0.6
1.0
0
1.0
yw H
0
1.0
yw H
0.8
yw H
x H
(a)
(b)
(c)
0.2
2 3 540 1
FIGURE 8. Baseline-flow, spanwise-averaged properties: (a) streamwise velocity U/Uin,(b) streamwise Reynolds stress uu/U2
in; (c) shear stress uv/U2in. The LES-derived zero-
streamwise-velocity locus is shown as a dash-dot line; •, experimental results of Zhang &Zhong (2010); —, LES results, baseline mesh; - - -, LES results, refined mesh.
indicates an especially thin and elongated reverse-flow zone following separation, up tox/H = 1.8. Interestingly, this is a feature also observed in Garcia-Villalba et al. (2009), andis associated with the spatially and temporally varying separation process, with the flowbeing intermittently attached and separated around the time-averaged separation location.
Attention has already been drawn to figure 7(d), in relation to the streak distance in theupstream boundary layer. Its inclusion is intended, primarily, to reinforce the observationderived from all other figures that the results of the simulations are only marginallysensitive to the grid and the SGS model. Moreover, the variations of Ruu demonstrate thatthe spanwise width of the domain is sufficient to secure spanwise decorrelation. Increasingthe spanwise domain further would have been possible, in principle, but would havenecessitated the inclusion of a third jet, with its cavity, thus substantially increasing theresource requirements.
Comprehensive comparisons of predicted streamwise-velocity and streamwise-Reynolds-stress profiles with all available experimental data are given in figure 8, whilemagnified views of profiles of U, uu and uv, at four different positions close to theseparation and reattachment points are given in figure 9. The predicted zero-velocitylocus, given earlier in figure 7(c), is included again in figure 8 for reference. Agreementwith experiment is generally close. The only significant difference is that the turbulenceactivity in the outer part of the separated shear layer is modestly overestimated by theLES. As anticipated, there is a strong rise of the streamwise fluctuations once the flow

188 S. Lardeau and M. A. Leschziner
=0.32
=1.27
= 4.44
= 9.52
u U
UU
2 in, u
u U
2 inin
= 1.27
1.0
– 0.2
0.0
0.2
0.4
0.6
0.8
1.2
yw H yw H
0.01 0.10 1.00
0.01 0.10 1.00
0.01 0.10 1.00
0.01 0.10 1.00
0 0.1 0.2 0.3 0.4 0.5 0.6 0.7 0.8 0.91.0
–0.01
0.00
0.01
0.02
0.03
0.04
–0.01
0.00
0.01
0.02
0.03
x H
= 1.27x H
x H
= 9.52x H
x H
= 4.44x H
= 4.44x H
=9.52x H
x H
x H
=0.32x H
(c) (d)
(a) (b)
FIGURE 9. Baseline-flow, spanwise-averaged properties, selected profiles: (a,b) streamwisevelocity; (c,d) streamwise and shear Reynolds stress; —, LES results, baseline mesh; - - -,LES results, refined mesh.
separates. In fact, this rise begins well ahead of the separation location, as is brought outclearly in figure 9(c), which indicates very high values of the ratio uu/uv at x/H = 0.32.A probability density function (p.d.f.) of the separation location, given in figure 10, showsseparation not to occur further upstream than x/H = 0.5, with a few rare exceptions(cf. figure 6). Hence, the high value in streamwise stress at x/H = 0.32 is taken asindicative of the destabilising influence of the adverse pressure gradient that sets inat around x/H = 0.2. Following separation, the increase in the streamwise stress isaccompanied by a corresponding increase in shear stress, although the ratio uu/uvsuggests a turbulence structure in the separated shear layer that is far from equilibrium– an issue that will be revisited later by reference to a few turbulence-energy budgets.The reverse flow in the recirculation region, which is usually quite sensitive to resolutionand difficult to capture accurately in LES, is remarkably well reproduced, and reaches aminimum of Umin/Uin = −0.1 around x/H = 2.70, in close accord with the experimentalvalue.
Turbulence-energy budgets at three locations, spanning the separation-to-reattachmentrange, are shown in figure 11. All contributions to the budget are scaled with the free-stream inlet velocity and the step height. The viscous-diffusion terms are negligible,except very close to the wall, and have thus been omitted from the plots. All threebudgets share common features, the principal difference lying in the magnitude of thecontributions. Close to the separation point (x/H = 0.95), production rises quickly to avery high level, relative to that in the upstream boundary layer, reaching a maximumat around x/H = 1.3. This is balanced by dissipation, pressure diffusion and turbulent

Interaction of round synthetic jets with separated boundary layer 189
Nor
mal
ized
p.d
.f.
p.d.f. separation
Bubble height
x H
yw H
0
0.2
0.4
0.6
0.8
1.0
1.2
1.4
0.5 1.5 2.0 2.5 3.01.0
0.1
0.2
0.3
0.4
0.5
0
FIGURE 10. Baseline flow: p.d.f. of the position of the upstream-most separation pointsampled across the span; —, LES results, baseline mesh; - - -, LES results, refined mesh.
Loss
Gain
ProductionTurb. flux
Pressure fluxDissipationConvection
Loss
Gain
Loss
Gain
–0.03
–0.02
–0.01
0.00
0.01
0.02
0.03
0.04
yw Hyw Hyw H
0 0.05 0.10 0.15 0.20 0.4 0.8 1.2 1.60–0.03–0.02–0.01
0.00 0.01 0.02 0.03 0.04 0.05
–0.010
–0.005
0.000
0.005
0.010
0.015(a) (c)(b)
0.2 0.4 0.60
FIGURE 11. Baseline flow: spanwise-averaged turbulence-energy budgets; (a) x/H = 0.95,(b) x/H = 1.90 and (c) x/H = 3.80.
transport, the first being much lower than production, however, especially in the earlystages following separation. Turbulent transport is a very important contributor, allowingturbulence energy to diffuse towards the wall and away into the outer region, in an effortto compensate for the difference between the high level of production and low levelof dissipation in the central region of the separated shear layer. The strong imbalancebetween production and dissipation, the former exceeding the latter by a factor 3 closeto the separation point, thus highlights the fact that the flow is very far from a stateof equilibrium. This also applies to other streamwise locations in the separated shearlayer, albeit to a lesser extent. Thus, at x/H = 1.9, which is almost in the middleof the recirculation zone, production exceeds dissipation by a more modest factor 2.Diffusion and convection, the latter confined mainly to the outer portion of the shearlayer, make important contributions to the balance. In common with other streamwiselocations, the balance in the outer region at x/H = 1.9 is characterised by dissipativeand convective losses being counteracted by moderate production and positive turbulentdiffusion. Finally, close to the reattachment point, the main difference relative to theother two locations is that the production has declined to around 20 % of its maximumvalue, due to relatively low shear straining, with other contributions following suit. Inmost other respects, this budget has features similar to those at other locations.

190 S. Lardeau and M. A. Leschziner
10–2 10–1 100 101
StH
E(S
t H)
Eto
t
StH
A
B
C
D
0.0
0.5
1.0
1.5
2.0
2.5
A BC
D
0 1–1–2 2 3 4 50.0
0.5
1.0
1.5
2.0
2.5(a)
(b)
y H
x H
FIGURE 12. Baseline flow: pre-multiplied energy spectra. (a) Positions of the four probes atwhich samples for energy spectra were taken; (b) energy spectra.
There has been a significant amount of discussion in the literature about instabilitymodes in separation bubbles. Three modes are said to be pertinent: the shear-layer mode,the shedding (or step) mode and the flapping mode. The former is associated with theKelvin–Helmholtz (K–H) waves, depends only on the state of the boundary layer aroundthe point of separation, and is associated with the much studied instability caused by theinflectional profile in the shear layer. Hasan & Khan (1992) have reported that the Strouhalnumber, based on the momentum thickness at the point of separation, is Stθ = 0.012. Thesecond mode appears to scale with the height of the step from which the flow separates,or the length of the shear layer. This mode is characterised by StH = 0.2 and is said to belinked to the shear-layer mode by a sequence of vortex pairing as the shear layer evolves(Hasan & Khan 1992). This mode has been singled out as offering the potential of optimumcontrol by pulsed perturbations through resonance between the actuation frequency and theshedding mode. The third, flapping, mode is associated with the interaction – a temporalimbalance – between the entrainment of fluid into the separation region and the injection offluid from the separation point into the separated bubble (hence directly related to the sizeof the separation bubble), and is generally observed to be much lower than the sheddingfrequency – reported by Dandois et al. (2007) to be of the order StL = 0.12− 0.18, whereL is the average recirculation-bubble length.
In the present case, StH = 0.2 corresponds to Stθ = 0.011 – i.e. virtually identical to theshear-layer mode – because at the nominal separation location, the present simulationsfor the baseline case yield θ/H = 0.055 (see figure 19 discussed in the next section).To investigate the existence of the above instability modes, in the present case Hanning-windowed energy spectra (Oppenheim & Schafer 2009) have been obtained for thebaseline simulation on the ‘refined mesh’. Four such spectra are shown in figure 12,derived at locations A–D, which are identified in figure 12(a) (the dashed line is thezero-streamwise-velocity locus). Upstream of the separation, the energy peaks occur athigh-frequency values, around StH = 1–2. In contrast, at locations C and D, the peak shiftsmarkedly to around StH = 0.2. There is no clear evidence of another distinct mode, exceptfor a hint to an elevated spectral region around StH = 0.08, which is close to the first sub-harmonic of the K–H mode, possibly indicative of vortex pairing. Thus, to some extent,

Interaction of round synthetic jets with separated boundary layer 191
2–2 4 6 80
x H–4 10
2 4 6 8–4 10
(a)
(b)
FIGURE 13. Reference actuated case Cref : instantaneous flow at maximum ejection phasevisualised with vorticity magnitude contours and zero-velocity iso-surface. (a) Side view;(b) top view (note bright regions downstream and on either side of two orifices, indicatingelevated vorticity magnitude).
the spectra support the choice of StH = 0.2 as the actuation frequency for which resultsfollow.
4.2. Synthetic-jet actuation: reference case
In what follows, a discussion is provided of the effects of synthetic-jet actuation on thebaseline flow discussed above. The present section confines itself to a description of thereference-injection case Cref (see table 1), for which experimental data are available, whilesubsequent sections deal with the limited parametric exploration in which the injectionvelocity and angle are varied.
Figure 13 shows an instantaneous image, corresponding to that of figure 6 for thebaseline case, at an actuation phase at which the injection rate is close to its maximumvalue. The cavity has been deliberately included to demonstrate that the actuation actuallyresults in two synthetic jets, one in the boundary layer and the other within the cavity.Hence, the fluid ejected into the boundary layer is, in general, significantly perturbed,having a highly non-uniform velocity profile and carrying with it the turbulence containedin the cavity. The ejection involves the expulsion of vorticity, visible in figure 13 as weakbright streaks on either side and downstream of the jet orifices (top view), and also aheadof the curved ramp in the jet centre-plane (side view). The visualisation suggests, albeittentatively, that the effect of the jets on the size of the separation zone is rather modest: alocal delay in the separation, represented by a downstream shift of around 0.5H across aspanwise slab of roughly 2d. Hence, a first indication emerging from figure 13 is thatthe modifications induced by the round jets are substantially weaker and more subtlethan those produced by slot jets, where reductions typically of order 30 % in the sizeof recirculation zone across their entire span are achieved. The more subtle effect in thepresent configuration is evidently due to the large spanwise jet-to-jet separation (10d). Thislarge separation distance also means that the jets do not interact, except perhaps followingseparation when the largest turbulent scale is of the order of the jet-separation distance.Similar observations also apply to isolated solid vortex generators.

192 S. Lardeau and M. A. Leschziner
1.2
1.0
0.8–0.8 –0.4–1.2 0.0 0.4
y H
y H
y H
y H
x H x H
1.2
1.0
0.8–0.8 –0.4–1.2 0.0 0.4
1.2
1.0
0.8–0.8 –0.4–1.2 0.0 0.4 –1.2
1.2
1.0
0.8–0.8 –0.4 0.0 0.4
1.2
1.0
0.8–0.8 –0.4–1.2 0.0 0.4
1.2
1.0
0.8–0.8 –0.4–1.2 0.0 0.4
1.2
1.0
0.8–0.8 –0.4–1.2 0.0 0.4
1.2
1.0
0.8–0.8 –0.4–1.2 0.0 0.4
(a) (b)
(c) (d)
(e) ( f )
(g) (h)
–10 –6 –2 2 6 10
–10 –6 –2 2 6 10
–10 –6 –2 2 6 10
–10 –6 –2 2 6 10 –10 –6 –2 2 6 10
–10 –6 –2 2 6 10
–10 –6 –2 2 6 10
–10 –6 –2 2 6 10
FIGURE 14. Reference actuated case Cref : phase-averaged streamlines and isocontours ofspanwise vorticity, 〈ωz〉, for 8 regularly spaced phases spanning the full injection cycleacross the jet mid-plane. (a–d) Ejection phase; (e–h) suction phase. (a) 0, (b) π/4, (c) 4π/8,(d) 6π/8, (e) 8π/8, (f ) 10π/8, (g) 12π/8 and (h) 14π/8.
The details of the actuation process around and within the orifice are shown in figure 14by way of 8 phase-averaged plots of the spanwise vorticity component 〈ωz〉 on the centre-plane, covering the entire actuation cycle. These are best viewed in conjunction with thephase-averaged pressure–Laplacian contours in figures 1 and 2, showing the evolutionof the vortical structures in the same region. During the outstroke phase (figure 14a–d)positive vorticity within the shear layer of the jet emanating from the upstream lip of thenozzle is shed into the upper portion of the boundary layer. At the same time, negativevorticity is shed by the leeward shear layer into the region behind the orifice. These tworegions are, in effect, cross-sections through the vortex ring seen in figure 1. Between thelower (negative-vorticity) layer of the jet and the wall nestles a region of weak positivevorticity, indicating the presence of a secondary vortex induced by the primary vortex ring,and hence a reverse-flow region. Below that region, however, very close to the wall, thevorticity is again negative, presumably due to the spanwise transport of negative-vorticityfluid by transverse motion from outer regions towards the centre-plane. During the instrokephase (figure 14e–h), the synthetic jet acts as a sink flow. The fluid drawn into the orificeat its upstream edge separates within the orifice, and boundary-layer fluid with negativevorticity is strongly drawn into the cavity for the entire duration of the suction phase,accelerating and thinning the boundary layer and giving rise to a negative value of the time-averaged velocity in the upstream portion of the orifice. At the downstream lip, suctionalso leads to a downward motion, with positive vorticity at the orifice wall. However, here,the fluid ingested originates from the rear, decelerating boundary layer, which contains

Interaction of round synthetic jets with separated boundary layer 193
V jet
V+jet
V_
jet
Total1.0
0.5
0.0
–0.5
–1.02 /8 6 /84 /8 8 /8 10 /8 14 /812 /80 2
FIGURE 15. Reference actuated case Cref : phase-wise (φ) variations of area-averagedcontributions of phase-averaged jet velocity over the upstream (+) and downstream (−)halves of the orifice and their sum (i.e. the orifice-averaged velocity).
predominantly negative vorticity, an interaction which opposes the ingestion process. Thus,at the time-averaged level, the jet velocity is positive in this region.
An important consequence of the highly asymmetric interaction between the boundarylayer and the injection process is that the phase- and time-averaged flow and vorticitydistribution vary greatly across the orifice. This is exemplified by figure 15, which showsseparate contributions of the area-averaged jet velocity over the upstream and downstreamhalves of the orifice area (denoted by the superscripts ‘+’ and ‘−’, respectively) duringthe actuation cycle, with their sum being the total sinusoidal variation that must complywith the cycle-averaged zero-mass-flux constraint. As is seen, the ejection velocity overthe front half of the orifice is much lower than that over the rear half, and this indicates,globally, the strong distortions arising from the collision of the boundary layer with theejected jet fluid. Clearly, the time-integral of the upstream contribution is negative, whilethat downstream is positive. Hence, the time-averaged flow at the upstream portion of theorifice is into the cavity, which is very different from the conditions in continuous injection.The implication is thus that ignoring this variation in any computational simulation – say,by prescribing the injection conditions as a temporally varying plug flow – is likely to havea significant negative impact on the realism of the simulation. It is this fact that primarilymotivates the inclusion of the cavity in the simulation.
Figure 16 is the first of several similar plots, included for different actuation scenarios,that attempt to bring out some major differences in respect of the periodic motions inducedby the actuation. The figure shows, for 8 equally spaced phases, iso-surfaces of 0.1Uin
and −0.1Uin in the streamwise and wall-normal velocity components. The plots covera streamwise distance of about 6 orifice diameters, within which the periodic velocitycomponents are especially pronounced.
At the start of the ejection, φ = 0, the periodic fluctuation downstream of the orifice ispredominantly positive. This reflects the fact that the suction preceding this phase (φ =2π− π/8), coupled with a predominantly negative wall-normal motion, draws down high-velocity fluid from upper layers towards the wall, leading to a streamwise acceleration(positive increment). As the ejection progresses, the wall-normal motion is predominantlypositive, except on the spanwise edges of this positive-velocity region (see especially lowerplot at 4π/8). This ejection then induces a deceleration, away from the wall, reflecting theblockage posed by the ejected fluid to the oncoming flow. Simultaneously, there also arises

194 S. Lardeau and M. A. Leschziner
8 8 10 8 12 8 14 8
0 2 8 4 8 6 8
y
xz
y
xz
y
xz
y
xz
y
xz
y
xz
y
xz
y
xz
y
xz
y
xz
y
xz
y
xz
y
xz
y
xz
y
xz
y
xz
FIGURE 16. Baseline case Cref : iso-surfaces of u = ±0.1Uin (+0.1 in blue and −0.1 in red),and of v = ±0.1Uin (+0.1 in grey and −0.1 in green), at 8 equally spaced phase values(progressing left to right and top to bottom) covering a whole cycle.
a second region of deceleration, close to the wall, as a consequence of the shielding effectof the jet. This creates a low-pressure region behind the jet into which low-momentumnear-wall fluid is drawn from outer spanwise regions towards the centre-plane. The adversepressure gradient acting on this low-momentum fluid then induces a reverse flow oversome portions of the ejection phase (figure 14). Towards the end of ejection, the periodicfield is thus dominated by an upward wall-normal motion and a decelerated streamwise-velocity region extending to around 5d. Importantly, the spanwise extent of this region israther narrow – only around 2d. During the suction phase, the wall-normal velocity aroundthe orifice is negative, and this induces the transport of high-momentum fluid from outerregions towards the wall (figure 14), resulting in a positive streamwise velocity fluctuation.The sequence of negative and positive fluctuations is seen especially well in the upperplot at φ = 10π/8. Towards the end of the suction phase, φ = 14π/8, the flow has almostreturned to the state φ = 0 at the top left-hand side of the figure.
An important aspect of the streamwise fluctuations in figure 16 is that the near-wallregion is affected, primarily, by positive fluctuations, while negative fluctuations are

Interaction of round synthetic jets with separated boundary layer 195
3.0
2.5
2.0
1.5
1.0
0.5
0
3.0
2.5
2.0
1.5
1.0
0.5
02.01.51.00.5–0.5 0.0 2.01.51.00.5–0.5 0.0
(2
)0.050
0.050.00
0.100.0250.000
–0.025–0.050
–0.05–0.10
(a) (b)
x H x H
FIGURE 17. Reference actuated case Cref : space–time plots of periodic streamwise velocityfluctuation u/Uin in the jet centre-plane for (a) yw/H = 0.01 and (b) yw/H = 0.085. Thewhite line indicates the separation point on the jet centre-line (derived from the reversal ofwall-nearest velocity).
predominant in outer regions. Because positive fluctuations at the wall tend to push theseparation location in the positive streamwise direction, the consequence of the above isthat, on average, the periodic component is expected to produce a downstream shift of theseparation line around the jet centre-line. This is brought out in figure 17, which showsspace–time maps of streamwise periodic-velocity fluctuations over three actuation cyclesat two wall-normal elevations, yw/H = 0.01 and 0.085, respectively. The maps include thephase-average variation of the separation point on the orifice centre-line. It is recalled thatthe separation point in the baseline flow is at x/H = 0.85, while the time-average value forthe present reference actuated case is x/H = 1.18. As is seen from figure 16, the phase-average value varies between 1.0 and 1.5, but the more important point to highlight isthat separation is delayed primarily by positive streamwise-velocity fluctuation at the wall(i.e. at yw/H = 0.01). It is also interesting to note that, away from the wall (yw/H = 0.085),the characteristic line identifying the progression of perturbations has a much shallowerangle, signifying a higher convection velocity with which the separation delay is notcorrelated. The conditions at this wall-normal distance correspond to the outer tongue-likestructures seen in figure 16.
As will be shown below, the strength of the periodic component declines substantiallyas the separation region is approached. However, the above predominance of positive near-wall perturbation is still likely to contribute to the delay of separation, enhancing anyactuation-induced stochastic turbulence and mixing by transverse circulation.
Figure 18 shows the time-averaged zero-streamwise-velocity locus, the spanwiselocation of the separation line and the separation-bubble length for the reference actuatedcase, relative to the baseline flow. The injection is seen to lead to a reduction of the lengthand height of the separation bubble, with the maximum reduction of the former beingaround 17 % at the jet centre-plane. This level is considerably lower than that obtainedwith slot jets, for reasons discussed already. It is also observed that the spanwise region of

196 S. Lardeau and M. A. Leschziner 0.4
0.3
0.2
0.1
yw H
(a)
x sep
H,L
sep
H
(b)
z
1.0
1.5
2.0
2.5
3.0
3.5
Jet w
idth
xsep /H
Lsep /H
Baseline LESCrefLDA
0 1 2 3 4 5 –0.8 –0.4 0.0 0.4 0.8
x H H
FIGURE 18. Reference actuated case Cref : (a) height of reverse-flow layer in jet centre-planeand (b) locus of the separation xsep and separation length Lsep. Lines: —, baseline case; - - -,actuated case.
influence extends only to around 1d on either side of the orifice, suggesting that a denselypacked row of jets is required if an effect is to be achieved that goes beyond the action of asingle jet that is divorced from its neighbours. Agreement of the zero-velocity locus withexperiment is fairly close, except in the upstream portion of the recirculation zone wherethe separated region is very thin and difficult to map accurately.
The global effect of the actuation on the structure of the boundary layer approaching theseparation point on the centre-plane is illustrated in figure 19 by way of the streamwisevariation of the momentum thickness θ/H. These were derived in accordance with theexpression by Dandois et al. (2007):
θ =∫ +∞
ymin
U − Umin
Uin − Umin
(1− U − Umin
Uin − Umin
)dy. (4.1)
Figure 19 also contains results derived from the parametric exploration that is discussed inthe following two sections; comments here relate only to the comparison of the referenceactuated flow to the baseline flow. The relevance of including θ is that it representsthe jet-induced boundary-layer thickening as a consequence of obstruction and adversepressure gradient in the near-field wake of the jet. It is appropriate to note here thatmomentum thickening is not, in itself, necessarily desirable, because such thickeningindicates deceleration on the lower region of the boundary layer, thus potentially reducingthe boundary layer’s ability to resist separation. However, the actuation also results inmomentum mixing and enhanced turbulence further downstream, and the net result turnsout to be a desirable delay in the separation. Thus, it can be argued that the optimumcombination is low jet-induced momentum thickening coupled with intensive downstreammixing.
Figure 19 shows, first, that the general trend of θ is to decline ahead of the orifice, dueto ramp-associated acceleration. In the presence of actuation, this acceleration is enhancedby the fact that the time-averaged flow in the upstream portion in the orifice is directed intothe cavity (constituting suction), so that the boundary layer is pulled towards the orifice.Further downstream, beyond x/H = 0.1− 0.2, the flow is subjected, overall, to an adversepressure gradient as the boundary layer progresses towards separation, hence provoking arapid rise in the momentum thickness. The introduction of actuation causes a significant

Interaction of round synthetic jets with separated boundary layer 197
–1.0 –0.5 0.0 0.5 1.0
θ
Jet e
xit
Baseline
H
0
0.02
0.04
0.06
0.08
0.10
x H
ref
Vr
C
+ 0.5CVr – 0.5C
αα
– 45
+ 45
CC
FIGURE 19. All flow cases examined: streamwise variations of momentum thickness θ alongthe jet centre-plane.
rise of the momentum thickness behind the jet as a consequence of the blockage of thejet and loss of momentum. Further downstream, beyond about two orifice diameters, thevariation of the momentum thickness, although elevated, is broadly similar to that of thebaseline boundary layer. However, the enhanced mixing that the actuation causes tends topartially reverse the elevation of the momentum thickness, the difference relative to thebaseline level being modest by the time the boundary layer reaches the separation region.This mixing is illustrated by the downwards-directed contours of streamwise velocitydownstream of the jet in figure 3.
An extensive comparison between measured and computed profiles of time-meanstreamwise velocity, streamwise normal stress and shear stress on the jet centre-planeis given in figure 20. Again, agreement is close in most regions, the exception being inrespect of the turbulence activity in the outer part of the flow above the separated region.The effect of the injection is most pronounced in the three or four upstream-most profilesof mean velocity and streamwise turbulence intensity. The former point to a decelerationwithin the layer yw/H = 0.3, into which jet fluid is ejected, and a thickening of theboundary layer as a whole, with inflection points between the inner and outer layers. Thisdeceleration is consistent with the predominance of negative periodic fluctuations in theouter region, identified earlier by reference to figure 16. The outer peaks in streamwisestress indicate a substantially enhanced level of unsteadiness in and below the inflectionlayer, but the effect of the shear stress is relatively modest, suggesting that the peaksare primarily due to the periodic component, which does not cause a significant level ofmomentum mixing. As will also be shown below, the fairly fast decay in the turbulence-intensity peaks in the streamwise direction is due mainly to a correspondingly rapiddecline in the strength of the coherent component, which dominates the total intensityimmediately downstream of the injection. This component is only a modest proportionof the total unsteadiness by the time the flow reaches the separation zone, so that theincreased resistance to separation is due, primarily, to enhanced stochastic turbulence andmixing by transverse circulation created by the injection of vorticity into the boundarylayer. These observations suggest that the level of separation control effected by the jetinjection suffers from the actuation being too far upstream of the separation location andinsufficiently targeted towards the agitation of the near-wall layer.
The periodic and stochastic contributions to the total time-averaged turbulent stressesmay be determined via the triple decomposition defined by (3.1). This is done in figure 21for the streamwise normal stress (upper part of each figure) and shear stress (lower part

198 S. Lardeau and M. A. Leschziner
1.0
0.8
0.6
0.4
0.2
0
1.0
0.8
0.6
0.4
0.2
0
1.0
0.8
0.6
0.4
2 3 4 5
(a)
(b)
(c)
yw H
yw H
yw H
0.2
10
x H
FIGURE 20. Reference actuated case Cref , flow properties in jet centre-plane: (a) streamwisevelocity U; (b) streamwise Reynolds stress uu/U2
in; (c) shear stress uv/U2in . The LES-derived
locus of zero-streamwise velocity is shown as a dash-dot line; •, experimental results ofZhang & Zhong (2010); - - -, LES results.
of each figure) at four streamwise locations, selected from the 13 included in figure 20.Each plot contains four distributions per stress component, representing respectively: thetotal value with actuation uiuj, the periodic contribution uiuj, the stochastic contributionu′iu′j and the total value for the baseline flow uiuj. At the first downstream position, wherethe curved ramp starts (x/H = 0, 4d past the orifice), the injection is seen to result ina massive increase in total ‘turbulence’ activity, but much of this is clearly due to theperiodic component, while the increase in the stochastic part is much lower. Moreover,the enhancement of the latter occurs, primarily, in the outer part of the boundary layeryw/H = 0.2, where the periodic component is also especially high, because of the strongcross-flow penetration of the jet, and where the coherent structures cause turbulence-generating extra straining. This is the region in which the large phase-averaged structuresdepicted in figure 1 are located. Near the wall, yw/H = 0.05, there is a second peak, whichis associated with the secondary motion induced by the primary outer vortices. As notedearlier, the rise in the stochastic part reflects extra turbulence production by unsteadystraining. Close to the wall, the effect of the additional straining, relative to the backgroundshear straining in the boundary layer, is very weak. In the outer region, however, thebackground shear straining is weak, while the periodic contribution is high, so that theeffect of the latter on the stochastic turbulence is appreciable. At the next streamwiseposition (x/H = 0.95), the periodic contribution has already diminished dramatically,constituting only a modest part of the total. Remarkably, the total turbulence activity closeto the wall is substantially reduced upon actuation. This is a direct consequence of the

Interaction of round synthetic jets with separated boundary layer 199
–0.02
0.04
0.03
0.02
0.01
0.00
–0.01
–0.02
0.04
0.03
0.02
0.01
0.00
–0.01
–0.02
0.04
0.03
0.02
0.01
0.00
–0.01
0 0.1 0.2 0.3 0.4 0.5 0.6
0 0.2 0.4 0.8 1.00.6 0 0.2 0.4 0.8 1.00.6
yw H yw H
MeanPeriodic
StochasticBaseline
0.020
0.015
0.010
0.005
–0.005
–0.010
0.000
0 0.1 0.2 0.3 0.4 0.5 0.6
(a) (b)
(c) (d)
FIGURE 21. Reference actuated case Cref , jet centre-plane. Profiles of total, coherent andstochastic stresses: mean uiuj, periodic uiuj, stochastic u′iu′j, all normalised by Uin. Positivevalues are for i = 1, j = 1 (streamwise stress); negative values are for i = 1, j = 2 (shearstress). (a) x/H = 0, (b) x/H = 0.63, (c) x/H = 1.25, (d) x/H = 1.90.
delay in the separation, and thus the delay in the rapid increase in turbulence associatedwith the boundary-layer separation and the K–H vortices within the separated shear layer.At this position, the only direct (local) effect of the actuation is a weak accentuation of thestochastic turbulence in the outer region arising from the declining periodic straining. Byx/H = 1.9, the periodic component has diminished to an insignificant level, and the totalstresses are virtually entirely due to the stochastic component, with differences relative tothe baseline flow being weak.
In light of the above observations, it might be concluded that much of the potential of theactuation is wasted by an excessive penetration of the synthetic jet into the outer portion ofthe boundary, where any modifications to the flow are only weakly linked to the near-wallprocesses that govern separation. This suggests the wisdom of injection at a lower rate andat a shallower angle. Whether or not this assumption is correct will be investigated in thefollowing sections.
The three-dimensional effects of the actuation process on the time-mean turbulencestatistics are brought out in figure 22 by way of cross-flow plots of the same quantitiesshown in figure 21 for the streamwise stress at four streamwise locations close to thejet orifice. In these plots, the periodic part is shown on the left half of each plot, whilethe stochastic component is shown on the right. Several of the patterns are, essentially,similar in shape to those seen in the interaction of a boundary layer with a continuouscross-jet: a kidney-shaped set of contours that indicate the presence of two dominantstreamwise vortices that draw boundary-layer fluid towards the centre-plane and outer fluidtowards the wall. Immediately downstream of the orifice, most of the fluctuating motion isdominated by the periodic component, which reaches a maximum at the outer region of thevortex, yw/H = 0.2. The downward motion induced by this vortex around its side (around

200 S. Lardeau and M. A. LeschzinerCoherent Stochastic Coherent Stochastic
Coherent Stochastic StochasticCoherent
–0.2 0.2 0.40.0–0.4
(a) (b)
(c) (d)
0.1
0.2
0.3
0.4
0.5
0.6
0 0.1
0.2
0.3
0.4
0.5
0.6
0
0.1
0.2
0.3
0.4
0.5
0.6
0
–0.2 0.2 0.40.0–0.4 –0.2 0.2 0.40.0–0.4
–0.2 0.2 0.40.0–0.4
0.1
0.2
0.3
0.4
0.5
0.6
0
0.015
0.005
0.010
0.020
0
0.015
0.005
0.010
0.020
0
0.015
0.005
0.010
0.020
0
0.015
0.005
0.010
0.020
0
yw H
yw H
z H z H
FIGURE 22. (Colour online available at journals.cambridge.org/flm) Reference actuated caseCref : contours of time-average of periodic streamwise normal stress, uu, and correspondingstochastic component u′u′, normalised by Uin, across four different streamwise positions.(a) x/H = 0, (b) x/H = 0.63, (c) x/H = 1.25, (d) x/H = 1.90.
z/H = −0.2) transports high-momentum fluid towards the wall, while low-momentumfluid is convected upwards around the jet centre-plane. Further downstream the periodiccomponent decays, especially close to the wall, and the stochastic component increasinglydominates. At the centre-plane, there is a distinct dip in the stochastic turbulence activityin the streamwise region, x/H = 0.63− 1.25, relative to that in the outer spanwise region,and this reflects the downstream shift of the separation around the centre-plane. Theseplots clearly convey the very limited spanwise extent of the region in which actuation iseffective, 2d at most. It is this fact that imposes the practical need for a much reducedinter-jet separation distance in efforts to achieve a higher level of control.
The present section has focused on one particular actuation scenario in detail, primarilybecause of the availability of experimental data for this case. The results and discussionhave demonstrated the ability of the simulations to reproduce all essential physical featuresof the actuation process. It has illustrated the role of, and interaction between, the periodicand stochastic components, and led to the conclusion that the actuation parameters inquestion might not be optimal in terms of control authority of the separation process.In view of the above, the next two sections examine the benefit of altering the injectionvelocity and the injection angle, respectively.
4.3. Effect of jet/boundary-layer-velocity ratioThis section explores the consequences of reducing and increasing the maximum injectionvelocity, Vr, by 50 % of the reference value. A supposition arising from the previous resultsis that increased injection velocity will not be advantageous, for the penetration at thereference value already appears to be excessive. More interesting is the question as towhether halving the injection velocity would result in the action being more effective inmodifying the near-wall region at much lower expenditure of actuation energy.

Interaction of round synthetic jets with separated boundary layer 201
0.4
0.3
0.2
y wH
(a)
2 3 4 5
x H
x sep
H,L
sep
H
1.0
1.5
2.0
2.5
3.0
3.5(b)
Jet w
idth
–0.8 –0.4 0.0 0.4 0.8
xsep/H
Lsep /H
1
0.1
0
z H
ref
Vr
C
+ 0.5CVr – 0.5C
FIGURE 23. Sensitivity of separation zone to actuation strength. (a) Locus of zero-streamwise velocity in jet centre-plane; (b) locus of separation location xsep and recirculationlength Lref ; —, baseline case; - - -, Cref ; +, CVr−0.5; ×, CVr+0.5.
A global view of the effects of the jet-velocity variation is first given in figure 23.This shows the time-averaged separation and reattachment lines. The outcome is clear:an increase in injection velocity results in a more pronounced delay of separation andearlier reattachment, with the shift in reattachment extending over a larger spanwisedistance. The effect is not dramatic but real. The results indicate, by implication, thatthe secondary perturbations near the wall, induced by the primary outer structures of thejet, are intensified by an increase of the injection velocity and thus translate to a slightincrease in control authority.
Figure 19 shows that the momentum thickness on the centre-plane responds sensitivelyto the actuation strength. In particular, the blockage-induced elevation of θ is substantialat the highest actuation strength. As was argued in the previous section, this is notan advantageous feature, unless more than compensated by downstream mixing. Whilethe delay of separation is evidently enhanced by increasing the actuation strength, thisenhancement is confined to a rather narrow spanwise segment, and it can thus be arguedthat an increase of actuation intensity, over and above some minimum value, is not a veryeffective means of enhancing separation control.
The effect of Vr on the time-averaged velocity and streamwise-normal and shear stressesis conveyed in figure 24 through profiles of the respective variables on the jet centre-planeat five streamwise locations for velocity and two for the Reynolds stresses. As the jetvelocity is increased, there is a modest delay in the separation, with the near-wall gradientremaining positive over a slightly extended streamwise distance. However, a much morepronounced effect arises in the outer part of the boundary layer, yw/H = 0.2 − 0.5,especially at low x/H values, wherein the velocity defect (trough) is intensified and alsoshifts outwards as the injection velocity increases, reflecting the more intense actuation andhigher penetration. The effect on the downstream velocity profiles is minor, consistent withthe earlier observation that the principal effect of the actuation is confined to the regionupstream and immediately downstream of the separation line. As regards the Reynoldsstresses, an increase in Vr results in a corresponding increase in total turbulence activityin the outer parts of the boundary layer – clearly conveyed in the plot for x/H = 1.25.There is also a noticeable effect on the turbulence activity close to the wall: while the peakdecreases with increasing Vr, the more important effect is the elevation of turbulence in

202 S. Lardeau and M. A. Leschziner
U
Uin
–0.2
0.0
0.2
0.4
0.6
0.8
1.0
1.2
U U
in
–0.2
0.0
0.2
0.4
0.6
0.8
1.0
1.2
(a) (b)
(c)
ref
Vr
C
+ 0.5CVr – 0.5C
ref
Vr
C
+ 0.5CVr – 0.5C
ref
Vr
C
+ 0.5CVr – 0.5C
ref
Vr
C
+ 0.5CVr – 0.5C
–0.03
–0.02
–0.01
0.00
0.01
0.02
0.03
0.04
0.01 0.10 1.00
0.01 0.10 1.00 0.01 0.10 1.00
0.01 0.10 1.00
x/ H =2.53
(d )
–0.02
–0.01
0.00
0.01
0.02
0.03
0.04
yw Hyw H
x/ H= 0
x/ H=1.90
x/ H= 4.44
x/ H=1.25
FIGURE 24. Sensitivity of flow properties to actuation strength in jet centre-plane. (a, c)Streamwise velocity, U/Uin; (b) streamwise normal stress uu/U2
in and shear stress uv/U2in for
x/H = 1.25; (d) the same as (b) but at x/H = 2.53.
the region x/H < 0.05, because it is this elevation, albeit slight, that is most likely to beresponsible for the delay in separation as Vr increases. The origin of this elevation willbe clarified below. As is the case for the velocity, once separation is well established, theinfluence of Vr on the turbulence level is minor, although there is clear evidence of theheight of the separated shear layer reducing, as reflected by the shear-induced turbulencepeaks being closer to the wall. This presumably reflects primarily the delayed separation,which then results in a thinner reverse-flow region.
The effect of injection velocity on the cross-flow properties, especially the lateral regionof influence, is conveyed in figure 25, which corresponds to figure 22 for the reference case.First, the lower injection velocity results, as expected, in the perturbed region being muchcloser to the wall, reflecting lower penetration. Second, the lower injection velocity is alsoseen to generate, in most areas, lower fluctuations, both periodic and stochastic, away fromthe wall. Close to the wall, however, the periodic contribution is higher, because the largeperiodic structures of the jet are also much closer to the wall. Third, the lateral extent ofthe perturbation is substantially larger with increasing injection velocity, and this results incorrespondingly larger lateral effects on the separation and especially reattachment lines(figure 23). Fourth, at the highest injection velocity, the outer and inner parts are almostdetached from each other, while there is a much greater level of wall-normal coherenceor continuity in properties at the lowest velocity. Finally, it is observed that the higherinjection velocity results in a more intensive streamwise vortex. This has two attendantconsequences: first the perturbations and secondary vortices induced close to the wall aremore vigorous, leading to higher fluctuation levels; second, the vertical motion transportshighly turbulent fluid from the primary vortex downwards, towards the wall, leading to a

Interaction of round synthetic jets with separated boundary layer 203
Coherent Stochastic Coherent Stochastic
Coherent Stochastic Stochastic
0.1
0.2
0.3
0.4
0.5
0.6
0
0.1
0.2
0.3
0.4
0.5
0.6
0
0.1
0.2
0.3
0.4
0.5
0.6
0
Coherent
0.1
0.2
0.3
0.4
0.5
0.6
0
–0.2 0.2 0.40.0–0.4
–0.2 0.2 0.40.0–0.4–0.2 0.2 0.40.0–0.4
–0.2 0.2 0.40.0–0.4
0.015
0.005
0.010
0.020
0
0.015
0.005
0.010
0.020
0
0.005
0.010
0.020
0
0.015
0.005
0.010
0.020
0
0.015
(a) (b)
(c) (d)
yw H
yw H
z H z H
FIGURE 25. (Colour online) Sensitivity of cross-sectional fields of streamwise stress toactuation strength (corresponding to figure 22). (a, b) CVr−0.5; (c,d) CVr+0.5; (a, c) x/H = 0;(b,d) x/H = 1.25.
further elevation of near-wall turbulence. However, the result of both processes is ratherlocal, being confined to a narrow region around the jet centre-plane. Hence, the overalleffect on the separation process is only modest.
4.4. Effect of injection angleIntuitively, one might assume that a flow-oriented injection, at an acute angle, would bebeneficial in two respects: first, such injection imparts additional streamwise momentumto the flow, and it does so preferentially in the near-wall region; second, penetration islower, and the unsteady large-scale structures are closer to the wall. On the other hand, onemight also expect somewhat weaker secondary motions, found to be advantageous in theabove investigation of the effects of the jet velocity. In a similar vein, injection against theflow might be expected to generate higher levels of turbulence close to the injection and alarger spanwise penetration of actuation and hence a wider region across which separationis affected – due to a blooming-jet-like process. Earlier experience with variations in theinjection angle (e.g. Garcillan et al. 2006) suggest that injection at a shallow angle, inthe direction of the flow, is the most effective, in so far as it generates strong and long-lived streamwise vortices. The physical scenario proposed is that the realignment of thejet is modest, thus securing a high level of coherence of the vortical secondary motionover a longer streamwise distance. It is against this background that the present sectioninvestigates the effects of injection angle through simulations of injection at 45 and 135degrees relative to the streamwise direction (Cα−45 and Cα+45, respectively).
The global effect of the injection angle on the separation and reattachment is shown infigure 26. Blowing upstream (135◦) is seen to be substantially more effective at reducingthe separation bubble than blowing downstream (45◦), with a maximum reduction of35 % in the length of the recirculation region at the centre-plane. Moreover, counter-flowinjection results in a materially larger lateral spread of the separation delay, with the effect

204 S. Lardeau and M. A. Leschziner
–0.8 –0.4 0.0 0.4 0.8
x sep
H,L
sep
H
Jet w
idth
xsep /H
Lsep/H
2 3 4 5
0.4
0.3
0.2
ref
αα
– 45
+ 45
CCC
y wH
1.0
1.5
2.0
2.5
3.0
3.5(a) (b)
0.1
10
z Hx H
FIGURE 26. Sensitivity of separation zone to actuation angle. (a) Height of zero-streamwisevelocity locus above the lower wall in jet centre-plane; (b) locus of separation location xsepand recirculation length Lsep; —, baseline case; - - -, Cref ; ◦, Cα+45; �, Cα−45.
extending up to z/H =±0.5, or z/d =±3. This is consistent with the blooming-jet notionalluded to earlier and observed with dramatic effects in preliminary simulations by thepresent authors for actuation into a laminar boundary layer. In contrast, and as is alsoexpected, co-flow injection leads to a narrowing of the region in which separation isdelayed, reflecting a greater coherence of the jet region. The effect of the injection onthe reattachment is not significant, however, although there is a slight upstream shift atboth 45◦ and 135◦.
Figure 19 shows that the actuation angle has a dramatic effect on the momentumthickness downstream of the actuation. Co-flow actuation actually results in a slightreduction in the momentum thickness, while counter-flow actuation leads to a substantialincrease. In view of earlier comments, it might be expected that co-flowing actuationwould yield the most effective control authority. As shown above, this is not the case,and the reason is, evidently, the strong mixing, especially in the spanwise direction, thatcounter-flow injection provokes.
While all three cases lead, globally, to similar reductions in separation, there are somemajor differences in the detailed mechanisms involved. This emerges from figure 27,which gives profiles of the streamwise velocity at five streamwise positions and twoReynolds-stress components at two streamwise positions in the jet centre-plane.
Counter-flow injection is seen to result in much higher levels of turbulence energy atx/H = 1.25, both in the inner and the outer parts of the boundary layer, in contrast tothe other two cases, and hence in the most pronounced delay in separation. This modeof injection also results in the largest obstruction (wake) in the wall-normal layer aroundyw/H = 0.1, simply because of the injection of counter-flow momentum. Curiously, atfirst sight, the shear stress for this case is relatively low around yw/H = 0.05 − 0.1, butreference to the velocity profiles reveals that this is within the wake region of the jet, anarea in which the shear strain is relatively low. The high level of uu is due mainly to thecoherent motion, but the shear stress is much less affected than the coherent componentand dominated by the stochastic processes. In co-flow actuation, the outer turbulence peakis absent, as penetration is much less pronounced, with the jet hugging the wall. The levelof fluctuations is similar to the normal injection case. Here, the shear stress at yw/H = 0.1is highest, and this goes hand-in-hand with the weaker velocity wake and higher shear

Interaction of round synthetic jets with separated boundary layer 205
U/U
inU
/Uin
x H =2.53
–0.2
0.0
0.2
0.4
0.6
0.8
1.0
1.2
0.01 0.10 1.00
0.01 0.10 1.00 0.01 0.10 1.00
0.01 0.10 1.00–0.02
– 0.01
0.00
0.02
0.01
0.03
0.04
0.05
0.06
–0.2
0.0
0.2
0.4
0.6
0.8
1.0
(a) (b)
(c) (d )
–0.02
–0.01
0.00
0.01
0.02
0.03
0.04
yw H yw H
ref
αα
– 45
+ 45
CCC
ref
αα
– 45
+ 45
CCC
ref
αα
– 45
+ 45
CCC
ref
αα
– 45+ 45
CCCx H=1.90
x H=1.25
x H= 0
x H= 4.44
FIGURE 27. Sensitivity of time-mean flow properties to actuation angle in jet centre-plane.(a, c) Streamwise velocity U/Uin; (b) streamwise normal stress uu/U2
in and shear stressuv/U2
in at x/H = 1.25; (d) the same as (b) but at x/H = 2.53.
strain in this region. However, the overall effect on the near-wall layer is not enhancedrelative to wall-normal injection, and the fact that co-flow injection is least effective interms of spanwise control makes this mode of injection least attractive.
The superior effectiveness of the counter-flow injection is confirmed in figure 28.Counter-flow injection results in high levels of turbulence activity over a large wall-normal as well as spanwise area. The high-turbulence tongue extending to the wall ataround z/H = 0.1− 0.3 (right half of plot of figure 28c) is especially noteworthy, and thebroadening of the separation line in figure 26 is clearly associated with it. In co-flowinginjection, the effects of the actuation is clearly much more confined, laterally as wellas in wall-normal direction. While this injection mode generates a tight, high-intensitystreamwise vortex, with high spanwise velocity towards the centre-plane near the wall, theturbulence level at the wall is low, relative to that in counter-flow injection, and thus theseparation control is less effective.
The major differences between the co-flow and counter-flow actuations are clearlyrevealed upon juxtaposing figures 29 and 30, and contrasting both with figure 16 for thewall-normal actuation, all showing the phase-varying periodic fluctuations in streamwiseand wall-normal velocity. In co-flow injection (figure 29), the periodic fluctuations areweaker and the regions of intense fluctuations smaller than in wall-normal actuation. Inparticular, positive near-wall fluctuations are narrow and confined to a smaller portionof the actuation cycle (φ = 1.5 − 2π). This is linked directly to the weaker transversecirculation induced by the actuation and hence lower convective transport of high-

206 S. Lardeau and M. A. LeschzinerCoherent Stochastic Coherent Stochastic
0.005
0.010
0.015
0.020
0
Coherent Stochastic
0.1
0.2
0.3
0.4
0.5
0.6
0
0.005
0.010
0.015
0.020
0.000
Coherent Stochastic
0.1
0.2
0.3
0.4
0.5
0.6
0–0.4 –0.2 0.2 0.40.0
–0.2 0.2 0.40.0 –0.4 –0.2 0.2 0.40.0
0.005
0.010
0.015
0.020
0
0.005
0.010
0.015
0.020
0
–0.4 –0.2 0.2 0.40.0
0.1
0.2
0.3
0.4
0.5
0.6
0
(a) (b)
(c) (d )
0.1
0.2
0.3
0.4
0.5
0.6
0–0.4
yw H
yw H
z H z H
FIGURE 28. (Colour online) Sensitivity of cross-flow fields of the streamwise normal stressto the actuation angle (corresponding to figure 22). (a, b) Cα−45; (c, d) Cα+45; (a, c) x/H = 0;(b, d) x/H = 1.25.
momentum fluid from outer regions towards the wall. In the remainder of the cycle, thenear-wall region is dominated by negative streamwise fluctuations which are ineffectivein terms of separation delay. During the ejection phase, for the counter-flow actuation(figure 30), streamwise momentum is injected into the outer wall-normal region, and thisis clearly reflected by regions of positive streamwise fluctuation away from the wall atφ = 4π/8 − 6π/8, in contrast to the corresponding conditions in wall-normal injection(cf. figure 16). In counter-flow injection (figure 30), the periodic motions are clearlymuch more vigorous and extend far wider in the spanwise direction. The blooming-jetbehaviour arising during the ejection phase is especially well shown by the wall-normalvelocity at φ = 4π/8. The actuation generates pronounced downward motion, both duringthe ejection and suction phases, and this enhances the formation of extensive regions ofpositive fluctuations over a substantial proportion of the actuation cycle, which persist overa significantly larger downstream distance than the other actuation scenarios. These imagesare thus fully consistent with the enhanced separation-control characteristics indicated bythe statistical data.
Overall, the actuation tends to elevate θ/H (figure 19), especially immediatelydownstream of the jet, with one notable exception – namely forward injection at 45◦. Thiselevation reflects primarily the major thickening of the flow by the blocking influence ofthe jet and the wake immediately behind it. Once this thickening has occurred, it tendsto decrease only modestly as the flow evolves on the flat portion preceding the ramp,subject to modest acceleration. As shown already, the jet induces substantial streamwisevortices, which tend, through cross-flow convection and associated turbulence, to promotecross-flow mixing and thus elevate the near-wall velocity. It is this elevation, associatedwith turbulence (both coherent and stochastic) that promotes increased resistance toseparation. In fact, it can be argued that the optimum combination is low jet-induced

Interaction of round synthetic jets with separated boundary layer 207
8 8 10 8 12 8 14 8
0 4 8 6 8
y
xz
y
xz
y
xz
y
xz
y
xz
y
xz
y
xz
y
xz
y
xz
y
xz
y
xz
y
xz
y
xz
y
xz
y
xz
y
xz
2 8
FIGURE 29. Actuated case Cα−45: sensitivity of streamwise periodic motion to injectionangle: isosurfaces of u = ±0.1Uin (+0.1 in blue and −0.1 in red), and of v = ±0.1Uin (+0.1in grey and −0.1 in green), at 8 equally spaced phase values (progressing left to right and topto bottom) covering a whole cycle.
momentum thickening coupled with intensive downstream mixing. As might be expected,momentum thickening is most pronounced at high injection velocity and counter-flowinjection. In both cases, the obstruction to the oncoming flow is large, and thus thickeningis maximised. In contrast, injection at 45◦ hardly affects θ and might be regarded as themost advantageous. However, this fails to take into account the lateral spread of the jet andthus its lateral region of influence on the separation, as explained in an earlier part of thediscussion.
5. ConclusionsThe study has investigated the fluid-mechanic characteristics of a turbulent boundary
layer separating from a rounded ramp and the sensitivity of the separation processto periodic perturbations created by the injection of synthetic round jets. Conclusionsemerging from the study are most appropriately divided into two groups, respectivelyfocusing on global and local characteristics, the former oriented towards the technologicalexploitation of synthetic-jet actuation, and the latter towards fundamental properties.

208 S. Lardeau and M. A. Leschzinery
xz
y
xz
y
xz
y
xz
y
xz
xz xz xz xz
y
xz
y
xz
y
xz
y
xz
y
xz
y
xz
y
xz
y
8 8 10 8 12 8 14 8
y y y0 2 8 4 8 6 8
FIGURE 30. As figure 29 but Cα+45.
Of greatest practical interest is the effect of the actuation on the size of theseparated region, effectively characterising the control authority of the actuation. Thestudy has shown that the present geometric arrangement is not conducive to a strongcontrol authority, because the jet orifices are located 7 diameters upstream of thenominal separation location and are laterally separated by 10 diameters, both reflectingexperimental constraints. Nevertheless, there is an appreciable reduction of around10–20 % in the length of the recirculation zone, depending on the actuation mode andup to 40 % reduction in the thickness of the reverse-flow layer. Despite the actuation-induced increase in momentum thickness, associated with blockage and adverse pressuregradient in the near-wake of the jets, the substantially enhanced level of mixing behindthe actuated jet results in a net benefit of separation delay and also in a modest backwardshift in the mean reattachment location. The most effective actuation involves counter-flowinjection, here at 135◦ relative to the boundary-layer direction. High injection velocity isalso beneficial, but to a lesser extent.
The above figures refer to a region around the jet centre-plane, while the lateral effectsare more modest, with the counter-flow injection yielding the best result. Depending onthe actuation mode, the lateral region of influence on the separation extends to around2–3 orifice diameters on either side of the centre-plane, suggesting the need for orificesto be separated by around 2–5 diameters, rather than 10 as done here, to achieve acredible spanwise uniformity of the control. This is contingent on the orifices remaining

Interaction of round synthetic jets with separated boundary layer 209
in the present streamwise location. However, there are clear indications, derived froman examination of the periodic and stochastic contributions to the statistics, that the jetsshould be placed closer to the separation location, but then the spanwise separation mustalso be reduced.
Although the present paper does not deal explicitly with the sensitivity of the control tothe actuation frequency – the one considered, corresponds to the accepted shedding mode,StH = 0.2 – it is worth noting here that unreported simulations do not provide evidence of asignificant sensitivity in this respect. This is in contrast to slot jets, in which the spanwiseuniformity of the actuation favours a pronounced resonance with the two-dimensionalstability modes of the separated shear layer. Spectra included in the paper for the baselinecase indicate that the most energetic motions indeed correspond to StH = 0.2, relative toStH = 1−2 in the attached boundary layer. Thus, if there is any sensitivity to the actuationfrequency, it is likely that the choice StH = 0.2 is close to optimal.
In terms of fluid-mechanic fundamentals, the study has highlighted, first, the complexnature of the separation processes in the unperturbed flow. Thus, the time-averagedrecirculation zone is very thin at its upstream end and grows gradually. Moreover, theseparated shear layer is characterised by very high levels of turbulence activity, reflectingthe unsteady separation behaviour, which is linked to temporal scale in the boundary layer,as well as the reverse propagation of disturbances linked to the K–H instability in theseparated shear layer. The turbulence-energy budgets indicate a state in the shear layerthat is very far from turbulence equilibrium, with production being 2–3 times higher thandissipation.
In the presence of actuation, an influential process by which the actuation exercisesseparation control is by causing additional mixing due to streamwise vortices andadditional stochastic turbulence provoked by unsteady straining. The time-averaged resultspresent a picture that is akin to that pertaining to continuous-jet injection: thus, thedominant process is the creation of a vigorous pair of vortices in the outer part ofthe boundary layer that causes wall-normal exchange of momentum. This is aided bymuch weaker vortices close to the wall, induced by the outer vortices. The effect ismost pronounced, especially laterally, in the case of counter-flow injection. Second, animportant observation relates to the relative contributions of actuation-induced periodicand stochastic fluctuations to the turbulent stresses. In the region within around 5–7 orificediameters downstream of the injection – that is, upstream of separation – there is a strongdominance of the contribution of the periodic component to both the streamwise stressand the shear stress, both being elevated up to 4-to-5-fold. This is accompanied by a moremodest elevation of the stochastic component. The above elevation occurs primarily inthe outer part of the boundary layer into which the ejected unsteady vortical structurepenetrates due to the high speed of the ejected fluid. The enhancement is much moremodest closer to the wall, where secondary vortices are induced. As the actuated boundarylayer reaches the nominal separation line, the turbulence levels close to the wall arerelatively low, as the boundary layer is firmly attached and more stable than the separatinglayer in the absence of actuation. In the outer layer, both the periodic and stochastic extracontributions are still noticeable, but much reduced relative to those further upstream. Thisstrengthens the conclusion that the position of the orifices has to be closer to the separationlocation, perhaps as close as 1–2 diameters upstream of the separation, to derive morebenefits from the actuation. Once separation has occurred, the influence of the actuationon the turbulence field is minor – that is, most of the control is derived from a delay of theseparation.
Phase-averaged fields of the periodic streamwise- and wall-normal velocityperturbations have brought to light some important differences among the actuation

210 S. Lardeau and M. A. Leschziner
scenarios. An important distinction relates to the predominance of positive near-wallperiodic streamwise perturbations in some scenarios, which then translate to the largestphase- and time-averaged forward shifts in separation location. This is seen especially athigh actuation intensity and counter-flow actuation. This process adds to the benefits ofenhanced mixing, especially in these two actuation cases.
The authors acknowledge the financial support granted to them by Airbus (UK) andthe UK Engineering and Physical Sciences Research Council (EPSRC). Some of thesimulations reported herein were obtained with resources from the UK TurbulenceConsortium, supported by EPSRC. Finally, the authors are grateful to Dr S. Zhong andS. Zhang, of the University of Manchester, for providing their experimental data in digitalform.
R E F E R E N C E S
ARAM, E., MITTAL, R. & CATTAFESTA, L. 2010 Simple representations of zero-net mass-flux jets in grazing flowfor flow-control simulations. Intl J. Flow Control 2 (2), 109–125.
AVDIS, A., LARDEAU, S. & LESCHZINER, M. 2009 Large eddy simulation of separated flow over atwo-dimensional hump with and without control by means of a synthetic slot-jet. Flow Turbul. Combust. 83(3), 343–370.
CATER, J. E. & SORIA, J. 2002 The evolution of round zero-net-mass-flux jets. J. Fluid Mech. 472, 167–200.DANDOIS, J., GARNIER, E. & SAGAUT, P. 2006 Unsteady simulation of a synthetic jet in a crossflow. AIAA J. 44
(2), 225.DANDOIS, J., GARNIER, E. & SAGAUT, P. 2007 Numerical simulation of active separation control by a synthetic jet.
J. Fluid Mech. 574, 25–58.DEJOAN, A. & LESCHZINER, M. A. 2004 Large eddy simulation of periodically perturbed separated flow over a
backward-facing step. Intl J. Heat Fluid Flow 25 (4), 581–592.FISHPOOL, G. M. & LESCHZINER, M. A. 2009 Stability bounds for explicit fractional-step schemes for the
Navier–Stokes equations at high Reynolds number. Comput. Fluids 38 (6), 1289–1298.FROHLICH, J., MELLEN, C., RODI, W., TEMMERMAN, L. & LESCHZINER, M. A. 2005 Highly resolved large-eddy
simulation of separated flow in a channel with streamwise periodic constrictions. J. Fluid Mech. 526 (-1),19–66.
GARCIA-VILLALBA, M., LI, N., RODI, W. & LESCHZINER, M. A. 2009 Large-eddy simulation of separated flowover a three-dimensional axisymmetric hill. J. Fluid Mech. 627, 55–96.
GARCILLAN, L., LIDDLE, S., SUNNEECHURRA, K., CROWTHER, B., ZHONG, S. & WOOD, N. 2006 PIVmeasurements of the effect of pitch and skew on a circular orifice synthetic jet in a turbulent boundary layer.AIAA Paper 318, 2006.
GERMANO, M., PIOMELLI, U., MOIN, P. & CABOT, W. H. 1991 A dynamic subgrid-scale eddy viscosity model.Phys. Fluids A 3, 1760.
GHARIB, M., RAMBOD, E. & SHARIFF, K. 1998 A universal time scale for vortex ring formation. J. Fluid Mech.360, 121–140.
GLEZER, A. 1981 An experimental study of a turbulent vortex ring. PhD thesis, California Institute of Technology.GLEZER, A. & AMITAY, M. 2002 Synthetic jets. Annu. Rev. Fluid Mech. 34 (1), 503–529.GORDON, M. & SORIA, J. 2002 PIV measurements of a zero-net-mass-flux jet in cross flow. Exp. Fluids 33 (6),
863–872.GREENBLATT, D., PASCHAL, K. B., YAO, C., HARRIS, J., SCHAEFFLER, N. W. & WASHBURN, A. E. 2006
Experimental investigation of separation control. Part 1. Baseline and steady suction. AIAA J. 44 (12), 2855.HASAN, M. A. Z. & KHAN, A. S. 1992 On the instability characteristics of a reattaching shear layer with
nonlaminar separation. Intl J. Heat Fluid Flow 13 (3), 224–231.HUSSAIN, A. 1983 Coherent structures: reality and myth. Phys. Fluids 26, 2816.INAGAKI, M., KONDOH, T. & NAGANO, Y. 2005 A mixed-time-scale SGS model with fixed model-parameters for
practical LES. Trans. ASME: J. Fluids Engng 127, 1.

Interaction of round synthetic jets with separated boundary layer 211
JABBAL, M. & ZHONG, S. 2008 The near wall effect of synthetic jets in a boundary layer. Intl J. Heat Fluid Flow29 (1), 119–130.
JIMENEZ, J., HOYAS, S., SIMENS, M. P., MIZUNO, & Y., 2010 Turbulent boundary layers and channels atmoderate Reynolds numbers. J. Fluid Mech. 1–26.
KRISHNAN, V., SQUIRES, K. D. & FORSYTHE, J. R. 2006 Prediction of separated flow characteristics over a hump.AIAA J. 44 (2), 252.
LESCHZINER, M. A. & LARDEAU, S. 2011 Simulation of slot and round synthetic jets in the context ofboundary-layer separation control. Philos. Trans. Royal Soc. A: Math. Phys. Engng Sci. 369, 1495–1512.
LILLY, D. K. 1992 A proposed modification of the Germano subgrid-scale closure method. Phys. Fluids A 4, 633.LUND, T. S., WU, X. & SQUIRES, K. D. 1998 Generation of turbulent inflow data for spatially-developing boundary
layer simulations. J. Comput. Phys. 140 (2), 233–258.MITTAL, R. & RAMPUNGGOON, P. 2002 On the virtual aeroshaping effect of synthetic jets. Phys. Fluids 14, 1533.NEUMANN, J. & WENGLE, H. 2004 Coherent structures in controlled separated flow over sharp-edged and rounded
steps. J. Turbul. 5 (22), 1–24.OPPENHEIM, A. V. & SCHAFER, R. W. 2007 Discrete-time signal processing. Pearson Education; 3 edition (31 Dec
2007), ISBN-13:978-0132067096.OZAWA, T., LESBROS, S. & HONG, G. 2010 LES of synthetic jets in boundary layer with laminar separation caused
by adverse pressure gradient. Comput. Fluids 39, 845–858.PAMART, P. Y., DANDOIS, J., GARNIER, E. & SAGAUT, P. 2010 Large Eddy Simulation Study of Synthetic Jet
Frequency and Amplitude Effects on a Rounded Step Separated Flow, 5th AIAA Shear Flow ControlConference, Chicago, Illinois, 28/06 to 01/07 2010.
RAJU, R., ARAM, E., MITTAL, R. & CATTAFESTA, L. 2009 Simple models of zero-net mass-flux jets for flowcontrol simulations. Intl J. Flow Control 1 (3), 179–197.
RAVI, B. R., MITTAL, R. & NAJJAR, F. M. 2004 Study of three-dimensional synthetic jet flow fields using directnumerical simulation. AIAA Paper 51, 61801.
RHIE, C. M. & CHOW, W. L. 1983 Numerical study of the turbulent flow past an aerofoil with trailing edgeseparation. AIAA J. 21 (11), 1525–1532.
RIZZETTA, D. P., VISBAL, M. R. & STANEK, M. J. 1999 Numerical investigation of synthetic-jet flow fields. AIAAJ. 37 (8).
RUMSEY, C. L., GATSKI, T. B., SELLERS, W. L., VATSA, V. N. & VIKEN, S. A. 2006 Summary of the 2004computational fluid dynamics validation workshop on synthetic jets. AIAA J. 44 (2), 194.
SAFFMAN, P. G. 1981 Dynamics of vorticity. J. Fluid Mech. 106, 49–58.SAU, R. & MAHESH, K. 2008 Dynamics and mixing of vortex rings in crossflow. J. Fluid Mech. 604, 389–409.SCHAEFFLER, N. W. & JENKINS, L. N. 2006 Isolated synthetic jet in crossflow: experimental protocols for a
validation dataset. AIAA J. 44 (12), 2835.SMITH, B. L. & GLEZER, A. 1998 The formation and evolution of synthetic jets. Phys. Fluids 10, 2281.SMITH, B. L. & SWIFT, G. W. 2003 A comparison between synthetic jets and continuous jets. Exp. Fluids 34 (4),
467–472.SONG, S. & EATON, J. K. 2004 Reynolds number effects on a turbulent boundary layer with separation,
reattachment, and recovery. Exp. Fluids 36 (2), 246–258.UDAYKUMAR, H. S., MITTAL, R., RAMPUNGGOON, P. & KHANNA, A. 2001 A sharp interface Cartesian grid
method for simulating flows with complex moving boundaries. J. Comput. Phys. 174 (1), 345–380.WU, D. K. L. & LESCHZINER, M. A. 2009 Large-eddy simulations of circular synthetic jets in quiescent
surroundings and in turbulent cross-flow. Intl J. Heat Fluid Flow 30 (3), 421–434.YOU, D., HAM, F. & MOIN, P. 2008 Discrete conservation principles in large-eddy simulation with application to
separation control over an airfoil. Phys. Fluids 20, 101515.ZAMAN, K. & MILANOVIC, I. 2002 Synthetic jets in cross-flow. Part II. Jets from orifices of different geometry. In
33rd AIAA Fluid Dynamics Conference and Exhibit AIAA Paper 2002-3715, Orlando, FL, 23–26 June.ZHANG, S. & ZHONG, S. 2010 An experimental investigation of turbulent flow separation control by an array of
synthetic jets. AIAA Paper 2010–4582.ZHONG, S., JABBAL, M., TANG, H., GARCILLAN, L., GUO, F., WOOD, N. & WARSOP, C. 2007 Towards the design
of synthetic-jet actuators for full-scale flight conditions. Flow Turbul. Combust. 78 (3), 283–307.ZHOU, J. & ZHONG, S. 2009 Numerical simulation of the interaction of a circular synthetic jet with a boundary
layer. Comput. Fluids 38 (2), 393–405.