J Bamford, H Fortnum, K Bristow, J Smith, G Vamvakas, L ...
202
Current practice, accuracy, effectiveness and cost-effectiveness of the school entry hearing screen J Bamford, H Fortnum, K Bristow, J Smith, G Vamvakas, L Davies, R Taylor, P Watkin, S Fonseca, A Davis and S Hind Health Technology Assessment 2007; Vol. 11: No. 32 HTA Health Technology Assessment NHS R&D HTA Programme www.hta.ac.uk August 2007
Transcript of J Bamford, H Fortnum, K Bristow, J Smith, G Vamvakas, L ...

Current practice, accuracy, effectivenessand cost-effectiveness of the schoolentry hearing screen
J Bamford, H Fortnum, K Bristow, J Smith,G Vamvakas, L Davies, R Taylor, P Watkin, S Fonseca, A Davis and S Hind
Health Technology Assessment 2007; Vol. 11: No. 32
HTAHealth Technology AssessmentNHS R&D HTA Programmewww.hta.ac.uk
The National Coordinating Centre for Health Technology Assessment,Mailpoint 728, Boldrewood,University of Southampton,Southampton, SO16 7PX, UK.Fax: +44 (0) 23 8059 5639 Email: [email protected]://www.hta.ac.uk ISSN 1366-5278
FeedbackThe HTA Programme and the authors would like to know
your views about this report.
The Correspondence Page on the HTA website(http://www.hta.ac.uk) is a convenient way to publish
your comments. If you prefer, you can send your comments to the address below, telling us whether you would like
us to transfer them to the website.
We look forward to hearing from you.
August 2007
Health Technology Assessm
ent2007;Vol. 11: N
o. 32School entry hearing screen
Copyright notice
© Queen's Printer and Controller of HMSO 2007 HTA reports may be freely reproduced for the purposes of private research and study and may be included in professional journals provided that suitable acknowledgement is made and the reproduction is not associated with any form of advertising Violations should be reported to [email protected] Applications for commercial reproduction should be addressed to HMSO, The Copyright Unit, St Clements House, 2–16 Colegate, Norwich NR3 1BQ

How to obtain copies of this and other HTA Programme reports.An electronic version of this publication, in Adobe Acrobat format, is available for downloading free ofcharge for personal use from the HTA website (http://www.hta.ac.uk). A fully searchable CD-ROM isalso available (see below).
Printed copies of HTA monographs cost £20 each (post and packing free in the UK) to both public andprivate sector purchasers from our Despatch Agents.
Non-UK purchasers will have to pay a small fee for post and packing. For European countries the cost is£2 per monograph and for the rest of the world £3 per monograph.
You can order HTA monographs from our Despatch Agents:
– fax (with credit card or official purchase order) – post (with credit card or official purchase order or cheque)– phone during office hours (credit card only).
Additionally the HTA website allows you either to pay securely by credit card or to print out yourorder and then post or fax it.
Contact details are as follows:HTA Despatch Email: [email protected]/o Direct Mail Works Ltd Tel: 02392 492 0004 Oakwood Business Centre Fax: 02392 478 555Downley, HAVANT PO9 2NP, UK Fax from outside the UK: +44 2392 478 555
NHS libraries can subscribe free of charge. Public libraries can subscribe at a very reduced cost of £100 for each volume (normally comprising 30–40 titles). The commercial subscription rate is £300 per volume. Please see our website for details. Subscriptions can only be purchased for the current orforthcoming volume.
Payment methods
Paying by chequeIf you pay by cheque, the cheque must be in pounds sterling, made payable to Direct Mail Works Ltdand drawn on a bank with a UK address.
Paying by credit cardThe following cards are accepted by phone, fax, post or via the website ordering pages: Delta, Eurocard,Mastercard, Solo, Switch and Visa. We advise against sending credit card details in a plain email.
Paying by official purchase orderYou can post or fax these, but they must be from public bodies (i.e. NHS or universities) within the UK.We cannot at present accept purchase orders from commercial companies or from outside the UK.
How do I get a copy of HTA on CD?
Please use the form on the HTA website (www.hta.ac.uk/htacd.htm). Or contact Direct Mail Works (seecontact details above) by email, post, fax or phone. HTA on CD is currently free of charge worldwide.
The website also provides information about the HTA Programme and lists the membership of the variouscommittees.
HTA

Current practice, accuracy, effectivenessand cost-effectiveness of the schoolentry hearing screen
J Bamford,1* H Fortnum,2 K Bristow,1 J Smith,3
G Vamvakas,4 L Davies,4 R Taylor,3† P Watkin,5
S Fonseca,6 A Davis7 and S Hind8
1 Human Communication and Deafness, University of Manchester, UK2 Trent Research and Development Support Unit, University of
Nottingham, UK3 Department of Public Health and Epidemiology,
University of Birmingham, UK4 Health Economics Research, University of Manchester, UK5 Paediatric Audiological Medicine, Whipps Cross Hospital, London, UK6 Developmental Paediatrics, St George’s Hospital, London, UK7 MRC Hearing and Communication Group, University of Manchester, UK8 MRC Institute of Hearing Research, University of Nottingham, UK
* Corresponding author† Present address: Peninsula Technology Assessment Group, Universities of Exeter and
Plymouth, UK
Declared competing interests of authors: A Davis is the Director of the UK NationalNewborn Hearing Screening Programme
Published August 2007
This report should be referenced as follows:
Bamford J, Fortnum H, Bristow K, Smith J, Vamvakas G, Davies L, et al. Current practice,accuracy, effectiveness and cost-effectiveness of the school entry hearing screen. HealthTechnol Assess 2007;11(32).
Health Technology Assessment is indexed and abstracted in Index Medicus/MEDLINE,Excerpta Medica/EMBASE and Science Citation Index Expanded (SciSearch®) and Current Contents®/Clinical Medicine.

NIHR Health Technology Assessment Programme
The Health Technology Assessment (HTA) programme, now part of the National Institute for HealthResearch (NIHR), was set up in 1993. It produces high-quality research information on the costs,
effectiveness and broader impact of health technologies for those who use, manage and provide care inthe NHS. ‘Health technologies’ are broadly defined to include all interventions used to promote health,prevent and treat disease, and improve rehabilitation and long-term care, rather than settings of care.The research findings from the HTA Programme directly influence decision-making bodies such as theNational Institute for Health and Clinical Excellence (NICE) and the National Screening Committee(NSC). HTA findings also help to improve the quality of clinical practice in the NHS indirectly in thatthey form a key component of the ‘National Knowledge Service’.The HTA Programme is needs-led in that it fills gaps in the evidence needed by the NHS. There arethree routes to the start of projects. First is the commissioned route. Suggestions for research are actively sought from people working in theNHS, the public and consumer groups and professional bodies such as royal colleges and NHS trusts.These suggestions are carefully prioritised by panels of independent experts (including NHS serviceusers). The HTA Programme then commissions the research by competitive tender. Secondly, the HTA Programme provides grants for clinical trials for researchers who identify researchquestions. These are assessed for importance to patients and the NHS, and scientific rigour.Thirdly, through its Technology Assessment Report (TAR) call-off contract, the HTA Programmecommissions bespoke reports, principally for NICE, but also for other policy-makers. TARs bring together evidence on the value of specific technologies.Some HTA research projects, including TARs, may take only months, others need several years. They cancost from as little as £40,000 to over £1 million, and may involve synthesising existing evidence,undertaking a trial, or other research collecting new data to answer a research problem.The final reports from HTA projects are peer-reviewed by a number of independent expert refereesbefore publication in the widely read monograph series Health Technology Assessment.
Criteria for inclusion in the HTA monograph seriesReports are published in the HTA monograph series if (1) they have resulted from work for the HTAProgramme, and (2) they are of a sufficiently high scientific quality as assessed by the referees and editors.Reviews in Health Technology Assessment are termed ‘systematic’ when the account of the search,appraisal and synthesis methods (to minimise biases and random errors) would, in theory, permit thereplication of the review by others.
The research reported in this monograph was commissioned by the HTA Programme as project number03/05/01. The contractual start date was in October 2004. The draft report began editorial review inAugust 2006 and was accepted for publication in February 2007. As the funder, by devising acommissioning brief, the HTA Programme specified the research question and study design. The authorshave been wholly responsible for all data collection, analysis and interpretation, and for writing up theirwork. The HTA editors and publisher have tried to ensure the accuracy of the authors’ report and wouldlike to thank the referees for their constructive comments on the draft document. However, they do notaccept liability for damages or losses arising from material published in this report.The views expressed in this publication are those of the authors and not necessarily those of the HTA Programme or the Department of Health.
Editor-in-Chief: Professor Tom WalleySeries Editors: Dr Aileen Clarke, Dr Peter Davidson, Dr Chris Hyde,
Dr John Powell, Dr Rob Riemsma and Dr Ken SteinProgramme Managers: Sarah Llewellyn Lloyd, Stephen Lemon, Stephanie Russell
and Pauline Swinburne
ISSN 1366-5278
© Queen’s Printer and Controller of HMSO 2007This monograph may be freely reproduced for the purposes of private research and study and may be included in professional journals providedthat suitable acknowledgement is made and the reproduction is not associated with any form of advertising.
Applications for commercial reproduction should be addressed to: NCCHTA, Mailpoint 728, Boldrewood, University of Southampton,Southampton SO16 7PX, UK.
Published by Gray Publishing, Tunbridge Wells, Kent, on behalf of NCCHTA.Printed on acid-free paper in the UK by St Edmundsbury Press Ltd, Bury St Edmunds, Suffolk. G

Objectives: To describe and analyse in detail currentpractice of school entry hearing screening (SES) in theUK.Data sources: Main electronic databases weresearched up to May 2005.Review methods: A national postal questionnairesurvey was addressed to all leads for SES in the UK, considering current practice in terms ofimplementation, protocols, target population andperformance data. Primary data from cohort studies inone area of London were examined. A systematicreview of alternative SES tests, test performance andimpact on outcomes was carried out. Finally, a reviewof published studies on costs, plus economic modellingof current and alternative programmes was prepared.Results: The survey suggested that SES is used in mostof England, Wales and Scotland; just over 10% ofrespondents have abandoned the screen; others areawaiting national guidance. Coverage of SES is variable,but is often over 90% for children in state schools.Referral rates are variable, with a median of about 8%.The test used for the screen is the pure tone sweeptest but with wide variation in implementation, withdiffering frequencies, pass criteria and retest protocols;written examples of protocols were often poor andambiguous. There is no national approach to datacollection, audit and quality assurance, and there arevariable approaches at local level. The screen isperformed in less than ideal test conditions andresources are often limited, which has an impact on the
quality of the screen. The primary cohort studies showthat the prevalence of permanent childhood hearingloss continues to increase through infancy. Of the 3.47in 1000 children with a permanent hearing loss atschool screen age, 1.89 in 1000 required identificationafter the newborn screen. Newborn hearing screeningis likely to reduce significantly the yield of SES forpermanent bilateral and unilateral hearing impairments;yield had fallen from about 1.11 in 1000 beforenewborn screening to about 0.34 in 1000 for cohortsthat had had newborn screening, of which only 0.07 in1000 were unilateral impairments. Just under 20% ofpermanent moderate or greater bilateral, mild bilateraland unilateral impairments, known to services as 6-year-olds or older, remained to be identified aroundthe time of school entry. No good-quality publishedcomparative trials of alternative screens or tests forSES were identified and studies concerned with therelative accuracy of alternative tests are difficult tocompare and often flawed by differing referral criteriaand case definitions; with full pure tone audiometry asthe reference test, the pure tone sweep test appears tohave high sensitivity and high specificity for minimal,mild and greater hearing impairments, better thanalternative tests for which evidence was identified.There is insufficient evidence regarding possible harmof the screen. There were no published studiesidentified that examined the possible effects of SES onlonger term outcomes. No good-quality publishedeconomic evaluations of SES were identified and a
Health Technology Assessment 2007; Vol. 11: No. 32
iii
© Queen’s Printer and Controller of HMSO 2007. All rights reserved.
Abstract
Current practice, accuracy, effectiveness and cost-effectiveness ofthe school entry hearing screen
J Bamford,1* H Fortnum,2 K Bristow,1 J Smith,3 G Vamvakas,4 L Davies,4 R Taylor,3†
P Watkin,5 S Fonseca,6 A Davis7 and S Hind8
1 Human Communication and Deafness, University of Manchester, UK2 Trent Research and Development Support Unit, University of Nottingham, UK3 Department of Public Health and Epidemiology, University of Birmingham, UK4 Health Economics Research, University of Manchester, UK5 Paediatric Audiological Medicine, Whipps Cross Hospital, London, UK6 Developmental Paediatrics, St George’s Hospital, London, UK7 MRC Hearing and Communication Group, University of Manchester, UK8 MRC Institute of Hearing Research, University of Nottingham, UK* Corresponding author† Present address: Peninsula Technology Assessment Group, Universities of Exeter and Plymouth, UK

iv
universal SES based on pure tone sweep tests wasassociated with higher costs and slightly higher quality-adjusted life-years (QALYs) compared with no screenand other screen alternatives; the incremental cost-effectiveness ratio for such a screen is around £2500per QALY gained; the range of expected costs, QALYsand net benefits was broad, indicating a considerabledegree of uncertainty. Targeted screening could bemore cost-effective than universal school entryscreening; however, the lack of primary data and thewide limits for variables in the modelling mean that anyconclusions must be considered indicative andexploratory only. A national screening programme forpermanent hearing impairment at school entry meets
all but three of the criteria for a screening programme,but at least six criteria are not met for screening fortemporary hearing impairment.Conclusions: The lack of good-quality evidence in thisarea remains a serious problem. Services should improve quality and audit screen performance foridentification of previously unknown permanent hearingimpairment, pending evidence-based policy decisionsbased on the research recommendations. Furtherresearch is needed into a number of important areas including the evaluation of an agreed nationalprotocol for services delivering SES to make futurestudies and audits of screen performance more directlycomparable.
Abstract

Health Technology Assessment 2007; Vol. 11: No. 32
v
© Queen’s Printer and Controller of HMSO 2007. All rights reserved.
Contents
List of abbreviations .................................. vii
Executive summary .................................... ix
1 Background and main questions ............... 1Historical background ................................ 1The nature of childhood hearing impairment ................................................. 1Main questions and overall design of the study ........................................................... 2
2 National survey of current screening practice ...................................................... 5Introduction ............................................... 5Methods ...................................................... 5Results ........................................................ 6Summary .................................................... 16
3 Possible effects of newborn hearing screening on the school entry hearing screen: evidence from a series of studies in Waltham Forest ..................................... 17Introduction ............................................... 17Changes in the programmes of early screening and identification ....................... 17Evaluating the SES ..................................... 18Generalising the study ............................... 19Changes in the SES .................................... 19Results ........................................................ 20Summary .................................................... 28
4 Systematic review of the effectiveness ofschool entry hearing screening ................. 31Background ................................................ 31Hypotheses tested in the review (researchquestions) ................................................... 31Methods ...................................................... 31Studies included in the review ................... 33Studies excluded from the review .............. 33Results of review ......................................... 33Summary of findings .................................. 48
5 Cost-effectiveness and cost-effectivenessacceptability of the school entry hearing screen ......................................................... 49Methods ...................................................... 49Results ........................................................ 57Summary .................................................... 72
6 Summary and conclusions ......................... 75Introduction: strengths and weaknesses of the study ..................................................... 75Summary of findings .................................. 77The OME issue and some further analyses ....................................................... 80Conclusions ................................................ 82Implications for practice ............................ 84Recommendations for future research ....... 84
Acknowledgements .................................... 87
References .................................................. 89
Appendix 1 Screening at school entry forchildhood hearing impairment: an appraisal against National ScreeningCommittee criteria ..................................... 93
Appendix 2 Questionnaire used in the survey of national practice ......................... 103
Appendix 3 Prevalence rates for permanentchildhood hearing impairment for threecohorts in Waltham Forest and RedbridgeDistricts and for one cohort in Trent Region of the UK .................................................... 119
Appendix 4 Search strategies used in thesystematic review ........................................ 123
Appendix 5 Quality criteria for systematicreviews ........................................................ 129
Appendix 6 Quality criteria for diagnostic test studies .................................................. 133
Appendix 7 Excluded studies and reasons for exclusions .............................................. 137
Appendix 8 Summary of quality of systematic reviews ....................................... 141
Appendix 9 Quality of primary studies ..... 143
Appendix 10 Two by two tables for sensitivity and specificity where available ...................................................... 147

Appendix 11 Economic search strategies ..................................................... 151
Appendix 12 Subsequent managementintervention search strategies .................... 153
Appendix 13 Inclusion/exclusion economicdata form .................................................... 155
Appendix 14 Inclusion/exclusion subsequent interventions data form .......... 157
Appendix 15 Economic data extraction form ............................................................ 159
Appendix 16 Description of included papers ......................................................... 167
Health Technology Assessment reportspublished to date ....................................... 169
Health Technology Assessment Programme ................................................ 185
Contents
vi

Health Technology Assessment 2007; Vol. 11: No. 32
vii
© Queen’s Printer and Controller of HMSO 2007. All rights reserved.
AABR automated auditory brainstemresponse
ABR auditory brainstem response
AOAE automated otoacoustic emissions
ASHA American Speech and LanguageHearing Association
BACDA British Association of CommunityDoctors in Audiology
BHE better hearing ear
CASP Critical Skills Appraisal Programme
CEAC cost-effectiveness acceptability curve
CI confidence interval
CRD Centre for Reviews andDissemination
df degrees of freedom
DNA did not attend
DPOAE distortion product otoacousticemissions
ENT ear, nose and throat
HB health board
Hib Haemophilus influenzae type b
HL hearing level
ICER incremental cost-effectiveness ratio
IDT Infant Distraction Test
IQR interquartile range
LHSCG local health and social care group
MMR measles, mumps and rubella
MRC Medical Research Council
NA not applicable
NHSP Newborn Hearing ScreeningProgramme
NICE National Institute for Health andClinical Excellence
NNHS no neonatal hearing screen
NPV negative predictive value
NR not reported
NZHTA New Zealand Health TechnologyAssessment
OME otitis media with effusion
PCHI permanent childhood hearingimpairment
PCT primary care trust
PPV positive predictive value
PSA probabilistic sensitivity analysis
PT pure tone
PTA pure tone audiometry
QALY quality-adjusted life-year
QUADAS Quality Assessment of Studies ofDiagnostic Accuracy
R&D research and development
RCT randomised controlled trial
RICHS Regional Interactive Child HealthSystem
continued
List of abbreviations

List of abbreviations
viii
List of abbreviations continuedROC receiver operating characteristic
SD standard deviation
SEM school entry medical examination
SES school entry hearing screen
SES-C composite school entry screening
SES-PQ SES using parental questionnaire
SES-PTS SES using pure tone sweep testing
SES-SW SES using spoken word tests
SES-T SES using tympanometry
SHA strategic health authority
STARD Standards for Reporting Studies ofDiagnostic Accuracy
SVEP Sweep Visual Evoked Potential
TEOAE transient evoked otoacousticemission
TNHS targeted neonatal hearing screen
UNHS universal newborn hearing screen
VASC verbal audiometric screening forchildren
WHE worse hearing ear
YNHI year with no hearing impairment
All abbreviations that have been used in this report are listed here unless the abbreviation is well known (e.g. NHS), or it has been used only once, or it is a non-standard abbreviation used only in figures/tables/appendices in which case the abbreviation is defined in the figure legend or at the end of the table.

Health Technology Assessment 2007; Vol. 11: No. 32
ix
© Queen’s Printer and Controller of HMSO 2007. All rights reserved.
BackgroundThe ability to hear is important, particularlyduring children’s formal education. Hearingimpairment is amenable to intervention and hencea screening programme when children begin theirschool careers has potential value. School entryhearing screening (SES) has been implementedthroughout the UK since the 1950s. There isevidence of mixed practice and uncertainty aboutthe value of the screen. In addition, recentchanges in childhood hearing screening policy(abandonment of a screen at 8 months andintroduction of universal newborn screening) haveimplications for identification of children withhearing impairment at school entry.
ObjectivesThis report aimed to determine answers to thefollowing three questions:
● What is current practice for the SES in the UK?● What is known about the accuracy of alternative
screening tests and the effectiveness ofinterventions?
● What is known about costs, and what is thelikely cost-effectiveness of the SES?
MethodsA national postal questionnaire survey wasaddressed to all leads for the SES in the UK,considering current practice in terms ofimplementation, protocols, target population andperformance data. Primary data from cohortstudies in one area of London were examined. Asystematic review of alternative SES tests, testperformance and impact on outcomes was carriedout. Finally, a review of published studies on costs,plus economic modelling of current andalternative programmes was prepared.
ResultsThe evidence from the national survey of currentpractice is that:
● the SES is in place in most areas of England,Wales and Scotland; just over 10% ofrespondents have abandoned the screen; othersare awaiting guidance in the light of thenational implementation of newborn hearingscreening
● coverage of the SES is variable, but is often over90% for children in state schools
● referral rates are variable, with a median ofabout 8%
● the test used for the screen is the pure tonesweep test but with wide variation inimplementation, with differing frequencies, passcriteria and retest protocols; written examplesof protocols were often poor and ambiguous
● there is no national approach to data collection,audit and quality assurance, and there arevariable approaches at local level
● the screen is performed in less than ideal testconditions
● resources are often limited and this has animpact on the quality of the screen.
The evidence from the primary cohort studies isthat:
● the prevalence of permanent childhood hearingimpairment continues to increase throughinfancy
● of the 3.47 in 1000 children with a permanenthearing impairment at school screen age, 1.89in 1000 required identification after thenewborn screen
● the introduction of newborn hearing screeningis likely to reduce significantly the yield of SESfor permanent bilateral and unilateral hearingimpairments; yield had fallen from about 1.11in 1000 before newborn screening to about 0.34in 1000 for cohorts that had had newbornscreening, of which only 0.07 in 1000 wereunilateral impairments
● just under 20% of permanent moderate orgreater bilateral, mild bilateral and unilateralimpairments, known to services as 6-year-oldsor older, remained to be identified around thetime of school entry.
The evidence from the systematic review of thealternative tests and of the effectiveness ofinterventions is that:
Executive summary

● no good-quality published comparative trials ofalternative screens or tests for school entryhearing screening were identified
● studies concerned with the relative accuracy ofalternative tests are difficult to compare andoften flawed by differing referral criteria andcase definitions; with full pure tone audiometryas the reference test, the pure tone sweep testappears to have high sensitivity and highspecificity for minimal, mild and greaterhearing impairments, better than alternativetests for which evidence was identified
● there is insufficient evidence to draw anyconclusions about possible harm of the screen
● there were no published studies identified thatexamined the possible effects of SES on longerterm outcomes.
The evidence from the cost-effectiveness study isthat:
● no good-quality published economic evaluationsof SES were identified
● a universal SES based on pure tone sweep testswas associated with higher costs and slightlyhigher quality-adjusted life-years (QALYs)compared with no screen and other screenalternatives; the incremental cost-effectivenessratio for such a screen is around £2500 perQALY gained; the range of expected costs,QALYs and net benefits was broad, indicating aconsiderable degree of uncertainty
● targeted screening could be more cost-effectivethan universal SES
● lack of primary data and the wide limits forvariables in the modelling mean that anyconclusions must be considered indicative andexploratory only.
A national screening programme for permanenthearing impairment at school entry meets all butthree of the criteria for a screening programme,but at least six criteria are not met for screeningfor temporary hearing impairment.
ConclusionsThe lack of good-quality evidence in this arearemains a serious problem. Services shouldimprove quality and audit screen performance foridentification of previously unknown permanenthearing impairment, pending evidence-basedpolicy decisions based on the researchrecommendations.
Recommendations for researchFurther research is highlighted in the followingareas:
● evaluation of an agreed national protocol forservices delivering the SES to make futurestudies and audits of screen performance moredirectly comparable
● development and evaluation of systems for datamonitoring so that robust data on screenperformance are available
● determination with greater certainty of theprevalence of congenital unilateral hearingimpairment, and permanent mild and minimalhearing impairment at school entry, that couldbe identified by a suitable quality-assured screenprotocol
● a comparison of the effectiveness, efficacy andefficiency of alternative approaches (reactiveservices, formal surveillance, targeted screeningand universal screening at school entry age) tothe identification of permanent hearingimpairment postnewborn screen
● controlled studies of the effectiveness of hearingscreening and subsequent interventions for lateroutcomes in children with permanent mild,minimal and unilateral hearing impairmentidentified at school entry
● determination of the distribution of detectionthresholds for pure tones in the population atschool entry.
x
Executive summary

Historical backgroundThere is a long history in the UK of screening forhearing impairment in childhood. By the 1930shearing screening by various methods was beingimplemented at school entry, which at that timerepresented the most obvious point at which thechild population was available for mass screening.In 1955, as simple screening audiometers becameavailable, it was recommended that all childrenundergo school entry hearing screening using thepure tone ‘sweep’ test.1 This test requires the childto indicate that he or she has detected each of anumber of tones of different frequencies (pitches)presented to each ear separately at an intensitylevel indicative of normal hearing. The screenquickly became established across the UK,organised and managed through local authorityschool health services. In 1976 the Court Reportrecommended that hearing screens be carried outat least twice in school.2 However, there was nonationally agreed protocol for the screen, andimplementation thus varied in small but possiblyimportant details across services.
In the 1974 reorganisation of local government theschool health service was brought into the NHS,and the school entry hearing screen (SES) hasremained the responsibility of the NHS ever since,undertaken in the main by school nurses andcommunity paediatricians. Evidence about the costsand effectiveness of the screen has remainedelusive, as has clarity about its aims, despite anumber of reviews.3–6 There are anecdotal reportsthat some services have supplemented the puretone sweep test with other tests, while others aresaid to have abandoned the screen in the light oflack of national guidance and unwanted variabilityfrom a variety of sources, including screenprotocols, test environment (schools can be noisyplaces), tester competence and equipmentcalibration. Despite this, there has until recentlybeen a widespread if implicit consensus that thepure tone sweep test has value educationally andprovides a safety net to catch any deficiencies of theearlier screening system in the overall public healthprovision,4 a position broadly endorsed by Hall.7
Haggard’s4 comment on the deficiencies of theearlier screening system refers to the Infant
Distraction Test (IDT) screen. From the mid-1950sa hearing screen was performed on all infants inthe UK aged 8 months using the IDT.8 This is abehavioural test in which sounds are presented tothe infant under controlled conditions and thechild’s responses, if any, noted. However, thisapparently simple test did not perform well, andthere were credible reports of high referral rates,with high false-positive and false-negative rates.During the 1990s, developments in technologymade it possible to test the auditory function ofnewborn babies using otoacoustic emissions and/orauditory evoked responses. A review in 19975 ledto a policy decision in England (with Wales,Scotland and Northern Ireland following suit) tophase out the IDT screen and to replace it with anational programme of newborn hearingscreening. The newborn screen in England is acontingent two-test screen involving an automatedotoacoustic emissions (AOAE) test followed, ifeither ear fails to show a clear response, by anautomated auditory brainstem response (AABR)test, again requiring a clear response on both earsfor a pass decision. The Newborn HearingScreening Programme (NHSP) was fullyimplemented in England by March 2006; theevidence is that it is highly effective, reducing theage of identification of permanent congenitalbilateral hearing impairment of moderate orgreater degree from some 80 weeks to 10 weeks ofage.9,10 The extent of the beneficial effects of thisearly identification for children with permanenthearing impairment upon developmentaloutcomes in general, and communication inparticular, has been demonstrated,11 althoughmuch detail remains to be added.
The nature of childhood hearingimpairmentHearing impairment in childhood can bepermanent or temporary. Permanent childhoodhearing impairment of a moderate degree orgreater [i.e. detection thresholds >40 dB hearinglevel (HL) averaged across 0.5, 1, 2 and 4 kHz] ispresent at birth at a rate of about 1.6 per 1000 livebirths, of which approximately 1.0 in 1000 arebilateral impairments and 0.6 in 1000 areunilateral impairments.5,10 In terms of incidence,
Health Technology Assessment 2007; Vol. 11: No. 32
1
© Queen’s Printer and Controller of HMSO 2007. All rights reserved.
Chapter 1
Background and main questions

this means that in the UK about 800 children peryear will be born with permanent bilateral hearingimpairment of a moderate or greater degree; andabout 500 per year will be born with unilateralhearing impairment (i.e. hearing within normallimits in one ear, but hearing impairment ofmoderate or greater degree in the other ear).There is good evidence that the prevalence ofpermanent bilateral moderate or greater hearingimpairment increases through the first decade ofchildhood.12,13 The reasons for this are notentirely clear, but include meningitis, measles andother causes of acquired impairment; progressionof unilateral to bilateral impairments; and late-onset/progressive impairments linked to prenatalor perinatal infection or to hereditary factors. It ispossible that the prevalence of bilateral moderateor greater impairment reaches 2 in 1000 by theage of about 9 years.
The evidence on permanent unilateral hearingimpairment is more limited. Although it appearsfrom NHSP data that the prevalence at birth isabout 0.6 in 1000, it is not known whether thereare significant numbers of later onset cases,whether some of the impairments are progressive,and whether there is a tendency for congenital orpostnatal unilateral hearing impairment toprogress to bilateral impairment. Unilateralhearing impairment would be expected to affectauditory perception in various predictable ways,such as poor localisation of sound sources, anddifficulty in noisy or reverberant environmentssuch as schools, and there is some evidence ofdetrimental effects on academic progress.14 Unlikebilateral permanent childhood hearingimpairment however, management of unilateralimpairment remains uncertain, and it is notknown whether early family advice and support, ahearing aid in the affected ear or otherapproaches would be helpful.
The significance of the increase in prevalence inpermanent hearing impairment in the first decadeof life is that a newborn hearing screeningprogramme would fail to detect these additionalcases and other processes are required, whetherbased on professional responsiveness to parentalobservations, structured surveillance, or laterscreening. In addition, the newborn screen aspresently conceived will not identify mild andminimal permanent hearing impairment, whereasa later screen could.
In children, temporary hearing impairment ismuch more common than permanent hearingimpairment. It is linked in the main to colds and
upper respiratory tract infections that lead to otitismedia with effusion (OME) – the presence of fluidin the middle ear. There is a huge literature onOME (see Haggard and Hughes 199115 for anearly but comprehensive review), which addressesprevalence, pathology, assessment, managementoptions, the time-course, and short-, medium- andlong-term effects of the condition. The pointprevalence of OME is of the order of 15–25% inthe 0–6-year-old age group, with peaks in the firstyear of life and at school entry.15–17 The periodprevalence across that age range may be as high as80%. Most cases resolve within 2–3 months. Somerecur, and some persist for much longer. In thosethat do, there can be significant short- andmedium-term effects not only on hearing, but alsoon behaviour, socialisation, speech and academicprogress. The difficulty for services is to be able toidentify those cases, perhaps around 3 or 4%, thatare likely to have the condition recurrently, and/orwith a persistence and severity likely to causeconcern (i.e. to affect significantly development,whether attention, communication, behaviour orother domains). Although case finding is donethrough hearing impairment, intervention optionsmay be directed at other effects, and includeadvice for parents and teachers, speech andlanguage therapy, and/or surgery to remove thefluid and decrease the chance of recurrence[myringotomy, ventilation tubes (grommets),adenoidectomy].
Main questions and overall designof the studyDespite several attempts, some of which arerecent,5,6 to investigate the value and effectivenessof the SES in the UK, there remains a pressingneed to understand the pattern of current practice(which has developed ‘bottom–up’) and to evaluatethe likely accuracy of alternative tests and costsand effectiveness of the screen to guide policydecisions. Furthermore, the introduction ofnewborn hearing screening to replace theunderperforming 8-month hearing screen hassignificantly changed the landscape of hearingscreening in childhood. Whereas the 8-month IDTscreen was very unlikely to identify permanentunilateral hearing impairment, the newbornscreening protocol will identify unilateral as well asbilateral permanent hearing impairment; thispotentially reduces one of the justifications for theSES. However, the SES might continue to yieldsignificant numbers of mild, high-frequency orlate-onset/progressive impairments that wouldotherwise be missed (or missed until later
Background and main questions
2

concerns led to identification), and might identifysignificant numbers of children with persistentmiddle ear disorders not otherwise known toservices at a time when good hearing is ofparticular importance educationally.
These uncertainties lie behind the currentresearch study. The authors were commissioned in2004 by the HTA Programme of the NHSResearch and Development initiative to
● carry out a national survey of current SESpractice
● conduct a systematic review of the accuracy ofalternative screening tests and the effectivenessof subsequent interventions
● assess the costs of the screen and to model cost-effectiveness.
The study therefore has three strands:
● Strand 1 (reported in Chapter 2) is a nationalquestionnaire survey of current practice. Asurvey instrument was designed and piloted,and the final version completed by leadclinicians/managers for the SES across the UK.The questionnaire was designed to collectinformation on whether the screen was stillbeing implemented, what tests and protocolswere being used, what the target populationwas, who performed the screen and where, withwhat training and what equipment, andwhether any screen performance data werecollected and available.
● Strand 2 (reported in Chapter 4) is a systematicreview of the existing research literature whichaims to evaluate the accuracy of alternativeapproaches to a school entry hearing screen,and to summarise the evidence on screenperformance (i.e. screen uptake and yield fordifferent screen options and different casedefinitions) and the impact of the screen onchildren’s outcomes (language, communication,social and educational).
● Strand 3 (reported in Chapter 5) is anassessment of the costs, outcomes andassociated levels of uncertainty of alternativemodels of school entry screening usingeconomic modelling techniques.
Throughout the three strands, cognisance is takenof three distinct possible case definitions: first,children with moderate, severe or profoundbilateral permanent hearing impairment, forwhom the evidence on the consequences of notidentifying and intervening appropriately isstrong; secondly, children with permanent mild,
minimal or unilateral hearing impairment, orhearing impairment affecting only somefrequencies, about which the evidence onconsequences, intervention (and prevalence) is lessclear; and thirdly, children with temporary hearingimpairment associated with persistent and/orsevere OME, the treatment for and sequelae ofwhich give rise to considerable controversy.18 Onereason for this is that while permanent hearingimpairment has a variety of causes, the treatmentand management are in the main directed at thehearing impairment itself; for children with OME,however, although there is a coherent set ofdisease processes at its core about whichsomething is known, hearing impairment is by no means the whole story, and interventionsaim to treat more than just the hearingimpairment.
Since the evidence base for the characteristics andyield of screening for the latter two categories is soweak, the study also considers a case definition interms of a disability measure for which there issome evidence, hearing in noise, or specifically theminimum signal to noise ratio required to score ata given criterion level on a speech perception task.
When gathering evidence on the effectiveness andthe efficiency of the SES for each of these casedefinitions, it is important in the cost-effectivenessmodelling (strand 3) to take account of the likelyincremental yield of the screen: for this one needsto know, or to be able to estimate, the number ofcases that remain to be identified by the SES afterthe identification of these cases by the newbornhearing screen, standard surveillance, parentalconcern and professional responsiveness. As well asreferring to the published evidence on prevalenceof cases and yields of screens and systems beforeschool entry, the researchers examined primarydata from cohort studies to which they have directaccess through authorship (Chapter 3). One ofthese (from Watkin) was a series of studiesundertaken in Waltham Forest where universalnewborn screening was introduced some 10 yearsago (so the outcomes from recent SES cohortswould be expected to reflect the effect of newbornscreening on cases left to be found), and the otherhas been the use of a large database of childrenwith persistent OME from the Medical ResearchCouncil (MRC) Otitis Media Study Group toanswer some specific questions thrown up by thediscussions and to address the issue of theeffectiveness of subsequent interventions for OME.
The authors decided at an early stage not toreview the literature on the effectiveness of
Health Technology Assessment 2007; Vol. 11: No. 32
3
© Queen’s Printer and Controller of HMSO 2007. All rights reserved.

treatment of OME fully or in a concentrated way,for two main reasons. First, it is very large andheterogeneous, with much of it of poor quality,giving some information but not of the type thatcan be easily extracted from aggregating theresults of the studies of best quality. Secondly, asnoted above, hearing is neither the only relevantnor necessarily the ultimate outcome of suchtreatment. Nevertheless, since there is a highcontinuing risk of two recent trials particularlyrelevant to screened caseloads continuing to bemisinterpreted in relation to other evidence(arising from the generally poor understanding ofthe importance of the characteristics ofpopulations selected and the economic pressures
in differing health systems), the interpretation andimplications of these particular studies arediscussed.
Finally, Chapter 6 outlines the strengths andweaknesses of the study, summarises the findingsfrom each strand, draws together the evidence onscreening at school entry in the UK from all threestrands into a series of conclusions and makesrecommendations. The conclusions are used toexamine the justification for the SES as a route toidentifying children with permanent andtemporary hearing impairment in the light of theNational Screening Committee’s criteria forscreening programmes (Appendix 1).
Background and main questions
4

IntroductionScientific backgroundA national survey of paediatricians responsible forthe SES in the UK6 confirmed clinical impressionsthat services had evolved such that there wasconsiderable variation between services in terms ofprogramme organisation, pass/fail criteria, casemanagement and screen performance, despiterecommendations to retain and standardise theSES.19 At the time of that survey of 96 services, fourservices had discontinued their SES programme asa result of local audit.20 In programmes where theSES was not carried out by dedicated screeners,competing programmes, such as immunisation,took priority over the SES, affecting itsperformance. There was also an awareness thatinformation may have been incomplete as therewere no available data from services that may havebeen provided by non-medical service leads.
In recent years consideration has been given to theimpact on individual children of unrecognisedmild, unilateral or temporary hearingimpairment21,22 and the possible need to identifyand manage these children. There is also growingdebate about the likely impact of newborn hearingscreening on the yield of new cases from the SESand about cases that will not be detected by theNHSP.12 Evidence is emerging that services willundergo further revision on an ad hoc basis as aresult of the changing pattern in the yield from theSES following the introduction of newborn hearingscreening and local variation in the epidemiologyof hearing impairment (see Chapter 3).
This chapter provides an up-to-date account ofcurrent practice and performance of the SES inthe UK.
AimsThe aims of this study were to describe andanalyse in detail current practice of the SESthroughout the UK, in order to:
● quantify variability in screening practicenationally
● evaluate current screen performance asreported by service leads in terms of screencoverage, referral rates and yield
● record the views of SES leads regarding thevalue of the screen together with their ideas forimprovements or alternatives.
MethodsEthics and NHS Research andDevelopment ApprovalThe study met the criteria for a multicentre studywith no local investigators. Application for fullethical approval for the UK was submitted to theCentral Manchester Local Research EthicsCommittee. Local research and development(R&D) approval was applied for in all primarycare trusts (PCTs) in England, NHS acute trustswhich employed an SES lead clinician, theprimary care arm of each health board (HB) inScotland, the NHS trusts in Wales and local healthand social care groups (LHSCGs) in NorthernIreland. Some R&D departments for the PCTs aregrouped into consortia with administrativeresponsibility for a number of PCTs, varying fromtwo to 15. Applications for approval were made to124 departments.
Identification of service leads for SESprovision Service delivery of the SES varies across the UK interms of the organisations responsible forcoordinating the programme and employing staffwho undertake it. It was therefore necessary to useseveral lines of enquiry to identify and recruit theservice leads.
● Letters were sent to all members of the BritishAssociation of Community Doctors in Audiology(BACDA) asking them to contact the researchteam if they were responsible for the SES intheir area or, if they were not, to return thename of the responsible person if they knew it.
● The Directory of Community Nursing2004/200523 was used to identify school nursingdepartments.
● Advertisements were placed in the BACDAnewsletter and British Society of Audiologynewsletter.
● Oral and poster presentations were made to the28th Annual Children’s Hearing ScreeningConference.
● ‘Cold calls’ were made to NHS trusts.
Health Technology Assessment 2007; Vol. 11: No. 32
5
© Queen’s Printer and Controller of HMSO 2007. All rights reserved.
Chapter 2
National survey of current screening practice

Development of a postalquestionnaire/survey instrumentA postal questionnaire (Appendix 2) wasdeveloped to establish:
● the target population of children who areroutinely entered in the SES programme
● locations and conditions under which the screenis performed
● test methods used● pass/fail criteria ● who carries out screening tests and equipment
used for screening● data management systems used● coverage, referral rates and yield of the
screen ● views of the SES leads regarding the screen.
The questionnaire was reviewed by the project’sadvisory committee and piloted by sevenaudiology professionals closely related to therunning of the SES in their area. Theseprofessionals were identified either via BACDA orthrough contacts known to members of theresearch group. Changes were made following thepilot and the questionnaire was finalised.
Data collectionQuestionnaires were posted to all identifiedservice leads between September and November2005 with a covering letter giving further detailsabout the study and a reply-paid envelope. If theservice lead failed to return the completed surveywithin 4 weeks a reminder letter and an additionalcopy of the questionnaire were posted to them.Those leads failing to respond within anadditional 2 weeks were contacted by telephone. Afinal telephone reminder was made after a further2 weeks and if, at this stage, no reply was receivednon-response was assumed.
Data were entered into an Access database by oneresearcher (KB) and 10% of questionnaires wereentered independently by another (HF) to check for errors in data entry. Data were converted to Excel for analysis and possiblecompletion errors checked by identifying outliervalues.
ResultsEthics and NHS research anddevelopment approval The Central Manchester Local Research EthicsCommittee granted final approval for the study inMay 2005.
In England, Scotland and Wales 124 R&Ddepartments were approached for approval,covering a total of 304 NHS trusts. Owing todifficulties in identifying the relevant departments,R&D applications could be made to only two outof 15 LHSCGs within Northern Ireland. Six R&Ddepartments covering seven NHS trusts inEngland did not give approval for the followingreasons:
● One required a separate consent sheet with thequestionnaire and information letter.
● Two required full Criminal Records Bureau andlocally administered occupational health checksfor the principal investigator to secure anhonorary contract.
● Three approvals were still pending at the timeof writing.
Questionnaires were not posted to any staffemployed by these seven trusts.
ResponseIn the UK, 244 services responsible for the SESwere identified. This does not match the numberof primary care organisations because it wascommon for services to cover a geographical areaencompassing more than one primary careorganisation; that is, the PCT/LSHCGs/Welsh andScottish HB boundaries did not match the SESservice boundaries.
Questionnaires were sent to 229 service leads and195 (85.2%) responded (Table 1).
The numbers of PCTs that were covered by areturned questionnaire within each of the 28strategic health authorities (SHAs) in England areshown in Table 2.
In only two of the 28 SHAs the survey failed toachieve 70% coverage of PCTs. Overall, 86.5% ofPCTs in England are represented in the survey.
Within Scotland questionnaires were returnedfrom ten SES services covering ten out of 15(66.7%) HBs. In Wales eight SES services returneda questionnaire, covering 16 out of 22 (72.7%)local health boards. In Northern Ireland, one SESservice covering one out of 15 LHSCGs returned aquestionnaire.
Questionnaire findingsThe descriptive results for each question in thequestionnaire are detailed. The responses fromeach of the countries have been grouped togetherto represent the response for the UK as a whole.
National survey of current screening practice
6

In all cases ‘n’ refers to the numbers of serviceleads indicating that response. Unless otherwiseindicated, percentages are of the total number (n)of services responding to that question. Missingdata are tabulated separately as a percentage of195 responses. When relevant, the missing valuesinclude the ten services who reported that they nolonger run an SES (see next subsection).
Population entered into the SES programmeTwenty-four services (12.2%) no longer run auniversal school entry hearing screen; 11 run noscreen and 13 implement a targeted screen. Tenservices gave reasons for not running a screen atall, including resource limitations (five) and lowyield (six). Only two services running a targetedscreen gave reasons, both resource limitations. All
Health Technology Assessment 2007; Vol. 11: No. 32
7
© Queen’s Printer and Controller of HMSO 2007. All rights reserved.
TABLE 1 Number of SES services identified in each country, number sent a questionnaire and number responding
Services
No. identified No. sent a Responsequestionnaire(contacted) n % of identified % of contacted
England 208 201 176 84.6 87.6Scotland 15 15 10 66.7 66.7Wales 11 11 8 72.7 72.7Northern Ireland 10 2 1 10.0 50.0Total 244 229 195 79.9 85.2
TABLE 2 Geographical coverage by PCTs in England
PCTs in each SHA
SHA No. within the SHA No. (%) covered by a returned questionnaire
Avon, Gloucestershire & Wiltshire 12 12 (100)Bedford and Hertfordshire 11 6 (54.5)Birmingham and the Black Country 12 9 (75)Cheshire & Merseyside 15 13 (86.7)County Durham & Tees Valley 10 10 (100)Coventry, Warwickshire, Herefordshire & Worcestershire 8 8 (100)Cumbria & Lancashire 13 12 (92.3)Dorset & Somerset 9 8 (88.9)Essex 13 12 (92.3)Greater Manchester 14 13 (92.9)Hampshire and Isle of Wight 10 9 (90)Kent and Medway 9 8 (88.9)Leicestershire, Northamptonshire & Rutland 9 8 (88.9)London North Central 5 5 (100)London North East 7 5 (71.4)London North West 8 8 (100)London South East 6 5 (83.3)London South West 5 4 (80)Norfolk, Suffolk and Cambridgeshire 17 14 (82.3)North and East Yorkshire and Northern Lincolnshire 10 6 (60)Northumberland, Tyne and Wear 6 6 (100)Shropshire and Staffordshire 10 9 (90)South West Peninsula 11 10 (90.9)South Yorkshire 9 8 (88.9)Surrey and Sussex 15 12 (80)Thames Valley 15 14 (93.3)Trent 19 14 (73.7)West Yorkshire 15 14 (93.3)Total 303 262 (86.5)

but two of the remaining 172 services screen allchildren in state schools. Table 3 indicates theextent to which the SES is offered to children indifferent educational environments.
Only 20.4% (37/181) of services screen all childrenin private schools. An additional 28.7% (52/181)screen some such children usually when requestedto do so. Services that do not routinely screenchildren in private schools commented that theydid perform screening when the school requestedit (n = 31), but others said that resources preventedthem giving full coverage (n = 10). Several saidthat private schools have their own arrangementsfor screening. The proportion of children in theUK attending private schools is up to 7%.24 Oneservice that does not run a universal SES at alldoes carry out screening in two private schools ona fee-for-service basis. This was reported to bebecause the private schools insisted on having ascreen and the service therefore provided it tomake sure that it was conducted properly.
It was found that 55.5% (97/174) of services screenall (21.3%, 37/174) or some (34.5%, 60/174)children who are already known to have a hearingloss. (Note that the term ‘hearing loss’ was usedthroughout the questionnaire and has thereforebeen used in this chapter when reporting results.)One reason given for screening children known tobe hearing impaired was that doing so wasbeneficial so as not to exclude children inmainstream education from a whole class activity.Eighteen services also stated that they would notbe aware of the child’s hearing status prior toscreening unless the child wore a hearing aid.
Most comments supporting not screening childrenwith a known hearing loss referred to the fact thatsuch children all had full audiology cover. Onlytwo services specifically stated that screening achild with known hearing loss would have novalue.
Children who are educated at home are notscreened by 71.8% (125/174) of services. Manyservices (22/63 commenting) were unaware ofhome-educated children, but a further 28 claimedto screen such children if they were requested todo so. One service commented that they were “notresponsible for children educated at homethrough parental choice”.
The most common reason given for not screeningchildren attending special schools was that suchchildren all receive full audiological testingroutinely, or are looked after by specialist services.
Additional comments recognised that somechildren not in state schools would be missed bythe service provided, but that responsive serviceswere available. Some services were activelyaddressing this issue.
Table 4 details the arrangements made to screenchildren who did not attend the first scheduledscreen.
Children miss the screening opportunity offered inschools for a variety of reasons, including illness,periods of time spent out of the country, travellingfamilies, lack of parental consent and transfer intothe school after the screen. The majority of
National survey of current screening practice
8
TABLE 3 The extent to which children are routinely entered into the school entry hearing screen (question 1)
All Some None Total Missing nresponses (% of 195
responses)
Children in state schools 170 (87.6) 13 (6.7) 11 (5.7) 194 (100) 1 ( 0.5)
Children in private schools 37 (20.4) 52 (28.7) 92 (50.8) 181 (100) 14 (7.2)
Children who are home educated 10 (5.7) 39 (22.4) 125 (71.8) 174 (100) 21 (10.7)
Children in special schools with known physical 85 (47.2) 44 (24.4) 51 (28.3) 180 (100) 15 (7.7)or sensory disability
Children in special schools with known mental 79 (44.4) 46 (25.8) 53 (29.8) 178 (100) 17 (8.7)disability (excluding those with hearing loss)
Children known to have hearing loss 37 (21.3) 60 (34.5) 77 (44.3) 174 (100) 21 (10.8)
Other 2 7 1 10
Data are shown as n (%).

services (91.5%, 161/176) make arrangements toscreen non-attendees during a revisit to the schooland 13.8% (16/116) of services say they rarely orsometimes make no arrangement to screen.
Respondents indicated that they would screenchildren in later school years if necessary and thatthe procedures in place for screening suchchildren usually involved recall to the communityclinic.
The majority of screening (88.4%, 160/181) isperformed in the first year of primary school(Table 5). Screening occurring at other timesincluded screening a child in any school year ifthey were new to the school and had no evidenceof undergoing a previous hearing screen;‘responsive screening’ at any time if concerns wereraised about a child’s hearing; and annualscreening of special cases such as children withvisual impairment or Down’s syndrome.
Commenting on the timing of the screen,respondents referred to the conflict that needs tobe considered between screening early (in thereception year) to ensure early identification ofany problems versus screening later (in year 1) tomaximise the child’s maturity and ability toperform the tests and thereby reduce the referralrate.
Screening procedureAn important aspect of any screening programmeis the information provided to, and consentreceived from, those covered by the screen. Table 6lists the documentation available: 123 serviceswere able to provide documentation.
Four services used an opt-out system for consentand several others used a global consent for thewider school health check to include consent forhearing screening.
Although all respondents reported screeningwithin the school most or some of the time(Table 7) it is notable that comments madehighlighted that the conditions under which thescreen was frequently performed are very variable(Table 8) and can be problematic, and that suitableconditions are sometimes difficult to identify.Seven respondents said that they would refuse toscreen in unsuitable conditions. No servicesroutinely use a sound-treated booth or room (one did use a sound-treated van), but mostservices operate the screen in ‘quiet’ areas of theschool.
Test methodsServices were fairly equally divided in whetherthey always implemented the SES as a stand-alonescreen or incorporated it into a wider health check
Health Technology Assessment 2007; Vol. 11: No. 32
9
© Queen’s Printer and Controller of HMSO 2007. All rights reserved.
TABLE 4 The arrangements in place to screen children for whom consent is obtained but who did not attend the screen for any reason(e.g. through school absence, had a cold) (question 2)
All of Most of Some of Rarely Never Total Missing nthe time the time the time responses (% of 195
responses)
Revisit to the school 135 (76.7) 26 (14.8) 13 (7.4) 1 (0.6) 1 (0.6) 176 (100) 19 (9.7)Appointment arranged at 8 (6.0) 4 (3.0) 34 (25.6) 25 (18.8) 62 (46.6) 133 (100) 62 (31.8)
school health clinicAppointment arranged at 6 (4.3) 5 (3.6) 28 (20.3) 46 (33.3) 53 (38.4) 138 (100) 57 (29.2)
audiology clinicNo arrangement made – – 2 (1.7) 14 (12.1) 100 (86.2) 116 (100) 79 (40.5)Othera 2 – 1 2 – 5 –
Data are shown as n (%).a Retest in school next year (2), next term (1); direct referral to doctor if concern (1); referral to school nurse audiology
clinic (1).
TABLE 5 The school year in which the school entry hearingscreen is routinely performed (question 3)
n (% of 181 responsesb)
Preschool 1 (0.6)Reception/primary 1a 160 (88.4)Year 1/primary 2a 48 (26.5)Year 2/primary 3a 6 (3.3)Other 19 (10.5)
a Primary 1, 2 and 3 refer to the system in Scotland andare equivalent to the year numbers in the Englishsystem.
b Forty-three responses indicated multiple (two or three)answers.

(Table 9), but if those who answered ‘most of thetime’ are included, 72.8% (115/158) incorporatescreening as part of a wider health check,compared with 52.7% (70/133) who screen forhearing loss on a separate occasion.
The estimates of children that could feasibly bescreened in 1 day were very variable (Table 10) andwere said to depend on many practical factors,including:
● child:– child’s understanding and cooperation– ease of testing– attendance rates
● administration:– mistake-free administration – ability to manage workload
● staff:– numbers– skills
National survey of current screening practice
10
TABLE 6 The extent to which written documentation concerning the SES is available (question 4)
Yes No Total Missing nresponses (% of 195
responses)
Parent/guardian agreement for the screen 151 (85.3) 26 (14.7) 177 (100) 18 (9.2)
Information provided to the parent/guardian prior to 124 (71.3) 50 (28.7) 174 (100) 21 (10.8)screening
Information provided to the parent/guardian prior 142 (83.5) 28 (16.5) 170 (100) 25 (12.8)to referral
Test protocol 137 (85.1) 24 (14.9) 161 (100) 34 (17.4)
Retest protocol 129 (80.1) 32 (19.9) 161 (100) 34 (17.4)
Referral protocol 133 (84.2) 25 (15.8) 158 (100) 37 (19.0)
Data are shown as n (%).
TABLE 7 The location of the first test within the school entry hearing screen (question 5)
All of Most of Some of Rarely Never Total Missing nthe time the time the time responses (% of 195
responses)
School 156 (86.2) 25 (13.8) – – – 181 (100) 14 (7.2)Community clinic – 4 (3.1) 19 (15.0) 55 (43.3) 49 (38.6) 127 (100) 68 (34.9)Home – – 3 (2.4) 39 (31.5) 82 (66.1) 124 (100) 71 (36.4)GP clinic – – 2 (1.6) 9 (7.4) 111 (91.0) 122 (100) 73 (37.4)Other – – 2 1 1 4
Data are shown as n (%).
TABLE 8 The conditions under which the school entry hearing screen is performed (question 6)
All of Most of Some of Rarely Never Total Missing nthe time the time the time responses (% of 195
responses)
Soundproof booth – – – 1 (0.7) 140 (99.3) 141 (100) 54 (27.7)Sound-treated room – – 3 (2.1) 14 (9.9) 125 (88.0) 142 (100) 55 (28.2)Quiet office 18 (10.8) 87 (52.4) 54 (32.5) 4 (2.4) 3 (1.8) 166 (100) 29 (14.9)Noisy office – 4 (2.8) 49 (34.0) 36 (25.0) 55 (38.2) 144 (100) 51 (26.2)Quiet classroom/area 16 (9.6) 48 (28.9) 65 (39.2) 19 (11.4) 18 (10.8) 166 (100) 29 (14.9)Noisy classroom/area – 6 (4.1) 31 (21.2) 27 (18.5) 82 (56.2) 146 (100) 49 (25.1)Othera 2 3 17 2 – 24 171 (87.7)
Data are shown as n (%).a Twenty-four services mentioned 14 different areas of the school: medical room (15), staff room (10), library (4), corridor
(3), stationery cupboard/store room/broom cupboard (4), main hall (2), sound-treated van, kitchen, hall, toilet, entrancearea, head’s office (1 each).

● school:– size and location (several small rural
schools entailing greater time spent ontravelling)
– support provided by schools– level of disturbance– other activities for children– experience of school nurses
● available time:– length of session– travelling time– number of schools visited.
Not all services screen children for a whole day.Some run the screening in the morning and dothe administration and paperwork in school in theafternoon; others attend schools only for half aday at a time. Where services stated the time takento screen a child, estimates varied from nine perhour to 20 minutes per child.
The majority of services (71.7%, 124/173)implement a two-test screen, with only 16.8%(29/173) referring after a single test (Table 11).
Pure tone (PT) sweep testing is used by 97.1%(170/175) of services as the first test. Thirty-oneservices (18.1%) add in pure tone audiometry(PTA) and/or tympanometry and/or otoscopy atthe second test (Table 12).
When a two-test screen is carried out, the timebetween tests varies from doing both tests on thesame day up to an interval between tests of morethan 12 weeks (Table 13).
The majority of referrals are made to ‘audiology’,but details of whether this was a second tier
Health Technology Assessment 2007; Vol. 11: No. 32
11
© Queen’s Printer and Controller of HMSO 2007. All rights reserved.
TABLE 9 The extent to which children at school entry are screened for hearing loss only or for hearing loss as part of a wider healthcheck (question 9)
All of Most of Some of Rarely Never Total Missing nthe time the time the time responses (% of 195
responses)
Screen for hearing 65 (48.9) 5 (3.8) 19 (14.3) 24 (18.0) 20 (15.0) 133 (100) 62 (31.8)loss only
Screen for hearing loss 95 (60.1) 20 (12.7) 5 (3.2) 5 (3.2) 33 (20.9) 158 (100) 37 (19.0)as part of a wider health check
Data are shown as n (%).
TABLE 10 Estimates of the numbers of children (minimum, average and maximum) that could be screened under normalcircumstances during the course of a one-day visit to a school (question 10)
Number of children No. of Lowest Highest Median responses responsea response response
(a) When screening for hearing loss onlyMinimum 94 1 45 10Average 92 2 60 33Maximum 93 5 110 40
(b) When screening for hearing loss as part of a wider health checkMinimum 96 1 20 5Average 99 2 55 14Maximum 100 3 90 20
a One service reported only testing one child per day.
TABLE 11 The number of tests routinely performed within thescreening programme before onward referral (question 7)
No. of tests before referral n (%)
1 29 (16.8)2 124 (71.7)3 18 (10.4)4 2 (1.2)Total 173 (100)Missing responses 22 (11.3)

community clinic or a tertiary audiology clinicwere not given. Fifteen services (8.8%) refer thechild to their GP (Table 14).
Pass/fail criteriaThe test levels at which services decide a childshould be retested or referred varied widely withmany combinations of levels and frequencies. Thedetails for the first test are shown in Table 15. One-hundred and forty of the 195 services consistentlyscreened at 20 or 25 dB for 1, 2 and 4 kHz, with avariety of other levels and frequencies added tothat base.
One-hundred and thirty-five services gave levels at which the child would be said not to havepassed the test at test 2. Of these, only 30 weredifferent from the levels at test 1. Seven added a
frequency, 12 increased the level, one decreasedthe level, nine tested to threshold, and oneincluded fails at tympanometry and otoscopy(unspecified).
Twenty-one services gave levels at which the childwould be said not to have passed the test at test 3. Two added a fail at tympanometry, sixtested to threshold, one decreased the level, fiveincreased the level and one added observation ofbehaviour.
Screen personnel and equipment Staff from different professional backgrounds areinvolved in carrying out the SES in different partsof the country (Table 16). Of the respondents, themajority of screeners are school nurses (66.3% ofservices) or their assistants (18.5% of services).
Many services emphasised the importance oftraining for staff undertaking the SES. A generaltheme emerged of staff less qualified in audiologyundertaking the initial screen(s) followed byreferral when necessary to audiologically qualifiedstaff. Resource issues were cited as the reason forusing ‘cheaper’ staff, including one instance of‘mumsy’ ladies who know the schools andchildren. In contrast, the benefit of employinghighly qualified staff, which meant fewerunnecessary referrals, was also mentioned.
The majority of services (94.3%) use screeningaudiometers (Table 17).
National survey of current screening practice
12
TABLE 12 The test methods used within the screening programme (question 7)
Test no. PTA PT sweep Tympanometry Otoscopy Total Missing nresponses (% of 195
responses)
1 4 (2.3) 170 (97.1) 1 (0.6) 1 (0.6) 175 (100) 22 (11.3)2 29 (20.3) 112 (78.3) 1 (0.7) 1 (0.7) 143 (100) 52 (26.7)3 16 (72.7) 5 (22.7) 1 (4.5) – 22 (100) 173 (88.7)
Data are shown as n (%).
TABLE 13 The time between tests for services implementing more than one test (question 7)
Between tests Same day 2 to <6 weeks 6–12 weeks >12 weeks Total responses Missing n(% of 195responses)
1 and 2 11 (8.3) 56 (42.4) 59 (44.7) 6 (4.5) 132 (100) 63 (32.3)2 and 3 5 (41.7) 3 (25.0) 4 (33.3) 12 (100) 183 (93.8)
Data are shown as n (%).
TABLE 14 Service/professional to which onward referral is madeon failure of the screen (question 7)
Referral to n (%)
Audiology/hearing clinic 127 (75.1)GP 15 (8.8)Children’s hearing assessment clinic 7 (4.1)Community paediatrician/medical officer 6 (3.6)ENT 3 (1.8)Community/hearing/school nurse clinic 11 (6.5)Total responses 169 (100)Missing responses 26 (13.3)
ENT, ear, nose and throat.

Health Technology Assessment 2007; Vol. 11: No. 32
13
© Queen’s Printer and Controller of HMSO 2007. All rights reserved.
TABLE 15 Pass/fail criteria (levels and frequencies) (question 8)
Screening level and frequencies No. of responses (%)
20 dB at 1, 2 and 4 kHz 51 (29.3)No other frequencies 6+ 20 dB at 500 Hz only 16+ 25 dB at 500 Hz and/or 250 Hz 13+ 30 dB at 500 Hz only 7+ 20 dB at 500 Hz and/or at 8 kHz and/or at 6 kHz and/or at 250 Hz 4+ 30 dB at 250 and 500 Hz and 8 kHz 2All other frequencies (not specified) at 20 dB 3
25 dB at 1, 2 and 4 kHz 89 (51.1)No other frequencies 10+ 25 dB at 500 Hz only 37+ 30 dB at 500 Hz and/or 250 Hz and/or 6 kHz 29+ 25 dB at 500 Hz and 8 kHz and/or 250 Hz and/or 6 kHz 9All other frequencies (not specified) at 25 dB 4
30dB at 1, 2 and 4 kHz 15 (8.6)No other frequencies 1+ 30 dB at 500 Hz and 8 kHz and/or 250 Hz 8+ 35 dB at 500 Hz only 2All other frequencies (not specified) at 30 dB 4
Varying between 20 and 30 dB at 1, 2 and 4 kHz 19 (10.9)No other frequencies 4+ 25–35 dB at 500 Hz only 10Other combinations 5
Total response 174 (100)Missing or unclassifiable 21 (10.8)
TABLE 16 Staff who perform the SES (question 11)
n (% of 178 responsesa)
School nurse 118 (66.3)School nurse assistant 33 (18.5)Nursery nurses 31 (17.4)Health care assistants/support workers/school health assistants 29 (16.3)Audiometrician 28 (15.7)Audiologist/assistant audiologist 18 (10.1)Technicians 14 (7.9)Screeners 11 (6.2)School doctor 5 (2.8)
a Eighty-eight services mentioned more than one grade of staff.
TABLE 17 Types of equipment and numbers used within the SES (question 12)
n Total responding No. owned
a. Screening audiometer 164 (94.3) 174 1–48b. Diagnostic audiometer 30 (29.1) 103 1–24c. Screening tympanometer 23 (21.9) 105 1–6d. Diagnostic tympanometer 8 (8.33) 96Othera 7
a Auroscope (2), otoacoustic emissions test for special schools (1), Quick tymp audiometer/tympanometer (1), sound level meter(2), otoscope (1).
Combinations: screening audiometer and screening tympanometer (a + c ) = 12; screening and diagnostic audiometer (a + b ) = 17; screening and diagnostic audiometer and screening tympanometer (a + b + c) = 8.

Several services commented that all equipment, iscalibrated annually and that each member of staffhad their own equipment, but others referred toequipment that was very old and the inability toreplace equipment owing to resource limitations.The use of otoscopes only by staff qualified to usethem and the need for explicit parental consentfor an invasive procedure were mentioned asreasons for not using them.
Audit dataServices were asked whether an audit of the SEShad taken place in the last 2 years, whether theyused any sort of data management system and, ifso, whether reports were easily obtainable(Table 18).
Less than 10% of services (16/168) haveperformed any audit of their service in the last2 years. Approximately 70% (112/161) of servicesuse some sort of data management system for theSES, but only half of those can easily obtain datareports from it.
Coverage, referral rates and yieldTable 18 indicated that few services were able toprovide accurate data on coverage and referralrates from the SES. Table 19 indicates the dataconsidered by respondents to be reliable. Datathat were estimated or guessed by services havenot been included.
Fifty-five respondents (28.2% of 195) provideddata on children eligible for the screen from whichcoverage figures could be calculated. Thepercentage of eligible children who were screened(coverage) ranged from 56.3 to 100%, with amedian of 95.2% (mean 91.1%). Nearly three-quarters of services (74.5%) achieved more than90% coverage.
Forty-six respondents provided data from whichreferral rates overall could be calculated. Thepercentage of screened children who were referredfor further assessment ranged from 1.91 to 23.4%with a median of 7.9% (mean 7.7%). Eleven of the57 services (19.3%) gave values of zero forreferrals.
The pattern of pass/fail criteria for these 46services did not differ from the pattern for theservices for which data are presented in Table 15.Data were unavailable on the number of childrenreferred at different stages of the screeningprogramme.
Comments made by respondents reflected thepoor data management of the SES in general. Inparticular, several services commented that datawere available on numbers eligible, screened andreferred (Table 19), but not on outcomes, withfewer than 20 respondents able to give numbers(Table 20). Many emphasised that although (some)
National survey of current screening practice
14
TABLE 18 Number of services with a recently performed audit of the SES, data management systems in place, and easily obtainablereports (questions 13, 14 and 15)
n Total responses Missing responses
Recent audit 16 (9.5) 168 (100) 27 (13.8)Data management system 112 (69.6) 161 (100) 34 (17.4)Data reports easily obtainable 52 (46.4) 112 (100) 83 (42.6)
Data are shown as n (%).
TABLE 19 Coverage and referral rates for the SES (question 16)
No. of service Childrenleads providing
reliable data Mean Median Range
n n % n %
Children eligible for the screen 55 2704 2229 – 352–10,291 –
Children undergoing the screen 55 2512 2176 95.2 234–9483 56.3–100.0
Children referred for further assessment 46 246 168 7.9 23–1977 1.91–23.4after failing the screen

data were collected it was not easy or possible toretrieve them in any meaningful form.
From the data in Tables 19 and 20, figures for theyield from the SES may be calculated. Table 21presents the yield as the percentage of childrenreferred and as the percentage of childrenscreened who were subsequently identified ashaving sensorineural hearing loss, permanentconductive hearing loss or temporary conductivehearing loss. For example, 18 services provideddata on the number of children identified withsensorineural hearing loss and the number ofchildren referred. A median yield of 1.44% ofthose referred can be calculated for the data fromthese 18 services, with a range of 0 to 12.16%. Therows in italics refer to the data excluding serviceswhere no children were identified.
Respondents’ views on the value and continuedneed for the SESServices were asked whether they had any plansfor development or change of the SES. For those
services who responded, 28.6% (50/175) areplanning to change their current practice in someway, several in response to the implementation ofthe NHSP (Table 22).
Services were also asked to rate the overallusefulness of the SES as it was currently operated.They were asked to indicate one of ten boxes on arange from ‘not useful at all’ to ‘very useful’(question 20) (Table 23).
Thus, 69.3% rated it as 8 or higher, more thanone-third (33.5%) rating it as 10. Only 12 servicesof the 176 responding (6.8%) rated it as 4 or less.
Positive comments about the service were made by184 services. The most common was that thescreen effectively identifies children with hearingimpairment; in general (38), impairment of lateonset or acquired since the newborn screen (30),OME (20), unilateral (15) or unsuspected losses(seven). Other suggested benefits of the screenwere that it could exclude hearing loss as a cause
Health Technology Assessment 2007; Vol. 11: No. 32
15
© Queen’s Printer and Controller of HMSO 2007. All rights reserved.
TABLE 20 Yield (numbers of children) from the SES for different definitions of hearing loss (question 16)
Children identified after failing the screen with … No. of service leads No. of children: rangeproviding reliable data
… sensorineural hearing loss 18 0–56… permanent conductive hearing loss 11 0–23… temporary conductive hearing loss 15 0–305… other types of hearing loss 7 0–11
TABLE 21 Percentage of children confirmed to have one of three different definitions of hearing loss after referral from the SES as apercentage of those screened and as a percentage of those referred (question 16)
Yield No. of service leads providing Median Range reliable data
(a) Sensorineural hearing lossPercentage of those referred 18 1.44 0–12.16(excluding 0%) 15 1.71 0.62–12.16Percentage of those screened 17 0.11 0–0.59(excluding 0%) 14 0.12 0.05–0.59
(b) Permanent conductive hearing lossPercentage of those referred 11 0 0–17.56(excluding 0%) 5 3.42 1.24–17.56Percentage of those screened 10 0 0–0.44(excluding 0%) 4 0.09 0.07–0.44
(c) Temporary conductive hearing lossPercentage of those referred 14 35.88 0–100.0(excluding 0%) 13 35.88 7.74–100.0Percentage of those screened 14 2.48 0–7.56(excluding 0%) 13 2.77 0.72–7.56

of a child’s difficulties (24) and that it raisedawareness among teachers and parents andallowed surveillance (13).
In contrast, only 54 negative comments were madeabout the screen service. These were concernedwith poor test conditions (12), high referral ratesand/or low yield (ten), the provision of a less thanadequate service owing to lack of resources(seven), poor information on outcomes (six), highrates of non-attendance at follow-up (five), anduncertainties following the introduction ofnewborn screening (two).
Respondents were asked specifically for theirsuggestions for the future of the SES, either locallyor nationally (question 21). Twenty respondentssaid that the screen must continue and only twospecifically said that it should stop. The future ofthe screen in relation to newborn screening wasagain highlighted (17), with suggestions forintroduction of a targeted SES. Other suggestionswere for better standards/guidelines (seven),increased coverage of private schools (six),improved test conditions, and better information technology (IT) support and datacollection.
Finally, respondents were invited to add anyfurther comments. Many of these reiterated, foremphasis, comments made earlier in thequestionnaire concerning inadequate conditions,IT support, training, etc.
SummaryNo national protocol exists for the SES programmeand there are wide variations in its implementationthroughout the UK in terms of the populationcovered, the physical location and conditionsunder which the screen is implemented, the testmethodology, the criteria used to determine whichchildren to refer, the personnel and the equipmentinvolved, and the ability to collect and thenretrieve data. Much of the variation appears to bedue to limitations of resources to implement thescreen in the light of competing activities for therange of staff employed to run it.
Data that could be used to assess outcome/performance and thereby to determine whichmethods, if any, were effective in achieving theaims of the screen are not routinely available. Thislack of data, combined with the wide variation,meant that the authors were unable to investigatewhether significant clusters of services had similaraims, tests and operational characteristics.
Despite the difficulties and the lack of robustevidence, most service leads think the screen isuseful and do not want to stop using it, eventhough they recognise that its worth may becomeeven less with the advent of universal newbornhearing screening. Guidelines concerning thevalue of a selective screen and the population forwhom it would be appropriate to target it wouldbe welcomed by many service leads.
National survey of current screening practice
16
TABLE 22 Proposed developments in the SES (question 19)
Development plans n
Changes to the staff running the screen 15Generally reviewing the screen 13Considering changes or discontinuation in the light of the introduction of NHSP 8Considering discontinuation 4Considering targeting the screen 5Further development of IT systems 3Changing the protocol with regard to screening levels 2Provision of modern equipment (2) or training (2) 4Improving relationship with second tier audiology services 2Waiting for these results 2
TABLE 23 Rates of the overall usefulness of the school entry hearing screen as it is currently operated (question 20)
Not useful at all Very useful
No. of responses 1 5 3 3 10 9 23 35 28 59% 0.6 2.8 1.7 1.7 5.7 5.1 13.1 19.9 15.9 33.5
Total n = 176.
1 105 94 83 72 6

IntroductionPrimary preventive measures have affected theunderlying epidemiology of permanent childhoodhearing impairment (PCHI). There has been areduction in the incidence of hearing impairmentattributable to rhesus incompatibility, and in thatremaining as a legacy of congenital rubella, butmore recent immunisations for meningococcal andHaemophilus influenzae type b (Hib) disease havealso had a demonstrable impact which shouldhave consequences for the occurrence of hearingimpairment (see www.hpa.org.uk: VaccinePreventable Diseases; data generated by theCentre for Infections). Meningitis, measles andmumps have all been implicated as causes ofunilateral acquired hearing impairment25 forwhich in the past the SES has been an importantroute to identification. Although there are currentissues concerning measles, mumps and rubella(MMR) immunisation uptake, the fall in bothmeasles and mumps notifications that followed theintroduction of vaccine in 1988 was dramatic, andpredictably such preventive measures haveconsequences for the occurrence of hearingimpairment.
Improvements in secondary prevention also haveimplications for the SES. Since the SES became avalued (although rarely evaluated) screen in the1960s, audiology services and programmes ofearly detection have developed substantially.Potentially the most significant factor has been theimplementation of neonatal screening. The NHSPhas been rolled out across England, but theimplications for the SES will not be fully realiseduntil the first cohorts reach school age. However,the Whipps Cross University Hospital universalnewborn hearing screen (UNHS) has beenimplemented as an audited service since 1992 pre-dating the country-wide implementation ofnewborn hearing screening by more than adecade. Although the Whipps Cross UNHS andthe NHSP differ in terms of protocol details[transient evoked otoacoustic emission test(TEOAE) followed if failed by a second TEOAE
test, with screen referral if either test failed for theformer; TEOAE followed if failed by AABR, withscreen referral if AABR failed for the latter],longitudinal data from the Whipps Cross screenprovide a valuable and quasi-controlled indicationof the likely implications for later screens such asthe SES.
The Whipps Cross UNHS was implemented forthe newborn population in the East Londondistrict of Waltham Forest. A single audiologyservice with long-term stability has beenresponsible for the screen follow-up programmeand for the audiological provision for a populationof around half a million in Waltham Forest and inthe neighbouring district of Redbridge. Whereasthe universal screen aimed at screening allnewborns in Waltham Forest, a more limitedtargeted neonatal hearing screen (TNHS), aimedat newborns at risk of hearing impairment, wasundertaken in Redbridge. Prospective follow-up ofthe cohorts has been undertaken by the audiologyservice and evaluation of process, surrogateoutcomes and actual outcome reviewed.26–30 Theavailable information has also been used toevaluate the current worth of the local SES. Thenecessity for a local evidence base to be availableto inform local policy has been emphasised,5 butthere are concerns about the applicability ofstudies with a small population base to informwider policy. However, the Waltham Forest cohortswill be unique within the UK until the much largerlong-term follow-up evaluations from the NHSPare available, and the use of the local cohorts toinform wider policy has therefore been maximisedby using longitudinal population studies and bycomparing the results with national studies or withdata drawn from larger populations.
Changes in the programmes ofearly screening and identificationApproaches to screening for hearing impairmentin preschool and primary age children in WalthamForest are detailed in Figure 1. Changes were based
Health Technology Assessment 2007; Vol. 11: No. 32
17
© Queen’s Printer and Controller of HMSO 2007. All rights reserved.
Chapter 3
Possible effects of newborn hearing screening on the school entry hearing screen: evidence from
a series of studies in Waltham Forest
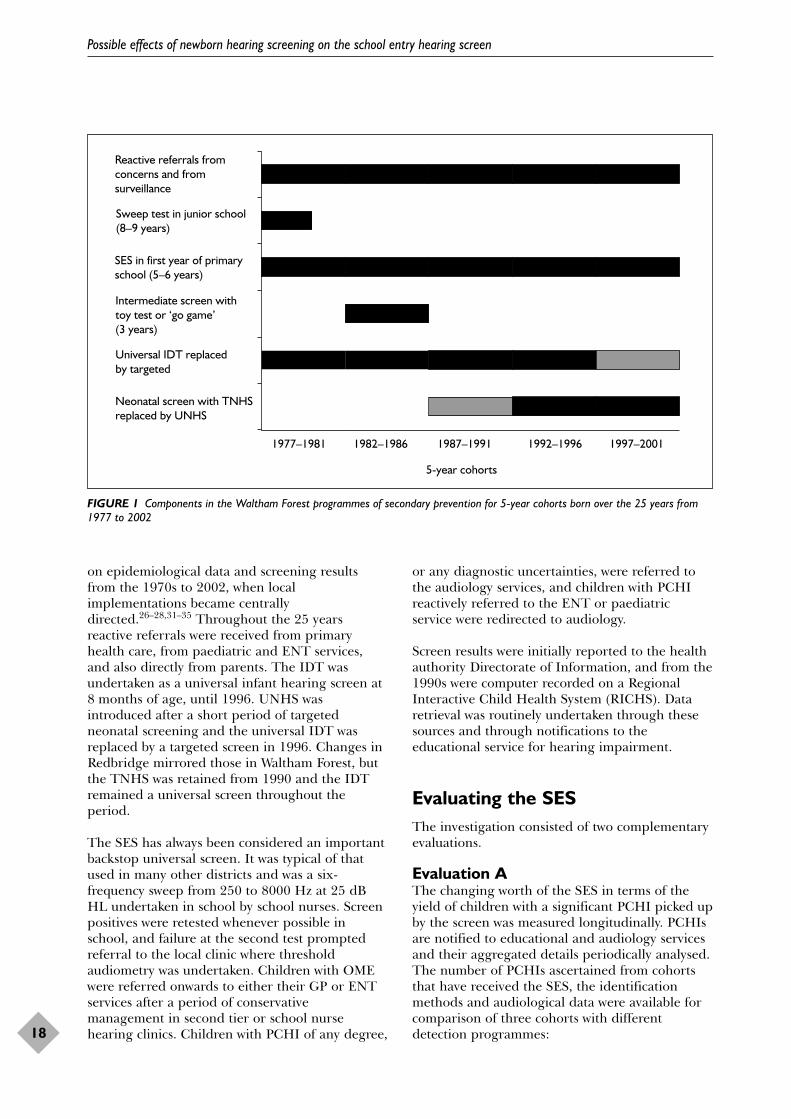
on epidemiological data and screening resultsfrom the 1970s to 2002, when localimplementations became centrallydirected.26–28,31–35 Throughout the 25 yearsreactive referrals were received from primaryhealth care, from paediatric and ENT services,and also directly from parents. The IDT wasundertaken as a universal infant hearing screen at8 months of age, until 1996. UNHS wasintroduced after a short period of targetedneonatal screening and the universal IDT wasreplaced by a targeted screen in 1996. Changes inRedbridge mirrored those in Waltham Forest, butthe TNHS was retained from 1990 and the IDTremained a universal screen throughout theperiod.
The SES has always been considered an importantbackstop universal screen. It was typical of thatused in many other districts and was a six-frequency sweep from 250 to 8000 Hz at 25 dBHL undertaken in school by school nurses. Screenpositives were retested whenever possible inschool, and failure at the second test promptedreferral to the local clinic where thresholdaudiometry was undertaken. Children with OMEwere referred onwards to either their GP or ENTservices after a period of conservativemanagement in second tier or school nursehearing clinics. Children with PCHI of any degree,
or any diagnostic uncertainties, were referred tothe audiology services, and children with PCHIreactively referred to the ENT or paediatricservice were redirected to audiology.
Screen results were initially reported to the healthauthority Directorate of Information, and from the1990s were computer recorded on a RegionalInteractive Child Health System (RICHS). Dataretrieval was routinely undertaken through thesesources and through notifications to theeducational service for hearing impairment.
Evaluating the SESThe investigation consisted of two complementaryevaluations.
Evaluation AThe changing worth of the SES in terms of theyield of children with a significant PCHI picked upby the screen was measured longitudinally. PCHIsare notified to educational and audiology servicesand their aggregated details periodically analysed.The number of PCHIs ascertained from cohortsthat have received the SES, the identificationmethods and audiological data were available forcomparison of three cohorts with differentdetection programmes:
Possible effects of newborn hearing screening on the school entry hearing screen
18
Reactive referrals fromconcerns and fromsurveillance
Sweep test in junior school(8–9 years)
SES in first year of primaryschool (5–6 years)
Intermediate screen withtoy test or ‘go game’(3 years)
Universal IDT replacedby targeted
Neonatal screen with TNHSreplaced by UNHS
5-year cohorts
1977–1981 1982–1986 1987–1991 1992–1996 1997–2001
FIGURE 1 Components in the Waltham Forest programmes of secondary prevention for 5-year cohorts born over the 25 years from1977 to 2002

● an historical 10-year Waltham Forest cohortborn from January 1977 to 1987 when noneonatal hearing screen (NNHS) was in place;the size of this NNHS cohort was 31,538(cohort 1, NNHS)
● a 10-year Redbridge cohort born from January1990 to 2000 when a TNHS was in place; thesize of this TNHS cohort was 32,890 (cohort 2,TNHS)
● an 8-year Waltham Forest cohort born fromJanuary 1992 to 2000 when a UNHS was inplace; the size of this UNHS cohort was 29,132(cohort 3, UNHS).
The three cohorts thus gave a total cohort of93,560. Although the primary analyses areconcerned with comparisons between cohorts,useful information (e.g. overall prevalence rates)can be derived from some combined analyses(combined cohort).
Evaluation BThe SES has also been argued to have anadditional ‘useful’ yield of children with a minimalPCHI or with temporary fluctuating OME.Because these children are not routinely andinvariably notified to the educational or audiologyservices an additional population-based cross-sectional survey was undertaken by examining theschool health records of a 6-year Waltham Forestcohort (January 1993 to 1999) of 19,296 children(cohort 4) who were eligible to have received theSES in the local education authority schools, andwho had previously been enrolled into the UNHS.The RICHS was interrogated for the study. Itenabled local comparative evaluation of processand results with historical returns from a 3-yearSES undertaken on 9301 children from 1986 to1989 (cohort 5) and with a 5-year Waltham Forestcohort of 15,536 children who were born up toDecember 1982 (cohort 6) and reported after theyhad all received the SES;32 neither of thesecohorts had had a newborn hearing screen.
Generalising the studyGeneralisation requires contextualisation of theresults within the local demographic. The level ofdeprivation36 and Asian ethnic background13 areboth factors that have been found to increase theodds ratio for PCHI within a community, andinward flow of children into the district fromabroad after the newborn or infant screens, andbefore school entry, are characteristics that are notuniform nationwide. Nevertheless, they arepertinent to the wider interpretation of the
current data. The combined population ofRedbridge and Waltham Forest in the mid-1990swas 449,500. The live birth rate in Waltham Forestwas 3500 per annum, with that in Redbridgebeing slightly less. Although the districts areimmediate neighbours, the populations have somedifferences. The Department of the EnvironmentIndex of Local Conditions using data from the1991 census ranked Waltham Forest as 20th on theindex of the most deprived boroughs, whileRedbridge was ranked 120th out of 366 Englishboroughs. In both there were ethnic minoritycommunities (31% in Waltham Forest and 28% inRedbridge). In Redbridge the largest ethniccommunity was Indian in origin, and WalthamForest had the largest Pakistani community, theeighth largest black Caribbean community and theninth largest Bangladeshi community in London.During the 1990s there was also an increasingnumber of refugees to both boroughs, principallyTurkish, Kurdish and Somalian. The majoritygrouping in both was Somali. The longitudinalcohort evaluation required assessment of changesin the Waltham Forest population. Data from the1981 census confirmed that the population in the1980s was slightly lower than it was a decade later(214,500 in the mid-1980s), with a slightly lowerbirth rate of around 3000 per year. However, theoverall level of deprivation measured by the 1981census was largely unchanged when comparedwith later measures from the Index of LocalConditions.
Local data on the epidemiology of hearingimpairment were compared with those derivedfrom three studies with a national or widerpopulation base:
● the prevalence of PCHI in the UK12
● the MRC Institute of Hearing Researchepidemiology of PCHI in a cohort of 366,480from the Trent region13
● evaluation of the NHSP in England.9
The local population-based cross-sectional surveyof the SES process and result was compared withthe national BACDA study of 109,505 schoolhearing screening tests undertaken by 43 servicesfor the school year 2000/01 (the 1995/96 birthcohort).6
Changes in the SESAlthough SES protocols and procedures remainedunchanged throughout the longitudinal cohortcomparison, the school nursing services had been
Health Technology Assessment 2007; Vol. 11: No. 32
19
© Queen’s Printer and Controller of HMSO 2007. All rights reserved.

increasingly used to provide other preventiveservices and since 2000 this has affected theperformance of the SES in Waltham Forest. Duringthe 1980s and up until the end of the 1990s, 90%or over of schoolchildren in the first year ofprimary school received a SES. Enrolment to theSES for the majority of the cohorts used in thelongitudinal comparisons therefore remainedhigh. However, in the cohorts screened since 2000the proportion receiving the SES has graduallyreduced and in 2005 was below 50%. The failurerate was 7.4%, with a mean age of referral forassessment in the school clinic of 5.5 years, andthis had remained stable since the 1980s. Thenon-attendance (DNA) rate for follow-up had alsoremained stable at 20%. Comparison with theBACDA survey6 confirmed that these results weretypical of those achieved elsewhere in the UK.
Did the gradually falling SES enrolment after2000 influence the yield? The non-screeningreferrals to the audiology service were examinedand the age distribution and referral rate fromcohort 1, NNHS, were compared with the latestyear. In fact, despite all the changes in earlierscreens and surveillance, the age distribution andreferral rate of reactive vigilant referrals remainedremarkably stable. The modal age of referralremained at between 3 and 4 years, with a meanage of referral of 4.81 years in 1986 and 4.65years in 2005. The reduced coverage of the SESappears therefore not to have resulted in increasednumbers identified through reactive referral, andthere has been no influx of schoolchildren withPCHI who have been reactively referred.Longitudinal comparison of the epidemiology ofhearing impairment was also made to ensure thatthere was no fall in the number of identified casesin recent years. Comparison was also made withthe epidemiological study of PCHI in Trent.13 Theprevalence of PCHI at school age also remainedlongitudinally stable.
ResultsEvaluation APrevalenceFrom the combined cohort of 93,560 in their firstyear of primary school, 349 children with aunilateral or bilateral PCHI of mild degree orgreater (>20 dB HL averaged over 0.5, 1, 2 and 4kHz) were ascertained. Severity was classified asmild (hearing level <40 dB HL), moderate(hearing level 40–69 dB HL), severe (hearing level70–94 dB HL) and profound (hearing level�95 dB HL). Bilateral PCHIs were categorised by
severity in the better hearing ear (BHE) andunilateral cases in the worse hearing ear (WHE). Inthose where pure tone audiometric thresholds wereunavailable, sound field or electrophysiological testresults were used with categorisation by degreeafter appropriate conversion of the decibel scale.The prevalence of moderate or worse bilateralPCHI (Figure 2) was 1.49 in 1000 [95% confidenceinterval (CI) 1.23 to 1.73], with 1.27 in 1000 (95%CI 1.03 to 1.49) appearing to be congenital. Therewas clear audiometric evidence of progressivehearing impairment in 18% of those with acongenital PCHI. The prevalence of hearingimpairment that was acquired or late onset was0.22 in 1000 (95% CI 0.13 to 0.32). There was nosignificant difference when the prevalence rates inthe three cohorts in the present study werecompared with each other [�2 0.060, degrees offreedom (df) 2, p = 0.967] or when they werecompared with the Trent cohort (�2 2.532, df 1,p = 0.112) (see Appendix 3). Similarly, theprevalence of 1.44 in 1000 (95% CI 1.41 to 1.48)with a moderate or worse bilateral hearingimpairment in the UK ascertainment study12 wasvery similar to the prevalence of 1.49 (95% CI1.24 to 1.73) measured in the current study.
The aetiologies of the hearing impairment werecategorised and fell equally into one-third whohad an inherited familial hearing impairment,one-third where no cause was known and one-third who had a perinatal illness, or a craniofacialabnormality or dysmorphology. Once again, therewere no significant differences between the threecohorts (�2 0.215, df 2, p = 0.898; �2 1.469, df 2,p = 0.480; and �2 2.264, df 2, p = 0.322,respectively). There were also no significantdifferences between the Waltham Forest cohortsand the Trent cohorts in the proportions with aninherited deafness; a perinatal illness, congenitalinfection or craniofacial abnormality/syndrome; oran unknown or missing aetiology (�2 0.412, df 1,p = 0.521; �2 1.062, df 1, p = 0.303; and �2 2.224,df 1, p =0.136, respectively) These epidemiologicalcharacteristics of bilateral moderate or worsePCHI were therefore longitudinally stable andthey were also representative of other cohortsreported in the UK.
The prevalence of mild bilateral PCHI was 1.21 in1000 (95% CI 0.99 to 1.43), and once again thiswas longitudinally stable in Waltham Forest (�2 0.052, df 2, p = 0.974), but there are nonational studies for comparison.
By contrast, there were highly significantdifferences (�2 8.229, df 2, p = 0.016) between the
Possible effects of newborn hearing screening on the school entry hearing screen
20

cohorts in the prevalence of cases (congenital andacquired) of unilateral hearing impairment(Figure 3). Note that for unilateral hearingimpairment it is more reasonable, in terms of theextent of disability, to group moderate impairmentwith mild rather than severe. Cases of severe orprofound unilateral hearing impairment (childrencolloquially considered to have a ‘dead ear’) fellfrom 0.95 in 1000 in cohort 1, NNHS, to 0.27 in1000 in cohort 3, UNHS (�2 13.338, df 2,p = 0.001), with those with a milder unilateralPCHI remaining stable across the longitudinalcohorts (�2 0.609, df 2, p = 0.737). The aetiologieswere investigated, but causation was usuallyelusive. Only 18.5% had onset definitelytemporally related to illness and the remainderwere considered to be congenital, although usuallythis was because of absence of firm evidence thatthe unilateral impairment was related to an illness,rather than clear evidence that it was present atbirth. In the majority (65%) there was no knowncause and it was in this category that there was ahighly significant fall in prevalence. Theprevalence decreased by a half from 0.86 in 1000(95% CI 0.53 to 1.18) in cohort 1, NNHS, to 0.41in 1000 (95% CI 0.18 to 0.64) in cohort 3, UNHS.Once again, comparative prevalence rates werenot available from the Trent or nationalprevalence studies and therefore generalisation isless robust. However, the UK Child Development
Studies reported 0.8 in 1000 children aged 7 yearsto have such an impairment,37 and other historicalsurveys have reported profound unilateral hearingimpairment in 1 in 1000 schoolchildren (manystudies cited by Bess and colleagues 198625).These were of the same order as the prevalencerate reported in the cohort 3, NNHS. Theprevalence rate of all degrees of unilateralcongenital hearing impairment reported from the recent NHSP evaluation was 0.64 in 1000(95% CI 0.37 to 0.91), of whom less than half hada severe or profound unilateral PCHI.9 Cohort 3,UNHS, used in the current study reported aunilateral congenital prevalence of 0.65 in 1000(95% CI 0.36 to 0.95), with 0.24 in 1000 (95% CI0.06 to 0.42) having a severe or profoundunilateral PCHI. It is therefore probable that thesignificant fall in prevalence of profoundunilateral hearing impairment can be generalisedand it is likely that this is due to measures ofprimary prevention.
Age of confirmation of hearing impairment Cohort comparisons of the median andinterquartile ages when the children wereconfirmed with a congenital PCHI are detailed inTable 24. The comparison confirmed that therehad been a considerable secular reduction in theage when hearing impairment was confirmedwhen cohort 2, TNHS, and cohort 3, UHNS, that
Health Technology Assessment 2007; Vol. 11: No. 32
21
© Queen’s Printer and Controller of HMSO 2007. All rights reserved.
0.99
0.58
0.25 0.23
1.241.21
0.76
0.37 0.35
1.491.43
0.94
0.5 0.47
1.73
0
0.2
0.4
0.6
0.8
1.0
1.2
1.4
1.6
1.8
Mild Moderate Severe Profound All bilateral>40 dB HL
Bilateral PCHI
Prev
alen
ce p
er 1
000
FIGURE 2 The prevalence of bilateral PCHI and 95% CIs for the combined cohorts (n = 93,560)

received either a targeted or universal newbornscreen were compared with cohort 1, NNHS, whennewborn screening was unavailable. In cohort 1,NNHS, the median age when hearing impairmentwas confirmed in those with severe or profoundhearing impairment was at just turned 1 year ofage. However, there was a much greater delay inthe confirmation of those with a mild or moderatePCHI. This occurred on average after their fourthbirthday and in the months running up toprimary school entry. Once universal neonatalscreening had been established there was a highlysignificant reduction to 10 weeks of age inconfirming the presence of a severe or profoundhearing impairment, with those with a moderatePCHI also now being confirmed on average wellwithin the first half of infancy. Those with a mildbilateral PCHI were now being confirmed ataround 3 years of age. The same pattern ofimprovements was also made in the age ofconfirmation of those with unilateral PCHI, with ahighly significant overall reduction when cohort 1,NNHS, was compared with cohort 2, UNHS.Historically, unilateral PCHI had been confirmedwhen the children had reached their fifth birthday,but once again this was now reduced to the firsthalf of infancy. These were highly significant
improvements in the average age at which alldegrees of hearing impairment were identified incohort 3, UNHS.
Such improvements in the median age would beexpected following the implementation of effectiveneonatal screens, but a statistic giving a betterindication of late identifications is required toreflect the effectiveness of the system as a wholeand the contribution from later screens such as theSES. The 75th centile is thus a more appropriateindex for measuring improvements. Theinterquartile range (IQR) is included in Table 24.Historically, the upper quartile for the age ofconfirmation was within the first year of primaryschool for all degrees of PCHI, other than forsevere and profound hearing impairment, where itwas at 2.5 years of age. Had the remarkableimprovements in the median age of confirmationfollowing the implementation of the UNHS alsobeen reflected in a lowering of the 75th centile?No child with a severe or profound bilateral PCHIremained with an unconfirmed hearingimpairment after 3 years of age and the 75thcentile had been reduced by over 1 year to justunder 18 months. However, lesser improvementswere seen in the other degrees of PCHI and the
Possible effects of newborn hearing screening on the school entry hearing screen
22
0.260.18
0.25
0.61
0.23
0.08
0.51
0.4
0.51
0.95
0.46
0.27
0.76
0.61
0.78
1.29
0.69
0.46
0
0.2
0.4
0.6
0.8
1.0
1.2
1.4
Cohort 1, NNHS
1977–1987
Cohort 2, TNHS
1990–2000
Mild or moderate unilateral hearing loss
Cohort 3, UNHS
1992–2000
Cohort 1, NNHS
1977–1987
Cohort 2, TNHS
1990–2000
Severe or profound unilateral hearing loss
Cohort 3, UNHS
1992–2000
Prev
alen
ce p
er 1
000
FIGURE 3 The prevalence and 95% CIs for unilateral PCHI in the three cohorts

75th centile remained within the weeks leading upto the fifth birthday. Around one-quarter of thosechildren with any degree of PCHI other than asevere or profound hearing impairment thereforestill remained to have that hearing impairmentconfirmed at around school entry, even though theaverage age of confirmation had been sodrastically cut by the introduction of the neonatalscreen. When the cumulative distributions of theage of confirmation were examined by severity,22% of those with a moderate bilateral PCHI, 26%of those with a mild bilateral PCHI and 18% ofthose with a unilateral hearing impairment in thefirst year of primary school still remained to havetheir hearing impairment confirmed after 5 yearsof age. Although the introduction of neonatalscreening had reduced the average age ofconfirmation, it appears to have done little toreduce the number of ‘stragglers’ in the overallsystem of detection.
Ages of referralThe cohort evaluations used the age when thecongenital hearing impairments were confirmedas the most robust and stable indicator available
for the longitudinal comparison. However,confirmation delays may have reflected problemsin the assessment of children who had actuallyreceived a timely referral. The age at referral wastherefore examined separately for the cohort thathad received the UNHS (cohort 3, UNHS, born1992–2000) (Table 25). The delay from referral toconfirmation was also measured. Median delaysfrom referral to confirmation were less than1 month for those with a severe or profoundhearing impairment. They were slightly longer forthose with a lesser degree or a unilateral hearingimpairment, but even in those with a mildbilateral impairment the median delay betweenreferral and confirmation was 3 months. Thedelays in confirmation therefore reflected delays inreactive referral or in referral from the screeningprogrammes. When the cumulative distributions of the age of referral were examined by severity,16% of those with a moderate bilateral PCHI, 18%of those with a mild bilateral PCHI and 17% ofthose with a unilateral hearing impairment whowere in their first year of primary school stillrequired identification and referral for hearingassessment.
Health Technology Assessment 2007; Vol. 11: No. 32
23
© Queen’s Printer and Controller of HMSO 2007. All rights reserved.
TABLE 24 Median ages of confirmation of hearing impairment and IQR for those who had remained resident or moved in with apreviously unidentified PCHI in the three cohorts (n = 266)
Degree of hearing impairment Median age (IQR) (weeks)
1977–1987 1990–2000 1992–2000Cohort 1 Cohort 2 Cohort 3
NNHS (n = 101) TNHS (n = 84) UNHS (n = 81)
Bilateral Mild(PTA average BHE 500–4000 Hz) (20–39 dB HL) 218 (166–307) 187 (49–267) 150 (13–257)
Moderate(40–69 dB HL) 218 (130–252) 119 (23–198) 18 (8–247)
Severe/profound(�70 dB HL) 53 (47–131) 44 (20–157) 10 (8–76)
Unilateral All unilateral(PTA average WHE 500–4000 Hz) (>20 dB HL) 265 (194–286) 56 (15–298) 18 (11–243)
TABLE 25 Median and IQR ages of referral and delays to confirmation for those with a congenital PCHI who had remained resident ormoved in with a previously unidentified PCHI in cohort 3, UNHS
Degree of hearing impairment Median (IQR) (weeks)
Age of referral Age of confirmation Delay from referral to confirmation
Mild bilateral (n = 28) 115 (4–236) 150 (13–257) 13 (5–24)Moderate bilateral (n = 19) 11 (5–233) 18 (8–247) 6 (2–11)Severe/profound bilateral (n = 16) 6 (5–64) 10 (8–76) 3 (2–5)All unilateral (n = 18) 9 (1–237) 18 (11–243) 6 (4–11)

Routes to identificationThe comparative yields per 1000 cohort for thedifferent identification methods in the threecohorts are detailed in Figure 4 and Table 26.There were significant longitudinal changes in theyields from all the identification methods, otherthan in the yield from parental or professionalconcerns from 1 to 5 years of age. (The slightlyhigher overall yield from cohort 1, NNHS, isaccounted for by more unilateral cases, probablydue to the incidence of mumps at this time.)
Electrophysiological testing was only introducedfor reactive neonatal referrals towards the end ofthe 10-year period of cohort 1 and earlyidentification was based around the IDT screen at8 months. The sensitivity of the IDT screen forthose with a severe or profound congenitalhearing impairment who remained in the districtwas 77%, but the sensitivity for lesser degrees ofbilateral hearing impairment was only 25%.Because this low sensitivity of the IDT screen waswidely experienced, the Advisory Committee onServices to Hearing Impaired People (ACSHIP)report (1981) recommended the implementationof an intermediate universal screen around 3 yearsof age, and this was undertaken in the district for
a period of 5 years. However, it gave a low yieldthat consisted entirely of those with a mild orunilateral hearing impairment. The largest yieldfrom cohort 1, NNHS, was from assessmentsundertaken because of parental or professionalconcern from 1 to 5 years, and this included 45%of those with a congenital bilateral moderate orworse hearing impairment and 62.5% of thosewith an acquired or late-onset hearing impairmentof this degree. The second largest yield for thesecohorts came from the SES (Table 26).
The implementation of a selective neonatal screenusing the auditory brainstem response (ABR)testing of neonates with risk factors based on theAmerican Joint Committee register (1982) gave anoverall yield of 1.00 in 1000 neonates with PCHI,with 0.51 in 1000 having a moderate or worsebilateral PCHI. The sensitivity of the districtTNHS programme for identifying moderate orworse bilateral congenital PCHI at 46.9% wastypical of many other such programmes.5
However, the earlier identification offered by theTNHS was partly offset by a reduced yield fromboth parental and professional vigilance and fromthe IDT screen. By combining all three infantdetection methods, a yield of 0.76 in 1000 with a
Possible effects of newborn hearing screening on the school entry hearing screen
24
Coh
ort 1
, NN
HS
Coh
ort 2
, TN
HS
Coh
ort 3
, UN
HS
Coh
ort 1
, NN
HS
Coh
ort 2
, TN
HS
Coh
ort 3
, UN
HS
Coh
ort 1
, NN
HS
Coh
ort 2
, TN
HS
Coh
ort 3
, UN
HS
Coh
ort 1
, NN
HS
Coh
ort 2
, TN
HS
Coh
ort 3
, UN
HS
Coh
ort 1
, NN
HS
Coh
ort 2
, TN
HS
Coh
ort 3
, UN
HS
Coh
ort 1
, NN
HS
Coh
ort 2
, TN
HS
Coh
ort 3
, UN
HS
1.6
1.4
1.2
1.0
0.8
0.6
0.4
0.2
0
1.8
Yiel
d pe
r 10
00 c
ohor
t
Neonatalscreen
Parental orprofessional
concerns0–1 year
IDT Intermediatescreen at3 years
Parental orprofessionalconcerns 1–5 years
SES
Unilateral Mild bilateral Moderate bilateral Severe + profound bilateral
FIGURE 4 The yield per 1000 from the three cohorts by the method of identification

moderate or worse bilateral congenital PCHI wasachieved by the end of infancy. This contrastedwith a yield of 0.63 in 1000 for cohort 1, NNHS,achieved by this age. The targeted neonatalprogramme had therefore conferred some benefit,but the largest individual yield in cohort 2, TNHS,once again was from assessments undertakenbecause of parental or professional concern from 1 to 5 years, with the yield from the SES beingreduced by over one-third from 1.11 to 0.70 in1000.
The implementation of universal newbornscreening, as evidenced in the data from cohort 3,UNHS, resulted in a high rate of detectionthrough this route (1.58 in 1000), with otherroutes predictably reducing. However, parentaland professional concerns continued to delivercases of PCHI at significant rates, especially mildand, to some extent, unilateral losses. The yield ofthe SES reduced to 0.34 in 1000 for all PCHI, andto less than 0.1 in 1000 for unilateral PCHI.
Effect on the SES of introducing a universalneonatal screenIt had been widely anticipated that universalneonatal hearing screening would diminish theneed to retain a further universal screen at schoolage. It was inevitable that the yield of earlyidentified PCHI would be increased byintroducing a sensitive UNHS. Indeed, in cohort3, UNHS, the neonatal screen contributed thelargest individual yield within the overallprogramme, with the obvious inference being that
numbers requiring later case finding would be low.However, following up the neonatally screenedcohort into primary school demonstrated that thiswas not the case. By primary school age thecombined total prevalence of PCHI was 3.47 in1000, with only 1.58 in 1000 (46%) beingidentified by the district’s UNHS. This seemingcontradiction was explained by the downwardcascade of effectiveness of a screen undertaken atbirth for identifying a condition present in thecohort several years later. Figure 5 illustrates theincremental steps that eroded UNHS effectivenessfor identifying the PCHIs present in primaryschool. The following factors cumulativelycontributed to the need for late case finding.
● Children identified by UNHS moved away, withother preschool hearing impaired childrenmoving in. The yield of moderate or worsePCHI confirmed by the UNHS programmebefore any had moved out was 1.03 in 1000.However, by school age 0.21 in 1000 of thesehad moved out to be replaced by 0.24 in 1000moving in, without neonatal confirmation (notethat this is not a situation that would apply oncethe NHSP is fully implemented nationwide).Similarly, the yield of unilateral hearingimpairment confirmed by the neonatalprogramme was 0.55 in 1000, but of these 0.17 in 1000 moved out to be replaced by 0.10in 1000 moving in. If those with a mild PCHIare included, then of the 3.47 in 1000 with aPCHI in primary school 0.48 in 1000 hadmoved in, with 86% having a previously
Health Technology Assessment 2007; Vol. 11: No. 32
25
© Queen’s Printer and Controller of HMSO 2007. All rights reserved.
TABLE 26 Comparison of the yields from the identification methods in the three cohorts
Identification method Yield of all PCHIs per 1000 in cohort (95% CI) Pearson �2 (p)
Cohort 1 Cohort 2 Cohort 3No NHS Targeted NHS Universal NHS
Neonatal screen NA 1.003 1.58 4.03(0.71–1.41) (1.18–2.11) (0.045)
Concerns 0.44 0.12 0.14 8.840–1 year (0.26–0.75) (0.05–0.31) (0.05–0.35) (0.01)
IDT screen 0.89 0.61 0.10 17.49(0.61–1.28) (0.39–0.94) (0.04–0.30) (<0.001)
Intermediate 3-year screen 0.22 NA NA NA(0.11–0.46)
Concerns 1.49 1.12 1.30 1.651–5 years (1.12–1.98) (0.82–1.55) (0.95–1.79) (0.44)
SES 1.11 0.70 0.34 12.30(0.80–1.54) (0.41–0.99) (0.19–0.63) (0.002)
NA, not applicable.

unidentified hearing impairment. In this East London district two-thirds had moved infrom abroad.
● PCHI in the school-aged cohort was acquiredpostnatally or of late onset in 0.20 in 1000, 0.27in 1000 and 0.14 in 1000 for those with amoderate or mild bilateral or unilateral PCHI,respectively.
● Not all cases of congenital PCHI born andcontinually resident in the district had beenpicked up by the neonatal screen. The casesmissed had implications for characterising thePCHIs that required later case finding. Of thechildren with a congenital PCHI, 94% had beenenrolled for the neonatal screen and the testwas 96% sensitive for picking up moderate orworse bilateral hearing impairment. A singlechild with this degree of PCHI and a reverseslope audiometric configuration was the onlyfalse negative identified over the period of thecohort. Screen sensitivity was 87% forcongenital unilateral hearing impairment. Twochildren were false negatives – one had asimilar reverse slope configuration and theother a profound unilateral impairmentrestricted to the high frequencies. TEOAE testsensitivity was 91% for those with a mild PCHI.Of all who had failed the cochlear emission
screen only 90% received the ABR assessment,but when undertaken, this confirmed thepresence of PCHI in all apart from the mildPCHIs. In those with a mild congenital hearingimpairment (they had failed the neonatalTEOAE test and/or there were no audiologicaland medical findings consistent with theimpairment having been acquired), 42% wereincorrectly assessed by the ABR to have hearinglevels within the normal range. These factorscombined to reduce the effectiveness of theoverall programme, the sensitivity of which was83% for moderate or worse bilateral hearingimpairment, 69% for unilateral hearingimpairment and 46% for mild PCHI. Therefore,despite a high screen sensitivity and a totalUNHS yield of 1.58 in 1000, of the congenitalPCHIs born and remaining resident, half asmany again as had been picked up by theUNHS were subsequently identified after theneonatal period.
There was therefore a need for postneonatal casefinding for 1.89 in 1000 of the children with PCHIin primary school. With a low yield from concernsin the first year of life and from the IDT screen,an incremental yield of 1.30 in 1000 from parentaland professional concern from 1 to 5 years
Possible effects of newborn hearing screening on the school entry hearing screen
26
0
0.25
0.50
0.75
1.00
1.25
1.50
1.75
2.00
Prev
alen
ce p
er 1
000
Moderate and worse bilateral PCHI Mild bilateral PCHI Unilateral PCHI
Congenital PCHIsdistrict born whoremained resident
identified by UNHS
Incremented bycongenital PCHIs,missed by UNHS
Incremented byacquired or late-
onset PCHIs
Incremented by PCHIs whomoved In
All PCHIs in first yearof primary school
Factors increasing the requirement for post-UNHS case finding
FIGURE 5 Incremental factors prompting the need for case identification after the neonatal screen and by the first year of primaryschool

remained the most productive means of casefinding after the UNHS. This yield had notchanged significantly compared with the earlierprogrammes (�2 1.650, df 2, p = 0.438) (Table 26),and consequently the place of the SES had beenfurther eroded. There was a highly significant fallin yield to 0.34 in 1000 (�2 12.304, df 2, p = 0.002).
Identification through preschool hearingsurveillanceThe postneonatal yield of 1.89 in 1000 had mostlybeen identified because of parental or professionalconcerns, and the possibility of identifying a partof this yield by targeting a group for hearingassessment after the neonatal screen but beforeschool entry was further evaluated from cohort 3,UNHS. The majority of the 0.48 in 1000 hearing-impaired children who had moved in had anunrecognised hearing impairment, and they couldhave been identified by referring for audiologicalassessment all those moving in who had notbenefited from a previous hearing screen. Of the0.62 in 1000 with an acquired or late-onset PCHI,a small number (0.1 in 1000) had no identifiablecause, although there had been strong audiometricevidence that their hearing had previously beennormal. In those with an identified cause, theimpairment was temporally related to a medicalevent (e.g. bacterial meningitis or measles) in 0.21in 1000. A small number had a known familyhistory of late-onset PCHI (0.06 in 1000), but thelargest individual yield of 0.24 in 1000 was inthose who had a late-onset hearing impairmentassociated with a craniofacial dysmorphology or asyndrome (e.g. Turner’s, Down’s,Rubinstein–Taybi). Their identification waspossible through routine hearing surveillanceundertaken in the child development centre. Asimilar targeting strategy was possible in the 0.79in 1000 with a congenital PCHI that had not beenpicked up by the neonatal programme. As in theoverall cohort, around two-thirds had risk factorsfor hearing impairment, with risk factors beingabsent in 0.27 in 1000. A positive family historywas present in 0.21 in 1000, and 0.14 in 1000 hadrequired admission to the special care baby unit(SCBU). However, once again the largest yield of0.31 in 1000 consisted of children who had adysmorphology or a neurodevelopmentalcondition that required the multidisciplinary careprovided by the child development centre.
Of the postneonatal yield of 1.89 in 1000,identification would have been achieved in:
● 25% by referring for hearing assessment allthose moving into the district
● around 10% by referral of all those withbacterial meningitis or where hearingimpairment had been suspected followingchildhood viral illness
● around 15% by keeping a check on those with afamily history of hearing impairment
● around 30% by routine hearing surveillance ofall those attending the child developmentcentre. Assessing this cohort would have beenalmost four times as productive as reviewing allgraduates of the SCBU.
However, in 0.37 in 1000 (20%) there were noidentifiable risk factors and pre-SES identificationrequired reactive referral because of parental orprofessional concerns about hearing acuity orbecause of speech and language delay.
Evaluation BMinimal permanent hearing impairment, OMEand the SESIf the yield of children with a mild or worse PCHIis used to benchmark the worth of the SES, thenthis was significantly reduced (to 0.34 in 1000) incohort 3, UNHS, that had already received auniversal neonatal screen. However, irrespective ofthis, there is an argument that the SES mightidentify significant numbers of children withpersistent middle ear disorders and ‘minimal’PCHI that would not be identified neonatally.
There has been a recent increasing interest in theproblems faced by schoolchildren with a minimalPCHI. These children have been defined invarious ways, but in the severity classification usedin the current study, audiometric inclusion criteriawere a hearing threshold over 20 dB HL at anyfrequency, but with an average level of 20 dB HLor below. Such children usually presentaudiometrically with a hearing impairment at theextreme high frequencies or with a sensorineuraldip in the middle frequencies. They have not beensubjected to rigorous study in the UK, and studiesreported from elsewhere have used a wide varietyof inclusion criteria. Bess and colleagues14
recorded a high prevalence of 1.0% with abilateral minimal PCHI and 1.4% with a high-frequency sensorineural hearing impairment in asample aged 8.6–14.7 years, but in the severityclassification used here many of these childrenwould have been included in the mild category,whose results have already been discussed.However, interest in the performance andproblems encountered by children with a minimalPCHI has prompted a more robustepidemiological study by the Centers for DiseaseControl and Prevention (Ross et al. Atlanta, GA,
Health Technology Assessment 2007; Vol. 11: No. 32
27
© Queen’s Printer and Controller of HMSO 2007. All rights reserved.

USA: personal communication; 2005). Preliminaryresults have projected the prevalence in the generalUS population aged 6–16 years of ‘slight–mild’bilateral hearing impairment and unilateral hearingimpairment to be as high as 7.7%.
In the studies reported here, the longitudinalcohorts (cohorts 1–3) were not an appropriate toolto investigate minimal impairments because suchcases would not necessarily be known to theeducational or audiology services. The 1993–1999population-based cross-sectional survey (cohort 4)described here was therefore used to investigatethe role of the SES in identifying these children.Comparison was with data from cohort 1, NNHS,and with the results of the BACDA nationalsurvey.6 In cohort 4, of those children receivingthe SES, 3.5 in 1000 had a newly identifiedminimal PCHI. The majority of these cases werenot referred for further diagnosis or managementby the secondary level services, but 70% wererepeatedly followed up, 18% were referred to thethird tier audiology unit and 12% were referred totheir GP. The records were further scrutinised, anddespite the repeated follow-up and onwardreferrals, habilitative or diagnostic audiologicalinterventions were not undertaken on any of thechildren. The UNHS results of those who hadbeen born in the district and remained residentwere scrutinised and a small number had failedthe TEOAE newborn screen. The sensitivity of thecochlear emission test for these children had been14%, but the diagnostic ABR assessment followingcochlear emission failure had been entirelyunsuccessful in confirming this condition and theneonatal programme sensitivity for identifyingminimal PCHI within the school cohort had beenreduced to zero. It was not possible to assessretrospectively with any accuracy whether theminimal impairments had been presentcongenitally, but it can be assumed that some wereacquired, and Bess and colleagues14 have arguedthat many such hearing impairments may be leftas a legacy of otitis media. However, it is clearfrom the present study that none had emergedwith a diagnosis of PCHI following the neonataldiagnostic assessment. A single child with aminimal PCHI had been referred reactively beforeschool entry, but otherwise this condition wasinvariably picked up by the SES. The yield hadbeen very much lower than that predicted fromUS studies, but had remained stable over timeusing the same screening method in WalthamForest. The returns of minimal PCHI from 1986 to1989 (cohort 5) had been 2.4 in 1000 screened.Although the current yield was slightly higher, thisdifference was not significant (�2 0.061, df 1,
p = 0.805). Clearly, the SES in its present formcan give a low but relatively stable yield ofminimal PCHI. Perhaps the most noteworthyoutcome of this limited cross-sectional survey wasthat it has not been judged to be useful to provideany further intervention for such cases.
The identification of OME cases via the SES wasalso examined for cohort 4. The yield was 20 in1000 of those screened. However, many werealready under treatment and only 14 in 1000 werenewly identified and considered true positives ofthe screen. Even then, when these children wereconservatively managed with follow-upappointments and ‘glue ear’ reviews, only 7 in1000 had persistent OME that required furtherotological management. Comparison was madewith the results achieved from cohort 6 in thedistrict and those achieved by the BACDA study.The yield of cases with OME identified historicallyby the SES in the district was 29 in 1000 of thosescreened. This is not significantly different fromnational data on SES performance,6 whichsuggested that 26 in 1000 receiving the SES hadOME (�2 2.512, df 1, p = 0.113). It wassignificantly greater than the SES OME yieldreported from cohort 3, UNHS, that had receivedUNHS (�2 15.342, df 1, p <0.001). This suggeststhat, although UNHS cannot have directly affectedthe detection and management of middle earproblems, fewer children with previously‘undetected glue ear’ were reaching school age.Reasons are conjectural, but increased early ENTservice provision and general awareness aboutchildhood hearing following UNHS introductionmay have had some effect.
SummaryThe data from the studies in Waltham Forestservices demonstrate that there has beensignificant local change in the circumstancesrelating to the SES. In the 1970s and 1980s theSES provided an important backstop to a relativelyinsensitive IDT screen. There was a higher yield ofPCHI from the SES than from the IDT. Someprimary and secondary prevention measures andin particular the introduction of neonatal hearingscreening have markedly changed this picture.The extent to which the findings from theWaltham Forest studies are generalisable to theUK as a whole is debatable; on the one hand,there are features of the local population (e.g.ethnicity, mobility, deprivation indices) that maybe non-typical, and which may affect aspects ofscreening performance. On the other hand, the
Possible effects of newborn hearing screening on the school entry hearing screen
28

Waltham Forest data are derived from relativelylarge cohorts, and comparisons of prevalence ratesand aetiologies with well-established national datashow no significant differences. Furthermore,while some aspects of screen performance (e.g.coverage) may be affected by the non-typicalnature of the local population, it is not clear whythe nature of the relationships between theperformance of different screens (e.g. the generaleffect of the introduction of universal newbornscreening on later screens) should be affected bythese local issues. The following points areindicated by Waltham Forest data.
● The prevalence of moderate or worsepermanent bilateral hearing impairment was1.49 in 1000, which is consistent with othernational reports. An additional 1.21 in 1000children had a mild permanent bilateralimpairment. These rates are apparently stable.
● The prevalence of unilateral permanent hearingimpairment at school age was 0.78 in 1000, withthe data indicating a significant reduction in thenumbers of severe and profound cases to 0.27in 1000, probably related to primaryintervention (immunisation programmes).
● The introduction of the newborn screen wasaccompanied by a highly significant reductionin the median age of confirmation ofpermanent childhood hearing impairment;however, there was much less of a reduction inthe upper quartile age of confirmation whichremained in the weeks leading up to the fifthbirthday. Sixteen per cent of those with amoderate bilateral PCHI, 18% of those with amild bilateral PCHI and 17% of those with aunilateral hearing impairment who were intheir first year of primary school still requiredidentification and referral for hearingassessment at 5 years of age. Reasons for thisinclude the relatively poor sensitivity of thepreschool identification of milder hearingimpairment, the occurrence of acquired andlate-onset cases, and unconfirmed cases movinginto the district.
● Historically, the major route to identification ofall PCHI was parental or professional concern,followed by the SES (1.1 in 1000). For unilateralhearing impairment alone, it was the SES (0.63in 1000) followed by parental or professionalconcern. The introduction of targeted newbornscreening resulted in the newborn screen
becoming the second main route toidentification (second to parental andprofessional concern for all PCHI, and secondto the SES for unilateral alone), with the SESyield reducing to 0.7 in 1000 (all PCHI) and0.36 in 1000 (unilateral). The introduction of auniversal newborn screening programme meantthat newborn screening became the main routeto identification for all PCHI and for unilateralPCHI, with parental and professional concernin second place (stable at 1.3 in 1000) and theSES yield reduced to 0.34 in 1000 (all PCHI)and 0.07 in 1000 (unilateral).
● The overall prevalence of all PCHI at SES age,excluding minimal but including mild andunilateral, was 3.47 in 1000, indicating asignificant increase from the prevalenceidentified neonatally, in line with previousstudies, owing to cases missed by the newbornscreening programme, cases moving intodistrict, and acquired or late-onset cases.
● Of the 3.47 in 1000 children with a PCHI atSES age, 1.89 in 1000 required identificationafter the neonatal screen. It would have beenpossible to identify 1.52 in 1000 by optimallyreferring from preschool surveillance a groupselected as needing audiological assessment.The most effective targeting appears to be theselection for hearing assessment of the childrenin attendance at the Child Development Centre.However, 0.37 in 1000 of those not picked upneonatally had no discernible risk factor thatwould have prompted referral for a hearingassessment, and for their identification reactivereferral or SES would be required.
● There has been growing interest in theprevalence and possible effects of minimalhearing impairment in childhood. In thesestudies, the SES showed a yield of minimalpermanent hearing impairment of 3.5 in 1000.Identification did not lead to any activeongoing management in any of the children.
● Both a national study6 and the data fromWaltham Forest have confirmed just under 3%of those primary school children screened ashaving OME. New cases amounted to 1.4% andof these one half (0.7%) needed furtherotological management.
● The DNA rate for follow-up appointments forthose failing the SES in Waltham Forest was inthe order of 20%; this is very similar to thatreported by Fonseca and colleagues.6
Health Technology Assessment 2007; Vol. 11: No. 32
29
© Queen’s Printer and Controller of HMSO 2007. All rights reserved.


BackgroundThis chapter examines the evidence base for theeffectiveness of available school entry hearingscreening tests or screening programmes (i.e.combination of screening tests).
As outlined by the UK National ScreeningCommittee in their recommendations forevaluating screening programmes, Wilson andJungner’s 1968 criteria remain the benchmark38
(see also Appendix 1). Those criteria thatspecifically relate to the screen itself include:
● There should be a reliable, valid and repeatablescreening test.
● The screening test should be acceptable, safeand easy to perform.
● The screening test should be sensitive andspecific.
● The cost of the screening programme should becommensurate with benefits of early detection.
With reference to these criteria, the review focuseson three broad aspects of evidence base for theeffectiveness of school-based hearing screening:38
screen accuracy (i.e. sensitivity: proportion ofchildren with a hearing impairment who have apositive screen test; and specificity: proportion ofchildren without hearing impairment who have anegative screen test), screen performance (i.e.uptake: number of children who take up screeningwhen offered; and yield: i.e. number of casesidentified by the screen) and screen effectiveness(i.e. impact of the screen on children’s outcomesincluding language, educational ability and socialinteraction). The issues of cost and cost-effectiveness of school entry hearing screen areconsidered in Chapter 5.
The nature of the evidence necessary to addressthese elements of screening is potentially quitediverse. At one end of the spectrum, for childoutcomes, one would want to focus on studies witha comparative design (i.e. a direct comparison of agroup of children who receive the hearing screenor programme with a group of children who donot). The prospective randomised controlled trial
(RCT) provides the study design of choice.39 Non-randomised (or observational or naturalistic)comparative designs, such as cohort orcase–control studies, may also be useful. Theassessment of sensitivity and specificity requires astudy design where the hearing outcome results ofa screen are compared with those of a referencetest undertaken in the same group of children.The quality of this latter type of study depends onfactors such as the degree of independence of theapplication of the screen test and reference.40 Atthe other end of the spectrum, uptake and yieldcan often be obtained from a relatively simplenon-comparative study design where a group ofchildren is offered a screen and followed up overtime.
Given that the primary focus of this chapter was toassess alternative school entry hearing screeningtests or programmes, the particular approach hasbeen to seek comparative evidence; that is, studiesthat directly compare the dimensions of accuracy,performance and effectiveness of two or morescreening tests or programmes.
Hypotheses tested in the review(research questions)1. How accurate are the tests used in school-based
hearing screening in terms of sensitivity andspecificity?
2. What is the performance of school-basedhearing screening in terms of yield and uptake?
3. What is the effectiveness of school-basedhearing screening in terms of language,education and social outcomes of children?
4. What are the adverse effects of school-basedhearing screening?
MethodsSearch strategySearches for systematic reviews and primarystudies of school-based hearing screening wereundertaken across the following bibliographicsources: Cochrane Library (Wiley) (CDSR,
Health Technology Assessment 2007; Vol. 11: No. 32
31
© Queen’s Printer and Controller of HMSO 2007. All rights reserved.
Chapter 4
Systematic review of the effectiveness of school entry hearing screening

CENTRAL, DARE), MEDLINE and MEDLINE InProcess (Ovid), EMBASE (Ovid), CINAHL (Ovid),PsycINFO (Ovid), Science Citation Index (Web ofScience), ERIC (CSA) and ongoing trial databases(National Research Register, ClinicalTrials.gov andReFeR) from initial entries up to May 2005. Thereference lists of retrieved full-text reports werealso checked.
Bibliographic searches were designed and run byan experienced information specialist. Medicalsubject headings and text terms were chosen tomaximise the comprehensiveness and sensitivity ofthe searches. Initial searches focused on screeningrelated terms. These were later supplemented byadditional searches designed to identify studies ontest accuracy. Search strategies are listed inAppendix 4.
Inclusion/exclusion criteria● Study design: systematic reviews and any
primary study using a comparative design (i.e.randomised controlled trials, non-randomisedcontrolled trials, cohort studies or comparisonsof two or more tests or test protocols) wereincluded.
● Population: included children aged 4–6 years.Studies of children with known hearingimpairment or high-risk groups (such as Down’ssyndrome, cytomegalovirus infection ormeningitis) were excluded.
● Screening test or programme: hearingscreening comprising of any of one or more ofthe following tests: sweep PTA, single-frequencyPTA, otoacoustic emissions, questionnaires,otoadmittance tests, tympanometry,reflectometry and speech audiometry. Testsshould be undertaken in either a primaryschool or the community (e.g. community clinic,family home or GP surgery) setting. This couldinclude hearing screening as a component of amultifaceted screen such as a school entrymedical examination.
● Comparator: no hearing screening or hearingscreening based on different tests or testprotocols. Studies with no clear comparatorwere excluded.
● Outcomes: outcomes were sought according tothe research questions: (1) test accuracy:sensitivity and specificity or equivalent;(2) screen performance: uptake (i.e. number of children who actually receive screen) andyield (i.e. number of cases identified); and (3) screen effectiveness: language skills, health-related quality of life, communicationsskills, social interaction and educationalperformance.
No language restrictions were applied to theinclusion of studies. Study selection wasundertaken independently by two reviewers (JSand RT). Disagreements about selection wereresolved by discussion.
Data extractionData were extracted from included studies onstudy population, sample size, study characteristics(author, year, country of publication and samplesize), study design (method of sampling, details oftest and comparison and listing of relevantoutcomes), screening procedure (age at testing,choice and combination of screening tools, typeand training of the tester, setting of the screen,failure criteria, retest frequency and interval) andstudy findings. For test accuracy, findings weresought as two-by-two tables so that reportedsensitivities and specificities could be checked.
Data extraction was carried out using a predefineddata extraction and quality assessment form by asingle reviewer (JS) and checked by a second (RT).Any discrepancies were resolved by discussion andwhere necessary by the mediation of a thirdreviewer (JB or HF). Furthermore, a clinical expert(SF) in the field checked the data extracted.
Quality assessmentThe methodological quality of systematic reviewswas assessed using the Oxford Critical SkillsAppraisal Programme (CASP) criteria (seeAppendix 5).41 Depending on study design, theUS Preventative Services Task Force has proposeda ‘levels of evidence’ rating for individualscreening studies:
level I: randomised controlled triallevel II: non-randomised control triallevel III: cohort or case–control studylevel IV: ecological or descriptive studies (e.g.international pattern time series)level V: opinions of respected authorities based onclinical experience, descriptive studies or reportsof expert committees.
Given the lack of studies identified by the reviewthat fell into the above designs it was decided tofocus quality assessment on the principal issueaddressed by included studies (i.e. test accuracy).The Quality Assessment of Studies of DiagnosticAccuracy (QUADAS) tool42 was used for thispurpose and consists of 14 questions (seeAppendix 6). For every study, each question wasgiven a ‘yes’, ‘no’ or ‘unsure’ answer based onwhether the criteria were met, not met or it wasunclear, respectively. The quality of each article
Systematic review of the effectiveness of school entry hearing screening
32

was scored on the basis of the total number of ‘yes’responses and could therefore range from zero(poorest possible quality score) to 14 (highestpossible quality score).
Data presentation and analysisResults are presented separately for test accuracy,screen performance and screen effectiveness.Given the limited evidence base for screenperformance and effectiveness, data pooling was not possible. To facilitate interpretation,sensitivity and specificity results are tabulatedaccording to specific tests. In addition, sensitivityand specificity results of individual studies are graphically presented in the form of summary receiver operating characteristic (ROC) curves.
Studies included in the reviewThe process of selecting studies for inclusion issummarised in Figure 6. In total, 998 citations wereidentified by the bibliographic searches, themajority from three databases (MEDLINE 464,EMBASE 252 and ERIC 172). Of these citations,899 were excluded on the basis of their title orabstract for one or more reasons, principally thatthe study did not address hearing impairment or
was non-comparative. Of the 99 papers retrievedin full, three systematic reviews and 25 primarystudies were judged to meet the inclusion criteriaof this review. Twenty-three of the included studieswere identified from the initial ‘screening’-basedsearches and two from the follow-up ‘testaccuracy’-based searches. The level of agreementin selecting studies between the two reviewers was good (weighted kappa 0.67, 95% CI 0.60 to0.75).
Studies excluded from the review The 74 excluded studies and reasons for exclusionare listed in Appendix 7.
Results of reviewPrevious systematic reviewsThree systematic reviews relating to school entryscreening were identified that met the inclusioncriteria (Table 27). A detailed summary of theirquality is provided in Appendix 8. The Cochranereview of screening for OME by Butler andcolleagues18 considered studies on children onlyup to the age of 4 years and was thereforeexcluded (but see discussion in Chapter 6).
Health Technology Assessment 2007; Vol. 11: No. 32
33
© Queen’s Printer and Controller of HMSO 2007. All rights reserved.
998 citations retrieved
899 references excluded on the basis of title
and/or abstract
99 full text reports obtained
Included 25 primary studies
3 systematic reviews
74 studies excluded(Appendix 7)
FIGURE 6 Selection process for primary studies

Barlow and colleagues (1998)43
The systematic review by Barlow and colleagues43
was published in 1998 and examined the issue ofthe school entry medical examination (SEM). TheSEM consisted of vision assessment, a hearing testand a general medical examination by a doctor.The authors also assessed the relative effectivenessof selective SEM (children assessed by a doctoronly when there are concerns about their health)compared with routine SEM (all children areexamined).
Overall, the methodological quality of the Barlowreview was judged to be good. The review stated aclear and comprehensive search strategy thatincluded a number of bibliographic databasesincluding MEDLINE, EMBASE, CINAHL andDARE. Searches were initially designed to identifymeta-analyses and RCTs. However, owing to alimited amount of RCT evidence the authorsbroadened their searches so no restrictions wereplaced on study design. Reference lists wereexamined and experts in the field were consulted.Principal investigators were contacted to obtaininformation about ongoing studies. There were nolanguage restrictions placed on study inclusion. Asingle reviewer undertook selection of studies forinclusion and it is not stated whether anotherreviewer checked this or not. Two reviewersassessed and critically appraised the quality ofmeta-analyses and systematic reviews usingpublished criteria. Primary studies were appraisedusing an adapted version of Wilson and Jungnercriteria for screening programmes. Noinformation was given as to whether studies wereselected on the basis of their quality.
The authors included a total of 16 primary studies.The authors reported a ‘high’ uptake rate for bothroutine and selective SEM, but did not provideactual figures. Across the identified studies the rateof new ‘problems’ identified by SEM variedmarkedly for both routine SEM (27–45 problemsper 100 children eligible) and selective SEM (twoto six problems per 100 children eligible). It isvirtually impossible to interpret the significance ofthese findings as the ‘number of problems’ couldinclude any combination of vision, hearing, growthor other physical problems.
Furthermore, the review authors noted thatdifferent studies applied different threshold levelsfor the identification of any particular problemarea, such as hearing impairment. Given thatstudies did not report their follow-up, it was notpossible to comment on the sensitivity orspecificity or yield of SEM. The one RCT
identified provided follow-up in the yearsucceeding the trial, of children not selected forSEM. The findings showed that from a cohort of302 children, 12 were discovered to have seriouslanguage development problems and nine hadbehaviour problems. However, as this trial did notinvolve the re-examination of children whoreceived SEM, it is impossible to know whether thesame number of children would have been missedin the routine medical group. The percentage ofchildren selected for SEM varied across studiesfrom 19 to 73%, this range reflecting the widelydiffering selection criteria of studies.
The overall conclusion of the authors of thisreview was that there was insufficient evidence toassess the effectiveness and efficiency of selectiveor routine SEM.
New Zealand Health Technology AssessmentReport (1998)44
The New Zealand Health Technology Agency(NZHTA) undertook a review of the effectiveness ofpreschool and school entrant screening programmesfor OME and conductive hearing impairment.44
The review report is divided into a number ofsections that examine different specific questions.The final section of the report is entitled ‘Is therea suitable screening test for OME? And theassociated hearing impairment?’ and ‘What is theevidence of effectiveness of screening programmesfor OME and associated hearing impairments?’and is clearly relevant to the present report.
The methodological quality of the review wasassessed to be good. Its aims were clearly statedand the authors undertook comprehensivesearches of MEDLINE, HEALTHSTAR andCINAHL databases up to March 1998. Inaddition, reference lists were handsearched andregisters of current research consulted. The reportdid not state whether experts in the field werecontacted and the search was restricted to English-language studies and those directly applicable tothe New Zealand population, thus limiting itsscope. The search strategy was aimed primarily atidentifying RCTs, although cohort studies andaudits were also included. To be included, studieshad to involve more than 30 participants andadequately report demographic details. Studieswere quality assessed using a schedule developedby the Group Health Cooperative of Puget Soundin 1996 and adapted by the New ZealandGuidelines Group of the National HealthCommittee in 1997. The quality criteria used inthis schedule were not stated in the report.
Systematic review of the effectiveness of school entry hearing screening
34

Health Technology Assessment 2007; Vol. 11: No. 32
35
© Queen’s Printer and Controller of HMSO 2007. All rights reserved.
TAB
LE 2
7Su
mm
ary
of p
revio
us s
yste
mat
ic re
view
s
Rev
iew
Rev
iew
sco
peN
umbe
r an
d ty
pe o
f inc
lude
d A
utho
rs’ c
oncl
usio
nsst
udie
sa
Popu
lati
onSc
reen
ing
Out
com
esin
terv
enti
onas
sess
ed
Barlo
w e
t al
., 19
9843
Chi
ldre
n en
terin
gpr
imar
y sc
hool
Rout
ine
orse
lect
ive
SEM
with
a d
octo
r’s
cont
ribut
ion
Upt
ake
rate
s, r
efer
ral
rate
s, y
ield
, PPV
, NPV
,se
nsiti
vity
, spe
cific
ity,
cost
s, o
utco
me
oftr
eatm
ent
and
patie
ntsa
tisfa
ctio
n m
easu
res
One
RC
T, t
wo
obse
rvat
iona
lco
mpa
rativ
e st
udie
s, a
nd 1
3pr
ospe
ctiv
e an
d re
tros
pect
ive
obse
rvat
iona
l stu
dies
or
audi
ts
Insu
ffici
ent
evid
ence
ava
ilabl
e to
ass
ess
the
effe
ctiv
enes
s or
effi
cien
cy o
f eith
er t
he r
outin
e or
the
sele
ctiv
e SE
M. T
his
revi
ew d
emon
stra
tes
the
frag
ility
of t
he e
vide
nce
on w
hich
the
SEM
is b
ased
and
ques
tions
the
eth
ical
bas
is of
thi
s pr
ogra
mm
e
NZ
HTA
, 199
844C
hild
ren
aged
2–12
yea
rsSc
reen
ing
tech
niqu
es fo
rth
e de
tect
ion
ofO
ME
Sens
itivi
ty, s
peci
ficity
,PP
V, r
efer
ral r
ate,
rete
st fr
eque
ncy
Two
coho
rt s
tudi
es, t
hree
unco
ntro
lled
stud
ies
and
two
audi
tst
udie
s
Cur
rent
res
earc
h ca
nnot
sup
port
or
refu
te t
heef
fect
iven
ess
of s
cree
ning
pro
gram
mes
des
igne
d to
dete
ct O
ME
and
cond
uctiv
e he
arin
g im
pairm
ent
inim
prov
ing
disa
bilit
y-re
late
d ou
tcom
es
Piro
zzo
et a
l., 2
00347
Chi
ldre
n ag
ed3–
12 y
ears
Whi
sper
edvo
ice
test
Sens
itivi
ty a
ndsp
ecifi
city
Five
cro
ss-s
ectio
nal s
tudi
esT
he w
hisp
ered
voi
ce t
est
is an
acc
urat
e an
d sim
ple
test
of h
earin
g im
pairm
ent
that
cou
ld b
e us
ed b
yG
Ps b
ut h
as n
ot b
een
adeq
uate
ly e
valu
ated
inpr
imar
y ca
re s
ettin
gs. D
iffer
ence
s in
acc
urac
y am
ong
publ
ished
stu
dies
cou
ld b
e ex
plai
ned
by d
iffer
ence
sin
con
duct
ing
the
test
. The
tec
hniq
ue fo
r co
nduc
ting
the
test
nee
ds t
o be
sta
ndar
dise
d to
opt
imise
the
sens
itivi
ty o
f the
tes
t, pa
rtic
ular
ly in
chi
ldre
n
a St
udie
s th
at a
re r
elev
ant
to t
he c
hild
ren
aged
4–6
yea
rs a
nd d
esig
n as
sta
ted
by t
he a
utho
rs.
NPV
, neg
ativ
e pr
edic
tive
valu
e; P
PV, p
ositi
ve p
redi
ctiv
e va
lue.

The review identified no RCTs, five cohort studiesand two audits. However, three of these so-called‘cohort’ studies were in fact uncontrolleddescriptive studies describing the outcomes ofchildren who had received hearing screening.Similarly, the audits describe the experiences oftwo New Zealand centres undertaking screeningfor OME. One Dutch study used tympanometry toscreen for OME in 2-year-olds over a 2-yearperiod;45 persistent cases were randomised forsurgery (grommets) versus no surgery, showing nolater language outcome differences. Although theages of the children at the close of this study werewithin the range of interest here, the screeningwas earlier. These six studies effectively provide nodirect information on the comparativeeffectiveness of hearing screening in 4–6-year-olds.
In the remaining study, which is relevant to thisreview, two geographical populations of school-entry Canadian children were compared byFeldman and colleagues in 1980.46 One group hadbeen screened in the previous 6–12 months usingtwo-step audiometry and the other group had not.On the basis of a non-significant difference in lateraudiometric outcomes between the two groups, theauthors concluded that screening was ineffective.
The NZHTA authors reported the specificity andsensitivity for detecting OME with otoscopy to behighly dependent on the technique, while thespecificity (53–94%) and sensitivity (78–100%) oftympanometry were generally high. Although thereport mentions audiometry, TEOAE and parentalquestionnaire, no specificity or sensitivity values forthe tests are provided. It is unclear howsystematically the authors of the New Zealandreport identified the evidence for OME screen testaccuracy.
Pirozzo and colleagues (2003)47
This review aimed to assess the accuracy(performance) of the whispered voice test forscreening for hearing impairment in adults andchildren.47
The quality of the review was judged to bemoderate as no details of the selection of studieswere provided. The aims of review were clearlystated. A detailed and comprehensivebibliographic search strategy including allpublications until June 2002 was presented andexperts were contacted about unpublished work.
To be included, studies had to be cross-sectionaland include a reference test (PTA) applied to atleast 80% of participants. A total of eight studiesmet the inclusion criteria, four of which wereconcerned with adults (17–89 years) and four withchildren (3–12 years). The authors commentedthat the quality of included studies was ‘modest’based on the Standards for Reporting Studies of Diagnostic Accuracy (STARD) criteria. Only the findings in children will be discussed furtherhere.
The authors stated that they did not undertakemeta-analysis given the level of heterogeneitybetween the methods of the studies and the way inwhich the whispered voice test was performed.The studies in children used slightly differenttechniques to conduct the whispered voice test andthe threshold for audiometry ranged from 20 to35 dB HL. The studies generally showed a goodlevel of specificity (92–98%), but a poorersensitivity (80–96%) (Table 28). The authors of thisreview did not report any other long-termoutcomes such as language or educationalattainment.
The authors concluded that the whispered voicetest is an accurate and simple test of hearingimpairment. However, they note that thesensitivity is much lower for children than adultsand therefore may fail to identify hearingimpairment in a large proportion of children.Furthermore, differences in accuracy amongpublished studies appeared to be explained bydifferences in test conduct (e.g. loudness of thewhisper, and the most appropriate use of letters,numbers or words for testing and tester).
Systematic review of the effectiveness of school entry hearing screening
36
TABLE 28 Studies using whispered voice test in children
Groen, 197348 Dempster and Prescott et al., Prescott et al., Mackenzie, 199249 1999, study 150 1999, study 250
Sample size 197 141 177 201Prevalence (%) of hearing impairment 14 13 31 9Sensitivity (%, 95% CI) 96 (82 to 99) 90 (69 to 97) 80 (68 to 88) 83 (61 to 94)Specificity (%, 95% CI) 92 (87 to 95) 90 (84 to 94) 96 (19 to 98) 98 (95 to 99)
Modified from Pirozzo et al. (2003), Table 2.48

Primary studiesScope of included studiesOne of 25 included studies was a cohort studywhile the remainder were comparative cross-sectional studies (Table 29). Only the cohortstudy46 attempted to address the question of theeffectiveness of the hearing screen in children atschool entry. The remaining cross-sectional studieswere primarily concerned with the question of thetest accuracy. Thirteen studies reported screenperformance.51–62 No studies reported eitherscreen yield or adverse effects.
Studies were included on the basis of involvingchildren between 4 and 6 years of age. However,only four studies included exclusively childrenwhose age fell specifically within thisrange.52,57,63,64 Most studies had varying ageranges, with some including children as young as2.5 years and others including children as old as14 years. Four studies failed to report a specificage, although they did describe the population as‘kindergarten’ or ‘preschool’ and therefore wereincluded on this basis.46,58,65,66 Overall, studiesincluded similar proportions of boys and girls.
A range of different test comparisons was found.Some studies compared individual tests (e.g.tympanometry versus PTA), whereas otherscompared combinations of tests or differentprotocols for the same test. The majority of studiesused PTA as the reference test because this wastheir current method of school entry screeningtesting and this is the standard test for measuringhearing threshold levels.67
Where details were reported, screening was carriedout in a variety of situations: within the school orprimary care/community facility, and under tightlycontrolled conditions (e.g. a soundproof room) ornot. In the majority of studies a qualifiedprofessional conducted the screen, such as aschool (or public health) nurse or an audiologist.
The conditions being sought varied across studies;for instance, tympanometry and otoscopy are nothearing tests but predictors of conductive hearingimpairment. Studies failed to describe explicitlythe conditions being sought or the severity ofhearing impairment identified.
Quality of included studies Three studies were in languages other thanEnglish56,64,66 and were data extracted with thehelp of a translator. Consequently, these studiescould only be partially quality assessed and sowere omitted from the following quality analysis.
The median QUADAS score across the remaining21 cross-sectional studies was 8 (out of a possiblemaximum score of 14), with a range of scores from5 to 12 (Table 29). Based on QUADAS scores,studies were categorised as of ‘poor’ quality: lessthan 7; ‘moderate’ quality: 7–9; and ‘good’ quality:greater than 9. On this basis, one study wasclassed as poor quality; seven studies as moderatequality and 13 studies as good quality. Themajority of low scores were the result of poorreporting where the authors had failed to describeparticular methodological aspects of their study.The breakdown of quality scoring across individualstudies is shown in Appendix 9.
Those criteria that were consistently met across the studies were questions 1, 4, 5, 6, and 7; that is,adequate time between index and reference test,representative sample and spectrum of childrentested and tests interpreted independently of each other. Such was the level of reporting thatsome criteria, questions 2, 3, 10, 11, 12 and 13,were not achieved by any or very few (less thanfive) studies.
Question 2 considers whether or not the selectioncriteria have been clearly described. The fact thatmost studies did not describe their selectioncriteria, or were unclear about them, means thatone has to consider that these studies may beinfluenced by selection bias. This brings intoquestion the internal validity and generalisabilityof the studies. Question 3 considers whether thereference standard is likely to classify the targetcondition correctly. As there is no recognisedreference test for hearing screening in children(see above, ‘Scope of included studies’), all studiesreceived an ‘unclear’ for this question; as none ofthem used a comprehensive audiologicalassessment as their reference standard one cannottell whether any of the tests they used are 100%effective. This means that there may be non-differential misclassification bias within thestudies. Thus, the sensitivities and specificities ofthese studies may be overestimates orunderestimates. Questions 9 and 10 take intoaccount whether or not the assessors were blindedto the results of the index test when carrying outthe reference test and vice versa. Lack of blindingis a source of observer bias potentially leading tofurther misclassification and invalidity of theresults. Question 12 looks at whether or not theclinical data available to the testers were the sameas those that would be available in clinicalpractice. All studies received an ‘unclear’ for thisquestion as none of them clearly states what datawere available to them at the time of testing.
Health Technology Assessment 2007; Vol. 11: No. 32
37
© Queen’s Printer and Controller of HMSO 2007. All rights reserved.

Systematic review of the effectiveness of school entry hearing screening
38 TAB
LE 2
9Su
mm
ary
of c
hara
cter
istic
s of
incl
uded
stu
dies
Sour
ceD
esig
nN
o. o
f A
ge,
Test
(s)
Ref
eren
ce s
tand
ard
Sett
ing
Test
er(s
)Q
ualit
y O
utco
me
dom
ains
child
ren
mea
n (S
D)
eval
uate
dsc
ore
(% m
ale)
or r
ange
Abo
u H
aida
ret
al.,
200
568
Fran
ce
Cro
ss-
sect
iona
l36
0(5
8)7.
4 ye
ars
‘Aud
io 4
’ pic
ture
test
PTA
NR
NR
7Te
st a
ccur
acy
Feld
man
etal
., 19
8046
Can
ada
Coh
ort
763
(NR)
NR
VASC
Non
eSc
hool
; no
furt
her
deta
ilsPu
blic
hea
lthnu
rse
NA
Scre
en e
ffect
iven
ess,
scre
en p
erfo
rman
ce
Fitz
Zal
and
and
Zin
k,19
8455
USA
Cro
ss-
sect
iona
l35
10(N
R)4
year
s6
mon
ths
to 6
year
s7
mon
ths
Pure
ton
e sw
eep
test
, aud
iom
etric
Rhin
ne t
est,
audi
omet
ric W
eber
test
,ty
mpa
nom
etry
,ac
oust
ic r
efle
x
Com
bina
tion
of h
istor
ypl
us p
ure
tone
and
air
and
bone
con
duct
edth
resh
olds
plu
sty
mpa
nom
etry
plu
sac
oust
ic r
efle
x pl
ussp
eech
tes
ts
Scho
ol; p
revi
ously
asse
ssed
for
noise
leve
l and
judg
ed t
obe
the
qui
etes
t
Publ
ic h
ealth
nurs
es a
ndau
diom
etric
aid
es
8Te
st a
ccur
acy
Gom
es a
ndLi
chtig
,20
0569
Braz
il
Cro
ss-
sect
iona
l13
3(5
0)3
year
sPa
rent
alqu
estio
nnai
reEx
amin
atio
n pl
usty
mpa
nom
etry
plu
s pu
reto
ne s
wee
p te
st
NR
Rese
arch
er a
ndvo
lunt
eers
(em
ploy
ees
from
a lo
cal n
urse
ry)
6Te
st a
ccur
acy
Ham
ill,
1988
58
USA
Cro
ss-
sect
iona
l57
6(N
R)N
RVA
SCA
and
pure
ton
esw
eep
test
Pure
ton
e sw
eep
test
NR
Scho
ol v
ision
and
hear
ing
pers
onne
l10
Test
acc
urac
y, s
cree
npe
rfor
man
ce
Ham
mon
det
al.,
199
763
Aus
tral
ia
Cro
ss-
sect
iona
l68
5(N
R)4–
5 ye
ars
Que
stio
nnai
rePT
A, p
ure
tone
sw
eep
test
and
EN
Tex
amin
atio
n
NR
Nur
ses
8Te
st a
ccur
acy
Hin
d et
al.,
1999
65
UK
Cro
ss-
sect
iona
l28
60(N
R)N
RQ
uest
ionn
aire
Pure
ton
e sw
eep
test
Scho
olA
udio
met
ricia
ns9
NR
Hol
tby
et a
l., 1
99770
UK
Cro
ss-
sect
iona
l67
4(N
R)5–
6 ye
ars
Tym
pano
met
ryPT
AEx
amin
atio
nSc
hool
Scho
ol n
urse
s11
Test
acc
urac
y, s
cree
npe
rfor
man
ce
cont
inue
d

Health Technology Assessment 2007; Vol. 11: No. 32
39
© Queen’s Printer and Controller of HMSO 2007. All rights reserved.
TAB
LE 2
9Su
mm
ary
of c
hara
cter
istic
s of
incl
uded
stu
dies
(co
nt’d
)
Sour
ceD
esig
nN
o. o
f A
ge,
Test
(s)
Ref
eren
ce s
tand
ard
Sett
ing
Test
er(s
)Q
ualit
y O
utco
me
dom
ains
child
ren
mea
n (S
D)
eval
uate
dsc
ore
(% m
ale)
or r
ange
Lyon
s et
al.,
2004
53
Aus
tral
ia
Cro
ss-
sect
iona
l52
8(5
3)6.
2 ye
ars
1m
onth
to
7ye
ars
9m
onth
s
Tym
pano
met
ryD
POA
EPu
re t
one
swee
p te
stSc
hool
: non
-so
undp
roof
edro
om w
ith a
mbi
ent
noise
leve
lsbe
twee
n 34
and
51dB
A
Aud
iolo
gist
8Te
st a
ccur
acy,
scr
een
perf
orm
ance
Mar
agno
and
Teat
ini,
1983
66
Italy
Cro
ss-
sect
iona
l11
4(N
R)N
RSp
eech
tes
tH
earin
g as
sess
men
tin
clud
ing
PTA
Hea
ring
cent
re:
silen
t-no
iseco
ntro
lled
cabi
net
NR
NA
Scre
en a
ccur
acy
McC
urdy
et
al.,
197
671
USA
Cro
ss-
sect
iona
l93 (N
R)3
year
s6
mon
ths
to4
year
s
Tym
pano
met
ry a
ndst
aped
ius
refle
xPT
ASc
hool
: vac
ant
clas
sroo
m, n
otno
ise c
ontr
olle
d
NR
8Sc
reen
acc
urac
y
Nie
nhuy
set
al.,
1994
61
Aus
tral
ia
Cro
ss-
sect
iona
l18
0(5
2)<
16 y
ears
Oto
scop
y,ty
mpa
nom
etry
,pn
eum
otos
copy
,re
flect
omet
ry
PTA
Scho
ol: m
obile
soun
dpro
ofed
tes
tbo
oth
Paed
iatr
icot
olog
ist, m
edic
alof
ficer
, aud
iolo
gist
and
a re
gist
ered
nurs
e
8Sc
reen
acc
urac
y,sc
reen
per
form
ance
Noz
za e
t al
.,19
9772
USA
Cro
ss-
sect
iona
l66 (N
R)5–
10 y
ears
TEO
AE
Pneu
mat
ic o
tosc
opy
plus
swee
p te
st s
cree
ning
plus
PTA
Scho
ol li
brar
yA
udio
logi
st a
ndth
ree
audi
olog
ygr
adua
te s
tude
nts
11N
R
Olu
sany
a,20
0151
Nig
eria
Cro
ss-
sect
iona
l35
9(4
8)6.
7 ye
ars
Que
stio
nnai
re,
tym
pano
met
ry,
otos
copi
cex
amin
atio
n
Two-
stag
e au
diom
etry
pure
ton
e sw
eep
test
plus
PTA
NR
NR
7Sc
reen
acc
urac
y
Orla
ndo
and
Fran
k,19
8773
USA
Cro
ss-
sect
iona
l10
0(N
R)2
year
s6
mon
ths
to6
year
s
Pure
ton
e sw
eep
test
usin
g an
audi
osco
pe, p
ure
tone
sw
eep
test
usin
g an
aud
iom
eter
PTA
Aud
iom
etric
tes
tbo
oth
Aud
iolo
gist
and
clin
icia
n11
Scre
en a
ccur
acy
cont
inue
d

Systematic review of the effectiveness of school entry hearing screening
40 TAB
LE 2
9Su
mm
ary
of c
hara
cter
istic
s of
incl
uded
stu
dies
(co
nt’d
)
Sour
ceD
esig
nN
o. o
f A
ge,
Test
(s)
Ref
eren
ce s
tand
ard
Sett
ing
Test
er(s
)Q
ualit
y O
utco
me
dom
ains
child
ren
mea
n (S
D)
eval
uate
dsc
ore
(% m
ale)
or r
ange
Pang
-Chi
ng
et a
l., 1
99552
Haw
aii
Cro
ss-
sect
iona
l17
2(5
0)4
year
sPu
re t
one
swee
pte
st, t
ympa
nom
etry
,pn
eum
atic
otos
copy
, aco
ustic
refle
ctom
etry
Pure
ton
e sw
eep
test
,ty
mpa
nom
etry
,pn
eum
atic
oto
scop
y,ac
oust
ic r
efle
ctom
etry
Hea
ring
clin
ic:
acou
stic
ally
tre
ated
test
roo
m
NR
8Sc
reen
acc
urac
y,sc
reen
per
form
ance
Pres
cott
et
al.,
199
974
Sout
h A
fric
a
Cro
ss-
sect
iona
l20
5(N
R)3–
7 ye
ars
Whi
sper
ed v
oice
test
PTA
Scho
ol c
lass
room
Four
th y
ear
BSc
stud
ents
8Sc
reen
acc
urac
y,sc
reen
per
form
ance
Ritc
hie
and
Mer
kein
,19
7257
USA
Cro
ss-
sect
iona
l16
2(6
4)4–
5 ye
ars
VASC
, tw
opr
otoc
ols
PTA
Aud
itory
tes
tbo
oth
(loca
tion
not
stat
ed)
NR
9Te
st a
ccur
acy,
scr
een
perf
orm
ance
Rodr
igue
zan
dM
elgu
izo-
Yepe
z,19
9456
Col
umbi
a
Cro
ss-
sect
iona
l80 (N
R)5–
14 y
ears
PTA
, pur
e to
nesw
eep
test
,qu
estio
nnai
re
Tym
pano
met
ry p
lus
pneu
mat
ic o
tosc
opy
NR
NR
NA
NR
Rous
ch
et a
l., 1
99259
USA
Cro
ss-
sect
iona
l20
4(5
0)3–
4 ye
ars
Tym
pano
met
ryO
tosc
opy
NR
Paed
iatr
icot
olar
yngo
logi
st10
Scre
en a
ccur
acy,
scre
en p
erfo
rman
ce
Rous
ch a
ndTa
it, 1
98562
USA
Cro
ss-
sect
iona
l75 (N
R)3–
4 ye
ars
PTA
, fou
r pr
otoc
ols
PTA
Day
car
e ce
ntre
with
am
bien
t no
iseG
radu
ate
audi
olog
y st
uden
t7
Scre
en a
ccur
acy,
scre
en p
erfo
rman
ce
Sabo
et
al.,
2000
54
USA
Cro
ss-
sect
iona
l57
3(5
5)5–
9 ye
ars
Pure
ton
e sw
eep
test
, TEO
AE
PTA
Scho
ol: n
on-
soun
dpro
ofed
room
Scho
ol n
urse
,sp
eech
audi
olog
ist,
volu
ntee
rs
8Sc
reen
acc
urac
y,sc
reen
per
form
ance
cont
inue
d

Health Technology Assessment 2007; Vol. 11: No. 32
41
© Queen’s Printer and Controller of HMSO 2007. All rights reserved.
TAB
LE 2
9Su
mm
ary
of c
hara
cter
istic
s of
incl
uded
stu
dies
(co
nt’d
)
Sour
ceD
esig
nN
o. o
f A
ge,
Test
(s)
Ref
eren
ce s
tand
ard
Sett
ing
Test
er(s
)Q
ualit
y O
utco
me
dom
ains
child
ren
mea
n (S
D)
eval
uate
dsc
ore
(% m
ale)
or r
ange
Sche
ll,19
7064
USA
Cro
ssse
ctio
nal
134
(NR)
4–5
year
sVA
SCPT
AN
RN
RN
ASc
reen
acc
urac
y
Skur
r an
dJo
nes,
1981
75
Aus
tral
ia
Cro
ss-
sect
iona
l56
4(5
0)3–
15 y
ears
Wat
ch t
ick,
tw
oto
ne, h
and-
held
beep
er, w
hisp
ered
voic
e te
st, P
TA
PTA
plu
s ty
mpa
nom
etry
Scho
ol: q
uiet
est
area
ava
ilabl
eC
hild
hea
lthnu
rses
5N
R
Squa
re
et a
l., 1
98560
USA
Cro
ss-
sect
iona
l11
3(N
R)2
year
s6
mon
ths
to6
year
s
Bone
con
duct
ion,
PTA
Impe
danc
e au
diom
etry
Scho
olN
R8
Scre
en a
ccur
acy,
scre
en p
erfo
rman
ce
DPO
AE,
dist
ortio
n pr
oduc
t ot
oaco
ustic
em
issio
n; N
R, n
ot r
epor
ted;
VA
SC, v
erba
l aud
iom
etric
scr
eeni
ng fo
r ch
ildre
n.

Finally, question 13 addresses the issue of whetherany interpretable or intermediate test results werereported. The fact that most studies failed toreport these could mean either that there were nouninterpretable test results or that they simplywere not recorded, which in turn could be hidingany practical problems encountered in actuallyapplying the tests.
FindingsTest accuracyA wide variety of hearing tests (and protocols) wasevaluated. Although the reference test varied,most studies used pure tone audiometric testing.Presented below are the sensitivity and specificityvalues, grouped and tabulated according to thescreening test compared where possible to PTAwith a hearing impairment cut-off ranging from15 to 30 dB at various frequencies. Where studiesreported multiple comparisons, the sensitivity andspecificity values are reported for each comparisonseparately (Tables 30–37). The two-by-two tables forsensitivity and specificity, where available, arepresented in Appendix 10.
Parental questionnairesThree studies examined the accuracy of parentalquestionnaire against PTA (Table 30). Bothsensitivity (34–71%) and specificity (52–95%)range widely.
Impedance audiometry/tympanometryNine studies reported 11 different comparisons ofthe accuracy of impedance audiometry/tympanometry compared with PTA, otoscopy or a combined test reference standard (Table 31).Against otoscopy the sensitivity (50–90%) andspecificity (65–97%) of tympanometry wasmoderate to good. However, compared with
PTA, the test accuracy of tympanometry appearedto be more variable (sensitivity of 40–90% andspecificity of 57–85%) and dependent on thetympanometry fail criteria used. FitzZaland andZink55 reported a good level of tympanometryaccuracy (sensitivity 40–93% and specificity91–100%) against a reference of multiple tests. In part, these findings reflect the differing aims of the tests: tympanometry and otoscopyassess pathology (presence of middle ear effusion)and, unlike PTA, are not tests of hearingsensitivity.
Spoken word testsFive studies reported four comparisons of spokenword tests, VASC or SVEP (a test using speechsignals), compared with PTA. Sensitivity(51–100%) and specificity (93–96.8%) weremoderate to good.
OtoscopyTwo studies compared otoscopy with PTA. Bothsensitivity (23–89%) and specificity values(60–93%) were highly variable.
AudiometryFive studies reported comparisons of the pure tone sweep test with PTA. The sensitivity(86–100%) and specificity (65–100%) values weregenerally high. Indeed, the study by Orlando andFrank73 showed that these high values wereconsistent across 6-month age groupings between4 and 6 years.
TEOAESabo and colleagues54 reported the sensitivity(63%) and specificity (91%) of TEOAE comparedwith PTA in a smaller study with just 66 children,only 61 of whom completed. They reported
Systematic review of the effectiveness of school entry hearing screening
42
TABLE 30 Test accuracy of parental questionnaires
Source Test Definition of Reference Definition of Sensitivity Specificityevaluated hearing impairment standard hearing impairment
Gomes and Parental Score = 0 fail Examination, Not stated 71% 64%Lichtig, questionnaire Score > 0 pass tympanometry 200569 and pure tone
sweep test
Olusanya, Parental NR PTA and pure >20 dB at 0.5, 1, 2 34% 95%200151 questionnaire tone sweep and 4 kHz
test
Hammond Parental Positive response PTA, pure tone >30 dB at 1 kHz 56% 52%et al., 199763 questionnaire to �1 question sweep test >20 dB at 2 kHz
and ENT >25 dB at 4 kHzexamination

sensitivity in the range of 67–100% depending onthe fail criterion, but these figures were based onresults from just six ears.
Combined testsThe study by Lyons and colleagues53 evaluatedfour protocols of combined DPOAE andtympanometry compared with PTA. The accuracy
of the combined test was high: sensitivity 96–98%and specificity 83–96%.
Other tests and protocolsThree studies assessed tests and protocols notconsidered by any other studies. FitzZaland andZink55 looked at the audiometric Rhinne testrelative to audiological assessment and found high
Health Technology Assessment 2007; Vol. 11: No. 32
43
© Queen’s Printer and Controller of HMSO 2007. All rights reserved.
TABLE 31 Test accuracy of impedance audiometry
Source Test Definition of Reference Definition of Sensitivity Specificityevaluated hearing impairment standard hearing impairment
Pang-Ching Tympanometry Modified ASHA Pure tone Score �3 73% 85%et al., 199552 (1990) criteria sweep test,
tympanometry, pneumatic otoscopy, acoustic reflectometry
Olusanya, Tympanometry Second test PTA and pure >20 dB at 0.5, 1, 2 50% 83%200151 non-type A tone sweep and 4 kHz
tympanogram test
Lyons et al., Tympanometry Non-type A Pure tone >20 dB at 0.5, 1, 2 85% 91%200453 tympanogram sweep test and 4 kHz
McCurdy Tympanometry Type B or C PTA Clark (7) criteria 71% 65%et al., 197671 and stapedius tympanogram or
reflex Type A tympanogram and no stapedius reflex
Nienhuys, Tympanometry Normal +100 to PTA >25 dB at 0.5–4 kHz 40–90%a 62–83%a
et al., 199461 –99 daPa and 0.3–6 ml
Rousch et al., Tympanometry Traditional ASHA Otoscopy Medical attention 27% 99%199259 (1990) criteria required
Rousch Tympanometry Modified ASHA Otoscopy Medical attention 64% 97%et al., 199259 (1990) criteria required
FitzZaland Tympanometry 1= Type B or C with Combination of Various according 1 = 93% 1 = 91%and Zink, pressure history, pure to test 2 = 93% 2 = 95%198455 �150 mmH2O tone and air 3 = 91% 3 = 99%
2= Type B or C with and bone 4 = 40% 4 = 100%pressure conducted �175 mmH2O thresholds, 3= Type B or C with tympanometry, pressure acoustic reflex�200 mmH2O and speech 4 = Type B only tests
Holtby et al., Tympanometry Negative pressure Examination Not stated 83.7% 73.6%199776 and stapedius of �–200 mm that included
reflex OR inability to show PTA, compliance at tympanometry<0.3 ml compliance and ear volume examinationOR inability to show a stapedius reflex at 80 or 100 dB
ASHA, American Speech and Language Hearing Association.a Dependent on tympanometry fail criteria used.

sensitivity (91%) and specificity (99.67%). Thestudy by Square and colleagues60 compared boneconduction tests combined with PTA to impedancescreening and found poor sensitivity (26%) andspecificity (6.6%). Finally, Pang-Ching andcolleagues52 found that reflectometry had poorsensitivity (23%) and specificity (56%) comparedwith otoscopy results.
Influence of testing environmentOnly five of the included studies reported using asoundproofed environment in which to carry outthe test.52,57,61,66,73 All other studies eitherreported a non-soundproofed environment orfailed to report where the test was conducted.There appeared to be no consistent differences inthe sensitivities and specificities of those studies
Systematic review of the effectiveness of school entry hearing screening
44
TABLE 32 Test accuracy of spoken word tests
Source Test Definition of Reference Definition of Sensitivity Specificityevaluated hearing impairment standard hearing impairment
Ritchie and VASC Two consecutive PTA �15 dB at 550 Hz in 51% 96%Merklein, (protocol 1) incorrect responses one ear197257 or two out of three �15 dB any two
incorrect responses frequencies in at 15 dB one ear
�20 dB for any single frequency for either ear
Ritchie and VASC Two consecutive PTA �15 dB at 550 Hz in 59% 93%Merklein, (protocol 2) incorrect responses one ear197257 or two out of three �15 dB any two
incorrect responses frequencies in one earat 15 dB or incorrect �20 dB for any single response to bird frequency for either earwhistle
Hamill, 198858 VASC Failure to respond Pure tone >20 dB at 0.5, 1, 2 and 87% 96%at two out of three sweep test 4 kHzof the 19 dB presentations
Maragno SVEP test NR Audiological NR 100% 94%and Teatini, assessment 198366 including PTA
Prescott Voice test Correctly identifying PTA >35 dB HL 83.3% 96.8%et al., 199974 less than 50% of
the test words
SVEP, Sweep Visual Evoked Potential.
TABLE 33 Test accuracy of otoscopy
Source Test Definition of Reference Definition of Sensitivity Specificityevaluated hearing impairment standard hearing impairment
Olusanya, Otoscopy NR Pure tone >20 dB at 0.5, 1, 2, 56% 62.4%200151 sweep test 4 kHz
and PTA
Nienhuys Otoscopy Wax discharge or PTA Clark (7) criteria 23–89%a 60–93%a
et al., 199461 lack of tympanic 0.5–4 kHzmembrane activity
a Dependent on fail criteria used.

that reported using a controlled test environmentand those that did not.
Influence of study qualityThere was no clear difference in sensitivity andspecificity of studies judged to be of goodmethodological quality (i.e. QUADAS score �9) or
poor to moderate methodological quality (i.e.QUADAS score <9).
Summary ROC curveTo provide some overall summary of screen testaccuracy results, the subgroup of sensitivity andspecificity values where the reference test applied
Health Technology Assessment 2007; Vol. 11: No. 32
45
© Queen’s Printer and Controller of HMSO 2007. All rights reserved.
TABLE 34 Test accuracy of sweep audiometry
Source Test Definition of Reference Definition of Sensitivity Specificityevaluated hearing standard hearing
impairment impairment
Sabo et al., Pure tone >25 dB at PTA NR 87% 80%200054 sweep test 0.5 kHz and
>20 dB at 1, 2 and 4 kHz
Orlando and Pure tone >25 dB at 0.5, PTA >30 dB 4–4.5 years: 90% 4–4.5 years: 71%Frank, 198773 sweep test 1, 2 and 4 kHz 4.5–5 years: 82% 4.5–5 years: 65%
(audioscope) 5–5.5 years: 100% 5–5.5 years: 90%5.5–6 years; 88% 5.6–6 years: 84%
Orlando and Pure tone >25 dB at 0.5, PTA >30 dB 4–4.5 years: 91% 4–4.5 years: 98%Frank, 198773 sweep test 1, 2 and 4 kHz 4.5–5 years: 91% 4.5–5 years: 98%
(audiometer) 5–5.5 years: 100% 5–5.5 years: 98%5.5–6 years: 100% 5.5–6 years: 97%
FitzZaland Pure tone >25 dB at 0.5 Combination Various, 93% 99%and Zink, sweep test and 4 kHz of history, dependent 198455 and >20 dB pure tone on test
1 and 2 kHz and air and bone conducted thresholds, tympanometry, acoustic reflex and speech tests
Holtby et al., Pure tone No response Examination NR 86% 70.2%199770 sweep test at 20 dB in either including PTA,
ear at any tympanometry frequency and ear
examination
TABLE 35 Test accuracy of TEOAE
Source Test Definition of Reference Definition of Sensitivity Specificityevaluated hearing impairment standard hearing impairment
Sabo et al., TEAOE Response at three PTA NR 63% 91%200054 frequencies of �3
above the noise floor with a minimum 70% reproducibility at each frequency and a 90% or greater stability
Nozza et al., TEAOE Various PTA NR 67–100% 80–98%199772

was PTA was plotted in the ROC space (Figure 7).Different types of test are given different symbolshading. The diameter of the symbol reflects thesample size of the study, with larger studies havinga larger symbol. ‘Good’ tests with both highsensitivity and specificity (e.g. tympanometry andpure tone sweep test) tend to occupy the top leftof the plot. In contrast, poorer tests with lowersensitivity and specificity (i.e. parentalquestionnaires) tend to occupy the bottom right ofthe plot. It is important to recognise there are atleast two caveats in interpreting this figure. First,either or both of two different conditions (middleear pathology, hearing impairment) are beingsought by different studies. Secondly, both the
referral criteria for the screening test and thecriterion definition of hearing impairment for thereference test varied across studies.
Screen performanceThe uptake of the screening test was reported by13 studies (Table 38) and across a variety ofscreening tests. Regardless of the test applied theuptake rates appeared to be high, ranging from87.5 to 100%. These high values reflect the factthat the studies are experimental test accuracyassessments rather than ‘real world’ andcommunity-based screening evaluations. None ofthe studies looked at reported their yield of truecases.
Systematic review of the effectiveness of school entry hearing screening
46
TABLE 36 Test accuracy of combined tests
Source Test Definition of Reference Definition of Sensitivity Specificityevaluated hearing impairment standard hearing impairment
Lyons et al., Protocol 1 DPOAE SNR �5 dB Pure tone >20 dB at 0.5, 1, 2 97% 86%200453 DPOAE and at 1.9 kHz and sweep test and 4 kHz
tympanometry tympanometry results normal
Lyons et al., Protocol 2 DPOAE SNR �5 dB Pure tone >20 dB at 0.5, 1, 2 97% 83%200453 DPOAE and at 1.9 kHz and sweep test and 4 kHz
tympanometry tympanometry results normal
Lyons et al., Protocol 3 DPOAE SNR �11 dB Pure tone >20 dB at 0.5, 1, 2 98% 74%200453 DPOAE and at 1.9 kHz and sweep test and 4 kHz
tympanometry tympanometry results normal
Lyons et al., Protocol 4 DPOAE SNR �5 dB Pure tone >20 dB at 0.5, 1, 2 96% 95%200453 DPOAE and at 1.9 kHz and sweep test and 4 kHz
tympanometry SNR �11 dB at 3.8 kHz and tympanometry results normal
SNR, signal to noise ratio.
TABLE 37 Test accuracy of other tests
Source Test Definition of Reference Definition of Sensitivity Specificityevaluated hearing impairment standard hearing impairment
FitzZaland Audiometric Reporting having Audiological Various, dependent on 91% 99.67%and Zink, Rhinne test heard the tone more assessment test198455 loudly at the
mastoid location
Square et al., Bone No response at Impedance Negative peak pressure 26% 6.6%198560 conduction and + 10 dB and –10 dB screening at >–150 mm/H2O air
PTA OR no response (tympanometry pressure or having no at = 10 dB and reflex) pressure peak at all
Pang-Ching Acoustic Scores of 6–9 Tympanometry Score �3 23% 56%et al., 199552 reflectometry and pneumatic
otoscopy

Screen effectivenessIt was not possible to assess the potentialeffectiveness of interventions for childrenidentified by the SES since only the study byFeldman and colleagues46 reported outcomesrelated to screening test effectiveness. Thisretrospective cohort study compared two groups of730 children from different geographical areas inOntario, Canada. One group received hearingscreening (VASC by a public health nurse) beforeschool entry while the other group did not.Hearing impairment was assessed (PTA at0.5–4 kHz) in both groups at 6–12 months afterthe hearing screening. As the study found nostatistically significant difference in the prevalenceof hearing impairment in the groups after 6–12
Health Technology Assessment 2007; Vol. 11: No. 32
47
© Queen’s Printer and Controller of HMSO 2007. All rights reserved.
TABLE 38 Uptake for each study
Source Uptake (%)
Ritchie and Merklein, 197257 100FitzZaland and Zink, 198455 100Holtby et al., 199770 91Lyons et al., 200453 100Nienhuys et al., 199461 71Olusanya, 200151 88Pang-Ching et al., 199552 100Prescott et al., 199974 94Rodriguez and Melguizo-Yepez, 199456 87.5Rousch et al., 199259 100Rousch and Tait, 198562 100Sabo et al., 200054 99Square et al., 198560 100
Parental questionnaires
Impedance
Otoscopy
TEAOE
Sweep audiometry
Spoken word tests
Sens
itivi
ty
0.80.60.40.20 1.0
1 – Specificity
0.2
0.4
0.6
0.8
1.0
0
Olusanya51 PQ
Olusanya51 OTOSCOlusanya51 Ty
Sabo54 TEAOE
Sabo54 PTST
Prescott74 VT
FitzZaland55 PTSTFitzZaland55 TY
Maragno66 SVEP
Orlando73 PTSTmeter
Orlando73 PTSTscope
Ritchie57 VASC1
Ritchie57 VASC2Holtby70 PTST
Holtby70 Ty+ St Ref
Nienhuys61 Ty McCurdy71 Ty + St Ref
Hammond63 PQ
Nenhuys61 OTOSC
FIGURE 7 Summary ROC (should be interpreted with the results in Tables 30–37)

months (unscreened group 16.8% versus screenedgroup 14.1%) the authors concluded that preschool hearing screening was ineffective inthe sense of leading to interventions whichresolved the (presumably temporary) hearingimpairments.
However, there are some problems with the designof this study that limit the strength of itsconclusions. First, it is likely to have beenunderpowered to detect the small improvement inprevalence of hearing deficit seen in the screenedgroup. Secondly, the observational nature of thestudy made it open to a number of potentialbiases. Although the authors attempted to matchthe children by selecting two geographical areaswith similar socio-economic class, there remainsconsiderable potential for differences in thebaseline characteristics of the children, so-calledselection bias. The baseline characteristics of thechildren in the two groups were not reported. Theassessors conducting the hearing test at6–12 months may not have been blinded to thescreening status of child. In addition to a lack ofeffectiveness of the hearing screen, there are otherpotential explanations for the similar level ofprevalence of hearing impairment in the twogroups (e.g. non-compliance with treatment;ineffective treatment or wrong timescale).
Adverse effectsNone of the included studies reported any adverseeffects of screening.
Summary of findings● There is only level III evidence for the
effectiveness of preschool hearing screening,from a single, poor-quality, observationalcomparative study. Furthermore, this singlestudy was inconclusive in whether preschoolscreening was more effective than no screeningin detecting hearing impairment.
● No studies were identified that have assessedthe long-term impact of preschool hearingscreening on outcomes including educational,language and social outcomes, or on the
effectiveness of interventions for childrenidentified with hearing impairment via the SES.
● Several studies with an unacceptable variabilityin their quality have assessed the accuracy ofdifferent hearing screening tests in preschoolchildren. Given the unacceptable variability inmethodological quality and reporting of thesestudies, lack of clarity in the cases of hearingimpairment detected (e.g. transient versuspermanent hearing impairment), variation inreference test and threshold level for hearingdeficit, and range of control over the settings inwhich these tests were applied, it is difficult tointerpret and compare their results. Acceptingthese caveats and selecting the subset of studiesusing PTA as the reference test, the findingssuggest that: – Studies comparing various screen protocols of
pure tone sweep audiometry report highsensitivity and specificity for full PTA andtherefore appear to be suitable tests forscreening.
– Spoken word tests are reported to be a viableoption because of their potential acceptablelevels of specificity and sensitivity.
– Depending on referral criteria, TEOAEs havepotentially high specificity, but somewhatlower sensitivity.
– Tympanometry and acoustic reflectometryhave variable sensitivity and specificity.
– Parental questionnaire and otoscopy havepoor sensitivity and specificity. Therefore,these tests are likely to be less suitable forscreening.
– There is insufficient evidence to comment onthe accuracy of combinations of tests.
● A small number of studies indicated a generallyhigh uptake in this age group. However, giventhe experimental design of the studies, and thatthey were assessing test accuracy rather thanprogramme accuracy, these findings cannotnecessarily be generalised to the uptake of thescreen in real-world community screeningsettings.
● No studies were found that assessed thepotential adverse effects or yield of hearingscreening for preschool children.
Systematic review of the effectiveness of school entry hearing screening
48
MethodsAims and objectivesThe overall aim of this part of the study was toestimate the cost-effectiveness and costacceptability of alternative strategies for SES. Toachieve this aim the principal objectives were:
● to conduct a systematic review of the economicsliterature
● to estimate the health-related quality of life andutilities associated with the SES programme
● to estimate the relative costs of the SES● to relate the costs and health-related quality of
life and utilities and compare alternativemodels of SES.
Overall approachThe analysis assessed the cost-effectiveness andcost acceptability of alternative models of SES. Itwas designed to investigate the extent to which thedifferences in the cost-effectiveness strategies forhearing screening result in differences in costs,resource use, health status, and hearing-relateddisability and quality of life. The perspectives ofthe NHS and education services, patients andfamily were used to approximate a societalperspective.
To address the research questions a decision-analytic model was developed to synthesise clinicaland economic data from a number of sources. Themodel was used to estimate the relative cost-effectiveness of alternative SES programmes andno SES. As recommended by guidelines foreconomic evaluation,77–79 the alternatives forcomparison were chosen to reflect the range ofSES programmes reported in the survey of UKcurrent practice (Chapter 2). A composite SESprogramme (SES-C) was defined that included acombination of the categories or types of SES testsreported in the survey of current practice. Todefine the composite, the probability of each typeof test being used was estimated. Using the datafrom the survey of current practice, SES-C wasdefined as pure tone sweep audiometry (99%) andtympanometry (1%). This was used to weight theprobability and cost data relating to the costs and
accuracy of individual types of test. The keyalternatives compared to SES-C were:
● universal SES, using pure tone sweepaudiometry only (SES-PTS)
● universal SES, using parental questionnaire only(SES-PQ)
● universal SES, using tympanometry only (SES-T)
● universal SES, using spoken word tests only(SES-SW)
● no SES● targeted SES.
The decision model includes events relevant to theeffectiveness, subsequent diagnosis andtreatment/management, patient outcomes,resource use and costs of the screening packages.The outcomes assessed with the model were costper quality-adjusted life-year (QALY) gained, andcost per year gained with no, minimal or mildhearing impairment (YNHI). The cost per QALYgained was the primary outcome measure. QALYsweight life-years by the utility or value attached tohealth states and improvements in health and arerecommended in cases where the health outcomeof interest is change in morbidity rather thansimply survival.77–79 If the data on utility requiredto estimate QALYs are derived from inappropriateinstruments or low-quality evaluations, then theestimates of QALYs may be inaccurate, whichwould bias the results of the analysis. Analternative measure is years with no disability dueto hearing impairment. However, there wereinsufficient data to extrapolate from years withdifferent levels of hearing impairment to estimateyears with different levels of disability. Therefore,the cost per year with no to mild hearingimpairment (YNHI) was included as an alternativemeasure, to assess whether the results of theeconomic model would differ substantiallyaccording to the method used to evaluate andvalue hearing levels. The outcome of cost per yearwith no, minimal or mild hearing impairment is apotentially less sensitive measure of healthassociated with hearing impairment. It assumesthat minimal and mild hearing impairment haveno impact on the overall utility or value of a year
Health Technology Assessment 2007; Vol. 11: No. 32
49
© Queen’s Printer and Controller of HMSO 2007. All rights reserved.
Chapter 5
Cost-effectiveness and cost-effectiveness acceptability of the school entry hearing screen

with these levels of hearing impairment comparedwith years of life with no hearing impairment. Inaddition, any benefit accruing to years of life withmore severe hearing impairment are not includedin the estimate of outcome; in other words, thevalue of years of life with moderate to severehearing impairment is set to zero. If differentmethods of SES affect the distribution of childrenbetween different levels of hearing impairment,and each level of hearing is associated with adifferent utility or value, then use of the YNHI willresults in misestimation of the benefit ofalternative SES programmes. The cost per truepositive case of hearing impairment detected is analternative outcome measure that is less sensitivethan the cost per YNHI. It was decided to includethis in the sensitivity analysis only if theconclusions of the economic model did not differsubstantially between cost per QALY gained andcost per YNHI gained.
The time-horizon used for the primary analysiswas from the day of screening up to 1 year.Secondary analyses explored longer time-horizonsof 6 years (from the day of screening to secondaryschool age) and 11 years (from the day ofscreening to 16 years of age). As outlined inChapter 1, children in the UK enter school ataround 5 years of age and are usually screened intheir first (reception) year at school. Differencesbetween education authorities mean that theyenter school any time from their fourth birthdayup to their fifth birthday. So, the most appropriatepopulation for the analysis is children 4–6 years ofage; that is, 4 years and 1 day to 5 years and364 days (i.e. the time at which school entryscreening could take place in the UK). Theselected age range also reflects an assumption thatidentification and management of previouslyundetected hearing impairment relatively early ina child’s school life are beneficial.
Data for the model were derived from the surveyof current SES practice reported in Chapter 2, the systematic review of test accuracy andeffectiveness reported in Chapter 4, and twoadditional reviews of the economics literature and national databases and statistical sources forthe UK.
Reviews of economic literature anddatabasesA systematic review of economic evaluations ofscreening for hearing impairment in childrenaged 4–6 years (the age range of interest for thiseconomic evaluation) was conducted. Theobjectives of the review were:
● to assess the costs, effectiveness and cost-effectiveness of school entry screening
● to identify decision models reported in theliterature
● to identify economic data for the model used inthis study.
The review used a focused systematic search ofstudies and databases that report resource use,quality of life data, costs or patient outcomesassociated with screening for hearing impairment.
A second review of literature that reportedresource use, costs or outcomes of managementinterventions for hearing impairment was alsoconducted. The objective of this review was toidentify economic data that could be used topopulate the economic model.
The search strategies for both reviews wereimplemented in the following electronic databases:
● MEDLINE (1966 to 2005 week 3)● EMBASE (1980 to 2005 week 31)● Cumulative Index to Nursing & Allied Health
Literature (CINAHL) (1982 to August 2005week 5)
● Econlit (1969–2002 and 2003–2005)● Cochrane Library (Wiley) NHS Economic
Evaluation Database (NHS EED) (2005 Issue 2)● Office of Health Economics Database (OHE
HEED) (July 2005 issue).
The searches were limited to electronic databases.The detailed search strategy for the review ofeconomic evaluations of screening is reproducedin Appendix 11. Appendix 12 details the searchstrategy for the management of hearingimpairment review. The search strategies weredeveloped by the project team and an informationspecialist with extensive experience in literaturesearching. The search strategy was modified andoptimised for each electronic database. Theeconomic terms used on MEDLINE, CINAHL andEMBASE were adapted from the York Centre forReviews and Dissemination (CRD)78 filter. Theclinical terms for the screening search strategywere based on filters developed at the Universityof Birmingham for the review of effectiveness ofSES (Chapter 4). The NHS National ElectronicLibrary for Health (http://libraries.nelh.nhs.uk),the PRODIGY guideline website(www.prodigy.nhs.uk) and the ScottishIntercollegiate Guideline Network website(www.sign.ac.uk) were used to identify relevantinterventions and search terms for themanagement of hearing impairment review. Only
Cost-effectiveness and cost-effectiveness acceptability of the school entry hearing screen
50

interventions with a clinical benefit recommendedin these guidelines were included in the searchstrategy for management of hearing impairment.
The syntax of the search strategies was mappedaccordingly, to translate directly the thesaurus ofMEDLINE, EMBASE and CINAHL. The searchstrategy imposed no language, date or othersimilar limitations.
A screening form for inclusion/exclusion was usedto screen titles and abstracts and exclude anystudies that did not report resource use, utilityvalues or costs related to SES or management ofhearing impairment. Articles were only rejected oninitial screen if the reviewer could determine fromthe title and abstract that the article did not meetthe prespecified inclusion/exclusion criteria. If atitle/abstract could not have been rejected withcertainty, the full text of the article was obtainedfor further evaluation to assess whether they metthe inclusion/exclusion criteria. One reviewer (GV)then screened all of the retrieved papers.
The following inclusion and exclusion criteria wereapplied for the review of economic evaluations ofscreening studies (Appendix 13):
1. The studies were based on primary data orused data from systematic literature reviews,reported detailed data on costs and outcomesfor extraction and use in the economic model,were conducted in a range of settings (e.g.education services, primary/secondary/tertiaryhealthcare, other local community services, orthe family home) and were generalisable to theUK setting.
2. The paper reported data relevant to thepopulation of interest (children between 4 and6 years of age).
3. The evaluations compared at least two of thefollowing interventions: PTA, tympanometry,acoustic reflex, otoadmittance tests, ABR,medical examinations (which entail a hearingscreening), distraction tests, behavioural tests,speech perception tests, questionnaires,otoacoustic emissions and no screen.
4. The paper reported at least one of thefollowing outcomes: year with no ormild/moderate disability due to hearingimpairment, year with moderate or severedisability due to hearing impairment, QALYsgained, utility measure and health statusmeasure.
5. The paper reported at least one of thefollowing types of economic data: resource use,costs or utilities associated with hearing
screening programmes and subsequentmanagement interventions.
6. Resource use and cost were reported separately.
The full paper was included in the review of thecost-effectiveness of screening only if it metcriteria 1, 2 and 3 and at least one of 4, 5 and 6.To identify decision models and data for theeconomic model, studies were included if they metcriterion 1 and one or more of criteria 2–6.
For the review of management strategies forhearing impairment the following inclusion andexclusion criteria were applied (Appendix 14):
1. The studies were based on primary data orused data from systematic literature reviews,reported detailed data on costs and outcomesfor extraction and use in the economic model,were conducted in a range of settings (e.g.education services, primary/secondary/tertiaryhealthcare, other local community services, orthe family home, and were generalisable to theUK setting.
2. The paper reported data relevant to childrenwith identified hearing impairment aged frombirth to 12 years, undergoing any of thefollowing interventions: hearing aids,autoinflation, middle ear ventilation,myringotomy/grommets, adenoidectomy,speech and language therapy, hearing tactics(family, community, school), referral tospecialists or cochlear implantation (only forcomparative purposes).
3. Studies assessed one of the following outcomes:year with no or mild/moderate disability due tohearing impairment, year with moderate orsevere disability due to hearing impairment,QALYs gained, utility or health status.
4. Studies reported resource use, costs or utilitiesassociated with subsequent managementinterventions.
5. Studies reported resource use and costseparately.
To identify data on the costs or outcomes ofmanagement strategies for hearing impairment topopulate the economic model, studies wereincluded if they met criterion 1 and one or moreof criteria 2–5.
A second reviewer (LD) independently screenedany papers where the first reviewer (GV) wasunclear of inclusion. Any uncertainties in thereviewers’ assessment of the studies were resolvedby discussion and, when necessary, in consultationwith the rest of the project team. Reviewers were
Health Technology Assessment 2007; Vol. 11: No. 32
51
© Queen’s Printer and Controller of HMSO 2007. All rights reserved.

not masked to the source and authors of thestudies.
Data were extracted to populate the economicmodel using a data abstraction form. The formwas based on the criteria to assess abstracts for theNHS EED database (Appendix 15). Data wereextracted from included studies on: participants –study population; study design including type ofintervention and perspective; screening procedureincluding comparator interventions and setting ofthe screen; resource use including choice andcombination of screening tools; costs (direct andindirect where reported) and outcomes, includinginformation of synthesis of costs and benefits, dataon quality of life, dates to which data relate,discounting rates and side-effects; statistical/sensitivity analyses; and study findings.
All economics papers included in the analysis werequality assessed. The purpose of this assessmentwas to examine whether the methodology wasappropriate and the results were valid andgeneralisable to other settings (with focus on theNHS). Quality assessment was based on the criticalappraisal criteria cited in the CRD ReportNumber 6.78 Quality assessment questions wereincluded in the data extraction form (seeAppendix 15) and the papers were scannedaccordingly.
Economic modelThe decision-analytic model was developed andvalidated by discussion with experts in theprovision of hearing and school entry screening
services. TreeAge Pro 2005 software was used. Astatic decision tree model was used. The time-horizon of the model is finite and limited for boththe primary and secondary analyses. A staticdecision-tree model works well in analysing chanceevents with limited recurrence or change overtime (such as the probability that a person hashearing impairment or not). This is the case formost events associated with SES. The mainexception is the occurrence of transient hearingimpairment due to OME. OME can resolve andrecur more than once in a 12-month time-frame.However, the consequences of an initial episode ofOME detected by the SES (including subsequentrecurrences) are not likely to last for more than12 months. In addition, OME is not likely to resultin long-term hearing impairment and onlyminimal or mild hearing impairment within anepisode of OME. Therefore, it was decided toestimate the mean number of recurrences oftransient hearing impairment and use these tomodel the impact on costs and outcomes oftransient hearing impairment (and associatedrecurrences) at the end of the 1-year time-horizon(6- and 11-year time-frames for the secondaryanalyses).
The first split in a decision-tree model is a‘decision node’ (sometimes called choice node)and is represented by a square box. Decisionnodes reflect a choice to be made betweenalternatives. Later splits occur at ‘chance nodes’,which are represented by circles. Chance nodesoccur when there is a number of subsequentevents that could happen. Each event is assigned a
Cost-effectiveness and cost-effectiveness acceptability of the school entry hearing screen
52
School entry screen (SES)
No SES
SES-PTS
SES-T
SES-SW
SES-PQ
SES-C
TargetedSES
1
2
Child screened
Child not screened
Child identified at risk, eligiblefor SESChild not identified at risk, not screened
Fails 1st screening test
Passes 1st screening test
Has hearing impairment
No hearing impairment
Child screened
Child not screened
2nd test within screen
No 2nd test
Referred for diagnostic evaluation
Identified, diagnostic evaluation
Not identified
FIGURE 8 Decision tree, choice of screening method

probability that it will occur. The potentialoutcomes resulting from a chance node must beall-inclusive and mutually exclusive, so that theprobabilities for each chance node sum to one.Triangles represent terminal nodes, to signify thelast stage in the model.
A simplified structure of the decision tree is shownin Figures 8–12. These figures outline the pathsfollowed after SES-C and targeted SES. Thestructure of the model is based on the UK schoolentry hearing screening practice, where themajority of services carry out a two-stage test
procedure for each child screened who has apositive test result with the first test, beforereferral for diagnostic evaluation (Figures 8 and 9).Children who have hearing impairment and whoare not screened, or children who have beenscreened but not identified as having a hearingimpairment may be identified in other ways (e.g.parental or teacher concern) and referred for adiagnostic evaluation.
The model includes up to three consecutive testsfor children who fail the first and second tests(Figure 9). It is assumed that children who fail the
Health Technology Assessment 2007; Vol. 11: No. 32
53
© Queen’s Printer and Controller of HMSO 2007. All rights reserved.
2nd test within screen
Child tested
Child not tested
Fails 2nd screening test
Passes 2nd screening test
Has hearing impairment
No hearing impairment
Referred for diagnostic evaluation
3rd test within screen
No 3rd test
True –ves
False –ves
Identified, diagnostic evaluation
Not identified
Identified, diagnostic evaluation
Not identified
FIGURE 9 Decision subtree for third test within a screen
Referred for diagnostic evaluation
Diagnostic evaluationHas hearing impairment
No hearing impairment
Has hearing impairment
No hearing impairmentNo diagnostic evaluation
Transient hearing impairmentPermanent hearing impairment
Non-surgical intervention
Surgical intervention
FIGURE 10 Decision subtree for children referred for diagnostic evaluation
Permanent hearing impairment
Unilateral hearing impairment
Bilateral hearing impairment
Minimal (<20 dB)
Mild (21–40 dB)
Moderate (41–70 dB)
Severe (71–95 dB)
Profound (�95 dB)Non-surgical intervention
Surgical intervention
FIGURE 11 Decision subtree for permanent hearing impairment

third test within a screen will be referred fordiagnostic evaluation (Figure 10).
Children who have hearing impairment may havepermanent or transient hearing impairment(Figure 10). Whether permanent or transient, thehearing impairment may be unilateral or bilateral,at different levels of severity (Figure 11). Childrenwith minimal to mild hearing impairment may bemanaged by watchful waiting or monitoring ornon-surgical interventions. Children with moresevere hearing impairment may be managed bysurgical or non-surgical interventions (Figure 11).
Finally, Figure 12 illustrates the end-points forchildren with hearing impairment, whetheridentified or not.
Variable estimationThe decision model required three categories ofdata: the likelihood of events occurring; theresource use and costs of those events, and theoutcomes associated with those events. The overallapproach and sources of data used for variableestimation for each of these categories is describedbelow. Estimation of each variable used in themodel was to some extent determined by the dataavailable.
Likelihood of eventsThe probability of whether a child was screened orreferred for a diagnostic evaluation was estimatedfrom the survey of current practice reported inChapter 2. These included the probability that: achild is screened for the first time, a child whofails the first test is scheduled for a second testwithin the screen or referred for diagnosticevaluation, a child who fails the second test isscheduled for a third test within the screen orreferred for diagnostic evaluation, and a childscheduled for a second or third test is actuallytested. Table distributions were used to derive the
mean and distribution used in the Monte Carlosimulation for the probabilistic sensitivity analysis(PSA). Each estimate from the survey was givenequal weight in the table distributions.
The probability that a child failed or passed thefirst and subsequent screening tests and that thetest results were true or false positive and true orfalse negative was estimated from the studiesincluded in the systematic review of accuracyreported in Chapter 4. The probability that a childfailed or passed the first test in the screen wasestimated as the number of children failingdivided by the number of children tested. Theprobability that a child passed or failed subsequentscreening tests and/or diagnostic evaluation wasconditional on having failed previous screeningtests. If data were available from two or morestudies, table distributions were used to derive themean and distribution used for the PSA. Theestimate from each study included in thedistribution was weighted by the sample size of thestudy. This means that the estimates from largerstudies were assumed to be more accurate thanthose from smaller studies. If data were onlyavailable from one study, theoretical minimumand maximum values were used in a triangulardistribution, to reflect the high level of uncertaintyassociated with single estimates.
The estimates of the probability of all other eventsin the model were estimated from a number ofsources. These included the Waltham Forest studyreported in Chapter 3, published prevalencesurveys, published surveys of clinical practice,published treatment guidelines, reviews andintervention studies.12,17,81–83 In most cases it wasnot possible to combine estimates from differentstudies into table distributions for these otherevents, so triangular distributions of mean or mostlikely estimates with minimum and maximum wereused.
Cost-effectiveness and cost-effectiveness acceptability of the school entry hearing screen
54
Intervention
Year with no to mild hearing impairment
Year with moderate hearing impairment
Year with severe hearing impairment
Year with profound hearing impairment
FIGURE 12 Outcomes of hearing impairment
Resource use and costsThe costs of resources used as inputs to screeningand management interventions were estimated.The costs were calculated as the product ofresource use and unit costs for each screen andsubsequent events. For each cost item data onresource use and unit costs were extracted fromthe reviewed literature and databases, nationallyagreed prices, local practice, service standards andguidelines. The costs for the 6- and 11-yearanalyses were adjusted to net present values usingthe rate recommended by the UK Treasury at thetime of analysis (currently 3.5% for both costs andoutcomes; NICE, 200477). All costs werestandardised to a single price year, 2004, using ahealth service price index.83
The costs of screening and diagnosis were brokendown into fixed costs, which include the capitalcost of equipment, and variable costs, whichinclude maintenance costs, the costs of suppliesand consumables and the costs of staff time. Theannual equivalent cost of screening and diagnosticequipment was estimated by discounting theacquisition price of the equipment over anestimated life of 8 years, at 3.5% per annum (UKTreasury recommended rate; NICE, 200477). Thecost per case of equipment, maintenance,consumables and staff was estimated by dividingthe annual equivalent cost by the throughput ornumber of children screened or diagnosed withthe equipment. The number of children screenedor diagnosed was estimated from the survey ofcurrent practice reported in Chapter 2. The costsof equipment and supplies and the throughput ofchildren for diagnostic equipment were estimatedfrom local purchasing data in Manchester. Thesalaries of staff were estimated from national unitcosts of health and social service staff.83
The costs of surgical interventions following adiagnosis of hearing impairment were derivedfrom national statistics and published literature.84
The costs of non-surgical treatment (hearing aids)included salary costs of staff to fit the hearing aids,cost of follow-up monitoring and replacement,cost of consumables, and maintenance and repairof hearing aids. The resources used to fit andmonitor the use of hearing aids and follow-upmaintenance were estimated from publishedstudies, national statistics and expert opinion.83,84
Where more than one estimate for each cost itemwas obtained, the range of values found was usedto generate a distribution for the simulationanalysis. The distribution for each variableincluded the minimum, mean or median and
maximum values found. Where possible a meanvalue and measure of variance (e.g. standarddeviation or 95% CI) were derived and used toderive a distribution. If this information was notavailable, minimum and maximum estimates ofcost were used to estimate a triangular distributionfor the PSA.
Outcomes, utility values and QALYsFor the primary analysis, the final outcomes ofyears with no or mild disability due to hearingimpairment, QALYs gained and true casesidentified were estimated. The years with no ormild hearing impairment were estimated by givinga weight of one to final outcomes of no, minimalor mild hearing impairment and weights of zeroto moderate, severe or profound hearingimpairment.
The utility values to attach to no hearingimpairment, minimal or mild hearing impairmentwere estimated from the population norms forpeople under the age of 25 years.85 The utilityvalues to attach to moderate, severe and profoundhearing impairment were estimated from apublished economic evaluation of the benefit ofhearing aids.86
Data analysisCost-effectiveness analysis compares the costs andbenefits of two or more healthcare interventionswith the aim of providing information that can beused to maximise the level of benefits (healtheffects) relative to the resources available.Incremental cost-effectiveness ratios (ICERs) areused to relate differences in consequences andcosts between alternatives.87 ICERs were calculatedas: (Expected cost of A – Expected cost of B)/(Expected outcome A – Expected outcome B).Statistical measures of variance around the ICERswere not calculated, since standard methods ofanalysis do not allow these to be interpreted inany meaningful way. Specifically, for positiveICERS (i.e. cost per QALY >0), a lower ICER ispreferred to a higher one. For negative ICERsthere is no clear decision rule. A negative ICERmay occur when one intervention is both morecostly and less effective than another and is notcost-effective, or when an intervention is less costlyand more effective than another and is clearlycost-effective. No predefined target ceiling ratio(i.e. the maximum a decision-maker is willing topay for a unit of effect) for cost-effectiveness waschosen. This was because there is no evidence onwhat a single target ceiling ratio should be. Arange of ceiling ratios was used, from decision-makers being willing to pay £0 to gain 1 QALY to
Health Technology Assessment 2007; Vol. 11: No. 32
55
© Queen’s Printer and Controller of HMSO 2007. All rights reserved.

decision-makers being willing to pay £30,000 togain 1 QALY. The ICER was the primary outcomemeasure used to compare each alternative with thecomposite universal SES programme (SES-C).
PSA was used to generate mean expected costsand outcomes and statistical measures of expectedvariance around the likely estimate of eachvariable in the model and its distribution. Eachvariable was assigned a base-case or average valueand a distribution of possible values. Theprobabilistic analysis sums the results of multipleanalyses (iterations). Each iteration samples valuesfor the variables at random from the specifieddistributions. The sampling method used wasMonte Carlo, expected value. The simulationsoftware was TreeAge Pro 2005 plus Healthcaremodule.
Cost-effectiveness acceptability curves (CEACs)were plotted and used as a method ofsummarising the uncertainty around thegenerated cost-effectiveness ratios. CEACs plot theprobability that an intervention is cost-effectiveagainst the value of a ceiling ratio (i.e. themaximum a decision-maker is willing to pay for aunit of effect).
The CEAC estimates the probability that SES-C iscost-effective. This is done by first bootstrappingthe estimates of cost per QALY (ICER) from thePSA. The proportion of bootstrapped estimateswhere the cost per QALY is lower than the ceilingratio is calculated out of the total number ofbootstrapped estimates of the ICER. This isrepeated for each of the ceiling ratios (in this casethe ceiling ratios were £0 per QALY gained to£30,000 per QALY gained, in increments of£1000). The probability that SES-C is cost-effectiveis then estimated as the proportion ofbootstrapped estimates of the ICER that are lowerthan each ceiling ratio. These estimates areplotted graphically, against each of the ceilingratios, to derive a CEAC.
Net benefit statistics were estimated by revaluingthe bootstrapped estimates of QALYs, using the ceiling ratios or willingness to pay (WTP) togain one unit of outcome used for the CEACanalysis (i.e. £0 per QALY gained to £30,000 perQALY gained, in increments of £1000). For eachWTP threshold, the net benefit (NB) is estimatedas
NB = E * WTP – C
Cost-effectiveness and cost-effectiveness acceptability of the school entry hearing screen
56
Papers excluded on thebasis of abstract and title
113
Total numbers of papersfor data extraction
2
Potentially relevant publications identified
for retrieval169
Full papers obtained for more detailed evaluation
56
FIGURE 13 Flow diagram of included studies for the cost-effectiveness of screening

where E is the incremental QALY gained by anintervention, WTP is willingness to pay to gain1 QALY, and C is the incremental cost of theintervention.
The CEAC summarises the information at eachvalue of WTP to gain a QALY. The net benefitstatistic gives an estimate of the monetary value ofa QALY or other measure of effectiveness.
Sensitivity analysis was used to explore the impactof structural uncertainty by estimating costs,effects, ICERs and CEACs for each of thealternative outcomes estimated in the analysis, forthe impact of universal newborn hearing screen onthe numbers of children with unidentified hearingimpairment at school entry, and for temporaryversus permanent hearing impairment.
ResultsSystematic review of the cost-effectiveness of screening and ofmanagement strategiesThe search strategy for the cost-effectiveness ofscreening identified 169 articles. Of these, 113were excluded. The full texts of 56 articles wereobtained and reviewed. Data from two papers wereextracted for inclusion in the economic model(Figure 13). Neither paper reported a fulleconomic evaluation (Appendix 16).
One paper reported a cost study88 to compare thecosts associated with a TEOAE infant screeningprogramme, a TEOAE school entry programmeand a pure tone screening school-entryprogramme. There was no justification for theselection of the comparator programmes; however,pure tone screening is used in routine practice inthe UK and so makes the comparison relevant tothis review. The perspective was not clearly stated,making it difficult to judge whether all relevantcosts had been assessed. The data for thescreening programmes were obtained fromobservational studies in Brisbane. A total of 1305infants entered the infant screening programme.The age of this population was 2 months. Theschool screening programme sample for TEOAEwas 940 children, with a mean age of 6.2 years,recruited from 22 primary schools throughoutBrisbane. No selection criteria were reported. Thesame schoolchildren were tested with PTA.
The results indicated that the costs for TEOAEinfant screening were higher than either schoolscreening programme. Moreover, costs for the
school TEOAE programme were marginallygreater than for the school pure tone programme.The cost per hearing-impaired child withsensorineural or mixed impairment of at least amoderate degree was substantially greater than thecost per hearing-impaired child identified withany hearing-impairment, across all programmes.The ultimate yield of hearing-impaired cases wasnot affected by the age at screening. Thedifference between the costs of children withhearing impairment for all programmes is relatedto the low yield of cases diagnosed withsensorineural/mixed hearing impairment and thehigher yield of subjects with conductive, andpossibly transient pathologies. The costs for theinfant programme were substantially less thanmost reports in the literature of TEOAE-baseduniversal neonatal screening programmes. Withregard to the first school programme, the use ofTEOAE resulted in a marginally higher cost perchild and cost per child with hearing impairment.Higher total programme costs were incurred inthe first school programme as opposed to thesecond one owing, in part, to difference in thecost, maintenance and efficiency of the screeningequipment. No indirect costs were included, butthis omission is unlikely to affect the model’sresults. Costs and quantities were reportedseparately; however, no sensitivity analysis or anyother statistical analysis was performed to evaluatethe uncertainty around costs of quantities. Thestudy did not discount costs owing to the shorttime-frame of the analysis. The price year was notreported.
The second paper reported an effectiveness studyof hearing screening89 that included some costinformation. The aims were to evaluate impedancemeasurements against PTA as a screening methodfor the detection of middle ear changes associatedwith hearing impairment in infant school children.Justification of the choice of PTA as thecomparator programme was that it representsusual practice. The study used an NHSperspective. Indirect costs were not included in theanalysis. The cost data were collected on thesample of children observed in the study. Thestudy did not discount costs owing to the shorttime-frame of the analysis. No sensitivity analysisor any other statistical analysis was used toevaluate the uncertainty around costs of quantities.The price year of the resources was 1998. Thestudy did not formally relate costs to outcomes.
The electronic and bibliographic searches ofpapers reporting resource use, costs or outcomesof management interventions identified 960
Health Technology Assessment 2007; Vol. 11: No. 32
57
© Queen’s Printer and Controller of HMSO 2007. All rights reserved.

potentially relevant titles and abstracts(Appendix 11). Of these, 824 were excluded onthe basis of title and abstract and 136 full-textpapers/abstracts were collected for more detailedevaluation. Of these 136 papers, no studies couldbe used to populate the model. Thirty-four wereexcluded because they did not report detailed dataon costs and outcomes for extraction and use inthe economic model, 33 studies were notgeneralisable to the UK setting, 19 papersevaluated the wrong intervention, 16 looked at adifferent population cohort, 12 papers assessed adifferent outcome measure, seven analyses did notreport resource use and costs separately, fivestudies reported utilities not associated withmanagement interventions, three were not basedon primary data collection or systematic reviews,and seven were excluded for other reasons.
Data used as inputs to the economicmodelThe probability of using PTA or pure tone sweepaudiometry in SES programmes in the UK wasestimated as 0.99 (survey of current practice,Chapter 2) for the first and second tests within ascreen. The remaining services usedtympanometry. The probability of using PTA orpure tone sweep audiometry for a third test withina screen was reduced to 0.95 and the probability oftympanometry increased to 0.05 (survey of currentpractice, Chapter 2).
Table 39 gives the probabilities of events related toscreening for and diagnosis of hearingimpairment. These data were derived from thesurvey of current practice, the Waltham Forest
study and the systematic review of effectivenessreported in Chapters 2, 3 and 4, respectively.
Table 40 shows the probability of having hearingimpairment and the distribution of hearingimpairment between transient and permanent andby severity of hearing impairment. To estimate theprobability of hearing impairment it was assumedthat only children with bilateral hearingimpairment, lasting for more than 1 month, werelikely to have hearing impairment.90 Theprobability for transient hearing impairment orOME lasting for more than a month wascalculated from published literature.91 Theprevalence of permanent hearing impairment wasestimated from published studies.12,17,30
Table 41 presents the probability of interventionsfor hearing impairment by different levels andtypes of hearing impairment. Children withtransient hearing impairment will have eithersurgical or non-surgical intervention. Childrenwith minimal, mild or moderate permanentunilateral hearing impairment will have either nointervention (or watchful waiting) or hearing aids.Children with severe or profound permanenthearing impairment will have either hearing aidsor surgery (i.e. cochlear implant).
Table 42 shows the staff and equipment used forscreening and the unit costs estimated for theanalysis. The acquisition costs of equipment wereestimated as: screening audiometer = £950 plusVAT, screening tympanometer = £2147 plus VAT(£1995–2300) and otoscope = £80. The estimateof throughput (number of children screened) for
Cost-effectiveness and cost-effectiveness acceptability of the school entry hearing screen
58
TABLE 39 Probability of events related to screening and diagnosis
Item/event Mean Range
Child is screened 0.92 0.56–1.00Fails first screening test 0.08a 0.05–0.26a
Referred for diagnostic evaluation following first screen test 0.37b 0.27–0.47b
Child attends diagnostic evaluation 0.80c 0.60–1.00c
Hearing impairment (true positives) 0.53a 0.23–0.83a
No hearing impairment (true negatives) 0.99a 0.98–1.00a
Referred for second test within screen 0.42b 0.32–0.52b
Misses second test within screen 0.08b 0.00–0.44b
Fails second screening test 0.50a 0.22–0.78a
Referred for diagnostic evaluation following second screen test 0.50b 0.17–0.83b
Third test within screen 0.10b 0.00–0.20b
Referred for diagnostic evaluation following third screen test 0.85b 0.70–1.00b
a Systematic review of effectiveness, Chapter 4 of this report.54,55
b Survey of current practice, Chapter 2 of this report.c Waltham Forest study, Chapter 3 of this report.

the first, second and third screening tests is 628,680 and 686, respectively (survey of currentpractice, Chapter 2). The total cost per screen testis also reported in Table 42. The estimatedduration of the tests on which the salary costs werebased was estimated from the survey of currentpractice (Chapter 2). If the reported duration ofthe tests includes the time for wider health checks,then the costs of the test will be overestimated.
The survey of current practice indicated that up to60% of SES programmes are conducted as part ofa wider health check. However, there wasinsufficient information to estimate the marginalcosts of the school entry screening tests whenconducted as part of a wider health check.
Table 43 shows the resource use and unit costs ofstaff and equipment used for the diagnostic
Health Technology Assessment 2007; Vol. 11: No. 32
59
© Queen’s Printer and Controller of HMSO 2007. All rights reserved.
TABLE 41 Probability of interventions for hearing impairment
Mean Range
Item/eventTransient unilateral hearing impairmentHearing aids 0.001a 0–0.002Surgical intervention 0.064b 0–0.128
Transient bilateral hearing impairmentHearing aids 0.05c 0–0.1Surgical intervention 0.21b 0.01–0.41
Permanent unilateral hearing impairmentNo intervention or ongoing monitoring; minimal hearing impairment 0.99a 0.98–1.00No intervention or ongoing monitoring; mild or moderate hearing impairment 0.49a 0.39–0.59Hearing aids; severe or profound hearing impairment 0.05a 0.00–0.50
Permanent bilateral hearing impairmentNo intervention or ongoing monitoring; minimal hearing impairment 0.96a 0.92–1.00No intervention or ongoing monitoring; mild hearing impairment 0.70a 0.40–1.00Hearing aids; moderate hearing impairment 0.70a 0.3–1.00Hearing aids; severe hearing impairment 0.90a 0.50–1.00Hearing aids; profound hearing impairment 0.50a 0.20–0.99
a Expert opinion.b Mills et al. (2000).81
c Ahmed et al. (2001).80
TABLE 40 Probability and distribution of hearing impairment in the general population of children
Item/event Mean Range
Prevalence of hearing impairment 0.078a–c 0–0.16a–c
Transient hearing impairment 0.96c 0.88–1.00c
Unilateral transient hearing impairment, given transient hearing impairment 0.56c 0.2–0.72c
Permanent hearing impairment 0.04a,b 0–0.12a,b
Permanent unilateral hearing impairment, given permanent hearing impairment 0.6a 0.3–0.9a
Minimal unilateral hearing impairment (<20 dB) 0.58a 0.28–0.88a
Mild or moderate unilateral hearing impairment (21–70 dB) 0.20a 0.15–0.25a
Severe or profound unilateral hearing impairment (>71 dB) 0.22a 0.18–0.27a
Permanent bilateral hearing impairment, given permanent hearing impairment 0.04a,b 0.10–0.70a,b
Minimal permanent bilateral hearing impairment (<20 dB) 0.20a,d 0–0.60a,d
Mild permanent bilateral hearing impairment (21–40 dB) 0.36a 0.31–0.41a
Moderate permanent bilateral hearing impairment (41–70 dB) 0.23a,b 0.18–0.28a,b
Severe permanent bilateral hearing impairment (71–95 dB) 0.10a,b 0.05–0.15a,b
Profound permanent bilateral hearing impairment (�95 dB) 0.11a,b 0.06–0.16a,b
a Watkin et al. (2007).30
b Fortnum et al. (2001).12
c Midgley et al. (2000).17
d Niskar et al. (1998).82

evaluation for hearing impairment. Theacquisition costs of equipment were estimated as:screening audiometer = £4600 plus VAT,screening tympanometer = £7750 plus VAT, andotoscope = £80.
Table 44 gives the estimated costs of surgicalinterventions and hearing aids. The life of hearing
aids was estimated as 3 years.84 The long-termcosts of hearing impairment were estimated as thecost of social care and the costs of education. Theadditional costs of special education and socialcare were estimated from national statistics.93,94
The additional costs for children with minimal ormild hearing impairment were estimated to bezero for both social care and education. The
Cost-effectiveness and cost-effectiveness acceptability of the school entry hearing screen
60
TABLE 42 Resource use and unit costs of staff and equipment for screening
Item/event Resource use, mean (range) Unit cost, mean (range) (£, 2004/05)
Duration of screening test 12 minutes (8–26)a
School nurse 0.46 (probability)a 7 per test (4–14)b,c
School nurse assistant 0.13 (probability)a 3 per test (2–7)b,c
Nursery nurse 0.12 (probability)a 7 per test (4–14)b,c
Healthcare assistant 0.11 (probability)a 3 per test (2–7)b,c
Audiometrician 0.11 (probability)a 7 per test (4–14)b,c
Audiologist 0.07 (probability)a 9 per test (5–18)b,c
Screening audiometer 0.99 0.97 per testd
Calibration of audiometer 0.99 0.14 per testd
Screening tympanometer 0.01 0.8 per testd
Calibration of tympanometer 0.01 0.26 per testd
Paper roll (tympanometer) 0.01 0.04 per testd
Disposable ear tips (tympanometer) 0.01 0.14 per testd
Otoscope 1.00 0.97 per testd
Tips for ear examination 1.00 0.14 per testd
Total cost of screening 1.00 8.00 per test
a The duration of the test and the probability that a particular staff category was used to conduct the school entry screentest were estimated from the survey of current practice, Chapter 2 of this report.
b Curtis and Netten (2005).83
c NHS (2005).92
d Local accounts and expert opinion.
TABLE 43 Resource use and unit costs of staff and equipment used for diagnostic evaluation
Item/event Resource use, mean (range) Unit cost, mean (range) (£, 2004/05)
Duration of diagnostic evaluation 3.5 hours (3–4)Specialist practitioner (audiologist or 0.80 (0.60–1) (probability)a 144 per session (123–164)b,c
clinical scientist)a–c
Audiology staff, AfC band 7 0.20 (0–0.40) (probability)a 164 per session (141–188)b,c
Diagnostic audiometer 0.80 (0.60–1) (probability) 7 per testd,e
Calibration of audiometer 0.80 (0.60–1) (probability) 0.13 per testd,e
Diagnostic tympanometer 0.20 (0–0.40) (probability) 15 per testd,e
Calibration of tympanometer 0.20 (0–0.40) (probability) 0.14 per testd,e
Paper roll (tympanometer) 0.20 (0–0.40) (probability) 0.8 per testd,e
Disposable ear tips (tympanometer) 0.20 (0–0.40) (probability) 0.26 per testd,e
Otoscope 1.00 (probability) 0.04 per testd,e
Tips for ear examination 1.00 (probability) 0.14 per testd,e
Total cost of diagnostic evaluation 1.00 (probability) 154.00 per evaluation
AfC, Agenda for Change. a Probability that a particular staff category was used to conduct the school entry screen test, estimated from the survey of
current practice, Chapter 2 of this report.b Curtis and Netten (2005).83
c NHS (2005).92
d Local accounts and expert opinion.e Survey of current practice, Chapter 2 of this report.

additional costs for children with moderatehearing impairment were estimated to be £0(range £0–7280) for social care and £6747 (range£0–8460) for education. The additional costs forchildren with severe hearing impairment wereestimated to be £7280 (range £0–7280) for socialcare and £6747 (range £0–8460) for education.The additional costs for children with profoundhearing impairment were estimated to be £7280(range £7280–31,500) for social care and £18460(range £6747–18,460) for education.
Table 45 shows the estimated utilities for differentlevels of hearing impairment. The utility for nohearing impairment was estimated as 0.99, whichis the population norm for the general populationunder 25 years of age.85 The utility values forminimal and mild hearing impairment wereestimated from expert opinion. The utility valuesfor moderate to profound hearing impairmentwere estimated from one study.86 This study usedthe Health Utilities Index, a generic validated
measure, and associated utility weights to evaluatehealth status.
Results of the economic modelOne-year time-horizon, alternative measures ofeffectTables 46–48 and Figure 14 show the results of theprimary analysis for the 1-year time-horizon.Table 46 indicates that universal SES using current practice (SES-C) costs a total of £10 perchild, which is more than no SES (less than £1 per child) and is associated with higher QALYs(0.983) than no SES (0.979). The ICER for SES-C is calculated as the net cost of SES-C (£10minus £0.22) divided by the net QALYs of SES-C(0.983 minus 0.979), which is £2445 per QALYgained. This is within the threshold WTP to gain1 QALY suggested by NICE guidelines (£30,000per QALY gained).96 The cost-effectivenessacceptability analysis suggests that SES-C wasmore cost-effective than no SES in more than 50% of simulations, if decision-makers are willing
Health Technology Assessment 2007; Vol. 11: No. 32
61
© Queen’s Printer and Controller of HMSO 2007. All rights reserved.
TABLE 44 Resource use and unit costs of surgical interventions and hearing aids
Item/event Resource use, mean (range) Unit cost, mean (range) (£, 2004/05)
Hearing aidsHearing aids 1 set 70 per ear (60–80)a
Fitting hearing aids (audiologist) 4.5 hoursa 185 per fitting (164–205)b,c
Follow-up 0.75 (0.5–1) hours per visit, 31 per visit (21–41)b,c
two visits per yeara
Repair of hearing aids 1–2 per year 15 per repair (10–20)b,c
SurgeryDrainage of middle ear – 612.71d per operationMyringotomy – 612.709d per operationAutoinflation – 612.709d per operationAdenoidectomy – 691.31d per operationCochlear implant – 30,102.56d per operation
a Local accounts and expert opinion.b Curtis and Netten (2005).83
c NHS (2005).92
d Department of Health and NHS IA (2003).95
TABLE 45 Utilities by level of hearing impairment
Level of hearing impairment Mean Range
Minimal and mild hearing impairment 0.85a 0.75–1.00a
Moderate hearing impairment 0.677b 0.652–0.702b
Severe hearing impairment 0.616b 0.469–0.634b
Profound hearing impairment (96–105 dB) 0.497b 0.469–0.525b
Profound hearing impairment (>105 dB) 0.353b 0.327–0.379b
a Expert opinion and Dolan et al. (1995).85
b Barton et al. (2004).86

to pay £2250 or more to gain 1 QALY (Table 47and Figure 14). Given the data used, this indicatesthat there is a high probability that SES-C is likelyto be more cost-effective than no SES.
The data in Table 48 show the results of the netbenefit analysis. The net benefit statistics wereestimated by revaluing the bootstrapped estimatesof QALYs, using different ceiling ratios or WTP togain one QALY. For each WTP threshold, the netbenefit is estimated as the incremental QALYgained by SES-C multiplied by the WTP value,minus the incremental cost of SES-C. If decision-makers are prepared to pay less than £2250 togain 1 QALY, then there is no net benefitassociated with SES-C and no SES would be morecost-effective. If decision-makers are prepared topay more than £2250 to gain 1 QALY, then SES-C is associated with an estimated net benefitof up to £112 per child (at a WTP threshold of
Cost-effectiveness and cost-effectiveness acceptability of the school entry hearing screen
62
TABLE 46 Expected cost and QALYs of screening, 1 year
Expected cost (£) Expected QALY
SES-C No SES SES-C No SES
Mean 10 0.22 0.983 0.979SD 6 0.19 0.005 0.0072.5% percentile 6 0.01 0.973 0.96497.5% percentile 27 0.74 0.992 0.991
TABLE 47 Probability that SES-C is cost-effective, 1 year,QALYs
WTP to gain 1 QALY (£) Probability SES-C is cost-effective
1 0.002250 0.055250 0.70
30,000 0.90
1.0
0.9
0.8
0.7
0.6
0.5
0.4
0.3
0.2
0.1
0
Prop
ortio
n co
st-e
ffect
ive
8 16 240
WTP (£,000)
Universal SES
FIGURE 14 CEAC of SES-C, 1 year, QALYs
TABLE 48 Net benefit of SES-C, 1 year, QALYs
WTP (£) Net benefit of SES-C compared with no SES (£)
Mean SD 2.5% percentile 97.5% percentile
1 –10 6 –27 –52250 0 12 –32 195250 12 22 –40 53
30,000 112 110 –118 341

£30,000 per QALY). However, the range ofestimates does cross zero (i.e. the estimate for the2.5% percentile is negative). This indicates thatthere may be a high level of uncertainty in thedata.
Tables 49 and 50 and Figure 15 show the results of the analysis for the 1-year time-horizon, usingyear with no to mild hearing impairment as themeasure of effect (YNHI). These data indicate thatuniversal SES using current practice costs more,and is associated with lower YNHIs than no SES.This suggests that no SES is more cost-effectivethan SES-C if years gained with no to mildhearing impairment is considered the most
relevant measure of effectiveness. The cost-effectiveness acceptability analysis and net benefit analysis suggest that SES-C is not likely to be cost-effective compared with no SES.However, this analysis gives equal weight tochildren with no hearing impairment, minimalhearing impairment and mild hearingimpairment. If minimal and mild hearingimpairment adversely affect health status andhealth-related utility, then using YNHI as ameasure of effect will underestimate the benefit ofSES-C. The cost per YNHI was included as analternative measure to assess whether the results ofthe economic model would differ substantiallyaccording to the method used to evaluate andvalue hearing levels.
The cost per true-positive case of hearingimpairment detected is an alternative outcomemeasure that is less sensitive than the cost perYNHI. Use of this measure would give similarresults to using the YNHI as an indicator of theimpact of SES-C. That is, SES-C would not becost-effective compared with no SES if the cost pertrue positive case were used as the outcomemeasure of interest.
Health Technology Assessment 2007; Vol. 11: No. 32
63
© Queen’s Printer and Controller of HMSO 2007. All rights reserved.
TABLE 50 Net benefit of SES-C, 1 year, YNHI
WTP (£) Net benefit of SES-C compared with no SES (£)
Mean SD 2.5% percentile 97.5% percentile
1 –10 5 –26 –530,000 –28 26 –113 –10
TABLE 49 Expected cost and YNHI of screening, 1 year
Expected cost (£) Expected YNHI
SES-C No SES SES-C No SES
Mean 10 0.22 0.999 1.000SD 6 0.19 0.001 0.0002.5% percentile 6 0.01 0.997 1.00097.5% percentile 27 0.74 1.000 1.000
1.0
0.9
0.8
0.7
0.6
0.5
0.4
0.3
0.2
0.1
0
Prop
ortio
n co
st-e
ffect
ive
8 16 240
WTP (£,000)
Universal SES
FIGURE 15 CEAC of SES-C, one year, YNHI

Six- and 11-year time-horizons, QALYsTables 51 and 52 and Figure 16 show the results ofthe primary analysis for the 6-year time-horizon.The cost-effectiveness acceptability analysissuggests that SES-C was more cost-effective thanno SES in more than 99% of simulations, ifdecision-makers are willing to pay £2000 or moreto gain 1 QALY. Given the data used, thisindicates that there is a high probability that SES-C is likely to be more cost-effective than no SES.
Tables 53 and 54 and Figure 17 show the results ofthe primary analysis for the 11-year time-horizon.The cost-effectiveness acceptability analysis
suggests that SES-C was more cost-effective thanno SES in more than 99% of simulations, ifdecision-makers are willing to pay £2000 or moreto gain 1 QALY. Given the data used, thisindicates that there is a high probability that SES-C is likely to be more cost-effective thanno SES.
Comparison of SES using less accurate screentests, 1-year time-horizon, QALYsTables 55 and 56 and Figure 18 show the resultswhen less accurate screening tests (SES-T, SES-PQand SES-SW) are compared with no SES for a1 year time-horizon. The CEACs for SES-PQ andSES-SW suggest that they are less cost-effectivethan no screening. The CEAC for SES-T suggeststhat it is more cost-effective than no SES in50–70% per cent of simulations, if decision-makersare willing to pay £5000 or more to gain 1 QALY.
Table 57 shows the net benefit of SES-C comparedwith less accurate screening tests (the cost andQALY information is given in Tables 46 and 57).Figure 19 shows the CEAC when less accuratescreening tests (SES-T, SES-PQ and SES-SW) arecompared with SES-C for a 1-year time-horizon.
Cost-effectiveness and cost-effectiveness acceptability of the school entry hearing screen
64
TABLE 51 Expected cost and QALYs of screening, 6 years
Expected cost (£) Expected QALY
SES-C No SES SES-C No SES
Mean 25 2 5.37 5.27SD 10 2 0.04 0.072.5% percentile 11 0.36 5.28 5.1397.5% percentile 49 6 5.44 5.39
TABLE 52 Net benefit of SES-C, 6 years, QALYs
WTP (£) Net benefit of SES-C compared with no SES (£)
Mean SD 2.5% percentile 97.5% percentile
1 –23 25 –46 –930,000 2853 1376 721 6034
1.0
0.9
0.8
0.7
0.6
0.5
0.4
0.3
0.2
0.1
0
Prop
ortio
n co
st-e
ffect
ive
8 16 240
WTP (£,000)
Universal SES
FIGURE 16 CEAC of SES-C, 6 years, QALYs

The CEACs for SES-T, SES-PQ and SES-SWsuggest that they are less cost-effective than SES-C.
Comparison of SES-C with no SES using moreaccurate screen tests, 1-year time-horizon, QALYsSES using pure tone sweep only (SES-PTS) wasmore accurate than SES-C. The expected costs ofSES-PTS were similar to those of SES-C (£10.39SES-PTS and £9.90 SES-C) and the expectedQALYs were the same at 0.983. Table 58 shows thenet benefit of SES-PTS compared with SES-C. TheCEAC in Figure 20 suggests that SES-C is cost-effective in 60% of simulations compared withSES-PTS.
Comparison of SES-C with low-accuracy targetedSES, 1-year time-horizon, QALYsTables 59 and 60 and Figure 21 show the resultswhen targeted SES is compared with SES-C for a 1-year time-horizon. The targeted SES assumesthat only children identified as being at risk ofhearing impairment are screened (10%). For thisanalysis, the probability that children areaccurately identified was set equal to theprobability that parental questionnaires are anaccurate screen, which was relatively low. The cost-effectiveness acceptability analysis suggests that inthis case SES-C was more cost-effective thantargeted SES in around 75–90% of simulations, ifdecision-makers are willing to pay £5000 or moreto gain 1 QALY. Given the data used, this indicatesthat there is a high probability that SES-C is likelyto be more cost-effective than targeted SES, if theaccuracy of identifying children at risk is low.
Comparison of SES-C with high-accuracytargeted SES, 1-year time-horizon, QALYsTable 61 and Figure 22 show the results when SES-C is compared with targeted SES for a 1-year time-horizon. The targeted SES assumes that onlychildren identified as being at risk of hearing
Health Technology Assessment 2007; Vol. 11: No. 32
65
© Queen’s Printer and Controller of HMSO 2007. All rights reserved.
1.0
0.9
0.8
0.7
0.6
0.5
0.4
0.3
0.2
0.1
0
Prop
ortio
n co
st-e
ffect
ive
8 16 240
WTP (£,000)
Universal SES
FIGURE 17 CEAC of SES-C, 11 years, QALYs
TABLE 53 Expected cost and QALYs of screening, 11 years
Expected cost (£) Expected QALY
SES-C No SES SES-C No SES
Mean 30 3 9.07 8.91SD 13 2 0.07 0.112.5% percentile 12 0.45 8.93 8.6897.5% percentile 64 9 9.19 9.10
TABLE 54 Net benefit of SES-C, 11 years, QALYs
WTP (£) Net benefit of SES-C compared with no SES (£)
Mean SD 2.5% percentile 97.5% percentile
1 –27 13 –59 –1030,000 4867 2327 1270 10,242

Cost-effectiveness and cost-effectiveness acceptability of the school entry hearing screen
66
TABLE 55 Expected cost and QALYs of less effective screening, 1 year
Expected cost (£) Expected QALY
SES-T SES-PQ SES-SW SES-T SES-PQ SES-SW
Mean 10 23 30 0.975 0.977 0.964SD 2 12 24 0.019 0.006 0.0222.5% percentile 6 8 9 0.912 0.964 0.90797.5% percentile 15 44 84 0.991 0.989 0.989
TABLE 56 Net benefit of less effective screening versus no screening, 1 year, QALYs
WTP (£) Net benefit of screening compared with no SES (£)
Mean SD 2.5% percentile 97.5% percentile
SES-T1 –10 2 –15 –6
30,000 –121 568 –1989 286
SES-PQ1 –23 12 –44 –8
30,000 –81 145 –355 207
SES-SW1 –30 24 –83 –9
30,000 –464 645 –2033 236
0.1
0
0.2
0.3
0.4
0.5
0.6
0.7
0.8
0.9
1.0
0 10 20 30
WTP (£,000)
Prop
ortio
n co
st-e
ffect
ive
SES-T
SES-SW
SES-PQ
FIGURE 18 CEAC of less accurate SES programmes versus no SES, 1 year, QALYs
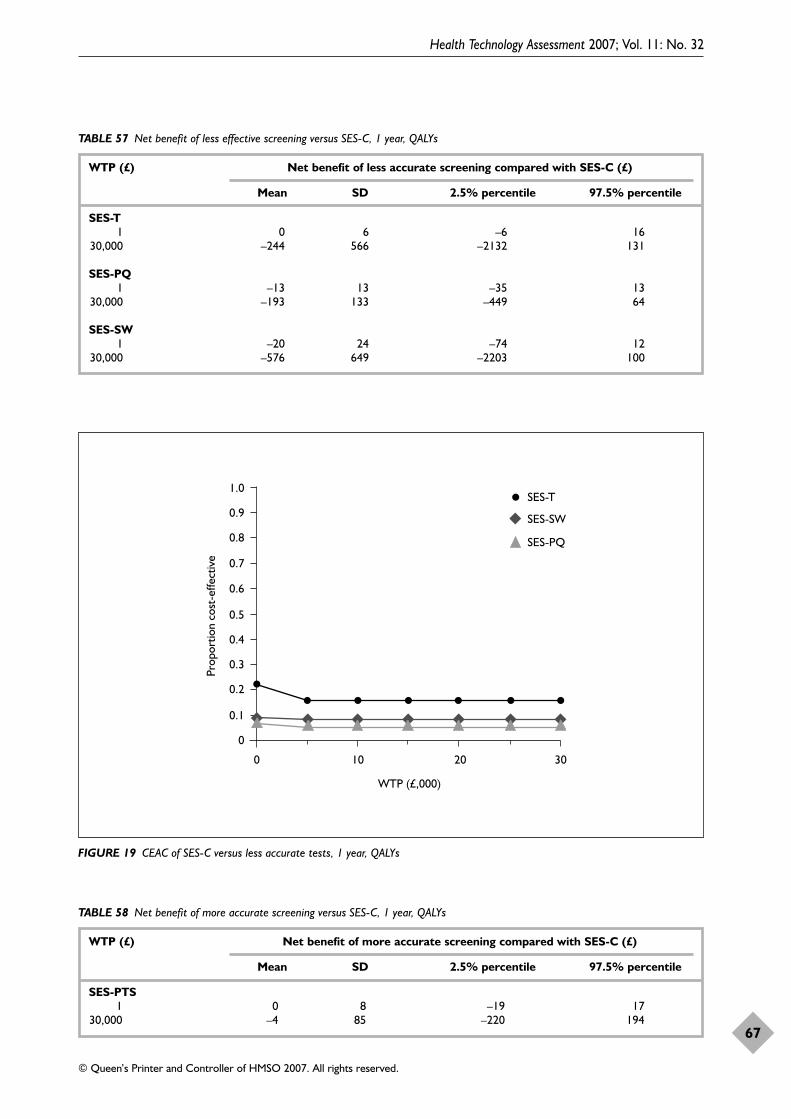
Health Technology Assessment 2007; Vol. 11: No. 32
67
© Queen’s Printer and Controller of HMSO 2007. All rights reserved.
TABLE 57 Net benefit of less effective screening versus SES-C, 1 year, QALYs
WTP (£) Net benefit of less accurate screening compared with SES-C (£)
Mean SD 2.5% percentile 97.5% percentile
SES-T1 0 6 –6 16
30,000 –244 566 –2132 131
SES-PQ1 –13 13 –35 13
30,000 –193 133 –449 64
SES-SW1 –20 24 –74 12
30,000 –576 649 –2203 100
0.1
0
0.2
0.3
0.4
0.5
0.6
0.7
0.8
0.9
1.0
0 10 20 30
WTP (£,000)
Prop
ortio
n co
st-e
ffect
ive
SES-T
SES-SW
SES-PQ
FIGURE 19 CEAC of SES-C versus less accurate tests, 1 year, QALYs
TABLE 58 Net benefit of more accurate screening versus SES-C, 1 year, QALYs
WTP (£) Net benefit of more accurate screening compared with SES-C (£)
Mean SD 2.5% percentile 97.5% percentile
SES-PTS1 0 8 –19 17
30,000 –4 85 –220 194
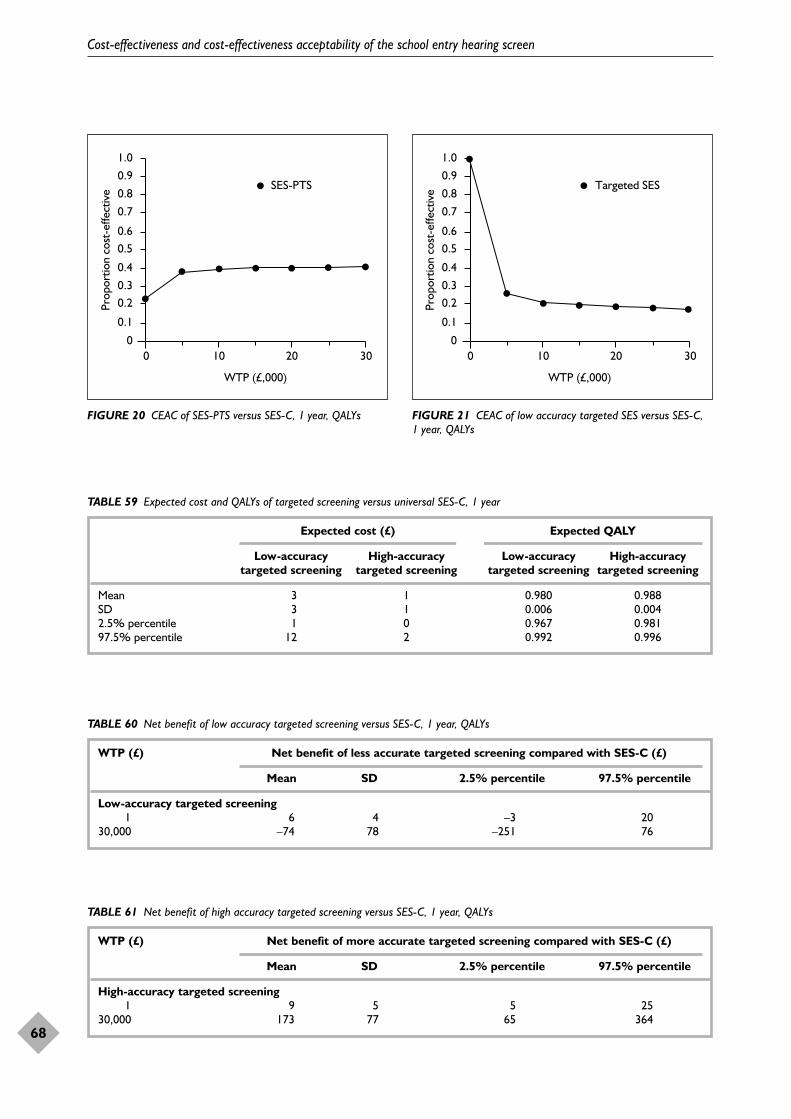
Cost-effectiveness and cost-effectiveness acceptability of the school entry hearing screen
68
1.0
0.9
0.8
0.7
0.60.5
0.4
0.30.2
0.1
0
Prop
ortio
n co
st-e
ffect
ive
10 20 300
WTP (£,000)
SES-PTS
FIGURE 20 CEAC of SES-PTS versus SES-C, 1 year, QALYs
1.0
0.9
0.8
0.7
0.60.5
0.4
0.30.2
0.1
0
Prop
ortio
n co
st-e
ffect
ive
10 20 300
WTP (£,000)
Targeted SES
FIGURE 21 CEAC of low accuracy targeted SES versus SES-C,1 year, QALYs
TABLE 59 Expected cost and QALYs of targeted screening versus universal SES-C, 1 year
Expected cost (£) Expected QALY
Low-accuracy High-accuracy Low-accuracy High-accuracy targeted screening targeted screening targeted screening targeted screening
Mean 3 1 0.980 0.988SD 3 1 0.006 0.0042.5% percentile 1 0 0.967 0.98197.5% percentile 12 2 0.992 0.996
TABLE 60 Net benefit of low accuracy targeted screening versus SES-C, 1 year, QALYs
WTP (£) Net benefit of less accurate targeted screening compared with SES-C (£)
Mean SD 2.5% percentile 97.5% percentile
Low-accuracy targeted screening1 6 4 –3 20
30,000 –74 78 –251 76
TABLE 61 Net benefit of high accuracy targeted screening versus SES-C, 1 year, QALYs
WTP (£) Net benefit of more accurate targeted screening compared with SES-C (£)
Mean SD 2.5% percentile 97.5% percentile
High-accuracy targeted screening1 9 5 5 25
30,000 173 77 65 364

impairment are screened (10%). For this analysis,the probability that children are accuratelyidentified was set equal to 90%. The cost-effectiveness acceptability analysis suggests that inthis case targeted SES was more cost-effective thanSES-C in around 80–90% of simulations, ifdecision-makers are willing to pay £1 or more togain 1 QALY. Given the data used, this indicatesthat there is a high probability that SES-C is likelyto be less cost-effective than targeted SES, if theprocess to identify at-risk children currently is atapproximately 90%.
Comparison of SES-C with no SES, lowprevalence of hearing impairment in targetpopulation, 1-year time-horizon, QALYsTables 62 and 63 and Figure 23 show the resultswhen the prevalence of unidentified permanenthearing impairment is assumed to be lower, aswould be the case if a proportion of cases ofhearing impairment were identified via the NHSP.SES-C is compared with no SES for a 1-year time-horizon. In this analysis, the prevalence ofunidentified permanent hearing impairment isreduced from 3.5 in 1000 to 0.34 in 1000. Thiswas chosen to reflect the potential impact of theintroduction of the NHSP (Waltham Forest study,Chapter 3). In addition, the probability thatsomeone with hearing impairment has anypermanent hearing impairment (includingminimal and mild hearing impairment) is reducedfrom 0.04 to 0.01. The cost-effectivenessacceptability analysis suggests that in this caseSES-C was still more cost-effective than no SES inover 50% of simulations, if decision-makers arewilling to pay £5000 or more to gain 1 QALY.Given the data used, this indicates that there is ahigh probability that SES-C is likely to be morecost-effective than no SES, when the prevalence ofunidentified permanent hearing impairment isreduced to 0.34 in 1000 and the proportion ofpeople with hearing impairment who have anypermanent hearing impairment is reduced to 1%.
Tables 64 and 65 and Figure 24 show the results ifthe NHSP or other previous screeningprogrammes mean that the prevalence of any
Health Technology Assessment 2007; Vol. 11: No. 32
69
© Queen’s Printer and Controller of HMSO 2007. All rights reserved.
1.0
0.9
0.8
0.7
0.60.5
0.4
0.30.2
0.1
0
Prop
ortio
n co
st-e
ffect
ive
10 20 300
WTP (£,000)
Targeted SES
FIGURE 22 CEAC of SES-C versus high accuracy targeted SES,1 year, QALYs
TABLE 63 Net benefit of SES-C versus no screening, low prevalence of hearing impairment, 1 year, QALYs
WTP (£) Net benefit of more accurate targeted screening compared with SES-C (£)
Mean SD 2.5% percentile 97.5% percentile
Low prevalence of hearing impairment
1 –9 5 –22 –530,000 47 78 –154 176
TABLE 62 Expected cost and QALYs of SES-C versus no screening, low prevalence of hearing impairment, 1 year
Expected cost (£) Expected QALY
SES-C No screening SES-C No screening
Mean 9 0.11 0.985 0.983SD 5 0.09 0.005 0.0052.5% percentile 5 0.007 0.976 0.97397.5% percentile 22 0.33 0.933 0.993

hearing impairment still to be found is halved,and the proportion of people with hearingimpairment who have permanent hearingimpairment is reduced to 1%. In this case, SES-Cis still cost-effective compared with no SES, but theprobability that it is cost-effective is reduced to50% in 60% of simulations. The amount thatdecision-makers would need to be willing to pay togain 1 QALY also increases from £2000 to over£6000. However, this is still less than the valueimplied by previous healthcare decisions (£30,000per QALY gained96).
Comparison of SES-C with no SES, 1-year time-horizon, true cases of hearing impairmentdetectedTables 66 and 67 and Figures 25 and 26 present the results of comparing SES-C with no screening, using the limited outcome measure ofnumber of true cases of hearing impairmentdetected by screening. When true cases of anyhearing impairment are used as the effectmeasure, the data support the results of theprimary analysis, that SES-C is likely to be cost-effective. However, if the appropriate effect
Cost-effectiveness and cost-effectiveness acceptability of the school entry hearing screen
70
1.0
0.9
0.8
0.7
0.6
0.5
0.4
0.3
0.2
0.1
0
Prop
ortio
n co
st-e
ffect
ive
8 16 240
WTP (£,000)
Universal SES
FIGURE 23 CEAC of SES-C versus no SES, lower prevalence of moderate or worse permanent hearing impairment, 1 year, QALYs
TABLE 64 Expected cost and QALYs of SES-C versus no screening, prevalence of hearing impairment halved, 1 year
Expected cost (£) Expected QALY
SES-C No screening SES-C No screening
Mean 9 0.08 0.986 0.985SD 5 0.07 0.005 0.0052.5% percentile 5 0.05 0.977 0.97597.5% percentile 23 0.27 0.994 0.994
TABLE 65 Net benefit of SES-C versus no screening, prevalence of hearing impairment halved, 1 year, QALYs
WTP (£) Net benefit of more accurate targeted screening compared with SES-C (£)
Mean SD 2.5% percentile 97.5% percentile
Low prevalence of hearing impairment
1 –8 4 –23 –530,000 16 73 –179 138

measure is thought to be true cases of permanenthearing impairment detected by screening, thenSES-C is less likely to be cost-effective, with lessthan 50% of simulations showing SES-C as cost-effective.
Table 68 shows the total cost and number of truecases of any hearing impairment detected for a 1-year cohort of children entering school andeligible for screening in England. This is based
on the population of 1.129 million children agedbetween 4 and 6 years in 2005(http://www.statistics.gov.uk/statbase/Expodata/Spreadsheets/D9390.xls). The data indicate thatthe universal screening programme represented bySES-C is likely to detect an additional 1497 truecases of any hearing impairment in 1 yearcompared with no screening, including anadditional 32 cases of permanent hearingimpairment.
Health Technology Assessment 2007; Vol. 11: No. 32
71
© Queen’s Printer and Controller of HMSO 2007. All rights reserved.
1.0
0.9
0.8
0.7
0.6
0.5
0.4
0.3
0.2
0.1
0
Prop
ortio
n co
st-e
ffect
ive
8 16 240
WTP (£,000)
Universal SES
FIGURE 24 CEAC of SES-C versus no SES, prevalence of still-to-be-found hearing impairment is halved, 1 year, QALYs
TABLE 66 Expected cost and true cases of any hearing impairment detected of SES-C versus no screening, 1 year
Expected true cases of any Expected true cases of permanent hearing impairment hearing impairment
SES-C No screening SES-C No screening
Mean 0.018 0.001 0.00038 0.00002SD 0.018 0.000 0.00053 0.000022.5% percentile 0.007 0.000 0.00003 0.0000097.5% percentile 0.07 0.002 0.00216 0.00009
TABLE 67 Net benefit of SES-C versus no screening, true cases of any hearing impairment detected, 1 year, QALYs
WTP (£) Net benefit of more accurate targeted screening compared with SES-C (£)
Mean SD 2.5% percentile 97.5% percentile
True cases of any hearing impairment1 –9 5 –24 –5
30,000 502 524 195 2058
True cases of permanent hearing impairment1 –9 5 24 5
30,000 2 12 –7 39

Summary The literature was systematically searched toidentify published economic evaluations thatassessed the cost-effectiveness of SES. No fulleconomic evaluations were found. Two partialeconomic evaluations were found. Overall, thequality of these papers was judged to be lowaccording to the quality assessment criteria used.In particular, there were insufficient data availableto judge the validity and robustness of theeconomic and clinical data used in the analyses, orthe relevance of the data and results to the UKsetting. Cost studies were also reviewed to extractany relevant resource use and unit cost data forthe economic model. However, as with theeconomic evaluations, the quality and applicabilityof the data (to the UK setting) from these studieswere limited.
A decision-analytic model was developed to assessthe costs, effectiveness and net benefit of SEScompared with no SES and SES using alternativetests within the screen. The primary source of dataabout the accuracy of the screening tests for the
economic model was the data included in thesystematic review reported in Chapter 4. This wassupplemented by data on the prevalence anddistribution of hearing impairment, theprobability of a child being screened, diagnosedand treated, the costs of screening, diagnosis andtreatment, and the outcomes of screening frompublished literature, the survey of current practice,the observational study conducted in WalthamForest, national statistics and databases, localaccounts and expert opinion.
For the 1-year time-horizon used in the primaryanalysis, SES-C was associated with higher costsand slightly higher QALYs compared with no SESand other SES programmes. The range ofexpected costs, QALYs and net benefits was broad,with the 2.5th to 97.5th percentiles of differencesin expected costs and outcomes crossing zero.CEACs and measures of net benefit provide ameans of assessing the robustness of differences inexpected costs and outcomes, when combined intoICERs. These analyses allow for the fact that theremay be a relationship between resource use andcosts and outcomes, so that, for example, higher
Cost-effectiveness and cost-effectiveness acceptability of the school entry hearing screen
72
1.0
0.9
0.8
0.7
0.60.5
0.4
0.30.2
0.1
0
Prop
ortio
n co
st-e
ffect
ive
10 20 300
WTP (£,000)
Universal SES
FIGURE 25 CEAC of SES-C versus no SES, 1 year, true cases ofany hearing impairment detected
1.0
0.9
0.8
0.7
0.60.5
0.4
0.30.2
0.1
0
Prop
ortio
n co
st-e
ffect
ive
10 20 300
WTP (£,000)
Universal SES
FIGURE 26 CEAC of SES-C versus no SES, 1 year, true cases ofpermanent hearing impairment detected
TABLE 68 Total costs and true cases detected for a 1-year cohort of children eligible for screening
Total costs (£) Total true cases detected
Any hearing impairment Permanent hearing impairment
SES-C 880,854 1,585 33No screening 19,379 88 2SES-C minus no screening 861,475 1,497 32

resource use and therefore costs may be associatedwith improved outcomes. Overall, the primaryanalysis indicated that SES-C was cost-effectivecompared with all the other SES and no SESprogrammes. A number of secondary analyses wasused to explore subgroups of the data and testassumptions used in the model. However, the useof subsets of the data, with relatively few studies to
combine and small sample sizes, means that theseanalyses can be exploratory only. The secondaryanalyses supported the result that SES-C is cost-effective compared with no SES and alternativeSES programmes. The most cost-effective methodof implementing SES is using SES-PTS. This ismore cost-effective than no SES, SES-C and lessaccurate tests used in SES.
Health Technology Assessment 2007; Vol. 11: No. 32
73
© Queen’s Printer and Controller of HMSO 2007. All rights reserved.


Introduction: strengths andweaknesses of the studyThis study is the first comprehensive attempt inthe UK to address issues surrounding screeningfor hearing impairment at school entry (aroundage 4–6 years). Previous studies have reportedsurveys of practice, audits of screen performanceand test accuracy for specific conditions such asOME. This study aims to bring three strands ofwork together: a survey of practice across the UK(Chapter 2), a systematic review of the accuracy ofalternative tests and the effectiveness ofinterventions (Chapter 4), and modelling costsand cost-effectiveness (Chapter 5). In addition, theauthors were able to access some primary datafrom the team in Waltham Forest (PW) thataddress changes that are likely to occur owing tothe introduction of newborn hearing screening(Chapter 3).
Survey of current practiceFor the survey of current practice a postalquestionnaire was developed for service leads forthe SES across the UK. Robust results from postalsurvey methodology rely on both identifying theappropriate population and achieving asufficiently high response rate to be able togeneralise.
Identification of the population to which thequestionnaire was to be sent raised severalprocedural difficulties. The aim was to survey thetotal population, that is, all staff responsible, asservice leads, for the SES programme in the UK.The service is not provided in the same waythroughout the UK, probably for historicalreasons, and hence identifying the leads involveda series of different approaches (listed inChapter 2), including advertisements inprofessional newsletters and cold-calling NHStrusts. This last method highlighted the difficulty,encountered often, of identifying anyone withinthe trust who knew about the screen and/or knewwho had responsibility for it. This raises issues ofmanagerial responsibility for the screen, andconsequent local and national accountability forscreen performance. After considerable effort andtime a contact was secured for every trust inEngland, every board in Wales and Scotland and
for every LSHCG in Northern Ireland. The 244service leads identified for the SES, many of whomcovered more than one PCT, comprise a muchhigher number of SES leads than in previoussurveys,6 and are likely to represent almost totalcoverage, although it is possible that a very fewservices run entirely by educational services wouldbe missed. Research governance approval wassought from 124 R&D directorates covering 304PCTs in England, Scotland and Wales, but inNorthern Ireland it was only possible to approachtwo R&D offices from 15 LSHCGs. R&Dprocedural difficulties meant that 229 out of 244services could be sent a questionnaire.
There was an extremely high return rate ofquestionnaires for this sort of study of just over85%. Bearing in mind the data and commentsfrom respondents, the high return rate seemed toreflect the willingness of people to take the time totell the researchers about their service and theirviews, in the knowledge that the informationwould be used to contribute to the development ofa service which they felt was important but in needof some guidance. The response rate may also bedue to the fact that respondents were not asked toallocate time to report data that were not easilyavailable. This means that some of theinformation provided lacks depth and that thedata on yield and screen performance are basedon a relatively small proportion of all services;even the data from these services may lackaccuracy. Nevertheless, the survey of currentpractice is the most complete carried out in theUK, with wide geographical coverage and a highresponse rate.
Waltham Forest observational studiesThe authors were fortunate to be able to accessgood-quality data from the Waltham Forestservices. In UK terms this service is unique since itoffers robust data from three sizeable cohorts, allof which had the SES, but following a universalnewborn screen for one, a targeted newbornscreen for the second and traditional infantscreens for the third. This is a rare set ofcomparative cohorts, and although they do notconjointly comprise a single longitudinal study,they allow some valuable comparisons concerningthe possible future impact of the now national
Health Technology Assessment 2007; Vol. 11: No. 32
75
© Queen’s Printer and Controller of HMSO 2007. All rights reserved.
Chapter 6
Summary and conclusions

implementation of the NHSP on the SES, as well as some other secular data. However, thereare features of the Waltham Forest populations(e.g. ethnicity, mobility) that undermine highlydetailed or quantitative generalisation from this local evidence base to the national cohortcovered (since March 2006) by the NHSP, once the latter has reached school entry age (inaround 2010).
Nevertheless, the epidemiological characteristicsof those children with a permanent hearingimpairment in the Waltham Forest cohorts was notsignificantly different from that reported fromlarger and national studies undertaken in the UK,and it is probable that the population of hearing-impaired children reported is reasonably typical ofthat present elsewhere in the UK. The newbornscreen protocol used in the Waltham Forestcohorts differed from that implemented in theNHSP; nevertheless, the yield of moderate orworse permanent bilateral hearing impairmentobtained from the NHSP (1.0 in 1000, 95% CI0.78 to 1.22)9 was extremely similar to the yield of1.03 in 1000 (95% CI 0.66 to 1.40) achieved in theWaltham Forest studies. The yield of children witha permanent unilateral hearing impairment in theWaltham Forest studies was 0.55 (95% CI 0.28 to0.82) and this was similar to the 0.64 in 1000 (95%CI 0.37 to 0.91) reported from the NHSP. Thesesimilarities suggest that generalisation is justified.
The Waltham Forest studies were ascertainmentstudies, that is, they depended on collecting datafrom all known cases of children with permanenthearing impairment in the three cohorts. Thus,cases not yet identified, for whatever reason,would not be included, and the strength of thedata is crucially dependent on both the quality ofthe service at identifying cases and the robustnessof the ascertainment procedures. Furthermore, the ability of services accurately to identifychildhood hearing impairment reduces with lower levels of impairment, so in any study of thistype, despite the greater number of milder casesthere remains some uncertainty about theirascertainment rate.
Systematic review of accuracy andeffectiveness of screeningThe principal strength of the systematic review wasits comprehensiveness. Compared with threeprevious similar reviews in this area more studieswere identified, in part because these previousreviews focused more narrowly, for example onpreschool screening for OME or on a particularscreening test (whisper voice test).
The main limitation of the review was a lack ofgood-quality evidence on the effectiveness of SESon long-term outcomes, including educational,language and social outcomes. The authorsacknowledge the challenge of demonstratingeffectiveness at two stages, both case finding andintervention. In addition, although several studieshave assessed the accuracy of screening tests, theirquality and the quality of reporting wereunacceptably variable. Two particular problemswere the inconsistent reference standard appliedand variability in the criterion definition forhearing impairment that was used. Although fulldiagnostic PTA was used as the reference test inmany studies, this was not the case in all. Areference standard test is a key element of anystudy of diagnostic accuracy. A high or low level ofaccuracy derived from a comparison of a given testagainst a range of reference standards, none ofwhich is stated to be a gold standard, is difficult tointerpret. Furthermore, studies often failed tospecify clearly the criterion threshold that definedhearing impairment, and different studies applieddifferent hearing thresholds for their casedefinition. Without a consistent case definition it isdifficult not only to interpret the accuracy ofresults of a given study, but also to apply theseresults to real-world clinical practice.
Cost-effectivenessOverall, the evidence base to support theeconomic model was weak. As noted in Chapter 4,the robustness of the available evidence about theaccuracy of screening tests was undermined by thevariable quality of the studies investigating testaccuracy. In addition, no evidence about the short-or long-term effectiveness (impact on disabilityand quality of life) or cost-effectiveness of SES wasfound. The data used to estimate otherprobabilities, costs and outcomes were synthesisedfrom a variety of sources, including surveys ofclinical practice and expert opinion. These mayaffect the robustness of the conclusions. Althoughthe variables that used data from surveys or expertopinion were assigned wide distributions whereverpossible, this also increases the uncertainty in themodel parameters and reduces the likelihood orprobability that an intervention is cost-effective.
The economic model was static in nature andbased on a short time-frame of 1 year for theprimary analysis. The time-horizon was extendedto 11 years in secondary analyses. The staticstructure of the model was based on theassumption that the values of the variablesincluded would not change significantly over time.There is no evidence to suggest that this is an
Summary and conclusions
76

unreasonable assumption for the 1-year time-frame considered in the primary analysis.However, if hearing impairment identified by theschool screen is progressive, or the impact onquality of life and health status of hearingimpairment identified by the SES changessignificantly over time, then the results of theeconomic model may not apply.
High and low estimates of utility and long-termcosts were included in the primary and secondaryanalyses. The results of the cost acceptability andnet benefit analyses reflected the high uncertaintyabout the input parameters, but broadlysupported the main conclusions of the economicanalyses. The structure of the model wasdeveloped from the reviews of clinical andeconomic evidence and discussion with experts inaudiology.
The primary and secondary analyses used QALYsas the outcome measure to estimate ICERs, netbenefit and CEACs. QALYs take into accountdifferences in potential life expectancy and theimpact of adverse events on overall health-relatedquality of life; they tend to be weighted bymortality and produce only small differencesamong adverse events that have a short orrelatively low impact on quality of life. This maybias the analysis if one or more interventions areassociated with high rates of adverse events thatindividually have a relatively low impact on health,but cumulatively could have a significant impacton health and health-related quality of life.Overall, the estimates of expected QALYsdifferentiated between different SES programmesand levels of hearing impairment. These factorswould suggest that the QALY is a reasonablemeasure for the economic analysis (and isconsistent with the approach used for reports toNICE).
Summary of findingsSurvey of current practiceThe SES is usually performed in the first year ofprimary education, in school, and usually (72%)with prior written information to parents andguardians. The survey indicated that there is widevariation in the implementation of the screenthroughout the UK. This variation applies to thepopulation covered, with 51% of respondentservices not screening children entering privateeducation and 72% not screening home-educatedchildren; the physical location and conditionsunder which the screen is implemented, with little
evidence of commitment by schools to offersuitable locations, and little commitment bymanagement to provide training and replacementequipment; test methodology, with differentnumbers and types of tests and retests (17%referring after the first test, 72% after a second,10% after a third); the time of repeat tests (sameday to 12 weeks); the criteria determining whichchildren to refer, which varied from 20 dB HLacross up to seven frequencies to 30 dB HL at onlythree frequencies (the dB scale is a logarithmicratio scale, with 0 dB HL being the averagenormal hearing threshold and the differencebetween 20 and 30 dB HL representing a ten-foldincrease in power and more than a doubling ofsubjective loudness); the personnel and theequipment involved; and the ability to collect andthen retrieve data. There is little or non-existentrobust audit at local (and therefore national) level,absent or inadequate data management systems,and a lack of explicit procedures for qualityassurance. The one area of consistency concernedthe pure tone sweep test, which was used by 97%of responding services as the first test in thescreen.
The fact of existing protocol variation betweenservices could provide for an evaluation of whatmight be the most appropriate, successful andefficient implementation of the screeningprogramme. However, good data on yield andscreen performance are necessary for such anevaluation; although nearly 70% of servicesclaimed to have data management systems inplace, only 50% of those said that they could easilyobtain data reports. Coverage and referral datawere available for approximately one-third ofservices (n = 55), but fewer than 20 services couldprovide any robust data on the numbers ofchildren identified as hearing impaired. Theuptake data from those that could provide themindicated a median uptake rate for those offeredthe screen of over 90%. At least half theresponding services screen those children alreadyknown to some part of the service (but often notto the SES service) to have a hearing impairment,again indicative of poor information sharing.
Despite these marked difficulties and the lack ofrobust audit there was a very high response rate tothe survey questionnaire, indicating a high level ofinterest; there were clear indications fromcomments offered that the majority of serviceleads regard the screen as useful and would preferit to continue, even though it was recognised thatthe value of the screen may reduce with the adventof universal newborn hearing screening. A small
Health Technology Assessment 2007; Vol. 11: No. 32
77
© Queen’s Printer and Controller of HMSO 2007. All rights reserved.

proportion of respondents (12.2%) haveabandoned the screen, and a few noted that theywere awaiting national guidance on its future. Asignificant number of respondents stated that theywould welcome such national guidance. Otherservice leads would welcome guidelines on thevalue of a selective (targeted) screen and on thepopulation for whom it would be appropriate.Most concerns about the continued relevance ofthe screen as a universal screen focused on theimpact of the introduction of universal newbornhearing screening, the inadequate resources (time,personnel and facilities) available to implementthe screen, and the inadequacy of systems andtechnological support for data management andretrieval. Support for the continuing value of thescreen focused on its ability to identify childrenwho would otherwise not be identified, eitherbecause they had been missed by previous screensor surveillance for whatever reason, or becausethey had entered the system having had noprevious screens.
Waltham Forest observational studiesThe evidence from the cohort comparisons inWaltham Forest reported here for the first time ina single source suggests strongly that there is amaterial effect of the introduction of newbornhearing screening on the SES, in addition to othersecular changes that have occurred in recent years.Of the latter, the most important are probably theimmunisation programmes that seem to have beenaccompanied by a significant reduction in theproportion of children with severe and profoundunilateral hearing impairment. With regard to thepossible changing pattern of routes toidentification of permanent childhood hearingimpairment, before the introduction of newbornscreening the yield from the IDT, intermediatescreens and parental/professional concernthroughout infancy and up to school entry wasaround 73% of the yield of all PCHI cases residentand currently known to the service, while the finalscreen, the SES, accounted for the remainder at arate of 1.11 in 1000, of which 0.63 in 1000 wereunilateral impairments. The evidence suggeststhat since the introduction of universal newbornscreening, over 90% of the cases known to servicesnow have been identified via newborn screeningand parental/professional concern in infancy andup to school entry, with only 0.34 in 1000identified by the SES (of which only 0.07 in 1000were unilateral).
Thus, in Waltham Forest, newborn screening hasreduced the yield of the SES for permanenthearing impairment. However, postnewborn
routes to identification remain important, in largepart because of late-onset and acquired cases,those who had ‘moved in’, and those with acongenital impairment that had not been pickedup by the newborn screening programme. Theprevalence of mild and greater bilateral andunilateral hearing impairment at school age was3.47 in 1000, similar to findings from otherstudies. Parental and professional concernremained a steady source of identification (1.31 in1000) postnatally, but still, at school entry 16% ofmoderate and greater bilateral, 18% of mildbilateral and 17% of unilateral permanent hearingimpairments remained to be identified. Theevidence for long-term effects of moderate orgreater congenital bilateral hearing impairment iswell documented,5 and there are known anddemonstrably beneficial interventions basedaround the early provision of hearing aids. Long-standing beliefs in the necessity of interventionhave made it impractical to conduct controlledtrials on benefits of intervention for moderatehearing impairment which is first identified atschool entry, and the present research hasfurthermore failed to identify statisticallycontrolled studies with age of identification as amajor factor that enable some conclusions to bedrawn in the way that it is possible in the earlieryears. Nevertheless, it is reasonable to assume thatthe effects, if untreated, would be marked,especially for significant but unidentifiedimpairment at the transition to formal schooling.These arguments suggest that some sort ofsystematic approach to identification of moderateor greater permanent hearing impairment at, orapproaching school entry age is required. Theevidence on the effects of mild bilateral andunilateral hearing impairment on long-termoutcomes is largely absent, and the sameargument is therefore difficult to make on thebasis of available evidence. However, from what isknown of mild hearing impairment and theacoustics of classrooms, it would be reasonable toextend the argument to include the need to findand manage these not previously known mild andunilateral hearing impairments as well.
Systematic review of accuracy andeffectiveness of screeningThere was only level III evidence for theeffectiveness of preschool hearing screening, froma single, poor-quality, observational comparativestudy. Furthermore, this single study wasinconclusive in whether preschool screening wasmore effective than no screening in detectinghearing impairment. No studies were identifiedthat have assessed the long-term impact of
Summary and conclusions
78

preschool hearing screening on educational,language and social outcomes.
Several studies have assessed the accuracy ofdifferent hearing screening tests in preschoolchildren. Given the unacceptable variability inmethodological quality and reporting of thesestudies, the lack of clarity over the cases of hearingimpairment detected (e.g. transient versuspermanent hearing impairment), the variation inreference test and threshold level for hearingdeficit, and the range of settings in which thesetests were applied, it is difficult to interpret andcompare their results.
Nevertheless, accepting these caveats and selectingthe subset of studies using PTA as the referencetest, the findings suggest that pure tone sweepaudiometry has high sensitivity and specificity forfull PTA and therefore appears to be a suitable testfor screening. Other possible tests, about whichmore and better evidence is required, are spokenword tests and TEOAEs. For OME, tympanometryand reflectometry have variable reportedsensitivity and specificity as screening tests(although note that tympanometry is a well-established and valuable diagnostic test whichwould be expected to be part of the follow-updiagnostic test battery), and parental report isfound to have poor sensitivity and specificity.There is insufficient evidence to comment on theaccuracy of combinations of tests.
A small number of studies indicated a generallyhigh uptake in this age group. However, given theexperimental design of the studies and the factthat they were assessing test accuracy rather thanprogramme effectiveness, these findings cannot begeneralised to the uptake of the screen in real-world community screening settings. The twopublished studies with evidence of uptake ofscreening at school entry in real-world settingssuggest uptake in excess of 90%, reflecting the‘captive’ nature of the population to be screened.6,97
Cost-effectivenessThere are no good-quality published studies thatassess the cost-effectiveness of SES, and no fulleconomic evaluations. The two partial economicevaluations that were found were of poor qualityand uncertain relevance.
A decision-analytic model was developed to assessthe costs, effectiveness and net benefit of SESwhen compared with no SES and SES usingalternative screening tests. The primary source ofdata about the accuracy of the screening tests for
the economic model was the data included in thesystematic review reported in Chapter 4. This wassupplemented by data on the prevalence anddistribution of hearing impairment, theprobability of a child being screened, diagnosedand treated, the costs of screening, diagnosis andtreatment, and the outcomes of screening frompublished literature, the survey of current practice(Chapter 2), the Waltham Forest observationalstudy (Chapter 3), national statistics anddatabases, local accounts and expert opinion.
For the 1-year time-horizon used in the primaryanalysis, SES-C was associated with higher costsand slightly higher QALYs compared with no SESand other SES alternatives. The ICER for SES-C isaround £2500 per QALY gained. The range ofexpected costs, QALYs and net benefits was broad,with the 2.5th to 97.5th percentiles of differencesin expected costs and outcomes crossing zero,indicating a high level of uncertainty in theconclusions. CEACs and measures of net benefitprovide a means of assessing the robustness ofdifferences in expected costs and outcomes, whencombined into ICERs. These analyses allow for thefact there may be a relationship between resourceuse and costs and outcomes, so that, for example,higher resource use and therefore costs may beassociated with improved outcomes. Overall, theprimary analysis indicated that SES-C was cost-effective compared with all the other SESprogrammes evaluated and with no SES. The costsof individual SES tests (rather than screeningprogrammes) were estimated to be approximately£8 per screening test (see Table 42, Chapter 5). Itis the costs of the screening tests that dominatethe total expected costs of screening. The costs ofthe screening tests may have been overestimated ifthe duration of the tests reported in the survey ofcurrent practice also included the time needed toconduct wider health checks. The survey of currentpractice (Chapter 2) indicated that up to 60% ofprogrammes included the SES in wider healthchecks all the time; if this is the case, then the costof each screening test may be lower and the cost-effectiveness of SES higher than estimated here.
A number of secondary analyses was used toexplore subgroups of the data and testassumptions used in the model. However, the useof subsets of the data, with relatively few studies tocombine and small sample sizes, means that theseanalyses can be exploratory only. The secondaryanalyses supported the result that SES-C is cost-effective compared with no SES and alternativeSES models. Furthermore, the analyses using the6- and 11-year time-horizons supported this
Health Technology Assessment 2007; Vol. 11: No. 32
79
© Queen’s Printer and Controller of HMSO 2007. All rights reserved.

conclusion, with SES-C being more cost-effectivein over 99% of simulations.
In the economic model, SES-C is a weightedcomposite reflecting the pure tone sweep test(99%) with tympanometry (1%). When SES-C wascompared with the SES as it is mostly practised atpresent in the UK (i.e. pure tone sweep only), thelatter was more cost-effective in 80% ofsimulations. The estimates of the costs and QALYsof SES-C were based primarily on the pure tonesweep as the screening test. The studies includedin the systematic review (Chapter 4) indicate thatthis test has relatively high sensitivity andspecificity compared with alternative tests;however, the accuracy of the pure tone sweep wasassessed in trials settings, rather than in the variedand less than ideal settings encountered in routinepractice. This may mean that the accuracy andtherefore the cost-effectiveness of SES-C areoverestimated, compared with no SES. However,the analysis comparing SES using alternative testswith lower accuracy indicated that SES might stillbe more cost-effective than no SES.
When SES-C was compared with targeted screeningat school entry, if the targeting accurately detected90% of children with a hearing impairment thentargeted screening was more cost-effective thanuniversal screening. However, if the identificationof children at risk of hearing impairment fortargeted screening was associated with lowsensitivity and specificity, then universal screeningwas more cost-effective than targeted screening.
The economic analyses used a relatively lowprevalence of moderate or worse previouslyunidentified permanent hearing impairment.Reducing this further to model the potentialimpact of newborn hearing screening reduced theproportion of simulations when SES was cost-effective to around 60%. Decision-makers alsoneeded to be willing to pay over £6000 to gain1 QALY for SES to be cost-effective in more than50% of cases.
Overall, because of the lack of primary data andthe necessarily wide limits for variables in themodelling, these results must be consideredindicative and exploratory only.
The OME issue and some furtheranalysesHearing impairment of a mild degree is alsoassociated with transient episodes of OME, which
is much more prevalent in children than ispermanent hearing impairment.15 Some peoplehave argued the case for a screen at school entryto identify previously unknown cases of childrenwith OME that is of a severity and/or persistencesufficient to require treatment.
There has been extensive although generallypoor-quality research on the treatments for OMEin children, much of which fails to address thequestion of which subtypes of ‘OME child’ benefitfrom treatments. A recent meta-analysis98
accessing individual patient data from severaltrials confirmed the accepted conclusion that, forwell-defined cases, ventilation tubes (grommets)do improve hearing for so long as they are inplace. However, for the most persistent orrecurrent cases (i.e. those for whom the certaintyof selection for surgery is greatest) the conditiontends to return, leading to the need forreinsertion(s) of grommets. Age, within the rangeof about 3–8 years, does not seem to be acharacteristic of major importance for results,provided that children meet a criterion forpersistence and severity.
The most comprehensive and sophisticatedevidence on candidature for intervention in OMEis emerging from the UK TARGET randomisedtrial,99 of which the aspects of particular relevancehere are mostly yet to be published. The trial doesnot contradict the above simple statements, butdocuments more fully the breadth and duration ofbenefits from adjuvant adenoidectomy and thecriteria for selection of a subgroup within whichthe combined treatment is highly effective(Haggard M, University of Cambridge: personalcommunication, 2006). Professor Haggardinformed the review team via several presentationsgiven at international meetings and extensiveannotated analyses which show that the largelynull results on young mild cases emerging fromscreening did not apply to older (>3.75 years) andbetter selected cases, but that consistent if modestbenefits are shown in the TARGET data. Thus, inrelation to the Wilson–Jungner principles forscreening, at one level an effective and availableintervention does exist for children of school entryage. There is still no convincing and favourableevidence for types of treatment other than thesesurgical operations.
The implementation of an overall screening andtreatment programme is less satisfactory than theabove statement suggests. The evidence on thispoint comes from children of younger age thanschool entry, but there is no good reason for it not
Summary and conclusions
80

to apply. Two trials of ventilation tubes in OMEhave been published in recent years, makingessentially the same point.100,101 They aresummarised here because, although restricted,they are of high internal validity and areparticularly relevant to the issue of the caseloadsthat screening tends to find: the marginal ratherthan the extreme. The Rovers trial was done onchildren referred from the implementation of the8-month IDT screen in The Netherlands,although by the time they had been throughconfirmation of fluid in the ears, they were around2 years of age. As well as an ear status measure,there was a language test and a quality of lifescale. The Paradise trial recruited slightly olderchildren in the USA to whom it was possible togive a wider range of assessments of valuedoutcomes including performance tests. Thesechildren had been referred by paediatricians whoexercise a highly surveillant semi-specialised formof childcare in the medically insured part of theUS population.
Both of these trials found that the placement ofventilation tubes did give the known short-termbenefits to ear status or hearing, but did notimprove wider valued measures of outcome. Thesenull results make useful political points for the twocountries concerned, both having highintervention rates, about overtreatment in routinepractice in the past, due to selection of cases thatare too mild and/or insufficiently persistent tobenefit. A widespread misinterpretation of thesetrials, imagining that they suggest that ventilationtubes ‘do not work’, has led to unnecessaryavoidance of their real message. In manyconditions it is hard to show a knock-on fromeither disease or treatment into valued outcomes,in relation to other powerful sources of influenceon those same outcomes. The indirect knock-onfrom fluctuating hearing impairment and physicalhealth problems in OME, and its treatment, intolanguage and other developmental outcomesmake that challenge particularly hard. The knock-on benefits would be expected to be rather slight.The evidence suggests that it is particularly slightin very young caseloads emerging from screeningor surveillance, where the rate of spontaneousremission in untreated controls is high, andparticularly so where the case entry criteria aremild.
For the preceding reasons, TARGET recruitedchildren from the NHS who had alreadyundergone gate-keeping. This typically includessome initial caution by the GP over the need forreferral, several months (in most districts) of
waiting to be seen in secondary care, and beingsubject to a further 3-month formal watchfulwaiting period to establish persistence orrecurrence. These were older children(3.5–7 years) and only randomised on meeting aseverity criterion of hearing thresholds of 20 dBHL or greater in the better ear a second time after3 months of watchful waiting. TARGET didproduce some statistically significant and clinicallymaterial benefits to physical health anddevelopment over the 2 years following treatmentas well as to hearing, but these benefits wererather modest taken as a whole. Given awarenessof this difference in caseload, the results fromTARGET and the other two trials are notinconsistent. Further analyses of the hearing leveldata from TARGET established that children withmore severe hearing levels do indeed receive morebenefit to hearing, as expected. The finding isencouraging for tests of hearing being relevant forscreens for OME. The issues then for screening inOME as a fluctuating condition are: (1) how fewsequential stages will suffice after some initialuniversal screen to define a small caseload thatapproximates the severity and persistence of thatin TARGET, and (2) whether for the cost of suchsuccessive testing, the incremental yield over whatwould have been referred reactively at this age isworth that cost.
There is no published evidence that addresses theforegoing two questions. Both a national study6
and the historical cohort from Waltham Forest(Chapter 3) have shown that just under 3% ofthose screened were referred from the SES withOME. This represents a large proportion of allthose referred by the SES, with data from thesurvey of current practice suggesting a median forpositive predictive value for temporary conductivehearing impairment of 36%. In the WalthamForest cohort, new cases (i.e. not previously knownto services) amounted to 1.4% and of these half(0.7%) needed ENT referral; details thereafterwere not available, and interpretation of the valueof making these referrals is therefore difficult.
However, some light can be thrown on thecontribution of the present SES system by afurther analysis of cases seen in the TARGETrecruitment stages. SES screen referrals to ENTservices for possible surgery tend to go throughcommunity paediatricians who specialise inaudiology (e.g. members of BACDA), rather thanthrough GPs. This distinction is not hard and fast:not all community referrals will have originatedwith screens, although many will, and nearly allex-screen referrals will arrive from this source. The
Health Technology Assessment 2007; Vol. 11: No. 32
81
© Queen’s Printer and Controller of HMSO 2007. All rights reserved.

TARGET RCT had already shown on its databaseof over 3000 cases that referrals from communitypaediatricians had higher positive predictive valuethan those direct from GPs.99 Because the lead-instages to the randomised trial had recruited at adozen ENT departments throughout the UK, thetrial chief investigator (Haggard) and colleagueswere asked to probe whether these analyses couldbe extended to say anything about the yield fromSES.
A set of analyses was run on over 4000 referralsand a document annotating the results wassupplied to the present team, of which thefollowing is a summary. Although the TARGETstudy had not asked about screening at the level ofeither individual case or contributing district(clinic), it had a useful degree of indirect leveragevia (1) the age distribution being centred on5 years, the age of maximal relevance to SES and(2) a distinction between GP and communityreferrals. The question that this permits to beanswered is one of yield: whether, taking GP-referred cases as a control set, the number orseverity of community-referred children in thisdatabase increases from around 5 years of age,when contrasting the preceding 2 years of cross-sectional age with the following 2 years. Thisinvolves an interaction with age. The main-effectadvantage for community mentioned above wasagain found to be pervasive and reflects theavailability in community services of audiometry,some specialist expertise and a tendency to retestto establish persistence. Analyses of this typebroken down by age and source were conductedon the severity (a marker of positive predictivevalue and specificity) and numbers of cases (yield).Effectiveness of screening would predict thehighest values to occur in the ex-community over-5-year-olds. However, in neither numbers norseverity was there an interaction between source(GP/community) and age band (before/after modalSES age). Thus, the combination of number andseverity of cases coming through the communityspecifically after SES age is not large enough toshow up in the ENT caseload. It is thereforeprobably not large enough either to represent adistinct societal benefit.
ConclusionsThe evidence from the national survey of currentpractice is that:
● the SES is in place in most areas of England,Wales and Scotland; data from Northern
Ireland were too few to draw any conclusionsthat might generalise there; just over 10% ofrespondents had abandoned the screen, whileothers were awaiting guidance in the light ofthe national implementation of newbornhearing screening
● coverage of the SES is variable, but is often over90% for children in state schools; coverage ispoor for private schools and home-educatedchildren
● referral rates are variable, with a median ofabout 8%
● the test used for the screen is in all cases thepure tone sweep test; however, there is a widevariety of implementations of this, withdiffering frequencies, pass criteria and retestprotocols; written examples of protocols wereoften poor and ambiguous
● there is no national approach to data collection,audit and quality assurance, and there arevariable approaches at local level; a smallproportion of services was able to provide auditdata on coverage referral rates and yields, butthese were often of doubtful quality, especiallywith respect to yield
● the screen is performed in less than ideal testconditions; this probably increases the referralrates and decreases accuracy
● resources for replacement equipment,calibration and screener training are said to belimited and impacting on the quality of thescreen in many areas.
The evidence from the observational studies inWaltham Forest is that:
● the prevalence of permanent childhood hearingimpairment continues to increase throughinfancy owing to acquired, late-onset andprogressive hearing impairment, in line withpublished evidence; of the 3.47 in 1000children with a permanent hearing impairmentat school screen age, 1.89 in 1000 requiredidentification after the newborn screen; a highproportion of these appeared to haveidentifiable risk factors
● the introduction of newborn hearing screeningis likely to reduce significantly the yield of auniversal SES for permanent bilateral andunilateral hearing impairments; the yield of theSES in Waltham Forest for such impairments hasfallen from about 1.11 in 1000 before newbornscreening to about 0.34 in 1000 for cohorts whohave had newborn screening, of which only 0.07in 1000 are unilateral impairments
● surveillance procedures, comprising (at least)reactive services to parental and professional
Summary and conclusions
82

concern, are an important route toidentification of cases throughout infancy andthe preschool years
● in the Waltham Forest cohort studies, small butmaterial numbers of children with permanenthearing impairment remained to be found at orbefore school entry; just under 20% ofpermanent moderate or greater bilateral, mildbilateral and unilateral impairments, known toservices as 6-year-olds or older, remained to beidentified around the time of school entry;some of these were late onset or acquired, some‘moved in’ and some congenital cases notidentified by the newborn screen.
The evidence from the systematic review of theaccuracy of alternative tests for the SES and of theeffectiveness of interventions is that:
● there were no good-quality publishedcomparative trials identified of alternativescreens or tests for SES
● there was one poor quality study whichcompares screening to no screening, but theresults are inconclusive
● studies concerned with the relative accuracy (interms of sensitivity and specificity) of alternativescreening tests are difficult to compare andoften flawed by differing referral criteria anddiffering case definitions; nevertheless, usingfull PTA as the reference test, the pure tonesweep test appears to have high sensitivity andhigh specificity for minimal, mild and greaterhearing impairments, better than alternativetests for which evidence was identified(otoacoustic emissions, tympanometry,reflectometry, parental questionnaire); someevidence suggests that spoken word tests canhave high sensitivity and specificity; no good-quality evidence was identified addressing theaccuracy of combinations of tests
● there is insufficient evidence to draw anyconclusions about possible harm of the screenas currently performed
● there were no published studies identifiedwhich examined the possible effects of SES andsubsequent interventions on longer termlanguage, educational or social outcomes.
The evidence from the cost-effectiveness and costmodelling study is that:
● no good-quality published cost-effectivenessstudies or economic evaluations of SES wereidentified
● lack of primary data and the necessarily widelimits for variables in the modelling mean that
any conclusions must be considered indicativeand exploratory only
● using decision-analytic modelling, and takinginto account all types of hearing impairment, auniversal SES based largely or completely onpure tone sweep tests was associated with highercosts and slightly higher QALYs compared withno screen and other screen alternatives; theICER for such a screen is around £2500 perQALY gained; the range of expected costs,QALYs and net benefits was broad, indicating aconsiderable degree of uncertainty
● targeted screening can be more cost-effectivethan universal school entry screening; thisdepends on there being identifiable risk factors.
The evidence suggests that a national screeningprogramme for permanent hearing impairment atschool entry meets all but three of the criteria fora screening programme; namely, knowledge of thedistribution of test values in the population withagreed cut-offs, RCTs showing that the screenreduces morbidity, and a national protocol withquality assurance and audit (Appendix 1).
With regard specifically to the issue of the value oreffectiveness of the screen finding cases oftransient hearing impairment associated withmiddle ear disorder, the evidence comes from thesurvey of current practice, a recently publishedsurvey,6 the Waltham Forest cohort studies and arecent meta-analysis, alongside data from a largeand well-controlled UK study as yet largelyunpublished (Haggard M, Cambridge University:personal communication, 2006). Collectively, thismaterial suggests that:
● surgical intervention (ventilation tubes) forchildren with OME improves hearing levels asexpected, and has modest but measurableeffects on longer term outcomes (physical,developmental) for more severe and persistentcases, but not for milder and marginal cases
● about 3% of those screened are referred withOME, representing perhaps 40% of referrals;some of these cases are already known toservices, and some will not require treatment;about one-quarter may require furtherotological management including surgery; these estimates will have wide confidenceintervals
● there is no evidence that the SES is a bettersource of referrals of more severe and persistentcases of OME than reactive GP referrals,although data with a more rigorous samplingframe and prospective analysis are required toconfirm that there is evidence for no effect
Health Technology Assessment 2007; Vol. 11: No. 32
83
© Queen’s Printer and Controller of HMSO 2007. All rights reserved.

● at least six of the accepted criteria for ascreening programme for OME are currentlynot met (Appendix 1).
Conclusions: closing commentIn 1987, Stewart-Brown and Haslum3 publishedthe results of a survey of national practice (inEngland and Wales) with regard to screening forhearing impairment in childhood. In it, theycommented that “the number of times thatchildren were screened at school variedconsiderably … the hearing level at which childrenwere referred after sweep audiometry variedamong districts … only 73 [out of 165] couldreport the referral rate … very few districts werecollecting the sort of data that would allow themto make even the most rudimentary assessment oftheir screening programmes, far less anyevaluation of cost consequences orbenefits … secretory otitis media fulfils few of thecriteria that should be met before a screeningprogramme can be considered likely to be eithereffective or ethical”. While a considerable numberof lead clinicians for the SES have tried toimplement an improved programme in the face ofresource constraints and competing priorities, theoverall similarity between the present team’sfindings in 2005 and Stewart-Brown and Haslum’sin 19843 is striking. They proceeded to commenton the need for well-controlled studies tounderpin policy changes; two decades on, the lackof a good-quality evidence base to drive change inthis area remains a serious problem.
Implications for practiceThere is some evidence that significant numbersof children with permanent hearing impairmentremain to be identified at school entry. There isevidence that the pure tone sweep test if properlyimplemented as a screen can have reasonablelevels of sensitivity and specificity as a route toidentification of these children. Although there islittle evidence on the effectiveness of the SES,there is also little evidence to judge whether it isineffective. The implications of the conclusionssummarised in the section ‘Conclusions’ (p. 82)are that services already implementing the SES(the overwhelming majority in the UK) shouldcontinue to do so, pending later evidence-basedpolicy decisions (see in the next section), but thatthey should make every effort to implement aclear test and screen protocol, and that theyshould audit the screen performance for cases ofPCHI not already known to services. However, thecase for using the SES as a route for finding
children with OME suitable for intervention isweak (see Appendix 1).
Recommendations for futureresearchIt is evident that in most areas of the UK there areservice leads who value the SES, and who head upservices that deliver a screen in the main based onthe pure tone sweep test to most children in publiceducation. However, test and screen protocols varybetween districts, there is little evidence of explicitquality assurance procedures, and datamanagement systems are generally poor or non-existent, so that data on screen performance, letalone longer term outcomes, are largely absent.
The public health context in which the SES isdelivered is changing significantly, and by about2010 almost all babies born in the UK will haveundergone newborn hearing screening. Not allPCHI will be identified by newborn screening:late-onset and acquired impairments, childrenmoving in who have not had a newborn screenand cases not picked up by the newborn screen(largely mild and minimal hearing impairments)will remain to be identified. The justifiable meansby which such cases could be identified includeparental and professional concern, formalsurveillance of some kind at defined ages, targetedschool entry screening and universal school entryhearing screening. The evidence required to makepolicy decisions between such alternatives does notexist. The following recommendations for futureresearch and audit are made with the overall aimof being able to make evidence-based policydecisions in or around 2012, when all school entrycohorts will have had newborn hearing screening.
A priority need is for the establishment of a single,agreed national protocol for those servicesdelivering the SES to make future studies andfuture audit of screen performance more directlycomparable. On the basis of the evidence, such aprotocol should be based on detection of puretones. It is known that the greater the level ofpermanent hearing impairment, the poorer thequality of life is likely to be, while the lower thepass threshold for the screening test, the poorerthe test and screen specificity. Furthermore, PCHItends to be worse in the higher frequencies, andthe testing of low and mid-frequencies in theconditions under which the SES has to beperformed is particularly subject to noiseinterference. Thus, there are persuasive argumentsfor a single, high-frequency (4 kHz) pure tone
Summary and conclusions
84

detection test set at a level likely to be mosteffective and efficient (25 dB HL). Although thecase for screening for OME at school entry is weak(see Appendix 1), there may be persistent orsevere cases who remain to be identified at schoolentry and who would benefit from surgicalintervention; a high-frequency 25 dB HL criterionfor referral would, as an incidental benefit,increase the positive predictive value for suchcases.
Alongside an agreed national protocol must gosystems for data monitoring and quality assuranceso that robust data on screen accuracy andeffectiveness can be collected. Such systems are inplace for newborn hearing screening, and R&D isrequired to develop a single data system as part ofa national plan around screening for childhoodhearing impairment and paediatric audiologyservices.
There is a need to establish with greater certaintythe prevalence of permanent mild and minimalhearing impairment at school entry that could beidentified by a suitable quality-assured screenprotocol, and to confirm the prevalence andseverity distribution of congenital unilateralhearing impairment.
Comparative trials are needed to compare theeffectiveness, efficacy and efficiency of alternativeapproaches to the identification of permanenthearing impairment postnewborn screen.
Specifically, a comparison of reactive services, aformal surveillance procedure between fourth andfifth birthdays,7 targeted screening between fourthand fifth birthdays, and universal screening atschool entry age would establish the necessaryevidence for policy decisions. Targeted screeningwould be based on children who had not receivedor completed newborn screening, childrenattending child development centres, childrencoming from families with a history of permanentchildhood deafness, and children who havesuffered bacterial meningitis or a childhood viralillness leading to doubt about their hearing.
The lack of prospective controlled studies on theeffectiveness of hearing screening and subsequentinterventions in terms of later outcomes forchildren with permanent mild, minimal andunilateral hearing impairment identified at schoolentry represents a major gap in the evidence base.However, it is not clear that such studies wouldtake priority over better data on alternativeprotocols, uptake, yield and diagnostic accuracy;furthermore, there are real problems in identifyingappropriate outcome measures that have sufficientsensitivity.
The distribution of detection thresholds for puretones in the population at school entry, and howdifferent cut-off criteria would relate to measuresof hearing disability (Wilson and Jungner criterionno. 538), are not known. Research is needed toestablish these.
Health Technology Assessment 2007; Vol. 11: No. 32
85
© Queen’s Printer and Controller of HMSO 2007. All rights reserved.


We thank Professor Mark Haggard (MulticentreOtitis Media Study Group, the University of
Cambridge), who has acted as an expert advisorfor the project and has provided invaluableguidance and input on all aspects of the study. Wealso thank the members of our advisory committeefor their contribution: Ms Susan Hamrouge(Speech and Language Therapist and EducationalPsychologist), Mr Andrew Ford (parent of a deafchild) and Mr Kevin Gibbin (ENT ConsultantSurgeon). Sincere thanks to all the SES serviceleads who completed and returned aquestionnaire. We thank Anne Shafe and SarahArmstrong (Medical Statisticians, Trent Researchand Development Support Unit) for statisticaladvice in Chapter 3, Dr Gill Painter (ConsultantCommunity Paediatrician – Audiology, CentralManchester PCT) for help and advice in pilotingthe questionnaire and her knowledge of the schoolhealth system, Ms Sue Bayliss (Department ofEpidemiology and Public Health, the University ofBirmingham) for designing the literature searchesused in the systematic review, Dr Martin Connock(Department of Epidemiology and Public Health,the University of Birmingham) for the preparationof the summary ROC curve for the systematicreview, and Mrs Tracey Keeble and Mrs JulieRobinson for the excellent administrative andsecretarial support they have provided.
Contribution of authorsJohn Bamford (Professor, Specialist in PaediatricAudiology and Deaf Education) led the research
team. Heather Fortnum (Associate Professor,Epidemiologist) led the survey and associatedanalyses of current practice and coordinated theediting of the final report. Kirsty Bristow(Research Assistant, Epidemiologist) conductedthe survey and analyses of current practice, andcoordinated effort across the team. Jenny Smith(Research Assistant, Epidemiologist) conductedthe reviews of accuracy and effectiveness ofscreening tests, and coordinated the editing of thedraft report. Georgios Vamvakas (ResearchAssistant, Health Economist) conducted the healtheconomics reviews, modelling and analyses. LindaDavies (Reader, Heath Economist) led the healtheconomics reviews, modelling and analyses. RodTaylor (Reader, Health Statistician) led the reviewsof accuracy and effectiveness of screening tests.Pete Watkin (Consultant Community Paediatrician,Physician in Paediatric Audiology) led the datacollection and analyses of the Waltham Foreststudies. Sarita Fonseca (Consultant CommunityPaediatrician, Physician in Paediatric Audiology)advised on the survey of current practice andprovided a direct link with the previous recentstudy of current practice. Adrian Davis (Professor,Director of NHSP, Epidemiologist) advised on allaspects of the research and provided a direct linkwith the newborn hearing screening programme.Sally Hind (Senior MRC Scientist, DevelopmentalPsychologist) advised on the survey of currentpractice. All authors contributed to writing andediting.
Health Technology Assessment 2007; Vol. 11: No. 32
87
© Queen’s Printer and Controller of HMSO 2007. All rights reserved.
Acknowledgements


1. Ewing A. The sweep frequency method of makingscreening tests of the hearing of school children.BMJ 1955;4904:41–2.
2. Court SDM. Fit for the Future. The Report of theCommittee on Child Health Services. London: HMSO;1976.
3. Stewart-Brown S, Haslum MN. Screening forhearing loss in childhood: a study of nationalpractice. BMJ 1987;6584:1386–8.
4. Haggard M. Research and development of effectiveservices for hearing-impaired people. London:Nuffield Provincial Hospitals Trust; 1993.
5. Davis A, Bamford J, Wilson I, Ramkalawan T,Forshaw M, Wright S. A critical review of the roleof neonatal hearing screening in the detection ofcongenital hearing impairment. Health TechnolAssess 1997;1(10).
6. Fonseca S, Forsyth H, Neary W. School hearingprogramme in the UK: practice and performance.Arch Dis Child 2005;90:154–64.
7. Hall D, editor. Health for all children. 4th ed.Oxford: Oxford University Press; 2003.
8. McCormick B. Screening for hearing impairment inyoung children. London: Croom Helm; 1988.
9. Bamford J, Uus K, Davis A. Screening for hearingloss in childhood: issues, evidence and currentapproaches in the UK. J Med Screen 2005;3:119–24.
10. Bamford J, Ankjell H, Crockett R, Marteau T,McCracken W, Parker D, et al. Evaluation of thenewborn hearing screening programme (NHSP) inEngland: Report of the evaluation of the firstphase of implementation of the NHSP. 2006;National Library for Health.
11. Yoshinga-Itano C, Sedley A, Coulter DK, Mehl AL.Language of early- and later-identified childrenwith hearing loss. Pediatrics 1998;102:1161–71.
12. Fortnum HM, Summerfield AQ, Marshall DH,Davis AC, Bamford JM. Prevalence of permanentchildhood hearing impairment in the UnitedKingdom and implications for universal neonatalhearing screening: questionnaire basedascertainment study. BMJ 2001;323:536–40.
13. Fortnum HM. Epidemiology of permanentchildhood hearing impairment: implications forneonatal hearing screening. J Audiol Med2003;1:155-64.
14. Bess FH, Dodd-Murphy J, Parker RA. Childrenwith minimal sensorineural hearing loss:prevalence, education performance and functionalstatus. Ear Hear 1998;19:339–54.
15. Haggard MP, Hughes E. Screening children’s hearing.London: HMSO; 1991.
16. Zielhuis GA, Straatman H, Rach GH, van den Broek P. Analysis and presentation of dataon the natural course of otitis media with effusionin children. Int J Epidemiol 1990;19:1037–44.
17. Midgley EJ, Dewey C, Pryce K, Maw AR. Thefrequency of otitis media with effusion in Britishpre-school children: a guide for treatment. ClinOtolaryngol 2000;25:485–91.
18. Butler CC, van der Linden MK, MacMillan HL,van der Wouden JC. Should children be screenedto undergo early treatment for otitis media witheffusion? A systematic review of randomized trials.Child Care Health Dev 2003;29:425–32.
19. Polnay L. Health needs of school age children: report ofa joint working party. London: British PaediatricAssociation; 1995.
20. Henderson RE, Newton N. Is a universal schoolentry hearing screen worthwhile? Ambulatory ChildHealth 2000;6:247–52.
21. Tharpe AM, Bess FH. Minimal, progressive andfluctuating hearing loss in children: characteristics,identification and management. Pediatr Clin N Am1999;46:65–78.
22. Smith WR, Pither RE. Long term follow-up ofchildren with mild hearing impairment pre and postintervention. J BATOD 1993;17(4):99–103.
23. Directory of Community Nursing 2004/2005.Chichester: Professional, Managerial andHealthcare Publications; 2004.
24. Independent Schools Council. URL: www.isc.co.uk.Accessed May 2006.
25. Bess FH, Klee T, Cuthbertson JL. Identificationassessment and management of children withunilateral sensorineural hearing loss. Ear Hear1986;7:43–5.
26. Watkin PM. Neonatal otoacoustic emissionscreening and the identification of deafness. ArchDis Child Fetal Neonatal Ed 1996;74:F16–25.
27. Watkin PM. Outcomes of neonatal screening forhearing loss by otoacoustic emission. Arch Dis ChildFetal Neonatal Ed 1996;75:F158–68.
Health Technology Assessment 2007; Vol. 11: No. 32
89
© Queen’s Printer and Controller of HMSO 2007. All rights reserved.
References

28. Watkin PM, Baldwin M. Confirmation of deafnessin infancy. Arch Dis Child 1999;81:380–9.
29. Kennedy C, McCann D, Campbell MJ, Law C,Mullee M, Petrou S, et al. Language ability afterearly detection of permanent childhood hearingimpairment. N Engl J Med 2006; 353:2131–41.
30. Watkin PM, McCann D, Law C, Petrou S,Stevenson J, Worsford S, et al. Language ability inchildren with permanent hearing impairment: theinfluence of early management and familyparticipation. Pediatrics 2007; in press.
31. Watkin PM, Baldwin M, Laoide S. Parentalsuspicion and identification of hearingimpairment. Arch Dis Child 1990;65:846–50.
32. Watkin PM. The age of identification of childhooddeafness – improvements since the 1970s. PublicHealth 1991;105:303–12.
33. Watkin PM, Baldwin M, McEnery G. Neonatal atrisk screening and the identification of deafness.Arch Dis Child 1991;66:1130–5.
34. Watkin PM. Controlling the quality of universalneonatal hearing screens. Public Health1999;113:171–6.
35. Watkin P, Hasan J, Baldwin M, Ahmed M.Neonatal hearing screening: have we taken theright road? Results from a 10-year targeted screenlongitudinally followed up in a single district.Audiol Med 2005;3:175–84.
36. Sutton G, Rowe S. Risk factors for childhooddeafness in the Oxford region. Br J Audiol1997;31:39–54.
37. Peckham CS, Stark O, Dudgeon JA, Martin JA,Hawkins G. Congenital cytomegalovirus infection:a cause of sensorineural hearing loss. Arch DisChild 1987;62:1233–7.
38. UK National Screening Committee. Criteria forappraising the viability effectiveness and appropriatenessof a screening programme. URL: http://www.nsc.nhs.uk/pdfs/criteria.pdf. Accessed May 2006.
39. Sackett DL, Haynes RB, Tugwell P, Guyatt GH.Clinical epidemiology: a basic science for clinicalmedicine. Philadelphia, PA: Lippincott Williams &Wilkins; 1991.
40. Whiting P, Rutjies AW, Dinnes J, Reitsma J,Bossuyt PM, Kleijnen J. Development andvalidation of methods for assessing the quality ofdiagnostic accuracy studies. Health Technol Assess2004;8(25).
41. Oxman AD. User’s guide to the medical literature.VI How to use an overview. JAMA1994;272:1367–71.
42. Whiting P. The development of QUADAS: a toolfor the quality assessment of studies of diagnosticaccuracy included in systematic reviews. BMC MedRes Methodol 2003;3:25.
43. Barlow J, Stewart-Brown S, Fletcher J. Systematicreview of the school entry medical examination.[review]. Arch Dis Child 1998;78:301–11.
44. New Zealand Health Technology Assessment.Screening programmes for the detection of otitismedia with effusion and conductive hearing loss inpre-school and new entrant school children: acritical appraisal of the literature [structuredabstract]. NZ Health Technol Assess 1998;3(61).
45. Zielhuis GA, Rach GH, van der Broek P. Screeningfor otitis media with effusion in preschoolchildren. Lancet 1989;i:311–14.
46. Feldman W, Sackett B, Milner RA, Gilbert S.Effects of preschool screening for vision andhearing on prevalence of vision and hearingproblems 6–12 months later. Lancet1980;ii:1014–16.
47. Pirozzo S, Papinczak T, Glasziou P. Whisperedvoice test for screening for hearing impairment inadults and children: systematic review. BMJ2003;327:967.
48. Groen JJ. Pure tone audiometry and whisperedvoice test. Conformities and differences in testresults. ORL J Otorhinolaryngol Relat Spec 1973;35:65–70.
49. Dempster JH, Mackenzie K. Clinical role of free-field voice tests in children. Clin Otolaryngol1992;17:54–6.
50. Prescott CA, Omoding SS, Fermor J, Ogilvy D. Anevaluation of the ‘voice test’ as a method forassessing hearing in children with particularreference to the situation in developing countries.Int J Pediatr Otorhinolaryngol 1999;51:165–70.
51. Olusanya B. Early detection of hearingimpairment in a developing country: whatoptions? Audiology 2001;40:141–7.
52. Pang-Ching G, Robb M, Heath R, Takumi M.Middle ear disorders and hearing loss in nativeHawaiian preschoolers. Language 1995;26:33–8.
53. Lyons A, Kei J, Driscoll C. Distortion productotoacoustic emissions in children at school entry: acomparison with pure-tone screening andtympanometry results. J Am Acad Audiol2004;15:702–15.
54. Sabo MP, Winston R, Macias JD. Comparison ofpure tone and transient otoacoustic emissionsscreening in a grade school population. Am JOtolaryngol 2000;21:88–91.
55. FitzZaland RE, Zink GD. A comparative study ofhearing screening procedures. Ear Hear 1984;5:205–10.
56. Rodriguez MA, Melguizo-Yepez M. [Screening forhearing disorders in school children of Medellin,Colombia, 1993]. [Spanish]. Salud Publica Mex1994;36:670–2.
References
90

57. Ritchie BC, Merklein RA. An evaluation of theefficiency of the Verbal Auditory Screening forChildren (VASC). J Speech Hear Res 1972;15:280–6.
58. Hamill B. Comparing two methods of preschooland kindergarten hearing screening. J Sch Health1988;58:95–7.
59. Roush J, Drake A, Sexton JE. Identification ofmiddle ear dysfunction in young children: acomparison of tympanometric screeningprocedures. Ear Hear 1992;13:63–9.
60. Square R, et al. An alternative to impedancescreening: unoccluded frontal bone conductionscreening. Journal of Childhood CommunicationDisorders 1985;8:123–30.
61. Nienhuys TG, Boswell JB, McConnel FB. Middleear measures as predictors of hearing loss inAustralian aboriginal schoolchildren. Int J PediatrOtorhinolaryngol 1994;30:15–27.
62. Roush J, Tait CA. Pure-tone and acousticimmittance screening of preschool-aged children:an examination of referral criteria. Ear Hear1985;6:245–50.
63. Hammond PD, Gold MS, Wigg NR, Volkmer RE.Preschool hearing screening: evaluation of aparental questionnaire. J Paediatr Child Health1997;33:528–30.
64. Schell NB. Report on Nassau County Pilot studyon preschool screening program for hearing. NewYork State J Med 1970;70:55.
65. Hind SE, Atkins RL, Haggard MP, Brady D,Grinham G. Alternatives in screening at schoolentry: comparison of the Childhood Middle EarDisease and Hearing Questionnaire (CMEDHQ)and the pure tone sweep test. Br J Audiol1999;33:403–14.
66. Maragno C, Teatini GP. [Measurement of theefficacy of the Rimondini–Rossi test foraudiometric screening] [Italian]. ActaOtorhinolaryngol Ital 1983;3:483–90.
67. British Society of Audiology. Descriptors for puretone audiograms. Br J Audiol 1988;22:123.
68. Abou Haidar L, Blond MH, Chautemps D, PloyetMJ, Lescanne E. [‘Audio 4’: a simple and quickspeech audiometry test for moderate hearing lossscreening in four-year-old children] [French]. ArchPediatr 2005;12:264–72.
69. Gomes M, Lichtig I. Evaluation of the use of aquestionnaire by non-specialists to detect hearingloss in preschool Brazilian children. Int J RehabilRes 2005;28:171–4.
70. Holtby I, Forster DP, Kumar U. Pure toneaudiometry and impedance screening of schoolentrant children by nurses: evaluation in apractical setting. J Epidemiol Community Health1997;51:711–15.
71. McCurdy JA, Goldstein JL, Gorski D. Auditoryscreening of preschool-children with impedanceaudiometry – comparison with pure-toneaudiometry – detecting otologic disease prior toonset of hearing-loss. Clin Pediatr 1976;15:436–41.
72. Nozza RJ, Sabo DL, Mandel EM. A role forotoacoustic emissions in screening for hearingimpairment and middle ear disorders in school-age children. Ear Hear 1997;18:227–39.
73. Orlando MS, Frank T. Audiometer andAudioScope hearing screening compared withthreshold test in young children. J Pediatr1987;110:261–3.
74. Prescott CA, Omoding SS, Fermor J, Ogilvy D. Anevaluation of the ‘voice test’ as a method forassessing hearing in children with particularreference to the situation in developing countries.Int J Pediatr Otorhinolaryngol 1999;51:165–70.
75. Skurr BA, Jones DL. Testing the hearing level ofschoolchildren: comparison of several currentlyused screening techniques. Med J Aust 1981;2:248–9.
76. Holtby I, Forster DP, Kumar U. Pure toneaudiometry and impedance screening of schoolentrant children by nurses: evaluation in apractical setting. J Epidemiol Community Health1997;51:711–15.
77. National Institute for Clinical Excellence. Guide tothe methods of technology appraisal No. 515. London:National Institute for Clinical Excellence; 2004.
78. Vanoli A, Drummond M. Improving access to cost-effectiveness information for health care decision making:the NHS Economic Evaluation Database. CRD ReportNo. 6. 2nd ed. York: Centre for Review andDissemination; 2001.
79. Gold MR, Siegel JE, Russell LB, Weinstein MC.Cost effectiveness in health and medicine. New York:Oxford University Press; 1996.
80. Ahmed AU, Curley JWA, Newton VE, Mukherjee D.Hearing aids versus ventilation tubes in persistentotitis media with effusion: a survey of clinicalpractice. J Laryngol Otol 2001;115:274–9.
81. Mills RP, McKerrow WS. Management ofchildhood otitis media with effusion by Scottishotolaryngologists. J R Coll Surg Edinb2000;45:321–5.
82. Niskar AS, Kieszak SM, Holmes A, Esteban E,Rubin C, Brody DJ. Prevalence of hearing lossamong children 6 to 19 years of age: the thirdnational health and nutrition examination survey.JAMA 1998;279:1071–5.
83. Curtis L, Netten A. Unit costs of health and socialcare. Canterbury: Personal Social Services ResearchUnit; 2005.
84. UK Cochlear Implant Study Group. UK CochlearImplant Study Group Criteria for candidacy for
Health Technology Assessment 2007; Vol. 11: No. 32
91
© Queen’s Printer and Controller of HMSO 2007. All rights reserved.
unilateral cochlear implantation in postlinguallydeafened adults. II: Cost effectiveness analysis. EarHear 2004;25:336–60.
85. Dolan P, Gudex C, Kind P, William A. A social tarifffor EuroQuol: results from a UK general populationsurvey. Centre for Health Economics DiscussionPaper 138. 1995; York: University of York.
86. Barton GR, Bankart J, Davis AC, Summerfield QA.Comparing utility scores before and after hearingaid provision. Appl Health Econ Health Policy2004;3:103–5.
87. Drummond M, O’Brien B, Stoddart GL, Torrance GW. Methods for economic evaluation ofhealth care programmes. Oxford: Oxford UniversityPress; 1997.
88. Driscoll C, Kei J, McPherson B. Transient evokedotoacoustic emissions in 6-year-old school children:a normative study. Scand Audiol 2000;29:103–10.
89. Holtby I, Forster DP. Evaluation of pure toneaudiometry and impedance screening in infantschoolchildren. J Epidemiol Community Health1992;46:21–5.
90. Butler CC, van-der-Linden MK, MacMillan H, van der Wouden JC. Screening children in the firstfour years of life to undergo early treatment forotitis media with effusion. Cochrane Database ofSystematic Reviews (Issue 2). Chichester: John Wiley& Sons; 2003.
91. Fria TJ. Hearing acuity of children with otitismedia with effusion. Arch Otolaryngol1985;111:10–16.
92. NHS. Agenda for change: NHS terms and conditions ofservice handbook. January 2005. URL:www.nhsemployers.org/pay-conditions/pay-conditions-707.cfm. Accessed April 2006.
93. Department for Education and Skills. Statistics ofeducation. 2005. URL: http//:www.dfes.gov.uk.Accessed April 2006.
94. Department for Education and Skills. Children inneed in England: results of a survey of activity andexpenditure as reported by local authority socialservices' children and families teams for a surveyweek in February 2005. National Statistics2005;(vweb 01-2005). http://www.dfes.gov.uk/rsgateway/DB/VOL/v000647/vweb02-2006.pdf.Accessed May 2006.
95. Department of Health. NHS Reference Costs 2003 and National Tariff 2004. URL:http://www.dh.gov.uk/PolicyAndGuidance/OrganisationPolicy/FinanceAndPlanning/NHSReferenceCosts/fs/en. Accessed April 2006.
96. Rawlins MD, Culyer AJ. National Institute forClinical Excellence and its value judgments. BMJ2006;329:224–7.
97. Rosen J, Johnson C, Wilkinson H. School-entryhearing screening: an audit of referrals in a three year period. Aust NZ J Audiol 2004;26:142–7.
98. Rovers MM, Black N, Browning GG, Maw R,Zielhuis GA, Haggard MP. Grommets in otitismedia with effusion: an individual patient datameta-analysis. Arch Dis Child 2005;90:480–5
99. MRC Multi-centre Otitis Media Study Group. Riskfactors for persistence of bilateral otitis media witheffusion. Clin Otolaryngol 2001;26:147–56
100. Rovers MM, Straatman H, Ingels K, van der WiltGJ, van den Broek P, Zielhuis GA. The effect of ventilation tubes on language development in infants with otitis media with effusion: a randomised trial. Pediatrics 2000;106:E42.
101. Paradise JL, Dollaghan CA, Campbell TF,Feldman HM, Bernard BS, Colborn DK, et al.Otitis media and tympanostomy tube insertionduring the first three years of life: developmentaloutcomes at the age of four years. Pediatrics2003;112:265–77.
References
92

Health Technology Assessment 2007; Vol. 11: No. 32
93
© Queen’s Printer and Controller of HMSO 2007. All rights reserved.
Appendix 1
Screening at school entry for childhood hearing impairment: an appraisal against National Screening
Committee criteria
Screening for permanent childhood hearing impairment (June 2006)
Criteria Supporting evidence
The condition
1. The condition should be animportant public healthproblem
Bilateral PCHI can have a devastating impact on communication skills (Conrad, 1979),educational attainment (Wood et al., 1986), and quality of life (Gregory, 1995; Cheng et al., 2000), with a high cost to society (Mohr et al., 2000).
Unilateral hearing impairment would be expected to affect auditory perception in variouspredictable ways (e.g. poor localisation of sound sources, difficulty in noisy or reverberantenvironments such as schools), and there is some evidence of detrimental effects onacademic progress (e.g. Bess et al., 1998)
Authors’ summary opinion: satisfied
2. (i) The epidemiology of thecondition should beknown
(ii) The natural history ofthe condition should beunderstood
(iii) There should be arecognised latent periodor early symptomaticstage
No national register of hearing-impaired children exists for the UK, and accurateestimates of the prevalence of PCHI and of its profile across all ages and all degrees ofimpairment are unavailable
PCHI of a moderate degree or greater (i.e. detection thresholds >40 dB HL averagedacross 0.5, 1, 2 and 4 kHz) is present at birth at a rate of about 1.6 per 1000 live births,of which approximately 1.0 in 1000 are bilateral and 0.6 in 1000 are unilateralimpairments (Davis et al., 1997; Bamford et al., 2006). In terms of incidence, this meansthat in the UK about 800 children per year will be born with permanent bilateral hearingimpairment of a moderate or greater degree, and about 500 per year will be born withunilateral hearing impairment (i.e. hearing within normal limits in one ear, hearingimpairment of moderate or greater degree in the other ear)
There is good evidence that the prevalence of permanent bilateral moderate or greaterhearing impairment increases through the first decade of childhood (Fortnum et al., 2001;Fortnum, 2003). It is possible that the prevalence of bilateral moderate or greaterimpairment reaches 2 in 1000 by the age of about 9 years. If permanent mild hearingimpairments are included, evidence from retrospective ascertainment studies in thisreview suggests that by school entry the prevalence is around 3.5 in 1000.
There are four situations where children with permanent hearing impairment may not beidentified by a screening test within a few days of birth:
● Some children will have no impairment at birth, but will acquire the impairment later intheir life as a result of some traumatic event such as infection (usually bacterialmeningitis, Fortnum, 1992), head injury (Zimmerman et al., 1993), ototoxic therapy(Casano et al., 1999) or chemotherapy (Littman et al., 1998; Berg et al., 1999).
● Some children may have an impairment at birth, but of a severity insufficient to bedetected by the newborn screening procedures. As the child grows this mildimpairment may represent a significant disabling condition in itself, or the impairmentmay progress to a greater severity (Hayes and Dreith, 2000). The causes of progressiveimpairments include hereditary hearing loss and syndromal associations such as Alport,Waardenburg type II and Alström (Gorlin et al., 1995; Zwirner and Wilichowski, 2001),infectious diseases (Williamson et al., 1992), anatomical malformations (Zalzal et al.,1995; Shetty et al., 1997), perinatal events and treatments (Fujiwaka et al., 1995; Laskyet al., 1998) and ototoxic drugs (Pasic and Dobie, 1991; Borradori et al., 1997).
continued

Appendix 1
94
Criteria Supporting evidence
● Some children develop genuine late-onset impairment that develops with no obviouscausative factor and hence is not truly acquired (Parker, 1999).
● A fourth group of children contributing to those who may not be identified at birth arethose who should undergo the screen but who do not. Reasons for this at the time ofscreening include early discharge and/or parental refusal, but children who migrate intoan area or country implementing a neonatal screening programme from an area/countrywhich does not, also fall into this group.
Children in all four of these categories comprise those who require identificationpostneonatal screen and who will need some form of follow-up to be established
The evidence on permanent unilateral hearing loss is more limited. Although it appearsfrom NHSP data that the prevalence at birth is about 0.6 in 1000, it is not knownwhether there are significant numbers of later onset cases, whether some of the lossesare progressive, and whether there is a tendency for congenital or postnatal unilateralhearing loss to progress to bilateral loss
PCHI of whatever cause does not improve. It may remain stable or worsen (progressive)
There is no latent period or early symptomatic stage in PCHI
Authors’ summary opinion: satisfied
3. All cost-effective primaryprevention interventionsshould have beenimplemented as far aspracticable
Primary prevention includes immunisation for conditions that are known to causepermanent hearing impairment, both prenatally and postnatally (e.g. rubella, mumps,meningitis); reduction in the use of, and monitoring of levels of, ototoxic antibiotics suchas gentamycin in the neonatal period; and genetic counselling for people with affectedchildren or at higher risk of having an affected child
Authors’ summary opinion: satisfied
The test
4. There should be a simple,safe, precise and validatedscreening test
The procedures for the SES vary in their implementation, but all are relatively simple.There is no known danger to the child or to the screener in performing the test. Limitedquality evidence suggests that the test has high sensitivity and specificity for full PTA(Orlando and Frank, 1987; FitzZaland and Zink, 1984; Holtby et al.. 1997; Sabo et al.,2000)
There has until recently been a widespread if implicit consensus that “the pure tonesweep test has value educationally and as a safety net to catch any deficiencies of theearlier screening system in the overall public health provision” (Haggard, 1993), a positionbroadly endorsed by Hall (2003)
The review of current practice indicated that all but 12.2% of respondents operate auniversal school entry screen and use the pure tone sweep test; however, the protocolsused are unacceptably variable
Authors’ summary opinion: satisfied
5. The distribution of testvalues in the populationshould be known and asuitable cut-off level definedand agreed
There are no published data on population values for pure tone sweep audiometry. A cut-off level has not been defined and agreed and varies across the national provision
Population data on pure tone audiometric levels are not available for children of schoolentry age; adult norms are used. This may have marginal effects on case identification ofmild and minimal hearing impairments, but not on moderate and greater impairments
Authors’ summary opinion: not satisfied
6. The test should beacceptable to the population
The pure tone sweep test and PTA are well-established tests and appear to be acceptableto the population (children) and their parents, although no data have been published thataddress this issue
Authors’ summary opinion: satisfied
continued

Health Technology Assessment 2007; Vol. 11: No. 32
95
© Queen’s Printer and Controller of HMSO 2007. All rights reserved.
Criteria Supporting evidence
7. If the test is for mutationsthe criteria used to selectsubset of mutations to becovered by screening shouldbe clearly set out
Although hearing impairment may be caused by inherited or novel mutations, thisscreening test is not designed to identify them. Further diagnostic evaluations may includeselective mutation screening/testing
Authors’ summary opinion: not relevant
8. There should be an agreedpolicy on the furtherdiagnostic investigation ofindividuals with a positivetest and on the choicesavailable to those individuals
In 1976 the Court Report recommended that hearing screens be carried out at leasttwice in school (Court, 1976). However, there was no nationally agreed protocol for thescreen, and implementation thus varied in small but possibly important details acrossservices
Guidelines on diagnostic investigation and subsequent treatment choices have beendeveloped by the British Society of Audiology in collaboration with the National DeafChildren’s Society (NDCS, 2006). For moderate and greater bilateral hearing impairmentsin school-age children, diagnostic procedures are well established and reliable whenperformed by trained paediatric audiologists. Intervention options include amplification(hearing aids), communication advice, educational support and social care support. Formild and unilateral hearing impairment, diagnostic procedures are more challenging,especially if transient middle ear conditions are also present, and require good-qualitypaediatric audiology services and paediatric audiologists, of which there is a nationalshortage. Intervention options are similar to those with more severe impairments, butevidence on the cost-effectiveness of these options is largely missing
Authors’ summary opinion: partially satisfied
The treatment
9. There should be an effectivetreatment or interventionfor patients identifiedthrough early detection
It has long been believed that earlier identification of hearing impairment must lead tobetter outcomes, and there is now reliable evidence that this is so in the domains ofcommunication, educational achievement and quality of life (Davis et al., 1997; Yoshinago-Itano et al., 2000; Moeller, 2000). Few people now disagree with the statement thatidentification of congenital impairments in the first few months of life and consequenthabilitation is desirable. For late-onset, progressive and otherwise not previously knownimpairments identified at school entry age, evidence on the effectiveness of theinterventions (provision of hearing aids and regular follow-up with appropriaterehabilitative support particularly in education) is absent. It is reasonable to assume thatthe intervention will be effective for moderate and greater bilateral impairments; moreevidence is required about intervention for mild, minimal and unilateral impairments.However, since these could be at risk for worsening impairment, identification andmonitoring is arguably desirable as a minimum
Authors’ summary opinion: satisfied
10. There should be agreedevidence-based policiescovering which individualsshould be offeredtreatment and theappropriate treatment tobe offered
There is still debate over the lower level of hearing impairment for which provision ofhearing aids is beneficial. More evidence is required with respect to interventions for mild,minimal and unilateral impairments identified at school age. The evidence for the type andextent of intervention for children with moderate and greater bilateral impairments isrelatively clear
Authors’ summary opinion: partially satisfied
11. Clinical management of thecondition and patientoutcomes should beoptimised by all healthcareproviders prior toparticipation in a screeningprogramme
There is evidence from the NHSP (www.nhsp.info) that the quality of paediatric audiologyservices in the UK is unacceptably variable. This is likely to be a resource and trainingissue and is receiving attention
Authors’ summary opinion: partially satisfied
continued

Appendix 1
96
Criteria Supporting evidence
12. There should be evidencefrom high-quality RCTs thatthe screening programmeis effective in reducingmortality and morbidity
There is no evidence from high-quality RCTs that the screening programme is effective inreducing morbidity
Authors’ summary opinion: not satisfied
13. There should be evidencethat the completescreening programme(test, diagnosticprocedures,treatment/intervention) isclinically, socially andethically acceptable tohealth professionals andthe public
Screening and intervention for childhood hearing impairment are clinically, socially andethically acceptable to all health professionals concerned with the issue and to most of thepublic. The majority of health professionals who took part in the survey of currentpractice were strongly in favour of the SES. There is an important minority of the Deafcommunity who subscribe to a social/cultural model of deafness and who do not supportsome of the ‘corrective’ interventions for severe/profound hearing impairment; however,this does not apply to the mild/moderate levels detected by the SES
Authors’ summary opinion: satisfied
14. The benefit from thescreening programmeshould outweigh thephysical and psychologicalharm (caused by the test,diagnostic procedure andtreatment)
The extent of the beneficial effects of early identification for children with permanenthearing impairment on developmental outcomes in general and communication inparticular has been demonstrated for young preschool infants (e.g. Yoshinaga-Itano et al.,1998); there is no evidence of either benefit or harm associated with the SES
Authors’ summary opinion: partially satisfied
15. The opportunity cost ofthe screening programme(including testing, diagnosisand treatment) should beeconomically balanced inrelation to expenditure onmedical care as a whole
There is no good-quality published evidence of the costs and effectiveness of the screen.The cost-effectiveness modelling carried out suggested that each screen costs £8, and thata universal school entry screen based largely or completely on pure tone sweep tests wasassociated with higher costs and slightly higher QALYs compared with no screen andother screen alternatives; the ICER for such a screen is around £2500 per QALY gained;the range of expected costs, QALYs and net benefits was broad, indicating a considerabledegree of uncertainty
Authors’ summary opinion: partially satisfied
16. There should be a plan formonitoring and managingthe screening programmeand an agreed set of qualityassurance standards
Several reviews (Stewart-Brown and Haslum, 1987; Haggard and Hughes, 1991; Daviset al., 1997; Fonseca et al., 2005) have recommended monitoring and managementstrategies for the SES; the evidence from the survey of current practice suggests thatnone has been widely implemented, and that little has changed since the review ofStewart-Brown and Haslum. There is no national protocol or quality assurance plan
Authors’ summary opinion: not satisfied
17. Adequate staffing facilitiesfor testing, diagnosis,treatment and programmemanagement should beavailable prior to thecommencement of thescreening programme
Resources to perform the screen vary across different implementations of the programmenationally. Many responses to the survey in the current report highlight deficiencies in staffnumbers and experience, facilities and equipment
Authors’ summary opinion: partially satisfied
18. All other options formanaging the conditionshould have beenconsidered (e.g. improvingtreatment, providing otherservices)
Suggestions for universal screens for hearing impairment at different ages have been madeand implemented. The most important is the universal newborn hearing screen, fullyimplemented in England as the NHSP with effect from March 2006
Interventions have remained stable in recent years
Authors’ summary opinion: satisfied

Bamford J, Ankjell H, Crockett R, Marteau T,McCracken W, Parker D, et al. Evaluation of the newbornhearing screening programme (NHSP) in England.2006 URL: http://libraries.nelh.nhs.uk/screening/
Berg AL, Spitzer JB, Garvin JH Jr. Ototoxic impact ofcisplatin in pediatric oncology patients. Laryngoscope1999;109:1806–14.
Bess FH, Dodd-Murphy J, Parker RA. Children withminimal sensorineural hearing loss: prevalence,education performance and functional status. Ear Hear1998,19:339–54.
Borradori C, Fawer C-L, Buclin T, Calame A. Riskfactors for sensorineural hearing loss in preterm infants.Biol Neonate 1997;71:1–10.
British Society of Audiology. Descriptors for pure-toneaudiograms. Br J Audiol 1988;22:123.
Casano RA, Johnson DF, Bykhovskaya Y, Torricelli F,Bigozzi M, Fischel-Ghodsian N. Inherited susceptibilityto aminoglycoside ototoxicity: genetic heterogeneity andclinical implications. Am J Otol 1999;20:151–6.
Cheng AK, Rubin HR, Powe NR, Mellon NK, FrancisHW, Niparko JK. Cost–utility analysis of the cochlearimplant in children. JAMA 2000;284:850–6.
Conrad R. The deaf schoolchild: language and cognitivefunction. London: Harper and Row; 1979.
Court, SDM, editor. Fit for the Future. The Report of theCommittee on Child Health Services. London: HMSO;1976.
Davis A, Bamford J, Wilson I, Ramkalawan T, Forshaw M,Wright S. A critical review of the role of neonatalhearing screening in the detection of congenital hearingimpairment. Health Technol Assess 1997;1(10).
FitzZaland RE, Zink GD. A comparative study ofhearing screening procedures. Ear Hear 1984;5:205–10.
Fonseca S, Forsyth H, Neary W. School hearingprogramme in the UK: practice and performance. ArchDis Child 2005,90:154–6.
Fortnum HM. Hearing impairment after bacterialmeningitis: a review. Arch Dis Child 1992;67:1128–33.
Fortnum HM. Epidemiology of permanent childhoodhearing impairment: implications for neonatal hearingscreening J Audiol Med 2003,1:155–64.
Fortnum HM, Summerfield AQ, Marshall DH, Davis AC,Bamford JM. Prevalence of permanent childhoodhearing impairment in the UK and implications foruniversal neonatal hearing screening: questionnairebased ascertainment study. BMJ, 2001;323:536–40.
Fujikawa S, Yang L, Waffern F, Lerner M. Persistentpulmonary hypertension of the newborn (PPHN)treated with inhaled nitric oxide: preliminary hearingoutcomes. J Am Acad Audiol 1995;8:263–8.
Gorlin RJ, Toriello HV, Cohen MM Jr. Hereditary hearingloss and its syndromes. New York: Oxford University Press;1995.
Gregory S. Deaf children and their families. Cambridge:Cambridge University Press; 1995.
Haggard M, Research in the development of effective servicesfor hearing-impaired people. London: Nuffield ProvincialHospitals Trust; 1993.
Haggard MP, Hughes E. Screening children’s hearing.London: HMSO; 1991.
Hall D, editor. Health for all children. 4th ed. Oxford:Oxford University Press; 2003.
Hayes D, Dreith S. Catastrophic progressive hearing lossin childhood. J Am Acad Audiol 2000;11:300–8.
Holtby I, Forster DP, Kumar U. Pure tone audiometryand impedance screening of school entrant children bynurses: evaluation in a practical setting. J EpidemiolCommunity Health 1997;51:711–15.
Lasky RE, Wiorek L, Becker TR. Hearing loss insurvivors of neonatal extracorporeal membraneoxygenation (ECMO) therapy and high-frequencyoscillatory (HFO) therapy. J Am Acad Audiol1998;9:47–58.
Littman TA, Magruder A, Strother DR. Monitoring andpredicting ototoxic damage using distortion-productotoacoustic emissions: pediatric case study. J Am AcadAudiol 1998;9:257–62.
Moeller MP. Early intervention and languagedevelopment in children who are deaf and hard ofhearing. Pediatrics 2000;106:E43.
Mohr PE, Feldman JJ, Dunbar JL, McConkey-Robbins A,Niparko JK, Rittenhouse RK, et al. The societal costs ofsevere to profound hearing loss in the United States. IntJ Technol Assess 2000;16:1120–35.
NDCS. Quality standards in paediatric audiology, 2006, Vol.3. URL: http://www.ndcs.org.uk/information/professional_focus/professional_publications/health_professionals/quality_3.html
Orlando MS, Frank T. Audiometer and AudioScopehearing screening compared with threshold test inyoung children. J Pediatr 1987;110:261–3.
Parker G. Children with significant hearing loss whopass neonatal hearing screening [MSc thesis].Manchester: University of Manchester; 1999.
Pasic TR, Dobie RA. Cis-platinum ototoxicity inchildren. Laryngoscope 1991;101:985–91.
Sabo MP, Winston R, Macias JD. Comparison of puretone and transient otoacoustic emissions screening in agrade school population. Am J Otol 2000;21:88–91.
Shetty PG, Shroff MM, Kirtane MV, Karmarker SS.Cerebrospinal fluid otorhinorrhea in patients withdefects through the lamina cribosa of the internalauditory canal. Am J Neuroradiol 1997;18:478–81.
Stewart-Brown S, Haslum MN, Screening for hearingloss in childhood: a study of national practice. BMJ1987;294:1386–8.
Health Technology Assessment 2007; Vol. 11: No. 32
97
© Queen’s Printer and Controller of HMSO 2007. All rights reserved.

Williamson WD, Demmler GJ, Percy AK, Catlin FI.Progressive hearing loss in infants with asymptomaticcongenital cytomegalovirus infection. Pediatrics 1992;90:862–6.
Wood D, Wood H, Griffiths A, Howarth I. Teaching andtalking with deaf children. Chichester: John Wiley andSons; 1986.
Yoshinago-Itano C, Coulter D, Thomson V. TheColorado newborn hearing screening project: effects onspeech and language development for children withhearing loss. J Perinatol 2000;20:S132–7.
Yoshinaga-Itano C, Sedey AL, Coulter DK. Language of
early- and later-identified children with hearing loss.Pediatrics 1998;102:1161–71.
Zalzal GH, Tomaski SM, Vezina LG, Bjornsti P,Grundfast KM. Enlarged vestibular aqueduct andsensorineural hearing loss in childhood. Arch OtolaryngolHead Neck Surg 1995;121:2–28.
Zimmerman WD, Ganzel TM, Windmill IM, Nazar GB,Phillips M. Peripheral hearing loss following headtrauma in children. Laryngoscope 1993;103:87–91.
Zwirner P, Wilichowski E. Progressive sensorineuralhearing loss in children with mitochondrialencephalomyopathies. Laryngoscope 2001;111:515–21.
Appendix 1
98
Screening for temporary childhood hearing impairment (June 2006)
Criteria Supporting evidence
The condition
1. The condition should be animportant public healthproblem
Temporary hearing impairment associated with middle ear fluid (OME, sometimes knownas glue ear) is a common condition in childhood, particularly up to about 8 years of age(Casselbrant and Mandel, 2003). The hearing loss may be unilateral or more commonlybilateral, minimal, mild or occasionally moderate in degree; evidence for long-term effectsis sparse
Authors’ summary opinion: partially satisfied
2. (i) The epidemiology ofthe condition should beknown
(ii) The natural history ofthe condition should beunderstood
(iii) There should be arecognised latent periodor early symptomaticstage
The period prevalence (0–8 years) for OME is around 80% (Casselbrant and Mandel,2003), while the point prevalence may be as high as 20% at 2 and 4 years of age (Zielhuiset al., 1990). Risk factors include socio-economic group, passive smoking, bottle feeding,upper respiratory tract infections, craniofacial anomalies and time on the neonatalintensive care unit at birth (Casselbrant and Mandel, 2003)
The natural history of the condition is only partly understood. Spontaneous remission iscommon, with no long-term effects. About 5% of cases exhibit severity of the hearingimpairment and persistence/recurrence of the condition sufficient to cause concern
Hearing impairment is a major symptom, caused by middle ear fluid impeding the passageof acoustic energy from outer to inner ear. The degree of impairment varies with thepresence and viscosity of the fluid
Authors’ summary opinion: satisfied
3. All cost-effective primaryprevention interventionsshould have beenimplemented as far aspracticable
Public health initiatives for children and families with young infants are likely to have animportant effect on the condition
Authors’ summary opinion: satisfied
The test
4. There should be a simple,safe, precise and validatedscreening test
The procedures for the SES vary in their implementation, but all are relatively simple. Thereis no known danger to the child or to the screener in performing the test. Limited qualityevidence suggests that the test has high sensitivity and specificity for full PTA (Orlando andFrank, 1987; FitzZaland and Zink;1984, Holtby et al., 1997; Sabo et al., 2000)
There has until recently been a widespread if implicit consensus that “the pure tonesweep test has value educationally and as a safety net to catch any deficiencies of theearlier screening system in the overall public health provision” (Haggard, 1993), a positionbroadly endorsed by Hall (2003)
continued

Health Technology Assessment 2007; Vol. 11: No. 32
99
© Queen’s Printer and Controller of HMSO 2007. All rights reserved.
Criteria Supporting evidence
The review of current practice indicated that all but 12.2% of respondents operate auniversal school entry screen and use the pure tone sweep test; however, the protocolsused are unacceptably variable
Authors’ summary opinion: satisfied
5. The distribution of testvalues in the populationshould be known and asuitable cut-off level definedand agreed
There are no published data on population values for pure tone sweep audiometry. A cut-off level has not been defined and agreed and varies across the national provision.Evidence on a suitable cut-off level for severity of hearing impairment associated withOME is emerging from the TARGET trial data (Haggard M, University of Cambridge:personal communication, 2006), but the requirement of persistence as a marker ofpotential to benefit requires repeat tests (screen or follow-up)
Population data on pure tone audiometric levels are not available for children of schoolentry age; adult norms are used. This may affect case identification of mild and minimalhearing impairments
Authors’ summary opinion: not satisfied
6. The test should beacceptable to the population
The pure tone sweep test and PTA are well-established tests and appear to be acceptableto the population (children) and their parents, although no data have been published thataddress this issue
Authors’ summary opinion: satisfied
7. If the test is for mutationsthe criteria used to selectsubset of mutations to becovered by screening shouldbe clearly set out
Authors’ summary opinion: not relevant
8. There should be an agreedpolicy on the furtherdiagnostic investigation ofindividuals with a positivetest and on the choicesavailable to those individuals
Further diagnostic investigation to confirm hearing impairment and middle ear fluidinvolves air and bone conduction PTA and acoustic impedance measures, with otoscopyand ENT examination; these are standard procedures.
Authors’ summary opinion: satisfied
The treatment
9. There should be an effectivetreatment or interventionfor patients identifiedthrough early detection
The main treatment option is surgery to drain the fluid and insert ventilation tubes(grommets), possibly with adjuvant adenoidectomy. This restores hearing to normal, butthere is no evidence for longer term benefits in marginal cases (Rovers et al., 2005). Insevere and persistent cases there is emerging evidence for modest benefit from treatmenton physical and developmental measures (Haggard M: personal communication). It isreasonable to argue that reactive services will know of these cases before school entry,but evidence is lacking. Education-based interventions may also be effective in reducingtemporary disability
Authors’ summary opinion: partially satisfied
10. There should be agreedevidence-based policiescovering which individualsshould be offeredtreatment and theappropriate treatment tobe offered
In severe and persistent cases there is emerging but as yet unpublished evidence formodest longer term benefit from surgical intervention, as well as the immediate expectedbenefit of hearing restored to near normal (Haggard M: personal communication). Morework is required on case definition and markers of likely benefit from surgery
Authors’ summary opinion: partially satisfied
continued

Appendix 1
100
Criteria Supporting evidence
11. Clinical management of thecondition and patientoutcomes should beoptimised by all healthcareproviders prior toparticipation in a screeningprogramme
There is considerable practice variability between services in the UK; management andoutcomes therefore vary in ways not related to evidence
Authors’ summary opinion: not satisfied
12. There should be evidencefrom high-quality RCTs thatthe screening programmeis effective in reducingmortality and morbidity
There is no evidence from high-quality RCTs that the screening programme is effective inreducing morbidity (Simpson et al., 2003)
Authors’ summary opinion: not satisfied
13. There should be evidencethat the completescreening programme(test, diagnosticprocedures,treatment/intervention) isclinically, socially andethically acceptable tohealth professionals andthe public
There is no evidence that screening and intervention for childhood hearing impairmentassociated with OME are clinically, socially and ethically unacceptable to healthprofessionals concerned with the issue and to the public. Universal SES is undertaken byall but 12.2% of service-lead respondents in the current nationwide survey of currentpractice; surgical intervention for OME is relatively straightforward and risk free, and isvery common; parental refusal is thought to be rare. Robust evidence for thesestatements is sparse, however
Authors’ summary opinion: partially satisfied
14. The benefit from thescreening programmeshould outweigh thephysical and psychologicalharm (caused by the test,diagnostic procedure andtreatment)
The extent of the beneficial effects of early identification for children with transienthearing impairment on developmental outcomes in general and communication inparticular has not been demonstrated; there is no evidence of either benefit or harmassociated with the SES and treatment for OME, other than evidence of somepostsurgical changes noted to the tympanic membrane in some cases who have repeatventilation tubes (Rosenfeld, 2003)
Authors’ summary opinion: not satisfied
15. The opportunity cost ofthe screening programme(including testing, diagnosisand treatment) should beeconomically balanced inrelation to expenditure onmedical care as a whole
There is no good-quality published evidence of the costs and effectiveness of the screen.The cost-effectiveness modelling carried out suggested that each screen costs £8, and thata universal school entry screen based largely or completely on pure tone sweep tests wasassociated with higher costs and slightly higher QALYs compared with no screen andother screen alternatives; the range of expected costs, QALYs and net benefits wasbroad, indicating a considerable degree of uncertainty
Authors’ summary opinion: satisfied
16. There should be a plan formonitoring and managingthe screening programmeand an agreed set of qualityassurance standards
Several reviews (Stewart-Brown and Haslum, 1987; Haggard and Hughes, 1991; Daviset al., 1997; Fonseca et al., 2005) have recommended monitoring and managementstrategies for the SES; the evidence from the survey of current practice suggests thatnone has been widely implemented, and that little has changed since the review ofStewart-Brown and Haslum. There is no national protocol or quality assurance plan
Authors’ summary opinion: not satisfied.
17. Adequate staffing facilitiesfor testing, diagnosis,treatment and programmemanagement should beavailable prior to thecommencement of thescreening programme
Resources to perform the screen vary across different implementations of the programmenationally. Many responses to the survey in the current report highlight deficiencies in staffnumbers and experience, facilities and equipment. Resources in paediatric otologydepartments are variable, with variable linkage with good-quality paediatric audiology;waiting times for surgery for OME in children are variable
Authors’ summary opinion: partially satisfied
continued

Casselbrant ML, Mandel E. Epidemiology. In RosenfeldRR, Bluestone CD, editors. Evidence-based otitis media.Hamilton and London: BC Decker; 2003. pp. 147–62.
Davis A, Bamford J, Wilson I, Ramkalawan T, ForshawM, Wright S. A critical review of the role of neonatalhearing screening in the detection of congenital hearingimpairment. Health Technol Assess 1997;1(10).
FitzZaland RE, Zink GD. A comparative study ofhearing screening procedures. Ear Hear 1984;5:205–10.
Fonseca S, Forsyth H, Neary W. School hearingprogramme in the UK: practice and performance. ArchDis Child 2005;90:154–64.
Haggard M. Research and development of effective servicesfor hearing-impaired people. London: Nuffield ProvincialHospitals Trust; 1993.
Haggard MP, Hughes E. Screening children’s hearing.London: HMSO; 1991.
Hall D, editor. Health for all children. 4th ed. Oxford:Oxford University Press; 2003.
Holtby I, Forster DP, Kumar U. Pure tone audiometryand impedance screening of school entrant children bynurses: evaluation in a practical setting. J EpidemiolCommunity Health 1997;51:711–15.
Orlando MS, Frank T. Audiometer and AudioScopehearing screening compared with threshold test inyoung children. J Pediatr 1987;110:261–3.
Rosenfeld RR. Tympanostomy tube care andconsequences. In Rosenfeld RR, Bluestone CD, editors.Evidence-based otitis media. Hamilton and London: BCDecker; 2003. pp. 460–81.
Rovers MM, Black N, Browning GG, Maw R, ZielhuisGA, Haggard MP. Grommets in otitis media witheffusion: an individual patient data meta-analysis. ArchDis Child 2005;90:480–5.
Sabo MP, Winston R, Macias JD. Comparison of puretone and transient otoacoustic emissions screening in a grade school population. Am J Otol 2000;21:88–91.
Simpson SA, Thomas CL, van der Linden MK,Macmillan H, van der Wouden JC, Butler C.Identification of children in the first four years of lifefor early treatment for otitis media with effusion.Cochrane Database Syst Rev 2003;(2):CD004163.(Updated: Cochrane Database Syst Rev 2007;(1):CD004163.)
Stewart-Brown S, Haslum MN. Screening for hearingloss in childhood: a study of national practice. BMJ1987;6584:1386–8.
Zielhuis GA, Rach GH, van den Broek P. The naturalcourse of otitis media with effusion in preschoolchildren. Eur Arch Otorhinol 1990;247:215–21.
Health Technology Assessment 2007; Vol. 11: No. 32
Criteria Supporting evidence
18. All other options formanaging the conditionshould have beenconsidered (e.g. improvingtreatment, providing otherservices)
The most common route for referral of children with this condition is via GPs. It is notclear from the published evidence that improvement of reactive services and surveillanceprogrammes in the preschool period (Hall and Elliman, 2003) would not result in theidentification of the children who would benefit from surgery (i.e. those with severe andpersistent symptoms)
Authors’ summary opinion: not satisfied
101
© Queen’s Printer and Controller of HMSO 2007. All rights reserved.


Health Technology Assessment 2007; Vol. 11: No. 32
103
© Queen’s Printer and Controller of HMSO 2007. All rights reserved.
Appendix 2
Questionnaire used in the survey of national practice
Health TechnologyAssessment ProgrammeSponsored Project
Use of this logo does not constitute endorsement
Current practice, accuracy, effectiveness and cost-effectiveness of the
School Entry hearing Screen (SES)
A research project commissioned by the NHS R&D Health Technology Assessment Programme
District / Area / PCT .....................................................................................
Service Lead Name .......................................................................................
Name of person completing the questionnaire (if different) ............................................................................

Who should fill in this questionnaire?This questionnaire should be filled in by the person who is considered the clinical service lead for theschool entry hearing screen in your area.
If this is not you then please pass the questionnaire on to the most appropriate person for completion.
ConfidentialityYour answers will be stored on a computer at the University of Manchester and will meet the conditionsof the Data Protection Act.
Your answers will be anonymised before they are inputted into the computer. All responses will be keptconfidential and they will be seen only by members of the research team.
QuestionsIf you have any questions or would like to receive a summary report of our findings then please do nothesitate to contact:
Kirsty Bristow
Human Communication and DeafnessSchool of Psychological SciencesHumanities Building (Devas)University of ManchesterOxford RoadManchesterM13 9PL
Telephone: 0161 275 8575
e-mail: [email protected]
Appendix 2
104

BEFORE YOU START
Does your area have a written protocol for the School Entry Hearing Screen AND
can a copy of this protocol be sent to us?
If you have answered NO please go to page 3 and answer as many questions as possible. If you are notsure how to answer a question then please give the best answer you can and write additional comments ifyou want to.
If you have answered YES to the above question please read the following statement –
Some of the questions within this questionnaire may already be answered within your written SchoolEntry Hearing Screen protocol.
So….
If the answer is adequately covered by information already given in the protocol just write ‘protocol’.However, this will not always be the case and some questions may need more detail or ask for youropinion. Therefore we ask that you read all sections of the questionnaire as carefully as possible.
Please feel free to add comments on any question in the spaces provided at the end of each sectionor on additional pages.
All comments will be read, so please write as many as you wish
� YES, a hard copy of the written protocol has been included with the completed questionnaire
� YES, a hard copy of the written protocol has been sent separately
� YES, an electronic version of the written protocol has been emailed to Kirsty Bristow([email protected])
� NO
Health Technology Assessment 2007; Vol. 11: No. 32
105
© Queen’s Printer and Controller of HMSO 2007. All rights reserved.

These questions are designed to find out the kinds of children that are routinely tested by the School Entry HearingScreen in your area.
1 Please indicate which children are routinely entered into the school entry hearing screen in yourarea. Please tick one box for each category.
All Some None
Children in state schools
Children in private schools
Children who are home educated
Children in special schools with known physical or sensory disability (excluding hearing loss)
Children in special schools with known mental disability (excluding children who also have hearing loss )
Children known to have hearing loss
Other (please specify in the space below)……………………………...................................................
If you have answered some or none to any of the above categories it would be very helpful if you could give furtherdetails in the space below
..........................................................................................................................................................................
..........................................................................................................................................................................
..........................................................................................................................................................................
..........................................................................................................................................................................
..........................................................................................................................................................................
WHO DO YOU TEST?
Appendix 2
106

2 What arrangements (if any) are in place within your area to screen children, for whom you haveconsent, who did not attend the screen for any reason (e.g. through school absence, had a cold)?Please tick one box for each category
All of Most of Some of Rarely Neverthe time the time the time
Revisit to the school
Appointment arranged at school health clinic
Appointment arranged at Audiology clinic
No arrangement made
Other (please specify in the space below)……………………………………………….
3 In which school year is the school entry hearing screen routinely performed in your area? Pleasetick as many answers as apply.
PreschoolReception/Primary 1Year 1/Primary 2Year 2/Primary 3Other (please specify in the space below)
..........................................................................................................................................................................
Any Comments?
..........................................................................................................................................................................
..........................................................................................................................................................................
..........................................................................................................................................................................
Health Technology Assessment 2007; Vol. 11: No. 32
107
© Queen’s Printer and Controller of HMSO 2007. All rights reserved.

For the purposes of this study we need to know what audiological tests are used in the School Entry Hearing Screen,under what conditions these tests are performed and in what locations. By answering all the questions in this sectionyou will enable us to understand these factors for your area
4 Does your area have any written documentation for the following?(please tick one box for each category)
Documentation?
Yes No
Parent/guardian agreement for the screen
Information provided to the parent/guardian prior to screening
Information provided to the parent/guardian prior to referral
Test protocol
Re-test protocol
Referral protocol
If you answered yes to any of the above categories, could a copy of the document(s) be sent to us?
Yes, they have been included with this completed questionnaireYes, they have been sent separately Copy unavailable
Before completing this section please be aware that for the purposes of this questionnaire we are applying thefollowing definitions –
Screen – the entire remit of tests that a child undergoes before either passing or being referred for furtherhearing assessment
Test – the individual assessments, which when taken together, form a screen
For example, the diagram below details one screen that consists of either one or two tests –
Screen Example –
HOW DO YOU PERFORM THE SCHOOL ENTRY HEARING SCREEN?
Appendix 2
108
Test One
Pass Fail
Pass screen Test two (three weeks later)
Pass
Pass screen
Fail
Referred for further assessment

5 Where is the first test within the school entry hearing screen typically carried out in your area?(please tick one box for each location)
All of Most of Some of Rarely Neverthe time the time the time
School
Community clinic
Home
GP clinic
Other (please specify in the space below)………………………………………………
6 Under what conditions is the school entry hearing screen in your area performed? (please tick onebox for each category)
All of Most of Some of Rarely Neverthe time the time the time
Soundproof booth
Sound treated room
Quiet office
Noisy office
Quiet classroom/area
Noisy classroom/area
Other (please specify in the space below)…………………………………........................
Health Technology Assessment 2007; Vol. 11: No. 32
109
© Queen’s Printer and Controller of HMSO 2007. All rights reserved.

7 Which tests are used as part of the school entry hearing screen in your area? How are these testscombined into a whole screen protocol? Please describe via words or flow diagram.
To indicate the required level of detail an example is shown in the box below. The information we requireis shown in italics in the diagram and detailed in the following bullet pointed list –
● the tests used at each stage of the screen● how much time passes between each test● how many times the child is tested before referral takes place ● which service the child is referred on to
Your text or diagram –
Test 1Sweep pure tone audiometry
Pass Fail
No further action Test 2Sweep pure tone audiometry
Test 2 takes place two weeks after test 1
Pass
No further action
Fail
Refer to Audiology
Appendix 2
110
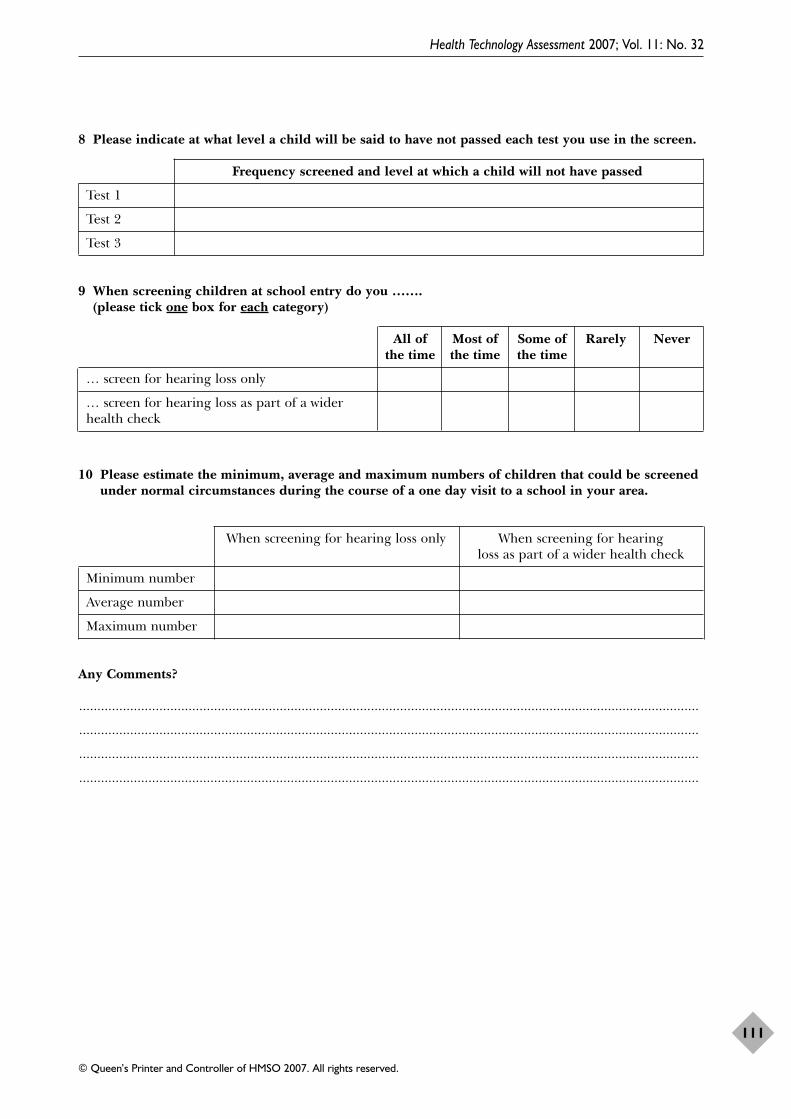
8 Please indicate at what level a child will be said to have not passed each test you use in the screen.
Frequency screened and level at which a child will not have passed
Test 1
Test 2
Test 3
9 When screening children at school entry do you ……. (please tick one box for each category)
All of Most of Some of Rarely Neverthe time the time the time
… screen for hearing loss only
… screen for hearing loss as part of a wider health check
10 Please estimate the minimum, average and maximum numbers of children that could be screenedunder normal circumstances during the course of a one day visit to a school in your area.
When screening for hearing loss only When screening for hearing loss as part of a wider health check
Minimum number
Average number
Maximum number
Any Comments?
..........................................................................................................................................................................
..........................................................................................................................................................................
..........................................................................................................................................................................
..........................................................................................................................................................................
Health Technology Assessment 2007; Vol. 11: No. 32
111
© Queen’s Printer and Controller of HMSO 2007. All rights reserved.

These questions are designed to find out which staff are involved in the implementation of the School Entry HearingScreen in your area.
11 Please indicate which staff perform the school entry hearing screen tests in your area. Please tickall that apply to your area.
School nurse
Audiometrician
Audiologist
Health Visitor
School Doctor
Other (please specify in the space below)
..........................................................................................................................................................................
Any Comments?
..........................................................................................................................................................................
..........................................................................................................................................................................
..........................................................................................................................................................................
..........................................................................................................................................................................
WHO PERFORMS THE TESTING?
Appendix 2
112

12 Please indicate the types of equipment used within the school entry hearing screen as run in yourarea. Please then say, as accurately as possible, the number of each you have.
Use? If yes, how many are in use?
No Yes
Screening audiometer
Diagnostic audiometer
Screening tympanometer
Diagnostic tympanometer
Other (please specify)……………………………………………
Any Comments?
..........................................................................................................................................................................
..........................................................................................................................................................................
..........................................................................................................................................................................
..........................................................................................................................................................................
WHAT EQUIPMENT DO YOU USE?
Health Technology Assessment 2007; Vol. 11: No. 32
113
© Queen’s Printer and Controller of HMSO 2007. All rights reserved.

In order for us to make evidence-based recommendations for the future of the School Entry Hearing Screen to theNHS we need to know the referral rates and yield of the screen. Your answers to these questions are therefore extremelyimportant.
However, we do NOT expect you to undertake an exhaustive and time consuming note review process.Please answer the questions below with details of audit data ONLY if it can be easily obtained.
13 Has an audit of the School Entry Hearing Screen in your area been performed in the last twoyears AND can a copy of this audit be made available to us?
No ................................................................................................................. please go to question 14
Yes, a hard copy of the audit has been included with this questionnaire ................................................................................................ please go to question 18
Yes, a hard copy of the audit has been sent separately ............................... please go to question 18
Yes, an electronic version of the audit has been emailedto Kirsty Bristow ([email protected]) ................................... please go to question 18
14 Please indicate if the school entry hearing screen in your area employs a data managementsystem.
No ................................................................................................................. please go to question 17
Yes, an IT system
Yes, paper system
Yes, other If other, please specify below
..........................................................................................................................................................................
15 Can you easily get data reports from this data management system?
No ................................................................................................................. please go to question 17
Yes
AUDIT DATA
Appendix 2
114

16 Please indicate the following for the most recent academic year possible – (e.g. 2003–2004,2002–2003 etc. Please indicate below which year)
For the academic year ……………….
Number
How many children were eligible for the school entry hearing screen in your area?
How many children were screened with the school entry hearing screen in your area?
How many children were referred for further audiological assessment following failure of the school entry hearing screen in your area?
How many children with sensorineural hearing loss were identified by the school entry hearing screen in your area?
How many children with permanent conductive hearing loss were identified by the school entry hearing screen in your area?
How many children with temporary conductive hearing loss were identified by the school entry hearing screen in your area?
How many children with other types of hearing loss were identified by the school entry hearing screen in your area? (please specify types of hearing loss)
……………………………………………………………………………………..
17 Do you have any other documentation that you feel may be of use to us?
No
Yes
If yes, could a copy this documentation be made available to us?
Yes, a hard copy has been included with this completed questionnaire
Yes, a hard copy has been sent separately
Yes, an electronic version has been emailed to Kirsty Bristow ([email protected])
No
Health Technology Assessment 2007; Vol. 11: No. 32
115
© Queen’s Printer and Controller of HMSO 2007. All rights reserved.

18 Is information regarding the costing of the School Entry Hearing Screen within the last two yearsroutinely available in your district?
No
Yes
If yes, please provide the contact details of a member of staff that could provide us with thiscosting data in the space below
Name .....................................................................................................................................................
Position .....................................................................................................................................................
Address .....................................................................................................................................................
.....................................................................................................................................................
E-mail .....................................................................................................................................................
Telephone .....................................................................................................................................................
Any Comments?
..........................................................................................................................................................................
..........................................................................................................................................................................
..........................................................................................................................................................................
Appendix 2
116

The questions so far may not have addressed all the issues you wish to raise. This section allows you to say what youthink about the usefulness and future of the School Entry Hearing Screen.
19 Are there any plans for development or change of the school entry hearing screen in your area?
No
Yes
If yes, please give details below
..........................................................................................................................................................................
..........................................................................................................................................................................
..........................................................................................................................................................................
..........................................................................................................................................................................
20 Please cross one of the boxes below to indicate how useful overall you think the School EntryHearing Screen is in your area as it is currently operated.
Not useful Very at all useful
Please add further comments to explain your answer
..........................................................................................................................................................................
..........................................................................................................................................................................
..........................................................................................................................................................................
..........................................................................................................................................................................
..........................................................................................................................................................................
21 Please add below any suggestions for the future of the School Entry Hearing Screen either in yourarea or nationally
..........................................................................................................................................................................
..........................................................................................................................................................................
..........................................................................................................................................................................
YOUR VIEWS
Health Technology Assessment 2007; Vol. 11: No. 32
117
© Queen’s Printer and Controller of HMSO 2007. All rights reserved.

Any further comments?
..........................................................................................................................................................................
..........................................................................................................................................................................
..........................................................................................................................................................................
..........................................................................................................................................................................
..........................................................................................................................................................................
Thank you for taking the time to complete this questionnaire
We may need to contact you again to discuss some matters raised in your questionnaire. We willendeavour to do so only when strictly necessary and will keep any correspondence with you to an absoluteminimum. Do we have your permission to contact you if required?
No
Yes
If yes could you please give your preferred form of contact below–
Telephone Number ..........................................................................................................................
OR
E-mail Address ..........................................................................................................................
..........................................................................................................................
..........................................................................................................................
OR
Post Address ..........................................................................................................................
..........................................................................................................................
..........................................................................................................................
Please return this completed questionnaire, and any other supporting documents you wish to include, inthe pre-paid envelope supplied to–
Kirsty BristowHuman Communication and DeafnessSchool of Psychological SciencesHumanities Building (Devas)University of ManchesterOxford RoadManchesterM13 9PL
Appendix 2
118
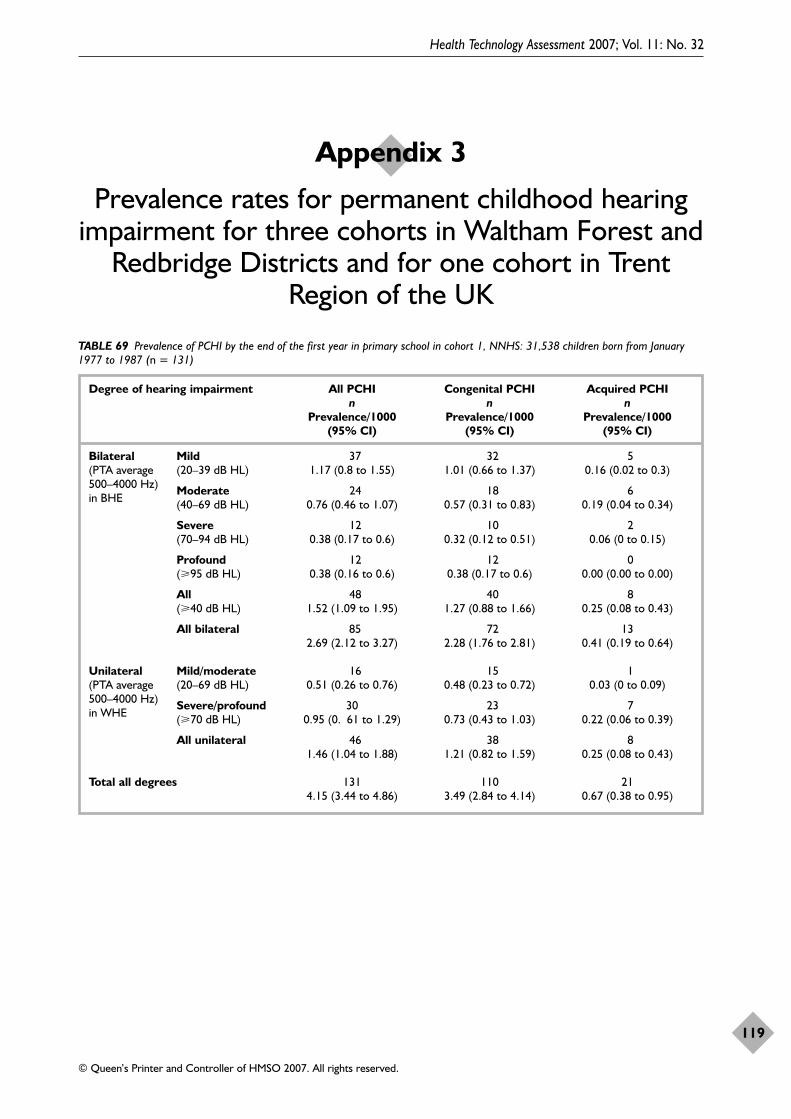
Health Technology Assessment 2007; Vol. 11: No. 32
119
© Queen’s Printer and Controller of HMSO 2007. All rights reserved.
Appendix 3
Prevalence rates for permanent childhood hearing impairment for three cohorts in Waltham Forest and
Redbridge Districts and for one cohort in TrentRegion of the UK
TABLE 69 Prevalence of PCHI by the end of the first year in primary school in cohort 1, NNHS: 31,538 children born from January1977 to 1987 (n = 131)
Degree of hearing impairment All PCHI Congenital PCHI Acquired PCHIn n n
Prevalence/1000 Prevalence/1000 Prevalence/1000 (95% CI) (95% CI) (95% CI)
Bilateral Mild 37 32 5(PTA average (20–39 dB HL) 1.17 (0.8 to 1.55) 1.01 (0.66 to 1.37) 0.16 (0.02 to 0.3)500–4000 Hz) Moderate 24 18 6in BHE (40–69 dB HL) 0.76 (0.46 to 1.07) 0.57 (0.31 to 0.83) 0.19 (0.04 to 0.34)
Severe 12 10 2(70–94 dB HL) 0.38 (0.17 to 0.6) 0.32 (0.12 to 0.51) 0.06 (0 to 0.15)
Profound 12 12 0(�95 dB HL) 0.38 (0.16 to 0.6) 0.38 (0.17 to 0.6) 0.00 (0.00 to 0.00)
All 48 40 8(�40 dB HL) 1.52 (1.09 to 1.95) 1.27 (0.88 to 1.66) 0.25 (0.08 to 0.43)
All bilateral 85 72 132.69 (2.12 to 3.27) 2.28 (1.76 to 2.81) 0.41 (0.19 to 0.64)
Unilateral Mild/moderate 16 15 1(PTA average (20–69 dB HL) 0.51 (0.26 to 0.76) 0.48 (0.23 to 0.72) 0.03 (0 to 0.09)500–4000 Hz) Severe/profound 30 23 7in WHE (�70 dB HL) 0.95 (0. 61 to 1.29) 0.73 (0.43 to 1.03) 0.22 (0.06 to 0.39)
All unilateral 46 38 81.46 (1.04 to 1.88) 1.21 (0.82 to 1.59) 0.25 (0.08 to 0.43)
Total all degrees 131 110 214.15 (3.44 to 4.86) 3.49 (2.84 to 4.14) 0.67 (0.38 to 0.95)

Appendix 3
120
TABLE 70 Prevalence of PCHI by the end of the first year in primary school in cohort 2, TNHS: 32,980 children born from January1990 to 2000 (n = 117)
Degree of hearing impairment All PCHI Congenital PCHI Acquired PCHIn n n
Prevalence/1000 Prevalence/1000 Prevalence/1000 (95% CI) (95% CI) (95% CI)
Bilateral Mild 40 29 11(PTA average (20–39 dB HL) 1.22 (0.84 to 1.59) 0.88 (0.56 to 1.2) 0.33 (0.14 to 0.53)500–4000 Hz) Moderate 24 19 5in BHE (40–69 dB HL) 0.73 (0.44 to 1.02) 0.58 (0.32 to 0.84) 0.15 (0.02 to 0.29)
Severe 14 12 2(70–94 dB HL) 0.43 (0.2 to 0.65) 0.36 (0.16 to 0.57) 0.06 (0 to 0.15)
Profound 11 11 0(�95 dB HL) 0.33 (0.14 to 0.53) 0.33 (0.14 to 0.53) 0.0 (0.00 to 0.00)
All 49 42 7(�40 dB HL) 1.49 (1.07 to 1.91) 1.28 (0.89 to 1.66) 0.21 (0.06 to 0.37)
All bilateral 89 71 182.71 (2.14 to 3.27) 2.16 (1.66 to 2.66) 0.55 (0.29 to 0.8)
Unilateral Mild/moderate 13 10 3(PTA average (20–69 dB HL) 0.39 (0.18 to 0.61) 0.30 (0.12 to 0.49) 0.09 (0 to 0.19)500–4000 Hz) Severe/profound 15 12 3in WHE (�70 dB HL) 0.46 (0.23 to 0.69) 0.36 (0.16 to 0.57) 0.09 (0 to 0.19)
All unilateral 28 22 60.85 (0.54 to 1.17) 0.67 (0.39 to 0.95) 0.18 (0.04 to 0.33)
Total all degrees 117 93 243.56 (2.91 to 4.2) 2.83 (2.25 to 3.4) 0.73 (0.44 to 1.02)

Health Technology Assessment 2007; Vol. 11: No. 32
121
© Queen’s Printer and Controller of HMSO 2007. All rights reserved.
TABLE 71 Prevalence of PCHI by the end of the first year in primary school in cohort 3, UNHS: 29,132 children born from January1992 to 2000 (n = 101)
Degree of hearing impairment All PCHI Congenital PCHI Acquired PCHIn n n
Prevalence/1000 Prevalence/1000 Prevalence/1000(95% CI) (95% CI) (95% CI)
Bilateral Mild 36 28 8(PTA average (20–39 dB HL) 1.24 (0.83 to 1.64) 0.96 (0.61 to 1.32) 0.27 (0.08 to 0.46)500–4000 Hz) Moderate 23 19 4in BHE (40–69 dB HL) 0.79 (0.47 to 1.11) 0.65 (0.36 to 0.95) 0.14 (0 to 0.27)
Severe 9 9 0(70–94 dB HL) 0.31 (0.11 to 0.51) 0.31 (0.11 to 0.51) 0.00 (0.00 to 0.00)
Profound 10 8 2(�95 dB HL) 0.34 (0.13 to 0.56) 0.27 (0.08 to 0.46) 0.07 (0 to 0.16)
All 42 36 6(�40 dBHL) 1.44 (1.01 to 1.88) 1.24 (0.83 to 1.64) 0.21 (0.04 to 0.37)
All bilateral 78 64 142.68 (2.08 to 3.27) 2.20 (1.63 to 2.7) 0.48 (0.25 to 0.78)
Unilateral Mild/moderate 15 12 3(PTA average (20–69 dB HL) 0.51 (0.25 to 0.78) 0.41 (0.18 to 0.64) 0.10 (0 to 0.22)500–4000 Hz) Severe/profound 8 7 1in WHE (�70 dB HL) 0.27 (0.08 to 0.46) 0.24 (0.06 to 0.42) 0.03 (0 to 0.1)
All unilateral 23 19 40.79 (0.47 to 1.11) 0.65 (0.36 to 0.95) 0.14 (0 to 0.27)
Total all degrees 101 83 183.47 (2.79 to 4.14) 2.85 (2.21 to 3.42) 0.62 (0.36 to 0.95)

Appendix 3
122
TABLE 72 Prevalence of PCHI for the three cohorts combined and for the Trent cohort, and an analysis of the difference in theprevalence rates between the three cohorts and between the combined cohort and the Trent cohort
Degree of hearing impairment Combined cohort Comparison of Trent cohort Comparison of Prevalence/1000 prevalence in Prevalence/1000 prevalence in
(95% CI) three cohorts (95% CI) Trent and Pearson �2 combined cohorts (p-value) Pearson �2
(p-value)
Bilateral Mild 1.21 0.052 Not available(PTA average (20–39 dB HL) (0.99 to 1.43) (0.974)500–4000 Hz) Moderate 0.76 0.073 0.68 0.583in BHE (40–69 dB HL) (0.58 to 0.94) (0.964) (0.61 to 0.78) (0.445)
Severe 0.37 0.568 0.28 2.151(70–94 dB HL) (0.25 to 0.5) (0.753) (0.23 to 0.34) (0.142)
Profound 0.35 0.108 0.31 0.463(�95 dB HL) (0.23 to 0.47) (0.948) (0.26 to 0.37) (0.496)
All 1.49 0.060 1.27 2.532(�40 dB HL) (1.24 to 1.73) (0.967) (1.16 to 1.39) (0.112)
All bilateral 2.69 0.005 Not available(2.36 to 3.03) (0.998)
Unilateral Mild/moderate 0.47 0.609 Not available(PTA average (20–69 dB HL) (0.33 to 0.61) (0.737)500–4000 Hz) Severe/profound 0.57 13.338 Not availablein WHE (�70 dB HL) (0.41 to 0.72) (0.001)***
All unilateral 1.04 8.229 Not available(0.83 to 1.24) (0.016)*
*** p < 0.001, * p < 0.05.

Ovid MEDLINE(R)1966 to April week 4 20051 hearing loss$.mp. or exp Hearing Loss/ 2 (hearing adj (disorder$ or difficult$ or
problem$ or impair$)).mp. 3 exp Hearing Disorders/ 4 or/1-3 5 exp Child, Preschool/ or school entry.mp. 6 exp Child Development/7 early detect$.mp. 8 infant school$.mp. 9 exp Schools, Nursery/ or exp Nurseries/ or exp
Child Day Care Centers/ or kindergarten$.mp. 10 nursery school$.mp.11 or/5-10 12 screen$.mp. or exp Mass Screening/ 13 4 and 12 14 13 and 11 15 (school entry adj3 (screen$ or exam$)).mp. 16 (medical exam$ adj2 school$).mp. 17 or/15-16 18 14 or 17 19 randomized controlled trial.pt. 20 controlled clinical trial.pt. 21 randomized controlled trials.sh. 22 random allocation.sh. 23 double blind method.sh. 24 single-blind method.sh. 25 or/19-24 26 (animals not human).sh. 27 25 not 26 28 clinical trial.pt. 29 exp clinical trials/ 30 (clin$ adj25 trial$).ti,ab. 31 ((singl$ or doubl$ or trebl$ or tripl$) adj25
(blind$ or mask$)).ti,ab. 32 placebos.sh. 33 placebo$.ti,ab. 34 random$.ti,ab. 35 research design.sh. 36 or/28-35 37 36 not 26 38 37 not 27 39 comparative study.sh. 40 exp evaluation studies/ 41 follow up studies.sh. 42 prospective studies.sh.43 (control$ or prospectiv$ or volunteer$).ti,ab. 44 or/39-43 45 44 not 26
46 45 not (27 or 38) 47 27 or 38 or 46 48 18 and 47
Ovid MEDLINE(R) In-Process & OtherNon-Indexed Citations 6 June 20051 hearing loss$.mp. or exp Hearing Loss/ 2 (hearing adj (disorder$ or difficult$ or
problem$ or impair$)).mp. 3 exp Child, Preschool/ or school entry.mp. 4 early detect$.mp. 5 infant school$.mp. 6 exp Schools, Nursery/ or exp Nurseries/ or exp
Child Day Care Centers/ or kindergarten$.mp. 7 nursery school$.mp. 8 screen$.mp. or exp Mass Screening/ 9 (school entry adj3 (screen$ or exam$)).mp. 10 (medical exam$ adj2 school$).mp. 11 randomized controlled trial.pt. 12 controlled clinical trial.pt. 13 clinical trial.pt. 14 (clin$ adj25 trial$).ti,ab. 15 ((singl$ or doubl$ or trebl$ or tripl$) adj25
(blind$ or mask$)).ti,ab.16 placebo$.ti,ab. 17 random$.ti,ab. 18 (control$ or prospectiv$ or volunteer$).ti,ab.19 or/1-2 20 or/3-7 21 or/8-10 22 or/11-18 23 19 and 20 24 21 and 23 25 22 and 24
EMBASE1980 to 2005 week 191 hearing loss$.mp. or exp Hearing Loss/ 2 (hearing adj (disorder$ or difficult$ or
problem$ or impair$)).mp. 3 exp Hearing Disorder/ 4 or/1-3 5 school entry.mp. 6 (pre adj school).mp. 7 (nursery adj school$).mp. 8 exp nursery school/ 9 kindergarten$.mp. or exp kindergarten/ 10 exp Day Care/ 11 infant school$.mp.
Health Technology Assessment 2007; Vol. 11: No. 32
123
© Queen’s Printer and Controller of HMSO 2007. All rights reserved.
Appendix 4
Search strategies used in the systematic review

12 early detect$.mp. 13 exp Child Development/ 14 or/5-13 15 screen$.mp. 16 exp mass screening/ or exp screening/ or exp
auditory screening/ or exp screening test/ 17 or/15-16 18 (school entry adj3 (screen$ or exam$)).mp. 19 (medical exam$ adj2 school$).mp. 20 or/18-19 21 4 and 17 22 21 and 14 23 22 or 20 24 randomized controlled trial/ 25 exp clinical trial/ 26 exp controlled study/ 27 double blind procedure/ 28 randomization/ 29 placebo/ 30 single blind procedure/ 31 (control$ adj (trial$ or stud$ or evaluation$ or
experiment$)).mp. 32 ((singl$ or doubl$ or trebl$ or tripl$) adj5
(blind$ or mask$)).mp. 33 (placebo$ or matched communities or
matched schools or matched populations).mp. 34 (comparison group$ or control group$).mp. 35 (clinical trial$ or random$).mp. 36 (quasiexperimental or quasi experimental or
pseudo experimental).mp. 37 matched pairs.mp. 38 or/24-37 39 23 and 38
CINAHL – Cumulative Index to Nursing& Allied Health Literature1982 to May week 1 20051 hearing loss$.mp. or exp Hearing Loss/ 2 (hearing adj (disorder$ or difficult$ or
problem$ or impair$)).mp. 3 exp Hearing Disorder/ 4 or/1-3 5 school entry.mp. 6 (pre adj school).mp.7 (nursery adj school$).mp. 8 exp nursery school/ 9 kindergarten$.mp. or exp kindergarten/ 10 exp day care/ 11 infant school$.mp. 12 early detect$.mp. 13 exp child development/ 14 or/5-13 15 (school entry adj3 (screen$ or exam$)).mp. 16 (medical exam$ adj2 school$).mp. 17 or/15-16 18 exp health screening/ or screen$.mp. 19 exp hearing screening/
20 or/18-19 21 4 and 18 22 21 or 19 23 22 and 14 24 23 or 17
Cochrane Library (Wiley)2005 Issue 2#1 exp Hearing Loss/#2 Hearing next loss#3 hearing next disorder*#4 hearing next difficult*#5 hearing next problem*#6 hearing next impair*#7 exp Hearing disorders/#8 #1 or #2 or #3 or #4 or #5 or #6 or #7#9 screening#10 exp Mass screening/#11 #9 or #10#12 school next entr*#13 early detect*#14 infant next school*#15 nursery next school*#16 kindergarten*#17 exp Schools, Nursery/#18 exp Child day care centers/#19 exp Child, Pre School#20 exp Child Development#21 #12 or #13 or #14 or #15 or #16 or #17
or #18 or #19 or #20#22 #8 and #11#23 #21 and #22 #24 school next entr*#25 medical near/3 exam* near/3 school*#26 #24 or #25#27 #23 or #26
ERIC (Cambridge Scientific Abstracts)Searched 7 June 2005#1 school entry or preschool #2 screen* or test* #3 hearing loss or hearing impair*#4 #1 and #2 and #3
Science Citation Index (Web ofKnowledge)Searched 7 June 2005 #1 school entry or preschool #2 screen* or test* #3 hearing loss or hearing impair*#4 #1 and #2 and #3
PsycINFO1985 to May week 1 20051 (hearing adj (disorder$ or impair$ or
problem$ or difficul$)).mp. 2 exp Hearing Disorders/ or hearing loss.mp.
Appendix 4
124

3 or/1-2 4 exp Screening Tests/ or screen$.mp. 5 1 and 4 6 Exp CHILD DAY CARE/ 7 (School Adj Entry).Mp8 (Pre Adj School).Mp. 9 Nurser$.Mp. 10 Exp Kindergarten Students/ Or Exp
KINDERGARTENS/ Or Kindergarten$.Mp. 11 Exp Preschool Students/ Or Exp Preschool
Education/ Or Exp Nursery School Students/Or Infant School$.Mp.
12 Early Detect$.Mp. 13 (School Entry Adj3 (Screen$ Or Exam$)).Mp. 14 Child$.Mp. 15 Or/6-14 16 5 And 15 17 (School Entry Adj3 (Screen$ Or Exam$)).Mp. 18 (Medical Exam$ Adj2 School$).Mp. 19 Or/17-18 20 16 Or 19
Search strategies: accuracy ofdiagnostic testsOvid MEDLINE(R)1966 to January week 4 20061 audiometry.mp. or audiometry/ or exp
audiometry, pure-tone/ 2 exp otoacoustic emissions, spontaneous/ or
otoacoustic emission$.mp. 3 exp acoustic impedance tests/ or acoustic
impedance.mp. 4 exp hearing tests/is, mt [instrumentation,
methods] 5 hearing test$.mp. 6 sweep audio.mp. 7 sweep test$.mp. 8 (hearing adj2 questionnaire$).mp. 9 cmedhq.mp. 10 conventional audiometry.mp. 11 conditioned play audiometry.mp. 12 cpa.mp. 13 exp audiometry, evoked response/ 14 audiologic$ assessment$.mp. 15 acoustic intermittance.tw. 16 tympanometry.mp. 17 otoscopy.mp. or exp otoscopy/ or exp
diagnostic techniques, otological/ 18 otological exam$.mp. 19 acoustic reflex test$.mp. 20 teoae.mp. 21 dpoae.mp. 22 (impedance adj screening).mp. 23 (impedance adj method$).mp. 24 fixed frequency audio.mp.
25 (speech adj2 noise).mp. 26 reflectometry.mp. 27 acoustic impedance.mp. 28 or/1-27 29 exp hearing loss, sensorineural/pc, di 30 exp hearing disorders/di, pc 31 exp otitis media/pc, di 32 exp hearing loss, high-frequency/pc, di 33 exp hearing loss/di, pc 34 hearing impairment$.mp. 35 exp hearing loss, conductive/di, pc36 (hearing adj3 screen$).mp. 37 exp "sensitivity and specificity"/ 38 exp predictive value of tests/ 39 (diagnos$ adj2 accura$).mp. 40 or/37-39 41 exp child, preschool/ or school entry.mp. 42 exp child development/ 43 early detect$.mp. 44 infant school$.mp. 45 exp schools, nursery/ or exp nurseries/ or exp
child day care centers/ or kindergarten$.mp. 46 nursery school$.mp. 47 or/41-46 48 screen$.mp. or exp mass screening/ 49 (school entry adj3 (screen$ or exam$)).mp. 50 (medical exam$ adj2 school$).mp. 51 or/49-50 52 28 and 40 53 47 or 51 54 or/29-36 55 52 and 53 56 40 and 54 57 53 and 56 58 55 or 57
EMBASE1980 to 2006 week 111 exp pure tone audiometry/ or exp audiometry/
or audiometry.mp. 2 otoacoustic emission$.mp. or exp spontaneous
otoacoustic emission/ or exp otoacousticemission/
3 acoustic impedance.mp. or exp acousticimpedance/
4 hearing test$.mp. 5 exp hearing test/ 6 sweep audio.mp. 7 sweep test$.mp. 8 (hearing adj2 questionnaire$).mp. 9 cmedhq.mp. 10 ((conventional or conditioned play) adj
audiometry).mp. 11 cpa.mp. 12 exp evoked response audiometry/ 13 (audiologic$ adj assessment$).mp. 14 (acoustic adj intermittance).mp.
Health Technology Assessment 2007; Vol. 11: No. 32
125
© Queen’s Printer and Controller of HMSO 2007. All rights reserved.

15 tympanometry.mp. or exp tympanometry/ 16 otoscopy.mp. or exp otoscopy/ 17 (otological adj2 technique$).mp. 18 (otological adj2 (exam$ or technique$)).mp. 19 teoae.mp. 20 dpoae.mp. or exp distortion product
otoacoustic emission/ 21 (impedance adj (screen$ or method$)).mp. 22 fixed frequency audio.mp. 23 (speech adj2 noise).mp. 24 reflectometry.mp. or exp reflectometry/ 25 or/1-24 26 hearing loss/pc, di [prevention, diagnosis] 27 hearing disorder/pc, di [prevention, diagnosis] 28 otitis media/pc, di [prevention, diagnosis] 29 hearing impair$.mp. 30 hearing impairment/pc, di [prevention,
diagnosis] 31 (hearing adj3 screen$).mp. 32 exp "sensitivity and specificity"/ 33 (predictive adj2 test$).mp. 34 (diagnos$ adj2 accura$).mp. 35 or/32-34 36 or/26-31 37 25 and 35 38 school entry.mp.39 pre-school.mp. 40 child/ 41 exp child development/ 42 early detect$.mp. 43 infant school$.mp. 44 nursery school$.mp. or exp nursery school/ 45 exp child care/ or child day care.mp. 46 kindergarten$.mp. or exp kindergarten/ 47 or/38-46 48 screen$.mp. 49 exp mass screening/ 50 (school entry adj3 (screen$ or exam$)).mp. 51 (medical exam$ adj2 school$).mp. 52 or/48-49 53 or/50-51 54 25 and 35 and 47 55 35 and 36 and 47 56 54 or 55 57 or/52-53 58 47 or 5759 35 and 36 and 58 60 56 or 59
CINAHL 1982 to March week 3 20061 audiometry.mp. or exp audiometry, evoked
response/ or exp audiometry/ or expaudiometry, pure-tone/
2 otoacoustic emission$.mp. or exp otoacousticemissions, spontaneous/
3 exp acoustic impedance tests/ or acousticimpedance.mp.
4 hearing test$.mp. or exp hearing tests/ 5 sweep test$.mp. 6 sweep audio.mp. 7 (hearing adj2 questionnaire$).mp. 8 cmedhq.mp. 9 (conventional adj2 audiometry).mp. 10 (conditioned adj2 audiometry).mp. 11 cpa.mp. 12 evoked response.mp. or exp evoked
potentials/ 13 (audiologic$ adj assessment$).mp. 14 (acoustic adj intermittance).mp. 15 tympanometry.mp. 16 otoscopy.mp. 17 (otological adj2 technique$).mp.18 (otological adj2 exam$).mp. 19 teoae.mp. 20 dpoae.mp. or exp otoacoustic emissions,
evoked/ 21 (impedance adj (screen$ or method$)).mp. 22 fixed frequency audio.mp. 23 (speech adj2 noise).mp.24 reflectometry.mp. 25 or/1-2426 hearing disorders/di, pc 27 hearing impair$.mp. 28 exp hearing screening/ 29 (hear$ adj2 screen$).mp. 31 exp "sensitivity and specificity"/ 32 exp "predictive value of tests"/ 33 (predictive adj2 test$).mp. 34 (diagnos$ adj2 accura$).mp. 35 or/31-34 36 school entry.mp. 37 exp child, preschool/ or pre-school.mp. 38 exp child development/ 39 early detect$.mp. 40 infant school$.mp. or exp infant development/ 41 nursery school$.mp. or exp schools, nursery/42 child day care.mp. or exp child day care/ 43 kindergarten$.mp. 44 or/36-43 45 screen$.mp. 46 exp hearing screening/ 47 exp school admissions/ 48 (school entry adj2 (screen$ or exam$)).mp. 49 (medical exam$ adj2 school$).mp.51 or/47-49 52 25 and 35 and 44 53 30 and 35 and 44 54 52 or 53 55 50 or 51 or 44 56 30 and 35 and 55 57 54 or 56
Appendix 4
126

PSYCINFO1967 to March week 4 20061 exp bone conduction audiometry/ or exp
audiometry/ or audiometry.mp. 2 otoacoustic emission$.mp. 3 acoustic impedance.mp. 4 hearing test$.mp. 5 sweep audio.mp. 6 sweep test$.mp. 7 (hearing adj2 questionnaire$).mp. 8 cmedhq.tw. 9 cpa.mp. 10 evoked response audiometry.mp. 11 audiologic$ assessment$.mp. 12 acoustic intermittance.tw. 13 tympanometry.mp. 14 otoscopy.mp. 15 (otological adj2 diagnos$).mp. 16 otological exam$.mp. 17 acoustic reflex test$.mp. 18 teoae.mp. 19 dpoae.mp. 20 (impedance adj screening).mp. 21 (impedance adj method$).mp. 22 fixed frequency audio.mp. 23 (speech adj2 noise).mp. 24 reflectometry.mp. 25 acoustic impedance.mp. 26 or/1-25 27 (sensitivity adj2 specificity).mp. 28 (predictive value adj2 test$).mp. 29 (diagnos$ adj2 accurac$).mp. 30 or/27-29 31 ((hearing loss$ or hearing disorder$ or
hearing impair$ or otitis media) adj3(diagnos$ or screen$)).mp.
32 30 or 31 33 26 and 32 34 child$.mp. or exp child day care/ 35 exp early childhood development/ or exp
preschool education/ or exp preschoolstudents/ or pre-school.mp. or exp nurseryschools/
36 kindergarten$.mp. or exp kindergartens/ 37 nursery school$.mp. 38 exp elementary school students/ or infant
school$.mp. 39 exp early intervention/ or early detect$.mp. 40 or/34-39 41 33 and 40
ERIC (CSA)1966 to presentSearch date: 28 March 2006
(hearing or otitis) and (diagnos* or screen* ortest*) and (school*or nurser* or infant*) and(accur* or predictive or sensitiv*)
Science Citation Index (Web OfKnowledge)1970 to presentSearch date: 28 March 2006
(Hearing or otitis or deaf*) and (screen* or test*or diagnos*) and (accura* or predictive orsensitive) and (pre-school or infant* or nurser* orkindergarten*)
Health Technology Assessment 2007; Vol. 11: No. 32
127
© Queen’s Printer and Controller of HMSO 2007. All rights reserved.


CRITICAL APPRAISAL SKILLS PROGRAMME
Making sense of evidence about clinical effectiveness
Health Technology Assessment 2007; Vol. 11: No. 32
129
© Queen’s Printer and Controller of HMSO 2007. All rights reserved.
Appendix 5
Quality criteria for systematic reviews
FIND
CASP
APPRAISE
AC
T
10 questions to help you make sense of a review
These questions consider the following:
Are the results of the review valid? (SECTION A)
What are the results? (SECTION B)
Will the results help locally? (SECTION C)
A number of italicised prompts are given after each question. These are designed to remind you whythe question is important. There will not be time in the small groups to answer them all in detail!
These materials were developed by the Critical Appraisal Skills Programme (CASP) and we thank themfor permission to use the materials.

1. Did the review address a clearly focused Yes Can’t tell Noquestion? � � �
HINT: An issue can be ‘focused’ in terms of
● the population studied● the intervention given● the outcome considered
2. Did the authors look for the appropriate Yes Can’t tell Nosort of papers? � � �
HINT: The ‘best sort of studies’ would
– address the review’s question – have an appropriate study design (usually
RCTs for papers evaluating interventions)
Appendix 5
130
A/ Are the results of the review valid?Screening Questions
3. Do you think the important, relevant studies Yes Can’t tell Nowere included? � � �
HINT: Look for
– which bibliographic databases were used– follow-up from reference lists– personal contact with experts– search for unpublished as well as published studies– search for non-English language studies
4. Did the review’s authors do enough to assess Yes Can’t tell Nothe quality of the included studies? � � �
HINT: The authors need to consider the rigour of the studies they have identified. Lack of rigour may affect the studies’ results (“All that glisters is not gold” Shakespeare, the Merchant of Venice, Act II)
5. If the results of the review have been Yes Can’t tell Nocombined, was it reasonable to do so? � � �
HINT: Consider whether
– the results were similar from study to study– the results of all the included studies are clearly displayed– the results of the different studies are similar – the reasons for any variations in results are discussed
Is it worth continuing?Detailed Questions

Health Technology Assessment 2007; Vol. 11: No. 32
131
© Queen’s Printer and Controller of HMSO 2007. All rights reserved.
6. What are the overall results of the reviews?
HINT: Consider
– if you are clear about the review’s ‘bottom line’ results:– what these are (numerically if appropriate)– how were the results expressed (NNT, odds ratio etc.)
7. How precise are the results?
HINT: Look at the confidence intervals, if given
B/ What are the results?
8. Can the results be applied to the local Yes Can’t tell Nopopulation? � � �
HINT: Consider whether
– the patients covered by the review could be sufficiently different to your population to cause concern
– your local setting is likely to differ much from that of the review
9. Were all important outcomes considered? Yes Can’t tell No� � �
10. Are the benefits worth the harms and costs?
Even if this is not addressed by the review, what do you think?
C/ Will the results help locally?


Health Technology Assessment 2007; Vol. 11: No. 32
133
© Queen’s Printer and Controller of HMSO 2007. All rights reserved.
Appendix 6
Quality criteria for diagnostic test studies
Quality assessment form for studies looking at diagnostic accuracy(Taken from the QUADAS checklist)
Title:
First Author:Date:
Question 1
Was the spectrum of patients representative of the patients who will receive the test in practice?
Yes
No
Unclear
Comments
Question 2
Were the selection criteria clearly described?
Yes
No
Unclear
Comments
Question 3
Is the reference standard likely to correctly classify the target condition?
Yes
No
Unclear
Comments

Appendix 6
134
Question 4
Is the time period between reference standard and index test short enough to be reasonable?
Yes
No
Unclear
Comments
Question 5
Did the whole sample or a random selection of the sample receive verification using a reference standard?
Yes
No
Unclear
Comments
Question 6
Did patients receive the same regardless of the index test result?
Yes
No
Unclear
Comments
Question 7
Was the reference standard independent of the index test? (i.e. the index test did not form part of the reference standard)
Yes
No
Unclear
Comments
Question 8
Was the execution of the index test described in sufficient detail to permit replication of the test?
Yes
No
Unclear
Comments

Health Technology Assessment 2007; Vol. 11: No. 32
135
© Queen’s Printer and Controller of HMSO 2007. All rights reserved.
Question 9
Was the execution of the reference standard described in sufficient detail to permit its replication?
Yes
No
Unclear
Comments
Question 10
Were the index test results interpreted without knowledge of the results of the reference standard?
Yes
No
Unclear
Comments
Question 11
Were the reference standard results interpreted without knowledge of the results of the index test?
Yes
No
Unclear
Comments
Question 12
Were the same clinical data available when test results were interpreted as would be available when the test is used in practice?
Yes
No
Unclear
Comments
Question 13
Were uninterpretable/intermediate test results reported?
Yes
No
Unclear
Comments

Appendix 6
136
Question 14
Were withdrawals from the study explained?
Yes
No
Unclear
Comments

Aguero AL, Borria JJ, de Mola M, Asnaghi P, Cansler A,Edelstein S, et al. The audiometric evaluation of BuenosAires schoolchildren. Boletin de la Oficina SanitariaPanamericana 1995;119:292–8. [Non-comparative study.]
Al Allaf AMY, Ali A, Muneer M. Deafness in childrenand the need for cochlear implants. [Arabic]. Journal ofthe Bahrain Medical Society 2003;15:219–22. [Non-comparative study.]
Arslan E, Turrini M, Lupi G, Genovese E, Orzan E.Hearing threshold assessment with auditory brainstemresponse (ABR) and ElectroCochleoGraphy (ECochG) inuncooperative children. Scand Audiol Suppl1997;46:32–7. [Looking at uncooperative children,general anaesthetic was applied.]
Augustsson I, Nilson C, Engstrand I. The preventivevalue of audiometric screening of preschool and youngschool-children. Int J Pediatr Otorhinolaryngol1990;20:51–62. [Non-comparative study.]
Babb MJ, Hilsinger RL Jr, Korol HW, Wilcox RD.Modern acoustic reflectometry: accuracy in diagnosingotitis media with effusion. Ear Nose Throat J2004;83:622–4. [Not looking at screening.]
Bamford J, Davis A, Boyle J, Law J, Chapman S, Brown SS, et al. Preschool hearing, speech, language,and vision screening. Qual Health Care 1998;7:240–7.[Audit.]
Baumann U, Schorn K. Early detection of pediatrichearing loss. Visual and automated procedurescompared. HNO 2001;49:118–25. [Children too young.]
Beppu R, Hattori T, Yanagita N. Comparison of TEOAEwith Play audiometry for screening hearing problems inchildren. Auris Nasus Larynx 1997;24:367–71. [Childrentoo young.]
Brunner M, Pfeiffer B, Heinrich C, Proschel U.Evaluation of the new Heidelberg preschool screeningfor auditory perception and language processing. FoliaPhoniatr Logop 2005;57:48-58. [Not looking atscreening.]
Cadman D, Walter SD, Chambers LW, Ferguson R,Szatmari P, Johnson N, et al. Predicting problems inschool performance from preschool health,developmental and behavioural assessments. CMAJ1988;139:31–6. [Not looking at hearing.]
Cadman D, Chambers LW, Walter SD, Feldman W,Smith K, Ferguson R. The usefulness of the DenverDevelopmental Screening Test to predict kindergartenproblems in a general community population. Am JPublic Health 1984;74:1093–7. [Not looking at hearing.]
Combs JT. Predictive value of the angle of acousticreflectometry. Pediatr Infect Dis J 1991;10:214–16. [Notlooking at screening/hearing.]
Combs JT. Single vs. double acoustic reflectometrytracings. Pediatr Infect Dis J 1989;8:616–20. [Not lookingat screening/hearing.]
Dancer J, Burl NT, Waters S. Effects of unilateralhearing loss on teacher responses to the SIFTER.Screening Instrument for Targeting Educational Risk.Am Ann Deaf 1995;140:291–4. [Some of the subjects hadpreviously diagnosed hearing problems.]
Dempster JH, Mackenzie K. Clinical role of free-fieldvoice tests in children. Clin Otolaryngol Allied Sci1992;17:54–6. [Looking at children who had previouslybeen referred to a hearing clinic.]
Dempster JH, Mackenzie K. Tympanometry in thedetection of hearing impairments associated with otitismedia with effusion. Clin Otolaryngol Allied Sci1991;16:157–9. [Children had already been referred.]
Douniadakis DE, Nikolopoulos TP, Tsakanikos MD,Vassiliadis SV, Apostolopoulos NJ. Evaluation of acousticreflectometry in detecting otitis media in children. Br JAudiol 1993;27:409–14. [Children had already beenreferred for hearing problems.]
Driscoll C, Kei J, McPherson B. Hearing screening forchildren in community settings using transient evokedotoacoustic emissions. Asia Pac J Speech Lang Hear2003;8:179–84. [Screening is not comparative.]
Driscoll C, Kei J, McPherson B. Transient evokedotoacoustic emissions in 6-year-old school children: anormative study. Scand Audiol Suppl 2000;29:103–10.[Looking at disabled children.]
Elliott M, Jones JC, Jones R, Pritchard VG, Robinson BE.An inter-district audit of the school entry medicalexamination in Cheshire. Public Health 1994;108:203–10.[Not a study, just an audit of medical examinations.]
Emmer MB, Silman S. The prediction of hearing loss inpersons with cerebral palsy using contralateral acousticreflex threshold for broad-band noise. Am J Audiol2003;12:91–5. [Children studied had cerebral palsy.]
Finitzo T, Friel-Patti S, Chinn K, Brown O.Tympanometry and otoscopy prior to myringotomy:issues in diagnosis of otitis media. Int J PediatrOtorhinolaryngol 1992;24:101–10. [Children hadrecurring otitis media.]
Flanary VA, Flanary CJ, Colombo J, Kloss D. Masshearing screening in kindergarten students. Int J PediatrOtorhinolaryngol 1999;50:93–8. [Non-comparative study.]
Health Technology Assessment 2007; Vol. 11: No. 32
137
© Queen’s Printer and Controller of HMSO 2007. All rights reserved.
Appendix 7
Excluded studies and reasons for exclusions

Garrubba V, Grandori F, Lamoretti M, Nicolai P, Zanetti D, Antonelli AR. Electric response audiometryin infants and preschool children. Long-term control ofthe results. Acta Otolaryngol Suppl 1991;482:36–43.[Children all under 4.]
Gershel J, Kruger B, Giraudi-Perry D, Chobot J,Rosenberg M, Shapiro IM, et al. Accuracy of the WelchAllyn AudioScope and traditional hearing screening forchildren with known hearing loss. J Pediatr1985;106:15–20. [Some children had previouslydiagnosed hearing problems.]
Gray S, Yamauchi T. Preschool screening of speech,language and hearing – model program of earlyidentification and intervention. Clin Res 1976;24:A175.[Non-comparative study.]
Guo Y, Yao D. The application of otoacoustic emissionsin paediatric hearing screening. Chung-Kuo i Hsueh KoHsueh Yuan Hsueh Pao Acta Academiae Medicinae Sinicae1996;18:284–7 [Used high-risk infants only.]
Haggard MP, Wood EJ, Carroll S. Speech, admittanceand tone tests in school screening. Reconcilingeconomics with pathology and disability perspectives.Br J Audiol 1984;18:133–53. [Outcomes not relevant.]
Heath RW, et al. Hearing dysfunction in Hawaiianpreschoolers: its relation to educational achievementand family characteristics. Internal report, January1987. [Paper could not be retrieved.]
Herer GR, Glattke TJ, Rafitis IA, Cummiskey C.Detection of hearing loss in young children and adultsusing otoacoustic emissions. Folia Phoniatr Logop1996;48:117–21 [Non-comparative study.]
Holmes AE, Jones-Muir KC, Kember FJ. Acousticreflectometry versus tympanometry in pediatric middleear screenings. Lang Speech Hear Serv Sch 1989;20:41–9.[Some children had previously diagnosed hearingproblems.]
Holtby I, Forster DP. Evaluation of pure toneaudiometry and impedance screening in infantschoolchildren. J Epidemiol Commun Health1992;46:21–5. [Children too old.]
Jones J, Batchelor L, Gordon N, West M. The preschoolmedical: an evaluation of this examination and its rolein child health surveillance. Child Care Health Dev1989;15:425–34. [Non-comparative study.]
Kaleida PH, Stool SE. Assessment of otoscopists’accuracy regarding middle-ear effusion. Otoscopicvalidation. Am J Dis Child 1992;146:433–5. [Physicianvalidation.]
Kanasaku M, Suzuki S, Notoya M, et al. The screeninglevel of pure tone audiometry for young children. AudiolJpn 1977;20:702–8. [Non-comparative study.]
Karzon RG. Validity and reliability of tympanometricmeasures for pediatric patients. J Speech Hear Res1991;34:386–90. [Children had already been referredfor hearing problems.]
Kazanas SG, Maw AR. Tympanometry, stapedius reflexand hearing impairment in children with otitis mediawith effusion. Acta Otolaryngol 1994;114:410–14[Children already had diagnosed hearing problems.]
Koike KJ, Wetmore SJ. Interactive effects of the middleear pathology and the associated hearing loss ontransient-evoked otoacoustic emission measures.Otolaryngol Head Neck Surg 1999;121:238–44. [Childrenwere deaf and blind and already had suspected earproblems.]
Krueger WWO, Ferguson L. A comparison of screeningmethods in school-aged children. Otolaryngol Head NeckSurg 2002;127:516–19. [Children too old.]
Lee DH, Yeo SW. Clinical diagnostic accuracy of otitismedia with effusion in children, and significance ofmyringotomy: diagnostic or therapeutic? J Korean MedSci 2004;19:739–43 [Children already had OME.]
Lous J. Secretory otitis-media in schoolchildren – isscreening for secretory otitis-media advisable? Dan MedBull 1995;42:71–99. [Audit.]
McKenzie E, Magian V, Stokes R. A study of therecommended pass/fail criteria for impedanceaudiometry in a school screening program. J Otolaryngol1982;11:40–5. [Comparative results not valid for thisreview.]
Mackie K, Dermody P. Use of a Monosyllabic AdaptiveSpeech Test (MAST) with young children. ResearchNote. J Speech Hear Res 1986;29:275–81. [Includedchildren with learning difficulties.]
Magnusson M, Rasmussen F, Sundelin C. Earlyidentification of children with communicationdisabilities – evaluation of a screening programme in aSwedish county. Acta Paediatr 1996;85:1319–26.[Children too young.]
Maki-Torkko E, Sorri M, Jarvelin MR. Conditions forpaediatric hearing screening: a survey in 28 Finnishchild welfare clinics. Public Health 1998;112:47–51 [Astudy looking at nurses and practitioners, not children.]
Marriage J, King J, Briggs J, Lutman ME. Thereliability of the SCAN test: results from a primaryschool population in the UK. Br J Audiol2001;35:199–208. [Children too old.]
Matkin ND. Analysis of a recorded test for themeasurement of hearing in children. December 1969.[Paper could not be retrieved.]
Matusiak M, Wierzbicka M, Szyfter W. [Prevalence ofconductive hypoacusis in children aged 5–9 years oldfrom rural area in Poland – prospective screening ofhealthy subjects] [Polish]. Otolaryngol Polska2002;56:459–66. [Non-comparative study.]
Maw AR, Tiwari RS. Children with glue ear: how dothey present? Clin Otolaryngol Allied Sci 1988;13:171–7.[Wrong outcomes.]
de Melker RA. Evaluation of the diagnostic value ofpneumatic otoscopy in primary care using the results of
Appendix 7
138

tympanometry as a reference standard. Br J GeneralPract 1993;43:22–4. [Children included were deaf.]
Merer DM, Gravel JS. Screening infants and youngchildren for hearing loss: examination of the CASTprocedure. J Am Acad Audiol 1997;8:233–42. [Somechildren had previously diagnosed hearing loss.]
National Institutes of Health. Consensus: earlyidentification of hearing impairment in infants andyoung children. Summary. Am J Otol 1994;1:130–1. [Nota study.]
Ng J, Yun HL. Otoacoustic emissions (OAE) inpaediatric hearing screening – the Singaporeexperience. J Singapore Paediatr Soc 1992;34:1–5.[Children included described as being ‘at risk’.]
Okalidou A, Kampanaros M. Teacher perceptions ofcommunication impairment at screening stage inpreschool children living in Patras, Greece. Int J LangCommun Disord 2001;36:489–502. [Looking atprevalence of communication problems, cross-sectionalstudy that only gives one figure for the prevalence ofhearing impairment in their study population.]
Piskorski P, Keefe DH, Simmons JL, Gorga MP.Prediction of conductive hearing loss based on acousticear-canal response using a multivariate clinical decisiontheory. J Acoust Soc Am 1999;105:1749–64. [Not lookingat screening.]
Proschel U, Eysholdt U. Evoked otoacoustic emissions inchildren in relation to middle ear impedance. FoliaPhoniatr 1993;45:288–94. [The children already hadconductive hearing loss in at least one ear.]
Richardson MP, Williamson TJ, Lenton SW, Tarlow MJ,Rudd PT. Otoacoustic emissions as a screening test forhearing impairment in children. Arch Dis Child1995;72:294–7. [No breakdown of age.]
Rothman R, Owens T, Simel DL. Does this child haveacute otitis media? [review]. JAMA 2003;290:1633–40.[Not looking at screening.]
Sagalovich BM, Shimanskaia EI. Age-relatedcharacteristics of dynamic indicators of acousticimpedance of the middle ear in children. VestnOtorinolaringol 1992;(3):9–13. [Non-comparative.]
Scaldwell WA. Prevalence of otis media in Cree andOjibway school children in six Ontario communities.Journal of American Indian Education 1985;25:1–5. [Notscreening.]
Schuster M, Kummer P, Hoppe U, Eysholdt U, Weber A,Rosanowski F. Guidelines and their practical applicationin congenital hearing loss. Gesundheitswesen2003;65:566–71. [Children already had diagnosedhearing problems.]
Silman S, Silverman CA, Arick DS. Pure-tone assessmentand screening of children with middle-ear effusion. J AmAcad Audiol 1994;5:173–82. [Children already hadOME.]
Stewart MG, Ohlms LA, Friedman EM, Sulek M,Duncan NO III, Fernandez AD, et al. Is parentalperception an accurate predictor of childhood hearingloss? A prospective study. Otolaryngol Head Neck Surg1999;120:340–4. [Children already had OME.]
Sturner RA, Green JA, Funk SG. Cognitive-developmentrelated to performance on preschool hearing screening-tests. J Dev Behav Pediatr 1983;4:94–8. [Not acomparison of hearing tests.]
Swedish Council on Technology Assessment in HealthCare. Universal newborn hearing screening – earlyassessment briefs 2004. [Wrong population.]
Takata GS, Chan LS, Morphew T, Mangione-Smith R,Morton SC, Shekelle P. Evidence assessment of theaccuracy of methods of diagnosing middle ear effusionin children with otitis media with effusion. Pediatrics2003;112:1379–87. [Just looking at OME diagnosis.]
Taylor CL, Brooks RP. Screening for hearing loss andmiddle-ear disorders in children using TEOAEs. Am JAudiol 2000;9:50–5. [Children had been referred.]
Westerlund M, Sundelin C. Screening for developmentallanguage disability in 3-year-old children. Experiencesfrom a field study in a Swedish municipality. Child CareHealth Dev 2000;26:91–110. [Children too young.]
Wood EJ, Lutman ME, Fernandes MA. Validation of ascreening oto-admittance instrument. Br J Audiol1982;16:273–5. [Wrong population.]
Yasuhara A, Hori A. A comparison of the three-dimensional auditory brainstem response and theconventional auditory brainstem response in children.Brain Dev 2002;24:750–7. [Not looking at hearing.]
Yockel NJ. A comparison of audiometry and audiometrywith tympanometry to determine middle ear status inschool-age children. J Sch Nurs 2002;18:287–92. [Non-comparative study.]
Zakzouk SM. Epidemiology and etiology of hearingimpairment among infants and children in a developingcountry. Part I. J Otolaryngol 1997;26:335–44. [Non-comparative study.]
Zielhuis GA, Gerritsen AAM, Gorissen WHM, DekkerLJ, Rovers MM, van der Wilt GJ, et al. Hearing deficitsat school age; the predictive value of otitis media ininfants. Int J Pediatr Otorhinolaryngol 1998;44:227–34[Not looking at screening.]
Health Technology Assessment 2007; Vol. 11: No. 32
139
© Queen’s Printer and Controller of HMSO 2007. All rights reserved.


Health Technology Assessment 2007; Vol. 11: No. 32
141
© Queen’s Printer and Controller of HMSO 2007. All rights reserved.
Appendix 8
Summary of quality of systematic reviews
TABLE 73 Quality of systematic reviews
Barlow et al., NZHTA, Pirozzo et al., 199843 199844 200347
Was the aim stated clearly? Yes Yes YesWere the appropriate sort of papers sought? Yes Yes Can’t tellAre the important relevant studies included? Yes Yes Can’t tellWas the quality of the studies appropriately assessed? Yes Yes YesIf the results are combined was it appropriate to do so? NA NA NACan the results be applied to the local population? Can’t tell Can’t tell Can’t tellWere all important outcomes considered? Yes Yes YesAre the benefits worth the harms and costs? Yes Yes Yes


Health Technology Assessment 2007; Vol. 11: No. 32
143
© Queen’s Printer and Controller of HMSO 2007. All rights reserved.
Appendix 9
Quality of primary studies

Appendix 9
144 TAB
LE 7
4Q
ualit
y of
prim
ary
stud
ies
Q. 1
Q. 2
Q. 3
Q. 4
Q. 5
Q. 6
Q. 7
Q. 8
Q. 9
Q. 1
0Q
. 11
Q. 1
2Q
.13
Q.1
4Sc
orec
Ritc
hie
and
Mer
klei
n, 1
97257
Yes
Yes
Yes
Yes
Yes
Yes
Yes
Yes
Yes
Unc
lear
Unc
lear
Unc
lear
Unc
lear
Yes
10Fi
tzZ
alan
d an
d Z
ink,
198
455Ye
sN
oYe
sYe
sYe
sYe
sYe
sYe
sYe
sU
ncle
arU
ncle
arU
ncle
arU
ncle
arYe
s9
Gom
es a
nd L
icht
ig, 2
00569
Yes
No
Yes
Unc
lear
Yes
Yes
Yes
Unc
lear
Yes
No
No
Unc
lear
Unc
lear
Yes
7A
bou
Hai
dar
et a
l., 2
00568
Yes
Yes
Yes
Yes
Yes
Yes
Yes
Yes
No
Unc
lear
Unc
lear
Unc
lear
Unc
lear
No
8H
amill
, 198
858Ye
sN
oYe
sYe
sYe
sYe
sYe
sYe
sYe
sYe
sYe
sU
ncle
arU
ncle
arYe
s11
Ham
mon
d et
al.,
199
763Ye
sYe
sYe
sYe
sYe
sYe
sYe
sYe
sYe
sU
ncle
arU
ncle
arU
ncle
arU
ncle
arN
o9
Hin
d et
al.,
199
965Ye
sYe
sYe
sYe
sYe
sYe
sYe
sYe
sYe
sU
ncle
arU
ncle
arU
ncle
arU
ncle
arYe
s10
Hol
tby
et a
l., 1
99770
Yes
Yes
Yes
Yes
Yes
Yes
Yes
Yes
Unc
lear
Yes
Yes
Unc
lear
Unc
lear
Yes
11Ly
ons
et a
l., 2
00453
Yes
No
Yes
Yes
Yes
Yes
Yes
Yes
Yes
Unc
lear
Unc
lear
Unc
lear
Unc
lear
Yes
9M
arag
no a
nd T
eatin
i, 19
8366
aYe
sU
ncle
arYe
sYe
sYe
sYe
sU
ncle
ar
Unc
lear
Unc
lear
Unc
lear
Unc
lear
Unc
lear
Unc
lear
Unc
lear
NA
McC
urdy
et
al.,1
97671
Yes
Yes
Yes
Yes
Yes
Yes
Yes
Yes
Yes
Unc
lear
Unc
lear
Unc
lear
Unc
lear
No
9N
ienh
uys
et a
l., 1
99461
Yes
Yes
Yes
Yes
Yes
Yes
Yes
Yes
Unc
lear
Unc
lear
Unc
lear
Unc
lear
Unc
lear
Yes
9N
ozza
et
al.,
1997
72Ye
sYe
sU
ncle
arYe
sYe
sYe
sYe
sYe
sYe
sYe
sYe
sU
ncle
arU
ncle
arYe
s11
Olu
sany
a, 2
00151
Yes
No
Yes
Yes
Yes
Yes
Yes
Yes
No
Unc
lear
Unc
lear
Unc
lear
Unc
lear
Yes
8O
rland
o an
d Fr
ank,
198
773Ye
sYe
sYe
sYe
sYe
sYe
sYe
sYe
sYe
sYe
sYe
sU
ncle
arU
ncle
arYe
s12
Pang
-Chi
ng e
t al
., 19
9552
Yes
Yes
Yes
Unc
lear
Yes
Yes
Yes
Yes
Yes
Unc
lear
Unc
lear
Unc
lear
Unc
lear
Yes
9Pr
esco
tt e
t al
., 19
9950
Yes
Unc
lear
Yes
Yes
Yes
Yes
Yes
Yes
Yes
Unc
lear
Unc
lear
Unc
lear
Unc
lear
Unc
lear
8Ro
drig
uez
and
Mel
guiz
o-Ye
pez,
Ye
sU
ncle
arU
ncle
arYe
sYe
sYe
sU
ncle
arU
ncle
arU
ncle
ar
Unc
lear
Unc
lear
Unc
lear
Unc
lear
Unc
lear
NA
1994
56a
Rous
ch e
t al
., 19
9259
Yes
Yes
Unc
lear
Yes
Yes
Yes
Yes
Yes
Yes
Unc
lear
Yes
Unc
lear
Unc
lear
Yes
10Ro
usch
and
Tai
t, 19
8562
Yes
Unc
lear
Yes
Yes
Yes
Yes
Unc
lear
Yes
Yes
Unc
lear
Unc
lear
Unc
lear
Unc
lear
Yes
8Sa
bo e
t al
., 20
0054
Yes
Unc
lear
Unc
lear
Yes
Yes
Yes
Yes
Yes
Yes
Unc
lear
Unc
lear
Unc
lear
Unc
lear
Yes
8Sc
hell,
197
064a
Yes
Unc
lear
Unc
lear
Yes
Yes
Yes
Unc
lear
Unc
lear
Unc
lear
Unc
lear
Unc
lear
Unc
lear
Unc
lear
Unc
lear
NA
Skur
r an
d Jo
nes,
198
175Ye
sYe
sU
ncle
arYe
sU
ncle
arYe
sYe
sN
oN
oU
ncle
arU
ncle
arU
ncle
arU
ncle
arN
o5
Squa
re e
t al
., 19
8560
Yes
No
Unc
lear
Yes
Yes
Yes
Yes
Yes
Yes
Unc
lear
Unc
lear
Unc
lear
Unc
lear
Yes
8To
tals
b20
1117
1812
2019
1616
45
00
16
a N
on-E
nglis
h st
udie
s.b
Tota
l num
ber
of ‘y
es’ r
espo
nses
to
each
crit
eria
.c To
tal n
umbe
r of
‘yes
’ sco
res
for
each
stu
dy.
Que
stio
ns1.
Was
the
spe
ctru
m o
f pat
ient
s re
pres
enta
tive
of t
he p
atie
nts
who
will
rec
eive
the
tes
t in
pra
ctic
e?2.
Wer
e th
e se
lect
ion
crite
ria c
lear
ly d
escr
ibed
?3.
Is t
he r
efer
ence
sta
ndar
d lik
ely
to c
orre
ctly
cla
ssify
the
tar
get
cond
ition
? (PT
A h
as b
een
take
n as
the
mos
t su
itabl
e re
fere
nce
stan
dard
.)4.
Is t
he t
ime
perio
d be
twee
n re
fere
nce
stan
dard
and
inde
x te
st s
hort
eno
ugh
to b
e re
ason
able
?5.
Did
the
who
le s
ampl
e or
a r
ando
m s
elec
tion
of t
he s
ampl
e re
ceiv
e ve
rific
atio
n us
ing
a re
fere
nce
stan
dard
?6.
Did
pat
ient
s re
ceiv
e th
e sa
me
rega
rdle
ss o
f the
inde
x te
st r
esul
t?
cont
inue
d

Health Technology Assessment 2007; Vol. 11: No. 32
145
© Queen’s Printer and Controller of HMSO 2007. All rights reserved.
TAB
LE 7
4Q
ualit
y of
prim
ary
stud
ies
(con
t’d)
7.W
as t
he r
efer
ence
sta
ndar
d in
depe
nden
t of
the
inde
x te
st? (
i.e. t
he in
dex
test
did
not
form
par
t of
the
ref
eren
ce s
tand
ard)
8.W
as t
he e
xecu
tion
of t
he in
dex
test
des
crib
ed in
suf
ficie
nt d
etai
l to
perm
it re
plic
atio
n of
the
tes
t?9.
Was
the
exe
cutio
n of
the
ref
eren
ce s
tand
ard
desc
ribed
in s
uffic
ient
det
ail t
o pe
rmit
its r
eplic
atio
n?10
.W
ere
the
inde
x te
st r
esul
ts in
terp
rete
d w
ithou
t kn
owle
dge
of t
he r
esul
ts o
f the
ref
eren
ce s
tand
ard?
11.
Wer
e th
e re
fere
nce
stan
dard
res
ults
inte
rpre
ted
with
out
know
ledg
e of
the
res
ults
of t
he in
dex
test
?12
.W
ere
the
sam
e cl
inic
al d
ata
avai
labl
e w
hen
test
res
ults
wer
e in
terp
rete
d as
wou
ld b
e av
aila
ble
whe
n th
e te
st is
use
d in
pra
ctic
e?13
.W
ere
unin
terp
reta
ble/
inte
rmed
iate
tes
t re
sults
rep
orte
d?14
.W
ere
any
with
draw
als
from
the
stu
dy e
xpla
ined
?

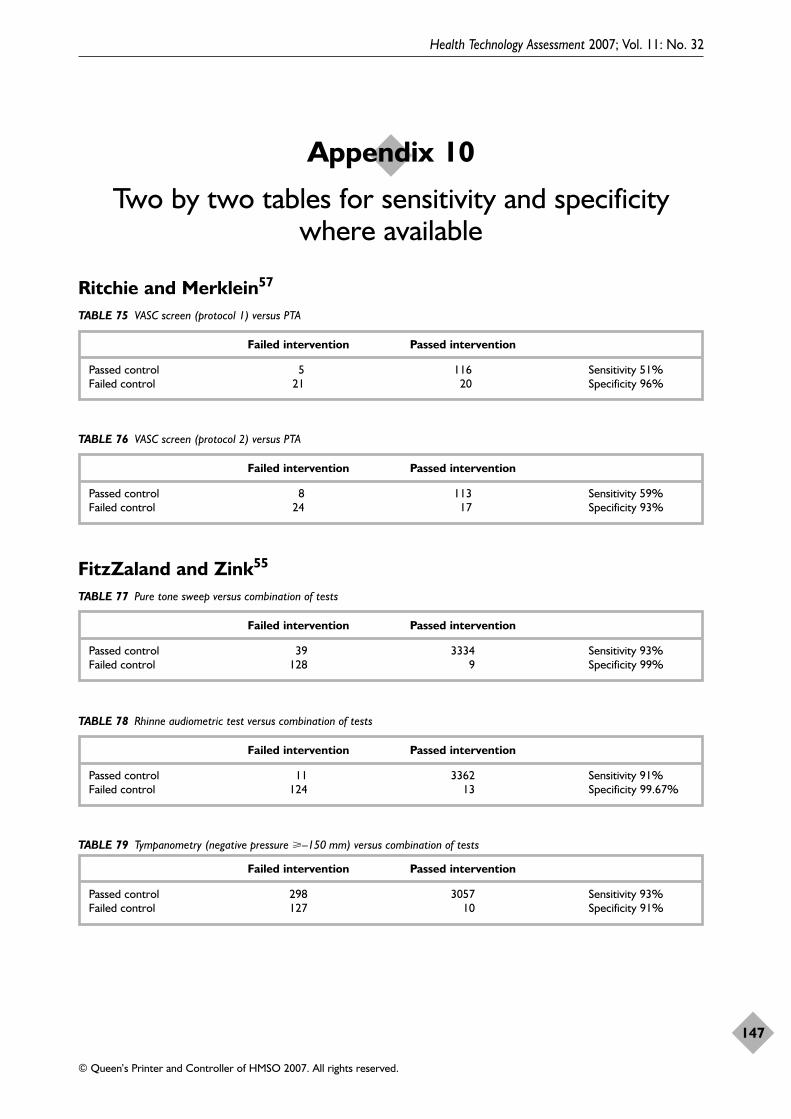
Ritchie and Merklein57
Health Technology Assessment 2007; Vol. 11: No. 32
147
© Queen’s Printer and Controller of HMSO 2007. All rights reserved.
Appendix 10
Two by two tables for sensitivity and specificity where available
TABLE 75 VASC screen (protocol 1) versus PTA
Failed intervention Passed intervention
Passed control 5 116 Sensitivity 51%Failed control 21 20 Specificity 96%
FitzZaland and Zink55
TABLE 77 Pure tone sweep versus combination of tests
Failed intervention Passed intervention
Passed control 39 3334 Sensitivity 93%Failed control 128 9 Specificity 99%
TABLE 76 VASC screen (protocol 2) versus PTA
Failed intervention Passed intervention
Passed control 8 113 Sensitivity 59%Failed control 24 17 Specificity 93%
TABLE 78 Rhinne audiometric test versus combination of tests
Failed intervention Passed intervention
Passed control 11 3362 Sensitivity 91%Failed control 124 13 Specificity 99.67%
TABLE 79 Tympanometry (negative pressure �–150 mm) versus combination of tests
Failed intervention Passed intervention
Passed control 298 3057 Sensitivity 93%Failed control 127 10 Specificity 91%

Appendix 10
148
TABLE 80 Tympanometry (negative pressure �–175 mm) versus combination of tests
Failed intervention Passed intervention
Passed control 183 3190 Sensitivity 91%Failed control 127 10 Specificity 99%
TABLE 81 Tympanometry (negative pressure �–200 mm) versus combination of tests
Failed intervention Passed intervention
Passed control 73 3300 Sensitivity 91%Failed control 125 12 Specificity 99%
TABLE 82 Tympanometry type B only
Failed intervention Passed intervention
Passed control 0 3373 Sensitivity 40%Failed control 55 82 Specificity 100%
Hammond and colleagues63
TABLE 83 Questionnaire versus combination of tests
Failed intervention Passed intervention
Passed control 259 227 Sensitivity 56%Failed control 10 8 Specificity 52%
Hamill58
TABLE 84 VASC versus pure tone sweep test
Failed intervention Passed intervention
Passed control 23 508 Sensitivity 87%Failed control 39 6 Specificity 96%
Lyons and colleagues53
TABLE 85 Tympanometry versus pure tone sweep test
Failed intervention Passed intervention
Passed control 171 1725 Sensitivity 85%Failed control 94 16 Specificity 91%

Health Technology Assessment 2007; Vol. 11: No. 32
149
© Queen’s Printer and Controller of HMSO 2007. All rights reserved.
Maragno and Teatini66
TABLE 90 SVEP test versus hearing assessment
Failed intervention Passed intervention
Passed control 0 48 Sensitivity 100%Failed control 31 2 Specificity 94%
McCurdy and colleagues71
TABLE 91 Tympanometry plus stapedius reflex versus PTA
Failed intervention Passed intervention
Passed control 24 45 Sensitivity 71%Failed control 57 23 Specificity 65%
TABLE 86 DPOAE (protocol 1) versus pure tone sweep test
Failed intervention Passed intervention
Passed control 241 1484 Sensitivity 97%Failed control 273 8 Specificity 86%
TABLE 87 DPOAE (protocol 2) versus pure tone sweep test
Failed intervention Passed intervention
Passed control 289 1436 Sensitivity 97%Failed control 273 8 Specificity 83%
TABLE 88 DPOAE (protocol 3) versus pure tone sweep test
Failed intervention Passed intervention
Passed control 440 1285 Sensitivity 98%Failed control 277 4 Specificity 74%
TABLE 89 DPOAE (protocol 4) versus pure tone sweep test
Failed intervention Passed intervention
Passed control 92 1633 Sensitivity 96%Failed control 269 12 Specificity 95%

Appendix 10
150
Olusanya51
TABLE 92 Questionnaire versus pure tone audiometry
Failed intervention Passed intervention
Passed control 15 291 Sensitivity 34%Failed control 23 45 Specificity 95%
Sabo and colleagues54
TABLE 95 Pure tone sweep test versus PTA
Failed intervention Passed intervention
Passed control 106 429 Sensitivity 87%Failed control 33 5 Specificity 80%
Square and colleagues60
TABLE 97 Bone conduction versus impedance audiometry
Failed intervention Passed intervention
Passed control 56 4 Sensitivity 26%Failed control 14 39 Specificity 6.6%
TABLE 96 TEOAE versus PTA
Failed intervention Passed intervention
Passed control 48 487 Sensitivity 63%Failed control 24 14 Specificity 91%
TABLE 93 Tympanometry versus PTA
Failed intervention Passed intervention
Passed control 50 253 Sensitivity 50%Failed control 25 25 Specificity 83%
TABLE 94 Otoscopy versus PTA
Failed intervention Passed intervention
Passed control 116 193 Sensitivity 56%Failed control 28 22 Specificity 62.4%

MEDLINE1966 to August week 3 2005Search date: 2 August 2005Number of records: 74
Hearing loss$.mp or exp Hearing loss/ or (hearingadj (disorder$ or difficult$ or problem$ orimpair$)).mp or Hearing Disorders/ AND expchild, preschool/ or school entry.mp or exp ChildDevelopment/ or early detect$.mp or infantschool$.mp or exp Schools, Nursery/ orkindergarten$.mp or exp Child Day Care Centers/or exp Nurseries/ or nursery school$.mp ANDscreen$.mp or exp Mass Screening/ AND (schoolentry adj3 (screen$ or exam$)).mp or (medicalexam$ adj2 school$).mp AND economics.mp orexp ECONOMICS, NURSING/ or expECONOMICS, MEDICAL/ or exp ECONOMICS/or exp ECONOMICS, HOSPITAL/ or expECONOMICS, PHARMACEUTICAL/ or(econom$ or cost or costs or costly or costing orcosted or price or prices or pricing orpharmacoeconomic$).tw or (expenditure$ notenergy).tw or (value adj1 money).tw or budget$.twor cost-effectiveness.mp or cost utili$.mp or costbenefit.mp or exp Cost-Benefit Analysis/ or costminimi$.mp or exp Health Care Costs/ oreconomic evaluation$.mp or exp ‘Costs and CostAnalysis’/ or financ$.mp or exp ResourceAllocation/ or health resource allocation.mp orHealth Resources/ or health resourceutilization.mp or preference?.ab,ti,kw orqaly?.ab,ti,kw or quality adjusted.ab,ti,kw or (utilityor utilities).ab,ti,kw
EMBASE1980 to 2005 week 31Search date: 2 August 2005Number of records: 38
Hearing loss$.mp or exp Hearing loss/ or (hearingadj (disorder$ or difficult$ or problem$ orimpair$)).mp or Hearing Disorders/ AND schoolentry.mp or (pre adj school).mp or (nursery adjschool$).mp or exp Nursery School/ orkindergarten$.mp or exp KINDERGARTEN/ orexp Day Care/ or infant school$.mp early
detect$.mp or exp Child Development/ ANDscreen$.mp or exp MASS SCREENING/ or expSCREENING/ or exp AUDITORY SCREENING/or exp SCREENING TEST/ AND (school entryadj3 (screen$ or exam$)).mp or (medical exam$adj2 school$).mp AND ‘Cost Benefit Analysis’/ or‘Cost-effectiveness Analysis’/ or ‘Cost MinimizationAnalysis’/ or ‘Cost Utility Analysis’/ or EconomicEvaluation/ or (cost or costs or costed or costly orcosting).tw or (economic$ or pharmacoeconomic$or price$ or pricing).tw or (technology adjassessment$).tw
CINAHL1982 to August 2005 week 5Search date: 2 August 2005Number of records: 32
Hearing loss$.mp or exp Hearing loss/ or (hearingadj (disorder$ or difficult$ or problem$ orimpair$)).mp or Hearing Disorders/ AND schoolentry.mp or (pre adj school).mp or (nursery adjschool$).mp or exp Schools, Nursery/ orkindergarten$.mp or exp Day Care/ or infantschool$.mp or early detect$.mp or exp ChildDevelopment/ AND (school entry adj3 (screen$ orexam$)).mp or (medical exam$ adj2 school$).mpAND exp Health Screening/ or screen$.mp or expHearing Screening/ AND (cost or costs or costedor costly or costing).tw or (economic$ orpharmacoeconomic$ or price$ or pricing).tw or(technology adj assessment$).tw or cost benefitanalysis.mp or exp ‘Cost Benefit Analysis’/ or cost-effectiveness.mp or cost minimization.mp or expHealth Care Costs/ or cost utility.mp or economicevaluation$.mp or exp ‘Economic Aspects ofIllness’/ or exp ECONOMICS/ or expECONOMICS, PHARMACEUTICAL/ or healthresource allocation.mp or exp Health ResourceAllocation/ or health resource utilization.mp orexp Health Resource Utilization/
Cochrane Library (Wiley) NHSEED 2005 Issue 2Search date: 28 July 2005Number of records: 12
Health Technology Assessment 2007; Vol. 11: No. 32
151
© Queen’s Printer and Controller of HMSO 2007. All rights reserved.
Appendix 11
Economic search strategies

Exp hearing loss/ or hearing next loss or hearingnext disorder* or hearing next difficult* orhearing next problem* or hearing next impair* orexp hearing disorders/ AND screening or expmass screening/ AND school next entr* or earlydetect* or infant next school* or nursery nextschool* or kindergarten* or exp schools, nursery/or exp Child Day Care Centers/ or exp Child,Preschool/ or exp Child Development/ OR schoolnext entr* or medical near/3 exam* near/3 school*
ECONLIT1969–2002 and 2003–2005Search date: 28 July 2005Number of records: 11
Hearing loss* or hearing disorder* or hearingdifficult* or hearing problem* or hearing impair*or deafness or hypoacusis or hypacusis or hard ofhearing of hard-of-hearing
OHE HEEDJuly 2005 issueSearch date: 26 July 2005Number of records: 18
Hearing AND screen* AND child*
Total references (after de-duplication): 164
Appendix 11
152

MEDLINE1966 to November week 3 2005Search date: 17 November 2005Number of records: 397
Hearing loss$.mp or exp Hearing loss/ or (hearingadj (disorder$ or difficult$ or problem$ orimpair$)).mp or Hearing Disorders/ or deaf$.mpor otitis media with effusion.mp or exp OtitisMedia with Effusion/ or OME.mp or glue ear.mpor (hard adj1 hearing).mp AND economics.mp orexp ECONOMICS, NURSING/ or expECONOMICS, MEDICAL/ or exp ECONOMICS/or exp ECONOMICS, HOSPITAL/ or expECONOMICS, PHARMACEUTICAL/ or(econom$ or cost or costs or costly or costing orcosted or price or prices or pricing orpharmacoeconomic$).tw or (expenditure$ notenergy).tw or (value adj1 money).tw or budget$.twor cost-effectiveness.mp or cost utili$.mp or costbenefit.mp or exp Cost-Benefit Analysis/ or costminimi$.mp or exp Health Care Costs/ oreconomic evaluation$.mp or exp ‘Costs and CostAnalysis’/ or financ$.mp or exp ResourceAllocation/ or health resource allocation.mp orHealth Resources/ or health resourceutilization.mp or preference?.ab,ti,kw orqaly?.ab,ti,kw or quality adjusted.ab,ti,kw or (utilityor utilities).ab,ti,kw AND hearing aid$.mp or expHearing Aids/ or cochlear implant$.mp or expCochlear Implants/ or exp ‘Rehabilitation ofHearing Impaired’/ or hearing tactic$.mp orautoinflation.mp or exp Middle Ear Ventilation/ orgrommet$.mp or tympanostomy.mp ormyringotomy.mp or adenoidectomy.mp or expADENOIDECTOMY/ or exp Language Therapy/or exp Speech Therapy/ or speech languagetherapy.mp or ear nose throat.mp or expEDUCATION/ or education$.mp or expEDUCATION, SPECIAL/ or exp Teaching/ orteach$.mp or exp Comprehensive Health Care/ oraudiolog$.mp or otolaryngology$.mp orpediatric$.mp or clinician$.mp or exp NURSECLINICIANS/ or exp Nursing Staff/ AND limit to(‘newborn infant (birth to 1 month)’ or ‘infant (1to 23 months)’ or ‘preschool child (2 to 5 years)’or ‘child (6 to 12 years)’)
EMBASE1980 to 2006 week 3Search date: 16 January 2006Number of records: 190
‘hearing loss’/exp or ‘hearing loss’ or ‘hearingdisorder’/exp or ‘hearing disorder’ or ‘hearingdifficulty’/exp or ‘hearing difficulty’ or ‘hearingproblem’ or ‘hearing impairment’/exp or ‘hearingimpairment’ or deaf* or ‘otitis media witheffusion’/exp or ‘otitis media with effusion’ or omeor ‘glue ear’/exp or ‘glue ear’ or ‘hard *1 hearing’AND ‘cost benefit analysis’/exp or ‘cost benefitanalysis’ or ‘cost-effectiveness analysis’/exp or‘cost-effectiveness analysis’ or ‘cost minimizationanalysis’/exp or ‘cost minimization analysis’ or‘economic evaluation’/exp or ‘economic evaluation’or (‘cost’/exp or ‘cost’) or costs or costed or costlyor costing or economic* or pharmacoeconomic*or price or pricing or ‘technology *3 assessment’or ‘health resources’/exp or ‘health resources’ or‘quality of life’/exp or ‘quality of life’ AND‘hearing aid’/exp or ‘hearing aid’ or ‘cochlearprosthesis’/exp or ‘cochlear prosthesis’ or ‘auditoryrehabilitation’/exp or ‘auditory rehabilation’ orautoinflation or ‘middle ear ventilation’/exp or‘middle ear ventilation’ or ‘tympanostomytube’/exp or ‘tympanostomy tube’ or grommet* or‘myringotomy’/exp or ‘myringotomy’ oradenoidectomy’/exp or ‘adenoidectomy’ or ‘speechtherapy’/exp or ‘speech therapy’ or‘otorhinolaryngology’/exp or ‘otorhinolaryngology’or ‘ear nose throat surgery’/exp or ‘ear nose throatsurgery’ or ‘education’/exp or ‘education’ or‘teaching’/exp or ‘teaching’ or ‘audiology’/exp or‘audiology’ or pediatric* or nurs* AND[embase]/lim AND ([newborn]/lim or [infant]/limor [preschool]/lim or [school]/lim)
CINAHL1982 to December 2005 week 1Search date: 1 December 2005Number of records: 263
Hearing loss$.mp or exp Hearing loss/ or (hearingadj (disorder$ or difficult$ or problem$ or
Health Technology Assessment 2007; Vol. 11: No. 32
153
© Queen’s Printer and Controller of HMSO 2007. All rights reserved.
Appendix 12
Subsequent management intervention search strategies

impair$)).mp or Hearing Disorders/ or deaf$.mpor exp Deafness/ or otitis media with effusion.mpor exp Otitis Media with Effusion/ or OME.mp orglue ear.mp or (hard adj1 hearing).mp AND (costor costs or costed or costly or costing).tw or(economic$ or pharmacoeconomic$ or price$ orpricing).tw or (technology adj assessment$).tw orcost benefit analysis.mp or exp ‘Cost BenefitAnalysis’/ or cost-effectiveness.mp or costminimization.mp or exp Health Care Costs/ orcost utility.mp or economic evaluation$.mp or exp‘Economic Aspects of Illness’/ or health resourceallocation.sh,mp or health resourceutilization.sh,mp or preference?.mp or exp LifeExpectancy/ or exp ‘Outcomes (Health Care)’/ orexp Quality of Life’/ or qaly?.mp or exp HealthStatus/ or quality adjusted.mp or (utility orutilities).mp AND hearing aid$.mp or expHearing Aids/ or cochlear implant$.mp or expCochlear Implant/ or Communication Skills/ orexp ‘Rehabilitation of Hearing Impaired’/ orhearing tactic$.mp or Conversation/ orCounseling/ or autoinflation.mp or exp MiddleEar Ventilation/ or grommet$.mp ortympanostomy.mp or myringotomy.mp oradenoidectomy.mp or exp ADENOIDECTOMY/or exp Education, Speech-Language Pathology/ orexp ‘Rehabilitation, Speech and Language’/ orspeech language therapy.mp or exp SpeechTherapy/ or exp ‘Education, Continuing (Credit)’/or exp Surgery, Otorhinolagyngologic/ or expSpecialties, Nursing/ or ear nose throat.mp or expDEAF EDUCATION/ or exp PATIENTEDUCATION/ or exp PARENTINGEDUCATION/ or education$.mp or expEDUCATION, SPECIAL/ or exp ‘OUTCOMESOF EDUCATION’/ or exp EDUCATION,CONTINUING/ or exp EDUCATION,AUDIOLOGY/ or exp EDUCATION, SPEECH-LANGUAGE PATHOLOGY/ or expEDUCATION/ or teach$.mp or audiolog$.mp orotolaryngolog$.mp or exp PEDIATRICS/ orpediatric$.mp or clinician$.mp AND limit to(newborn infant <birth to 1 month> or infant <1to 23 months> or preschool child <2 to 5 years>or child <6 to 12 years>)
Cochrane Library (Wiley internetversion) NHS EED 2006 Issue 1Search date: 31 January 2006Number of records: 69
Hearing next (loss or disorder* or difficulty orproblem or impairment) or deaf or otitis nextmedia or OME or glue next ear or hard near/2hearing AND hearing next aid* or cochlear nextimplant* or rehabilitation near/2 hearing orhearing next tactics or autoinflation or middlenext ear next ventilation or grommet* ortympanostomy or myringotomy or adenoidectomyor language next therapy or speech next therapyor ear next nose or education or teaching orcomprehensive next health or audiology orotolaryngology or paediatrician* or clinician*AND restrict to NHS EED database
ECONLIT1969–2002 and 2003–2005/12Search date: 11 January 2006Number of records: 39
hearing or deaf* or otitis AND manage* or treat*or intervene* or otolaryngology* or audiolog* orspeech or rehabilit* or nurs* or aid* or implant*or grommet* or autoinflation or tympanostomy ormyringotomy or adenoid* or language
OHE HEEDJanuary 2006 issueSearch date: 10 January 2006Number of records: 189
hearing or deaf* or otitis AND manage* or treat*or intervene* or otolaryngology* or audiolog* orspeech or rehabilit* or nurs* or aid* or implant*or grommet* or autoinflation or tympanostomy ormyringotomy or adenoid* or language
Total references (after de-duplication): 960
Appendix 12
154

Health Technology Assessment 2007; Vol. 11: No. 32
155
© Queen’s Printer and Controller of HMSO 2007. All rights reserved.
Appendix 13
Inclusion/exclusion economic data form
Trial author and date: Ref. no:
Yes No ?
1. Based on primary data collection or systematic review?
2. Children 4–6 years old, undergoing any of the following interventions?Pure tone audiometryQuestionnairesReflectometryOtoadmittance testsSpeech audiometryOtoacoustic emissionsMedical examinations (which entail a hearing screen)
3. Including at least two of the following interventions?Pure tone audiometryTympanometryAcoustic reflexOtoadmittance testsAuditory brainstem responseMedical examinations (which entail a hearing screen)Speech perception testsDistraction testBehavioural testQuestionnairesOtoacoustic emissionsNo screen
4. Assessing any of the following outcomes?Year with no or mild/moderate disability due to hearing lossYear with moderate or severe disability due to hearing lossQuality-adjusted life-year gainedUtility measureHealth status measure
5. Resource use and costs and utilities associated with screening programmes and subsequent management?
6. Report resource use and cost separately?
7. Report sufficient detail to extract costs and outcome data relevant to each alternative comparison of screening programmes?

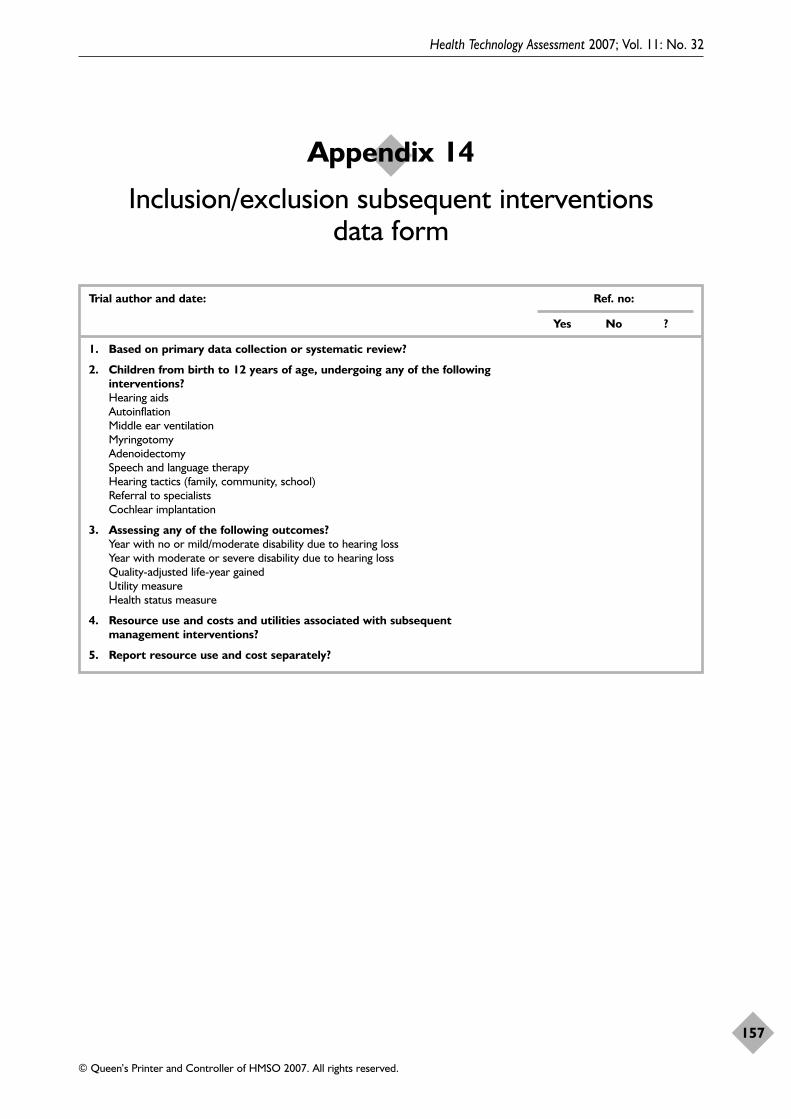
Health Technology Assessment 2007; Vol. 11: No. 32
157
© Queen’s Printer and Controller of HMSO 2007. All rights reserved.
Appendix 14
Inclusion/exclusion subsequent interventions data form
Trial author and date: Ref. no:
Yes No ?
1. Based on primary data collection or systematic review?
2. Children from birth to 12 years of age, undergoing any of the following interventions?Hearing aidsAutoinflationMiddle ear ventilationMyringotomyAdenoidectomySpeech and language therapyHearing tactics (family, community, school)Referral to specialistsCochlear implantation
3. Assessing any of the following outcomes?Year with no or mild/moderate disability due to hearing lossYear with moderate or severe disability due to hearing lossQuality-adjusted life-year gainedUtility measureHealth status measure
4. Resource use and costs and utilities associated with subsequent management interventions?
5. Report resource use and cost separately?


Health Technology Assessment 2007; Vol. 11: No. 32
159
© Queen’s Printer and Controller of HMSO 2007. All rights reserved.
Appendix 15
Economic data extraction form
Economic Data Extraction Form
General InformationPaper Reference No. Date: Reviewer ID:Author/Year:
Title:
Sub Title:
Journal:
Source of funding:
Notes/Comments:
Study CharacteristicsHealth Technology:
Comparator:
Type of Intervention Economic Study Type Perspective
Primary Prevention Cost-effectiveness Analysis NHSSecondary Prevention Cost-utility Analysis SocietalScreening Cost-benefit Analysis HospitalDiagnosis Cost-consequence Analysis Not StatedTreatment Cost-Study Other (Please Specify) Rehabilitation Not ReportedPalliative Care Setting:Other (Please Specify) Not ReportedHypothesis/Study Question:
Study Population:
Dates to which Data Relate Modelling
Effectiveness Evidence Was a model used?Resource Use Yes
NoPrice Year If yes state purpose and type:

Appendix 15
160
Source of DataSource of Effectiveness Data Source of Cost DataSingle Study Actual SourceSynthesis of Prev. Pub. Literature Source
Link between Effectiveness and Costs
Effectiveness data from a single studyStudy Sample: Study design:
Power calculation RCT Duration of follow-up:
Number subjects inintervention group
Non-RCT withconcurrentcontrols
Loss to follow-up:
Number subjects incontrol group
Cohort study Any blinding for assessment of outcomes:
Recruitment rate Historicalcontrols
Analysis of clinical study:
Number excluded from study
Before and afterstudy
Treatment completers
Method of sample selection: Case series Intention to treat
Other (specify) Effectiveness results:
Not reported
Number ofcentres
Effectiveness data from a synthesis of previous studies (model)Study inclusion criteria: Study designs
included:Number of primary studies included:

Health Technology Assessment 2007; Vol. 11: No. 32
161
© Queen’s Printer and Controller of HMSO 2007. All rights reserved.
Study exclusion criteriareported:
RCT Method of combination ofprimary studies:
Sources searched reported: Non-RCT withconcurrentcontrols
Meta-analysis
Criteria used to judge validity: Cohort study Narrative method
Concealment ofrandomisation
Historicalcontrols
Other (specify)
Blind assessment Before and afterstudy
Results of the review:
Low drop out rates Case series
Other (specify) Other (specify)
Not reported Not reported

Appendix 15
162
Economic EvaluationMeasure of Benefits used in the Economic Analysis
No Measure of Benefit (CCA orCMA)
Direct costs: Health service Estimation of Direct Costs Based On:
A GuessActual DataDerived using ModellingOtherNot Reported
Direct costs: Patient Estimation of Patient Direct Costs Based On:
A GuessActual DataDerived using ModellingOther
Not Reported
Source of Direct Cost Data:
Price Year:
Discounting Undertaken?
Yes Discount Rate
NoCurrency:

Health Technology Assessment 2007; Vol. 11: No. 32
163
© Queen’s Printer and Controller of HMSO 2007. All rights reserved.
Economic Evaluation (continued)Indirect Costs Estimation of Indirect Costs Based
On:
A GuessActual DataDerived usingModellingOtherNot Reported
Source of Indirect Cost Data
Price Year:
Discounting Undertaken?
Yes Discount Rate:No
Currency: Conversion Rates Used:
Statistical/Sensitivity AnalysesStatistical Tests Carried Out? Types of test used in Analysis of Costs:
YesNo
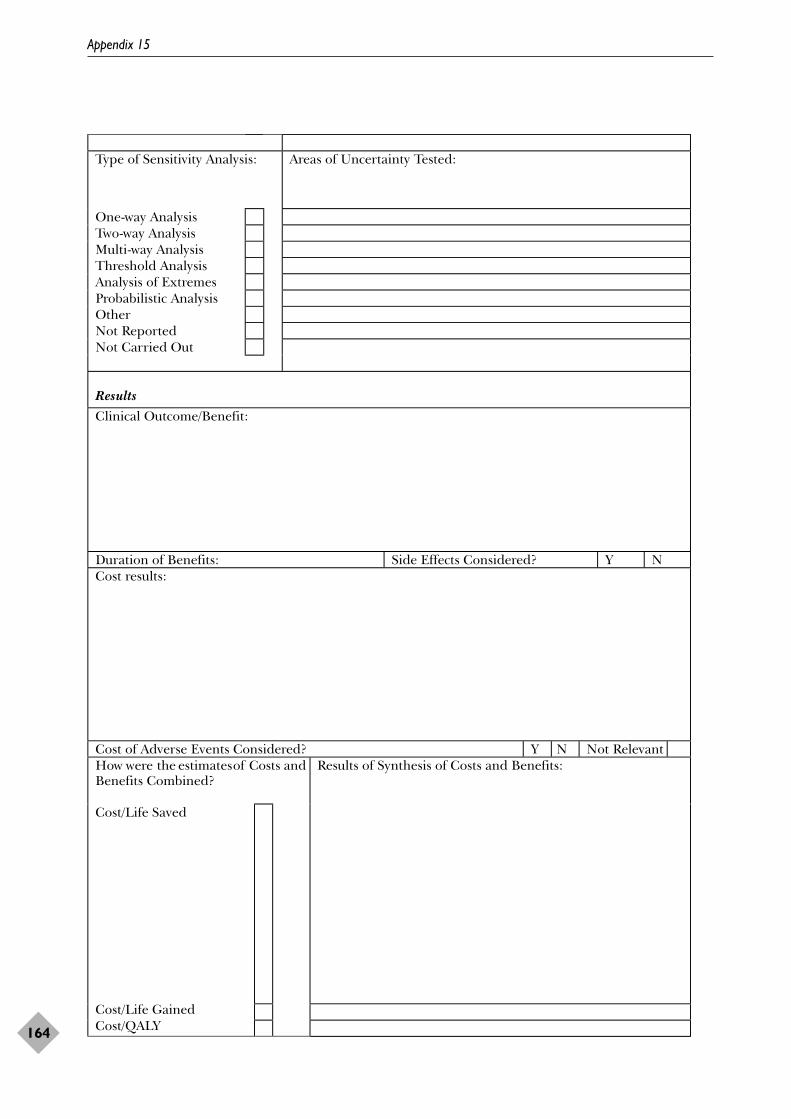
Appendix 15
164
Type of Sensitivity Analysis: Areas of Uncertainty Tested:
One-way AnalysisTwo-way AnalysisMulti-way AnalysisThreshold AnalysisAnalysis of ExtremesProbabilistic AnalysisOtherNot ReportedNot Carried Out
ResultsClinical Outcome/Benefit:
Duration of Benefits: Side Effects Considered? Y NCost results:
Cost of Adverse Events Considered? Y N Not RelevantHow were the estimates of Costs andBenefits Combined?
Results of Synthesis of Costs and Benefits:
Cost/Life Saved
Cost/Life GainedCost/QALY

Health Technology Assessment 2007; Vol. 11: No. 32
165
© Queen’s Printer and Controller of HMSO 2007. All rights reserved.
Net BenefitIncremental Net BenefitOtherNot Combined
Author’s Conclusions:
Reviewer’s Conclusions:
Overall assessment of study quality:


Health Technology Assessment 2007; Vol. 11: No. 32
167
© Queen’s Printer and Controller of HMSO 2007. All rights reserved.
Appendix 16
Description of included papers

Appendix 16
168 TAB
LE 9
8D
escr
iptio
n of
incl
uded
pap
ers
Stud
y ch
arac
teri
stic
sC
ompa
rato
rsEc
onom
ic s
tudy
typ
e an
d po
pula
tion
Dat
a
Auth
ors:
Dris
coll,
et
al.,
2000
88
Sett
ing:
Aud
iolo
gica
l clin
ic,
Aus
tral
iaPe
rspe
ctive
:Not
sta
ted
Fund
ing:
Uni
vers
ity o
fQ
ueen
sland
NA
Stud
y:St
udy
Hea
lth t
echn
olog
y:T
EOA
E an
d PT
ATy
pe o
f int
erve
ntio
n:Sc
reen
ing
Popu
latio
n:In
fant
s w
ith a
mea
n ag
e of
2m
onth
s (r
ange
1.5
–2.5
) and
chi
ldre
n w
itha
mea
n ag
e of
6.2
yea
rs (r
ange
5.2
–7.9
)So
urce
s:A
ctua
l stu
dy, s
ynth
esis
of d
ata
from
prev
ious
pub
licat
ions
for
effe
ctiv
enes
s
Dat
e:20
00Ef
fect
ivene
ss:R
ate
of t
ests
per
hou
rRe
sour
ce u
se:A
udio
logi
sts,
equ
ipm
ent
Pric
e ye
ar:N
ot c
lear
Dire
ct c
osts
:Hou
rly w
age
of a
full-
time
audi
olog
ist, c
ost
of e
quip
men
t, co
st o
f ann
ual
equi
pmen
t m
aint
enan
ce, c
ost
per
child
scr
eene
d In
dire
ct c
osts
:NR
Curr
ency
:Aus
tral
ian
dolla
rsLi
nk b
etw
een
effe
ctive
ness
and
cos
ts:C
ost
per
child
= S
/R +
(C +
(M*L
)/(N
*L))
whe
re S
= s
alar
y of
scr
eene
r, R
= r
ate
of t
ests
/hou
r, C
= c
ost
of in
itial
equ
ipm
ent
purc
hase
, M =
cos
t of
ann
ual m
aint
enan
ce, L
= e
xpec
ted
life
of e
quip
men
t in
yea
rs,
and
N =
num
ber
of c
ases
per
yea
r
The
tot
al a
nnua
l cos
t (T
C) o
f the
pro
gram
mes
was
det
erm
ined
usin
g th
e fo
llow
ing
equa
tion:
TC
= C
PC ×
N. T
he c
ost
per
hear
ing
impa
ired
child
(CPH
Ia) w
asca
lcul
ated
usin
g th
e eq
uatio
n: C
PHIa
= T
C/#
HL
(whe
re #
HL
is th
e nu
mbe
r of
child
ren
diag
nose
d w
ith a
uni
late
ral o
r bi
late
ral,
sens
orin
eura
l or
mix
ed h
earin
gim
pairm
ent
of a
t le
ast
a m
oder
ate
degr
ee (3
FA �
41))
. The
cos
t pe
r ch
ild w
ithse
nsor
ineu
ral/m
ixed
/con
duct
ive
hear
ing
impa
irmen
t w
as c
alcu
late
d ba
sed
on t
henu
mbe
r of
chi
ldre
n di
agno
sed
with
any
hea
ring
impa
irmen
t
Auth
ors:
Hol
tby
and
Fors
ter,
1992
89
Sett
ing:
Infa
nt o
r pr
imar
ysc
hool
s, U
KPe
rspe
ctive
:NH
SFu
ndin
g:N
ot s
tate
d
Impe
danc
em
easu
rem
ents
agai
nst
PTA
Stud
y:Ef
fect
iven
ess
Hea
lth t
echn
olog
y:Im
peda
nce
mea
sure
men
tsTy
pe o
f int
erve
ntio
n:Sc
reen
ing
Popu
latio
n:6-
year
-old
sch
oolc
hild
ren
Sour
ces:
Sing
le s
tudy
for
the
effe
ctiv
enes
sda
ta. T
he s
ourc
e fo
r th
e co
st d
ata
was
not
repo
rted
Dat
e:19
88Ef
fect
ivene
ss:S
ensit
ivity
, spe
cific
ity, r
epea
tabi
lity,
pre
dict
ive
valu
e, s
cree
ning
rat
eRe
sour
ce u
se:N
urse
s, a
udio
met
ers
Pric
e ye
ar:N
RD
irect
cos
ts:S
alar
y, c
ost
of e
quip
men
t, co
st o
f ann
ual m
aint
enan
ceIn
dire
ct c
osts
: NR
Curr
ency
:UK
ste
rling
Link
bet
wee
n ef
fect
ivene
ss a
nd c
osts
:Cos
t pe
r ch
ild s
cree
ned
per
inst
rum
ent
= S
/R +
(C +
(M*L
)/(N
*L))
whe
re S
= s
alar
y of
scr
eene
r, R
= r
ate
of t
ests
, C =
cos
t of
equ
ipm
ent,
M =
cos
t of
annu
al m
aint
enan
ce, L
= e
xpec
ted
life
of e
quip
men
t in
yea
rs, a
nd N
= n
umbe
r of
child
ren
scre
ened
per
inst
rum
ent
per
year

Health Technology Assessment 2007; Vol. 11: No. 32
169
© Queen’s Printer and Controller of HMSO 2007. All rights reserved.
Volume 1, 1997
No. 1Home parenteral nutrition: a systematicreview.
By Richards DM, Deeks JJ, SheldonTA, Shaffer JL.
No. 2Diagnosis, management and screeningof early localised prostate cancer.
A review by Selley S, Donovan J,Faulkner A, Coast J, Gillatt D.
No. 3The diagnosis, management, treatmentand costs of prostate cancer in Englandand Wales.
A review by Chamberlain J, Melia J,Moss S, Brown J.
No. 4Screening for fragile X syndrome.
A review by Murray J, Cuckle H,Taylor G, Hewison J.
No. 5A review of near patient testing inprimary care.
By Hobbs FDR, Delaney BC,Fitzmaurice DA, Wilson S, Hyde CJ,Thorpe GH, et al.
No. 6Systematic review of outpatient servicesfor chronic pain control.
By McQuay HJ, Moore RA, EcclestonC, Morley S, de C Williams AC.
No. 7Neonatal screening for inborn errors ofmetabolism: cost, yield and outcome.
A review by Pollitt RJ, Green A,McCabe CJ, Booth A, Cooper NJ,Leonard JV, et al.
No. 8Preschool vision screening.
A review by Snowdon SK, Stewart-Brown SL.
No. 9Implications of socio-cultural contextsfor the ethics of clinical trials.
A review by Ashcroft RE, ChadwickDW, Clark SRL, Edwards RHT, Frith L,Hutton JL.
No. 10A critical review of the role of neonatalhearing screening in the detection ofcongenital hearing impairment.
By Davis A, Bamford J, Wilson I,Ramkalawan T, Forshaw M, Wright S.
No. 11Newborn screening for inborn errors ofmetabolism: a systematic review.
By Seymour CA, Thomason MJ,Chalmers RA, Addison GM, Bain MD,Cockburn F, et al.
No. 12Routine preoperative testing: a systematic review of the evidence.
By Munro J, Booth A, Nicholl J.
No. 13Systematic review of the effectiveness of laxatives in the elderly.
By Petticrew M, Watt I, Sheldon T.
No. 14When and how to assess fast-changingtechnologies: a comparative study ofmedical applications of four generictechnologies.
A review by Mowatt G, Bower DJ,Brebner JA, Cairns JA, Grant AM,McKee L.
Volume 2, 1998
No. 1Antenatal screening for Down’ssyndrome.
A review by Wald NJ, Kennard A,Hackshaw A, McGuire A.
No. 2Screening for ovarian cancer: a systematic review.
By Bell R, Petticrew M, Luengo S,Sheldon TA.
No. 3Consensus development methods, andtheir use in clinical guidelinedevelopment.
A review by Murphy MK, Black NA,Lamping DL, McKee CM, SandersonCFB, Askham J, et al.
No. 4A cost–utility analysis of interferon beta for multiple sclerosis.
By Parkin D, McNamee P, Jacoby A,Miller P, Thomas S, Bates D.
No. 5Effectiveness and efficiency of methodsof dialysis therapy for end-stage renaldisease: systematic reviews.
By MacLeod A, Grant A, Donaldson C, Khan I, Campbell M,Daly C, et al.
No. 6Effectiveness of hip prostheses inprimary total hip replacement: a criticalreview of evidence and an economicmodel.
By Faulkner A, Kennedy LG, Baxter K, Donovan J, Wilkinson M,Bevan G.
No. 7Antimicrobial prophylaxis in colorectalsurgery: a systematic review ofrandomised controlled trials.
By Song F, Glenny AM.
No. 8Bone marrow and peripheral bloodstem cell transplantation for malignancy.
A review by Johnson PWM, Simnett SJ,Sweetenham JW, Morgan GJ, Stewart LA.
No. 9Screening for speech and languagedelay: a systematic review of theliterature.
By Law J, Boyle J, Harris F, HarknessA, Nye C.
No. 10Resource allocation for chronic stableangina: a systematic review ofeffectiveness, costs and cost-effectiveness of alternativeinterventions.
By Sculpher MJ, Petticrew M, Kelland JL, Elliott RA, Holdright DR,Buxton MJ.
No. 11Detection, adherence and control ofhypertension for the prevention ofstroke: a systematic review.
By Ebrahim S.
No. 12Postoperative analgesia and vomiting,with special reference to day-casesurgery: a systematic review.
By McQuay HJ, Moore RA.
No. 13Choosing between randomised andnonrandomised studies: a systematicreview.
By Britton A, McKee M, Black N,McPherson K, Sanderson C, Bain C.
No. 14Evaluating patient-based outcomemeasures for use in clinical trials.
A review by Fitzpatrick R, Davey C,Buxton MJ, Jones DR.
Health Technology Assessment reports published to date

No. 15Ethical issues in the design and conductof randomised controlled trials.
A review by Edwards SJL, Lilford RJ,Braunholtz DA, Jackson JC, Hewison J,Thornton J.
No. 16Qualitative research methods in healthtechnology assessment: a review of theliterature.
By Murphy E, Dingwall R, GreatbatchD, Parker S, Watson P.
No. 17The costs and benefits of paramedicskills in pre-hospital trauma care.
By Nicholl J, Hughes S, Dixon S,Turner J, Yates D.
No. 18Systematic review of endoscopicultrasound in gastro-oesophagealcancer.
By Harris KM, Kelly S, Berry E,Hutton J, Roderick P, Cullingworth J, et al.
No. 19Systematic reviews of trials and otherstudies.
By Sutton AJ, Abrams KR, Jones DR,Sheldon TA, Song F.
No. 20Primary total hip replacement surgery: a systematic review of outcomes andmodelling of cost-effectivenessassociated with different prostheses.
A review by Fitzpatrick R, Shortall E,Sculpher M, Murray D, Morris R, LodgeM, et al.
Volume 3, 1999
No. 1Informed decision making: an annotatedbibliography and systematic review.
By Bekker H, Thornton JG, Airey CM, Connelly JB, Hewison J,Robinson MB, et al.
No. 2Handling uncertainty when performingeconomic evaluation of healthcareinterventions.
A review by Briggs AH, Gray AM.
No. 3The role of expectancies in the placeboeffect and their use in the delivery ofhealth care: a systematic review.
By Crow R, Gage H, Hampson S,Hart J, Kimber A, Thomas H.
No. 4A randomised controlled trial ofdifferent approaches to universalantenatal HIV testing: uptake andacceptability. Annex: Antenatal HIVtesting – assessment of a routinevoluntary approach.
By Simpson WM, Johnstone FD, BoydFM, Goldberg DJ, Hart GJ, GormleySM, et al.
No. 5Methods for evaluating area-wide andorganisation-based interventions inhealth and health care: a systematicreview.
By Ukoumunne OC, Gulliford MC,Chinn S, Sterne JAC, Burney PGJ.
No. 6Assessing the costs of healthcaretechnologies in clinical trials.
A review by Johnston K, Buxton MJ,Jones DR, Fitzpatrick R.
No. 7Cooperatives and their primary careemergency centres: organisation andimpact.
By Hallam L, Henthorne K.
No. 8Screening for cystic fibrosis.
A review by Murray J, Cuckle H,Taylor G, Littlewood J, Hewison J.
No. 9A review of the use of health statusmeasures in economic evaluation.
By Brazier J, Deverill M, Green C,Harper R, Booth A.
No. 10Methods for the analysis of quality-of-life and survival data in healthtechnology assessment.
A review by Billingham LJ, AbramsKR, Jones DR.
No. 11Antenatal and neonatalhaemoglobinopathy screening in theUK: review and economic analysis.
By Zeuner D, Ades AE, Karnon J,Brown J, Dezateux C, Anionwu EN.
No. 12Assessing the quality of reports ofrandomised trials: implications for theconduct of meta-analyses.
A review by Moher D, Cook DJ, JadadAR, Tugwell P, Moher M, Jones A, et al.
No. 13‘Early warning systems’ for identifyingnew healthcare technologies.
By Robert G, Stevens A, Gabbay J.
No. 14A systematic review of the role of humanpapillomavirus testing within a cervicalscreening programme.
By Cuzick J, Sasieni P, Davies P,Adams J, Normand C, Frater A, et al.
No. 15Near patient testing in diabetes clinics:appraising the costs and outcomes.
By Grieve R, Beech R, Vincent J,Mazurkiewicz J.
No. 16Positron emission tomography:establishing priorities for healthtechnology assessment.
A review by Robert G, Milne R.
No. 17 (Pt 1)The debridement of chronic wounds: a systematic review.
By Bradley M, Cullum N, Sheldon T.
No. 17 (Pt 2)Systematic reviews of wound caremanagement: (2) Dressings and topicalagents used in the healing of chronicwounds.
By Bradley M, Cullum N, Nelson EA,Petticrew M, Sheldon T, Torgerson D.
No. 18A systematic literature review of spiraland electron beam computedtomography: with particular reference toclinical applications in hepatic lesions,pulmonary embolus and coronary arterydisease.
By Berry E, Kelly S, Hutton J, Harris KM, Roderick P, Boyce JC, et al.
No. 19What role for statins? A review andeconomic model.
By Ebrahim S, Davey Smith G,McCabe C, Payne N, Pickin M, SheldonTA, et al.
No. 20Factors that limit the quality, numberand progress of randomised controlledtrials.
A review by Prescott RJ, Counsell CE,Gillespie WJ, Grant AM, Russell IT,Kiauka S, et al.
No. 21Antimicrobial prophylaxis in total hipreplacement: a systematic review.
By Glenny AM, Song F.
No. 22Health promoting schools and healthpromotion in schools: two systematicreviews.
By Lister-Sharp D, Chapman S,Stewart-Brown S, Sowden A.
No. 23Economic evaluation of a primary care-based education programme for patientswith osteoarthritis of the knee.
A review by Lord J, Victor C,Littlejohns P, Ross FM, Axford JS.
Volume 4, 2000
No. 1The estimation of marginal timepreference in a UK-wide sample(TEMPUS) project.
A review by Cairns JA, van der PolMM.
No. 2Geriatric rehabilitation followingfractures in older people: a systematicreview.
By Cameron I, Crotty M, Currie C,Finnegan T, Gillespie L, Gillespie W, et al.
Health Technology Assessment reports published to date
170

No. 3Screening for sickle cell disease andthalassaemia: a systematic review withsupplementary research.
By Davies SC, Cronin E, Gill M,Greengross P, Hickman M, Normand C.
No. 4Community provision of hearing aidsand related audiology services.
A review by Reeves DJ, Alborz A,Hickson FS, Bamford JM.
No. 5False-negative results in screeningprogrammes: systematic review ofimpact and implications.
By Petticrew MP, Sowden AJ, Lister-Sharp D, Wright K.
No. 6Costs and benefits of communitypostnatal support workers: arandomised controlled trial.
By Morrell CJ, Spiby H, Stewart P,Walters S, Morgan A.
No. 7Implantable contraceptives (subdermalimplants and hormonally impregnatedintrauterine systems) versus other formsof reversible contraceptives: twosystematic reviews to assess relativeeffectiveness, acceptability, tolerabilityand cost-effectiveness.
By French RS, Cowan FM, MansourDJA, Morris S, Procter T, Hughes D, et al.
No. 8An introduction to statistical methodsfor health technology assessment.
A review by White SJ, Ashby D, Brown PJ.
No. 9Disease-modifying drugs for multiplesclerosis: a rapid and systematic review.
By Clegg A, Bryant J, Milne R.
No. 10Publication and related biases.
A review by Song F, Eastwood AJ,Gilbody S, Duley L, Sutton AJ.
No. 11Cost and outcome implications of theorganisation of vascular services.
By Michaels J, Brazier J, PalfreymanS, Shackley P, Slack R.
No. 12Monitoring blood glucose control indiabetes mellitus: a systematic review.
By Coster S, Gulliford MC, Seed PT,Powrie JK, Swaminathan R.
No. 13The effectiveness of domiciliary healthvisiting: a systematic review ofinternational studies and a selective review of the Britishliterature.
By Elkan R, Kendrick D, Hewitt M,Robinson JJA, Tolley K, Blair M, et al.
No. 14The determinants of screening uptakeand interventions for increasing uptake:a systematic review.
By Jepson R, Clegg A, Forbes C,Lewis R, Sowden A, Kleijnen J.
No. 15The effectiveness and cost-effectivenessof prophylactic removal of wisdomteeth.
A rapid review by Song F, O’Meara S,Wilson P, Golder S, Kleijnen J.
No. 16Ultrasound screening in pregnancy: asystematic review of the clinicaleffectiveness, cost-effectiveness andwomen’s views.
By Bricker L, Garcia J, Henderson J,Mugford M, Neilson J, Roberts T, et al.
No. 17A rapid and systematic review of theeffectiveness and cost-effectiveness ofthe taxanes used in the treatment ofadvanced breast and ovarian cancer.
By Lister-Sharp D, McDonagh MS,Khan KS, Kleijnen J.
No. 18Liquid-based cytology in cervicalscreening: a rapid and systematic review.
By Payne N, Chilcott J, McGoogan E.
No. 19Randomised controlled trial of non-directive counselling,cognitive–behaviour therapy and usualgeneral practitioner care in themanagement of depression as well asmixed anxiety and depression inprimary care.
By King M, Sibbald B, Ward E, BowerP, Lloyd M, Gabbay M, et al.
No. 20Routine referral for radiography ofpatients presenting with low back pain:is patients’ outcome influenced by GPs’referral for plain radiography?
By Kerry S, Hilton S, Patel S, DundasD, Rink E, Lord J.
No. 21Systematic reviews of wound caremanagement: (3) antimicrobial agentsfor chronic wounds; (4) diabetic footulceration.
By O’Meara S, Cullum N, Majid M,Sheldon T.
No. 22Using routine data to complement andenhance the results of randomisedcontrolled trials.
By Lewsey JD, Leyland AH, Murray GD, Boddy FA.
No. 23Coronary artery stents in the treatmentof ischaemic heart disease: a rapid andsystematic review.
By Meads C, Cummins C, Jolly K,Stevens A, Burls A, Hyde C.
No. 24Outcome measures for adult criticalcare: a systematic review.
By Hayes JA, Black NA, Jenkinson C, Young JD, Rowan KM,Daly K, et al.
No. 25A systematic review to evaluate theeffectiveness of interventions to promote the initiation of breastfeeding.
By Fairbank L, O’Meara S, RenfrewMJ, Woolridge M, Sowden AJ, Lister-Sharp D.
No. 26Implantable cardioverter defibrillators:arrhythmias. A rapid and systematicreview.
By Parkes J, Bryant J, Milne R.
No. 27Treatments for fatigue in multiplesclerosis: a rapid and systematic review.
By Brañas P, Jordan R, Fry-Smith A,Burls A, Hyde C.
No. 28Early asthma prophylaxis, naturalhistory, skeletal development andeconomy (EASE): a pilot randomisedcontrolled trial.
By Baxter-Jones ADG, Helms PJ,Russell G, Grant A, Ross S, Cairns JA, et al.
No. 29Screening for hypercholesterolaemiaversus case finding for familialhypercholesterolaemia: a systematicreview and cost-effectiveness analysis.
By Marks D, Wonderling D,Thorogood M, Lambert H, HumphriesSE, Neil HAW.
No. 30A rapid and systematic review of theclinical effectiveness and cost-effectiveness of glycoprotein IIb/IIIaantagonists in the medical managementof unstable angina.
By McDonagh MS, Bachmann LM,Golder S, Kleijnen J, ter Riet G.
No. 31A randomised controlled trial ofprehospital intravenous fluidreplacement therapy in serious trauma.
By Turner J, Nicholl J, Webber L,Cox H, Dixon S, Yates D.
No. 32Intrathecal pumps for giving opioids inchronic pain: a systematic review.
By Williams JE, Louw G, Towlerton G.
No. 33Combination therapy (interferon alfaand ribavirin) in the treatment ofchronic hepatitis C: a rapid andsystematic review.
By Shepherd J, Waugh N, Hewitson P.
Health Technology Assessment 2007; Vol. 11: No. 32
171
© Queen’s Printer and Controller of HMSO 2007. All rights reserved.

No. 34A systematic review of comparisons ofeffect sizes derived from randomisedand non-randomised studies.
By MacLehose RR, Reeves BC,Harvey IM, Sheldon TA, Russell IT,Black AMS.
No. 35Intravascular ultrasound-guidedinterventions in coronary artery disease:a systematic literature review, withdecision-analytic modelling, of outcomesand cost-effectiveness.
By Berry E, Kelly S, Hutton J,Lindsay HSJ, Blaxill JM, Evans JA, et al.
No. 36A randomised controlled trial toevaluate the effectiveness and cost-effectiveness of counselling patients withchronic depression.
By Simpson S, Corney R, Fitzgerald P,Beecham J.
No. 37Systematic review of treatments foratopic eczema.
By Hoare C, Li Wan Po A, Williams H.
No. 38Bayesian methods in health technologyassessment: a review.
By Spiegelhalter DJ, Myles JP, Jones DR, Abrams KR.
No. 39The management of dyspepsia: asystematic review.
By Delaney B, Moayyedi P, Deeks J,Innes M, Soo S, Barton P, et al.
No. 40A systematic review of treatments forsevere psoriasis.
By Griffiths CEM, Clark CM, ChalmersRJG, Li Wan Po A, Williams HC.
Volume 5, 2001
No. 1Clinical and cost-effectiveness ofdonepezil, rivastigmine andgalantamine for Alzheimer’s disease: arapid and systematic review.
By Clegg A, Bryant J, Nicholson T,McIntyre L, De Broe S, Gerard K, et al.
No. 2The clinical effectiveness and cost-effectiveness of riluzole for motorneurone disease: a rapid and systematicreview.
By Stewart A, Sandercock J, Bryan S,Hyde C, Barton PM, Fry-Smith A, et al.
No. 3Equity and the economic evaluation ofhealthcare.
By Sassi F, Archard L, Le Grand J.
No. 4Quality-of-life measures in chronicdiseases of childhood.
By Eiser C, Morse R.
No. 5Eliciting public preferences forhealthcare: a systematic review oftechniques.
By Ryan M, Scott DA, Reeves C, BateA, van Teijlingen ER, Russell EM, et al.
No. 6General health status measures forpeople with cognitive impairment:learning disability and acquired braininjury.
By Riemsma RP, Forbes CA, Glanville JM, Eastwood AJ, Kleijnen J.
No. 7An assessment of screening strategies forfragile X syndrome in the UK.
By Pembrey ME, Barnicoat AJ,Carmichael B, Bobrow M, Turner G.
No. 8Issues in methodological research:perspectives from researchers andcommissioners.
By Lilford RJ, Richardson A, StevensA, Fitzpatrick R, Edwards S, Rock F, et al.
No. 9Systematic reviews of wound caremanagement: (5) beds; (6) compression;(7) laser therapy, therapeuticultrasound, electrotherapy andelectromagnetic therapy.
By Cullum N, Nelson EA, FlemmingK, Sheldon T.
No. 10Effects of educational and psychosocialinterventions for adolescents withdiabetes mellitus: a systematic review.
By Hampson SE, Skinner TC, Hart J,Storey L, Gage H, Foxcroft D, et al.
No. 11Effectiveness of autologous chondrocytetransplantation for hyaline cartilagedefects in knees: a rapid and systematicreview.
By Jobanputra P, Parry D, Fry-SmithA, Burls A.
No. 12Statistical assessment of the learningcurves of health technologies.
By Ramsay CR, Grant AM, Wallace SA, Garthwaite PH, Monk AF,Russell IT.
No. 13The effectiveness and cost-effectivenessof temozolomide for the treatment ofrecurrent malignant glioma: a rapid andsystematic review.
By Dinnes J, Cave C, Huang S, Major K, Milne R.
No. 14A rapid and systematic review of theclinical effectiveness and cost-effectiveness of debriding agents intreating surgical wounds healing bysecondary intention.
By Lewis R, Whiting P, ter Riet G,O’Meara S, Glanville J.
No. 15Home treatment for mental healthproblems: a systematic review.
By Burns T, Knapp M, Catty J, Healey A, Henderson J, Watt H, et al.
No. 16How to develop cost-consciousguidelines.
By Eccles M, Mason J.
No. 17The role of specialist nurses in multiplesclerosis: a rapid and systematic review.
By De Broe S, Christopher F, Waugh N.
No. 18A rapid and systematic review of theclinical effectiveness and cost-effectiveness of orlistat in themanagement of obesity.
By O’Meara S, Riemsma R, Shirran L, Mather L, ter Riet G.
No. 19The clinical effectiveness and cost-effectiveness of pioglitazone for type 2diabetes mellitus: a rapid and systematicreview.
By Chilcott J, Wight J, Lloyd JonesM, Tappenden P.
No. 20Extended scope of nursing practice: amulticentre randomised controlled trialof appropriately trained nurses andpreregistration house officers in pre-operative assessment in elective generalsurgery.
By Kinley H, Czoski-Murray C,George S, McCabe C, Primrose J, Reilly C, et al.
No. 21Systematic reviews of the effectiveness ofday care for people with severe mentaldisorders: (1) Acute day hospital versusadmission; (2) Vocational rehabilitation;(3) Day hospital versus outpatient care.
By Marshall M, Crowther R, Almaraz-Serrano A, Creed F, Sledge W, Kluiter H, et al.
No. 22The measurement and monitoring ofsurgical adverse events.
By Bruce J, Russell EM, Mollison J,Krukowski ZH.
No. 23Action research: a systematic review andguidance for assessment.
By Waterman H, Tillen D, Dickson R,de Koning K.
No. 24A rapid and systematic review of theclinical effectiveness and cost-effectiveness of gemcitabine for thetreatment of pancreatic cancer.
By Ward S, Morris E, Bansback N,Calvert N, Crellin A, Forman D, et al.
Health Technology Assessment reports published to date
172

No. 25A rapid and systematic review of theevidence for the clinical effectivenessand cost-effectiveness of irinotecan,oxaliplatin and raltitrexed for thetreatment of advanced colorectal cancer.
By Lloyd Jones M, Hummel S,Bansback N, Orr B, Seymour M.
No. 26Comparison of the effectiveness ofinhaler devices in asthma and chronicobstructive airways disease: a systematicreview of the literature.
By Brocklebank D, Ram F, Wright J,Barry P, Cates C, Davies L, et al.
No. 27The cost-effectiveness of magneticresonance imaging for investigation ofthe knee joint.
By Bryan S, Weatherburn G, BungayH, Hatrick C, Salas C, Parry D, et al.
No. 28A rapid and systematic review of theclinical effectiveness and cost-effectiveness of topotecan for ovariancancer.
By Forbes C, Shirran L, Bagnall A-M,Duffy S, ter Riet G.
No. 29Superseded by a report published in alater volume.
No. 30The role of radiography in primary carepatients with low back pain of at least 6weeks duration: a randomised(unblinded) controlled trial.
By Kendrick D, Fielding K, Bentley E,Miller P, Kerslake R, Pringle M.
No. 31Design and use of questionnaires: areview of best practice applicable tosurveys of health service staff andpatients.
By McColl E, Jacoby A, Thomas L,Soutter J, Bamford C, Steen N, et al.
No. 32A rapid and systematic review of theclinical effectiveness and cost-effectiveness of paclitaxel, docetaxel,gemcitabine and vinorelbine in non-small-cell lung cancer.
By Clegg A, Scott DA, Sidhu M,Hewitson P, Waugh N.
No. 33Subgroup analyses in randomisedcontrolled trials: quantifying the risks offalse-positives and false-negatives.
By Brookes ST, Whitley E, Peters TJ, Mulheran PA, Egger M,Davey Smith G.
No. 34Depot antipsychotic medication in thetreatment of patients with schizophrenia:(1) Meta-review; (2) Patient and nurseattitudes.
By David AS, Adams C.
No. 35A systematic review of controlled trialsof the effectiveness and cost-effectiveness of brief psychologicaltreatments for depression.
By Churchill R, Hunot V, Corney R,Knapp M, McGuire H, Tylee A, et al.
No. 36Cost analysis of child healthsurveillance.
By Sanderson D, Wright D, Acton C,Duree D.
Volume 6, 2002
No. 1A study of the methods used to selectreview criteria for clinical audit.
By Hearnshaw H, Harker R, CheaterF, Baker R, Grimshaw G.
No. 2Fludarabine as second-line therapy forB cell chronic lymphocytic leukaemia: a technology assessment.
By Hyde C, Wake B, Bryan S, BartonP, Fry-Smith A, Davenport C, et al.
No. 3Rituximab as third-line treatment forrefractory or recurrent Stage III or IVfollicular non-Hodgkin’s lymphoma: asystematic review and economicevaluation.
By Wake B, Hyde C, Bryan S, BartonP, Song F, Fry-Smith A, et al.
No. 4A systematic review of dischargearrangements for older people.
By Parker SG, Peet SM, McPherson A,Cannaby AM, Baker R, Wilson A, et al.
No. 5The clinical effectiveness and cost-effectiveness of inhaler devices used inthe routine management of chronicasthma in older children: a systematicreview and economic evaluation.
By Peters J, Stevenson M, Beverley C,Lim J, Smith S.
No. 6The clinical effectiveness and cost-effectiveness of sibutramine in themanagement of obesity: a technologyassessment.
By O’Meara S, Riemsma R, ShirranL, Mather L, ter Riet G.
No. 7The cost-effectiveness of magneticresonance angiography for carotidartery stenosis and peripheral vasculardisease: a systematic review.
By Berry E, Kelly S, Westwood ME,Davies LM, Gough MJ, Bamford JM,et al.
No. 8Promoting physical activity in SouthAsian Muslim women through ‘exerciseon prescription’.
By Carroll B, Ali N, Azam N.
No. 9Zanamivir for the treatment of influenzain adults: a systematic review andeconomic evaluation.
By Burls A, Clark W, Stewart T,Preston C, Bryan S, Jefferson T, et al.
No. 10A review of the natural history andepidemiology of multiple sclerosis:implications for resource allocation andhealth economic models.
By Richards RG, Sampson FC, Beard SM, Tappenden P.
No. 11Screening for gestational diabetes: asystematic review and economicevaluation.
By Scott DA, Loveman E, McIntyre L,Waugh N.
No. 12The clinical effectiveness and cost-effectiveness of surgery for people withmorbid obesity: a systematic review andeconomic evaluation.
By Clegg AJ, Colquitt J, Sidhu MK,Royle P, Loveman E, Walker A.
No. 13The clinical effectiveness of trastuzumabfor breast cancer: a systematic review.
By Lewis R, Bagnall A-M, Forbes C,Shirran E, Duffy S, Kleijnen J, et al.
No. 14The clinical effectiveness and cost-effectiveness of vinorelbine for breastcancer: a systematic review andeconomic evaluation.
By Lewis R, Bagnall A-M, King S,Woolacott N, Forbes C, Shirran L, et al.
No. 15A systematic review of the effectivenessand cost-effectiveness of metal-on-metalhip resurfacing arthroplasty fortreatment of hip disease.
By Vale L, Wyness L, McCormack K,McKenzie L, Brazzelli M, Stearns SC.
No. 16The clinical effectiveness and cost-effectiveness of bupropion and nicotinereplacement therapy for smokingcessation: a systematic review andeconomic evaluation.
By Woolacott NF, Jones L, Forbes CA,Mather LC, Sowden AJ, Song FJ, et al.
No. 17A systematic review of effectiveness andeconomic evaluation of new drugtreatments for juvenile idiopathicarthritis: etanercept.
By Cummins C, Connock M, Fry-Smith A, Burls A.
No. 18Clinical effectiveness and cost-effectiveness of growth hormone inchildren: a systematic review andeconomic evaluation.
By Bryant J, Cave C, Mihaylova B,Chase D, McIntyre L, Gerard K, et al.
Health Technology Assessment 2007; Vol. 11: No. 32
173
© Queen’s Printer and Controller of HMSO 2007. All rights reserved.

No. 19Clinical effectiveness and cost-effectiveness of growth hormone inadults in relation to impact on quality oflife: a systematic review and economicevaluation.
By Bryant J, Loveman E, Chase D,Mihaylova B, Cave C, Gerard K, et al.
No. 20Clinical medication review by apharmacist of patients on repeatprescriptions in general practice: arandomised controlled trial.
By Zermansky AG, Petty DR, RaynorDK, Lowe CJ, Freementle N, Vail A.
No. 21The effectiveness of infliximab andetanercept for the treatment ofrheumatoid arthritis: a systematic reviewand economic evaluation.
By Jobanputra P, Barton P, Bryan S,Burls A.
No. 22A systematic review and economicevaluation of computerised cognitivebehaviour therapy for depression andanxiety.
By Kaltenthaler E, Shackley P, StevensK, Beverley C, Parry G, Chilcott J.
No. 23A systematic review and economicevaluation of pegylated liposomaldoxorubicin hydrochloride for ovariancancer.
By Forbes C, Wilby J, Richardson G,Sculpher M, Mather L, Reimsma R.
No. 24A systematic review of the effectivenessof interventions based on a stages-of-change approach to promote individualbehaviour change.
By Riemsma RP, Pattenden J, Bridle C,Sowden AJ, Mather L, Watt IS, et al.
No. 25A systematic review update of theclinical effectiveness and cost-effectiveness of glycoprotein IIb/IIIaantagonists.
By Robinson M, Ginnelly L, SculpherM, Jones L, Riemsma R, Palmer S, et al.
No. 26A systematic review of the effectiveness,cost-effectiveness and barriers toimplementation of thrombolytic andneuroprotective therapy for acuteischaemic stroke in the NHS.
By Sandercock P, Berge E, Dennis M,Forbes J, Hand P, Kwan J, et al.
No. 27A randomised controlled crossover trial of nurse practitioner versus doctor-led outpatient care in abronchiectasis clinic.
By Caine N, Sharples LD,Hollingworth W, French J, Keogan M,Exley A, et al.
No. 28Clinical effectiveness and cost –consequences of selective serotoninreuptake inhibitors in the treatment ofsex offenders.
By Adi Y, Ashcroft D, Browne K,Beech A, Fry-Smith A, Hyde C.
No. 29Treatment of established osteoporosis: a systematic review and cost–utilityanalysis.
By Kanis JA, Brazier JE, Stevenson M,Calvert NW, Lloyd Jones M.
No. 30Which anaesthetic agents are cost-effective in day surgery? Literaturereview, national survey of practice andrandomised controlled trial.
By Elliott RA Payne K, Moore JK,Davies LM, Harper NJN, St Leger AS,et al.
No. 31Screening for hepatitis C amonginjecting drug users and ingenitourinary medicine clinics:systematic reviews of effectiveness,modelling study and national survey ofcurrent practice.
By Stein K, Dalziel K, Walker A,McIntyre L, Jenkins B, Horne J, et al.
No. 32The measurement of satisfaction withhealthcare: implications for practicefrom a systematic review of theliterature.
By Crow R, Gage H, Hampson S,Hart J, Kimber A, Storey L, et al.
No. 33The effectiveness and cost-effectivenessof imatinib in chronic myeloidleukaemia: a systematic review.
By Garside R, Round A, Dalziel K,Stein K, Royle R.
No. 34A comparative study of hypertonicsaline, daily and alternate-day rhDNase in children with cystic fibrosis.
By Suri R, Wallis C, Bush A,Thompson S, Normand C, Flather M, et al.
No. 35A systematic review of the costs andeffectiveness of different models ofpaediatric home care.
By Parker G, Bhakta P, Lovett CA,Paisley S, Olsen R, Turner D, et al.
Volume 7, 2003
No. 1How important are comprehensiveliterature searches and the assessment oftrial quality in systematic reviews?Empirical study.
By Egger M, Jüni P, Bartlett C,Holenstein F, Sterne J.
No. 2Systematic review of the effectivenessand cost-effectiveness, and economicevaluation, of home versus hospital orsatellite unit haemodialysis for peoplewith end-stage renal failure.
By Mowatt G, Vale L, Perez J, WynessL, Fraser C, MacLeod A, et al.
No. 3Systematic review and economicevaluation of the effectiveness ofinfliximab for the treatment of Crohn’sdisease.
By Clark W, Raftery J, Barton P, Song F, Fry-Smith A, Burls A.
No. 4A review of the clinical effectiveness andcost-effectiveness of routine anti-Dprophylaxis for pregnant women whoare rhesus negative.
By Chilcott J, Lloyd Jones M, WightJ, Forman K, Wray J, Beverley C, et al.
No. 5Systematic review and evaluation of theuse of tumour markers in paediatriconcology: Ewing’s sarcoma andneuroblastoma.
By Riley RD, Burchill SA, Abrams KR,Heney D, Lambert PC, Jones DR, et al.
No. 6The cost-effectiveness of screening forHelicobacter pylori to reduce mortalityand morbidity from gastric cancer andpeptic ulcer disease: a discrete-eventsimulation model.
By Roderick P, Davies R, Raftery J,Crabbe D, Pearce R, Bhandari P, et al.
No. 7The clinical effectiveness and cost-effectiveness of routine dental checks: asystematic review and economicevaluation.
By Davenport C, Elley K, Salas C,Taylor-Weetman CL, Fry-Smith A, Bryan S, et al.
No. 8A multicentre randomised controlledtrial assessing the costs and benefits ofusing structured information andanalysis of women’s preferences in themanagement of menorrhagia.
By Kennedy ADM, Sculpher MJ,Coulter A, Dwyer N, Rees M, Horsley S, et al.
No. 9Clinical effectiveness and cost–utility ofphotodynamic therapy for wet age-relatedmacular degeneration: a systematic reviewand economic evaluation.
By Meads C, Salas C, Roberts T,Moore D, Fry-Smith A, Hyde C.
No. 10Evaluation of molecular tests forprenatal diagnosis of chromosomeabnormalities.
By Grimshaw GM, Szczepura A,Hultén M, MacDonald F, Nevin NC,Sutton F, et al.
Health Technology Assessment reports published to date
174

No. 11First and second trimester antenatalscreening for Down’s syndrome: theresults of the Serum, Urine andUltrasound Screening Study (SURUSS).
By Wald NJ, Rodeck C, Hackshaw AK, Walters J, Chitty L,Mackinson AM.
No. 12The effectiveness and cost-effectivenessof ultrasound locating devices forcentral venous access: a systematicreview and economic evaluation.
By Calvert N, Hind D, McWilliamsRG, Thomas SM, Beverley C, Davidson A.
No. 13A systematic review of atypicalantipsychotics in schizophrenia.
By Bagnall A-M, Jones L, Lewis R,Ginnelly L, Glanville J, Torgerson D, et al.
No. 14Prostate Testing for Cancer andTreatment (ProtecT) feasibility study.
By Donovan J, Hamdy F, Neal D,Peters T, Oliver S, Brindle L, et al.
No. 15Early thrombolysis for the treatment of acute myocardial infarction: asystematic review and economicevaluation.
By Boland A, Dundar Y, Bagust A,Haycox A, Hill R, Mujica Mota R,et al.
No. 16Screening for fragile X syndrome: a literature review and modelling.
By Song FJ, Barton P, Sleightholme V,Yao GL, Fry-Smith A.
No. 17Systematic review of endoscopic sinussurgery for nasal polyps.
By Dalziel K, Stein K, Round A,Garside R, Royle P.
No. 18Towards efficient guidelines: how tomonitor guideline use in primary care.
By Hutchinson A, McIntosh A, Cox S,Gilbert C.
No. 19Effectiveness and cost-effectiveness ofacute hospital-based spinal cord injuriesservices: systematic review.
By Bagnall A-M, Jones L, Richardson G, Duffy S, Riemsma R.
No. 20Prioritisation of health technologyassessment. The PATHS model:methods and case studies.
By Townsend J, Buxton M, Harper G.
No. 21Systematic review of the clinicaleffectiveness and cost-effectiveness of tension-free vaginal tape fortreatment of urinary stress incontinence.
By Cody J, Wyness L, Wallace S,Glazener C, Kilonzo M, Stearns S,et al.
No. 22The clinical and cost-effectiveness ofpatient education models for diabetes: a systematic review and economicevaluation.
By Loveman E, Cave C, Green C,Royle P, Dunn N, Waugh N.
No. 23The role of modelling in prioritisingand planning clinical trials.
By Chilcott J, Brennan A, Booth A,Karnon J, Tappenden P.
No. 24Cost–benefit evaluation of routineinfluenza immunisation in people 65–74years of age.
By Allsup S, Gosney M, Haycox A,Regan M.
No. 25The clinical and cost-effectiveness ofpulsatile machine perfusion versus coldstorage of kidneys for transplantationretrieved from heart-beating and non-heart-beating donors.
By Wight J, Chilcott J, Holmes M,Brewer N.
No. 26Can randomised trials rely on existingelectronic data? A feasibility study toexplore the value of routine data inhealth technology assessment.
By Williams JG, Cheung WY, Cohen DR, Hutchings HA, Longo MF, Russell IT.
No. 27Evaluating non-randomised interventionstudies.
By Deeks JJ, Dinnes J, D’Amico R,Sowden AJ, Sakarovitch C, Song F, et al.
No. 28A randomised controlled trial to assessthe impact of a package comprising apatient-orientated, evidence-based self-help guidebook and patient-centredconsultations on disease managementand satisfaction in inflammatory boweldisease.
By Kennedy A, Nelson E, Reeves D,Richardson G, Roberts C, Robinson A,et al.
No. 29The effectiveness of diagnostic tests forthe assessment of shoulder pain due tosoft tissue disorders: a systematic review.
By Dinnes J, Loveman E, McIntyre L,Waugh N.
No. 30The value of digital imaging in diabeticretinopathy.
By Sharp PF, Olson J, Strachan F,Hipwell J, Ludbrook A, O’Donnell M, et al.
No. 31Lowering blood pressure to preventmyocardial infarction and stroke: a new preventive strategy.
By Law M, Wald N, Morris J.
No. 32Clinical and cost-effectiveness ofcapecitabine and tegafur with uracil forthe treatment of metastatic colorectalcancer: systematic review and economicevaluation.
By Ward S, Kaltenthaler E, Cowan J,Brewer N.
No. 33Clinical and cost-effectiveness of new and emerging technologies for earlylocalised prostate cancer: a systematicreview.
By Hummel S, Paisley S, Morgan A,Currie E, Brewer N.
No. 34Literature searching for clinical andcost-effectiveness studies used in healthtechnology assessment reports carriedout for the National Institute forClinical Excellence appraisal system.
By Royle P, Waugh N.
No. 35Systematic review and economicdecision modelling for the preventionand treatment of influenza A and B.
By Turner D, Wailoo A, Nicholson K,Cooper N, Sutton A, Abrams K.
No. 36A randomised controlled trial toevaluate the clinical and cost-effectiveness of Hickman line insertions in adult cancer patients bynurses.
By Boland A, Haycox A, Bagust A,Fitzsimmons L.
No. 37Redesigning postnatal care: arandomised controlled trial of protocol-based midwifery-led carefocused on individual women’s physical and psychological health needs.
By MacArthur C, Winter HR, Bick DE, Lilford RJ, Lancashire RJ,Knowles H, et al.
No. 38Estimating implied rates of discount inhealthcare decision-making.
By West RR, McNabb R, Thompson AGH, Sheldon TA, Grimley Evans J.
Health Technology Assessment 2007; Vol. 11: No. 32
175
© Queen’s Printer and Controller of HMSO 2007. All rights reserved.
No. 39Systematic review of isolation policies inthe hospital management of methicillin-resistant Staphylococcus aureus: a review ofthe literature with epidemiological andeconomic modelling.
By Cooper BS, Stone SP, Kibbler CC,Cookson BD, Roberts JA, Medley GF, et al.
No. 40Treatments for spasticity and pain inmultiple sclerosis: a systematic review.
By Beard S, Hunn A, Wight J.
No. 41The inclusion of reports of randomisedtrials published in languages other thanEnglish in systematic reviews.
By Moher D, Pham B, Lawson ML,Klassen TP.
No. 42The impact of screening on futurehealth-promoting behaviours and healthbeliefs: a systematic review.
By Bankhead CR, Brett J, Bukach C,Webster P, Stewart-Brown S, Munafo M,et al.
Volume 8, 2004
No. 1What is the best imaging strategy foracute stroke?
By Wardlaw JM, Keir SL, Seymour J,Lewis S, Sandercock PAG, Dennis MS, et al.
No. 2Systematic review and modelling of theinvestigation of acute and chronic chestpain presenting in primary care.
By Mant J, McManus RJ, Oakes RAL,Delaney BC, Barton PM, Deeks JJ, et al.
No. 3The effectiveness and cost-effectivenessof microwave and thermal balloonendometrial ablation for heavymenstrual bleeding: a systematic reviewand economic modelling.
By Garside R, Stein K, Wyatt K,Round A, Price A.
No. 4A systematic review of the role ofbisphosphonates in metastatic disease.
By Ross JR, Saunders Y, Edmonds PM,Patel S, Wonderling D, Normand C, et al.
No. 5Systematic review of the clinicaleffectiveness and cost-effectiveness ofcapecitabine (Xeloda®) for locallyadvanced and/or metastatic breast cancer.
By Jones L, Hawkins N, Westwood M,Wright K, Richardson G, Riemsma R.
No. 6Effectiveness and efficiency of guidelinedissemination and implementationstrategies.
By Grimshaw JM, Thomas RE,MacLennan G, Fraser C, Ramsay CR,Vale L, et al.
No. 7Clinical effectiveness and costs of theSugarbaker procedure for the treatmentof pseudomyxoma peritonei.
By Bryant J, Clegg AJ, Sidhu MK,Brodin H, Royle P, Davidson P.
No. 8Psychological treatment for insomnia inthe regulation of long-term hypnoticdrug use.
By Morgan K, Dixon S, Mathers N,Thompson J, Tomeny M.
No. 9Improving the evaluation of therapeuticinterventions in multiple sclerosis:development of a patient-based measureof outcome.
By Hobart JC, Riazi A, Lamping DL,Fitzpatrick R, Thompson AJ.
No. 10A systematic review and economicevaluation of magnetic resonancecholangiopancreatography comparedwith diagnostic endoscopic retrogradecholangiopancreatography.
By Kaltenthaler E, Bravo Vergel Y,Chilcott J, Thomas S, Blakeborough T,Walters SJ, et al.
No. 11The use of modelling to evaluate newdrugs for patients with a chroniccondition: the case of antibodies againsttumour necrosis factor in rheumatoidarthritis.
By Barton P, Jobanputra P, Wilson J,Bryan S, Burls A.
No. 12Clinical effectiveness and cost-effectiveness of neonatal screening forinborn errors of metabolism usingtandem mass spectrometry: a systematicreview.
By Pandor A, Eastham J, Beverley C,Chilcott J, Paisley S.
No. 13Clinical effectiveness and cost-effectiveness of pioglitazone androsiglitazone in the treatment of type 2 diabetes: a systematic review and economic evaluation.
By Czoski-Murray C, Warren E,Chilcott J, Beverley C, Psyllaki MA,Cowan J.
No. 14Routine examination of the newborn:the EMREN study. Evaluation of anextension of the midwife role including a randomised controlled trial of appropriately trained midwivesand paediatric senior house officers.
By Townsend J, Wolke D, Hayes J,Davé S, Rogers C, Bloomfield L, et al.
No. 15Involving consumers in research anddevelopment agenda setting for theNHS: developing an evidence-basedapproach.
By Oliver S, Clarke-Jones L, Rees R, Milne R, Buchanan P, Gabbay J, et al.
No. 16A multi-centre randomised controlledtrial of minimally invasive directcoronary bypass grafting versuspercutaneous transluminal coronaryangioplasty with stenting for proximalstenosis of the left anterior descendingcoronary artery.
By Reeves BC, Angelini GD, BryanAJ, Taylor FC, Cripps T, Spyt TJ, et al.
No. 17Does early magnetic resonance imaginginfluence management or improveoutcome in patients referred tosecondary care with low back pain? A pragmatic randomised controlledtrial.
By Gilbert FJ, Grant AM, GillanMGC, Vale L, Scott NW, Campbell MK,et al.
No. 18The clinical and cost-effectiveness ofanakinra for the treatment ofrheumatoid arthritis in adults: asystematic review and economic analysis.
By Clark W, Jobanputra P, Barton P,Burls A.
No. 19A rapid and systematic review andeconomic evaluation of the clinical andcost-effectiveness of newer drugs fortreatment of mania associated withbipolar affective disorder.
By Bridle C, Palmer S, Bagnall A-M,Darba J, Duffy S, Sculpher M, et al.
No. 20Liquid-based cytology in cervicalscreening: an updated rapid andsystematic review and economic analysis.
By Karnon J, Peters J, Platt J, Chilcott J, McGoogan E, Brewer N.
No. 21Systematic review of the long-termeffects and economic consequences oftreatments for obesity and implicationsfor health improvement.
By Avenell A, Broom J, Brown TJ,Poobalan A, Aucott L, Stearns SC, et al.
No. 22Autoantibody testing in children withnewly diagnosed type 1 diabetesmellitus.
By Dretzke J, Cummins C,Sandercock J, Fry-Smith A, Barrett T,Burls A.
Health Technology Assessment reports published to date
176

No. 23Clinical effectiveness and cost-effectiveness of prehospital intravenousfluids in trauma patients.
By Dretzke J, Sandercock J, Bayliss S,Burls A.
No. 24Newer hypnotic drugs for the short-term management of insomnia: asystematic review and economicevaluation.
By Dündar Y, Boland A, Strobl J,Dodd S, Haycox A, Bagust A, et al.
No. 25Development and validation of methodsfor assessing the quality of diagnosticaccuracy studies.
By Whiting P, Rutjes AWS, Dinnes J,Reitsma JB, Bossuyt PMM, Kleijnen J.
No. 26EVALUATE hysterectomy trial: amulticentre randomised trial comparingabdominal, vaginal and laparoscopicmethods of hysterectomy.
By Garry R, Fountain J, Brown J,Manca A, Mason S, Sculpher M, et al.
No. 27Methods for expected value ofinformation analysis in complex healtheconomic models: developments on thehealth economics of interferon-� andglatiramer acetate for multiple sclerosis.
By Tappenden P, Chilcott JB,Eggington S, Oakley J, McCabe C.
No. 28Effectiveness and cost-effectiveness ofimatinib for first-line treatment ofchronic myeloid leukaemia in chronicphase: a systematic review and economicanalysis.
By Dalziel K, Round A, Stein K,Garside R, Price A.
No. 29VenUS I: a randomised controlled trialof two types of bandage for treatingvenous leg ulcers.
By Iglesias C, Nelson EA, Cullum NA,Torgerson DJ on behalf of the VenUSTeam.
No. 30Systematic review of the effectivenessand cost-effectiveness, and economicevaluation, of myocardial perfusionscintigraphy for the diagnosis andmanagement of angina and myocardialinfarction.
By Mowatt G, Vale L, Brazzelli M,Hernandez R, Murray A, Scott N, et al.
No. 31A pilot study on the use of decisiontheory and value of information analysisas part of the NHS Health TechnologyAssessment programme.
By Claxton Kon K, Ginnelly L, SculpherM, Philips Z, Palmer S.
No. 32The Social Support and Family HealthStudy: a randomised controlled trial andeconomic evaluation of two alternativeforms of postnatal support for mothersliving in disadvantaged inner-city areas.
By Wiggins M, Oakley A, Roberts I,Turner H, Rajan L, Austerberry H, et al.
No. 33Psychosocial aspects of genetic screeningof pregnant women and newborns: a systematic review.
By Green JM, Hewison J, Bekker HL,Bryant, Cuckle HS.
No. 34Evaluation of abnormal uterinebleeding: comparison of threeoutpatient procedures within cohortsdefined by age and menopausal status.
By Critchley HOD, Warner P, Lee AJ, Brechin S, Guise J, Graham B.
No. 35Coronary artery stents: a rapid systematicreview and economic evaluation.
By Hill R, Bagust A, Bakhai A,Dickson R, Dündar Y, Haycox A, et al.
No. 36Review of guidelines for good practicein decision-analytic modelling in healthtechnology assessment.
By Philips Z, Ginnelly L, Sculpher M,Claxton K, Golder S, Riemsma R, et al.
No. 37Rituximab (MabThera®) for aggressivenon-Hodgkin’s lymphoma: systematicreview and economic evaluation.
By Knight C, Hind D, Brewer N,Abbott V.
No. 38Clinical effectiveness and cost-effectiveness of clopidogrel andmodified-release dipyridamole in thesecondary prevention of occlusivevascular events: a systematic review andeconomic evaluation.
By Jones L, Griffin S, Palmer S, MainC, Orton V, Sculpher M, et al.
No. 39Pegylated interferon �-2a and -2b incombination with ribavirin in thetreatment of chronic hepatitis C: asystematic review and economicevaluation.
By Shepherd J, Brodin H, Cave C,Waugh N, Price A, Gabbay J.
No. 40Clopidogrel used in combination withaspirin compared with aspirin alone inthe treatment of non-ST-segment-elevation acute coronary syndromes: asystematic review and economicevaluation.
By Main C, Palmer S, Griffin S, Jones L, Orton V, Sculpher M, et al.
No. 41Provision, uptake and cost of cardiacrehabilitation programmes: improvingservices to under-represented groups.
By Beswick AD, Rees K, Griebsch I,Taylor FC, Burke M, West RR, et al.
No. 42Involving South Asian patients inclinical trials.
By Hussain-Gambles M, Leese B,Atkin K, Brown J, Mason S, Tovey P.
No. 43Clinical and cost-effectiveness ofcontinuous subcutaneous insulininfusion for diabetes.
By Colquitt JL, Green C, Sidhu MK,Hartwell D, Waugh N.
No. 44Identification and assessment ofongoing trials in health technologyassessment reviews.
By Song FJ, Fry-Smith A, DavenportC, Bayliss S, Adi Y, Wilson JS, et al.
No. 45Systematic review and economicevaluation of a long-acting insulinanalogue, insulin glargine
By Warren E, Weatherley-Jones E,Chilcott J, Beverley C.
No. 46Supplementation of a home-basedexercise programme with a class-basedprogramme for people with osteoarthritisof the knees: a randomised controlledtrial and health economic analysis.
By McCarthy CJ, Mills PM, Pullen R, Richardson G, Hawkins N,Roberts CR, et al.
No. 47Clinical and cost-effectiveness of once-daily versus more frequent use of samepotency topical corticosteroids for atopiceczema: a systematic review andeconomic evaluation.
By Green C, Colquitt JL, Kirby J,Davidson P, Payne E.
No. 48Acupuncture of chronic headachedisorders in primary care: randomisedcontrolled trial and economic analysis.
By Vickers AJ, Rees RW, Zollman CE,McCarney R, Smith CM, Ellis N, et al.
No. 49Generalisability in economic evaluationstudies in healthcare: a review and casestudies.
By Sculpher MJ, Pang FS, Manca A,Drummond MF, Golder S, Urdahl H, et al.
No. 50Virtual outreach: a randomisedcontrolled trial and economic evaluationof joint teleconferenced medicalconsultations.
By Wallace P, Barber J, Clayton W,Currell R, Fleming K, Garner P, et al.
Health Technology Assessment 2007; Vol. 11: No. 32
177
© Queen’s Printer and Controller of HMSO 2007. All rights reserved.

Volume 9, 2005
No. 1Randomised controlled multipletreatment comparison to provide a cost-effectiveness rationale for theselection of antimicrobial therapy inacne.
By Ozolins M, Eady EA, Avery A,Cunliffe WJ, O’Neill C, Simpson NB, et al.
No. 2Do the findings of case series studiesvary significantly according tomethodological characteristics?
By Dalziel K, Round A, Stein K,Garside R, Castelnuovo E, Payne L.
No. 3Improving the referral process forfamilial breast cancer geneticcounselling: findings of threerandomised controlled trials of twointerventions.
By Wilson BJ, Torrance N, Mollison J,Wordsworth S, Gray JR, Haites NE, et al.
No. 4Randomised evaluation of alternativeelectrosurgical modalities to treatbladder outflow obstruction in men withbenign prostatic hyperplasia.
By Fowler C, McAllister W, Plail R,Karim O, Yang Q.
No. 5A pragmatic randomised controlled trialof the cost-effectiveness of palliativetherapies for patients with inoperableoesophageal cancer.
By Shenfine J, McNamee P, Steen N,Bond J, Griffin SM.
No. 6Impact of computer-aided detectionprompts on the sensitivity and specificityof screening mammography.
By Taylor P, Champness J, Given-Wilson R, Johnston K, Potts H.
No. 7Issues in data monitoring and interimanalysis of trials.
By Grant AM, Altman DG, BabikerAB, Campbell MK, Clemens FJ,Darbyshire JH, et al.
No. 8Lay public’s understanding of equipoiseand randomisation in randomisedcontrolled trials.
By Robinson EJ, Kerr CEP, StevensAJ, Lilford RJ, Braunholtz DA, EdwardsSJ, et al.
No. 9Clinical and cost-effectiveness ofelectroconvulsive therapy for depressiveillness, schizophrenia, catatonia andmania: systematic reviews and economicmodelling studies.
By Greenhalgh J, Knight C, Hind D,Beverley C, Walters S.
No. 10Measurement of health-related qualityof life for people with dementia:development of a new instrument(DEMQOL) and an evaluation ofcurrent methodology.
By Smith SC, Lamping DL, Banerjee S, Harwood R, Foley B, Smith P, et al.
No. 11Clinical effectiveness and cost-effectiveness of drotrecogin alfa(activated) (Xigris®) for the treatment ofsevere sepsis in adults: a systematicreview and economic evaluation.
By Green C, Dinnes J, Takeda A,Shepherd J, Hartwell D, Cave C, et al.
No. 12A methodological review of howheterogeneity has been examined insystematic reviews of diagnostic testaccuracy.
By Dinnes J, Deeks J, Kirby J,Roderick P.
No. 13Cervical screening programmes: canautomation help? Evidence fromsystematic reviews, an economic analysisand a simulation modelling exerciseapplied to the UK.
By Willis BH, Barton P, Pearmain P,Bryan S, Hyde C.
No. 14Laparoscopic surgery for inguinalhernia repair: systematic review ofeffectiveness and economic evaluation.
By McCormack K, Wake B, Perez J,Fraser C, Cook J, McIntosh E, et al.
No. 15Clinical effectiveness, tolerability andcost-effectiveness of newer drugs forepilepsy in adults: a systematic reviewand economic evaluation.
By Wilby J, Kainth A, Hawkins N,Epstein D, McIntosh H, McDaid C, et al.
No. 16A randomised controlled trial tocompare the cost-effectiveness oftricyclic antidepressants, selectiveserotonin reuptake inhibitors andlofepramine.
By Peveler R, Kendrick T, Buxton M,Longworth L, Baldwin D, Moore M, et al.
No. 17Clinical effectiveness and cost-effectiveness of immediate angioplastyfor acute myocardial infarction:systematic review and economicevaluation.
By Hartwell D, Colquitt J, LovemanE, Clegg AJ, Brodin H, Waugh N, et al.
No. 18A randomised controlled comparison ofalternative strategies in stroke care.
By Kalra L, Evans A, Perez I, Knapp M, Swift C, Donaldson N.
No. 19The investigation and analysis of criticalincidents and adverse events inhealthcare.
By Woloshynowych M, Rogers S,Taylor-Adams S, Vincent C.
No. 20Potential use of routine databases inhealth technology assessment.
By Raftery J, Roderick P, Stevens A.
No. 21Clinical and cost-effectiveness of newerimmunosuppressive regimens in renaltransplantation: a systematic review andmodelling study.
By Woodroffe R, Yao GL, Meads C,Bayliss S, Ready A, Raftery J, et al.
No. 22A systematic review and economicevaluation of alendronate, etidronate,risedronate, raloxifene and teriparatidefor the prevention and treatment ofpostmenopausal osteoporosis.
By Stevenson M, Lloyd Jones M, De Nigris E, Brewer N, Davis S, Oakley J.
No. 23A systematic review to examine theimpact of psycho-educationalinterventions on health outcomes andcosts in adults and children with difficultasthma.
By Smith JR, Mugford M, Holland R,Candy B, Noble MJ, Harrison BDW, et al.
No. 24An evaluation of the costs, effectivenessand quality of renal replacementtherapy provision in renal satellite unitsin England and Wales.
By Roderick P, Nicholson T, ArmitageA, Mehta R, Mullee M, Gerard K, et al.
No. 25Imatinib for the treatment of patientswith unresectable and/or metastaticgastrointestinal stromal tumours:systematic review and economicevaluation.
By Wilson J, Connock M, Song F, YaoG, Fry-Smith A, Raftery J, et al.
No. 26Indirect comparisons of competinginterventions.
By Glenny AM, Altman DG, Song F,Sakarovitch C, Deeks JJ, D’Amico R, et al.
No. 27Cost-effectiveness of alternativestrategies for the initial medicalmanagement of non-ST elevation acutecoronary syndrome: systematic reviewand decision-analytical modelling.
By Robinson M, Palmer S, SculpherM, Philips Z, Ginnelly L, Bowens A, et al.
Health Technology Assessment reports published to date
178

No. 28Outcomes of electrically stimulatedgracilis neosphincter surgery.
By Tillin T, Chambers M, Feldman R.
No. 29The effectiveness and cost-effectivenessof pimecrolimus and tacrolimus foratopic eczema: a systematic review andeconomic evaluation.
By Garside R, Stein K, Castelnuovo E,Pitt M, Ashcroft D, Dimmock P, et al.
No. 30Systematic review on urine albumintesting for early detection of diabeticcomplications.
By Newman DJ, Mattock MB, DawnayABS, Kerry S, McGuire A, Yaqoob M, et al.
No. 31Randomised controlled trial of the cost-effectiveness of water-based therapy forlower limb osteoarthritis.
By Cochrane T, Davey RC, Matthes Edwards SM.
No. 32Longer term clinical and economicbenefits of offering acupuncture care topatients with chronic low back pain.
By Thomas KJ, MacPherson H,Ratcliffe J, Thorpe L, Brazier J,Campbell M, et al.
No. 33Cost-effectiveness and safety of epiduralsteroids in the management of sciatica.
By Price C, Arden N, Coglan L,Rogers P.
No. 34The British Rheumatoid Outcome StudyGroup (BROSG) randomised controlledtrial to compare the effectiveness andcost-effectiveness of aggressive versussymptomatic therapy in establishedrheumatoid arthritis.
By Symmons D, Tricker K, Roberts C,Davies L, Dawes P, Scott DL.
No. 35Conceptual framework and systematicreview of the effects of participants’ andprofessionals’ preferences in randomisedcontrolled trials.
By King M, Nazareth I, Lampe F,Bower P, Chandler M, Morou M, et al.
No. 36The clinical and cost-effectiveness ofimplantable cardioverter defibrillators: a systematic review.
By Bryant J, Brodin H, Loveman E,Payne E, Clegg A.
No. 37A trial of problem-solving by communitymental health nurses for anxiety,depression and life difficulties amonggeneral practice patients. The CPN-GPstudy.
By Kendrick T, Simons L, Mynors-Wallis L, Gray A, Lathlean J,Pickering R, et al.
No. 38The causes and effects of socio-demographic exclusions from clinicaltrials.
By Bartlett C, Doyal L, Ebrahim S,Davey P, Bachmann M, Egger M, et al.
No. 39Is hydrotherapy cost-effective? Arandomised controlled trial of combinedhydrotherapy programmes comparedwith physiotherapy land techniques inchildren with juvenile idiopathicarthritis.
By Epps H, Ginnelly L, Utley M,Southwood T, Gallivan S, Sculpher M, et al.
No. 40A randomised controlled trial and cost-effectiveness study of systematicscreening (targeted and total populationscreening) versus routine practice forthe detection of atrial fibrillation inpeople aged 65 and over. The SAFEstudy.
By Hobbs FDR, Fitzmaurice DA,Mant J, Murray E, Jowett S, Bryan S, et al.
No. 41Displaced intracapsular hip fractures in fit, older people: a randomisedcomparison of reduction and fixation,bipolar hemiarthroplasty and total hiparthroplasty.
By Keating JF, Grant A, Masson M,Scott NW, Forbes JF.
No. 42Long-term outcome of cognitivebehaviour therapy clinical trials incentral Scotland.
By Durham RC, Chambers JA, Power KG, Sharp DM, Macdonald RR,Major KA, et al.
No. 43The effectiveness and cost-effectivenessof dual-chamber pacemakers comparedwith single-chamber pacemakers forbradycardia due to atrioventricularblock or sick sinus syndrome: systematic review and economicevaluation.
By Castelnuovo E, Stein K, Pitt M,Garside R, Payne E.
No. 44Newborn screening for congenital heartdefects: a systematic review and cost-effectiveness analysis.
By Knowles R, Griebsch I, DezateuxC, Brown J, Bull C, Wren C.
No. 45The clinical and cost-effectiveness of leftventricular assist devices for end-stageheart failure: a systematic review andeconomic evaluation.
By Clegg AJ, Scott DA, Loveman E,Colquitt J, Hutchinson J, Royle P, et al.
No. 46The effectiveness of the HeidelbergRetina Tomograph and laser diagnosticglaucoma scanning system (GDx) indetecting and monitoring glaucoma.
By Kwartz AJ, Henson DB, Harper RA, Spencer AF, McLeod D.
No. 47Clinical and cost-effectiveness ofautologous chondrocyte implantationfor cartilage defects in knee joints:systematic review and economicevaluation.
By Clar C, Cummins E, McIntyre L,Thomas S, Lamb J, Bain L, et al.
No. 48Systematic review of effectiveness ofdifferent treatments for childhoodretinoblastoma.
By McDaid C, Hartley S, Bagnall A-M, Ritchie G, Light K,Riemsma R.
No. 49Towards evidence-based guidelines for the prevention of venousthromboembolism: systematic reviews of mechanical methods, oralanticoagulation, dextran and regionalanaesthesia as thromboprophylaxis.
By Roderick P, Ferris G, Wilson K,Halls H, Jackson D, Collins R,et al.
No. 50The effectiveness and cost-effectivenessof parent training/educationprogrammes for the treatment ofconduct disorder, including oppositionaldefiant disorder, in children.
By Dretzke J, Frew E, Davenport C,Barlow J, Stewart-Brown S, Sandercock J, et al.
Volume 10, 2006
No. 1The clinical and cost-effectiveness ofdonepezil, rivastigmine, galantamineand memantine for Alzheimer’s disease.
By Loveman E, Green C, Kirby J,Takeda A, Picot J, Payne E, et al.
No. 2FOOD: a multicentre randomised trialevaluating feeding policies in patientsadmitted to hospital with a recentstroke.
By Dennis M, Lewis S, Cranswick G,Forbes J.
No. 3The clinical effectiveness and cost-effectiveness of computed tomographyscreening for lung cancer: systematicreviews.
By Black C, Bagust A, Boland A,Walker S, McLeod C, De Verteuil R, et al.
Health Technology Assessment 2007; Vol. 11: No. 32
179
© Queen’s Printer and Controller of HMSO 2007. All rights reserved.

No. 4A systematic review of the effectivenessand cost-effectiveness of neuroimagingassessments used to visualise the seizure focus in people with refractoryepilepsy being considered for surgery.
By Whiting P, Gupta R, Burch J,Mujica Mota RE, Wright K, Marson A, et al.
No. 5Comparison of conference abstracts and presentations with full-text articles in the health technologyassessments of rapidly evolvingtechnologies.
By Dundar Y, Dodd S, Dickson R,Walley T, Haycox A, Williamson PR.
No. 6Systematic review and evaluation ofmethods of assessing urinaryincontinence.
By Martin JL, Williams KS, AbramsKR, Turner DA, Sutton AJ, Chapple C,et al.
No. 7The clinical effectiveness and cost-effectiveness of newer drugs for childrenwith epilepsy. A systematic review.
By Connock M, Frew E, Evans B-W, Bryan S, Cummins C, Fry-Smith A, et al.
No. 8Surveillance of Barrett’s oesophagus:exploring the uncertainty throughsystematic review, expert workshop andeconomic modelling.
By Garside R, Pitt M, Somerville M,Stein K, Price A, Gilbert N.
No. 9Topotecan, pegylated liposomaldoxorubicin hydrochloride andpaclitaxel for second-line or subsequenttreatment of advanced ovarian cancer: asystematic review and economicevaluation.
By Main C, Bojke L, Griffin S,Norman G, Barbieri M, Mather L, et al.
No. 10Evaluation of molecular techniques in prediction and diagnosis ofcytomegalovirus disease inimmunocompromised patients.
By Szczepura A, Westmoreland D,Vinogradova Y, Fox J, Clark M.
No. 11Screening for thrombophilia in high-risksituations: systematic review and cost-effectiveness analysis. The Thrombosis:Risk and Economic Assessment ofThrombophilia Screening (TREATS)study.
By Wu O, Robertson L, Twaddle S,Lowe GDO, Clark P, Greaves M, et al.
No. 12A series of systematic reviews to informa decision analysis for sampling andtreating infected diabetic foot ulcers.
By Nelson EA, O’Meara S, Craig D,Iglesias C, Golder S, Dalton J, et al.
No. 13Randomised clinical trial, observationalstudy and assessment of cost-effectiveness of the treatment of varicoseveins (REACTIV trial).
By Michaels JA, Campbell WB,Brazier JE, MacIntyre JB, PalfreymanSJ, Ratcliffe J, et al.
No. 14The cost-effectiveness of screening fororal cancer in primary care.
By Speight PM, Palmer S, Moles DR,Downer MC, Smith DH, Henriksson Met al.
No. 15Measurement of the clinical and cost-effectiveness of non-invasive diagnostictesting strategies for deep veinthrombosis.
By Goodacre S, Sampson F, StevensonM, Wailoo A, Sutton A, Thomas S, et al.
No. 16Systematic review of the effectivenessand cost-effectiveness of HealOzone®
for the treatment of occlusal pit/fissurecaries and root caries.
By Brazzelli M, McKenzie L, FieldingS, Fraser C, Clarkson J, Kilonzo M, et al.
No. 17Randomised controlled trials ofconventional antipsychotic versus newatypical drugs, and new atypical drugsversus clozapine, in people withschizophrenia responding poorly to, or intolerant of, current drugtreatment.
By Lewis SW, Davies L, Jones PB,Barnes TRE, Murray RM, Kerwin R, et al.
No. 18Diagnostic tests and algorithms used inthe investigation of haematuria:systematic reviews and economicevaluation.
By Rodgers M, Nixon J, Hempel S,Aho T, Kelly J, Neal D, et al.
No. 19Cognitive behavioural therapy inaddition to antispasmodic therapy forirritable bowel syndrome in primarycare: randomised controlled trial.
By Kennedy TM, Chalder T, McCrone P, Darnley S, Knapp M, Jones RH, et al.
No. 20A systematic review of the clinicaleffectiveness and cost-effectiveness ofenzyme replacement therapies forFabry’s disease andmucopolysaccharidosis type 1.
By Connock M, Juarez-Garcia A, FrewE, Mans A, Dretzke J, Fry-Smith A, et al.
No. 21Health benefits of antiviral therapy formild chronic hepatitis C: randomisedcontrolled trial and economicevaluation.
By Wright M, Grieve R, Roberts J,Main J, Thomas HC on behalf of theUK Mild Hepatitis C Trial Investigators.
No. 22Pressure relieving support surfaces: arandomised evaluation.
By Nixon J, Nelson EA, Cranny G,Iglesias CP, Hawkins K, Cullum NA, et al.
No. 23A systematic review and economicmodel of the effectiveness and cost-effectiveness of methylphenidate,dexamfetamine and atomoxetine for thetreatment of attention deficithyperactivity disorder in children andadolescents.
By King S, Griffin S, Hodges Z,Weatherly H, Asseburg C, Richardson G,et al.
No. 24The clinical effectiveness and cost-effectiveness of enzyme replacementtherapy for Gaucher’s disease: a systematic review.
By Connock M, Burls A, Frew E, Fry-Smith A, Juarez-Garcia A, McCabe C, et al.
No. 25Effectiveness and cost-effectiveness ofsalicylic acid and cryotherapy forcutaneous warts. An economic decisionmodel.
By Thomas KS, Keogh-Brown MR,Chalmers JR, Fordham RJ, Holland RC,Armstrong SJ, et al.
No. 26A systematic literature review of theeffectiveness of non-pharmacologicalinterventions to prevent wandering indementia and evaluation of the ethicalimplications and acceptability of theiruse.
By Robinson L, Hutchings D, CornerL, Beyer F, Dickinson H, Vanoli A, et al.
No. 27A review of the evidence on the effectsand costs of implantable cardioverterdefibrillator therapy in different patientgroups, and modelling of cost-effectiveness and cost–utility for thesegroups in a UK context.
By Buxton M, Caine N, Chase D,Connelly D, Grace A, Jackson C, et al.
Health Technology Assessment reports published to date
180

No. 28Adefovir dipivoxil and pegylatedinterferon alfa-2a for the treatment ofchronic hepatitis B: a systematic reviewand economic evaluation.
By Shepherd J, Jones J, Takeda A,Davidson P, Price A.
No. 29An evaluation of the clinical and cost-effectiveness of pulmonary arterycatheters in patient management inintensive care: a systematic review and arandomised controlled trial.
By Harvey S, Stevens K, Harrison D,Young D, Brampton W, McCabe C, et al.
No. 30Accurate, practical and cost-effectiveassessment of carotid stenosis in the UK.
By Wardlaw JM, Chappell FM,Stevenson M, De Nigris E, Thomas S,Gillard J, et al.
No. 31Etanercept and infliximab for thetreatment of psoriatic arthritis: a systematic review and economicevaluation.
By Woolacott N, Bravo Vergel Y,Hawkins N, Kainth A, Khadjesari Z,Misso K, et al.
No. 32The cost-effectiveness of testing forhepatitis C in former injecting drugusers.
By Castelnuovo E, Thompson-Coon J,Pitt M, Cramp M, Siebert U, Price A, et al.
No. 33Computerised cognitive behaviourtherapy for depression and anxietyupdate: a systematic review andeconomic evaluation.
By Kaltenthaler E, Brazier J, De Nigris E, Tumur I, Ferriter M,Beverley C, et al.
No. 34Cost-effectiveness of using prognosticinformation to select women with breast cancer for adjuvant systemic therapy.
By Williams C, Brunskill S, Altman D,Briggs A, Campbell H, Clarke M, et al.
No. 35Psychological therapies includingdialectical behaviour therapy forborderline personality disorder: a systematic review and preliminaryeconomic evaluation.
By Brazier J, Tumur I, Holmes M,Ferriter M, Parry G, Dent-Brown K, et al.
No. 36Clinical effectiveness and cost-effectiveness of tests for the diagnosisand investigation of urinary tractinfection in children: a systematic reviewand economic model.
By Whiting P, Westwood M, Bojke L,Palmer S, Richardson G, Cooper J, et al.
No. 37Cognitive behavioural therapy inchronic fatigue syndrome: a randomisedcontrolled trial of an outpatient groupprogramme.
By O’Dowd H, Gladwell P, Rogers CA,Hollinghurst S, Gregory A.
No. 38A comparison of the cost-effectiveness offive strategies for the prevention of non-steroidal anti-inflammatory drug-inducedgastrointestinal toxicity: a systematicreview with economic modelling.
By Brown TJ, Hooper L, Elliott RA,Payne K, Webb R, Roberts C, et al.
No. 39The effectiveness and cost-effectivenessof computed tomography screening forcoronary artery disease: systematicreview.
By Waugh N, Black C, Walker S,McIntyre L, Cummins E, Hillis G.
No. 40What are the clinical outcome and cost-effectiveness of endoscopy undertakenby nurses when compared with doctors?A Multi-Institution Nurse EndoscopyTrial (MINuET).
By Williams J, Russell I, Durai D,Cheung W-Y, Farrin A, Bloor K, et al.
No. 41The clinical and cost-effectiveness ofoxaliplatin and capecitabine for theadjuvant treatment of colon cancer:systematic review and economicevaluation.
By Pandor A, Eggington S, Paisley S,Tappenden P, Sutcliffe P.
No. 42A systematic review of the effectivenessof adalimumab, etanercept andinfliximab for the treatment ofrheumatoid arthritis in adults and aneconomic evaluation of their cost-effectiveness.
By Chen Y-F, Jobanputra P, Barton P,Jowett S, Bryan S, Clark W, et al.
No. 43Telemedicine in dermatology: a randomised controlled trial.
By Bowns IR, Collins K, Walters SJ,McDonagh AJG.
No. 44Cost-effectiveness of cell salvage andalternative methods of minimisingperioperative allogeneic bloodtransfusion: a systematic review andeconomic model.
By Davies L, Brown TJ, Haynes S,Payne K, Elliott RA, McCollum C.
No. 45Clinical effectiveness and cost-effectiveness of laparoscopic surgery forcolorectal cancer: systematic reviews andeconomic evaluation.
By Murray A, Lourenco T, de Verteuil R, Hernandez R, Fraser C,McKinley A, et al.
No. 46Etanercept and efalizumab for thetreatment of psoriasis: a systematicreview.
By Woolacott N, Hawkins N, Mason A, Kainth A, Khadjesari Z, Bravo Vergel Y, et al.
No. 47Systematic reviews of clinical decisiontools for acute abdominal pain.
By Liu JLY, Wyatt JC, Deeks JJ,Clamp S, Keen J, Verde P, et al.
No. 48Evaluation of the ventricular assistdevice programme in the UK.
By Sharples L, Buxton M, Caine N,Cafferty F, Demiris N, Dyer M, et al.
No. 49A systematic review and economicmodel of the clinical and cost-effectiveness of immunosuppressivetherapy for renal transplantation inchildren.
By Yao G, Albon E, Adi Y, Milford D,Bayliss S, Ready A, et al.
No. 50Amniocentesis results: investigation ofanxiety. The ARIA trial.
By Hewison J, Nixon J, Fountain J,Cocks K, Jones C, Mason G, et al.
Volume 11, 2007
No. 1Pemetrexed disodium for the treatmentof malignant pleural mesothelioma: a systematic review and economicevaluation.
By Dundar Y, Bagust A, Dickson R,Dodd S, Green J, Haycox A, et al.
No. 2A systematic review and economicmodel of the clinical effectiveness andcost-effectiveness of docetaxel incombination with prednisone orprednisolone for the treatment ofhormone-refractory metastatic prostatecancer.
By Collins R, Fenwick E, Trowman R,Perard R, Norman G, Light K, et al.
No. 3A systematic review of rapid diagnostictests for the detection of tuberculosisinfection.
By Dinnes J, Deeks J, Kunst H,Gibson A, Cummins E, Waugh N, et al.
No. 4The clinical effectiveness and cost-effectiveness of strontium ranelate forthe prevention of osteoporotic fragility fractures in postmenopausalwomen.
By Stevenson M, Davis S, Lloyd-Jones M, Beverley C.
Health Technology Assessment 2007; Vol. 11: No. 32
181
© Queen’s Printer and Controller of HMSO 2007. All rights reserved.

No. 5A systematic review of quantitative andqualitative research on the role andeffectiveness of written informationavailable to patients about individualmedicines.
By Raynor DK, Blenkinsopp A,Knapp P, Grime J, Nicolson DJ, Pollock K, et al.
No. 6Oral naltrexone as a treatment forrelapse prevention in formerly opioid-dependent drug users: a systematic review and economicevaluation.
By Adi Y, Juarez-Garcia A, Wang D,Jowett S, Frew E, Day E, et al.
No. 7Glucocorticoid-induced osteoporosis: a systematic review and cost–utility analysis.
By Kanis JA, Stevenson M, McCloskey EV, Davis S, Lloyd-Jones M.
No. 8Epidemiological, social, diagnostic andeconomic evaluation of populationscreening for genital chlamydial infection.
By Low N, McCarthy A, Macleod J,Salisbury C, Campbell R, Roberts TE, et al.
No. 9Methadone and buprenorphine for themanagement of opioid dependence: a systematic review and economicevaluation.
By Connock M, Juarez-Garcia A,Jowett S, Frew E, Liu Z, Taylor RJ, et al.
No. 10Exercise Evaluation Randomised Trial(EXERT): a randomised trial comparingGP referral for leisure centre-basedexercise, community-based walking andadvice only.
By Isaacs AJ, Critchley JA, See Tai S, Buckingham K, Westley D,Harridge SDR, et al.
No. 11Interferon alfa (pegylated and non-pegylated) and ribavirin for thetreatment of mild chronic hepatitis C: a systematic review and economicevaluation.
By Shepherd J, Jones J, Hartwell D, Davidson P, Price A, Waugh N.
No. 12Systematic review and economicevaluation of bevacizumab andcetuximab for the treatment ofmetastatic colorectal cancer.
By Tappenden P, Jones R, Paisley S,Carroll C.
No. 13A systematic review and economicevaluation of epoetin alfa, epoetin betaand darbepoetin alfa in anaemiaassociated with cancer, especially thatattributable to cancer treatment.
By Wilson J, Yao GL, Raftery J,Bohlius J, Brunskill S, Sandercock J, et al.
No. 14A systematic review and economicevaluation of statins for the preventionof coronary events.
By Ward S, Lloyd Jones M, Pandor A,Holmes M, Ara R, Ryan A, et al.
No. 15A systematic review of the effectivenessand cost-effectiveness of differentmodels of community-based respite care for frail older people and theircarers.
By Mason A, Weatherly H, SpilsburyK, Arksey H, Golder S, Adamson J, et al.
No. 16Additional therapy for young childrenwith spastic cerebral palsy: a randomised controlled trial.
By Weindling AM, Cunningham CC,Glenn SM, Edwards RT, Reeves DJ.
No. 17Screening for type 2 diabetes: literaturereview and economic modelling.
By Waugh N, Scotland G, McNamee P, Gillett M, Brennan A,Goyder E, et al.
No. 18The effectiveness and cost-effectivenessof cinacalcet for secondaryhyperparathyroidism in end-stage renal disease patients on dialysis: asystematic review and economicevaluation.
By Garside R, Pitt M, Anderson R,Mealing S, Roome C, Snaith A, et al.
No. 19The clinical effectiveness and cost-effectiveness of gemcitabine formetastatic breast cancer: a systematicreview and economic evaluation.
By Takeda AL, Jones J, Loveman E,Tan SC, Clegg AJ.
No. 20A systematic review of duplexultrasound, magnetic resonanceangiography and computed tomographyangiography for the diagnosis and assessment of symptomatic, lowerlimb peripheral arterial disease.
By Collins R, Cranny G, Burch J,Aguiar-Ibáñez R, Craig D, Wright K, et al.
No. 21The clinical effectiveness and cost-effectiveness of treatments for childrenwith idiopathic steroid-resistantnephrotic syndrome: a systematic review.
By Colquitt JL, Kirby J, Green C,Cooper K, Trompeter RS.
No. 22A systematic review of the routinemonitoring of growth in children ofprimary school age to identify growth-related conditions.
By Fayter D, Nixon J, Hartley S,Rithalia A, Butler G, Rudolf M, et al.
No. 23Systematic review of the effectiveness ofpreventing and treating Staphylococcusaureus carriage in reducing peritonealcatheter-related infections.
By McCormack K, Rabindranath K,Kilonzo M, Vale L, Fraser C, McIntyre L,et al.
No. 24The clinical effectiveness and cost ofrepetitive transcranial magneticstimulation versus electroconvulsivetherapy in severe depression: a multicentre pragmatic randomisedcontrolled trial and economic analysis.
By McLoughlin DM, Mogg A, Eranti S, Pluck G, Purvis R, Edwards D,et al.
No. 25A randomised controlled trial andeconomic evaluation of direct versusindirect and individual versus groupmodes of speech and language therapyfor children with primary languageimpairment.
By Boyle J, McCartney E, Forbes J,O’Hare A.
No. 26Hormonal therapies for early breastcancer: systematic review and economicevaluation.
By Hind D, Ward S, De Nigris E,Simpson E, Carroll C, Wyld L.
No. 27Cardioprotection against the toxic effects of anthracyclines given tochildren with cancer: a systematic review.
By Bryant J, Picot J, Levitt G, Sullivan I, Baxter L, Clegg A.
No. 28Adalimumab, etanercept and infliximabfor the treatment of ankylosingspondylitis: a systematic review andeconomic evaluation.
By McLeod C, Bagust A, Boland A,Dagenais P, Dickson R, Dundar Y,et al.
Health Technology Assessment reports published to date
182

No. 29Prenatal screening and treatmentstrategies to prevent group B streptococcaland other bacterial infections in earlyinfancy: cost-effectiveness and expectedvalue of information analyses.
By Colbourn T, Asseburg C, Bojke L,Philips Z, Claxton K, Ades AE, et al.
No. 30Clinical effectiveness and cost-effectiveness of bone morphogeneticproteins in the non-healing of fracturesand spinal fusion: a systematic review.
By Garrison KR, Donell S, Ryder J,Shemilt I, Mugford M, Harvey I, et al.
No. 31A randomised controlled trial ofpostoperative radiotherapy followingbreast-conserving surgery in aminimum-risk older population. The PRIME trial.
By Prescott RJ, Kunkler IH, Williams LJ, King CC, Jack W, van der Pol M, et al.
No. 32Current practice, accuracy, effectivenessand cost-effectiveness of the schoolentry hearing screen.
By Bamford J, Fortnum H, Bristow K,Smith J, Vamvakas G, Davies L, et al.
Health Technology Assessment 2007; Vol. 11: No. 32
183
© Queen’s Printer and Controller of HMSO 2007. All rights reserved.


Health Technology Assessment 2007; Vol. 11: No. 32
185
Health Technology AssessmentProgramme
Prioritisation Strategy GroupMembers
Chair,Professor Tom Walley, Director, NHS HTA Programme,Department of Pharmacology &Therapeutics,University of Liverpool
Professor Bruce Campbell,Consultant Vascular & GeneralSurgeon, Royal Devon & ExeterHospital
Professor Robin E Ferner,Consultant Physician andDirector, West Midlands Centrefor Adverse Drug Reactions,City Hospital NHS Trust,Birmingham
Dr Edmund Jessop, MedicalAdviser, National Specialist,Commissioning Advisory Group(NSCAG), Department ofHealth, London
Professor Jon Nicholl, Director,Medical Care Research Unit,University of Sheffield, School of Health and Related Research
Dr Ron Zimmern, Director,Public Health Genetics Unit,Strangeways ResearchLaboratories, Cambridge
Director, Professor Tom Walley, Director, NHS HTA Programme,Department of Pharmacology &Therapeutics,University of Liverpool
Deputy Director, Professor Jon Nicholl,Director, Medical Care ResearchUnit, University of Sheffield,School of Health and RelatedResearch
HTA Commissioning BoardMembers
Programme Director, Professor Tom Walley, Director, NHS HTA Programme,Department of Pharmacology &Therapeutics,University of Liverpool
Chair,Professor Jon Nicholl,Director, Medical Care ResearchUnit, University of Sheffield,School of Health and RelatedResearch
Deputy Chair, Dr Andrew Farmer, University Lecturer in GeneralPractice, Department of Primary Health Care, University of Oxford
Dr Jeffrey Aronson,Reader in ClinicalPharmacology, Department ofClinical Pharmacology,Radcliffe Infirmary, Oxford
Professor Deborah Ashby,Professor of Medical Statistics,Department of Environmentaland Preventative Medicine,Queen Mary University ofLondon
Professor Ann Bowling,Professor of Health ServicesResearch, Primary Care andPopulation Studies,University College London
Professor John Cairns, Professor of Health Economics,Public Health Policy, London School of Hygiene and Tropical Medicine, London
Professor Nicky Cullum,Director of Centre for EvidenceBased Nursing, Department ofHealth Sciences, University ofYork
Professor Jon Deeks, Professor of Health Statistics,University of Birmingham
Professor Jenny Donovan,Professor of Social Medicine,Department of Social Medicine,University of Bristol
Professor Freddie Hamdy,Professor of Urology, University of Sheffield
Professor Allan House, Professor of Liaison Psychiatry,University of Leeds
Professor Sallie Lamb, Director,Warwick Clinical Trials Unit,University of Warwick
Professor Stuart Logan,Director of Health & SocialCare Research, The PeninsulaMedical School, Universities ofExeter & Plymouth
Professor Miranda Mugford,Professor of Health Economics,University of East Anglia
Dr Linda Patterson, Consultant Physician,Department of Medicine,Burnley General Hospital
Professor Ian Roberts, Professor of Epidemiology &Public Health, InterventionResearch Unit, London Schoolof Hygiene and TropicalMedicine
Professor Mark Sculpher,Professor of Health Economics,Centre for Health Economics,Institute for Research in theSocial Services, University of York
Professor Kate Thomas,Professor of Complementaryand Alternative Medicine,University of Leeds
Professor David John Torgerson,Director of York Trial Unit,Department of Health Sciences,University of York
Professor Hywel Williams,Professor of Dermato-Epidemiology,University of Nottingham
Current and past membership details of all HTA ‘committees’ are available from the HTA website (www.hta.ac.uk)
© Queen’s Printer and Controller of HMSO 2007. All rights reserved.

Health Technology Assessment Programme
186
Diagnostic Technologies & Screening PanelMembers
Chair,Dr Ron Zimmern, Director ofthe Public Health Genetics Unit,Strangeways ResearchLaboratories, Cambridge
Ms Norma Armston,Freelance Consumer Advocate,Bolton
Professor Max Bachmann,Professor of Health CareInterfaces, Department ofHealth Policy and Practice,University of East Anglia
Professor Rudy BilousProfessor of Clinical Medicine &Consultant Physician,The Academic Centre,South Tees Hospitals NHS Trust
Ms Dea Birkett, Service UserRepresentative, London
Dr Paul Cockcroft, ConsultantMedical Microbiologist andClinical Director of Pathology,Department of ClinicalMicrobiology, St Mary'sHospital, Portsmouth
Professor Adrian K Dixon,Professor of Radiology,University Department ofRadiology, University ofCambridge Clinical School
Dr David Elliman, Consultant inCommunity Child Health,Islington PCT & Great OrmondStreet Hospital, London
Professor Glyn Elwyn, Research Chair, Centre forHealth Sciences Research,Cardiff University, Departmentof General Practice, Cardiff
Professor Paul Glasziou,Director, Centre for Evidence-Based Practice,University of Oxford
Dr Jennifer J Kurinczuk,Consultant ClinicalEpidemiologist, NationalPerinatal Epidemiology Unit,Oxford
Dr Susanne M Ludgate, Clinical Director, Medicines &Healthcare Products RegulatoryAgency, London
Mr Stephen Pilling, Director,Centre for Outcomes, Research & Effectiveness, Joint Director, NationalCollaborating Centre for MentalHealth, University CollegeLondon
Mrs Una Rennard, Service User Representative,Oxford
Dr Phil Shackley, SeniorLecturer in Health Economics,Academic Vascular Unit,University of Sheffield
Dr Margaret Somerville,Director of Public HealthLearning, Peninsula MedicalSchool, University of Plymouth
Dr Graham Taylor, ScientificDirector & Senior Lecturer,Regional DNA Laboratory, TheLeeds Teaching Hospitals
Professor Lindsay WilsonTurnbull, Scientific Director,Centre for MR Investigations &YCR Professor of Radiology,University of Hull
Professor Martin J Whittle,Clinical Co-director, NationalCo-ordinating Centre forWomen’s and Childhealth
Dr Dennis Wright, Consultant Biochemist &Clinical Director, The North West LondonHospitals NHS Trust, Middlesex
Pharmaceuticals PanelMembers
Chair,Professor Robin Ferner,Consultant Physician andDirector, West Midlands Centrefor Adverse Drug Reactions, City Hospital NHS Trust,Birmingham
Ms Anne Baileff, ConsultantNurse in First Contact Care,Southampton City Primary CareTrust, University ofSouthampton
Professor Imti Choonara,Professor in Child Health,Academic Division of ChildHealth, University ofNottingham
Professor John Geddes,Professor of EpidemiologicalPsychiatry, University of Oxford
Mrs Barbara Greggains, Non-Executive Director,Greggains Management Ltd
Dr Bill Gutteridge, MedicalAdviser, National SpecialistCommissioning Advisory Group(NSCAG), London
Mrs Sharon Hart, Consultant PharmaceuticalAdviser, Reading
Dr Jonathan Karnon, SeniorResearch Fellow, HealthEconomics and DecisionScience, University of Sheffield
Dr Yoon Loke, Senior Lecturerin Clinical Pharmacology,University of East Anglia
Ms Barbara Meredith,Lay Member, Epsom
Dr Andrew Prentice, SeniorLecturer and ConsultantObstetrician & Gynaecologist,Department of Obstetrics &Gynaecology, University ofCambridge
Dr Frances Rotblat, CPMPDelegate, Medicines &Healthcare Products RegulatoryAgency, London
Dr Martin Shelly, General Practitioner, Leeds
Mrs Katrina Simister, AssistantDirector New Medicines,National Prescribing Centre,Liverpool
Dr Richard Tiner, MedicalDirector, Medical Department,Association of the BritishPharmaceutical Industry,London
Current and past membership details of all HTA ‘committees’ are available from the HTA website (www.hta.ac.uk)

Therapeutic Procedures PanelMembers
Chair, Professor Bruce Campbell,Consultant Vascular andGeneral Surgeon, Departmentof Surgery, Royal Devon &Exeter Hospital
Dr Mahmood Adil, DeputyRegional Director of PublicHealth, Department of Health,Manchester
Dr Aileen Clarke,Consultant in Public Health,Public Health Resource Unit,Oxford
Professor Matthew Cooke,Professor of EmergencyMedicine, Warwick EmergencyCare and Rehabilitation,University of Warwick
Mr Mark Emberton, SeniorLecturer in OncologicalUrology, Institute of Urology,University College Hospital
Professor Paul Gregg,Professor of OrthopaedicSurgical Science, Department ofGeneral Practice and PrimaryCare, South Tees Hospital NHSTrust, Middlesbrough
Ms Maryann L Hardy, Lecturer, Division ofRadiography, University ofBradford
Dr Simon de Lusignan,Senior Lecturer, Primary CareInformatics, Department ofCommunity Health Sciences,St George’s Hospital MedicalSchool, London
Dr Peter Martin, ConsultantNeurologist, Addenbrooke’sHospital, Cambridge
Professor Neil McIntosh,Edward Clark Professor of ChildLife & Health, Department ofChild Life & Health, Universityof Edinburgh
Professor Jim Neilson,Professor of Obstetrics andGynaecology, Department ofObstetrics and Gynaecology,University of Liverpool
Dr John C Pounsford,Consultant Physician,Directorate of Medical Services,North Bristol NHS Trust
Dr Karen Roberts, NurseConsultant, Queen ElizabethHospital, Gateshead
Dr Vimal Sharma, ConsultantPsychiatrist/Hon. Senior Lecturer, Mental HealthResource Centre, Cheshire andWirral Partnership NHS Trust,Wallasey
Professor Scott Weich, Professor of Psychiatry, Division of Health in theCommunity, University ofWarwick
Disease Prevention PanelMembers
Chair, Dr Edmund Jessop, MedicalAdviser, National SpecialistCommissioning Advisory Group(NSCAG), London
Mrs Sheila Clark, ChiefExecutive, St James’s Hospital,Portsmouth
Mr Richard Copeland, Lead Pharmacist: ClinicalEconomy/Interface, Wansbeck General Hospital,Northumberland
Dr Elizabeth Fellow-Smith,Medical Director, West London Mental HealthTrust, Middlesex
Mr Ian Flack, Director PPIForum Support, Council ofEthnic Minority VoluntarySector Organisations, Stratford
Dr John Jackson, General Practitioner, Newcastle upon Tyne
Mrs Veronica James, ChiefOfficer, Horsham District AgeConcern, Horsham
Professor Mike Kelly, Director, Centre for PublicHealth Excellence, National Institute for Healthand Clinical Excellence, London
Professor Yi Mien Koh, Director of Public Health andMedical Director, London NHS (North West LondonStrategic Health Authority),London
Ms Jeanett Martin, Director of Clinical Leadership& Quality, Lewisham PCT,London
Dr Chris McCall, GeneralPractitioner, Dorset
Dr David Pencheon, Director,Eastern Region Public HealthObservatory, Cambridge
Dr Ken Stein, Senior ClinicalLecturer in Public Health,Director, Peninsula TechnologyAssessment Group, University of Exeter, Exeter
Dr Carol Tannahill, Director,Glasgow Centre for PopulationHealth, Glasgow
Professor Margaret Thorogood,Professor of Epidemiology,University of Warwick, Coventry
Dr Ewan Wilkinson, Consultant in Public Health,Royal Liverpool UniversityHospital, Liverpool
Health Technology Assessment 2007; Vol. 11: No. 32
187Current and past membership details of all HTA ‘committees’ are available from the HTA website (www.hta.ac.uk)

Health Technology Assessment Programme
188Current and past membership details of all HTA ‘committees’ are available from the HTA website (www.hta.ac.uk)
Expert Advisory NetworkMembers
Professor Douglas Altman,Professor of Statistics inMedicine, Centre for Statisticsin Medicine, University ofOxford
Professor John Bond,Director, Centre for HealthServices Research, University ofNewcastle upon Tyne, School ofPopulation & Health Sciences,Newcastle upon Tyne
Professor Andrew Bradbury,Professor of Vascular Surgery,Solihull Hospital, Birmingham
Mr Shaun Brogan, Chief Executive, RidgewayPrimary Care Group, Aylesbury
Mrs Stella Burnside OBE,Chief Executive, Regulation and ImprovementAuthority, Belfast
Ms Tracy Bury, Project Manager, WorldConfederation for PhysicalTherapy, London
Professor Iain T Cameron,Professor of Obstetrics andGynaecology and Head of theSchool of Medicine,University of Southampton
Dr Christine Clark,Medical Writer & ConsultantPharmacist, Rossendale
Professor Collette Clifford,Professor of Nursing & Head ofResearch, School of HealthSciences, University ofBirmingham, Edgbaston,Birmingham
Professor Barry Cookson,Director, Laboratory ofHealthcare Associated Infection,Health Protection Agency,London
Dr Carl Counsell, ClinicalSenior Lecturer in Neurology,Department of Medicine &Therapeutics, University ofAberdeen
Professor Howard Cuckle,Professor of ReproductiveEpidemiology, Department ofPaediatrics, Obstetrics &Gynaecology, University ofLeeds
Dr Katherine Darton, Information Unit, MIND – The Mental Health Charity,London
Professor Carol Dezateux, Professor of PaediatricEpidemiology, London
Dr Keith Dodd, ConsultantPaediatrician, Derby
Mr John Dunning,Consultant CardiothoracicSurgeon, CardiothoracicSurgical Unit, PapworthHospital NHS Trust, Cambridge
Mr Jonothan Earnshaw,Consultant Vascular Surgeon,Gloucestershire Royal Hospital,Gloucester
Professor Martin Eccles, Professor of ClinicalEffectiveness, Centre for HealthServices Research, University ofNewcastle upon Tyne
Professor Pam Enderby,Professor of CommunityRehabilitation, Institute ofGeneral Practice and PrimaryCare, University of Sheffield
Professor Gene Feder, Professorof Primary Care Research &Development, Centre for HealthSciences, Barts & The LondonQueen Mary’s School ofMedicine & Dentistry, London
Mr Leonard R Fenwick, Chief Executive, Newcastleupon Tyne Hospitals NHS Trust
Mrs Gillian Fletcher, Antenatal Teacher & Tutor andPresident, National ChildbirthTrust, Henfield
Professor Jayne Franklyn,Professor of Medicine,Department of Medicine,University of Birmingham,Queen Elizabeth Hospital,Edgbaston, Birmingham
Dr Neville Goodman, Consultant Anaesthetist,Southmead Hospital, Bristol
Professor Robert E Hawkins, CRC Professor and Director ofMedical Oncology, Christie CRCResearch Centre, ChristieHospital NHS Trust, Manchester
Professor Allen Hutchinson, Director of Public Health &Deputy Dean of ScHARR,Department of Public Health,University of Sheffield
Professor Peter Jones, Professorof Psychiatry, University ofCambridge, Cambridge
Professor Stan Kaye, CancerResearch UK Professor ofMedical Oncology, Section ofMedicine, Royal MarsdenHospital & Institute of CancerResearch, Surrey
Dr Duncan Keeley,General Practitioner (Dr Burch& Ptnrs), The Health Centre,Thame
Dr Donna Lamping,Research Degrees ProgrammeDirector & Reader in Psychology,Health Services Research Unit,London School of Hygiene andTropical Medicine, London
Mr George Levvy,Chief Executive, Motor Neurone Disease Association,Northampton
Professor James Lindesay,Professor of Psychiatry for theElderly, University of Leicester,Leicester General Hospital
Professor Julian Little,Professor of Human GenomeEpidemiology, Department ofEpidemiology & CommunityMedicine, University of Ottawa
Professor Rajan Madhok, Consultant in Public Health,South Manchester Primary Care Trust, Manchester
Professor Alexander Markham, Director, Molecular MedicineUnit, St James’s UniversityHospital, Leeds
Professor Alistaire McGuire,Professor of Health Economics,London School of Economics
Dr Peter Moore, Freelance Science Writer, Ashtead
Dr Andrew Mortimore, PublicHealth Director, SouthamptonCity Primary Care Trust,Southampton
Dr Sue Moss, Associate Director,Cancer Screening EvaluationUnit, Institute of CancerResearch, Sutton
Mrs Julietta Patnick, Director, NHS Cancer ScreeningProgrammes, Sheffield
Professor Robert Peveler,Professor of Liaison Psychiatry,Royal South Hants Hospital,Southampton
Professor Chris Price, Visiting Professor in ClinicalBiochemistry, University ofOxford
Professor William Rosenberg,Professor of Hepatology andConsultant Physician, Universityof Southampton, Southampton
Professor Peter Sandercock,Professor of Medical Neurology,Department of ClinicalNeurosciences, University ofEdinburgh
Dr Susan Schonfield, Consultantin Public Health, HillingdonPCT, Middlesex
Dr Eamonn Sheridan,Consultant in Clinical Genetics,Genetics Department,St James’s University Hospital,Leeds
Professor Sarah Stewart-Brown, Professor of Public Health,University of Warwick, Division of Health in theCommunity Warwick MedicalSchool, LWMS, Coventry
Professor Ala Szczepura, Professor of Health ServiceResearch, Centre for HealthServices Studies, University ofWarwick
Dr Ross Taylor, Senior Lecturer, Department ofGeneral Practice and PrimaryCare, University of Aberdeen
Mrs Joan Webster, Consumer member, HTA –Expert Advisory Network

How to obtain copies of this and other HTA Programme reports.An electronic version of this publication, in Adobe Acrobat format, is available for downloading free ofcharge for personal use from the HTA website (http://www.hta.ac.uk). A fully searchable CD-ROM isalso available (see below).
Printed copies of HTA monographs cost £20 each (post and packing free in the UK) to both public andprivate sector purchasers from our Despatch Agents.
Non-UK purchasers will have to pay a small fee for post and packing. For European countries the cost is£2 per monograph and for the rest of the world £3 per monograph.
You can order HTA monographs from our Despatch Agents:
– fax (with credit card or official purchase order) – post (with credit card or official purchase order or cheque)– phone during office hours (credit card only).
Additionally the HTA website allows you either to pay securely by credit card or to print out yourorder and then post or fax it.
Contact details are as follows:HTA Publications Email: [email protected] Box 642 Tel: 0870 1616662YORK YO31 7WX Fax: 0870 1616663UK
NHS libraries can subscribe free of charge. Public libraries can subscribe at a very reduced cost of £100 for each volume (normally comprising 30–40 titles). The commercial subscription rate is £300 per volume. Please see our website for details. Subscriptions can only be purchased for the current orforthcoming volume.
Payment methods
Paying by chequeIf you pay by cheque, the cheque must be in pounds sterling. Please see our website for details.
Paying by credit cardThe following cards are accepted by phone, fax, post or via the website ordering pages: Delta, Eurocard,Mastercard, Solo, Switch and Visa. We advise against sending credit card details in a plain email.
Paying by official purchase orderYou can post or fax these, but they must be from public bodies (i.e. NHS or universities) within the UK.We cannot at present accept purchase orders from commercial companies or from outside the UK.
How do I get a copy of HTA on CD?
Please use the form on the HTA website (www.hta.ac.uk/htacd.htm). Or contact our despatch agents(see contact details above) by email, post, fax or phone. HTA on CD is currently free of charge worldwide.
The website also provides information about the HTA Programme and lists the membership of the variouscommittees.
HTA

Current practice, accuracy, effectivenessand cost-effectiveness of the schoolentry hearing screen
J Bamford, H Fortnum, K Bristow, J Smith,G Vamvakas, L Davies, R Taylor, P Watkin, S Fonseca, A Davis and S Hind
Health Technology Assessment 2007; Vol. 11: No. 32
HTAHealth Technology AssessmentNHS R&D HTA Programmewww.hta.ac.uk
The National Coordinating Centre for Health Technology Assessment,Mailpoint 728, Boldrewood,University of Southampton,Southampton, SO16 7PX, UK.Fax: +44 (0) 23 8059 5639 Email: [email protected]://www.hta.ac.uk ISSN 1366-5278
FeedbackThe HTA Programme and the authors would like to know
your views about this report.
The Correspondence Page on the HTA website(http://www.hta.ac.uk) is a convenient way to publish
your comments. If you prefer, you can send your comments to the address below, telling us whether you would like
us to transfer them to the website.
We look forward to hearing from you.
August 2007
Health Technology Assessm
ent2007;Vol. 11: N
o. 32School entry hearing screen