
Bill McCormick - Elliot Health System and Elliot Hospital ...

Transactions of the ASABE
Vol. 54(4): 2011 American Society of Agricultural and Biological Engineers ISSN 2151-0032 1
STRATEGIES TO IMPROVE WEPP SNOWMELT
SIMULATIONS IN MOUNTAINOUS TERRAIN
J. A. Hubbart, T. E. Link, W. J. Elliot
ABSTRACT. The ability to predict snow accumulation and melt in complex vegetated terrain is critical for effective watersupply, water quality, and forest land management. Accurate numerical simulation of these processes is important for erosionand sedimentation modeling in the mountainous western U.S., where snow processes dominate the winter phase of thehydrologic cycle. This work assessed approaches to adjust meteorological data and canopy parameterizations to improveWater Erosion Prediction Project (WEPP) snowmelt model predictions and to identify areas in which to focus future modeldevelopment efforts. Four data modification approaches were used that represented a range of operator cost and effort.Approaches included direct application of: (1) nearby climate data, (2) empirically derived precipitation adjustment factorsbased on snowpack measurements, (3) custom climate data collected at the site of interest, and (4) adjusted canopy coverfactors. Site!specific climate and calibrated canopy parameters produced the best simulation of snowcover duration and meltrate but underestimated peak snow water equivalent (SWE) by approximately 1%, 34%, and 40% in clearcut, partially cut,and fully forested sites, respectively. The best simulation produced time to snowpack depletion from peak SWE of 11, 15, and45 days earlier than observed in clearcut, partial cut, and full forest, respectively. Results illustrate the difficulties ofsimulating snowpack dynamics with WEPP in forested mountainous systems of the interior Pacific Northwest where airtemperatures are close to 0°C during snow deposition. Although improvements in simulation accuracy are needed in forests,the proposed methods can improve confidence in WEPP snowpack simulations or be applied to other models to improvepredictions in complex snow!dominated systems.
Keywords. Forest management, Snowmelt modeling, WEPP.
ffective watershed management requires tools tohelp solve practical problems and provide a scien!tific basis for decision!making. Numerical modelsthat explicitly consider climate, topography, and
land use are vital for accurately simulating and predictingwater flow, surface runoff, and erosion (NRC, 1999). Landmanagers require relatively simple, effective models; how!ever, creating such tools can be problematic due to oversim!plification or omission of key hydrological processes. Forexample, to simulate erosion effectively, hydrology mustalso be accurately simulated to correctly represent theamount and timing of runoff. Effective models of snow!dominated systems therefore require that both snow deposi!tion and ablation be accurately simulated. Forest canopiesadd yet another level of complexity due to interactions be!tween vegetation and snowcover, which affects depositionamounts due to sublimation of canopy!intercepted snow andablation rates due to modification of meteorological condi!
Submitted for review in November 2010 as manuscript number SW8892; approved for publication by the Soil & Water Division of ASABE inJuly 2011.
The authors are Jason A. Hubbart, Assistant Professor of ForestHydrology, Department of Forestry, University of Missouri, Columbia,Missouri; Timothy E. Link, Associate Professor of Forest Hydrology,Department of Forest Ecology and Biogeosciences, University of Idaho,Moscow, Idaho; and William J. Elliot, ASABE Member, ResearchEngineer, U.S. Forest Service, Rocky Mountain Research Station, Moscow,Idaho. Corresponding author: Jason A. Hubbart, Department of Forestry,203!Q ABNR Building, University of Missouri, Columbia, MO 65211;phone: 573!884!7732; e!mail: [email protected].
tions at the snow surface (Link and Marks, 1999). A recentevaluation of forest snow process models indicated a widerange of performance between models, between open andforested sites, and between both calibrated and subsequentuncalibrated years (Rutter et al., 2009). Given these com!plexities and simulation challenges, model users would bene!fit from a series of optimization approaches to improvepredictive confidence. Ultimately, to improve current model!ing platforms for erosion prediction in snow!dominated sys!tems, simulation of snowpack dynamics must first beevaluated before recommendations can be made for modelimprovements. Identification of specific simulated processesto focus model development efforts is a useful strategy to im!prove model predictions.
Snowmelt models range from simple temperature indexmodels to detailed, physically based models (Gray and Male,1981). Simple index models may be practical for general ap!plications but lack sufficient physical basis to predict spatio!temporal variation of snowmelt in forested mountainousterrain. Spatially explicit, physically based models generallyrequire a greater amount of data, computational power, andexpertise to operate (Moore et al., 1993; Williams and Tarbo!ton, 1999) and are therefore most often used for research pur!poses. Consequently, there is typically a trade!off betweenmodel complexity and ease of implementation. To achieve abalance between ease of use and performance, there is a needto evaluate current user!friendly models so that developerscan formulate strategies to improve models for watershedmanagement. This requires studies that supply necessary ref!erence data sets and evaluations of model performance (Su!song et al., 1999). Models that strike a balance between ease
E
2 TRANSACTIONS OF THE ASABE
of use, complexity, and input requirements are especiallyneeded by the management community.
The Water Erosion Prediction Project (WEPP) model is amanagement tool that is evolving to meet the needs for bothease of use and predictive confidence. In 1985, the U.S. De!partments of Agriculture (USDA) and the Interior (USDOI)began developing the WEPP erosion and sedimentation pre!diction model to replace the more empirically based Univer!sal Soil Loss Equation (USLE) (Flanagan and Nearing, 1995;Flanagan et al., 2007). The USDA Forest Service RockyMountain Research Station developed a series of WEPP in!terfaces (FSWEPP) to enable the rapid assessment of erosionpotential from roads, and from forest and rangeland distur!bances such as timber harvest and fire. Development ofFSWEPP led to interest in improving WEPP simulations ofsnowpack and water cycle dynamics in forested mountainecosystems (Anderson and McCool, 2005; Covert et al.,2005; Dun et al., 2009; Greer et al., 2006; Singh et al., 2009).There is interest in evaluating the overall performance ofWEPP snowmelt processes since the hydrology of many for!ested mountainous watersheds is snow!dominated, and tim!ber harvest alters the hydrometeorological regime at thesnow surface and therefore snowpack dynamics (Bayley etal., 2010).
The winter hydrology component of WEPP (Savabi et al.,1995) simulates snow accumulation and ablation using amodified general basin snowmelt equation that predictssnowmelt in open areas based on daily hydrometeorologicaldata (Flanagan and Nearing, 1995). Hendrick et al. (1971)further developed the general basin snowmelt equation to ac!cept commonly available meteorological and environmentaldata (e.g., air temperature, vapor pressure, wind speed, cano!py cover) (Savabi et al., 1995). WEPP (version 91.5) wasfound to perform unsatisfactorily under winter conditionsdue to poorly predicted wintertime runoff (McConkey,1992). WEPP version 95.6 addressed some of the problemsby replacing the daily winter predictions with hourly predic!tions (Flanagan and Nearing, 1995). More recently, WEPPsimulations were completed using a modified winter routinebased on minimum daily air temperature that more effective!ly simulated snowfall events (Anderson and McCool, 2005).However, improvements were not sufficient to accuratelypredict snowpack accumulation for an entire winter seasondue to consistent underestimation of snow accumulations. Anevaluation of model performance within different land coverconditions is needed to guide a logical approach for modelimplementation and future improvements. Furthermore, thiscan help to inform managers of approaches that can be usedto increase simulation accuracy and hence confidence in themodel.
The objective of this study is to assess the accuracy ofWEPP!simulated snow deposition, peak snow water equiva!lent (SWE), and snow ablation in clearcut, partially cut, andfully forested conditions using a number of sequential modelimplementation approaches. Specific implementation ap!proaches include: (1) use of climate data from a nearby hy!drometeorological station; (2) application of empiricallyderived precipitation adjustment factors; (3) application ofon!site custom climate data from clearcut, partially cut, andfully forested sites; and (4) application of a calibrated canopycover factor to optimize simulated snowpack ablation. A fi!nal objective is to identify deficiencies in the model and pro!vide recommendations for model improvements.
METHODSSTUDY SITE
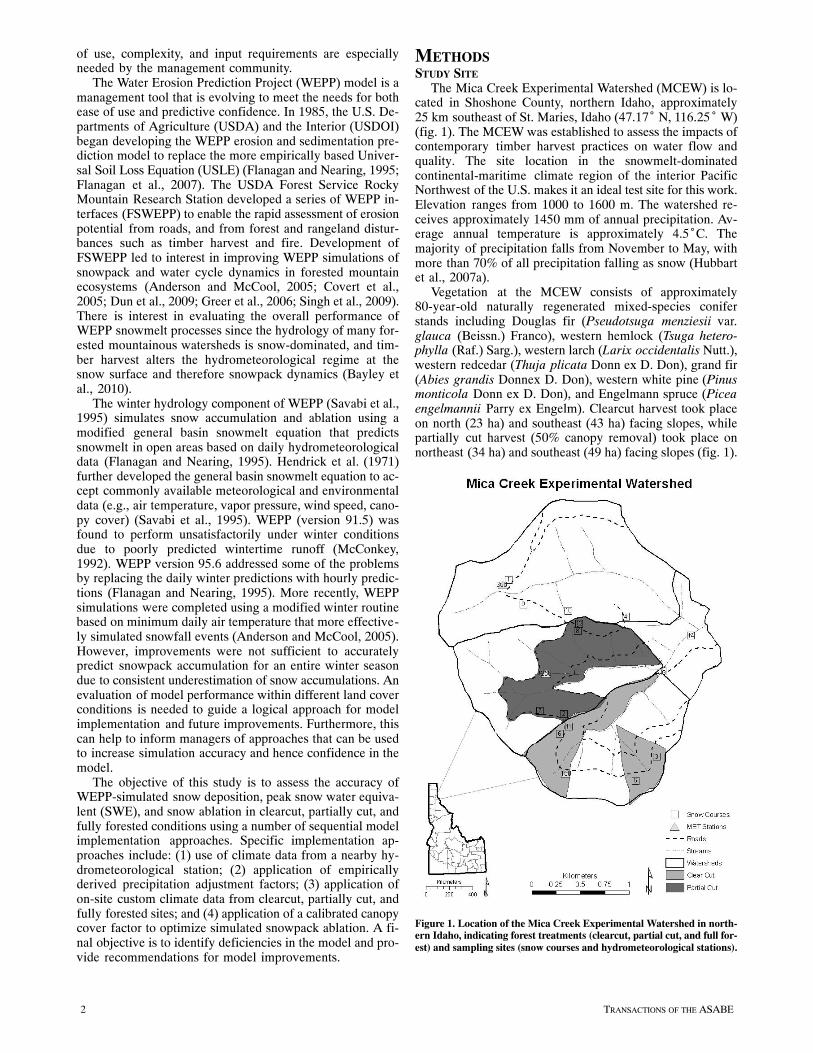
The Mica Creek Experimental Watershed (MCEW) is lo!cated in Shoshone County, northern Idaho, approximately25"km southeast of St. Maries, Idaho (47.17° N, 116.25° W)(fig. 1). The MCEW was established to assess the impacts ofcontemporary timber harvest practices on water flow andquality. The site location in the snowmelt!dominatedcontinental!maritime climate region of the interior PacificNorthwest of the U.S. makes it an ideal test site for this work.Elevation ranges from 1000 to 1600 m. The watershed re!ceives approximately 1450 mm of annual precipitation. Av!erage annual temperature is approximately 4.5°C. Themajority of precipitation falls from November to May, withmore than 70% of all precipitation falling as snow (Hubbartet al., 2007a).
Vegetation at the MCEW consists of approximately80!year!old naturally regenerated mixed!species coniferstands including Douglas fir (Pseudotsuga menziesii var.glauca (Beissn.) Franco), western hemlock (Tsuga hetero!phylla (Raf.) Sarg.), western larch (Larix occidentalis Nutt.),western redcedar (Thuja plicata Donn ex D. Don), grand fir(Abies grandis Donnex D. Don), western white pine (Pinusmonticola Donn ex D. Don), and Engelmann spruce (Piceaengelmannii Parry ex Engelm). Clearcut harvest took placeon north (23 ha) and southeast (43 ha) facing slopes, whilepartially cut harvest (50% canopy removal) took place onnortheast (34 ha) and southeast (49 ha) facing slopes (fig. 1).
Figure 1. Location of the Mica Creek Experimental Watershed in north!ern Idaho, indicating forest treatments (clearcut, partial cut, and full for!est) and sampling sites (snow courses and hydrometeorological stations).

3Vol. 54(4):
Average leaf area index (LAI) was 7.5 and 3.8 for the full for!est and partially cut canopies, respectively.
INSTRUMENTATION AND MONITORING
Data collection included automated continuous climateand manually measured snowpack data. The field datacollection was designed to enable investigations of strategiesto focus limited resources to obtain the best possible modelpredictions for managers. Precipitation was measured at theMica Creek Natural Resources Conservation Service(NRCS) SNOw TELemetry (SNOTEL) site (table 1, fig. 1).The SNOTEL site (site number 623) is located near the me!dian elevation of the study site at 1440 m above sea level,approximately 1 km southeast of the catchments in this study,and provides a reasonable estimate of mean areal precipita!tion for the watershed (Gravelle and Link, 2007; Hubbart etal. 2007a; Hubbart et al., 2007b; Koeniger et al., 2008).Shortwave radiation (SK08 pyranometer, Middleton Solar,Yarraville, Victoria, Australia) was measured at a height ofapproximately 10 m, at an elevation of 1460 m approximate!ly 3 km south of the study site on the top of a prominent ridge(47.14° N, 116.25° W) (Gravelle and Link, 2007; Hubbart etal., 2007b; Koeniger et al., 2008). Basic climate data, includ!ing air temperature (HMP45C, Vaisala, Oulu, Finland), windspeed (034B, Met!One Instruments, Grants Pass, Ore.), andsnow depth (Judd Communications, Inc., Salt Lake City,Utah) were recorded at hydrometeorological stations in eachforest treatment (fig. 1., stations 150, 250, and 350). To maxi!mize snow depth accuracy, sensors were oriented perpendic!ular (i.e., normal) to the slope. Given the steepness of slopes
Table 1. Local topographic characteristics for hydrometeorologicalstations, and snow courses (fig. 1) in the Mica Creek
Experimental Watershed in northern Idaho.
Station TreatmentElevation
(m)Slope(%)
Aspectfrom North(degrees)
AspectCategorized
SNOTEL !! 1440 10 80 NE
Hydrometeorological stations
150 Clearcut 1424 30 304 NW
250 Partial cut 1403 29 56 NE
350 Full forest 1453 30 134 SE
Snow courses
3 Clearcut 1418 30 258 W
5 Clearcut 1438 41 345 N
6 Clearcut 1418 32 99 E
11 Clearcut 1393 38 82 E
2 Partial cut 1359 25 98 E
7 Partial cut 1393 38 1 N
8 Partial cut 1384 38 194 S
12 Partial cut 1409 38 206 SW
1 Full forest 1452 30 134 SE
4 Full forest 1376 35 71 E
9 Full forest 1457 28 348 N
10 Full forest 1405 26 291 W
13 Full forest 1224 8 332 NW
14 Full forest 1194 6 285 W
Variables Sensed at all Climate Stations Sensor Model
Air temperature Vaisala HMP45C
Relative humidity Vaisala HMP45C
Wind speed Met!One 034B
Wind direction Met!One 034B
Snow depth Judd Communications
in this study (30% or less, table 1), snow depth (and radiation)would differ by less than 4% between measurements madenormal to the slope or normal to gravity.
Fourteen snow courses were established to monitor snow!pack depth and SWE on a weekly basis from peak SWEthrough the end of the melt season (fig. 1). Snow courses were20 m in length, running parallel to the slope, and were locatedthroughout the treatment watersheds, stratified by elevation,aspect, and canopy structure (table 1). Snow surveys werecompleted on 19 February and every 6 to 8 days between23"March and 19 May, when the snow had completelyablated. At each survey site, snow depth and SWE measure!ments were collected every 2 and 4 m, respectively, using astandard Federal snow tube and weighed with a calibratedspring balance. Snow density was calculated by the quotientof SWE and depth. Snow density values were averaged bytreatment type and elevation band, temporally interpolatedbetween measurement periods and multiplied by the hourlyautomated depth measurements at hydrometeorological sta!tions to produce a continuous estimated SWE record. To en!sure accuracy, care was taken to be certain that the snow tubewas clear of snow and soil prior to each sample. The same sur!vey teams collected snow depth and SWE samples for the en!tire season to reduce operator measurement bias betweensampling dates.
WEPP SNOWMELT PARAMETERIZATION AND OUTPUTS
WEPP version 2004.7 was used for this study. In this ver!sion, snow accumulation, density, melt, and soil freezing andthawing are simulated on an hourly basis. In WEPP, snow!melt calculations are performed in the MELT subroutine,which is called from the main WINTER routine when a snow!pack is present, or frost is present in the soil, and the averagedaily temperature is greater than 0°C (Flanagan and Nearing,1995). Users can select a number of model output files, mostcommonly runoff and erosion. However, for this work, wewere interested in snowpack processes that in turn generaterunoff and erosion (not part of the current study). We there!fore generated the winter output data files, which containsnowfall, snow depth, and snowmelt. There are a number ofassumptions related to snowmelt in WEPP, including: (1) anyprecipitation occurring when maximum daily temperature isless than 0°C is snowfall; (2) no snowmelt occurs if the maxi!mum daily temperature is less than !3.0°C; (3) the snowpackwill not melt until snowpack density is greater than or equalto 350 kg m!3; (4) the temperature of the cloud base is approx!imately the same as the surface air temperature; (5) the albe!do of melting snow is assumed to be 0.5; and (6) fresh snowis assumed to have a density of 100 kg m!3 (Flanagan and Li!vingston, 1995). WEPP does not currently account for soilheat flux to snow, or snow redistribution due to drifting orgravitational processes.
In WEPP, snowmelt is computed as:
)(0254.0 dmeltcmeltbmeltamelthrmelt ++!= (1)
where hrmelt is hourly melt water, 0.0254 is a conversion fac!tor from inches to meters, amelt represents shortwave radi!ation, bmelt represents incoming longwave radiation fromthe atmosphere, cmelt includes a combination of sensible andlatent heat fluxes but generally represents vapor transfer(i.e.,"latent heat flux), and dmelt represents a combination ofheat flux from air temperature and rainfall (i.e., sensible and

4 TRANSACTIONS OF THE ASABE
advected energy, respectively) (Flanagan and Nearing,1995). Equation 1 is a modification of a generalized basinsnowmelt equation for melt in open areas developed by theU.S. Army Corp of Engineers (USACE, 1956, 1960), andmodified by Hendrick et al. (1971) for WEPP. Because of thecombined energy fluxes in each of the snowmelt compo!nents, the computed melt terms are not representative of dis!tinct energy balance components (i.e., net radiation, latentheat, sensible heat, and advection).
The model requires climate, slope, aspect, soil, and plant/management input (Flanagan and Livingston, 1995). Theslope profile is represented as a set of length and steepnessvalues that characterize the site, generally starting at a ridgeand ending at a channel. WEPP performs all calculations as!suming a 1 m wide strip with user!specified treatment. Forthis work, a point simulation of one square meter was created,with slope and aspect representative of the given hydrome!teorological station for each treatment (table 1). The pointsimulation approach used in this investigation was to evalu!ate snowcover simulation accuracy. In practice, a managerwould typically apply the model over a homogeneous hill!slope unit, or a series of units that comprise a watershed tosimulate processes at a larger scale (Laflen, 2011).
There are a variety of vegetation and management param!eters in the WEPP input files that describe vegetation croptypes (i.e., rangeland plant communities and cropland annualand perennial crops), tillage sequences and tillage imple!mentation parameters, plant residue management, initialconditions, contouring, subsurface drainage, and crop rota!tions (Flanagan and Livingston, 1995). There are a total ofeight templates of vegetation treatments in FSWEPP rangingfrom 20!year!old forest to skid trail. The 20!year!old forestwas selected since this vegetation input file effectively char!acterized the closed!canopy forested conditions of theMCEW even though the forest stands were comprised of80!year!old second!growth vegetation. Notably, the only pa!rameter called from the plant/management file in the WEPPsnowmelt routine that affects snow simulations is the canopycover factor (Flanagan and Livingston, 1995). The canopycover factor (Cc) is derived by the following relationship:
mceCc ""!!= 1 (2)
where !c is an index of canopy cover, and !m is the adjustedtotal biomass production accumulated through the growingseason. This index is part of the Plant Growth component ofWEPP (Flanagan and Nearing, 1995) and can be modified bythe user to refine the canopy parameterization.
MODEL IMPLEMENTATION APPROACHES
In this study, WEPP snowpack simulations were assessedusing four model implementation strategies of increasingcomplexity, cost, and effort. This approach was conducted toidentify how site!specific model performance could be im!proved using simple methods, and how much the model pre!dictions might improve with each incremental approach. Thegeneral strategic modeling approaches and specific tacticsthat were sequentially implemented and evaluated to im!prove site!specific snow dynamics are described below.
Approach 1: Application of Nearby Climate DataThe WEPP model requires daily input values of precipita!
tion (duration, maximum intensity, and time to peak intensi!ty), maximum and minimum air temperature, solar radiation,
wind speed, and dewpoint temperature. When there are nomeasured climate data inputs, the stochastic weather genera!tor CLIGEN is the default program used by the model to gen!erate either continuous climate or single storm files(Flanagan and Livingston, 1995). Publicly available datafrom nearby installations such as NRCS SNOTEL sites canbe substituted for CLIGEN data to potentially improve simu!lation accuracy. Approach 1 closely mirrors use of CLIGENdata but is assumed to improve the accuracy by using site!specific climate information, while retaining ease of use. Pre!cipitation and temperature data were obtained from the MicaCreek SNOTEL site. The nearby hydrometeorological sta!tion (station 150) (fig. 1) with similar topographic character!istics supplied wind speed, and radiation data were suppliedfrom the shortwave radiation site. These data were substi!tuted for CLIGEN data and used for all study treatments asthe simplest modeling approach that could be used by landmanagers.
Approach 2: Adjustment of Precipitation Data to Accountfor Local Snow Deposition Variations, e.g., CanopyInterception Loss or Redistribution
For this study, precipitation was estimated at each locationby calculating the ratio of peak SWE at each site to peak SWEat the SNOTEL site. This ratio was then multiplied by thehourly precipitation measured at the SNOTEL site using thefollowing simple relationship:
)()( STLPPTSWE
SWEStnNPPT hr
STL
StnNhr #= (3)
where PPThr is hourly estimated precipitation (mm) at stationN (where N is the station identifier: 150, 250, or 350), SWESTL
is the peak snow water equivalent measured at the SNOTELsite, SWEStnN is peak snow water equivalent at a given hydro!meteorological station (StnN), and PPThr(STL) is the mea!sured SNOTEL hourly precipitation (mm). This procedureyielded an estimate of precipitation (ppt) time series at eachmonitoring site through the snow season, where SWEStnN/SWESTL for the clearcut, partial cut, and full forest sites was0.98, 0.44, and 0.27, respectively. This approach is reason!able for the MCEW, since there were minimal SWE lossesdue to midwinter melt events that would have been indicatedby isolated simultaneous SWE decreases and soil moistureincreases. These conditions only occurred early in the season(i.e., early snow deposition), and no midwinter rain!on!snow(ROS) events were observed that might have confoundedsome of the seasonal SWE estimates. This method is analo!gous to the approach used by Chauvin et al. (2011) and Fler!chinger and Cooley (2000), who computed a catchment waterbalance using estimated precipitation inputs for three land!scape units using drift factors to adjust measured precipita!tion. The procedure simply requires snow measurements nearthe date of peak SWE or estimated SWE differences to calcu!late a precipitation adjustment factor, and could be applied toany site of interest.
Approach 3: Application of Measured or EstimatedClimate Data for a Given Location to More AccuratelySimulate the Precipitation Phase (Rain vs. Snow) andMelt Energetics
For this evaluation, all climate data were measured at eachhydrometeorological station, and precipitation was adjustedas described in approach 2. This information was used to

5Vol. 54(4):
force the model using custom climate data for each location.This approach requires installing and maintaining a climatestation with basic sensors (see the Instrumentation and Moni!toring section) in each treatment over the period of study, andrequires additional investment in terms of instrumentationand labor, but this approach also supplies more accuratesite!specific information. Alternatively, meteorological datacould be estimated for a location of interest using local or re!gional lapse rates to account for topographic effects(e.g.,"Dingman, 2002; Geiger, 1965).
Approach 4: Modification of Snowmelt Rates byAdjusting the Canopy Cover Factors Based on theObserved Melt out Date
The only parameter called from the plant/managementfile in the WEPP snowmelt routine that affects snow simula!tions is the canopy cover factor (Cc) (see the Methods sec!tion). The canopy cover factor (Cc) is calculated by the modelbut is modifiable by the user, thus directly influencing simu!lated snow deposition and ablation processes. This was theobvious approach for this study since the treatments involvedforest canopy removal. In this study, approaches 1 through 3assumed canopy cover factors of 0.0 (clearcut), 0.45 (partialcut), and 0.90 (full forest) to emulate canopy cover in pre! andpost!harvest conditions (i.e., 100% clearcut, 50% partialcut). The partial cut was assumed to be less than 50% canopycover due to harvest practices, and full forest was assumed tobe less than 100% due to canopy heterogeneity and forestgaps. Forest managers wishing to quantify actual forest cano!py cover can use methods such as spherical densiometry,hemispherical photography, or line intercept (e.g., Campbelland Norman, 1998; Fiala et al., 2006; Korhonen et al., 2006;Stenberg et al., 1994). In the simulations for approach 4, thecanopy cover factor was adjusted manually to find the coverfactors that narrowed the difference between the observedand simulated final snowpack depletion dates. Using this pro!cedure, manually adjusted canopy cover was 0.38 for clear!cut, 0.79 for partial cut, and 0.79 for full forest. Thisprocedure represents a simple approach that land managerscould use to improve model performance when approximatesnowpack ablation dates are known.
MODEL PERFORMANCE METRICS
The fundamental metrics that were compared between thesimulated and observed values were peak SWE, seasonalmelt rate, and date of complete ablation. Peak SWE definesroughly how much snowmelt runoff will occur, the melt ratecontrols the surface water input, and the date of completeablation is important for erosion modeling, since it controlswhen soils are exposed to potentially more erosive rainfallevents. The agreement between simulated and observedSWE was assessed using the Nash!Sutcliffe (NS) efficiencyparameter (Nash and Sutcliffe, 1970), which quantifies howwell the model predicts the observed variability relative tothe mean observed value for the selected time period. Nashand Sutcliffe (1970) introduced the efficiency to correct forthe unsuitability of the classic coefficient of determination,which represents the square of Pearson's product!momentcorrelation coefficient (Legates and McCabe, 1999). As Leg!ates and McCabe (1999) further explicated, the coefficient ofdetermination is poorly suited to measuring goodness!of!fitdue to its basis in linear correlation. When the observed andsimulated values are in perfect agreement, NS equals 1.0;
however, NS values can be less than zero, indicating pooragreement (Nash and Sutcliffe, 1970). Other statistical com!parisons included the root mean square error (RMSE), whichprovides an indication of the absolute differences betweenobserved and predicted values (Willmott, 1984; Covert et al.,2005), and the mean difference (MD), which describes theoverall bias of the model. The equations used to calculatethese performance statistics are as follows:
( ) ( )
( )$
$$
=
==
!
!!=
!!=
N
i
i
N
i
ii
o
N
i
iio
xx
yx
Nv
yxNv
1
2
1
2
1
2
1NS (4)
( )
N
yxN
i
ii$=
!= 1
2
RMSE (5)
( )$=
!=N
i
ii yxN
1
1MD (6)
where vo is the variance of observed values, N is the numberof data points, xi is the observed value, yi is the correspondingpredicted value, and x is the average observed value for thestudy period.
RESULTS AND DISCUSSIONCLIMATE
Total precipitation measured at the Mica Creek SNOTELsite during the period of study from 1 October 2005 to 31 May2006 was 1130 mm, which comprised approximately 85% ofannual precipitation. Seasonal snowmelt trends were charac!terized by gradual melt and lack of ROS events that are typi!cal for the altitude of the study area. Table 2 lists the snowseason (1 November to 31 May, water year 2006) climate av!erages and standard deviations (SD) of data required to drivethe WEPP snowmelt algorithms from both the SNOTEL siteand each of the hydrometeorological sites in the clearcut, par!tial cut, and full forest areas. The greatest meteorological dif!ferences were observed between the full canopy and clearcutconditions. Figure 2 shows time series of climate variablesused as input in the WEPP model for each of the three treat!ments in this study. Identical incoming shortwave radiationdata were used for all runs, as WEPP includes an adjustmentfor slope, aspect, and solar zenith angle. Using the methodsdescribed above (eq. 2), effective precipitation (i.e., site!specific precipitation deposition) was estimated to be 2%,55%, and 73% less in the clearcut, partial cut, and full forestsites, respectively, relative to the SNOTEL site (table 2). Thesubstantial difference in precipitation is largely attributableto differences in canopy snow interception and subsequentsublimation, but may be due in part to preferential depositionat the clearcut and SNOTEL sites. Dressler et al. (2006) re!ported that even when collocated, SNOTEL sites predicted,on average, 5% greater SWE than a snow course, with greaterdifferences in wetter years. Given similar elevation, topogra!phy, and canopy attributes, it is not unexpected that the SNO!TEL and clearcut sites exhibited similar meteorological

6 TRANSACTIONS OF THE ASABE
Table 2. Snow season (1 November to 31 May, water year 2006) averages (and standard deviations) of climate data requiredto drive WEPP snowmelt. Data derived from the Mica Creek SNOTEL site and monitoring sites established within
clearcut, partial cut, and full forest sites in the Mica Creek Experimental Watershed in northern Idaho.
Meteorological Factor SNOTEL Clearcut Partial Cut Full Forest
Total or modeled precipitation (mm)[a] 1085 1063 477 293
Maximum air temperature (°C) 5.6 (±7.0) 4.2 (±7.3) 4.9 (±7.3) 3.3 (±6.9)
Minimum air temperature (°C) !1.3 (±5.3) !1.4 (±6.0) !1.0 (±5.8) !1.6 (±5.8)
Solar radiation (langleys d!1)[b] 163.9 (±129.9) 163.9 (±129.9) 163.9 (±129.9) 163.9 (±129.9)
Wind speed (m s!1) 1.3 (±0.7) 1.3 (±0.7) 0.8 (±0.45) 0.5 (±0.4)
Dewpoint temperature (°C) !3.3 (±5.8) !3.0 (±5.7) !2.5 (±5.7) !2.7 (±5.4)[a] SNOTEL values are measured; clearcut, partial cut, and full forest values are estimates.[b] Data collected at MCEW Solar Radiation Site.
Figure 2. Average climatic variables between treatments for the snow deposition and melt months of water year 2006 within the Mica Creek Experimen!tal Watershed in northern Idaho.
conditions relative to the partial cut and full forest canopy in!fluenced sites. Wind speeds in the clearcut sites were on aver!age 60% and 28% greater than in the full forest and partial cutsites, respectively. There were some very small differencesin air and dewpoint temperature between the three foresttreatments (table 2).
OBSERVED SNOW DISTRIBUTION AND MELT VARIABILITY
Canopy differences were associated with profound effectson deposition and ablation of the snowpack. The clearcut siteaccumulated almost twice as much SWE as the partial cutsite, and almost three times the SWE of the full forest(table"3). Melt rates followed a similar trend, in which the av-

7Vol. 54(4):
Table 3. Peak snow water equivalent (SWE), and melt rate statistics forthe total melt season, reflecting clearcut, partial cut, and full forest
study sites, monitored over the snow season of water year 2006in the Mica Creek Experimental Watershed in northern Idaho.
Observed Dataor Model Approach
Total Melt Period
Peak SWEAblation
EndDate
Daysto
Melt
Avg. Meltper Day
(cm)
Depth(cm) Date
SNOTEL
Observed 60.8 27 Mar 15 May 49 1.2
Clearcut
Observed 56.5 27 Mar 13 May 47 1.2
Approach 1 30.9 5 Mar 31 Mar 26 1.2
Approach 2 29.7 5 Mar 30 Mar 25 1.2
Approach 3 52.7 28 Mar 23 Apr 26 2.0
Approach 4 55.7 7 Apr 13 May 36 1.5
Partial Cut
Observed 29.5 19 Mar 1 May 43 0.7
Approach 1 33.5 23 Mar 18 Apr 26 1.3
Approach 2 11.3 28 Feb 21 Mar 21 0.5
Approach 3 17.3 16 Mar 4 Apr 19 0.9
Approach 4 19.5 3 Apr 1 May 28 0.7
Full Forest
Observed 21.3 20 Mar 29 Apr 40 0.5
Approach 1 36.3 17 Apr 31 May 44 0.8
Approach 2 7.4 19 Mar 5 Apr 17 0.4
Approach 3 14.1 17 Apr 15 May 28 0.5
Approach 4 12.8 4 Apr 29 Apr 25 0.5
erage melt per day was almost twice as much in the clearcutas the partial cut and even less in the full forest, as shown intable 3. Snow density differences were relatively small be!tween treatments. Average snow density (kg m!3) during themelt season (23 March to 19 May) was 0.38 (±0.06), 0.36(±0.03), and 0.41 (±0.05) for the full canopy, partial cut, andclearcut sites, respectively.
MODELING APPROACH OUTCOMES
Although snowmelt models have improved greatly in re!cent years, users still struggle with accuracy issues in com!plex terrain. Managers can use stochastic climate generators(e.g., CLIGEN) for input to more physically based modelssuch as WEPP, but accuracy is questionable, especially in for!ested mountainous terrain where differences in microclimateassociated with elevation and aspect can be large (e.g., Hub!bart et al., 2007b). The current work explored the potentialof sequential model implementation approaches to improveWEPP model predictions without modifying the software,thereby improving user confidence in model predictions.Conceivably, model users could implement the approaches(or variants) presented here depending on available resourcesto increase simulation accuracy.
Results from initial simulations of WEPP snowmelt com!ponents (amelt, bmelt, cmelt, and dmelt) are presented in fig!ure 3, and comparisons of simulated versus observed SWEare shown in figure 4. The amelt component, which serves asa rough proxy for shortwave radiation, exhibits a strong diur!nal cycle. The cmelt and dmelt components exhibit a weakdiurnal cycle, as would be expected for sensible and latentheat fluxes, and the bmelt component is nearly constantthroughout the day. These results differ from other physicallybased snow simulations, in which the longwave radiationcomponent (bmelt in WEPP) typically displays a slight diur!
nal variation and the sensible and latent heat components aretypically similar in magnitude but opposite in sign (Link andMarks, 1999).
In both figures, there is a clear relationship between cano!py cover, snowcover energy fluxes (fig. 3), and snowpack dy!namics (fig. 4). These relationships are important for erosionprediction because the rate and timing of snowmelt directlycontrols soil water input. For example, in an extreme case,overestimated melt rates could exceed the infiltration capac!ity of soils, resulting in surface runoff and overestimated ero!sion.
Simulated peak SWE at the clearcut site ranged from30.9"cm on 5 March (approach 1) to 55.7 cm on 7 April (ap!proach 4) (table 3, fig. 4). There was thus a difference of overone month between approaches 1 and 4, the latter of whichproduced the greatest agreement with observed peak SWE(27 March, 56.5 cm). Average melt per day ranged from with!in 1% of observed (approaches 1 and 2, 1.2 cm d!1) to a 67%overestimation (2.0 cm d!1) with approach 3 (table 3, fig. 5).Nash!Sutcliffe efficiency (NS) values ranged from !0.69 to0.98, with the latter value for approach 4, indicating a goodfit of the modeled SWE to observed SWE in the clearcut sites.The root mean squared error (RMSE) and mean difference(MD) for the simulated SWE were 2.6 and 0.16 cm, respec!tively (table 4). It is worth mentioning that model perfor!mance metrics give a general indication of modelperformance, but in this work peak SWE, melt rate, and meltout date are the key indicators of model performance sincethey are the most important in terms of the water balance andpotential erosion dynamics.
Snow deposition, peak SWE, and ablation were poorlysimulated using the standard approach (i.e., approach 1,table"3). While amelt (a rough proxy for shortwave radiation)accounted for 84% of melt in the clearcut sites, total snow!pack depletion occurred much earlier than observed (largelydue to underestimated snowpack development). Under fullcanopy, amelt accounted for only 16% of the energy forsnowmelt during the melt season of 2006, while dmelt(a"rough proxy for sensible and advected energy) contributed56% of snowmelt energy. The relatively large dmelt compo!nent occurred in the forest despite low wind speeds, since thesnow melted later in the season when air temperatures werehigher but simulated radiation components were relatively
Table 4. Model performance statistics comparing observed versusmodeled SWE between clearcut, partial cut, and full forest studysites monitored over the snow season of water year 2006 in the
Mica Creek Experimental Watershed in northern Idaho.[a]
Model Approach NS RMSE MD
Clearcut Approach 1 !0.64 25.47 19.38
Approach 2 !0.69 25.81 19.74
Approach 3 0.56 13.15 6.84
Approach 4 0.98 2.60 0.16
Partial Cut Approach 1 0.77 5.10 !1.24
Approach 2 !0.72 13.89 10.60
Approach 3 0.10 10.06 7.71
Approach 4 0.67 6.07 4.52
Full Forest Approach 1 !3.29 16.70 !14.05
Approach 2 !0.35 8.93 6.94
Approach 3 0.61 4.94 1.29
Approach 4 0.69 4.61 3.19[a] NS = Nash!Sutcliffe efficiency, RMSE = root mean squared error
(cm), and MD = mean difference (cm).

8 TRANSACTIONS OF THE ASABE
Figure 3. (left) Simulated WEPP snowmelt components (amelt, bmelt, cmelt, and dmelt) for a single representative day of melt (30 March 2006) and(right) the melt season (15 March to 31 May) contribution of each melt component for a standard model run in three treatment sites of the Mica CreekExperimental Watershed in northern Idaho. Cumulative melt trends plateau when all snow is ablated in the simulation.
low. This contrasts with other physically based snow simula!tions, which indicated that radiation accounts for 70% to 80%(or more) of total snowmelt energy, even under a continuouscanopy (Link and Marks, 1999). These results suggest thatthe simulated energy balance components in forested envi!ronments may not be reasonable in the version of the modelthat was evaluated for this investigation. Complete assess!ment of specific algorithms used in the model would requirea more detailed evaluation of snowcover energetics.
Model implementation approaches for the partial cut for!est resulted in date of peak SWE ranging from 28 Februaryto 3 April (table 3, fig. 4). Approach 4 matched the observedablation end date of 1 May but underestimated peak SWE by10 cm (34%). Relative to observed average daily melt rates(0.7 cm d!1), simulated rates were overestimated by almost88% using approach 1, whereas approach 4 was withinapproximately 1% of the observed rate. Nash!Sutcliffe effi!
ciency values ranged from !0.72 to 0.77, with the former forapproach 2 and the latter for approach 1 (table 4). Approach"4yielded a Nash!Sutcliffe efficiency of 0.67, indicating an im-proved fit of modeled SWE to observed SWE. The RMSE forthe partial cut simulations ranged from 13.9 cm (approach 2)to 5.1 cm (approach 1). Approach 4 yielded an RMSE of6.1"cm but more accurately matched total days to melt andaverage melt per day. Mean difference results are in generalagreement with RMSE values. Approach 1 produced thesmallest differences between simulated and observed SWE(table 4). However, with approach 1, the model overesti!mated peak SWE by almost 15% and daily melt (cm d!1) byalmost 88%. This has important implications for overesti!mating surface water input and erosion. Approach 4 pro!duced the closest modeled versus observed results in terms ofaverage daily melt and total time to melt, but model perfor!mance improvements are needed for forested sites.

9Vol. 54(4):
Figure 4. Observed versus simulated SWE for three treatment sites (clearcut, partial cut, and full forest) using four different modeling implementationapproaches over the snow season (1 November to 31 May) of water year 2006 in the Mica Creek Experimental Watershed in northern Idaho.
The full forest model approaches resulted in peak SWEoccurring from 19 March (approx. 7 cm, approach 2) to17"April with approaches 1 and 3 (36.3 and 14.1 cm, respec!tively) (table 3). Approach 4 resulted in peak SWE on 4 April,with a corresponding SWE of 12.8 cm (fig. 4). Approach 4overestimated the observed peak SWE date of 20 March by14 days but was able to precisely match the end of snowpackdepletion on 29 April. Average melt per day ranged from 0.4to 0.8 cm d!1 for approaches 2 and 1, respectively. Relativeto the observed rate (0.5 cm d!1) the model overestimated fullforest average daily melt by almost 40% for approach 1 (thesimplest method, i.e., SNOTEL climate). The model waswithin 5% of observed melt per day for approaches 3 and 4.Approach 4 produced the best simulated snowpack depletiondate and melt per day for the full forest site of all the modelimplementations (table 3). Nash!Sutcliffe efficiency valuesranged from !3.29, to 0.69, with the latter value being for ap!proach 4, indicating the best fit of modeled SWE to observedSWE of all of the approaches (table 4). The other statistics(RMSE and MD) were in general agreement with this result.Simulated results indicate that approach 4 yielded the bestmodeled SWE versus observed SWE, although peak SWEvalues were underestimated by 40%. This result may be per!ceived as relatively unimportant in terms of erosion predic!tion, since erosion is typically low in unimpacted forests.However, the implications of this error for heterogeneous for!est cover simulations may be considerable. This further sup!ports the conclusion that in fully forested mountainousterrain, model users can improve model predictions with site!specific climate and canopy cover data, but fundamental im!provements to the model are needed to accurately simulateconditions in forests.
Approach 4 used a precipitation adjustment factor, a cus!tom climate, and an adjusted canopy cover factor and pro!duced the best overall model performance (table 4). Usingthis approach, WEPP closely predicted peak SWE for theclearcut site, but underpredicted observed peak SWE for boththe partial cut and full forest sites (table 3). However, this ap!proach corrected the melt rate and timing of melt out issuesthat were common to the other implementation approaches.This observation is important since land managers are likelyto use the model to assess the impact of landcover changesand erosion estimates, as discussed earlier, and may wish tooptimize the model for those predictions. WEPP produced amoderate improvement in the total days to melt from peakSWE relative to observations, and improved predicted aver!age daily melt for all three treatments using this approach.Therefore, a custom (on!site) climate forcing approachcoupled with an adjusted canopy cover factor can producenotable improvement in open areas, and some improvementin forested areas. While approach 4 may seem too complexfor a manager to implement, a variant of the method could beapplied to improve simulations. For example, the model usercould estimate meteorological conditions at a site of interestusing publicly available data (e.g., SNOTEL), average lapserates, and a simple temperature sensor (e.g., ThermoChroniButton; Hubbart et al., 2005) at the soil surface or field ob!servations of melt out date to calibrate simulations by adjust!ing the canopy cover factor. The current version of the modelcan be implemented to produce relatively good performancein clearcut environments where simulated conditions aremost likely needed for management applications, but theseresults also clearly illustrate the need to further improve theWEPP snowmelt algorithms for forested conditions.

10 TRANSACTIONS OF THE ASABE
Figure 5. Observed and modeled (using four approaches) cumulative melt rates (cm d!1) versus time (graphs are cubic b!spline interpolations for easeof visualization) for three treatment sites (clearcut, partial cut, and full forest) over the snowmelt season (1 March to 31 May) of water year 2006 inthe Mica Creek Experimental Watershed in northern Idaho.
MODEL IMPROVEMENT RECOMMENDATIONS
Simulations using custom climates and canopy cover fac!tors produced the most accurate snowpack accumulation startdates but generally underestimated observed SWE. The latterproblem appears to be in part attributable to the lack of useroptions to adjust the 0°C air temperature threshold that dis!tinguishes rain from snow in the model. In reality, this thresh!old varies from roughly !2°C to +4°C (Dai, 2008), with ahalf!frequency air temperature of approximately 1.2°C.Physically based snowmelt modeling in a similar climate in!dicated that a threshold of 1.3°C was the most effective valueto distinguish rain from snow (Link et al., 2004). Further!more, research has indicated that it is more appropriate to usea dewpoint rather than an air temperature threshold of 0°C todistinguish the precipitation phase (Nayak et al., 2010). An!derson and McCool (2005) identified missing snowfallevents in WEPP that were coupled with days when minimumtemperatures were at or slightly below freezing. They simul!taneously identified false positives for model!predictedsnowfall when a snowfall event was not observed during dayswhen maximum temperatures were only a few degrees abovefreezing. These errors may accumulate over the season and
could lead to large errors in the simulated peak SWE values.This appears to have occurred for approaches 1 and 2, wheresimulations driven with slightly warmer air temperaturesfrom the SNOTEL site resulted in underestimated peak SWE,since most snowfall events at MCEW occur when tempera!tures are very close to 0°C. A likely contributor to this prob!lem is the reduction of daily input to hourly output data in themodel subroutines and the increased likelihood of missing oroverestimating the timing, frequency, intensity, and distribu!tion (rain or snow) of precipitation (Anderson and McCool,2005). Ranaivoson et al. (2002) corroborated this finding intheir work, in which WEPP consistently underestimatedsnowpack by nearly 33% in Minnesota. Similar to the studyby Anderson and McCool (2005), they attributed much of thediscrepancy to air temperature threshold concerns. Model de!velopers are currently undertaking improvements for winterroutines, particularly regarding frozen soil processes and useof dewpoint temperature to partition the rain!snow mix whileretaining the 0°C melt threshold function (S. Dun, personalcommunication, August 2010). Upcoming versions will stillrequire evaluation of winter performance, but the methodsoutlined in this article to improve simulations will also be ap!

11Vol. 54(4):
plicable to both newer versions of WEPP as well as other rela!tively simple management tools.
The WEPP snowmelt routines also include a number of as!sumptions, many of which are deserving of consideration forfuture improvement. For example, WEPP assumes an albedoof 0.5 for snow. Although snow albedo data were not col!lected at the MCEW for this project, snow albedo can behighly variable in both space and time (Melloh et al., 2001,2002). While snow albedo may not play an important roleduring the deposition season, it becomes a critical componentlater in the season due to increasing shortwave radiationcoupled with declining albedo from grain size increases asso!ciated with snow aging, water content increases, and cumula!tive debris deposition. A more sophisticated albedo modelwould therefore likely improve the simulated accuracy ofsnowmelt rates during the spring months.
In the WEPP model, canopy cover is a factor between zeroand one, where one is equal to full canopy. Multiple modelruns were executed implementing different canopy coverfactors for each of the modeling approaches listed in table 3.The model was found to be very sensitive to canopy cover be!cause this factor affects the melt component that serves as theradiation proxy that typically dominates melt energy. Themodel was not as sensitive to canopy height, which only af!fects the turbulent heat flux proxy terms in the model, whichcomprise a relatively minor component of the snowcover en!ergy balance (Link and Marks, 1999). In addition, topograph!ic shading from adjacent slopes is not considered in the model(Hendricks et al., 1971). Omitting topographic shading mayintroduce modeling errors at the local to slope scale. Usersshould therefore consider the potential for adjacent terrainshading and adjust the inputs if necessary. The current workshowed that manual adjustment of the canopy cover factor inpart to compensate for topographic shading may be an effec!tive approach when using the current version of WEPP, aswas done for approach 4. However, this should not precludefuture development of topographic corrections in the modelor preprocessing routines for radiation data.
Canopy effects also include interception losses due toevaporation and sublimation. In the U.S. southern RockyMountains, 25% to 35% reductions in snowpack due to inter!ception losses were observed (Troendle et al., 2010), whereaswinter interception losses in the nearby Priest River Experi!mental Forest were found to be approximately 25% (Packer,1962). In this study, interception losses were approximatedby adjusting the precipitation based on observations of peakSWE; however, this important process warrants further con!sideration to improve snow simulations with WEPP technol!ogy.
The current version of WEPP also does not account forsnow drifting. Redistribution of snow by topography andwind can result in a high degree of variability in accumula!tion and melt patterns, and subsequent runoff characteristics(Gray and Male, 1981; Winstral et al., 2002; Winstral andMarks, 2002). This process was addressed in this work byconducting multiple snow courses spanning land use types,and by using a precipitation adjustment factor (eq. 2). Man!agers should be aware when localized drifting may be an is!sue, and potentially apply a drift factor adjustment.
Hendrick et al. (1971) considered heat conduction fromthe ground to the base of the snowpack to be negligible. It wastherefore not included in the model but may be necessary forregions characterized by transient snowcovers and intermit!
tent soil warming throughout the winter (Mazurkiewicz et al.,2008).
Future work should include a similar evaluation of theWEPP snowmelt model during a year with a large ROS event.Brooks et al. (2010) noted that the runoff from a large ROSevent was poorly predicted with weather from a higher!elevation SNOTEL site, but was well predicted with weatherfrom a lower!elevation site on three watersheds in the LakeTahoe basin during a large ROS event on 1 January 2007.These findings further support the need to use site!specificclimate to accurately estimate snowmelt rates, even when themelt is associated with ROS. Ultimately, the WEPP snow!melt model should be able to adequately predict snow accu!mulation and melt under a variety of snowfall and weatherconditions, without extensive modification of parameters forpractical applications. Model improvements are underway,and further studies will therefore be needed to validate im!provements to the model during years with differing meteo!rological conditions.
SUMMARY AND CONCLUSIONSFour model implementation approaches were used to
drive the WEPP snowmelt algorithms to supply informationfor how model users might improve the model outputs and in!form model developers on areas to focus future model im!provements. Study results indicate that the simplest imple-mentation of WEPP in a mountainous environment does notyield acceptable model performance, especially in forests.Precipitation adjustment factors effect some simulation im!provements (i.e., forested sites with large interceptionlosses); however, in general, application of these factors is in!adequate to account for spatial variability of precipitation re!sulting from combined topographic and canopy effects.Using site!specific climate data produces notable improve!ments, and the cost and labor associated with installing mete!orological stations may be eliminated by estimating localconditions based on environmental lapse rates. Calibratingthe model based on periodic snow surveys or estimated meltout dates by adjusting canopy cover factors produced themost promising results. In cases where a high level of confi!dence is needed for WEPP simulations, the user is advised touse adjusted precipitation, on!site climate data, and customcanopy cover factors if possible. These methods can improvesimulations with the current version, but an improved versionof the model with an enhanced suite of options is needed toincrease confidence in the simulations, especially for snowprocesses in forests. This study further justifies the need toadvance process!based understanding to improve manage!ment tools used to make science!based decisions in complexforested ecosystems.
ACKNOWLEDGEMENTS
Gratitude is extended to Potlatch Corporation for design!ing and implementing the MCEW and for access to the exper!imental site. A great deal of appreciation is extended to theRocky Mountain Research Station of the U.S. Forest Servicefor funding and project support. This research was funded byUSFS Research Joint Venture Agreement No. 03!JV!11222065!068 and USDA!CSREES 2003!01264. Gratitudeis also extended to John Gravelle, Justin Broglio, Enhao Du,and Mike Bobbitt for field support, and to multiple reviewers,

12 TRANSACTIONS OF THE ASABE
including Katy Kavanagh, Jan Boll, and three anonymous re!viewers whose feedback and insights greatly improved theclarity and quality of the manuscript.
REFERENCESAnderson, T., and D. K. McCool. 2005. SPAW and WEPP
simulations of observed snow accumulation and melt. ASABEPaper No. PNW05!1016. St. Joseph, Mich.: ASABE.
Bayley, T., W. Elliot, M. A. Nearing, D. P. Guertin, T. Johnson, D.Goodrich, and D. Flanagan. 2010. Modeling erosion underfuture climates with the WEPP model. In Proc. 2nd JointFederal Interagency Conf. on Sedimentation and HydrologicModeling. Reston, Va.: U.S. Geological Survey.
Brooks, E. E., W. Elliot, J. Boll, and J. Wu. 2010. Final report:Assessing the sources and transport of fine sediment in responseto management practices in the Tahoe basin using the WEPPmodel. Albany, Cal.: U.S. Forest Service, Pacific SouthwestResearch Station. Available at:www.fs.fed.us/psw/partnerships/tahoescience/sediment_sources.shtml.
Campbell, G. S., and J. M. Norman. 1998. An Introduction toEnvironmental Biophysics. New York, N.Y.: Springer Scienceand Business Media.
Chauvin, G. M., G. N. Flerchinger, T. E. Link, D. Marks, A. H.Winstral, and M. S. Seyfried. 2011. Long!term water balanceand conceptual model of a semi!arid mountainous catchment. J.Hydrol. 400(1!2): 133!143.
Covert, S. A., P. R. Robichaud, W. J. Elliot, and T. E. Link. 2005.Evaluation of runoff predictions from WEPP!based erosionmodels for harvested and burned forest watersheds. Trans. ASAE48(3): 1091!1100.
Dai, A. 2008. Temperature and pressure dependence of therain!snow phase transition over land and ocean. Geophys.Research Letters 35: L12802.
Dingman, S. L. 2002. Physical Hydrology. 2nd ed. Upper SaddleRiver, N.J.: Prentice Hall.
Dressler, K. A., S. R. Fassnacht, and R. C. Bales. 2006. Acomparison of snow telemetry and snow course measurementsin the Colorado River basin. J. Hydrometeorol. 7(4): 705!712.
Dun, S., J. Q. Wu, W. J. Elliot, P. R. Robichaud, D. C. Flanagan, J.R. Frankenberger, R. E. Brown, and A. D. Xu. 2009. Adaptingthe Water Erosion Prediction Project (WEPP) model for forestapplications. J. Hydrol. 336(1!4): 45!54.
Fiala, A. C. S., S. L. Garman, and A. N. Gray. 2006. Comparison offive canopy cover estimation techniques in western OregonCascades. Forest Ecology and Mgmt. 232(1!3): 188!197.
Flanagan, D. C., and S. J. Livingston. 1995. USDA Water ErosionPrediction Project: WEPP User Summary. NSERL Report No.11. West Lafayette, Ind.: National Soil Erosion ResearchLaboratory.
Flanagan, D. C., and M. A. Nearing, eds. 1995. USDA WaterErosion Prediction Project: Technical Documentation. NSERLReport No. 10. West Lafayette, Ind.: National Soil ErosionResearch Laboratory.
Flanagan, D. C., J. E. Gilley, and T. G. Franti. 2007. Water ErosionPrediction Project (WEPP): Development history, modelcapabilities and future enhancements. Trans ASABE 50(5):1603!1612.
Flerchinger, G. N., and K. R. Cooley. 2000. A ten!year waterbalance of a mountainous semi!arid watershed. J. Hydrol.237(1!2): 86!99.
Geiger, R. 1965. The Climate Near the Ground. Cambridge, Mass.:Harvard University Press.
Gravelle, J. A., and T. E. Link. 2007. Influences of timberharvesting on headwater peak stream temperatures in a northernIdaho watershed. Forest Sci. 53(2): 189!205.
Gray, D. M., and D. H. Male, eds. 1981. Handbook of Snow:Principles, Processes, Management, and Use. Willowdale,Ontario, Canada: Pergamon Press Canada.
Greer, R. C., J. Q. Wu, P. Singh, and D. K. McCool. 2006. WEPPsimulation of observed winter runoff and erosion in the U.S.Pacific Northwest. Vadose Zone J. 5(1): 261!272.
Hendrick, R. L., B. D. Filgate, and W. M. Adams. 1971.Application of environmental analysis to watershed snowmelt. J.Applied Meteorol. 10(3): 418!429.
Hubbart, J. A., T. E. Link, C. Campbell, and D. Cobos. 2005.Evaluation of a low!cost temperature measurement system forenvironmental applications. Hydrol. Proc. 19(7): 1517!1523.
Hubbart, J. A., T. E. Link, J. A. Gravelle, and W. J. Elliot. 2007a.Timber harvest impacts on water yield in thecontinental/maritime hydroclimatic region of the United States.Forest Science 53(2): 169!180.
Hubbart, J. A., K. L. Kavanagh, R. Pangle, T. E. Link, and A.Schotzko. 2007b. Cold air drainage and modeled nocturnal leafwater potential in complex forested terrain. Tree Physiol. 27(4):631!639.
Koeniger, P., J. A. Hubbart, T. Link, and J. D. Marshall. 2008.Isotopic variation of snow cover and streamflow in response tochanges in canopy structure in a snow!dominated mountaincatchment. Hydrol. Proc. 22(4): 557!566.
Korhonen, L., K. T. Korhonen, M. Rautianinen, and P. Stenberg.2006. Estimation of forest canopy cover: A comparison of fieldmeasurement techniques. Silva Fennica 40(4): 577!588.
Laflen, J. M. 2011. Application of WEPP to sustainablemanagement of a small catchment in southwest Missouri, U.S.,under present land use and with climate change. In Handbook ofErosion Modeling, 168!185. R. P. C. Morgan and M. Nearing,eds. Chichester, U.K.: Blackwell.
Legates, D. R., and G. J. McCabe Jr. 1999. Evaluating the use of“goodness!of!fit” measures in hydrologic and hydroclimaticmodel validation. Water Resour. Res. 35(1): 233!241.
Link, T. E., and D. Marks. 1999. Point simulation of seasonalsnowcover dynamics beneath boreal forest canopies. J. Geophys.Res. 104(D22): 27841!27858.
Link, T. E., G. N. Flerchinger, M. H. Unsworth, and D. Marks.2004. Simulation of water and energy fluxes in an old growthseasonal temperate rainforest using the Simultaneous Heat andWater (SHAW) model. J. Hydrometeorol. 5(3): 443!457.
Mazurkiewicz, A. B., D. G. Callery, and J. J. McDonnell. 2008.Assessing the controls of the snow energy balance and wateravailable for runoff in a rain!on!snow environment. J. Hydrol.354(1!4): 1!14.
McConkey, B. G. 1992. Modeling cold!region agricultural hillslopehydrology. PhD diss. Pullman, Wash.: Washington StateUniversity, Department of Crop and Soil Sciences.
Melloh, R., J. P. Hardy, R. E Davis, and P. B. Robinson. 2001.Spectral albedo/reflectance of littered forest snow during themelt season. Hydrol. Proc. 15(18): 3409!3422.
Melloh, R. A., J. P. Hardy, R. N. Bailey, and T. J. Hall. 2002. Anefficient snow albedo model for the open and sub!canopy.Hydrol. Proc. 16(18): 3571!3584.
Moore, I. D., A. Lewis., and J. C. Gallant. 1993. Terrain attributes:Estimation methods and scale effects. In Modeling Change inEnvironmental Systems, 189!214. A. J. Jakeman, M. B. Beckand M. J. McAleer, eds. New York, N.Y.: John Wiley and Sons.
Nash, J. E., and J. V. Sutcliffe. 1970. River flow forecasting throughconceptual models: Part 1. A discussion of principles. J. Hydrol.10(3): 238!250.
NRC. 1999. New Strategies for America's Watersheds. Washington,D.C.: National Research Council.
Nayak, A., D. Marks, D. G. Chandler, and M. Seyfried. 2010.Long!term snow, climate, and streamflow trends at the ReynoldsCreek experimental watershed, Owyhee Mountains, Idaho,United States. Water Resources Res. 46: W06519.

13Vol. 54(4):
Packer, P. E. 1962. Elevation, aspect, and cover effects onmaximum snowpack water content in a western white pineforest. Forest Sci. 8(3): 225!35.
Ranaivoson, A. Z. H., S. C. Gupta, and J. F. Moncrief. 2002.WEPP!simulated tillage effects on runoff and sediment losses ina corn!soybean rotation. In Sustaining the Global Farm,877!881. D. E. Stott, R. H. Mohtar, and G. C. Steinhardt, eds.Published by the Intl. Soil Conservation Organization incooperation with the USDA!ARS National Soil ErosionResearch Laboratory and Purdue University.
Rutter, N., R. Essery, J. Pomeroy, N. Altimir, K. Andreadis, I.Baker, A. Barr, P. Bartlett, A. Boone, H. Deng, and others. 2009.Evaluation of forest snow processes models (SnowMIP2). J.Geophys. Res. 114: DO6111.
Savabi, M. R., B. Young, G. R. Benoit, J. Witte, and D. Flanagan.1995. Winter hydrology. In USDA Water Erosion PredictionProject: Technical Documentation, Chapter 3: 14. NSERLReport No. 10. D.C. Flanagan and M. A. Nearing, eds. WestLafayette, Ind.: National Soil Erosion Research Laboratory.
Singh, P., J. Q. Wu, D. K. McCool, S. Dun, C. Lin, and J. R. Morse.2009. Winter hydrological and erosion processes in the U. S.Palouse region: Field experimentation and WEPP simulation.Vadose Zone J. 8(2): 426!436.
Stenberg, P., S. Linder, H. Smolander, and J. Flower!Ellis. 1994.Performance of the LAI!2000 plant canopy analyzer inestimating leaf area index of some Scots pine stands. TreePhysiol. 14(7!9): 981!995.
Susong, D., D. Marks, and D. Green. 1999. Methods for developingtime!series climate surfaces to drive topographically distributedenergy and water balance models. Hydrol. Proc. 13(12!13):2003!2021.
Troendle, C. A., L. H. MacDonald, C. H. Luce, and I. J. Larsen.2010. Chapter 7: Fuel management and water yield. InCumulative Watershed Effects of Fuel Management in theWestern United States, 126!148. W. J. Elliot, I. S. Miller, and L.Audin., eds. Gen. Tech. Rep. RMRS!GTR!231. Fort Collins,Colo.: U.S. Forest Service, Rocky Mountain Research Station.
USACE. 1956. Snow hydrology: Summary report of the snowinvestigations. Portland, Ore.: U.S. Army Corps of Engineers,North Pacific Division, Portland District.
USACE. 1960. Runoff from snowmelt. Manual EM 1110!2!1406.Washington, D.C.: U.S. Army Corps of Engineers.
Williams, K. S., and D. G. Tarboton. 1999. The ABC's ofsnowmelt: A topographically factorized energy componentsnowmelt model. Hydrol. Proc. 13(12!13): 1905!1920.
Willmott, C. J. 1984. On the evaluation of model performance inphysical geography. In Spatial Statistics and Models, 443!460.G. L. Gaile and C. J. Willmott, eds. Boston, Mass.: D. ReidelPublishing.
Winstral, A., and D. Marks. 2002. Simulating wind fields and snowredistribution using terrain!based parameters to model snowaccumulation and melt over a semi!arid mountain catchment.Hydrol. Proc. 16(18): 3585!3603.
Winstral, A., K. Elder, and R. E. Davis. 2002. Spatial snowmodeling of wind!redistributed snow using terrain!basedparameters. J. Hydrometeorol. 3(5): 524!538.

14 TRANSACTIONS OF THE ASABE